AGRICULTURE SUBSIDIES FOR BETTER OUTCOMES
32
AGRICULTURE SUBSIDIES FOR BETTER OUTCOMES Options for Zimbabwe Public Disclosure Authorized Public Disclosure Authorized Public Disclosure Authorized Public Disclosure Authorized
Transcript of AGRICULTURE SUBSIDIES FOR BETTER OUTCOMES

AGRICULTURE SUBSIDIES FOR BETTER OUTCOMESOptions for Zimbabwe
Pub
lic D
iscl
osur
e A
utho
rized
Pub
lic D
iscl
osur
e A
utho
rized
Pub
lic D
iscl
osur
e A
utho
rized
Pub
lic D
iscl
osur
e A
utho
rized

ii
ContentsIntroduction ...................................................................................................................................................................................
A. Smart Subsidies – International Best Practices ...........................................................
B. Agricultural Subsidies - Zimbabwe Practice Overview ....................................
C. Costs of Agricultural Subsidies in Zimbabwe .................................................................
D. Preliminary Evidence on Command Agricultures Impacts .........................
E. Options and Recommendations .........................................................................................................
1
4
8
11
18
21
iii
IntroductionZimbabwe has a long history of providing subsidies to farmers. The
policies that have defined these subsidies have changed over time
and led periodically to significant and unsustainable pressure on fiscal
resources. Agricultural subsidy costs are a main driver of recent fiscal
imbalances and inflationary pressure. The Ministry of Finance and
Economic Development is making efforts to bring them under control
while maintaining adequate support to the agricultural sector during
a significant drought and other structural challenges.
This Brief contributes to the identification and scoping of options
for redesigning agricultural subsidies in Zimbabwe so that their
objectives – a mix of national food security, smallholder access
to production technology, and trade balance strengthening – can
be pursued at significantly reduced fiscal costs.¹ The Brief draws
on recent analytical work, particularly the report Zimbabwe: Public
Expenditure Review with a Focus on Agriculture (World Bank and
MFED, 2019), and an impact assessment of Command Agriculture’s
first year of support for maize production.
The Brief is an output of the Zimbabwe Agriculture Policy Technical Assistance (P171757).¹
1
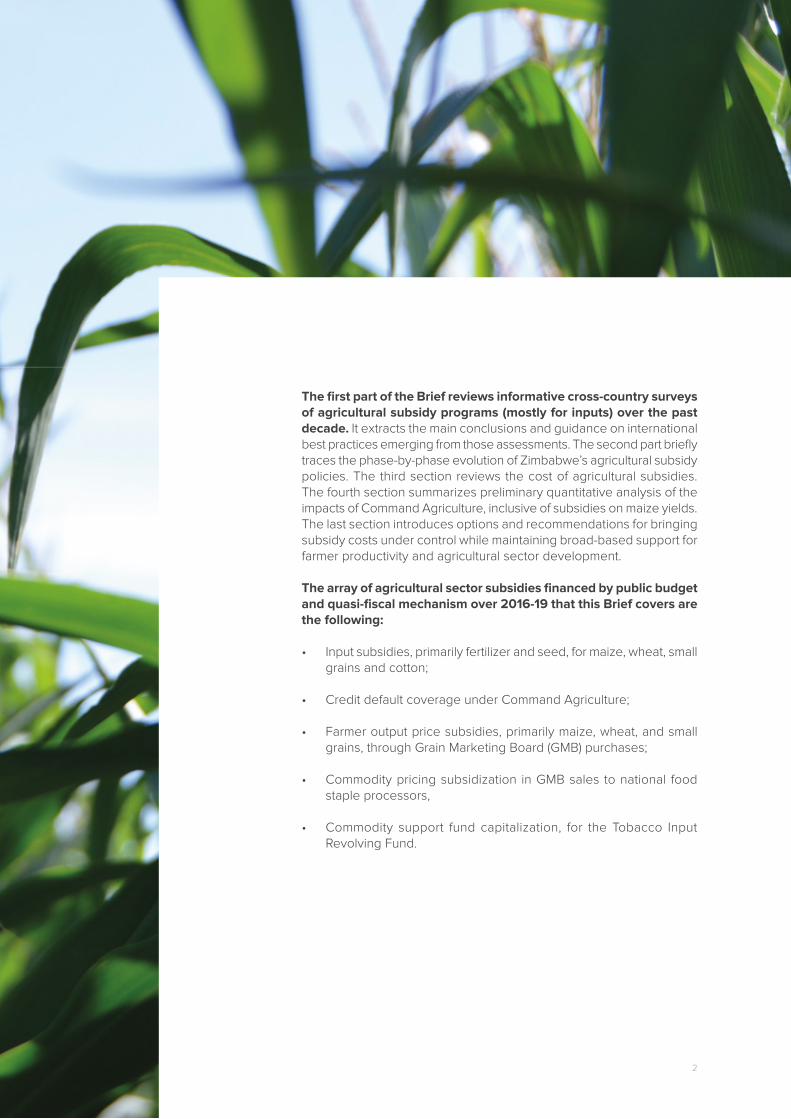
The first part of the Brief reviews informative cross-country surveys of agricultural subsidy programs (mostly for inputs) over the past decade. It extracts the main conclusions and guidance on international best practices emerging from those assessments. The second part briefly traces the phase-by-phase evolution of Zimbabwe’s agricultural subsidy policies. The third section reviews the cost of agricultural subsidies. The fourth section summarizes preliminary quantitative analysis of the impacts of Command Agriculture, inclusive of subsidies on maize yields. The last section introduces options and recommendations for bringing subsidy costs under control while maintaining broad-based support for farmer productivity and agricultural sector development.
The array of agricultural sector subsidies financed by public budget and quasi-fiscal mechanism over 2016-19 that this Brief covers are the following:
• Input subsidies, primarily fertilizer and seed, for maize, wheat, small grains and cotton;
• Credit default coverage under Command Agriculture;
• Farmer output price subsidies, primarily maize, wheat, and small grains, through Grain Marketing Board (GMB) purchases;
• Commodity pricing subsidization in GMB sales to national food staple processors,
• Commodity support fund capitalization, for the Tobacco Input Revolving Fund.
2

3
A. Smart Subsidies: International Best
Practices
Following the world food market supply and price crisis of 2008, many
countries in Sub Saharan Africa (SSA) introduced input and output price
policies in the form of subsidies to spur farmer productivity and increase
production. Agricultural subsidies in earlier decades had provided few
examples of fiscally sustainable subsidies that demonstrably contributed
to enduring productivity gains by farmers and there were few experience-
based “how-to” guides for implementing targeted and impactful interventions.
Nonetheless, to guide these new initiatives, a series of reviews attempted to
cull and consolidate lessons from past experience, and efforts were made
to ramp up the monitoring of subsidy programs to provide evidence for any
adjustments that might be required.
The findings from three reviews in particular reveal a fair degree of
consensus on the main building blocks for the design of “smart subsidies.”
One of the early reviews (Morris et al., 2007) emphasizes that establishing
a sufficiently broad approach to sustained development of input markets is
paramount as the overall architecture within which subsidies can selectively
contribute. Within several years of the global food crisis of 2007/08, a number of
SSA countries had introduced and already started to assess the effectiveness
of agricultural subsidy policies. A review by Michigan State University (Kelly
et al., 2011) assessed the experiences of five countries – Kenya, Malawi, Mali,
Senegal, and Zambia. More recently, Goyal et al. (2017) took stock of studies
on input subsidy programs in SSA to combine their evidence into proposals
on the design and implementation of smarter subsidy programs.
4
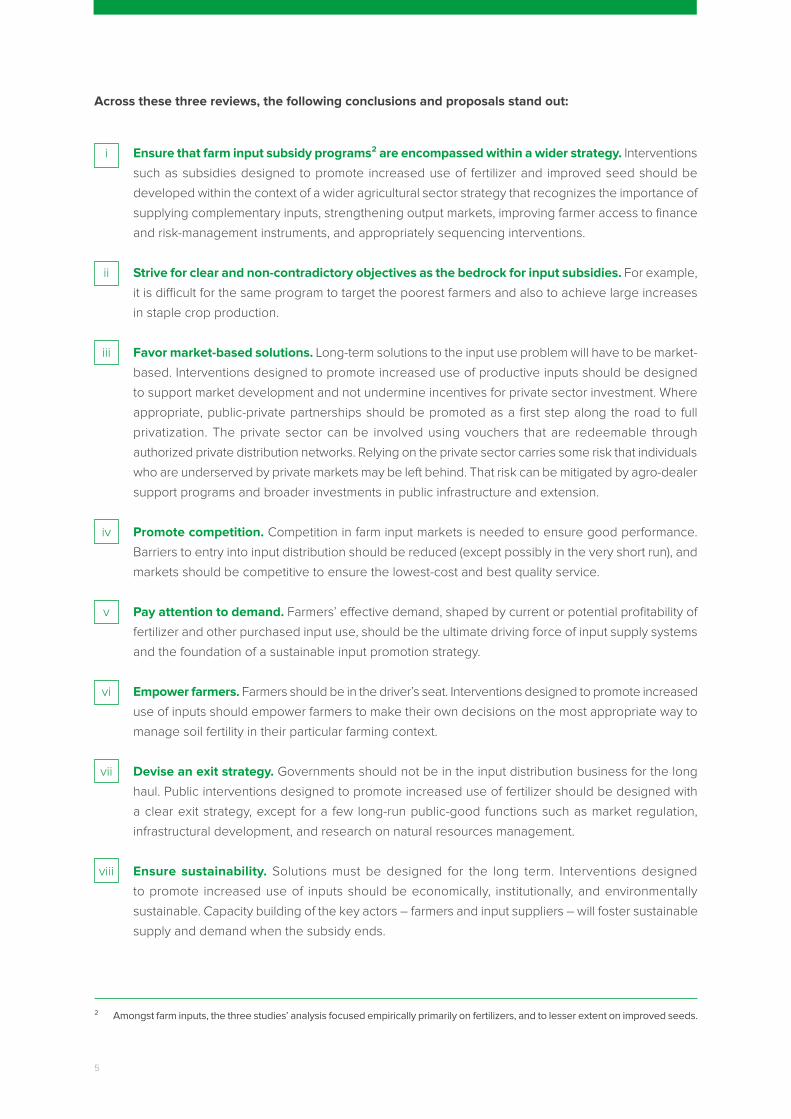
Across these three reviews, the following conclusions and proposals stand out:
i
ii
iii
iv
v
vi
vii
viii
Ensure that farm input subsidy programs² are encompassed within a wider strategy. Interventions
such as subsidies designed to promote increased use of fertilizer and improved seed should be
developed within the context of a wider agricultural sector strategy that recognizes the importance of
supplying complementary inputs, strengthening output markets, improving farmer access to finance
and risk-management instruments, and appropriately sequencing interventions.
Strive for clear and non-contradictory objectives as the bedrock for input subsidies. For example,
it is difficult for the same program to target the poorest farmers and also to achieve large increases
in staple crop production.
Favor market-based solutions. Long-term solutions to the input use problem will have to be market-
based. Interventions designed to promote increased use of productive inputs should be designed
to support market development and not undermine incentives for private sector investment. Where
appropriate, public-private partnerships should be promoted as a first step along the road to full
privatization. The private sector can be involved using vouchers that are redeemable through
authorized private distribution networks. Relying on the private sector carries some risk that individuals
who are underserved by private markets may be left behind. That risk can be mitigated by agro-dealer
support programs and broader investments in public infrastructure and extension.
Promote competition. Competition in farm input markets is needed to ensure good performance.
Barriers to entry into input distribution should be reduced (except possibly in the very short run), and
markets should be competitive to ensure the lowest-cost and best quality service.
Pay attention to demand. Farmers’ effective demand, shaped by current or potential profitability of
fertilizer and other purchased input use, should be the ultimate driving force of input supply systems
and the foundation of a sustainable input promotion strategy.
Empower farmers. Farmers should be in the driver’s seat. Interventions designed to promote increased
use of inputs should empower farmers to make their own decisions on the most appropriate way to
manage soil fertility in their particular farming context.
Devise an exit strategy. Governments should not be in the input distribution business for the long
haul. Public interventions designed to promote increased use of fertilizer should be designed with
a clear exit strategy, except for a few long-run public-good functions such as market regulation,
infrastructural development, and research on natural resources management.
Ensure sustainability. Solutions must be designed for the long term. Interventions designed
to promote increased use of inputs should be economically, institutionally, and environmentally
sustainable. Capacity building of the key actors – farmers and input suppliers – will foster sustainable
supply and demand when the subsidy ends.
Amongst farm inputs, the three studies’ analysis focused empirically primarily on fertilizers, and to lesser extent on improved seeds.²
5
These reviews do not flinch from the political-economy realities of input subsidies, observing that they
are often inefficient, costly, fiscally unsustainable, and highly politicized. Input subsidies remain popular
because beneficiaries receive something tangible from the government, while alternative investments
capable of making substantial contributions to agricultural development (infrastructure, agricultural research
and development, extension services) are slower to show impacts, and the benefits may not be clear to
voters. Moreover, the inherent risks that input subsidies will be diverted are important to recognize, confront,
and address. An analysis of the fertilizer retail-import price gap in 14 African countries between 2002 and
2013 (Shimeles, 2015) showed that the price differentials between the retail fertilizer price and the world
market price are negatively correlated with measures of government effectiveness. This correlation suggests
that in environments with poor governance, input subsidy programs may be susceptible to over-invoicing
and corruption. In such cases, costs to the treasury and farmer prices could both be driven up. Increased
transparency regarding the program costs could go a long way toward reducing the risk that this problem
will occur.
Due to such national socio-political realities, it is important to recognize that international best practice,
as summarized above, provides broad lessons, but that solutions need to be tailored to local constraints
and opportunities.
ix
x
Do evidence-based tracking as the basis for program adjustments. Input subsidy programs need
to be accompanied by adequate investment in basic agricultural statistics to enable monitoring and
evaluation, impact assessment, and analysis-based policy adjustment. Experimentation with different
policy variables, such as types of targeting or subsidy level and duration of eligibility, can provide
information and inform program design improvements.
Promote pro-poor growth. Equity considerations matter. Assuming that the previous guiding
principles have been followed, a final consideration is that public interventions designed to promote
increased use of inputs should also aim to promote pro-poor growth, through targeting the subsidies
to households that could use inputs profitably but could not afford to do so (or whose purchases are
well below optimal levels) due to credit constraints. In exceptional circumstances, poverty reduction
or food security objectives may even be given precedence over efficiency and sustainability goals, if
it can be determined that input interventions are a cost-effective way of addressing these problems.
Input subsidy programs that do not exclude households already purchasing commercial inputs
or that operate in areas where commercial inputs use is already high tend to have a diminished
positive impact.
6

7
B. Agricultural Subsidies: Zimbabwe
Practice OverviewZimbabwe has extensive experience with various agricultural
subsidy policy regimes since 1980 (Moyo et al., 2014). Universal
subsidies of agricultural inputs (seed and fertilizer) for producing key
crops were in place until 1990. Input manufacturers received subsidies
from the state for onward transfer to farmers in the form of reduced
prices. Farmers accessed seed and fertilizer below the market prices,
contributing to maize and cotton production booms among small farmers
in the early 1980s. The boom was also supported by cheap agricultural
finance provided through the Agricultural Finance Corporation (AFC)
to both small- but mostly large-scale commercial farmers. The fiscal
unsustainability of these programs became pressing by the late 1980s,
and in response, policies shifted toward liberalizing agricultural markets.
Structural adjustment policies introduced in 1990 removed most
market controls – the single-channel marketing system and
regulation of commodity prices – while retaining agricultural support
prices for maize and wheat and a strategic grain reserve, which
was maintained by the Grain Marketing Board (GMB). One effect of
these policy changes was a gradual decline in the use of purchased
inputs among small farmers, which reversed the earlier gains in maize
production and productivity. These productivity losses were exacerbated
by drought and other economic shocks.
From 2000, agricultural input subsidies were re-introduced to
promote the recovery of agriculture, particularly amongst the
broadening base of small (and often new) farmers. Domestic
grain markets remained controlled through 2008, with the GMB playing
a dominant role in grain procurement, storage, and on-selling to a
concentrated private milling and wholesale grain-meal industry. But
the procurement pricing policy did not provide assured support (level,
timeliness) to grain farmers because of GMB’s inadequate financial
management in an inflationary environment.
8
Nevertheless, the performance of the agricultural economy from 2000 was so depressed that the
subsidy policy became attractive for more general reasons of propping up the distressed economy, often
serving as a desperate response to hyper-inflation and the steep decline in domestic capacity to cover
national food requirements. The overall volume and value of agricultural exports declined substantially
from 2000. By 2009 the nominal value of the main exports had declined by 45–58%, compared to the value
of non-agricultural exports, which declined by 11%.
In 2009 the economy was dollarized, grain markets were liberalized, and trade protection was lowered,
but concerns persisted in government and among development partners that markets were not reaching
farmers adequately with competitive input and output prices.
In response to the challenges, the Presidential Input Support Programme (PISP) was introduced in
2009. It focuses on subsistence farmers, poverty, and food security. According to the Transitional Stabilization
Programme (TSP), the program draws on “lessons on social protection, both from the harmonized cash
transfers, as well as from the Zimbabwe resilience building fund, that provide more sustainable ways to
support vulnerable households and allow them to escape the poverty trap, and show that assistance to
vulnerable households needs to go beyond food assistance.” The PISP is thus an important program for the
poor and for household-level food security. During 2010–13, partly with project finance provided by external
partners, support was mobilized to develop small-scale agro-dealers by recapitalizing their input and grain
marketing in rural areas, and voucher and e-voucher mechanisms were piloted and partially scaled up to
target small farmers. However, these initiatives were abandoned when donor finance dried up.
On the heels of two consecutive drought years, in the 2016/17 growing season the government launched
a Command Agriculture program. The program aimed to mobilize substantial financial resources from the
private sector by marshalling private companies to finance the importation and distribution of inputs on credit
to commercial farmers who were contracted to deliver output to the GMB. While the Command Agriculture
crop and livestock initiatives entailed mobilizing substantial private financial resources, over the next two
years the initiatives also relied on considerably scaled-up Treasury and quasi-fiscal spending that contributed
significantly to unsustainable overall fiscal deficits in 2017, 2018, and (with the return of drought) 2019.
In the first year, the program focused on maize in the summer season and wheat in the winter season.
In the following crop year (2017/18), additional programs on the same model were designed to benefit
other crops (small grains, soybeans), farming systems, and livestock producers, although these were
smaller in terms of area and financial implications. In principle, these programs did not entail a subsidy
component, since participating farmers were contractually bound to reimburse the input costs when they
delivered their output to the GMB. But even with the excellent growing conditions and production levels of
2017, non-repayment of input credits (in the 30–40% range) required the government to use national fiscal
resources to cover the losses incurred by the private partners.
In addition, the government continued to support for food production by small-scale farmers through
the PISP. This support consisted of a fully subsidized input package issued to each eligible farmer to produce
grain on a limited area, typically less than each farmer’s full area of cropping.
With the additional objective of promoting foreign exchange-earning export crops, the government
undertook different approaches for tobacco and cotton. For tobacco, the Reserve Bank of Zimbabwe
(RBZ) provided finance through AgriBank to capitalize a tobacco input revolving fund for implementation
9
through Tobacco Industry and Marketing Board, intended to alleviate financing constraints in the value chain
for mobilizing and distributing inputs needed for production. Apart from the cost of the fund capitalization,
inputs were not subsidized further under this mechanism. For cotton, starting in 2014, the government
provided a full subsidy on the inputs made available to farmer for growing this crop. The cotton program
expanded rapidly, with implementation of the free input provision shifting from AGRITEX and GMB in the first
year to the Cotton Company (Cottco) subsequently, and with the number of participation farmers growing
from 155,000 in 2016/17 to about 385,000 in 2017/18. The cotton program’s continuation at a similar scale
was announced for 2019/20. The rationale for the 100% input subsidy for cotton, in contrast to the zero
input subsidy for other export earners such as tobacco and sugarcane, has not been explicitly articulated
in government policy documents.
Finally, a subsidy on output prices for selected crops has prevailed during the Command Agriculture
period - in the form of GMB domestic procurement prices that are higher than GMB sale prices to
domestic processors. While the economy was dollarized (through 2018), this practice was followed partly
to compensate for the strong value of the dollar compared to the currencies of neighboring countries, which
meant that Zimbabwe’s domestic producers confronted stiff competition from agricultural imports. In this
way, the prices administered by the GMB provided – at considerable cost – favorable prices to domestic
producers that sold to the GMB, and encouraged domestic processors to source maize, wheat, and soybeans
from domestic production (via GMB) rather than through imports.
A political economy perspective provides an additional layer of understanding of Zimbabwe’s experience
with agricultural subsidies in recent decades. Dynamic pressures to adjust policy arise through electoral
politics, the existence of urban consumer as well as multiple rural farming constituencies (the larger A2
commercial farms, smaller A1 commercial farms, and communal area farms), the shifting engagement and
financing of external partners, and political re-alignments (such as the Government of National Unity, 2003–13).
The choices of successive governments related to the design and implementation of agricultural subsidy
programs represent balancing acts motivated by political objectives as well as technocratic assessments
of economic development outcomes.
In simplistic terms, following periods of drought, government concerns to address national food security
and ensure affordable prices for urban consumers can motivate a concentration on increasing surplus
production by larger commercial farmers (seen most recently under the Command Agriculture Special
Maize Production Program targeting A2 farmers); on the other hand, government subsidies on inputs
for communal area farmers (such as those provided through the PISP) are a visible demonstration of
support for rural voters. While technocratic assessment of agricultural subsidy programs may call for clear
and focused objectives and targeting of beneficiaries, a political economy perspective illuminates how the
multiple, overlapping, and shifting purposes of such programs reflect the continual balancing of dynamic
underlying political processes (see Shonhe, 2018).
10

C. Costs of Agricultural Subsidies in Zimbabwe The total public finance costs of the subsidy composition of the
agricultural scale-up initiatives during 2017 and 2018 are estimated
in Table 1 (see Agriculture Public Expenditure Review, 2019). These
costs have four main components:
• Scaling up of the PISP, including for cotton.
• Public finance to establish a tobacco input revolving fund.
• Public finance of Command Agriculture programs, notably to cover
non-repayment of input credits by farmers.
• Costs of GMB procurement of harvested crops at administered
prices higher than both import parity and sales prices.
Under the PISP in 2017, the government distributed inputs – seed
and fertilizer – to about 1.4 million small-scale farms for grain and
soybean production: grain production inputs accounted for about
US$53 million of costs, and US$38 million went to oilseed crop (mainly
soybean) input costs. Additional costs were incurred for providing
inputs free to cotton farmers. Table 1 shows that the government
spent US$42.7 million on the PISP in 2016, scaling expenditures up
substantially to US$125.3 million in 2017 and US$263.5 million in 2018.
Whether the resources are properly targeted and effective could not
be evaluated in this study due to lack of data.
The revolving fund for tobacco support was established in 2017 and
capitalized with a provision from the RBZ of US$28 million in 2017
and US$70 million in 2018.
11
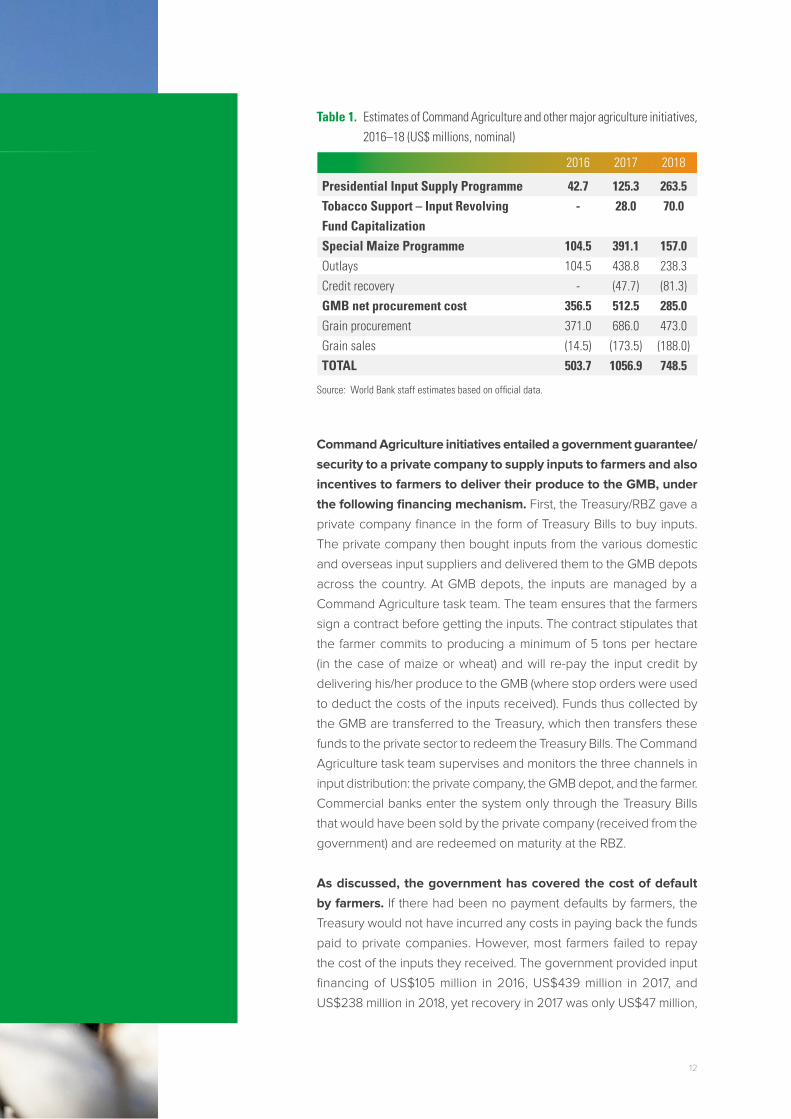
Table 1. Estimates of Command Agriculture and other major agriculture initiatives, 2016–18 (US$ millions, nominal)
Source: World Bank staff estimates based on official data.
Command Agriculture initiatives entailed a government guarantee/
security to a private company to supply inputs to farmers and also
incentives to farmers to deliver their produce to the GMB, under
the following financing mechanism. First, the Treasury/RBZ gave a
private company finance in the form of Treasury Bills to buy inputs.
The private company then bought inputs from the various domestic
and overseas input suppliers and delivered them to the GMB depots
across the country. At GMB depots, the inputs are managed by a
Command Agriculture task team. The team ensures that the farmers
sign a contract before getting the inputs. The contract stipulates that
the farmer commits to producing a minimum of 5 tons per hectare
(in the case of maize or wheat) and will re-pay the input credit by
delivering his/her produce to the GMB (where stop orders were used
to deduct the costs of the inputs received). Funds thus collected by
the GMB are transferred to the Treasury, which then transfers these
funds to the private sector to redeem the Treasury Bills. The Command
Agriculture task team supervises and monitors the three channels in
input distribution: the private company, the GMB depot, and the farmer.
Commercial banks enter the system only through the Treasury Bills
that would have been sold by the private company (received from the
government) and are redeemed on maturity at the RBZ.
As discussed, the government has covered the cost of default
by farmers. If there had been no payment defaults by farmers, the
Treasury would not have incurred any costs in paying back the funds
paid to private companies. However, most farmers failed to repay
the cost of the inputs they received. The government provided input
financing of US$105 million in 2016, US$439 million in 2017, and
US$238 million in 2018, yet recovery in 2017 was only US$47 million,
Presidential Input Supply ProgrammeTobacco Support – Input Revolving Fund CapitalizationSpecial Maize ProgrammeOutlaysCredit recoveryGMB net procurement costGrain procurementGrain salesTOTAL
2016
42.7-
104.5104.5
-356.5371.0(14.5)503.7
2017
125.328.0
391.1438.8(47.7)512.5686.0
(173.5)1056.9
2018
263.570.0
157.0238.3(81.3)285.0473.0
(188.0)748.5
12
while US$81 million was recovered in 2018 (Table 1), implying very high non-repayment rates of 54% in 2017
and 81% in 2018.³ These numbers suggest that the net cost of the Special Maize Production Programme to
the government was about 1.9% of GDP in 2017 and 0.7% in 2018.
To provide additional production incentives, the GMB subsidized grain production through its
implementation of government-set procurement prices, which were fixed well above import parity prices
for procurement involving maize, wheat, soybeans, and small grains. To avoid increasing prices for the
consumers of final grain products produced from GMB stocks, millers also received a subsidy. In 2018, the
difference between the procurement and sales prices amounted to about US$285 million, or about 2.1% of
GDP. Maize transactions accounted for 86% of this total subsidy amount, followed by wheat (12%) with the
balance for soybeans (2%). Net of this subsidy, grain purchases were US$473 million, or about 3.4% of GDP.
The cost of Command Agriculture was supposed to decrease in 2019 due to a change announced with
the 2019 budget in GMB’s procurement prices. These were lowered significantly (Table 2) on a par with
import parity, reducing the estimated subsidy by nearly 40%, assuming that the same quantities were sold at
the maintained subsidy to millers. At the same time, the GMB was expected to procure less grain in 2019, as
implementation of state enterprise reforms led to the splitting off of GMB’s previous commercial operations,
and because the year started off with high SGR stocks.⁴ Compared to 2018, these price, anticipated volume,
and SGR management changes could have resulted in currency savings of 74%. According to the 2019 budget,
only about 0.5% of GDP was to be spent on Command Agriculture (including maize procurement).
Yet the pressure of a significant drought on the 2018/19 harvest caused government intervention responses
and subsidy costs to increase substantially over the course of 2019. On 11 June 2019, the government
announced a higher procurement price for maize producers, of US$242 (+4%) or RTGS$1,331 (+83%) and
subsequently to ZWL$2,100 (due to depreciation of RTGS, and then the newly introduced national currency,
against the US dollar). Assuming maize procurement of 500,000 metric tons, this change would increase the
subsidy from RTGS$140 million (Table 2) to RTGS$443 million in 2019, which is equivalent to an additional 0.4
percentage point of estimated 2019 GDP. Other changes made over the course of 2019 dramatically increased
the cost of Command Agriculture. The Special Maize Production Programme increased by 1,700% between
the original Budget and Supplemental Budget submitted to Parliament in mid-2019. By June, expenditures on
Command Agriculture and grain reserves had increased from the RTGS$355 million specified in the original
2019 Budget to RTGS$3.8 billion, or ~5.4% of GDP.
Note that these cost figures are in nominal terms; the recent hyperinflation only became a factor subsequent to the period these
costs refer to.
As part of SOE reforms implemented in 2019, GMB’s commercial operations were spun off, leaving GMB with the public service
of operating the Strategic Grain Reserve (SGR), up to a level of 500,000 mt as established on a statutory basis.
³
⁴
13
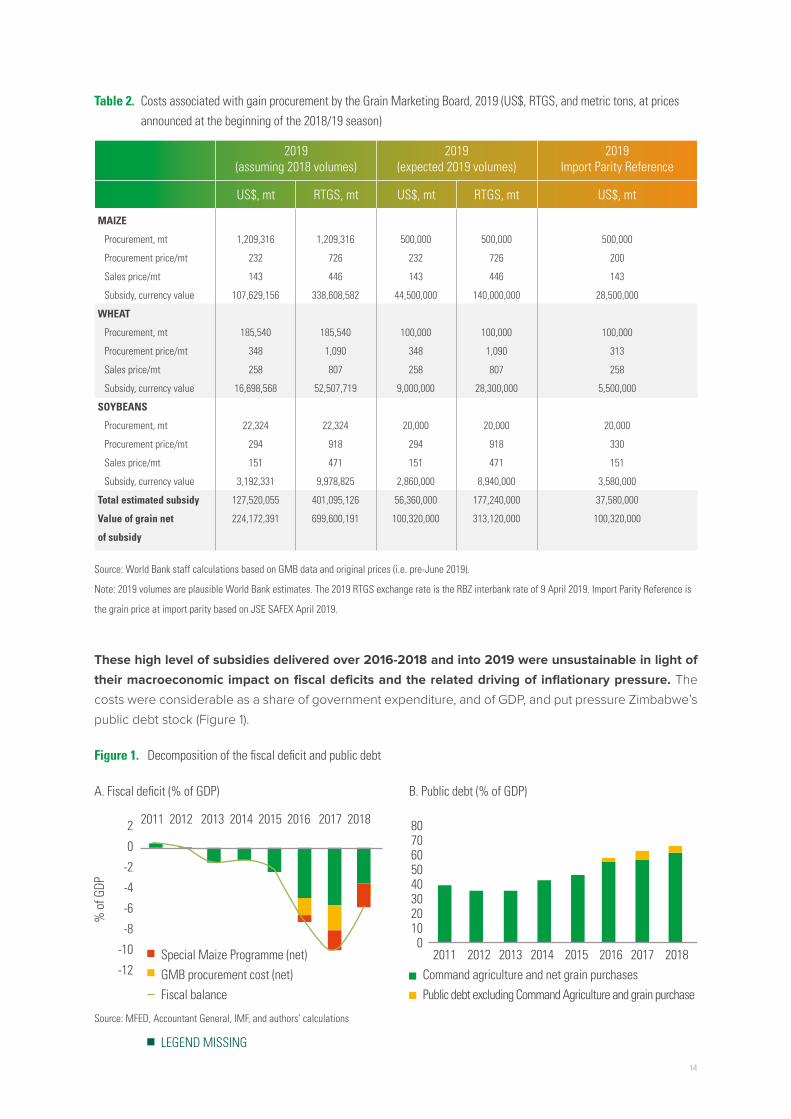
Table 2. Costs associated with gain procurement by the Grain Marketing Board, 2019 (US$, RTGS, and metric tons, at prices announced at the beginning of the 2018/19 season)
Figure 1. Decomposition of the fiscal deficit and public debt
A. Fiscal deficit (% of GDP)
2
0
-2
-4
-6
-8
-10
-12
80706050403020100
% o
f GDP
2011 2012 2013 2014 2015 2016 2017 2018
2011 2012 2013 2014 2015 2016 2017 2018Special Maize Programme (net)GMB procurement cost (net)Fiscal balance
LEGEND MISSING
Command agriculture and net grain purchasesPublic debt excluding Command Agriculture and grain purchase
B. Public debt (% of GDP)
Source: World Bank staff calculations based on GMB data and original prices (i.e. pre-June 2019).
Note: 2019 volumes are plausible World Bank estimates. The 2019 RTGS exchange rate is the RBZ interbank rate of 9 April 2019. Import Parity Reference is
the grain price at import parity based on JSE SAFEX April 2019.
Source: MFED, Accountant General, IMF, and authors’ calculations
These high level of subsidies delivered over 2016-2018 and into 2019 were unsustainable in light of
their macroeconomic impact on fiscal deficits and the related driving of inflationary pressure. The
costs were considerable as a share of government expenditure, and of GDP, and put pressure Zimbabwe’s
public debt stock (Figure 1).
2019 (assuming 2018 volumes)
US$, mt US$, mt US$, mtRTGS, mt RTGS, mt
1,209,316
232
143
107,629,156
185,540
348
258
16,698,568
22,324
294
151
3,192,331
127,520,055
224,172,391
500,000
232
143
44,500,000
100,000
348
258
9,000,000
20,000
294
151
2,860,000
56,360,000
100,320,000
1,209,316
726
446
338,608,582
185,540
1,090
807
52,507,719
22,324
918
471
9,978,825
401,095,126
699,600,191
500,000
726
446
140,000,000
100,000
1,090
807
28,300,000
20,000
918
471
8,940,000
177,240,000
313,120,000
MAIZE
Procurement, mt
Procurement price/mt
Sales price/mt
Subsidy, currency value
WHEAT
Procurement, mt
Procurement price/mt
Sales price/mt
Subsidy, currency value
SOYBEANS
Procurement, mt
Procurement price/mt
Sales price/mt
Subsidy, currency value
Total estimated subsidy
Value of grain net
of subsidy
2019 (expected 2019 volumes)
2019 Import Parity Reference
500,000
200
143
28,500,000
100,000
313
258
5,500,000
20,000
330
151
3,580,000
37,580,000
100,320,000
14

Official exchange rate RTGS/US$-mid ratesParallel market exchange rate RTGS/US$10,000 mid rates
M2 y-o-y change (%) [LHS]CPI y-o-y change (%) [RHS]
The high spending on agriculture was again financed through quasi-fiscal activities, coupled with
Zimbabwe’s third currency reform in 10 years. Inflation accelerated once more. RBZ lending soared
(Figure 2) to finance government support to agriculture. To finance deficits of between 7 and 10% of GDP
in 2016 and 2017, the RBZ provided financing in the form of electronic payments – designated as RTGS$.
This resulted in a relative depreciation of this de-facto digital currency in relation to the US dollar (Figure
2B), reducing the relative value of all electronic payments. The monetary expansion also found its way into
RTGS-based inflation; inflation reached as much as 80% in April 2019 (Figure 2C).
Figure 2. Monetary expansion, inflation, and parallel exchange rates
A. RBZ lending, 2014-2018 (US$ ‘000)
B. Official and parallel exchange rates (RTGS$/US$)
C. Money supply and consumer prices (year-on-year percentage change)
4,5004,0003,5003,0002,5002,0001,5001,000
0
65.5
54.5
43.5
32.5
21.5
1
50454035302520151050
80706050403020100-10
Jan-
16Ap
r-16
Jul-1
6Oc
t-16
Jan-
17Ap
r-17
Jul-1
7Oc
t-17
Jan-
18Ap
r-18
Jul-1
8Oc
t-18
Jan-
19Ap
r-19
2-Ja
n-18
2-Fe
b-18
2-M
ar-1
82-
Apr-1
82-
May
-18
2-Ju
n-18
2-Ju
l-18
2-Au
g-18
2-Se
p-18
2-Oc
t-18
2-No
v-18
2-De
c-18
2-Ja
n-19
2-Fe
b-19
2-M
ar-1
92-
Apr-1
92-
May
-19
Oct-1
4
Jan-
15
Apr-1
5
Jul-1
5
Oct-1
5
Jan-
16
Apr-1
6
Jul-1
6
Oct-1
6
Jan-
17
Apr-1
7
Jul-1
7
Oct-1
7
Jan-
18
Apr-1
8
Jul-1
8
Monetary support to agriculture (US$ ‘000)
Source: RBZ.
Source: RBZ and WB staff estimates. Source: RBZ, ZIMSTAT and WB staff estimates.
15
In the face of these macroeconomic pressures, additional reforms were introduced during September–
November 2019 with the aim to bring the fiscal costs and unsustainable monetary consequences
under control. Two reforms are being attempted. The first shifts the implementation of input finance under
Command Agriculture to a “Smart Agriculture” mechanism operated through banks, and the second reform
changes subsidies on commodity sales by GMB to food processors.
The Smart Agriculture mechanism, announced by the Ministry of Finance and Economic Development
in September in advance of the main 2019–20 planting season, engages four banks in the provision of
credit to farmers who express interest and successfully pass through a two-stage-screening process.
A first screening was done by district-level AGRITEX agents who checked on basic eligibility criteria (such
as access to productive land, no delinquent debts). Farmers who passed this stage were assigned to
participating banks – Commercial Bank of Zimbabwe (CBZ), Stanbic, AgriBank, and the Zimbabwe Women
Micro-Finance Bank (ZWMB) – who conducted their own risk assessment, inclusive of site visits, in establishing
a financing dossier specific to each farmer’s intended activity and input needs. Subsequent to approval of
the dossier, farmers were instructed to acquire the identified input needs from approved suppliers, with
payment for the inputs made through a direct transfer from the bank to the supplier. Terms of the loan are
reported to be 270 days at an interest rate of 10.5% per annum and an upfront fee of 2.25% (part of the
loan drawdown). Government provided notional area targets guide the banks; CBZ, for instance, aims for
210,000 hectares of maize plantings and 30,000 hectares of soybean plantings. The Women’s Bank was to
focus on small grains and women and youth farmers, while AgriBank was to focus on credit to suppliers of
seeds, agro-chemicals, and fertilizers. The Treasury was reported to have earmarked ZWL$120 million for
the Agriculture Input Guarantee Scheme.
The new Smart Agriculture mechanism has strengths and weaknesses. Among the strengths are that
it relies explicitly on credit assessments of farmers by banks, unlike the Command Agriculture mechanism
of the prior several years, which conducted no professional credit risk assessment of participating farmers.
Another strength is that the banks appear to be mobilizing wrap-around services for farmers to provide
technical support during the agricultural season. In addition, weather insurance has been arranged (for
instance, by CBZ) to protect against the risk that drought will make farmers unable to service their loans.
Also, on the positive side, the banks (CBZ, for instance) have established the capacity to monitor farmers’
production in real time through satellite imagery, enabling them to ascertain that the agreed cropping activity
was indeed initiated and to estimate area and yields as the season progresses.
The design of the program has two main weakness. One is that the government guarantees 100% of
loan amounts to the banks. Thus, while the banks are providing capital up front for the program, none of
this is at their risk, which introduces the hazard that they will be less rigorous in their credit risk assessment,
client monitoring, and loan payment recovery. It may be possible to address this weakness in subsequent
iterations of the program, by a reduction in the government guarantee coverage and hence increasing risk
sharing by the banks in credit outcomes. However, this will need to proceed carefully, since banks are
already significantly exposed to agriculture sector and most of the non-performing loans are in agriculture.
The Government’s fiscal space to honor the guarantees is also limited. The other weakness is the risk of
side selling by farmers at the time of harvest, and default on credits received.
The other main subsidy reform, announced as part of the proposed 2020 Budget Speech by the Minister
of Finance to Parliament (November 2019), was the intended removal of the 38% subsidy on the price
of commodities – maize, wheat and soybeans – sold by GMB to national food producers of maize
meal, wheat flour, and edible oils. This general subsidy was indeed removed by end-2019 and replaced
16
by a targeted subsidy at the point of production for roller meal, standard loaves of bread,
and cooking oil. This targeted subsidy approach offers the potential to be more efficient
compared with the well-known leakages in implementing subsidies at GMB points of
sale. However, its implementation has not proven easy. Criteria that were established
for processor eligibility to participate in the subsidy mechanism proved cumbersome to
apply to small and medium-scale processors; maize allocations from GMB in some cases
exceeded processors’ capacity, with excess quantities reported to have leaked at profit
into grain markets; processed product shortages have persisted and resulted in retail
price speculation and queues. By February 2020, these problems were severe enough
that Government was designing a replacement mechanism to be based on a consumer
voucher system relying on a data-base being put together of eligible consumers in both
urban and rural areas.
In 2017, ZIMSTAT undertook a household survey that provides data for analyzing
the impacts of a variety of government interventions in the agricultural sector.
The survey in that year consisted of a new agricultural productivity module (APM) in
addition to the periodic Poverty, Income, Consumption, and Expenditure Economic
survey (PICES). The data (cleaned and anonymized) were released in 2019 and publicly
available for analysis. The next section reports on preliminary analysis to understand if
micro-level effects of the government support activities through Command Agriculture
can be discerned and quantified.
17

D. Preliminary Evidence on Command
Agricultures ImpactsA study was undertaken to quantify the impact of the first year of
implementation of the Command Agriculture programme using data
from the 2017 Poverty, Income, Consumption and Expenditure Survey
(PICES) - Agricultural Productivity Module (APM). We are especially
interested in knowing whether the Command Agriculture Programme
(CAP) stimulated agricultural yield. The analysis employs Propensity
Score Matching (PSM) techniques for the estimations.
In order to assess the impact of the command agriculture programme
we need information on both the outcome, intervention as well as
on the beneficiaries. The intervention in this case is whether or not a
household received government assistance. This information is found
in Q1 in the Agricultural Productivity Module of the Poverty, Income,
Consumption and Expenditure Survey (PICES).
The statistics show that 5.4 percent (64) of all households (1819)
participated in the Command Agriculture programme which involved
providing farming inputs. Generally, Command Agriculturegrowers
utilised more inputs than the non-Command Agriculture growers. On
average, Command Agriculture growers utilised 4 more kilograms of
maize seeds per hectare than non-Command Agriculture growers (22.8
versus 18.6 kilograms per hectare). Also a larger proportion of Command
Agriculture growers (93.8 percent) utilised hybrid or improved seeds
compared to non-Command Agriculture growers (77.8 percent). This
pattern also extends to fertiliser usage where 98.4 percent of Command
Agriculturegrowers utilised the inputs compared to 77 percent for non-
Command Agriculture growers. As for farm-type, most non-Command
Agriculture programme participants (49.6. percent) were in communal
areas while about 72 percent of participating households had A1 and
ORA farms.
18
Although close monitoring by extension officers may help reduce such measurement errors. ⁵
Regarding inputs received by farmers participating in the CA programme, most recipient households
received seeds (90.6 percent) and fertilizer (67.2 percent). This extensive margin of input recipients was
followed in descending order by herbicides (34.4 percent), diesel (20.3 percent), pesticides (14.1 percent),
lime and assistance with land preparation (0.047).
Regarding the impact of the CA programme on average maize output in kilograms per hectare, Table 3 shows
the results for the average treatment effect on the treated (ATT). The ATT is small and insignificant regardless of
the matching algorithm employed. Thus, there is no significant difference in maize yield between CA and non-CA
farmers. This indicates that although the objective of the CA programme may have been noble the programme,
which utilized a significant amount of resources, did not manage to stimulate maize yield or agricultural productivity.
What might explain this evidence of minimal impact of the first year of CA implementation in the PICES APM
data? Some possible sources of measurements errors may be contributing to the results. First, programme
beneficiaries may understate their output with a view to side-selling or avoid repayments. Second, farmers
can also under-report inputs received for fear they will be asked to pay back additional amounts. Third,
some beneficiaries may also overstate their output with a view to putting across a message that says the
programme may be working (possibly wanting to also get future assistance from the government). Fourth,
non-CA participants, knowing the criteria required to qualify for similar future programmes, may also overstate
their output. The above weaknesses, coupled with the fact that we conducted the PSM (itself a highly data-
hungry procedure) using a very small sample of CA programme participants, imply that we need to look at
the results only as indicative.⁵ Also, one needs to assess the costs versus the benefits of the programme. For
example, given the amount of resources used and the resultant impact can one really say the programme
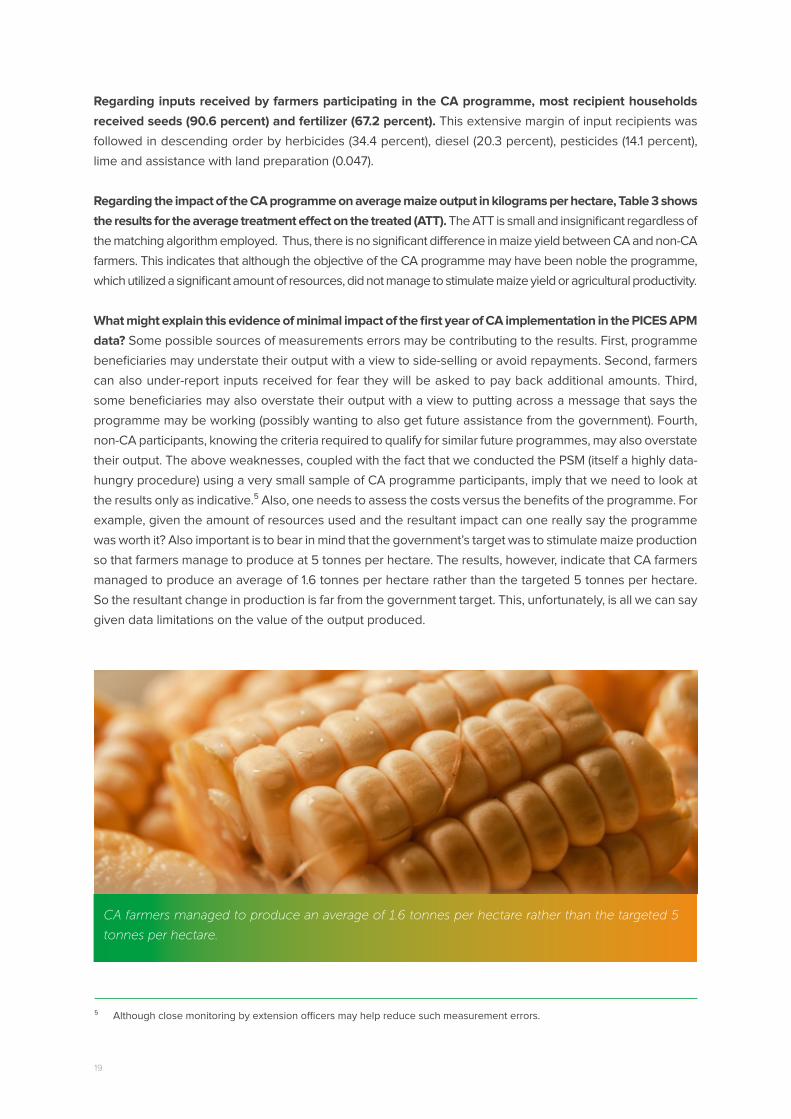
was worth it? Also important is to bear in mind that the government’s target was to stimulate maize production
so that farmers manage to produce at 5 tonnes per hectare. The results, however, indicate that CA farmers
managed to produce an average of 1.6 tonnes per hectare rather than the targeted 5 tonnes per hectare.
So the resultant change in production is far from the government target. This, unfortunately, is all we can say
given data limitations on the value of the output produced.
CA farmers managed to produce an average of 1.6 tonnes per hectare rather than the targeted 5
tonnes per hectare.
19

This study uses the propensity score matching (PSM) approach to investigate the impact of the Command Agriculture programme on maize yield. The PSM estimator seeks to solve a missing data problem. In this particular case the missing data problem arises from being able to observe the farmers that benefit from the programme but not knowing what they would be like without the programme (counterfactual). But through properly matching beneficiaries and non-beneficiaries one can analytically estimate the counterfactual. Matching the beneficiaries to non-beneficiaries is done by running a logit/probit regression of the following equation:
P = f(household characteristics, farm and regional characteristics)
Where P is a dummy variable taking a value of 1 if a farmer is a programme beneficiary and 0 if not. Being selected into the programme may be a function of household, farm/plot and regional characteristics, and the analysis proceeds by choosing for the equations right hand side those characteristics that are not affected by the outcome but that do affect participation. These include farmer age, farmer experience, region, soil quality, plot size, etc. It is important to understand the CA programme’s selection process or the eligibility criteria, which can help with the selection of the appropriate variables to be included in the above equation.
Use of PSM must deal with a number of potential shortcomings including that some underlying assumptions may fail to be true for the case being analysed. Such assumptions include that it is random whether a farmer is in the participant or non-participant groups between which matching is done, and that there are no un-observed characteristics that bear on farmers being in one group or another. If the assumptions don’t hold, selection bias becomes a problem as the treatment and control group may be systematically different. The PSM analysis reported here attempted to manage these shortcomings, but did not have adequate data to apply all the corrective techniques desirable.
Box 1. Facilitation of contract farming can outperform Command Agriculture mechanisms
20
E. Options and RecommendationsIn response to the agriculture subsidy-driven fiscal and monetary
stresses that accumulated through 2018, MFED had already identified
in the 2019 budget statement to Parliament that spending on these
subsidies needed to be reduced. Some of the avenues to achieve this
reduction already have been acted upon. In addition, several options
can improve the administrative efficiency of subsidy delivery (and
thus reduce fiscal costs) and improve beneficiary targeting (and thus
improve the cost-effectiveness of achieving the desired impacts). It is
important to bear in mind that input and output subsidies on their own,
no matter how well implemented, are unlikely to achieve meaningful
outcomes unless part of a more holistic approach to broader sector
transformation, and this section will return to this point after first
reviewing options specific to subsidy policy and mechanisms.
Reduce the price subsidy in GMB procurement and sales. The wedge
between GMB procurement price to sales prices – at about 38%
under the policy maintained by the President’s end-November 2019
statements – constitutes a large subsidy that needs to be reduced. In
the latter years of the dollarized economy through the February 2019
conversion to a local currency (RTGS), GMB’s domestic procurement
price tended to be much higher than import parity while its sales price
2121
In the event, Government only infrequently adjusted the GMB procurement
price for maize to acquire stocks for the Strategic Grain Reserve: from ZWL$
1400/mt on 12 July 2019, to 2100, 4000 then 6958 on 19 July, 4 October and 13
March 2020, respectively.
⁶
to domestic processors was below import parity, to simultaneously
incentivize food crop production and subsidize the cost of staple
foods such as maize and wheat flour and edible oils. But as noted,
the three adjustments during 2019 have moved and kept the
procurement price closer to import parity.
In a high-inflation environment, it is difficult to estimate well in
advance a harvest season procurement price in RTBS that is in
line with import parity. As a result, the announced administered
prices can quickly get out of line with import parity, with substantial
subsidy implications re-emerging. A US dollar-denominated price
for future procurement can be estimated from grain futures, for
instance from the Johannesburg Stock Exchange, and used
to anchor the procurement price. To improve transparency and
minimize speculative arbitrage, however, a clear, formula-based
determination of the procurement price could be adopted, along
with clearly specified intervals during the harvest season when that
formula will be used to formally update the procurement price. Such
an arrangement would provide grain sellers with clear price signals
and minimize subsidy growth from exchange rate movements.⁶
The GMB sales price to processors could also be adjusted toward
the actual market price, transitionally reducing the current 38%
price wedge, while the impact on consumers could be cushioned
through a more targeted social protection approach. More research
is required to understand the distributional consequences and
policy options for adjustments to the sales price.
Farmers should be free to sell their produce where they get the
best prices and should not be bound to sell to the GMB as under
the current Statutory Instrument 145. At the same time, however,
suitable arrangements have to be put in place for contractual
Command Agriculture participants to repay suppliers. Over the
longer term, the sustainable approach would be for farmers to have
financial arrangements with commercial banks for working capital
loans, underpinned by collateral in the form of property titles or
other securitization. Ultimately it seems likely that facilitation of
contract farming can outperform Command Agriculture mechanisms
in enhancing productivity in the agricultural sector (Box 2).
22
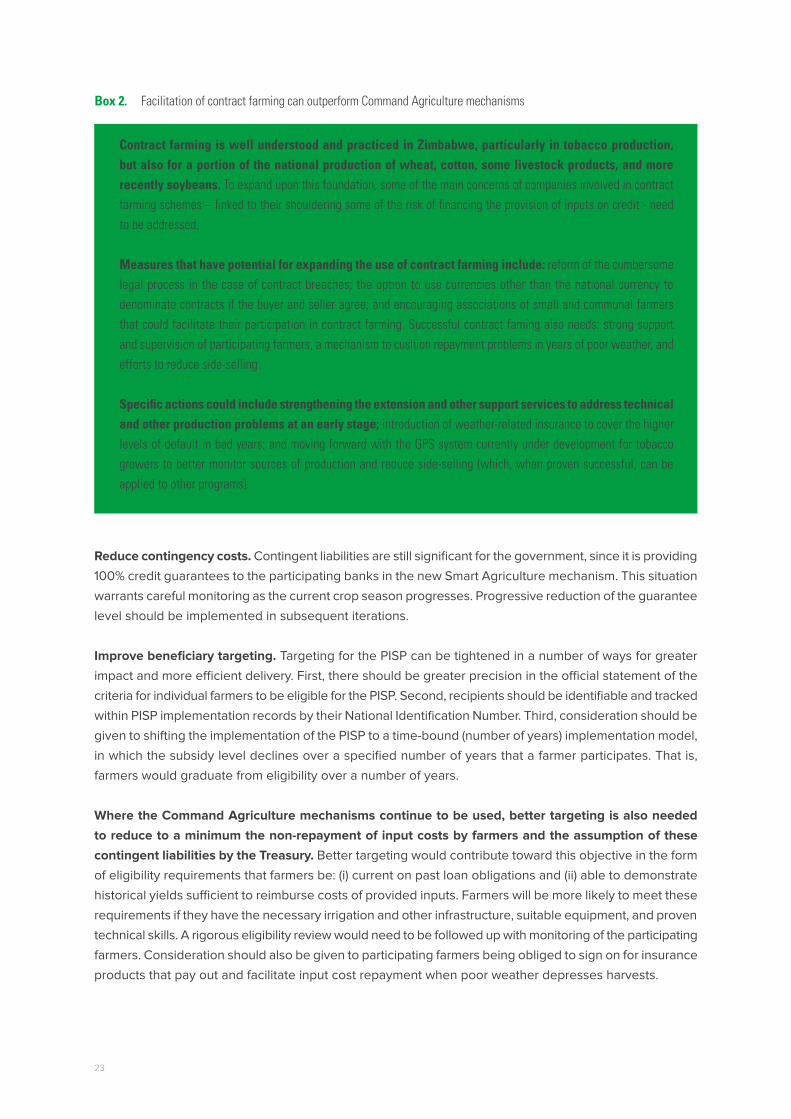
Contract farming is well understood and practiced in Zimbabwe, particularly in tobacco production, but also for a portion of the national production of wheat, cotton, some livestock products, and more recently soybeans. To expand upon this foundation, some of the main concerns of companies involved in contract farming schemes – linked to their shouldering some of the risk of financing the provision of inputs on credit - need to be addressed.
Measures that have potential for expanding the use of contract farming include: reform of the cumbersome legal process in the case of contract breaches; the option to use currencies other than the national currency to denominate contracts if the buyer and seller agree; and encouraging associations of small and communal farmers that could facilitate their participation in contract farming. Successful contract faming also needs: strong support and supervision of participating farmers, a mechanism to cushion repayment problems in years of poor weather, and efforts to reduce side-selling.
Specific actions could include strengthening the extension and other support services to address technical and other production problems at an early stage; introduction of weather-related insurance to cover the higher levels of default in bad years; and moving forward with the GPS system currently under development for tobacco growers to better monitor sources of production and reduce side-selling (which, when proven successful, can be applied to other programs).
Box 2. Facilitation of contract farming can outperform Command Agriculture mechanisms
Reduce contingency costs. Contingent liabilities are still significant for the government, since it is providing
100% credit guarantees to the participating banks in the new Smart Agriculture mechanism. This situation
warrants careful monitoring as the current crop season progresses. Progressive reduction of the guarantee
level should be implemented in subsequent iterations.
Improve beneficiary targeting. Targeting for the PISP can be tightened in a number of ways for greater
impact and more efficient delivery. First, there should be greater precision in the official statement of the
criteria for individual farmers to be eligible for the PISP. Second, recipients should be identifiable and tracked
within PISP implementation records by their National Identification Number. Third, consideration should be
given to shifting the implementation of the PISP to a time-bound (number of years) implementation model,
in which the subsidy level declines over a specified number of years that a farmer participates. That is,
farmers would graduate from eligibility over a number of years.
Where the Command Agriculture mechanisms continue to be used, better targeting is also needed
to reduce to a minimum the non-repayment of input costs by farmers and the assumption of these
contingent liabilities by the Treasury. Better targeting would contribute toward this objective in the form
of eligibility requirements that farmers be: (i) current on past loan obligations and (ii) able to demonstrate
historical yields sufficient to reimburse costs of provided inputs. Farmers will be more likely to meet these
requirements if they have the necessary irrigation and other infrastructure, suitable equipment, and proven
technical skills. A rigorous eligibility review would need to be followed up with monitoring of the participating
farmers. Consideration should also be given to participating farmers being obliged to sign on for insurance
products that pay out and facilitate input cost repayment when poor weather depresses harvests.
23
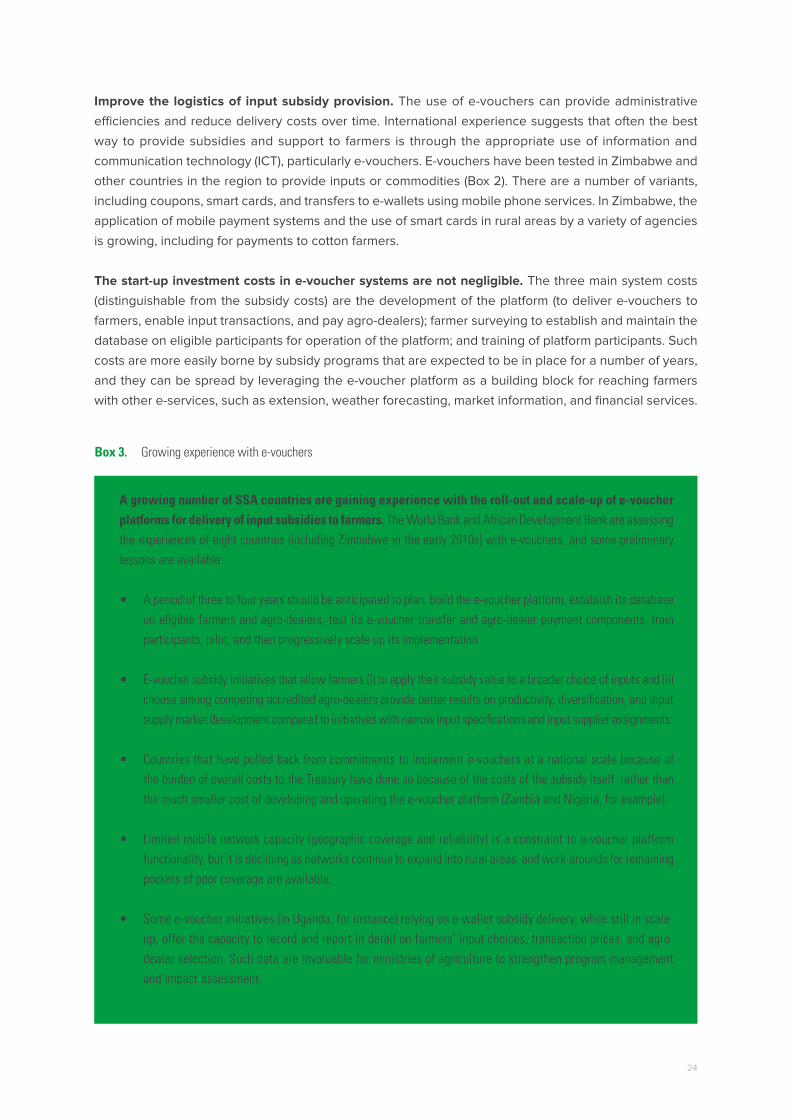
A growing number of SSA countries are gaining experience with the roll-out and scale-up of e-voucher platforms for delivery of input subsidies to farmers. The World Bank and African Development Bank are assessing the experiences of eight countries (including Zimbabwe in the early 2010s) with e-vouchers, and some preliminary lessons are available:
• A period of three to four years should be anticipated to plan, build the e-voucher platform, establish its database on eligible farmers and agro-dealers, test its e-voucher transfer and agro-dealer payment components, train participants, pilot, and then progressively scale up its implementation.
• E-voucher subsidy initiatives that allow farmers (i) to apply their subsidy value to a broader choice of inputs and (ii) choose among competing accredited agro-dealers provide better results on productivity, diversification, and input supply market development compared to initiatives with narrow input specifications and input supplier assignments.
• Countries that have pulled back from commitments to implement e-vouchers at a national scale because of the burden of overall costs to the Treasury have done so because of the costs of the subsidy itself, rather than the much smaller cost of developing and operating the e-voucher platform (Zambia and Nigeria, for example).
• Limited mobile network capacity (geographic coverage and reliability) is a constraint to e-voucher platform functionality, but it is declining as networks continue to expand into rural areas, and work-arounds for remaining pockets of poor coverage are available.
• Some e-voucher initiatives (in Uganda, for instance) relying on e-wallet subsidy delivery, while still in scale-up, offer the capacity to record and report in detail on farmers’ input choices, transaction prices, and agro-dealer selection. Such data are invaluable for ministries of agriculture to strengthen program management and impact assessment.
Box 3. Growing experience with e-vouchers
Improve the logistics of input subsidy provision. The use of e-vouchers can provide administrative
efficiencies and reduce delivery costs over time. International experience suggests that often the best
way to provide subsidies and support to farmers is through the appropriate use of information and
communication technology (ICT), particularly e-vouchers. E-vouchers have been tested in Zimbabwe and
other countries in the region to provide inputs or commodities (Box 2). There are a number of variants,
including coupons, smart cards, and transfers to e-wallets using mobile phone services. In Zimbabwe, the
application of mobile payment systems and the use of smart cards in rural areas by a variety of agencies
is growing, including for payments to cotton farmers.
The start-up investment costs in e-voucher systems are not negligible. The three main system costs
(distinguishable from the subsidy costs) are the development of the platform (to deliver e-vouchers to
farmers, enable input transactions, and pay agro-dealers); farmer surveying to establish and maintain the
database on eligible participants for operation of the platform; and training of platform participants. Such
costs are more easily borne by subsidy programs that are expected to be in place for a number of years,
and they can be spread by leveraging the e-voucher platform as a building block for reaching farmers
with other e-services, such as extension, weather forecasting, market information, and financial services.
24

• Adequate training and capacity building to accompany e-voucher approaches are a priority, and three types are important: (i) training specific to e-voucher platform operation for farmers and agro-dealers; (ii) capacity building for agro-dealers in supply and inventory management; and (iii) extension activities with farmers to improve input choice and use.
Zimbabwe implemented e-vouchers for several years at the start of the 2010s and can draw on this experience if it chooses to pursue this delivery mechanism again (see FAO, 2012). Zimbabwe can also draw upon the additional experience of other countries in the intervening years, take advantage of the additional mobile network capacity extension into Zimbabwe’s rural areas, and draw on lessons from the growing experience in Zimbabwe’s commercial banking sector with electronic payment systems when developing options for e-voucher value transfer to farmers.
The commercial banking sector is already demonstrating the capacity to use electronic payment systems
to implement credits to farmers for input purchases under the government’s 2019–20 Smart Agriculture
Programme. One of the participating banks, upon approving farmers for a program credit, issues them
an e-voucher number which is taken to the input suppliers designated in their credit dossier. Using a cell
phone-based platform, the input supplier verifies the farmer’s registration and e-voucher number, supplies
the designated inputs, and receives payment directly from the bank.
Design and implementation of an e-voucher mechanism would also be appropriate for the PISP. To
further assess the practicalities of implementing such a system, there is a need to move forward – in
consultation with the banks that are already rolling out proprietary e-voucher systems as part of their
participation in the 2019–20 Smart Agriculture Programme, agro-dealer representatives, input suppliers,
smart-card providers and cell phone companies, cash transfer companies, Ministry of Lands Agriculture
Water Climate and Rural Resettlement and MFED – on planning steps toward a concrete design for piloting
and scaling up an e-voucher platform for delivering input subsidies. Compared with the commercial
bank’s electronic payments system already being implemented for the 2019–20 crop season, the design
of additional flexibility would need to be added to handle full or partial payments (depending on subsidy
level) on the government account, with the balance covered by credit or farmer own resources.
Reduce cross-commodity subsidy distortions. Both tobacco and cotton have become important cash-
earning crops grown predominantly by small farmers. A main reason for government support to cotton
and tobacco farmers is that these crops can contribute significantly to export earnings. In addition,
efficient domestic production of cotton has the potential for supporting a domestic transformation industry
(hence additional value added). Further, in the current transitional period from a dollarized economy to
a re-introduced national currency, contribution to healthy export earnings helps to maintain a liquid and
stable foreign exchange market. Cotton production has rebounded strongly since 2015 with significant
government intervention after a collapse caused by private ginners and farmers being unable to overcome
problems of side-selling.
Nonetheless, it is hard to justify cotton production continuing to be incentivized through free provision
of inputs to all cotton farmers, while tobacco farmers pay for their inputs. While transitional support
to cotton may have been warranted to re-launch production five years ago, rapid expansion of farmer
participation and output has been achieved (until the current year’s, drought-impacted harvest). A cotton
25

subsidy reduction plan now needs to be implemented to reduce input subsidies for cotton farmers so that
production incentives are not grossly different from those for tobacco farmers, and so that some percentage
of cotton farmers are able to stay in production despite inefficiency largely because recipients of free inputs.
Build the foundation for agricultural productivity to overcome long-standing structural deficiencies by
shifting the emphasis of public expenditures in agriculture from subsidies and private goods to supportive
public goods. This general conclusion comes out of the detailed analysis of the report Zimbabwe: Public
Expenditure Review with a Focus on Agriculture (2019). Although essential public services and investments
such as agricultural research, extension and animal disease control benefitted from modest fiscal spending
growth in spending over 2011–15, the level of expenditure remained inadequate and was further reduced
by 2018. While this spending on public goods, services, and investments was declining, fiscal and quasi-
fiscal transfers for private goods were dramatically increasing, especially for the financing of farm enterprise
production through input subsidies and price supports on public procurement of outputs. The balance
has begun to shift back towards public goods with the 2019 budget, and needs to continue, along with the
renewed government efforts to overcome sector constraints arising from profound land tenure insecurity
and inadequate investment in rural infrastructure, particularly in upstream irrigation capacity.
Additional opportunities exist for shifting public expenditure from subsidies to programmes able to
build sustainable agricultural sector resilience to climate vulnerabilities. These are detailed in Zimbabwe:
Climate Smart Agriculture Investment Programme (World Bank, 2019). Public investment packages are
identified in five priority areas: enhanced agricultural knowledge and innovation system, sustainable
livelihoods through diversified livestock systems, water harvesting for resilient crop and livestock production,
women- and youth-focused value chain development, and resilient commercial dairy farming.
Undertake future household socio-economic surveys (e.g. ZIMSTAT’s PISCES APM) to enable quantitative
analysis of subsidy programs. Such analysis can provide quantitative estimates of the welfare impacts
of the programs (who gains, who loses, how big are the efficiency losses) and such evidence should be
brought to bear on the determination of policies and programme design.
26
ReferencesFAO (2012). E-vouchers in Zimbabwe: Guidelines for agricultural input distribution. September. http://www.
fao.org/fileadmin/user_upload/emergencies/docs/2_E-voucher_Zimbabwe.pdf
Goyal, Aparajita, and John Nash (2017). Reaping Richer Returns: Public Spending Priorities for African Agri-
culture Productivity Growth. Africa Development Forum series. Washington, DC: World Bank
Gwatidzo, Tendai and Shylock Muyengwa. 2020. Zimbabwe - Assessing the Impact of the Command Ag-
riculture programme using the Propensity Score Matching Approach. Draft.
Jayne, T. S., N. M. Mason, W. J. Burke, and J. Ariga. 2016. “Agricultural Input Subsidy Programs in Africa: An
Assessment of Recent Evidence.” International Development Working Paper 145, Michigan State Univer-
sity, East Lansing, MI.
Jayne, T. S., D. Mather, N. Mason, and J. Ricker-Gilbert. 2013. “How Do Fertilizer Subsidy Programs Affect
Total Fertilizer Use in Sub-Saharan Africa? Crowding Out, Diversion, and Benefit/Cost Assessments.”
Agricultural Economics 44 (6): 687–703.
Jayne, T. S., D. Mather, N. M. Mason, J. Ricker-Gilbert, and E. Crawford. 2015. “Rejoinder to the Comment
by Andrew Dorward and Ephraim Chirwa on Jayne, T. S., D. Mather, N. Mason, and J. Ricker‐Gilbert.
2013. ‘How Do Fertilizer Subsidy Programs Affect Total Fertilizer Use in Sub‐Saharan Africa? Crowding
Out, Diversion, and Benefit/Cost Assessments.’ Agricultural Economics 44 (6): 687–703.” Agricultural
Economics 46 (6): 745–55.
Jayne, T.S., and Shahidur Rashid. 2013. Input subsidy programs in sub-Saharan Africa: a synthesis of recent
evidence. Agricultural Economics 44:547-562
Kelly, Valerie, Eric Crawford, Jacob Ricker-Gilbert (2011). “The New Generation of African Fertilizer Subsi-
dies: Panacea or Pandora Box?” Michigan State University and USAID. May. http://ageconsearch.umn.
edu/record/107460/files/number_87.pdf
Morris, Michael et al. (2007). Fertilizer Use in African Agriculture: Lessons Learned and Good Practice
Guidelines. World Bank.
Moyo, Sam, Walter Chambati and Shepherd Siziba (2014). Agricultural Subsidies Policies in Zimbabwe: a
review. African Institute for Agrarian Studies. July.
Shimeles, A., D. Z. Gurara, and D. B. Tessema. 2015. “Market Distortions and Political Rent: The Case of
Fertilizer Price Divergence in Africa.” Institute for the Study of Labor. Discussion Paper 8998, Institute for
the Study of Labor, Bonn, Germany.
Scoones, Ian. 2017. “Command Agriculture and the Politics of Subsidies.” Zimbabweland. https://zimba-
bweland.wordpress.com/2017/09/25/command-agriculture-and-the-politics-of-subsidies/
Shonhe, Toendepi. (2018) ‘The Political Economy of Agricultural Commercialisation in Zimbabwe’ APRA
Working Paper 12, Future Agricultures Consortium. https://opendocs.ids.ac.uk/opendocs/bitstream/han-
dle/123456789/13817/WP_12_Layout_FINAL%20%28003%29.pdf?sequence=1&isAllowed=y
World Bank Group. 2019. Zimbabwe: Agriculture Sector Disaster Risk Assessment. March.
World Bank Group. 2019. Zimbabwe: Climate Smart Agriculture Investment Plan.
World Bank and MFED. 2019. Zimbabwe: Public Expenditure Review with a Focus on Agriculture.
27