Absolute Quantification of Amyloid Propagons by Digital ...
11
Zurich Open Repository and Archive University of Zurich Main Library Strickhofstrasse 39 CH-8057 Zurich www.zora.uzh.ch Year: 2017 Absolute Quantifcation of Amyloid Propagons by Digital Microfuidics Pfammatter, Manuela ; Andreasen, Maria ; Meisl, Georg ; Taylor, Christopher G ; Adamcik, Jozef ; Bolisetty, Sreenath ; Sanchez-Ferrer, Antoni ; Klenerman, David ; Dobson, Christopher M ; Mezzenga, Rafaele ; Knowles, Tuomas P J ; Aguzzi, Adriano ; Hornemann, Simone DOI: https://doi.org/10.1021/acs.analchem.7b03279 Posted at the Zurich Open Repository and Archive, University of Zurich ZORA URL: https://doi.org/10.5167/uzh-141180 Journal Article Accepted Version Originally published at: Pfammatter, Manuela; Andreasen, Maria; Meisl, Georg; Taylor, Christopher G; Adamcik, Jozef; Bolisetty, Sreenath; Sanchez-Ferrer, Antoni; Klenerman, David; Dobson, Christopher M; Mezzenga, Rafaele; Knowles, Tuomas P J; Aguzzi, Adriano; Hornemann, Simone (2017). Absolute Quantifcation of Amyloid Propagons by Digital Microfuidics. Analytical Chemistry, 89(22):12306-12313. DOI: https://doi.org/10.1021/acs.analchem.7b03279
Transcript of Absolute Quantification of Amyloid Propagons by Digital ...
Zurich Open Repository andArchiveUniversity of ZurichMain LibraryStrickhofstrasse 39CH-8057 Zurichwww.zora.uzh.ch
Year: 2017
Absolute Quantification of Amyloid Propagons by Digital Microfluidics
Pfammatter, Manuela ; Andreasen, Maria ; Meisl, Georg ; Taylor, Christopher G ; Adamcik, Jozef ;Bolisetty, Sreenath ; Sanchez-Ferrer, Antoni ; Klenerman, David ; Dobson, Christopher M ; Mezzenga,
Raffaele ; Knowles, Tuomas P J ; Aguzzi, Adriano ; Hornemann, Simone
DOI: https://doi.org/10.1021/acs.analchem.7b03279
Posted at the Zurich Open Repository and Archive, University of ZurichZORA URL: https://doi.org/10.5167/uzh-141180Journal ArticleAccepted Version
Originally published at:Pfammatter, Manuela; Andreasen, Maria; Meisl, Georg; Taylor, Christopher G; Adamcik, Jozef; Bolisetty,Sreenath; Sanchez-Ferrer, Antoni; Klenerman, David; Dobson, Christopher M; Mezzenga, Raffaele;Knowles, Tuomas P J; Aguzzi, Adriano; Hornemann, Simone (2017). Absolute Quantification of AmyloidPropagons by Digital Microfluidics. Analytical Chemistry, 89(22):12306-12313.DOI: https://doi.org/10.1021/acs.analchem.7b03279

Full text access provided via ACS AuthorChoice
Analytical Chemistry is published by the American Chemical Society. 1155 SixteenthStreet N.W., Washington, DC 20036
Published by American Chemical Society. Copyright © American Chemical Society.
However, no copyright claim is made to original U.S. Government works, or worksproduced by employees of any Commonwealth realm Crown government in the course
of their duties.
Article
Absolute Quantification of Amyloid Propagons by Digital MicrofluidicsManuela Pfammatter, Maria Andreasen, Georg Meisl, Christopher G. Taylor, Jozef Adamcik,
Sreenath Bolisetty, Antoni Sanchez-Ferrer, David Klenerman, Christopher M. Dobson,
Raffaele Mezzenga, Tuomas P.J. Knowles, Adriano A Aguzzi, and Simone Hornemann
Anal. Chem., Just Accepted Manuscript • DOI: 10.1021/acs.analchem.7b03279 • Publication Date (Web): 03 Oct 2017
Downloaded from http://pubs.acs.org on October 26, 2017
Just Accepted
“Just Accepted” manuscripts have been peer-reviewed and accepted for publication. They are postedonline prior to technical editing, formatting for publication and author proofing. The American ChemicalSociety provides “Just Accepted” as a free service to the research community to expedite thedissemination of scientific material as soon as possible after acceptance. “Just Accepted” manuscriptsappear in full in PDF format accompanied by an HTML abstract. “Just Accepted” manuscripts have beenfully peer reviewed, but should not be considered the official version of record. They are accessible to allreaders and citable by the Digital Object Identifier (DOI®). “Just Accepted” is an optional service offeredto authors. Therefore, the “Just Accepted” Web site may not include all articles that will be publishedin the journal. After a manuscript is technically edited and formatted, it will be removed from the “JustAccepted” Web site and published as an ASAP article. Note that technical editing may introduce minorchanges to the manuscript text and/or graphics which could affect content, and all legal disclaimersand ethical guidelines that apply to the journal pertain. ACS cannot be held responsible for errorsor consequences arising from the use of information contained in these “Just Accepted” manuscripts.

Absolute Quantification of Amyloid Propagons by Digital Microfluidics
Manuela Pfammatter,† Maria Andreasen,‡,§ Georg Meisl,‡ Christopher G. Taylor,‡ Jozef Adamcik,┴ Sreenath Bolisetty,┴ Antoni Sánchez&Ferrer,┴ David Klenerman,‡ Christopher M. Dobson,‡ Raffaele Mezzenga,┴ Tuomas P. J. Knowles,‡,║ Adriano Aguzzi,† and Simone Hornemann†,* †Institute of Neuropathology, University of Zurich, CH&8091 Zurich, Switzerland ‡Department of Chemistry, University of Cambridge, Cambridge CB2 1EW, United Kingdom §Interdisciplinary Nanoscience Center (iNANO), Aarhus University, DK&8000 Aarhus, Denmark ┴Department of Health Sciences and Technology, ETH Zurich, CH&8092 Zurich, Switzerland ║Cavendish Laboratory, Department of Physics, University of Cambridge, Cambridge CB3 1HE, United Kingdom
��������� The self&replicating properties of numerous proteins into amyloid fibrils is a common phenomenon and underlies several neurodegenerative diseases. Because propagation&active fibrils are chemically indistinguishable from innocuous aggregates and monomeric precursors, their detection requires measurements of their replicative capacity. Here we present a digital amyloid quantitative assay (d&AQuA) with insulin as amyloid model for the absolute quantification of single replicative units, propagons. D&AQuA is a microfluidics&based technology that performs miniaturized simultaneous propagon&induced amplification chain reac&tions within hundreds to thousands of picoliter&sized droplets. At limiting dilutions, the d&AQuA reactions follow a stochastic re&gime indicative of the detection of single propagons. D&AQuA thus enables absolute quantification of single propagons present in a given sample at very low concentrations. The number of propagons quantified by d&AQuA was similar to that of fibrillar insulin aggregates detected by atomic&force microscopy and to an equivalent microplate&based assay, providing independent evidence for the identity of insulin propagons with a subset of morphologically defined protein aggregates. The sensitivity, precision and accura&cy of d&AQuA renders it suitable to multiple biotechnological and medical applications.
Digital microfluidic assays have revolutionized quantitative biology, as they facilitate the precise and accurate quantifica&tion of absolute numbers of biomolecules1,2. The use of digital microfluidics offers the possibility of performing a very large number of individual experiments in small droplet compart&ments in a short time, yielding the data volumes needed for digital data analysis. Microfluidics therefore enables assays with higher throughput, greater reliability and sensitivity1,3&5. The miniaturization to picoliter (pL)&sized droplets further allows for an effective reduction in the consumption of rare biological samples, costs, potential contamination, and surface effects due to the absence of air&water interfaces1&3. This con&cept has already transformed several applications in DNA technology, including the further development of digital pol&ymerase chain reaction (dPCR)6,7 to droplet digital PCR (ddPCR)8&11, DNA microarrays12,13 and next generation se&quencing14, as it enables large numbers of parallel experiments for absolute quantification of specific targets even at low concentrations. Digital microfluidics has also been applied to cell&based assays15&17, protein biomarker detection18, isother&mal amplification chemistries19, studies on amyloid growth20 and high&throughput applications1. In this paper, we describe the extension of digital microfluidics to amyloid amplification assays.
Amyloid amplification assays have recently been developed to address the urgent need for reliable and sensitive ��� ����� detection of amyloid aggregates, causing several neurodegen&erative disorders, including transmissible spongiform encepha&lopathies, Alzheimer’s, Parkinson’s and many other diseases21&
23, for basic research and for diagnostic applications24&27. These diseases are associated with the ability of proteins to self&assemble into amyloid fibrils in a nucleation&dependent polymerization reaction28,29. This process typically follows a sigmoidal kinetic progression involving primary nucleation, aggregate growth and fibril elongation, along with secondary
processes, such as fragmentation and surface&induced nuclea&tion events that serve to amplify the number of aggregates30,31. The process of amyloid formation therefore involves the gen&eration of “propagons”32, defined as all those aggregated spe&cies, including fibrils, that are able to seed or propagate the conversion of monomeric proteins into a higher number of active propagons in a template&catalyzed way.
Amyloid amplification assays are built on the self&propagation principle, promoting the amplification of minute amounts of active pathological species to readily detectable levels in the presence of their monomeric counterparts. Assays that either use cyclic sonication for efficient amplification, as the protein misfolding cyclic amplification (PMCA) assay24, or agitation in a microplate, as the real&time quaking&induced conversion (RT&QuIC) assay25, have been developed for sensi&tive detection of prions and prionoids33 in biological samples26,27,34. These assays, however, have certain limitations with respect to automation and high&throughput applications and are, because of their analogue nature, able to measure only average concentrations. Digital microfluidics may overcome these limitations, because of its ability to perform high num&bers of pL&sized volume reactions, allowing the precise quan&tification of absolute numbers of single low&abundance entities present in a system.
Here, we describe the development of a digital amyloid quantitative assay, d&AQuA, using droplet&based microfluid&ics. We demonstrate that d&AQuA represents a powerful method for the ultrasensitive detection of single insulin propa&gons contained in a sample and their absolute quantification. D&AQuA also showed a significantly better performance with respect to sensitivity, precision and speed than an equivalent assay in a microplate. We therefore anticipate that d&AQuA holds great potential for advancing a wide range of biotechno&logical and medical research applications and opens up new
Page 1 of 9
ACS Paragon Plus Environment
Analytical Chemistry
123456789101112131415161718192021222324252627282930313233343536373839404142434445464748495051525354555657585960

avenues for ultrasensitive and precise high&throughput digital diagnostics.
EXPERIMENTAL SECTION
��� ��� Human insulin was purchased from Sigma&Aldrich (SAFC Biosciences) and used without further purifi&cation. All chemicals unless otherwise specified were pur&chased from Sigma&Aldrich. ������ � �� �� ������ ����� ��� Fibrils were assem&
bled �������� by incubating 1 mM monomeric human insulin in a 10 mM HCl water solution at pH 2.0 (HCl, pH 2.0) at 65 °C and agitation at 600 rpm for 72 h. Remnant monomer was removed by intense washing with HCl (pH 2.0) using Amicon centrifugal filters (MWCO 100 kDa; Merck Millipore)35. Fibrils were lyophilized and stored at &20 °C until usage. The sample was diluted to a concentration of 400 µM (monomer equivalents) to yield the standard fibril sample. ������� �� �������������� � ��� The standard fi&
bril sample was characterized using atomic force microscopy (AFM), dynamic light scattering (DLS), Fourier transform infra&red spectroscopy (FTIR), far&UV circular dichroism (CD) and a self&propagation activity assay. Details are de&scribed in SI Materials and Methods. � ���������� ��� ��� ��� � ��� Microfluidic flow&
focusing devices (Figure S1) were fabricated using standard soft&lithography techniques36. Briefly, the device design was patterned on a silicon wafer using SU&8 negative photoresist (MicroChem) to produce a negative mold. Microfluidic chan&nels were cast into poly(dimethylsiloxane) (PDMS; Dow Corning Sylgard 184 Silicone Elastomer) on the silicon mold, and the PDMS stamp was cured at 65 °C for 150 min before peeling off the mold. Channel inlets and outlets were punched into the PDMS stamp before oxygen plasma bonding it to a glass slide to seal the channels. To make channel walls hydro&phobic, the device was flushed with the water repellent agent Aquapel (PPG Industries) for 30 min before washing with isopropanol and then blow&drying with a nitrogen stream. ��������� � Lyophilized insulin was dissolved in HCl
(pH 2.0) at a concentration of 6 mg mL&1 and filtered (50 kDa Amicon centrifugal filters; Millipore UFC505096) to remove higher molecular weight species. The protein was dissolved to a final assay concentration of 400 µM in HCl (pH 2.0) con&taining 0.1 M GdmCl and 40 µM Thioflavin (ThT). Serial 10&fold dilutions of the standard fibril sample were prepared in HCl (pH 2.0) and added to the reaction mixture immediately before encapsulating the mixture into microdroplets. Negative controls were incubated with the same volume of HCl (pH 2.0) instead of fibrils. Amplification reactions were encapsu&lated into water&in&oil&emulsions using a microfluidic device with flow focusing geometry. The sample containing mono&meric substrate, fibrils and ThT was injected into the middle inlet on the chip at a flow rate of 200 µL h&1. The carrier oil phase made of fluorinated FC&40 (Sigma) with 4% (w/v) triblock co&polymer (ABA) surfactant (where A is a perfluori&nated poly(propylene oxide) block and B a poly(ethylene oxide) block, synthesized as previously described37) was in&jected into the outer inlet at a flow rate of 300 µL h&1 to gener&ate droplets with a radius of ~25 µm (volume ~65 pL). Fluid flow rates were controlled with a Cetoni neMESYS syringe pump (Cetoni GmbH). Between 500 and 1400 replicate drop&lets were collected per dilution at the outlet into Rectangular
Boro Silicate capillaries (CM Scientific), and the capillaries were sealed with wax plugs to prevent sample evaporation. Before imaging the capillaries containing samples at different fibril dilutions, capillaries were aligned on a glass slide for amplification and imaging. The aligned capillaries were placed on the automated motorized stage of a custom&built epifluo&rescence laser microscope (Figure S1) and covered with a hotplate heated to 65 °C to induce amplification. To track aggregate formation within the droplets, fluorescent images were acquired every 15 min for approximately 24 h using laser excitation at 445 nm (diode laser (MLD445, Cobolt)). Individ&ual droplets were identified manually, and the average intensi&ty of the droplet area was extracted for all frames. The bright&ness of the images of the 102 capillary in Figure 3a was mod&erately adjusted to account for minor differences in brightness arising from imaging on different frames of the automated&stage laser (for original figure see Figure S4). Fluorescent traces in Figure 3b were cut after dropping once having reached plateau. � ������� � �� �� ��� � � ��� �� � Lyophilized in&
sulin was dissolved in HCOOH (pH 3.0) at a concentration of 6 mg mL&1 and filtered using 50 kDa Amicon Ultra centrifugal filters (Millipore, Prod.No. UFC505096). The protein was dissolved to a final concentration of 2 µM in 0.75 M D&mannitol, 1 M GdmCl, 10 µM ThT, HCOOH (pH 3.0) in a reaction volume of 28.5 µL per well. To each reaction either 1.5 µL of serial 10&fold dilutions from 104 to 1015 of the stand&ard fibril sample (dissolved in HCOOH, pH 3.0) or HCOOH (pH 3.0, negative control) was added. Each dilution and the control were performed in sixteen technical replica on black 384&well polystyrene microplates (Corning, Prod. No. 3540) covered with sealing tape (Sarstedt, Prod. No. 95.1999). Mi&croplates were incubated at a constant temperature of 30 °C with cyclic agitation (1 min at 300 rpm followed by 2 min quiescent) on a SpectraMax Paradigm microplate reader (Mo&lecular Devices). To monitor the aggregation kinetics, ThT fluorescence was measured at 482 nm following excitation at 440 nm every 3 min using bottom read. The error of the assay was calculated from three independent replicate measurements of the microplate assay (for data analysis see section ‘Digital data analysis’). The replicate measurements are shown in Figure 5 and Figure S3. � ! ������ � �� To digitize the assay readout for ab&
solute propagon quantification, fluorescence endpoint values of the amplification reactions were transformed into positive and negative signals by thresholding. For the microplate assay, the threshold was set five standard deviations above the mean of the unseeded negative control reactions (�̅� + 5��), any signal above the threshold was regarded as positive signal. For d&AQuA, droplets which showed positive ThT fluorescence at the endpoint were scored positive. The fraction of positive droplets at every dilution was then calculated from the number of positive droplets and the total number of droplets counted in the corresponding brightfield images. The absolute number of propagons in both assays was calculated using the Possion distribution model. The probability of finding � propagons in a reaction compartment if the average number of propagons per reaction compartment is �, is described by the Poisson distri&bution
� = � = �����
�!. (1)
The probability of having one or more propagons per reaction compartment (the probability of a positive signal) is given by
Page 2 of 9
ACS Paragon Plus Environment
Analytical Chemistry
123456789101112131415161718192021222324252627282930313233343536373839404142434445464748495051525354555657585960

� � 0 = 1 � � = 0 = 1 � ���, (2)
where � = 0 is the probability of not having any propagons in the reaction compartment (the probability of a negative
signal). For the different dilution factors �, the probability of having one or more propagons per compartment can be
" !����#� D&AQuA workflow. (i) Samples containing 10&fold serial dilutions of the standard fibril sample (blue dashes) are mixed with soluble substrate protein and ThT. The mixtures are partitioned into several thousand pL&droplets using a microfluidic flow&focusing de&vice (inset). (ii) Microdroplets are collected into glass capillaries for endpoint amplification and detection by ThT fluorescence (green). (iii) ThT&positive droplets are counted and the absolute number of propagons in the standard fibril sample is quantified by Poisson statis&tics.
described as
�� � 0 = 1 � ���
�� , (3) where � is the average number of propagons in the original sample and � is the dilution factor. The fraction of positive signals can be related to the dilution factors using equation (3), and therefore the absolute number of propagons in the original sample � can be calculated. All data analysis was done using Matlab (The MathWorks, USA). " �� ��$�� � � ���� ��"�� The number of fibrils per
unit volume of the standard fibril sample was estimated from AFM length distribution and mass conservation. The distri&bution of fibrils � ! as a function of the contour length measured by AFM is shown in Figure 4b. This distribution is essentially the same distribution of fibrils per unit volume, differing by a mere normalization constant α, so that the distribution of fibrils per unit volume is simply #� ! . The constant α can be obtained from the total mass per unit vol&ume, which is obtained from the initial molar concentration of monomer $%, i.e. $%&'. Therefore, by mass conserva&tion this results in
∑#� ! ∙ ! *+,- = $%&', (4)
where ρ can be taken as the density of the monomer and the fibril, supposed to be identical. This then gives # = $%&'/∑� ! ∙ ! *+,- , since all the terms on the right hand are known.
The total number of fibrils per unit volume, 01
2, is then
01
2= ∑#� ! = # ∑� ! =
3456
789:∑ 0;< ∙<;∑� ! , (5)
where both ∑� ! ∙ ! and ∑� ! are known from the distribution of fibrils as a function of the contour length in Figure 4b.
RESULTS AND DISCUSSION
%��&���'� ��� ������� The set&up of d&AQuA is sche&matically depicted in Figure 1. We used a microfluidic chip with flow focusing geometry to generate uniform droplet compartments for highly parallel amplification of single propagons in thousands of pL&droplets. This high number of parallel measurements enables a digital interpretation of the data for precise and accurate quantification of the absolute number of propagons contained in a sample. Individual droplets encapsulating the soluble substrate protein, Thiofla&vin T (ThT), a fluorescent dye that allows specific detection of amyloid aggregates, along with a series of 10&fold dilu&tions of a propagon&containing sample, are formed from water&in&oil emulsions at kilohertz frequency. Droplets of each fibril dilution are stored inside glass capillaries, and amplification is carried out in the individual droplets to the end&point. Droplets containing amplified aggregates induced by propagons are detected by their positive ThT fluorescence signals, and the number of fluorescence positive and nega&tive droplets is counted. As d&AQuA enters a stochastic regime at limiting dilutions, the Poisson distribution model becomes valid and is applied for determining the absolute number of propagons in the original sample.
Page 3 of 9
ACS Paragon Plus Environment
Analytical Chemistry
123456789101112131415161718192021222324252627282930313233343536373839404142434445464748495051525354555657585960

������� �� ��������!���� ��� For the development of d&AQuA, we used the hormone insulin as amyloid model, because it readily forms amyloid fibrils analogous to those of disease relevant amyloidogenic proteins38, and is therefore widely used as experimental model protein to study amyloid formation39&41. We first generated a standard fibril sample, a well&characterized sample of preformed insulin fibrils with reproducible propagation properties. Insulin fibrils were reconstituted �������� by incubating human insulin at a con¢ration of 1 mM in HCl (pH 2.0) at 65 °C and agitation at 600 rpm for 72 h. Residual monomeric species were re&moved by intense washing with 1 mM HCl (pH 2.0) using Amicon
�" !����(� The standard fibril sample was characterized by DLS (a), FTIR spectroscopy (b, shown are the whole spectrum as solid line and its deconvoluted peaks in dashed lines), far&UV CD spectroscopy (c) and self&propagation activity assay (d).�
centrifugal filters (MWCO 100 kDa)35. The remaining fibrils were lyophilized and stored at &20 °C. The fibrils were dilut&ed to a concentration of 400 µM (monomer equivalents) to yield a standard fibril sample. We analyzed this sample for the typical morphological and biophysical characteristics of amyloid fibrils and its self&propagation activity in a seeded propagation assay (Figure 2). Dynamic light scattering (DLS) measurements showed that the fibrils have a mean hydrodynamic radius of 85 nm (Figure 2a). Furthermore, both Fourier transform infrared (FTIR) and circular dichro&ism (CD) spectra indicated a high β&sheet content of about 86%, which is characteristic for amyloid fibrils40,42 (Figure 2b,c). To assess the propagation activity of the sample, the kinetics of fibril formation by monomeric insulin in the presence of preformed fibrils from the standard sample were monitored by optical density at OD370nm (Figure 2d). Increas&ing concentrations of preformed fibrils (1, 2 and 5% of total protein concentration) were found to shorten the lag phase of the aggregation reaction gradually, as expected for a nucleat&ed self&assembly process. These results indicate that the standard fibril sample exhibits the typical biophysical char&acteristics of amyloid fibrils. ����������� ��� ������� Next, we established the ex&
perimental conditions for d&AQuA (Figure 1; experimental setup in Figure S1). 400 µM insulin in HCl (pH 2.0), 0.1 M guanidinium chloride (GdmCl) and 40 µM ThT were encap&
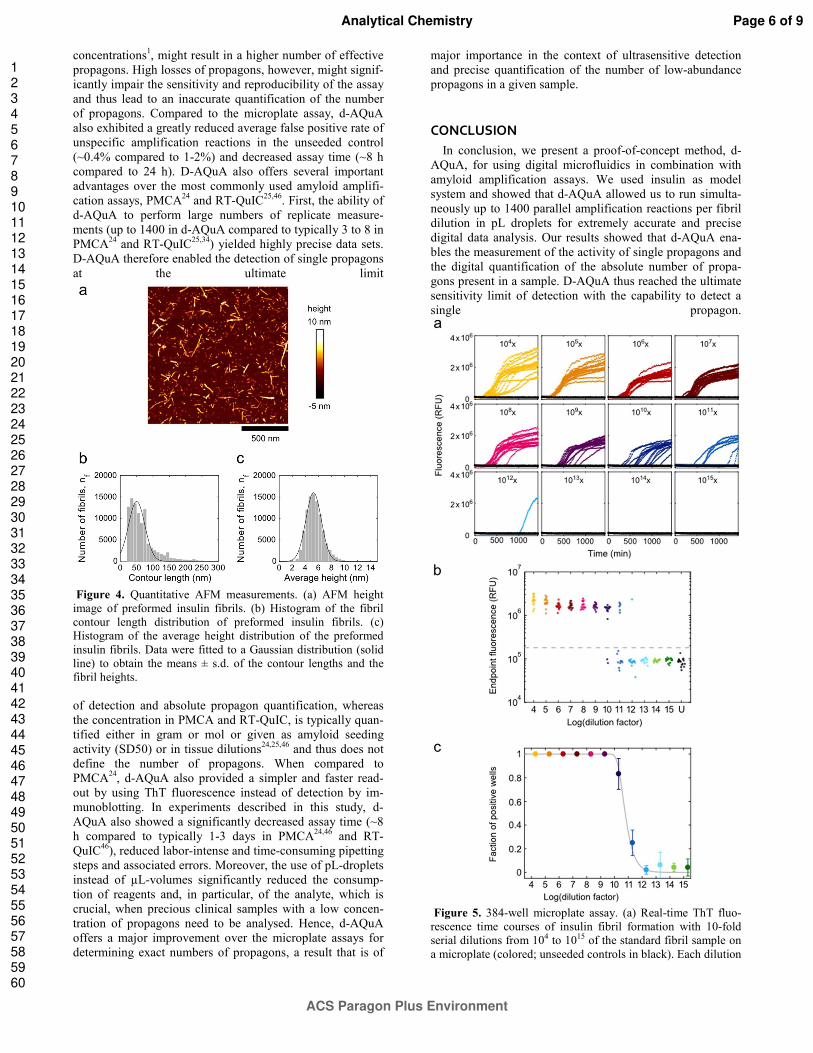
sulated inside microdroplets together with serial 10&fold dilutions ranging from 102 to 108 of the standard fibril sam&ple (in monomer equivalents). We found that the use of a high concentration of the substrate and the addition of low amounts of GdmCl, which accelerates aggregation by induc&ing partial unfolding of the monomeric species43, were im&portant for efficient amplification. Droplets without (i.e. unseeded controls) and with different dilutions of preformed fibrils were collected in separate capillaries, mounted on a microscope slide and heated to 65 °C to accelerate the growth and proliferation of the propagons. Fluorescence images were taken every 15 min to follow the amplification process in the individual droplets over 24 h (Figure 3a,b). For the absolute quantification of the number of propagons, we analyzed between 500 and 1400 droplets per dilution and digitized the readout by grouping the fluorescence endpoint signals into positive and negative outcomes by thresholding (see Experimental Section for details). A Poisson distribution was fitted to the number of fluorescence positive (i.e. propa&gon containing) droplets for each dilution factor at the assay endpoint with the best fits yielding an average number of 2.1W1011 propagons per µL (accurate to within a factor of 1.1, n=2) in the standard fibril sample (Figure 3c and Experi&mental Section). Moreover, under these conditions we ob&tained a very low average false positive rate of only ~0.4% spontaneously aggregating reactions in a total of about 700 droplets of the unseeded control (Figure S2). Because of the high level of conformity of the data to the Poisson distribu&tion model, we conclude that the assay is capable of amplify&ing single propagons in pL droplets and allows the precise quantification of absolute numbers of propagons at low femtomolar concentrations. )� � ��� ��� ��� ������� ��� ����!���� � � �"�� To
monitor the number of propagons determined by d&AQuA with an alternative method, we used AFM to estimate the dimensions and the physical number of fibrillar aggregates present in the standard fibril sample (Figure 4a). The average contour length of the fibrils was (50 ± 35) nm (Figure 4b) and the height was (5.3 ± 1.7) nm (Figure 4c). We used these dimensions and mass conservation to calculate the physical number of fibrils per unit volume of the standard fibril sam&ple (see Experimental Section for details). The calculations yielded an average number of 1.1W1012 µL&1 fibrils. This number is closely similar (less than an order of magnitude, i.e. within a factor of ~5) to the number of propagons deter&mined by d&AQuA (2.1W1011 propagons µL&1). A possible explanation for the small difference between these numbers might be that not all fibrillar aggregates detected by AFM also act as active propagons in d&AQuA. We therefore con&clude that the active propagons detected by d&AQuA are identical to a fraction of morphologically defined fibrillar aggregates. ����� �������� ! ��� �� ����� � � ����� � ��
� � ������� Microplate&based amyloid amplification as&says in 96&well plate formats with an analogue read&out are the current standard assays for detecting amyloid aggregates in biological samples26,27,34. To enable a direct comparison between the sensitivity of this method with d&AQuA, we developed an amyloid amplification assay for insulin in a microplate with a digital read&out (Figure 5). As the preci&sion of digital read&outs increases with the number of repli&cate reactions, we established the assay in a 384&well format. We also adapted the experimental conditions to account for
Page 4 of 9
ACS Paragon Plus Environment
Analytical Chemistry
123456789101112131415161718192021222324252627282930313233343536373839404142434445464748495051525354555657585960

the higher volumes and larger surface areas used in the mi&croplate assay. A range of experimental parameters including substrate protein concentration, temperature, shaking cycles, pH&value, buffer conditions and additives were systematical&ly screened and optimized for best assay performance. Espe&cially crucial was the addition of D&mannitol, which has been reported to suppress spontaneous nucleation of insulin
by stabilization of the monomer, while enhancing the growth rate of existing fibrils44. HCOOH at pH 3.0 was chosen as the solvent, because of its reported ability to reduce sponta&neous aggregation of monomeric insulin45. Finally, we iden&tified a concentration of 2 ZM soluble substrate protein in 0.75 M D&mannitol, 1 M GdmCl,
�
" !����*� D&AQuA for single propagon quantification. (a) Representative fluorescence image sections of the capillaries containing micro&droplets with 10&fold serial dilutions from 102 to 108 of the standard fibril sample (in monomer equivalents). Droplets containing newly formed aggregates appeared as ThT fluorescence positive, whereas droplets without preformed fibrils were fluorescence negative. U: unseeded control. (b) Representative time courses of insulin fibril formation within microdroplets for different fibril dilutions (colored; unseeded controls in black) monitored by ThT fluorescence. 200 representative reactions are shown per dilution. (c) Fraction of fluores&cence&positive droplets as a function of the logarithm of the dilution factor. Every data point represents the mean ± s.d. from two independ&ent experiments of d&AQuA. A Poisson distribution (grey line) was fitted to the data to quantify the number of propagons in the standard fibril sample.
10 µM ThT, HCOOH (pH 3.0) with cyclic agitation (1 min at 300 rpm, 2 min quiescent) at 30 °C as optimal assay con&ditions. These conditions resulted in an efficient reduction of spontaneous aggregation to a false positive rate of 1 & 2% in 384 replicas over the course of the experiment (24 h; Figure S2), while yielding highly reproducible aggregation kinetics of the propagon&catalyzed reactions (Figure 5a).
For digital quantification of the propagon number in our standard fibril sample, we again performed serial 10&fold dilutions of the standard fibril sample (104& to 1015&fold dilutions in monomer equivalents) using 16 replicas per dilution. The aggregation time course was monitored by real&time ThT fluorescence over 24 h (Figure 5a). At low dilu&tions (104& to 109&fold), we observed lag times of approxi&mately 8 h, which gradually increased with higher dilutions of preformed fibrils. Endpoint fluorescence signals of reac&tions with low dilution factors (≤ 109&fold) of preformed fibrils were all positive, whereas at higher dilutions only fractions of the replicate reactions appeared positive (14, 6
and 1 out of 16 replicas for 1010&, 1011& and 1012&fold dilu&tions, respectively). All reactions at dilution factors ≥ 1013&fold, as well as the control (without preformed fibrils) were scored negative (Figure 5b). The fraction of positive signals was correlated to the dilution factors, and a Poisson distribu&tion was fitted to the data (Figure 5c and Experimental Sec&tion). The best fit yielded an average number of 1.4W109 propagons µL&1 (accurate to within a factor of 1.2, n=3) in the standard fibril sample (Figure 5c and Figure S3). These data show that the microplate assay (1.4W109 propagons µL&1) is also capable of detecting individual propagons, but when compared to d&AQuA (2.1W1011 propagons µL&1) two orders of magnitude less propagons were detected.
The detection of a lower number of active propagons in the microplate assay might be attributed to a loss of fibrils to various solid surfaces during the extensive pipetting steps or to their adherence to the microplate surface. Alternatively, the absence of solid contact surfaces in the microdroplets or the small droplet sizes, associated with higher effective
Page 5 of 9
ACS Paragon Plus Environment
Analytical Chemistry
123456789101112131415161718192021222324252627282930313233343536373839404142434445464748495051525354555657585960
concentrations1, might result in a higher number of effective propagons. High losses of propagons, however, might signif&icantly impair the sensitivity and reproducibility of the assay and thus lead to an inaccurate quantification of the number of propagons. Compared to the microplate assay, d&AQuA also exhibited a greatly reduced average false positive rate of unspecific amplification reactions in the unseeded control (~0.4% compared to 1&2%) and decreased assay time (~8 h compared to 24 h). D&AQuA also offers several important advantages over the most commonly used amyloid amplifi&cation assays, PMCA24 and RT&QuIC25,46. First, the ability of d&AQuA to perform large numbers of replicate measure&ments (up to 1400 in d&AQuA compared to typically 3 to 8 in PMCA24 and RT&QuIC25,34) yielded highly precise data sets. D&AQuA therefore enabled the detection of single propagons at the ultimate limit
�" !���� +� Quantitative AFM measurements. (a) AFM height image of preformed insulin fibrils. (b) Histogram of the fibril contour length distribution of preformed insulin fibrils. (c) Histogram of the average height distribution of the preformed insulin fibrils. Data were fitted to a Gaussian distribution (solid line) to obtain the means ± s.d. of the contour lengths and the fibril heights.
of detection and absolute propagon quantification, whereas the concentration in PMCA and RT&QuIC, is typically quan&tified either in gram or mol or given as amyloid seeding activity (SD50) or in tissue dilutions24,25,46 and thus does not define the number of propagons. When compared to PMCA24, d&AQuA also provided a simpler and faster read&out by using ThT fluorescence instead of detection by im&munoblotting. In experiments described in this study, d&AQuA also showed a significantly decreased assay time (~8 h compared to typically 1&3 days in PMCA24,46 and RT&QuIC46), reduced labor&intense and time&consuming pipetting steps and associated errors. Moreover, the use of pL&droplets instead of µL&volumes significantly reduced the consump&tion of reagents and, in particular, of the analyte, which is crucial, when precious clinical samples with a low concen&tration of propagons need to be analysed. Hence, d&AQuA offers a major improvement over the microplate assays for determining exact numbers of propagons, a result that is of
major importance in the context of ultrasensitive detection and precise quantification of the number of low&abundance propagons in a given sample.
CONCLUSION
In conclusion, we present a proof&of&concept method, d&AQuA, for using digital microfluidics in combination with amyloid amplification assays. We used insulin as model system and showed that d&AQuA allowed us to run simulta&neously up to 1400 parallel amplification reactions per fibril dilution in pL droplets for extremely accurate and precise digital data analysis. Our results showed that d&AQuA ena&bles the measurement of the activity of single propagons and the digital quantification of the absolute number of propa&gons present in a sample. D&AQuA thus reached the ultimate sensitivity limit of detection with the capability to detect a single propagon.
�" !���� ,� 384&well microplate assay. (a) Real&time ThT fluo&rescence time courses of insulin fibril formation with 10&fold serial dilutions from 104 to 1015 of the standard fibril sample on a microplate (colored; unseeded controls in black). Each dilution
Page 6 of 9
ACS Paragon Plus Environment
Analytical Chemistry
123456789101112131415161718192021222324252627282930313233343536373839404142434445464748495051525354555657585960

and the control was performed in sixteen technical replica. (b) Fluorescence endpoint signals at different fibril dilution factors (colored; unseeded controls in black, U). The grey dashed line shows the threshold ��=== + 5�� used for the positive/negative scoring of the signals. (c) Fraction of positive wells as a function of the logarithm of the dilution factor. Data represents the mean ± s.d. from three independent experiments.
Compared to a complementary microplate assay, which also reached the ultimate level of sensitivity, d&AQuA turned out to be the more rapid and precise method and to have a higher recovery rate of low&abundance propagons. This opens up the possibility for multiple applications. For example, d&AQuA provides the potential by correlating its data with mathematical models to address specific scientific questions for a more fundamental understanding of the molecular mechanisms of amyloid formation. In addition, d&AQuA might be of practical use for the detection of even smallest traces of insulin aggregates that cannot be detected with existing analytical methods in biopharmaceutical prepara&tions of insulin products used for therapy in diabetes pa&tients47&49 and may lead to an immune response in patients after subcutaneous injection49. Our technology also holds the potential to be used for rapid, ultrasensitive and highly paral&lel preclinical and clinical diagnosis through the detection of early pathological propagons in protein misfolding and ag&gregation (PMA) diseases for personalized medicine. In particular, a small&volume, single&use disposable chip with the ability to diagnose accurately PMA diseases from body fluids holds great promise for novel automated diagnostic approaches. Finally, the technological innovations of d&AQuA are well suited to the establishment of powerful high&throughput screening platforms for the identification of novel aggregation inhibitors, both in the context of stabilizing reagents for biopharmaceutical products or as drugs to cure PMA diseases. We therefore envisage that d&AQuA has great potential for advancing biomedical research and sensitive point&of&care diagnostics for PMA diseases.
ASSOCIATED CONTENT
SUPPORTING INFORMATION
The Supporting Information is available free of charge on the ACS Publications website. SI Materials and Methods. SI Figures: Experimental setup of d&AQuA (Figure S1). Comparison of false positive rates between d&AQuA and the microplate assay (Figure S2). Poisson analysis of three individual microplate assays (Figure S3). Raw images of Figure 3a (Figure S4). (PDF)�
AUTHOR INFORMATION
Corresponding Author
*Email: [email protected]. Phone: +41 44 255 21 07.
Notes The authors declare no competing financial interest.
ACKNOWLEDGMENT
We thank Rita Moos and Lisa Caflisch for technical help, Tom Mason for surfactant synthesis and Elisabeth J. Rushing for editing the manuscript. This work was funded and supported by
Sanofi&Aventis Deutschland GmbH within a research collabora&tion of the University of Zurich and Sanofi&Aventis Deutschland GmbH. MP is the recipient of a Forschungskredit of the Univer&sity of Zurich (grant no. FK&16&026) and an EMBO Short&Term Fellowship. MA is the recipient of an individual post doc grant from the Danish Council for Independent Research, Natural Sciences (FNU&11&113326). GM is supported by the European Research Council and Sidney Sussex College Cambridge. CGT is supported by the Frances and Augustus Newman Foundation. DK is supported by the European research council and Royal Society. CMD is supported by the Wellcome Trust and the Cambridge Centre for Misfolding Diseases. TPJK is supported by the Biotechnology and Biological Sciences Research Coun&cil, the Frances and Augustus Newman Foundation, Cancer Research UK, and the European Research Council and the Cambridge Centre for Misfolding Diseases. AA is the recipient of an Advanced Grant of the European Research Council, a European Union Framework 7 Grant (NEURINOX), and is supported by the Swiss National Foundation, the Clinical Re&search Priority Programs “Small RNAs” and “Human Hemato&Lymphatic Diseases”, SystemsX.ch, and the Grela Foundation. SH is the recipient of grants from SystemsX.ch (SynucleiX) and the commission innovations of the University Hospital of Zur&ich.
REFERENCES
(1) Guo, M. T.; Rotem, A.; Heyman, J. A.; Weitz, D. A. ����� (-#(, ��, 2146&2155.
(2) Theberge, A. B.; Courtois, F.; Schaerli, Y.; Fischlechner, M.; Abell, C.; Hollfelder, F.; Huck, W. T. S. ������� ������ ����� ��� (-#-, ��, 5846&5868.
(3) Mitchell, P. ��������������� (--#, ��, 717&721. (4) Dressler, O. J.; Solvas, X. C. i.; deMello, A. J. ������ ����
���������� (-#., �!, 1&24. (5) Hong, J. W.; Quake, S. R. ��������������� (--*, ��, 1179&
1183. (6) Sykes, P. J.; Neoh, S. H.; Brisco, M. J.; Hughes, E.; Condon,
J.; Morley, A. A. ���"�����#��$ #//(, �%, 444&449. (7) Vogelstein, B.; Kinzler, K. W. &����� ����� ����� '���� ('�
#///, �), 9236&9241. (8) Beer, N. R.; Hindson, B. J.; Wheeler, E. K.; Hall, S. B.; Rose,
K. A.; Kennedy, I. M.; Colston, B. W. ���������� (--., *�, 8471&8475.
(9) Beer, N. R.; Wheeler, E. K.; Lee&Houghton, L.; Watkins, N.; Nasarabadi, S.; Hebert, N.; Leung, P.; Arnold, D. W.; Bailey, C. G.; Colston, B. W. ���������� (--0, +!, 1854&1858.
(10) Hindson, B. J.; Ness, K. D.; Masquelier, D. A.; Belgrader, P.; Heredia, N. J.; Makarewicz, A. J.; Bright, I. J.; Lucero, M. Y.; Hiddessen, A. L.; Legler, T. C.; Kitano, T. K.; Hodel, M. R.; Petersen, J. F.; Wyatt, P. W.; Steenblock, E. R.; Shah, P. H.; Bousse, L. J.; Troup, C. B.; Mellen, J. C.; Wittmann, D. K.; Erndt, N. G.; Cauley, T. H.; Koehler, R. T.; So, A. P.; Dube, S.; Rose, K. A.; Montesclaros, L.; Wang, S.; Stumbo, D. P.; Hodges, S. P.; Romine, S.; Milanovich, F. P.; White, H. E.; Regan, J. F.; Karlin&Neumann, G. A.; Hindson, C. M.; Saxonov, S.; Colston, B. W. ���������� (-##, +%, 8604&8610.
(11) Pinheiro, L. B.; Coleman, V. A.; Hindson, C. M.; Herrmann, J.; Hindson, B. J.; Bhat, S.; Emslie, K. R. ����� ����� (-#(, +�, 1003&1011.
(12) Situma, C.; Hashimoto, M.; Soper, S. A. ������������ (--1, �%, 213&231.
(13) Wang, Y.; Vaidya, B.; Farquar, H. D.; Stryjewski, W.; Hammer, R. P.; McCarley, R. L.; Soper, S. A.; Cheng, Y.&W.; Barany, F. ���������� (--*, *,, 1130&1140.
(14) Lan, F.; Haliburton, J. R.; Yuan, A.; Abate, A. R. ����������� (-#1, *, 11784.
Page 7 of 9
ACS Paragon Plus Environment
Analytical Chemistry
123456789101112131415161718192021222324252627282930313233343536373839404142434445464748495051525354555657585960

(15) Macosko, E. Z.; Basu, A.; Satija, R.; Nemesh, J.; Shekhar, K.; Goldman, M.; Tirosh, I.; Bialas, A. R.; Kamitaki, N.; Martersteck, E. M.; Trombetta, J. J.; Weitz, D. A.; Sanes, J. R.; Shalek, A. K.; Regev, A.; McCarroll, S. A. ���� (-#,, �)�, 1202&1214.
(16) Klein, A. M.; Mazutis, L.; Akartuna, I.; Tallapragada, N.; Veres, A.; Li, V.; Peshkin, L.; Weitz, D. A.; Kirschner, M. W. ���� (-#,, �)�, 1187&1201.
(17) Mazutis, L.; Gilbert, J.; Ung, W. L.; Weitz, D. A.; Griffiths, A. D.; Heyman, J. A. ����&������ (-#*, +, 870&891.
(18) Mok, J.; Mindrinos, M. N.; Davis, R. W.; Javanmard, M. &���������������'����('� (-#+, ���, 2110&2115.
(19) Mazutis, L.; Araghi, A. F.; Miller, O. J.; Baret, J.&C.; Frenz, L.; Janoshazi, A.; Taly, V.; Miller, B. J.; Hutchison, J. B.; Link, D.; Griffiths, A. D.; Ryckelynck, M. ���������� (--/, +�, 4813&4821.
(20) Knowles, T. P. J.; White, D. A.; Abate, A. R.; Agresti, J. J.; Cohen, S. I. A.; Sperling, R. A.; De Genst, E. J.; Dobson, C. M.; Weitz, D. A. &���������������'����('� (-##, �!+, 14746&14751.
(21) Prusiner, S. '������ #/0(, ��), 136&144. (22) Aguzzi, A.; Falsig, J. ���������$��� (-#(, �,, 936&939. (23) Knowles, T. P.; Vendruscolo, M.; Dobson, C. M. ���� ����
-�������������� (-#+, �,, 384&396. (24) Saborio, G. P.; Permanne, B.; Soto, C. ����� (--#, ���,
810&813. (25) Wilham, J. M.; Orrú, C. D.; Bessen, R. A.; Atarashi, R.;
Sano, K.; Race, B.; Meade&White, K. D.; Taubner, L. M.; Timmes, A.; Caughey, B. &��'�&��� (-#-, ), e1001217.
(26) Salvadores, N.; Shahnawaz, M.; Scarpini, E.; Tagliavini, F.; Soto, C. ����� � � (-#+, *, 261&268.
(27) Shahnawaz, M.; Tokuda, T.; Waragai, M.; Mendez, N.; Ishii, R.; Trenkwalder, C.; Mollenhauer, B.; Soto, C. .�-��������� (-#., *�, 163&172.
(28) Cohen, S. I. A.; Linse, S.; Luheshi, L. M.; Hellstrand, E.; White, D. A.; Rajah, L.; Otzen, D. E.; Vendruscolo, M.; Dobson, C. M.; Knowles, T. P. J. &���������������'����('� (-#*, ��!, 9758&9763.
(29) Jarrett, J. T.; Lansbury, P. T. ���� #//*, *%, 1055&1058. (30) Ferrone, F. A.; Hofrichter, J.; Eaton, W. A. .�� -���� �����
#/0,, �+%, 611&631. (31) Knowles, T. P. J.; Waudby, C. A.; Devlin, G. L.; Cohen, S.
I. A.; Aguzzi, A.; Vendruscolo, M.; Terentjev, E. M.; Welland, M. E.; Dobson, C. M. '������ (--/, %�), 1533&1537.
(32) Cox, B.; Ness, F.; Tuite, M. /������$ (--*, �),, 23&33.
(33) Aguzzi, A. ����� (--/, �,�, 924&925. (34) McGuire, L. I.; Poleggi, A.; Poggiolini, I.; Suardi, S.;
Grznarova, K.; Shi, S.; de Vil, B.; Sarros, S.; Satoh, K.; Cheng, K.; Cramm, M.; Fairfoul, G.; Schmitz, M.; Zerr, I.; Cras, P.; Equestre, M.; Tagliavini, F.; Atarashi, R.; Knox, D.; Collins, S.; Haïk, S.; Parchi, P.; Pocchiari, M.; Green, A. ������������ (-#1, +!, 160&165.
(35) Nilsson, M. R.; Dobson, C. M. &�������'��� (--*, ��, 2637&2641.
(36) McDonald, J. C.; Duffy, D. C.; Anderson, J. R.; Chiu, D. T.; Wu, H.; Schueller, O. J. A.; Whitesides, G. M. ������� ����$�$ (---, ��, 27&40.
(37) Holtze, C.; Rowat, A. C.; Agresti, J. J.; Hutchison, J. B.; Angile, F. E.; Schmitz, C. H. J.; Koster, S.; Duan, H.; Humphry, K. J.; Scanga, R. A.; Johnson, J. S.; Pisignano, D.; Weitz, D. A. ����� (--0, +, 1632&1639.
(38) Jiménez, J. L.; Nettleton, E. J.; Bouchard, M.; Robinson, C. V.; Dobson, C. M.; Saibil, H. R. &���������������'����('� (--(, ��, 9196&9201.
(39) Nettleton, E. J.; Tito, P.; Sunde, M.; Bouchard, M.; Dobson, C. M.; Robinson, C. V. ��� �0$��.� (---, *�, 1053&1065.
(40) Bouchard, M.; Zurdo, J.; Nettleton, E. J.; Dobson, C. M.; Robinson, C. V. &�������'��� (---, �, 1960&1967.
(41) Ivanova, M. I.; Sievers, S. A.; Sawaya, M. R.; Wall, J. S.; Eisenberg, D. &���������������'����('� (--/, �!), 18990&18995.
(42) Nelson, R.; Sawaya, M. R.; Balbirnie, M.; Madsen, A.; Riekel, C.; Grothe, R.; Eisenberg, D. ����� (--,, �%,, 773&778.
(43) Ahmad, A.; Millett, I. S.; Doniach, S.; Uversky, V. N.; Fink, A. L. ��������$��0 (--*, ��, 11404&11416.
(44) Saha, S.; Sharma, A.; Deep, S. '������ (-#1, ), 28640&28652.
(45) Brange, J.; Andersen, L.; Laursen, E. D.; Meyn, G.; Rasmussen, E. .��&�����'��� #//., +), 517&525.
(46) Orru, C. D.; Wilham, J. M.; Vascellari, S.; Hughson, A. G.; Caughey, B. &���� (-#(, ), 147&152.
(47) Chi, E. Y.; Krishnan, S.; Randolph, T. W.; Carpenter, J. F. &����� �$� (--*, �!, 1325&1336.
(48) Nielsen, L.; Khurana, R.; Coats, A.; Frokjaer, S.; Brange, J.; Vyas, S.; Uversky, V. N.; Fink, A. L. ��������$��0 (--#, �!, 6036&6046.
(49) D’Souza, A.; Theis, J. D.; Vrana, J. A.; Dogan, A. ��0���� (-#+, ��, 71&75.
Page 8 of 9
ACS Paragon Plus Environment
Analytical Chemistry
123456789101112131415161718192021222324252627282930313233343536373839404142434445464748495051525354555657585960

9
����������� �
Page 9 of 9
ACS Paragon Plus Environment
Analytical Chemistry
123456789101112131415161718192021222324252627282930313233343536373839404142434445464748495051525354555657585960