'A OS FÄCULTfc DES SCIENCES DE PARIS · 'A OS FÄCULTfc DES SCIENCES DE PARIS (0 LABORATOIRE DE...
58
PS!"* ~ü 'A OS FÄCULTfc DES SCIENCES DE PARIS (0 LABORATOIRE DE PHYSIQUE DES SOLIDES j, i%P*P« *• Recherche Associ«*« au C.N. R. S. : OPTIQUE DES SEMICÖNDUCTEURS 1 Ä NO EOQAR-68-0016 SCIENTIFIC REPORT N° 1 OPTICAL STUDIES Of LATTICE VIBRATION IN II-VI SEMICONDUCTING COMPOUNDS c THIS RESEARCH HAS BEEN SPONSORED IN PART BY THE AF" " /ACE RESEARCH LABORATORIES THROUGH THE EUROPEAN OFFICE OF AEROSPACE RESEARCH, OAR, UNITED STATES AIR FORCE UNDER GRAND NUMBER EOOAR-68-0016
Transcript of 'A OS FÄCULTfc DES SCIENCES DE PARIS · 'A OS FÄCULTfc DES SCIENCES DE PARIS (0 LABORATOIRE DE...
PS!"* ~ü
'A OS FÄCULTfc DES SCIENCES DE PARIS
(0 LABORATOIRE DE PHYSIQUE DES SOLIDES
j, i%P*P« *• Recherche Associ«*« au C.N. R. S. : OPTIQUE DES SEMICÖNDUCTEURS
1 Ä NO EOQAR-68-0016
SCIENTIFIC REPORT N° 1
OPTICAL STUDIES Of LATTICE VIBRATION IN II-VI SEMICONDUCTING COMPOUNDS
c THIS RESEARCH HAS BEEN SPONSORED IN PART BY THE
AF" " /ACE RESEARCH LABORATORIES
THROUGH THE EUROPEAN OFFICE OF AEROSPACE RESEARCH, OAR,
UNITED STATES AIR FORCE UNDER GRAND NUMBER EOOAR-68-0016
GRANT N° EOOAR -68-0016
SCIENTIFIC REPORT N<> 1
OPTICAL STUDIES OF LATTICE VIBRATION IN H-VI SEMICONDUCTING COMPOUNDS
M. BALKANSKI
Laboratoire de Physique des Solides de la Faculte des Sciences de Paris
Equipe de Recherche Associee au C, N. R. S. : Optique des Semiconducteurs
9t Quai Saint-Bernard - Paris 5eme
This research has been sponsored in part by the
AEROSPACE RESEARCH LABORATORIES
Through the European Office of Aerospace Research, 0ARs
United States Air Force under grand number EOOAR-68-0016
OPTICAL STUDIES OP LATTICE VIBRATIONS
IN II-VI SEMICONDUCTING COMPOUNDS
M. Balkanski
Laboratoire de Physique des Solides de la Faculty des Sciences de Paris
1. Introduction.
In recent years considerable efforts have been developped to-
ward the understanding of the main features of lattice dynamics of
a great number of crystals among which the II-VI semiconductor com-
pounds have a good position. Neutron scattering technics be0ing in-
applicable to most of these compounds the experimental determinations
of the normal mode frequencies are essentially done by infrared spec-
trometry and Raman scattering. Being ionic crystals all these com-
pounds possess first order dipole moments due t& the relative dis-
placement of the constituting ion3. The optical vibrational modes
are often allowed for optical transitions in view of specific selec-
tion rules and give the possibility of direct determination of the
frequencies of these modes at the center of the Brillouln zone. Those
of the optical modes which are not allowed for direct optical transi-
tions are often allowed in Raman scattering and hence available for
direct determination by spectrosccpic technics.
Normal modes frequencies at the edge of the Brillouin zone are
determined by second and higher order processes due to their partici-
pation in two or three phonon combinations as well in infrared spec-
troscopy as in Raman scattering.
The realistic boundary conditions taking into consideration the
discontinuity at the surface of the crystal bring up the surface modes
of vibrations for the normal lattice and the localized surface modes
for a crystal with foreign atoms absorbed at the surface.
Presence of imperfections or foreign atoms leads to the appear-
ance of localized modes of vibrations which are also coupled to the
radiation field by means of resonant absorption in the infrared region
and by Raman scattering.
-nwujj? J>m -u ' *ni
Parallel to the experimental investigations theoretical studies
have been developed and the dispersion relations calculated for same
of the II-VI compounds. The theory of systems with high impurity con-
centration and the lattice dynamics of the alloys is now under way.
2. Crystal Structures.
The II-VT semiconducting compounds crystallize in a variety of
polymorphic modifications, the principal structure types being t
a) Cubic zinc-blende (sphalerite) structure \sed on the cubic space
group T, :
ZnS, ZnSe, ZnTe, CdTe, HgS, HgSe, HgTe crystallize preferen-
tially in the zinc-blende structure.
Each unit cell contains 2 atoms and the crystal will therefore
possess 6 phonon branches.
b) Hexagonal wurtzite (zincite) structure based on the hexagonal A
space group CJ :
ZnO, ZnS, CdS, CdSe crystallize preferentially in the
wurtzite structure.
Each unit cell contains 4- atoms and the crystal will therefore
possess 12 phonon branches.
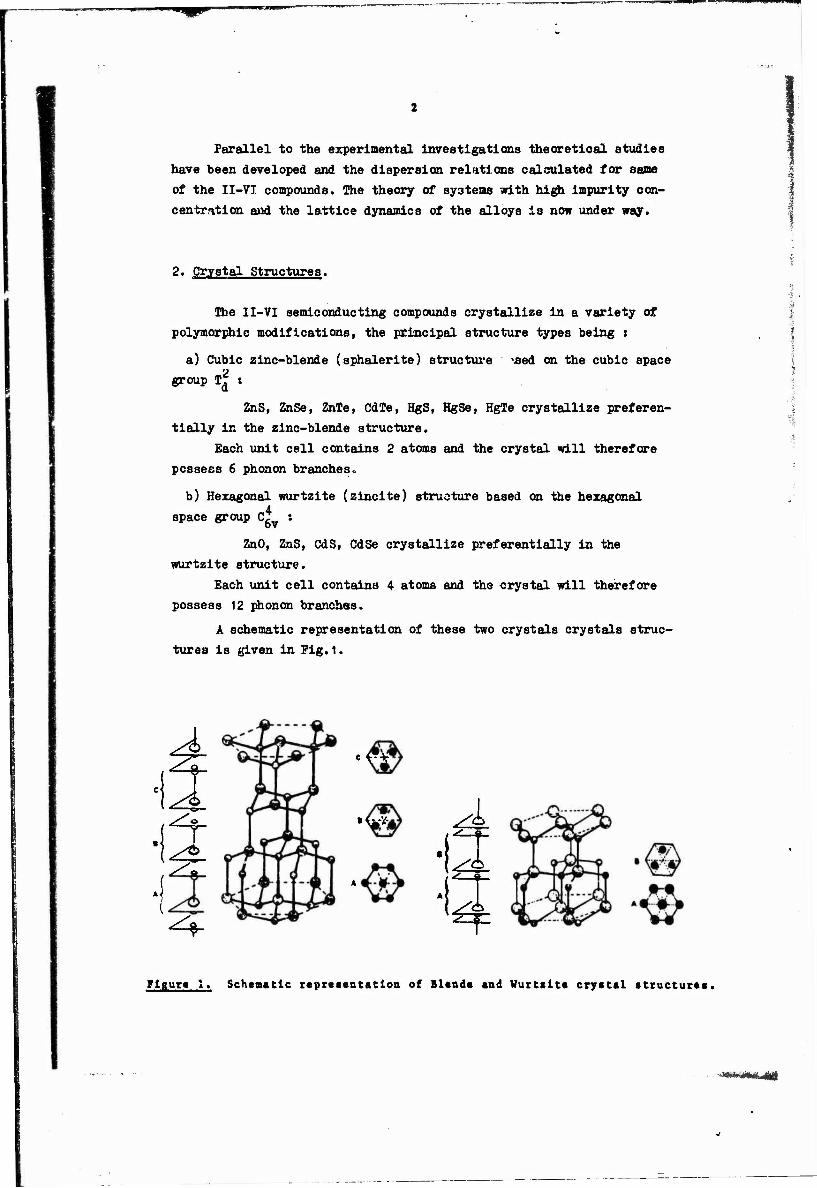
A schematic representation of these two crystals crystals struc-
tures is given in Pig.1.
A T A.
^ *-
«^
• \M*
*;
A a \<£k f
Figur« 1. Schematic representation of Blende and Wurtilte crystal atructuraa,
"«KtaMWUMi
Ng**
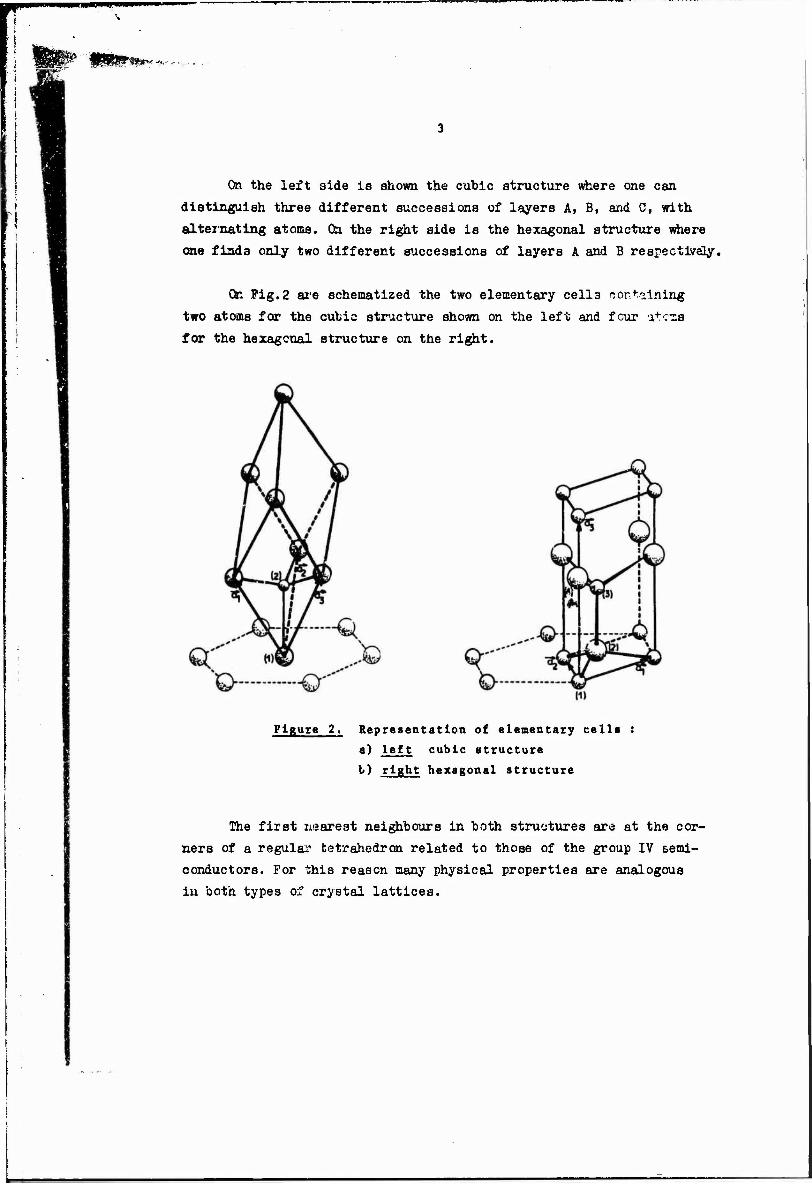
On the left side is shown the cubic structure where one can
distinguish three different successions of layers A, B, and C, with
alternating atoms. On the right side is the hexagonal structure where
one finds only two different successions of layers A and B respectively.
On Pig.2 are schematized the two elementary cell3 containing
two atoms for the cubic structure shown on the left and four at ens
for the hexagonal structure on the right.
Figure 2. Representation of elementary cells :
a) left cubic structure
b) right hexagonal structure
The first nearest neighbours in both structures are at the cor-
ners of a regular tetrahedron related to those of the group IV semi-
conductors. For this reason many physical properties are analogous
in both types of crystal lattices.
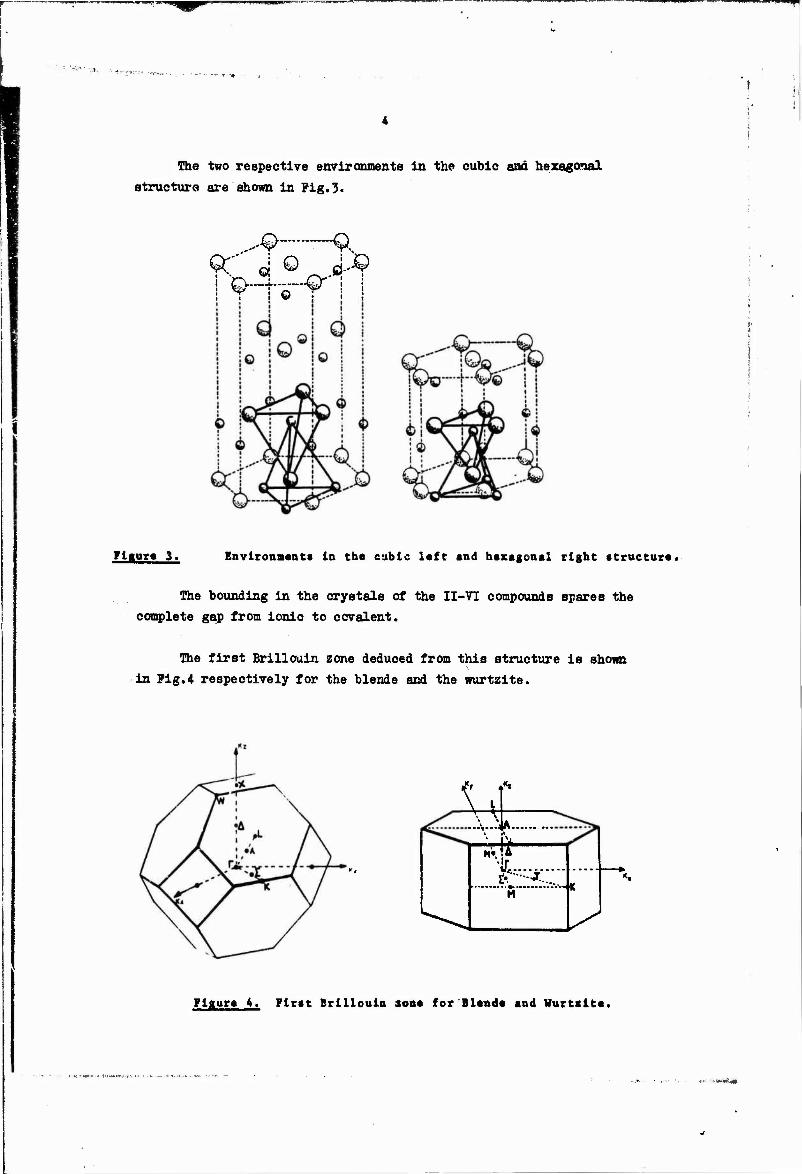
The two respective environments in the cubic and hexagonal structure are shown in Pig.3«
Figure 3. Environments in the cubic left and hexagonal right structure.
The hounding in the crystals of the II-VT compounds spares the
complete gap from ionic to ccvalent.
The first Brillouir. zone deduced from this structure is shown
in Pig.4 respectively for the blende and the wurtzite.
1 .>,.->
H», r ■h,:i...
-K
Figure 4. First Brlllouln son« for Blend« and Wurtilte,
PBW^P«
3. Maperalon Relations.
In the harmonic approximation where the potential energy of a
crystal is expended in power of the displacement of the atoms from
their equilibrium positions and the expansion is broken off the quad-
ratic terms» the equation of motion of the atom k with mass m. in the
unit cell 1 subject to the displacement u with a = x, y, z is given
by
■k»«'!1^, f vik'JVk,!) (3.1)
where * is the force constant matrix depending only on the distance
between cells s(l)-s(l*) due to the periodic symmetry of the lattice.
The normal modes and their frequencies are» solutions of the set
of equations for all unit cells of the crystal. Because of the period-
ic symmetry the modes have wave like phase variation from cell to cell
and specific relative motion in the cell.
The dynamical matrix being of the farm
1 Im. m, ,; (3.2?
the system of 3n linear and homogenious equations has non-vanishing
solutions only if the determinant
VkV)-",26kK.
&ap
= ° (3'3)
vanishes.
This "characteristic'1 equation gives the chracteristic frequen-
cies w(jq) whose graphic representations are the dispersion curves of
the crystal.
A certain number of investigations have been developed aiming
the knowledge of the dispersion curves of the II-VI compound?,. Some 1 2 of them ' based on the shell model develop the formal discussion
without actually doing the calculations. Calculating the dispersion
relations of blende or wurtzite structures in the shell model would
involve a large number of parameters which make such calculations
■aaaalngless.
x Herten has dsveloped a series of studies in which the lattice
vibrations of blende and wurtzite structures are investigated on
microscopic basis considering the dynamical matrix without and with
long range Coulomb interactions. Here again the numerical calcula-
tions have not been carried out throughout the whole Brillxmin zone
and only the optical modes at the center of the Brillouin zone have
been deduced.
Recently Nusimovici and Birman have performed the explicite
calculations of the dispersion relations for CdS-wurtzite structur--.
The single phonon frequencies have been used to calculate the force
constants. The model considers shnrt range interactions correspond-
ing to central forces between first, second and third neighbours and
to central angular forces between first and second neighbours, as
well as long range Coulomb interactions depending on a parameter
having the dimensions of a spring constant.
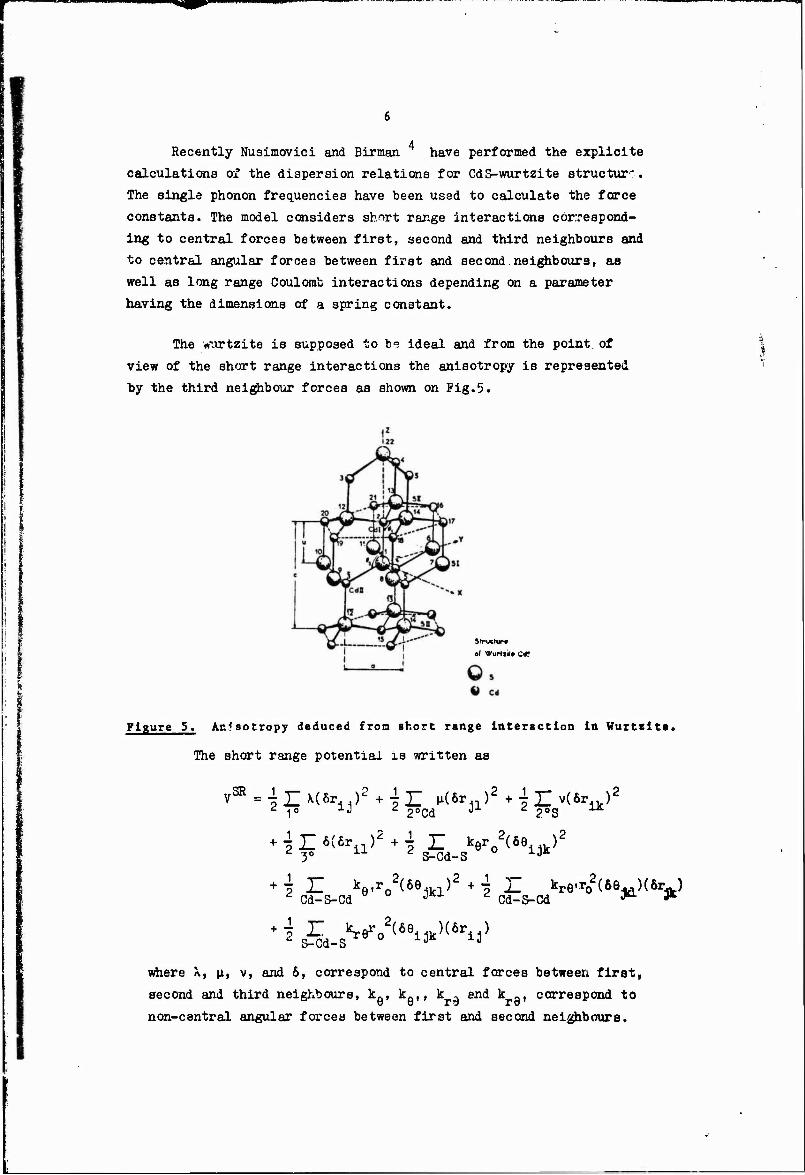
The wortzite is supposed to be ideal and from the point of
view of the short range interactions the anisotropy is represented
by the third neighbour forces as shown on Fig.5.
Structure
of Vurltit» Cd?
Figure 5. Anfsotropy deduced from short range interaction In Wurtcita.
The short range potential is written as
1 T- */*_ \2 .. 1 T- v _ 2,*„ N2 *iZ6(cr )2+i JZ kero2(69 )«
^3° iJ- £ S-Cd-S J
2,tn v2 + i "«- ' Cd-S-Cd
S-Cd-S
where \, \x, v, and 6, correspond to central forces between first,
second and third neighbours, kQ, kQI, k - end k _, correspond to
non-central angular forces between first and second neighbours.
$MW :Tl^S■l,*»■*^:■■
The Coulomb part has been determined by summing the second
derivatives of
„C T~ ek ek'
Ik | i(l,k) - s(l,k»)| l'k*
using the Ewald transformation.
2 3 The Coulomb field is proportional to a parameter p = q /a
having the dimensions of a spring constant, q being the effective
charge of the ion and a is a lattice parameter. The values of the
parameters taken in this first calculations are the following :
X = 1.061X10⁵ dyn/cm ,
u = 0.203X10⁵ dyn/cm ,
v = -0.086x10' dyn/cm ,
6 = -0.065X10⁵ dyn/cm ,
kQ = 0.170X10⁵ dyn/cm ,
ke, = 0.154X10⁵ dyn/cm ,
Kr6 = ^e^re' = -°-°2l6x10' dyn/cm ,
p = 0.032X10⁵ dyn/cm .
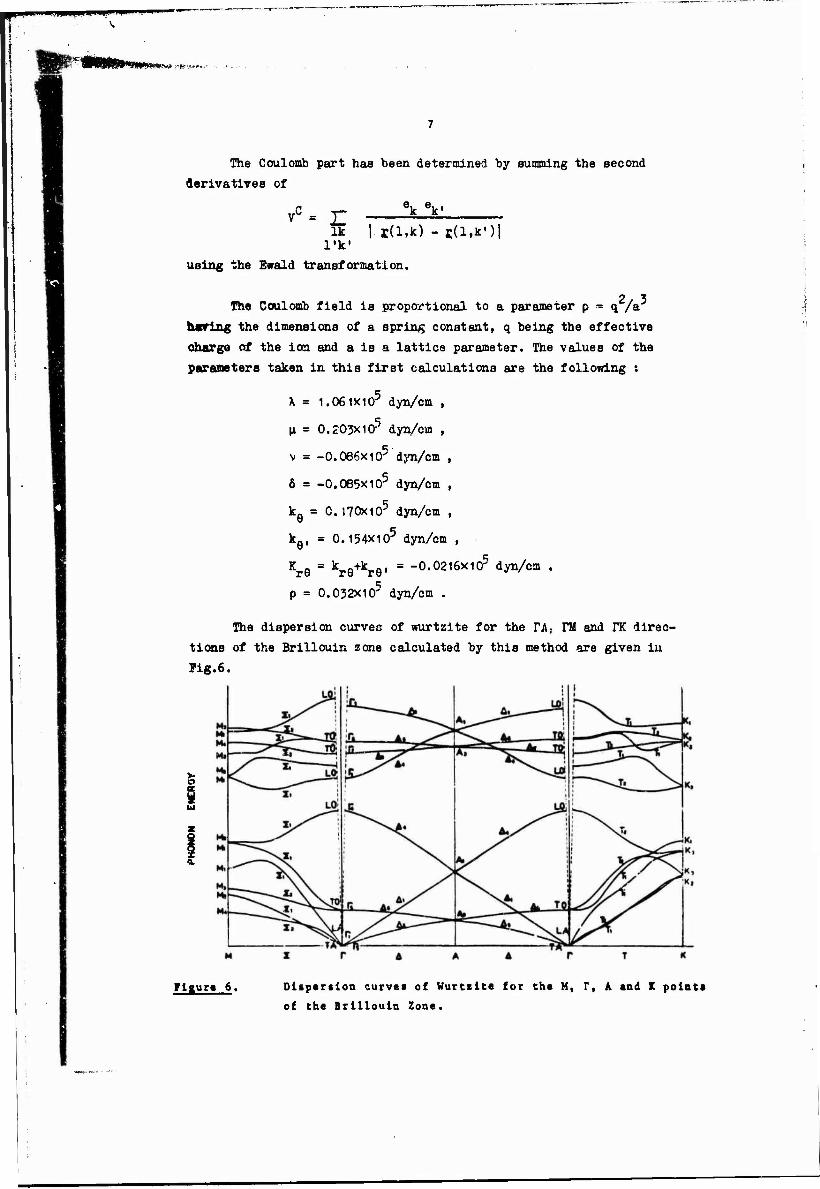
The dispersion curvec of wurtzite for the FA} Hi and rK direc-
tions of the Brillouin zone calculated by this method are given iu
Fig.6.
s
Figur« 6. Dispersion curvei of Wurttite for the M, r, A and K points
of tha Brillouin Zone.
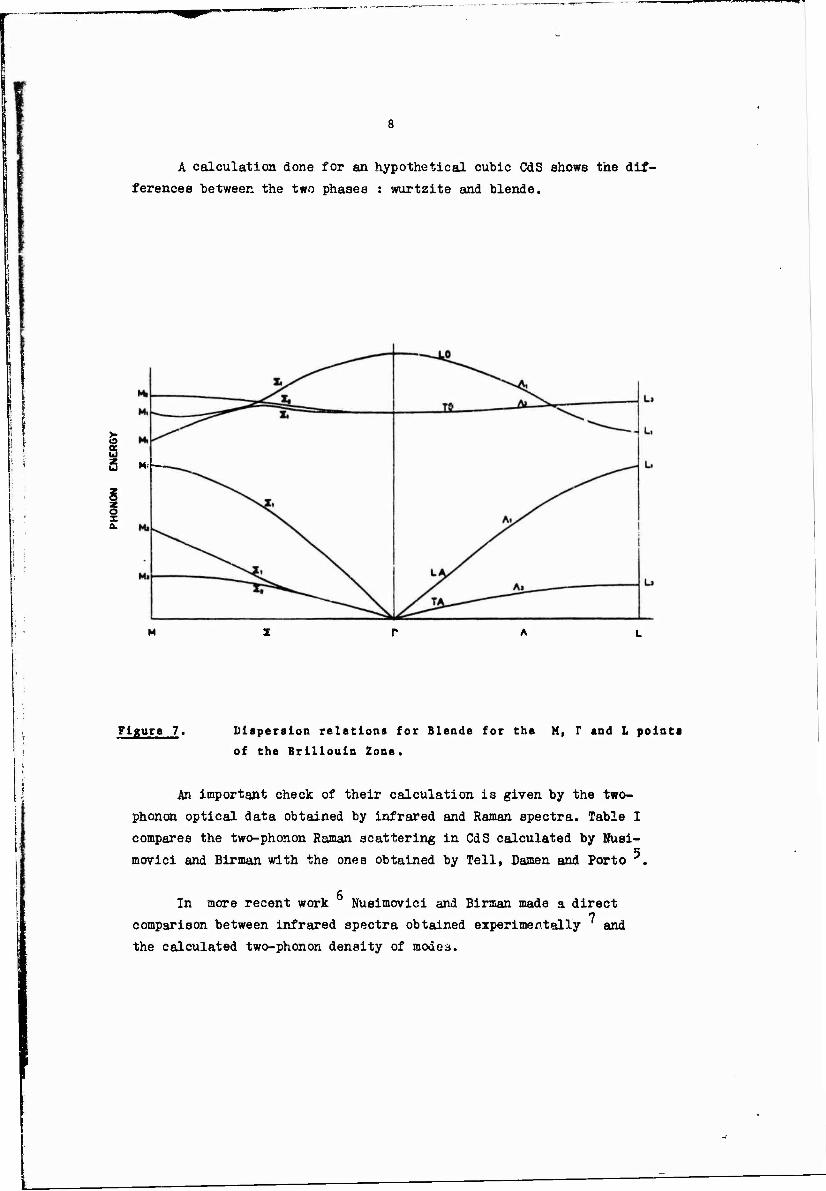
A calculation done for an hypothetical cubic CdS shows the dif-
ferences between the two phases : wurtzite and blende.
> to a u 2 *=■—
o X a.
Figure 7. Dispersion relations for Blende for the M, r end L points
of the Brillouin Zone.
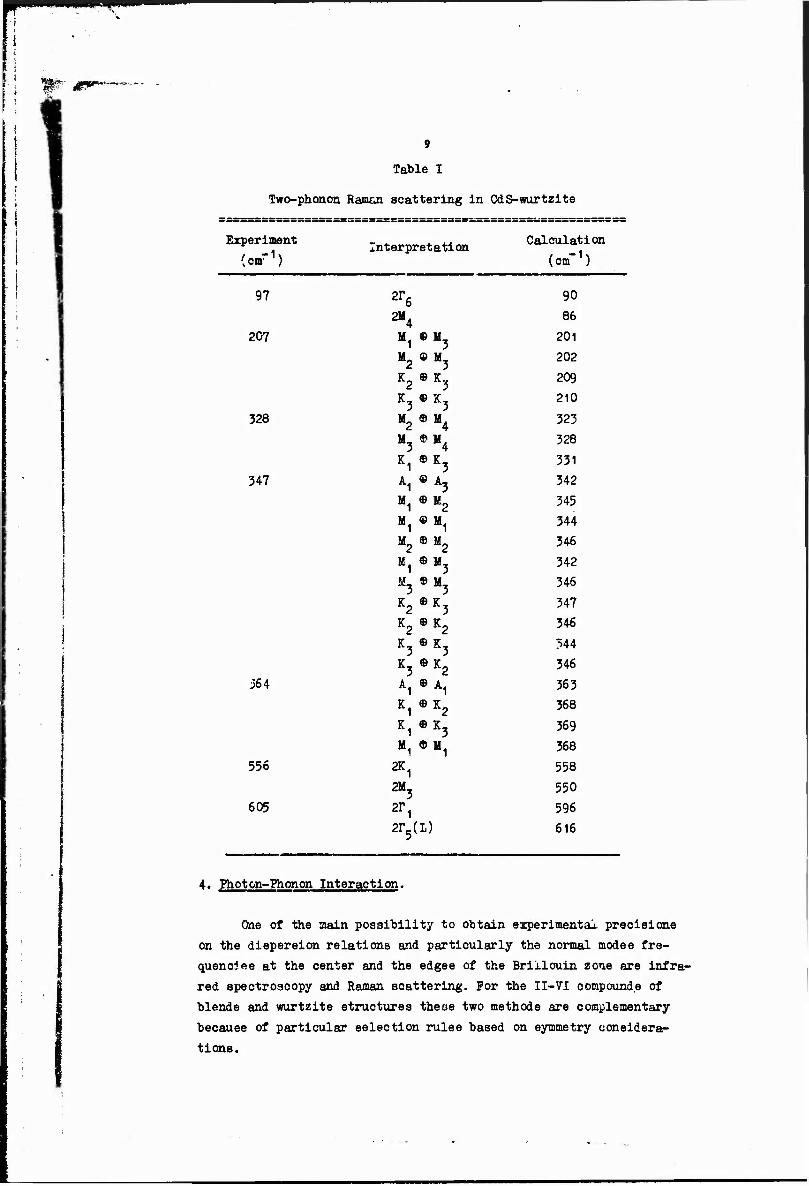
An important check of their calculation is given by the two-
phonon optical data obtained by infrared and Raman spectra. Table I
compares the two-phonon Raman scattering in CdS calculated by Nusi-
movici and Birman with the ones obtained by Tell, Damen and Porto .
In more recent work Nusimovici and Birman made a direct 7 comparison between infrared spectra obtained experimentally
the calculated two-phonon density of modes. and
#!*«--
! i i
- i
9
Table I
Two-phonon Ramcn scattering in CdS-wurtzite
Experiment
(cnf1) Interpretation Calculation
(cm-1)
97 2r6 90
2M4 86
207 M1 © M- 201
M2 © M 202
K2 © K3 209
K3 © K3 210
328 M2 ©M4 323
M3 ®M4 328
K1 ©K3 331
347 A1 ©A, 342
M1 © M2 345
M1 © M1 344
M2 © M2 346
M1 © M, 342
M3 » M 346
K2 © K, 347
K2 © K2 346
K3 © K3 344
K3 © K2 346
j6 4 A1 © A1 363
K1 ©K2 368
K1 © K3 369 M1 « M1 368
556 2K 558
2M3 550
605 2r1 596
2F5 ;D 616
Photon-Fhonon Interaction.
One of the main possibility to obtain experimental precisions
on the dispersion relations and particularly the normal modes fre-
quences at the center and the edges of the Brillouin zone are infra-
red spectroscopy and Raman scattering. For the II-VI compounds of
blende and wurtzite structures these two methods are complementary
because of particular selection rules based on symmetry considera-
tions.
10
The optical absorption is given by the transition probability
proportional to a matrix element which is different from zero only
when energy and momentum conservation rules are obeyed. The matrix
element for optical absorption depends on the dipole moment operator
Y« It is then easy to deduce by group theory arguments the optically
active normal modes in blende and wurtzite structures. These are of-
ten different from that active in Raman scattering while in those
cases the matrix element is related to the polarizability tensor 71.
4.1. Infrared Dispersion.
When the electromagnetic field acts on the crystal there is a
coupling between the elastic waves giving the phonon fields and the
electromagnetic waves giving the photon fields.
The electromagnetic field is given by Maxwell's equations :
CSi Ö = £ £ »
1 » isi S±nt - - i Ö »
div D, =■ 0 , (4.1)
div fl = 0 ,
and C = JBint + 4Tt£ . (4.2)
The phonon field is described by the induced polarization dui
to the displacement in opposite directions of the two sublattices
formed by charged ions and the internal electric field ]}. . equal
to the macroscopic electric fiell in the crystal,
S,H,I» + ir £int ' (4'3)
and also by the equation of motion
a N e e M Ü * (Mu.^ -JL^k)^ gint . (4.4)
The solutions of the coupled system of equations representing
the radiation field and the phonon field „ive thu infrared dioporsion
for a given crystal.
A detailed analysis of infrared dispersion for blende and wurtz-
tructures has bee
summarize the results.
ite structures has been carried out by Le Toullec ; this chapiter
gfT
li
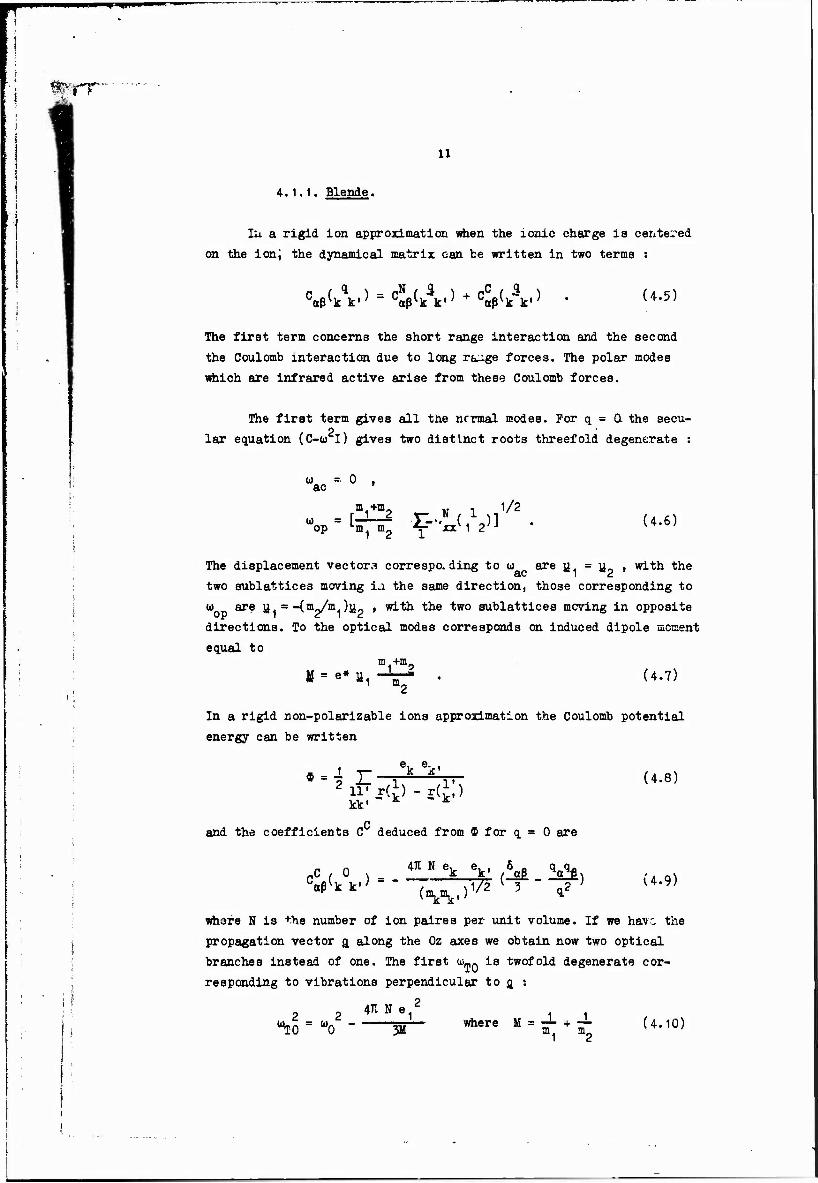
4.1.1. Blende.
In a rigid ion approximation when the ionic charge is centered
on the ion; the dynamical matrix can be written in two terms :
caß(k *•) " Coß{k"k,> + <Wk kf) (4.5)
The first term concerns the short range interaction and the second
the Coulomb interaction due to long ra.;ge forces. The polar modes
which are infrared active arise from these Coulomb forces.
The first term gives all the nrrmal modes. For q = 0- the secu-
lax equation (C-a> I) gives two distinct roots threefold degenerate :
u = 0 . ac '
1/2 (4.6)
The displacement vectors corresponding to u are u, - U„ » with the
two sublattices moving i.i the same direction, those corresponding to
to are u =-(nu/m )u? , with the two sublattices moving in opposite
directions. To the optical modes corresponds on induced dipole moment
equal to
(4.7) »= ** »1 Vm2
m.
In a rigid non-polarizable ions approximation the Coulomb potential
energy can be written
e, e, 4-l T- k k'
kk'
and the coefficients C deduced from * for q = 0 are
(4.8)
CC ( ° ) = °<x^k k,;
471 N eu e,., 6^ q a. k pk' f BB V*6x ^T72 V 3 " „2 ; (4.9)
(Vk,)"6 J *£
whore N is the number of ion paires per unit volume. If we have the
propagation vector a along the Oz axes we obtain now two optical
branches instead of one. The first ü5TQ is twofold degenerate cor-
responding to vibrations perpendicular to g s
2
^TO = w0 "
2 411 N e1
3M where M = — + — mi m2
(4.10)

12
«here u,. is the optical frequency when the Coulomb farces are neglect-
ed and the second IIL non-degenerate corresponding to vibrations
parallel to a :
. 871 N e 2 , 4KB e 2
Compared to equation (4.4) we see that these two equations differ by
the effective charge a, instead of e e„ due to the fact that we. have 1 si considered rigid non-polarizable-ions.
The displacement in the case of polarizable atoms will be
u=_VSin|_ m (4>12)
Substituting in equation (4.3) and subsequently in equation (4.2) we
obtain the equation of optical dispersion of the crystal
471 N e 2
c(u) = c + 5J5- (4.13) M(u,T2-u
2)
and in the limit u = 0 we have the static dielectric constant
471 N e 2
e° = E» + T7^" (4'u)
where from
e(„,. .„, lv!=Lis (4>|J) ■*po " "
two cases can be distinguished.
First case : e = 0 ; y //a /^Sln* * longitudinal wave.
e=0=E„,^>§° U.,6, "TO"»
hence „ 471 N 8
•"L2 = "TO (eo/e»> = UT0 + M e"T ' U'17) 00
This frequency is independent of the wave vector a ssd is equal to
the longitudinal optical frequency of the system without the external field being applied.
Second case : li 1 a 1 S> * : transverse wave.
Prom Maxwell's equations one deduces
cfq2 (eQ-eo>TQ , * , 2 = e»o + 5 r = E(w) . (4.18)
CO 0)_„ - It) TO
s"
>4T
13
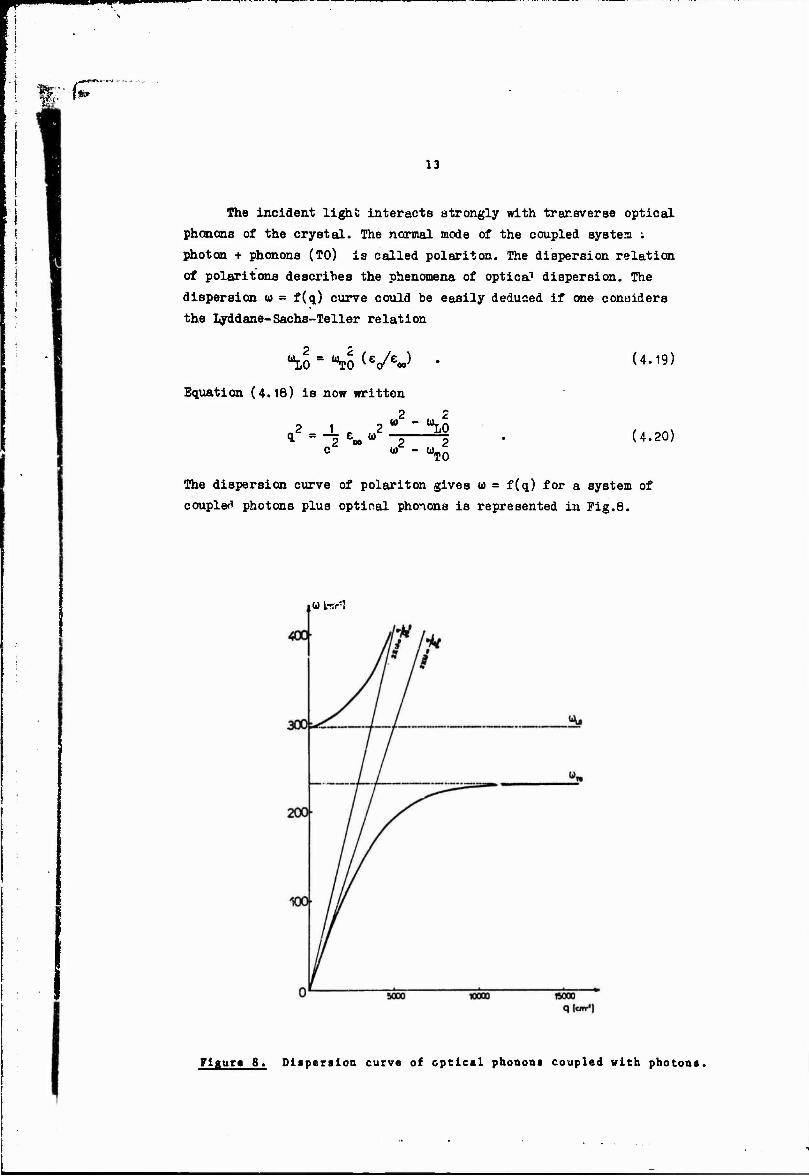
The incident light interacts strongly with transverse optical
phonons of the crystal. The normal mode of the coupled system ;
photon + phonons (TO) is called polariton. The dispersion relation
of polaritons describes the phenomena of optica1 dispersion. The
dispersion u = f(q) curve could be easily deduced if one conaiders
the Lyddane-Sachs-Teller relation
\0= ^S (ec/eJ Equation (4.18) is now written
4 " 1 e«o » "2-"L0 2 2
WT0
(4.19)
(4.20)
The dispersion curve of polariton gives u = f(q) for a system of
coupled photons plus optical phonons is represented in Pig.8.
iU Issr*!
Figur» 6. Dispersion curve of optical phonons coupled with photons,
14
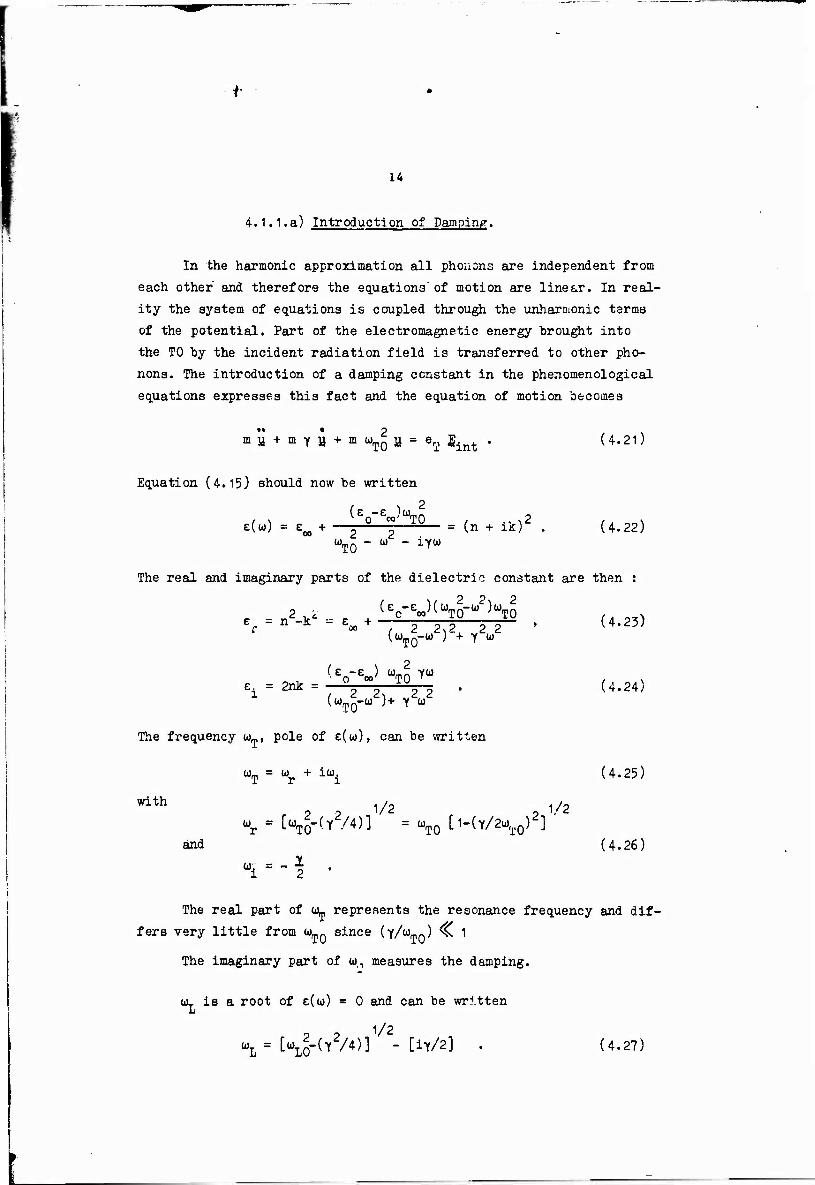
4.1.1.a) Introduction of Damping.
In the harmonic approximation all phonons are independent from
each other and therefore the equations of motion are linear. In real-
ity the system of equations is coupled through the unharDionic terms
of the potential. Part of the electromagnetic energy brought into
the TO by the incident radiation field is transferred to other pho-
nons. The introduction of a damping constant in the phenomenological
equations expresses this fact and the equation of motion becomes
■5 + »T J + »^0»a«i Sint • (4.21)
Equation (4.15) should now be written
E(W) = e^ + 2 2 ■ (n + ik)' . (4.22) UT0 " u " ±yU1
The real and imaginary parts of the dielectric constant are then ;
r ** (eo"^ ^0™ r . oil e, = 2nk = 5—=- 5-3 . (4.24; 1 («jj--cu2) + 7
2"2
The frequency m., pole of e(ui), can be written
Uj = cor + iu^ (4.25)
with ^2 l/2
«r - C^§-(Y2/4)] = "T0 Cl-(Y/2u)10)
2] ' and (4.26)
MY - - * . i 2
The real part of w_ represents the resonance frequency and dif-
fers very little from w Q since (Y/W»A) C 1
The imaginary part of to,, measures the damping,
u- is a root of e(u) = 0 and can be written
2 / 2 1/2 (0L= Ko-(Y74)] - [iY/2] . (4.27)
iL» mmm*
fi :• fST
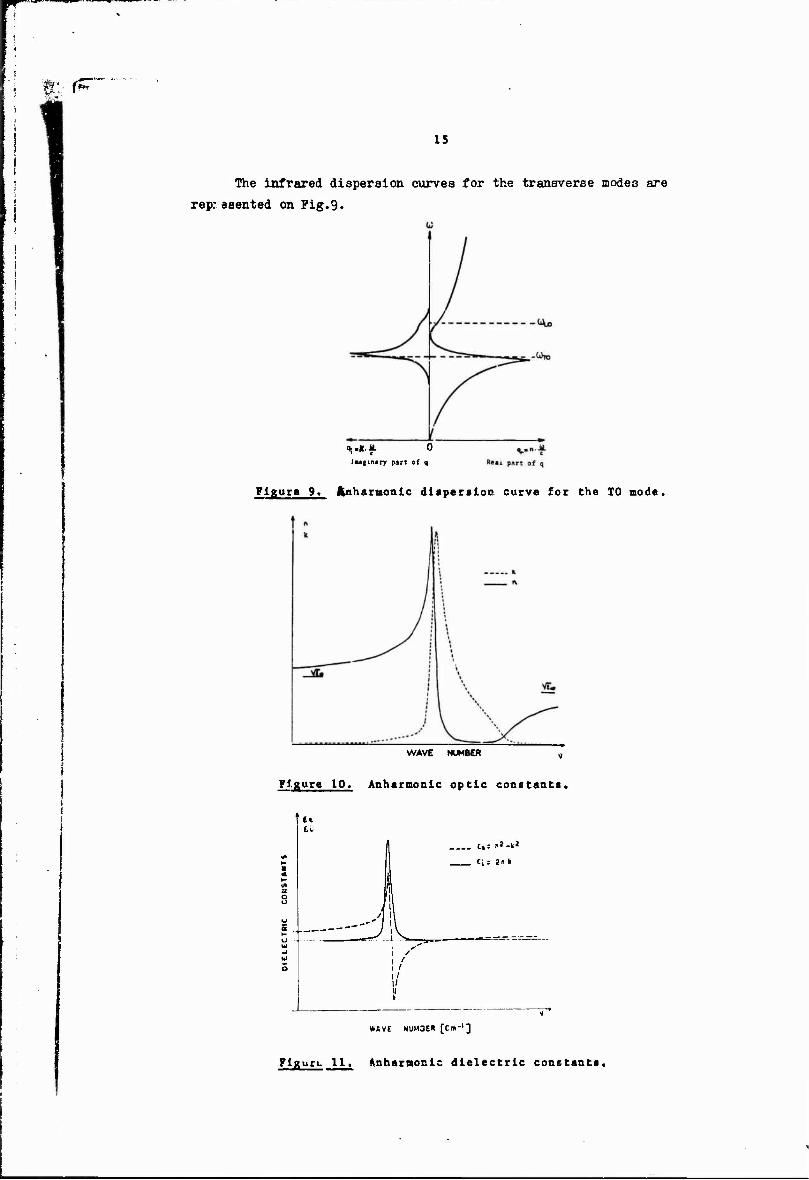
15
The infrared dispersion curves for the transverse modes are
represented on Fig.9.
Imaginary part of q
Figure 9. fcnharmonic dispersion, curve for the TO mode,
WAVE NUMBER
Figure 10. Anharmonic optic constant!.
,
C.ix'-k2
«/I *- Z 4
t;; 2n k
a g !
>! KJ ^dL, 1 x" Ul i / o ! /
!/ »
- • , «
*AvE NUM3ER [Cm-1]
Figure 11. Anharmonlc dielectric constants.
WSPIWV^WWWWP!
16
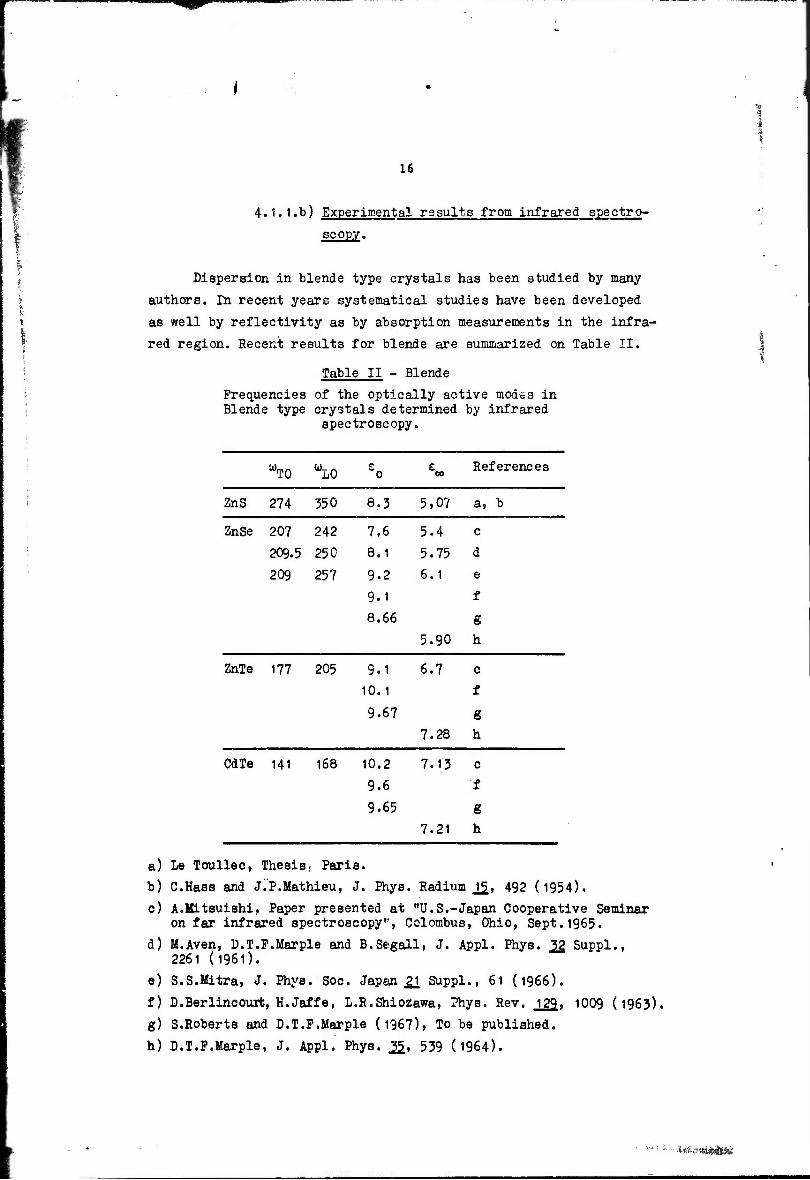
4.1.1.1a) Experimental results from infrared spectro-
scopy.
Dispersion in blende type crystals has been studied by many
authors. In recent years systematical studies have been developed
as well by reflectivity as by absorption measurements in the infra-
red region. Recent results for blende are summarized on Table II.
Table II - Blende
Frequencies of the optically active modss in Blende type crystals determined by infrared
spectroscopy.
UT0 UL0 £o e 00
References
ZnS 274 350 8.3 5,07 a, b
ZnSe 207 242 7.6 5.4 c
209.5 250 8.1 5.75 d
209 257 9.2
9.1
8.66
6.1
5.90
e
f
g h
ZnTe 177 205 9.1 10.1
9.67
6.7
7.28
c
f
g h
CdTe 141 168 10.2
9.6
9.65
7.13
7.21
c
f
g h
a) Le Toullec, Thesis- Paris.
b) C.Hass and Jl'P.Mathieu, J. Phys. Radium J£, 492 (1954).
c) A.Mttsuiehi, Paper presented at "U.S.-Japan Cooperative Seminar on far infrared spectroscopy", Colombus, Ohio, Sept.1965.
d) M.Aven, D.T.F.Marple and B.Segall, J. Appl. Phys. 2£ Suppl., 2261 (1961).
e) S.S.Mitra, J. Phys. Soc. Japan .21 Suppl., 61 (1966).
f) D.Berlincourt, H.Jaffe, L.R.Shiozawa, Phys. Rev. J_29_, 1009 (1963), g) S.Roberts and D.T.P.Marple (1967), To be published, h) D.T.P.Marple, J. Appl. Phys. jj£, 539 (1964).
PPP^VPPÜP' ■ «mpM^niH >WB1WBPv' WE WWW
17
4.1.2. Würteite.
4.1.2.a) Short ran&9 forces.
The unit cell contains 4 atoms 2 anions and 2 cations, 12 branches
are therefore expected in the dispersion curves.
The following relation between C coefficients results from the
crystal symmetry »
JS / 0 x _ J / 0 . , N , 0 , (4.28)
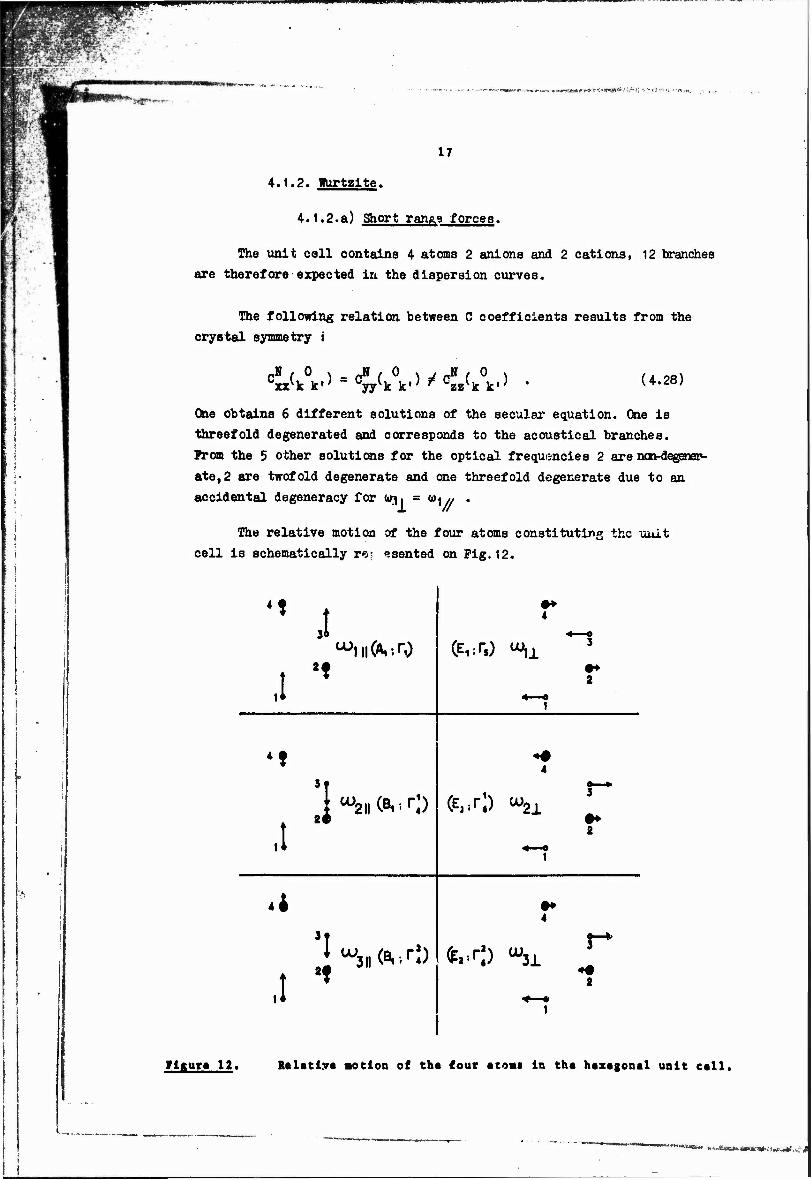
One obtains 6 different solutions of the secular equation. One is threefold degenerated and corresponds to the acoustical branches. From the 5 other solutions for the optical frequencies 2 are non-degener- ate^ are twofold degenerate and one threefold degenerate due to an accidental degeneracy for ut$, = w^ ,, .
The relative motion of the four atoms constituting the unit cell is schematically res esented on Pig.12.
*t J 4
">i nCv.ro (E,'.!",) w]1 3
,1 2t
1
2
't
J^llCBi-O
4 o »
,1 fe.O 21
1
3
2
.*
^llfo-.r«)
4
,1 CO "31
1
3
2
Figure 12. Relativ« motion of the four atoms in the haxagonal unit cell.
»««ma >**«isaim.wmm^M>it&,^4
18
In the optical modes of vibration for the frequency w. the sub-
lattices with the same kind of atoms (1) and (3) are moving in the
same direction and the sublattices with atoms (2) and (4) in opposite
directions-. The displacement vectors are related by
u (1) = _-2 u (2) = u (3) = --A u (4) . (4.29)
This kind of displacement results into a total dipole moment
per unit cell :
M = 2 e* jj ÜÜ2 1 m„ (4.30)
For the nodes of frequencies Up and u_ the displacement
vectors are of the same type but the induced dipole moment per unit
cell is always equal to zero and therefore these modes are not optic-
ally active.
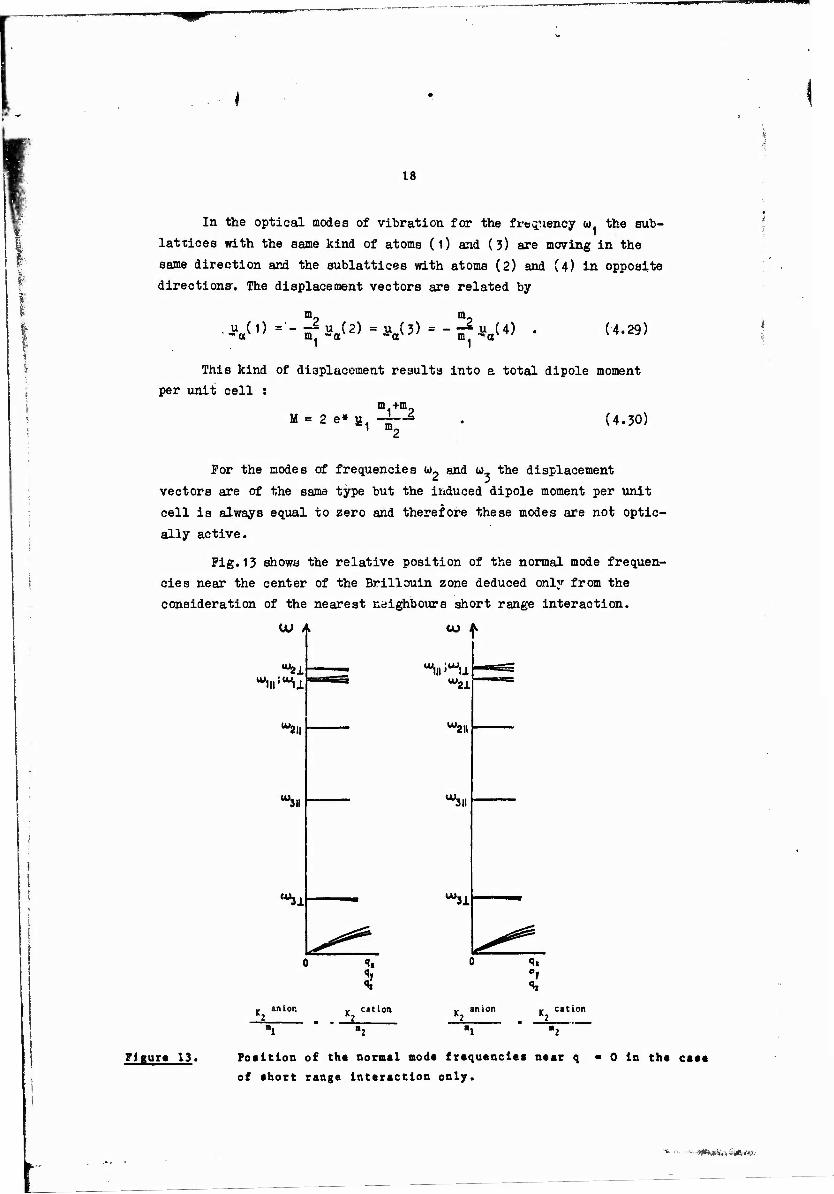
Pig.13 shows the relative position of the normal mode frequen-
cies near the center of the Brillouin zone deduced only from the
consideration of the nearest neighbours short range interaction.
CU A to f
tu, '211
"^Jll
"*u
•»I
5
w2X
w, '211
IU '311
*3J.
Si
Figure 13. Position of the norasl mod« frequencies near q
of short range Interaction only.
0 In the case
■■&tU&vk.Hk#H
■^^*"^VMv«a«m
'••«•»r- 'T&W'.'tv*,!wy
*
19
4.1.2.b) Long range Coulomb forces.
n The coefficient C deduced from the Coulomb potential energy
can be written in the case of wurtzite :
coß^k k,; " \ e
k. . vv. W 1- 4«
,) i75(La 6<xß ~2> ' (4'51)
kk1
L are Lorentz factors in anisotropic crystals and their numerical values are known.
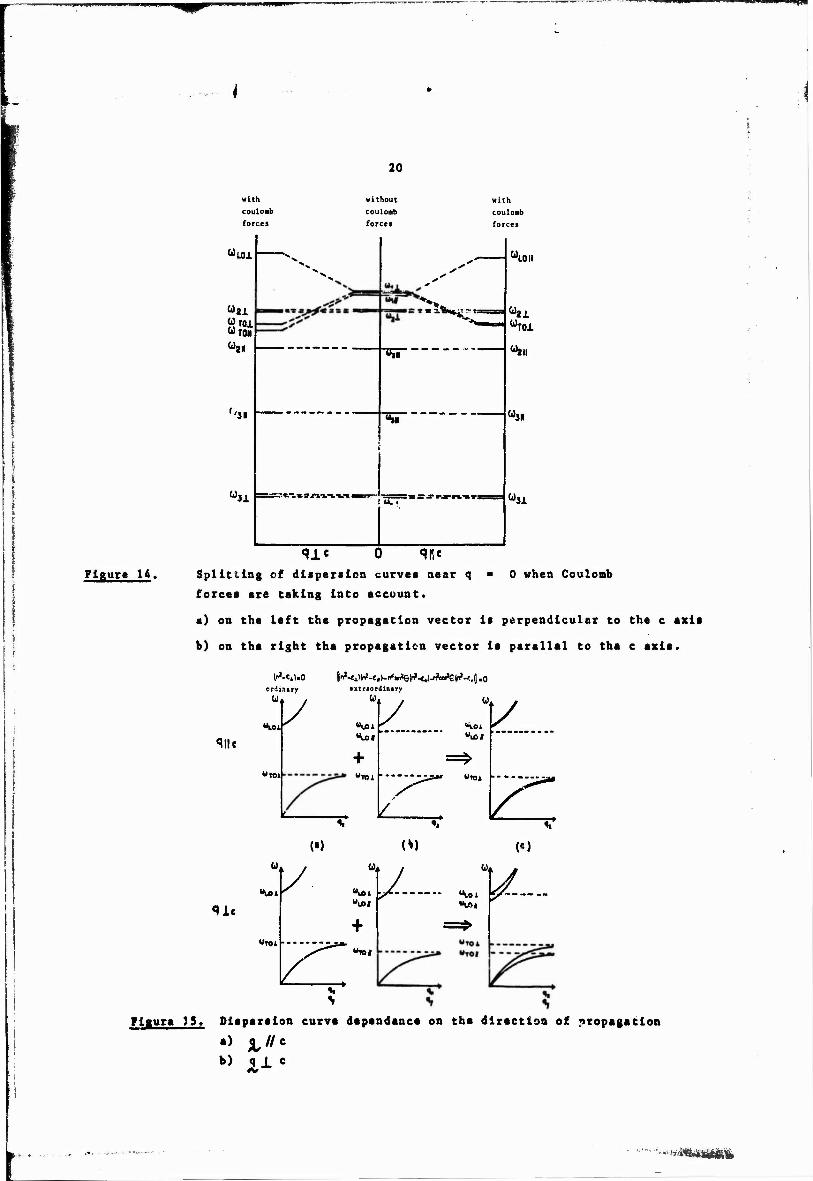
Introducing Coulomb interaction into the determination of the normal mode frequencies one have also to distinguish between the case whera the propagation vector g is parallel or perpendicular to the optical axis Q. The modes corresponding to atom vibrations per- pendicular to thd propagation vector labelled TO and these to parallel vibration 10, // and J[ refers to the vibration of the atoms with re- gard to the e, axis. The optically active triply degenerate mode w without Coulomb interaction, splits now into the following frequencies
For alfi : .2 „.2 „ „_2
«LÖ = «H + 8.47 ~T > "*o£ «1J_ - 4.09 -^ ; <"m0/-«l^ - 4.39 -g- •
For a. //fi »
V" MV/' Na Ne
<*L0//= w1//+ 8'17 "rf- I "SOI = «i| - 4.09 H jOj^ = w^ M
Here N is the number of unit cell per cm , e is the electronic charge, and M the reduced mass : M = m.nu/Cm.wO . These results are schematically represented in Fig.14.
4.l.2.c) Infrared dispersion curves.
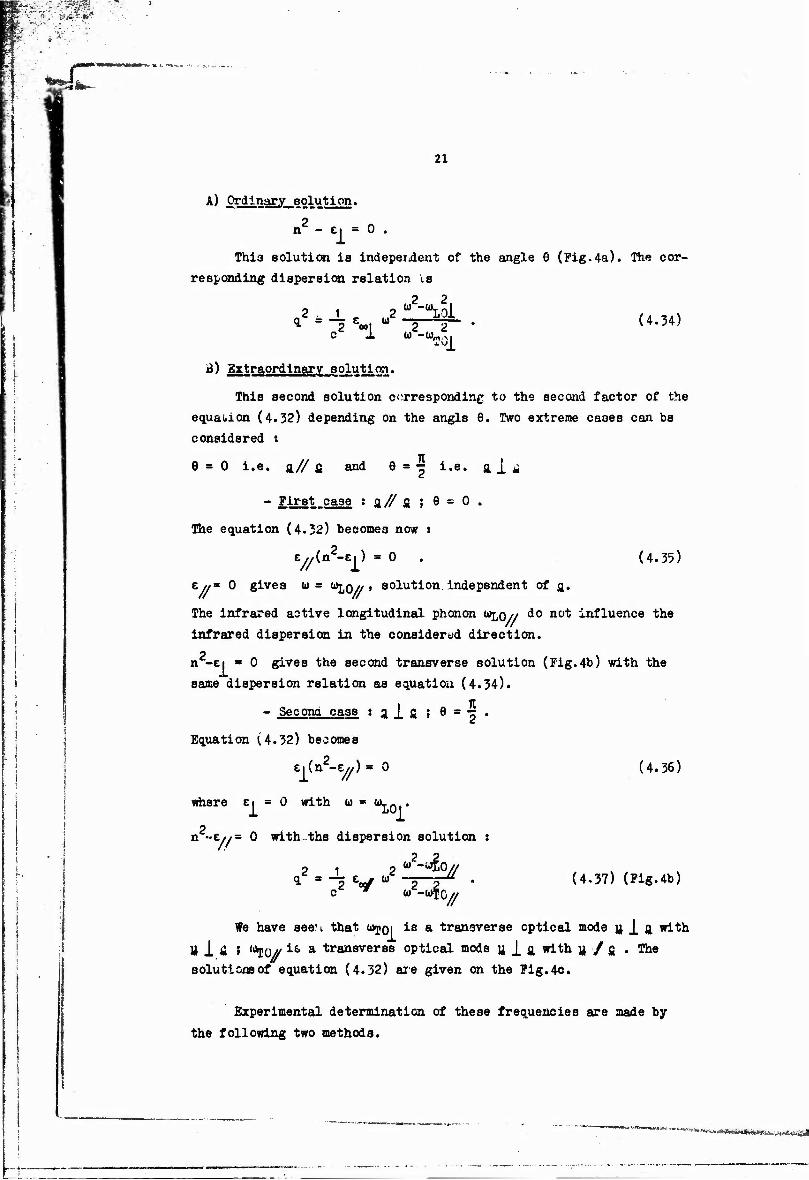
Wurtzite being on uniaxial crystal, because of the anisotropy, the infrared dispersion curves depend on the direction of propagation. The solutions of the coupled equations giving the radiation field and the phonon field are now of the form t
(n2-e.) [(n2-€|)(n2-e^)-n2sin2e(n2-e^)-n2co820(n2-ei)] » 0 . (4.32)
8 is the angle between the propagation vector and the optical axis.
Two types of solutions represented in Fig.15 appears.
-~-*™^v>-v; JHtfWMMw^tBöagS*!
-rjjp
Figure 14.
20
with coulomb forces
without coulomb force»
wit* coulomb forcei
»Ul
U2X
"ai
yji
"Ji 3t/l*m4T.V« •
«an
Su
r u, •
U, LOU
(02i
"T01
«III
u II
Cd n
qie 0 9RC Splitting of dispersion curves near q « 0 when Coulomb
forces are taking Into account.
a) on the left the propagation vector Is perpendicular to the c axis
b) on the right the propagation vector Is parallel to the c axis.
1>*-M.0 ordinary
(it,
«ia
«lilt
«tot
in,-ti)(rf-c»)-H'ir«e(r?^.rfWCln>-i;j] „0
• xtrxordimry U
«u»i «LO»
«WU
V
\L (•) (*) <<)
/ ^ ./. «lie
«TO!
+ "»I
«\oi ,v.
Figure 15. Dispersion curve dependence on Che direction of propagation
b) q I c ♦v
' ■■<£
HäB---
21
A) Ordinary solution.
n2 - ei = 0 .
This solution is indeper^dent of the angle 6 (Pig-4a). The cor- responding dispersion relation is
b) „2 „ _L P „2 I ""LOI w2-UT01
(4.34)
B) Extraordinary solution.
This second solution corresponding to the second factor of the equation (4.32) depending on the angle 9. Two extreme cases can be considered :
0 = 0 i.e. %// fi and 9 = -z i.e. a j. £
- First case : g // fi ; 9 ~ 0 .
The equation (4.32) becomes now :
e ,An -e.) = 0 (4.35)
e«= 0 gives u = <*LO// t solution independent of a«
The infrared active longitudinal phonon «LO// d° not influence the infrared dispersion in the considered direction.
n -Ei = 0 gives the second transverse solution (Pig.4b) with the same dispersion relation as equation (4.34).
- Second case : a 1 fi » 9 = ■* .
Equation (4.32) becomes
ci(tt-£^) = 0 (4.36)
where e j = 0 with u * üL. Q .
2 n -•£//= 0 with.the dispersion solution "V/
2 _ 1 . „2 ^^M a = "2 V " ~2~2 5 ^ fa) -Uj, 0//
(4.37) (Pig.4b)
We have seen that c*poi is a transverse optical mode u, J_ a with
U 1 fi » ,*roi*' *s a transverse optical mode U 1 a with u / fi . The solutions of equation (4.32) are given on the Pig.4c.
Experimental determination of these frequencies are made by the following two methods.
" """""* *"»•**» *K»te**«fcSÄi,iiMe<siö8
22
') Sinple crystals of large dimensions.
The reflectivity is measured under weak incidence angle (9~15°).
f The curves representing the refractive index n(u) and the extension
i coefficient K(u>) are calculated by means of Kramers-Krönig inversion
I formula. \
i.
The u_0 frequency is the frequency for which the quantity
(2nK<i>) has its maximum.
The öL- frequency is the frequency for which one has the rela-
tion n2-K2 = 0 with (&i/bu>) > 0 .
In order to be able to determine the four frequencies ID^Q// ,
t*po| , uhjQ n, WJ^QI , it is sufficient to prepare a sample with g
axis perpendicular to the plane of incidence and to use a polarized
light beam either parallel to the e, axis in which case one obtains
ULO^and WTO>/» or perpendicular to the c, axis in which case one ob-
tains WJ^QI and UJQI .
2) Thin films.
When transmission or reflectivity measurements are performed
on thin films under oblic incidence and with a light beam polarized
in the plane of incidence, the transverse optical as well as the
longitudinal optical modes interact with the infrared radiation and
hence their frequencies can ba aeasured directly. In the case of an
mria-Hai crystal if the thin film is such as to have the jj axis per-
pendicular tothe substrate one measures then w^o/' a*^ the w^oi fre-
quencies. This is the case of CdS thin films evaporated on silicon
single crystal substrates.
If the £ axis is parallel to the surface of the layer it is
then possible to observe ULQI.
!£
■öa*ft
•■+**-■,}, -:.?i
23
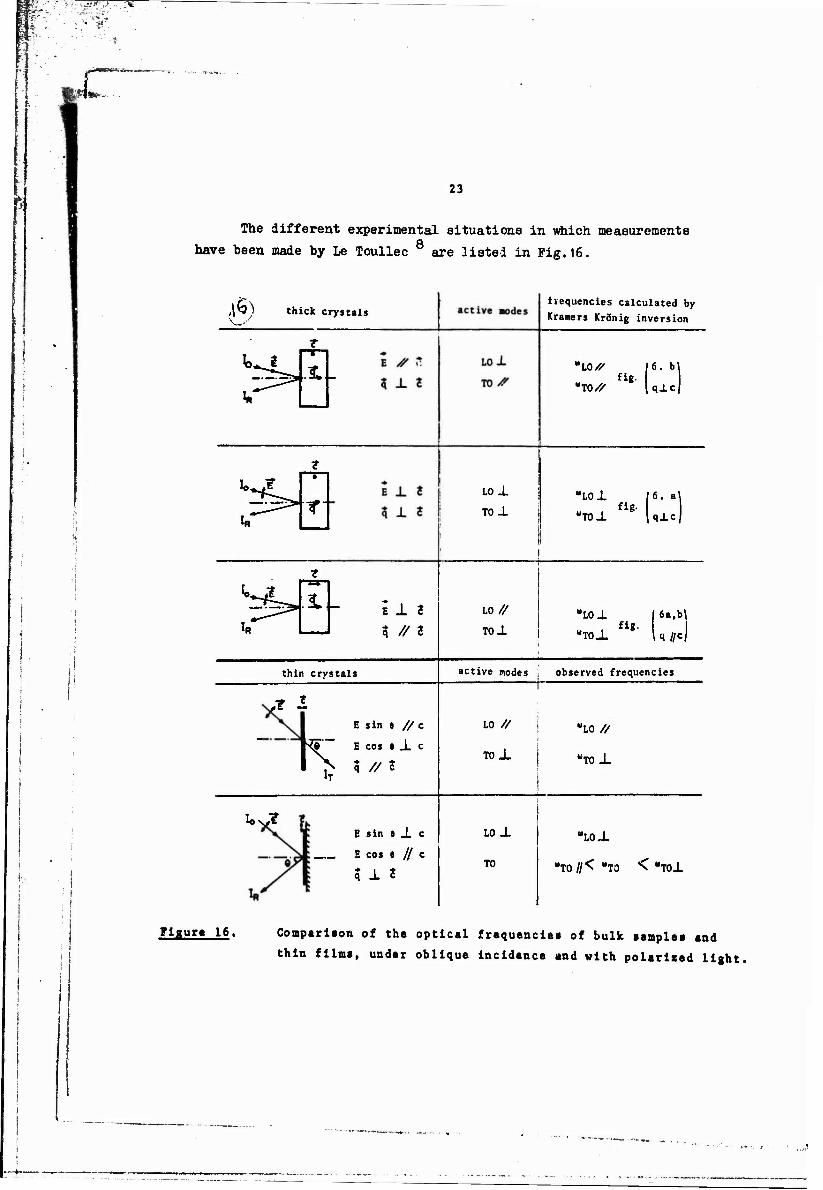
The different experimental situations in which measurements
have been made by Le Toullec are listed in Pig.16.
fi) thick crystals frequencies calculated by
Kramers Krönig inversion
X- 'MS// 16. b\ fig.
I«
LO±
TO± 'LOl
"TOJ. fig-
6. a
qj.c
i- 11 z * // 2
LO/?
TOJL
"LOJ. |6a,b\ fig-
"TO± q //c
thin crvstals active nodes 1 observed frequencies T
,? I
^5 E
X 3
E sin 6 // c
E cos tic
q // ?
LO //
T0±
UL0//
"TO-L
ION,? E sin t 1 c
E cos e // c
5 1 t
LO JL.
TO
"LOJ.
»TO //< "TO < -T0±
Figur» 16. Comparison of the optical frequencies of bulk samples and
thin films, under oblique incidence and with polarised light,
24
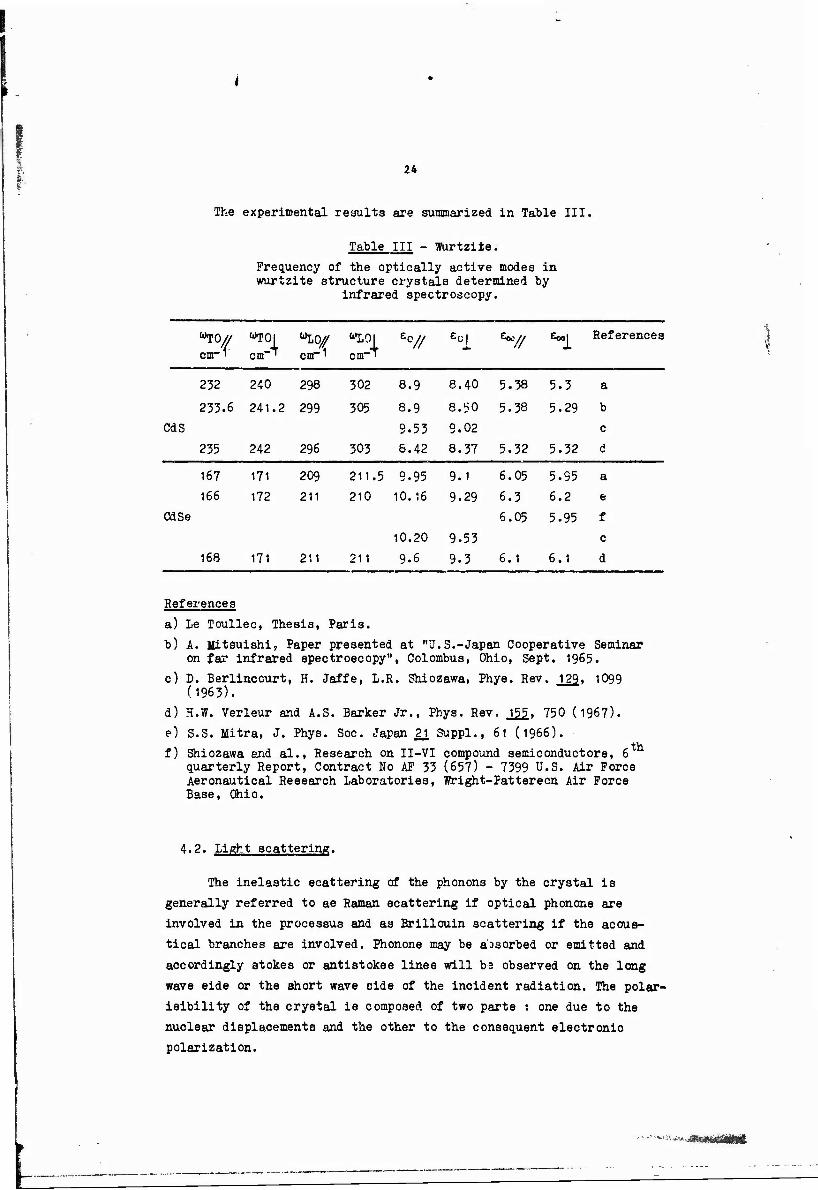
The experimental results are summarized in Table III,
Table III - Wurtzite.
Frequency of the optically active modes in wurtzite structure crystals determined by
infrared spectroscopy.
"TO/ cm-i
0).T0i
cm-' <"L0/ cnr1
<"L0| cnr'
£°// ***// Eool References
232 240 298 302 8.9 8.40 5.38 5.3 a
233.6 241.2 299 305 8.9 8.50 5.38 5.29 b
CdS 9.53 9.02 c
235 242 296 303 6.42 8.37 5.32 5.32 d
167 171 209 211.5 9.95 9.1 6.05 5.95 a
166 172 211 210 10.16 9.29 6.3 6.2 e
CdSe
10.20 9.53
6.05 5.95 f
c
168 171 211 211 9.6 9.3 6.1 6.1 d
References
a) Le Toullec, Thesis, Paris.
b) A. Mitsuishi, Paper presented at "U.S.-Japan Cooperative Seminar on far infrared spectroscopy", Colombus, Ohio, Sept. 1965.
c) D. Berlinccurt, H. Jaffe, L.R. Shiozawa, Phys. Rev. jj>o,, 1099 (1963).
d) H.W. Verleur and A.S. Barker Jr., Phys. Rev, J^, 750 (1967).
e) S.S. Mitra, J. Phys. Soc. Japan 2± Suppl., 61 (1966).
f) Shiozawa and al., Research on II-VI compound semiconductors, 6 quarterly Report, Contract No AP 33 (657) - 7399 U.S. Air Force Aeronautical Research Laboratories, Wright-Patterson Air Force Base, Ohio.
4.2. Light scattering.
The inelastic scattering of the phonons by the crystal is
generally referred to as Raman scattering if optical phonons are
involved in the processus and as Brillouin scattering if the acous-
tical branches are involved. Phonons may be absorbed or emitted and
accordingly stokes or antistokes lines will b3 observed on the long
wave side or the short wave side of the incident radiation. The polar-
isibility of the crystal is composed of two parts : one due to the
nuclear displacements and the other to the consequent electronic
polarization.
■^^■Mmmaim
.'•:';*f|ft' ■ ':'"ü
25
In first order the diffused intensity for the stokes Raman line
in the harmonic approximation is
Istokes = K vdiff
nD+1 i • HH [ea aab "b e^iffl'
n is the number of Fhonons occupying the initial p state, v. is the P i th oscillator's frequency, e is the a component of the unit polariza-
diff th tion vector of the incident radiation, e. is the b component of the polarization unit vector of the diffused light, ex'b(q ) = bot v/^qu is the variation of the a . component of the polarization tensor for the vibration with normal coordinates q .
e Symmetry considerations and group theory arguments define what
are for each normal mode the polarizibility tensor components which
have changed during the vibration. It can be easily shown that in the
blende type crystals the two modes at the center of the Brillouin zone
ar* Raman actives.
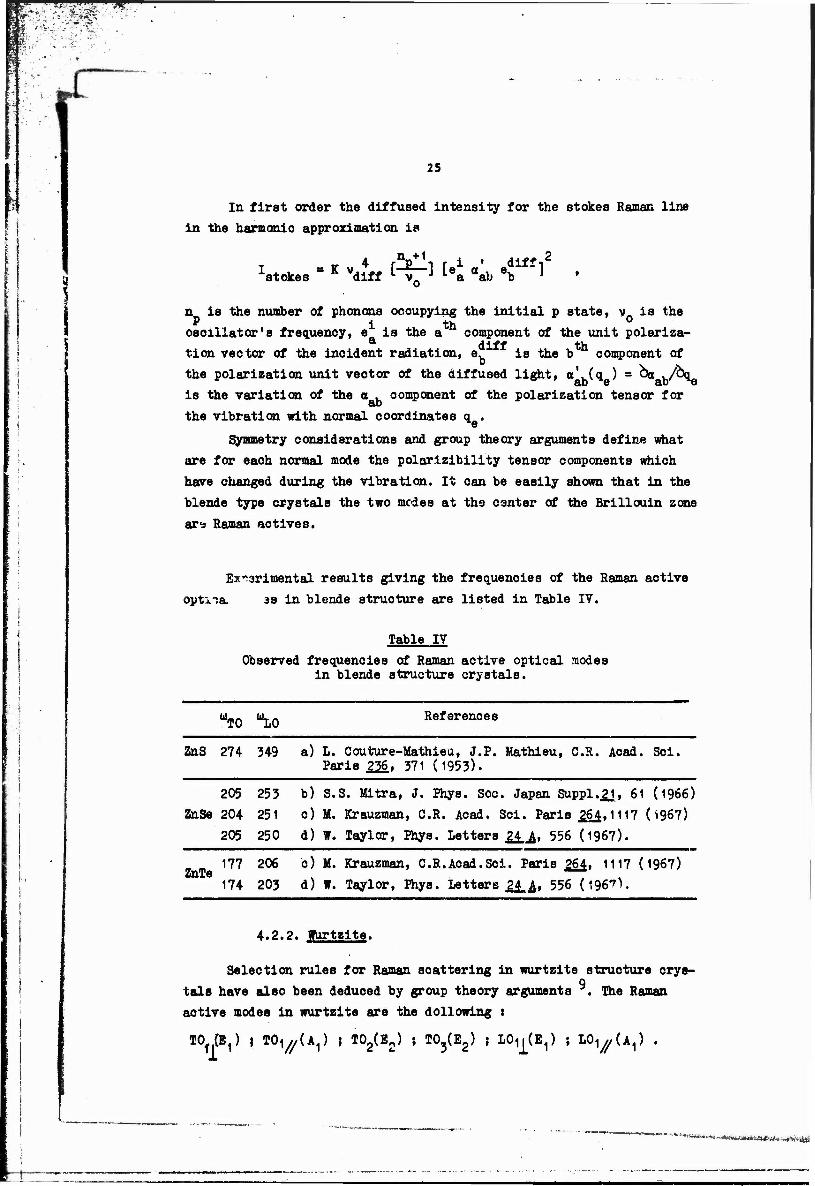
Experimental results giving the frequencies of the Raman active
optima. 38 in blende structure are listed in Table IV.
Table IV
Observed frequencies of Raman active optical modes in blende structure crystals.
UT0 "LO References
ZnS 274 349 a) I. Couture-Mathlea, J.P. Mathieu, C.R. Acad. Sei. Paris .2J6, 371 (1953).
205 253 b) S.S. Mitra, J. Phys. Soc. Japan Supply, 61 (1966) ZnSe 204 251 c) M. Krauzman, C.R. Acad. Sei. Paris J>6J,1117 (1967)
205 250 d) W. Taylor, Phys. Letters £££, 556 (1967).
ZnTe 177 206 c) M. Krauzman, C.R.Acad.Sei. Paris 264. 1117 (1967)
174 203 d) f. Taylor, Phys. Letters ££&, 556 (1967>.
4.2.2. Wurtzite.
Selection rules for Raman scattering in wurtzite structure crys- 9 tals have also been deduced by group theory arguments
active modes in wurtzite are the dollowing i
TO
The Raman
3 03,) { TO^U,) J T02(E2) j TO^Eg) | LO^E^ ; LO^U,) .
26
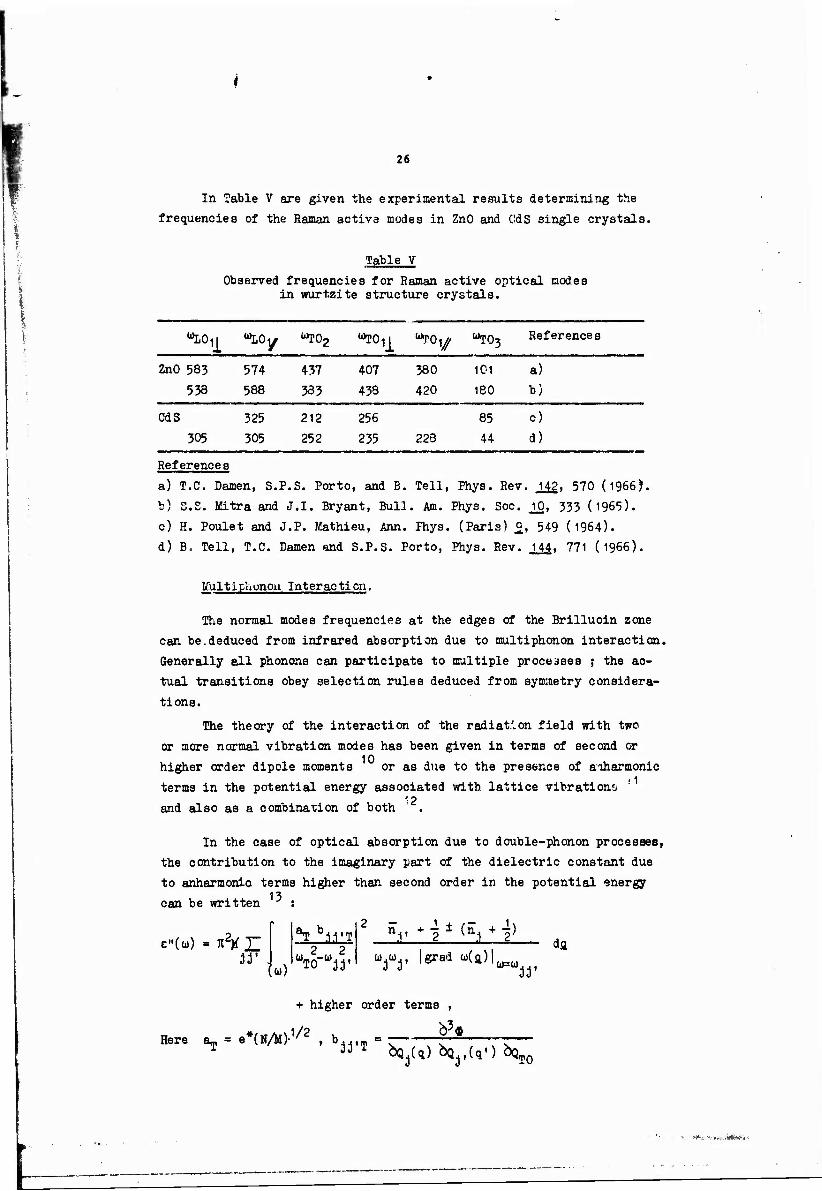
In Table V are given the experimental results determining the
frequencies of the Raman active modes in ZnO and CdS single crystals.
Table V
Observed frequencies for Raman active optical modes in wurtzite structure crystals.
«LO^ "LOy ^02 "TOii "lOy "TOj References
ZnO 583 574 437 407 380 101 a)
538 588 383 433 420 180 b)
CdS 325 212 256 85 c)
305 305 252 235 228 44 d)
References
a) T.C. Damen, S.P.S. Porto, and B. Tell, Phys. Rev. J^2, 570 (1966).
b) S.S. Mitra and J.I. Bryant, Bull. Am. Phys. Soc. _10, 333 (1965).
c) H. Poulet and J.P. Mathieu, Ann. Phys. (Paris) °, 549 0964).
d) B. Tell, T.C. Damen and S.P.S. Porto, Phys. Rev. 14fl. 771 (1966).
Lftiltiphonou Interaction.
The normal modes frequencies at the edges of the Brilluoin zone
can be.deduced from infrared absorption due to multiphonon interaction.
Generally all phonone can participate to multiple processes ; the ac-
tual transitions obey selection rules deduced from symmetry considera-
tions.
The theory of the interaction of the radiation field with two
or more normal vibration modes has been given in terms of second or
higher order dipole moments or as due to the presence of aiharmonic
terms in the potential energy associated with lattice vibrations ' '2 and also as a combination of both
In the case of optical absorption due to double-phonon processes, the contribution to the imaginary part of the dielectric constant due
to anharmonic terms higher than second order in the potential energy
can be written 15 .
ir J (u)
Stiiia 2 2
2 EnjJlÜLlJj 3d'
da
Here *T 5*(N/ii)-1/2 , b
+ higher order terms ,
b3« M'1 bq (q) bq (q-) bQT0 y
iS'*-.- '*.■>,. .{äRs»Hr".i
srr^r
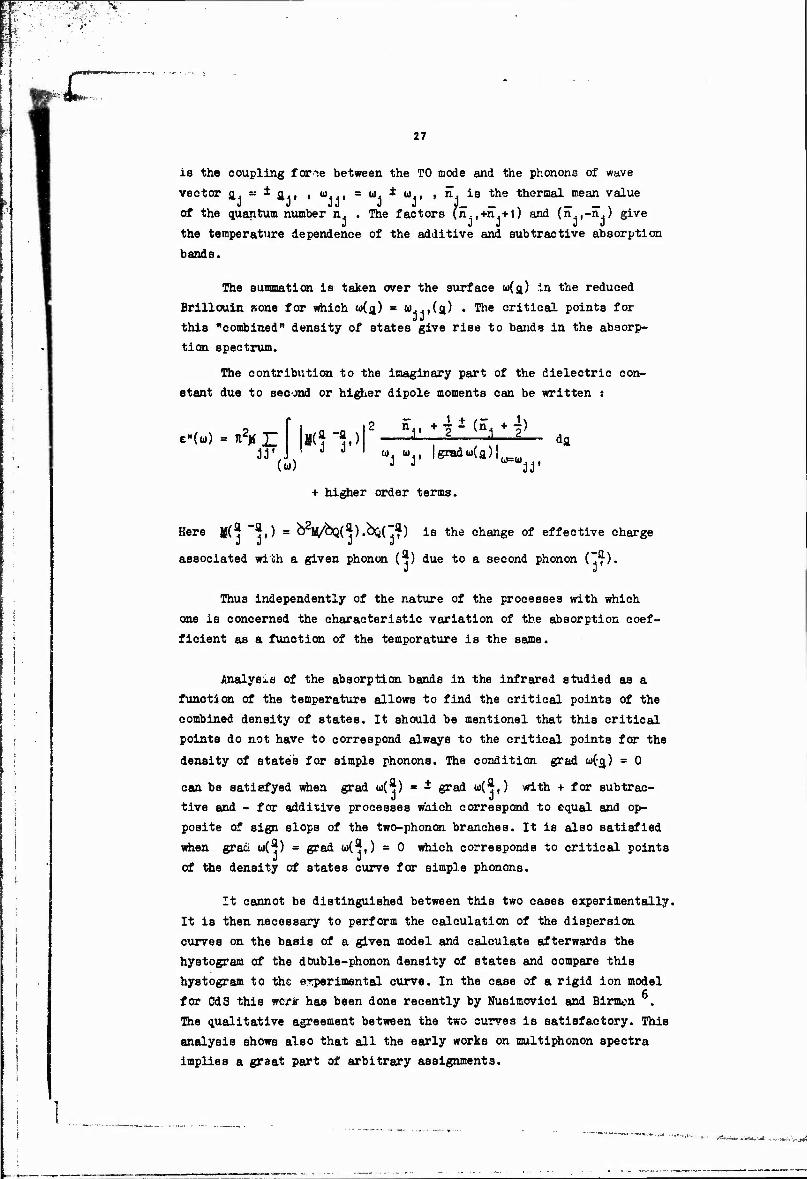
27
is the coupling fane between the TO mode and the phonons of wave
vector a. « ± a-, ,«!>..,= u. ± (I)., , n. is the thermal mean value
of the quantum number n. . The factors (n.,+n.+l) and (n ,-n.) give the temperature dependence of the additive and subtractive absorption
bands.
The summation is taken over the surface w(a) in the reduced
Brillouin zone for which w(a) = u. .,(a) • The critical points for this "combined" density of states give rise to bands in the absorp- tion spectrum.
The contribution to the imaginary part of the dielectric con- stant due to second or higher dipole moments can be written :
E"(U) = U2tf JZ 2 n-.^-Myj)
(u>)
+ higher order terms.
uj »j. Igrad^a)!^ da
ir
Here Jf(j ~^i) = ^2V^Q( j)-^Q(^) is ^e change of effective charge
associated with a given phonon (a) due to a second phonon ("!f). J J
Thus independently of the nature of the processes with which
one is concerned the characteristic variation of the absorption coef-
ficient as a function of the temperature is the same.
Analysis of the absorption bands in the infrared studied as a
function of the temperature allows to find the critical points of the
combined density of states. It should be mentionel that this critical
points do not have to correspond always to the critical points for the
density of stateb for simple phonons. The condition grad W(-JJ) = 0
can be satiefyed when grad u(^) = ± grad u(^,) with + for subtrac-
tive and - for additive processes which correspond to equal and op-
posite of sign slops of the two-phonon branches. It is also satisfied
when grad w(^) = grad u(^i) = 0 which corresponds to critical points
of the density of states curve for simple phonons.
It cannot be distinguished between this two cases experimentally.
It is then necessary to perform the calculation of the dispersion
curves on the basis of a given model and calculate afterwards the
hystogram of the double-phonon density of states and compare this
hystogram to the experimental curve. In the case of a rigid ion model
for CdS this wer* has been done recently by Nusimovici and Birmcn .
The qualitative agreement between the two curves 1B satisfactory. This
analysis shows also that all the early works on multiphonon spectra
implies a great part of arbitrary assignments.
28
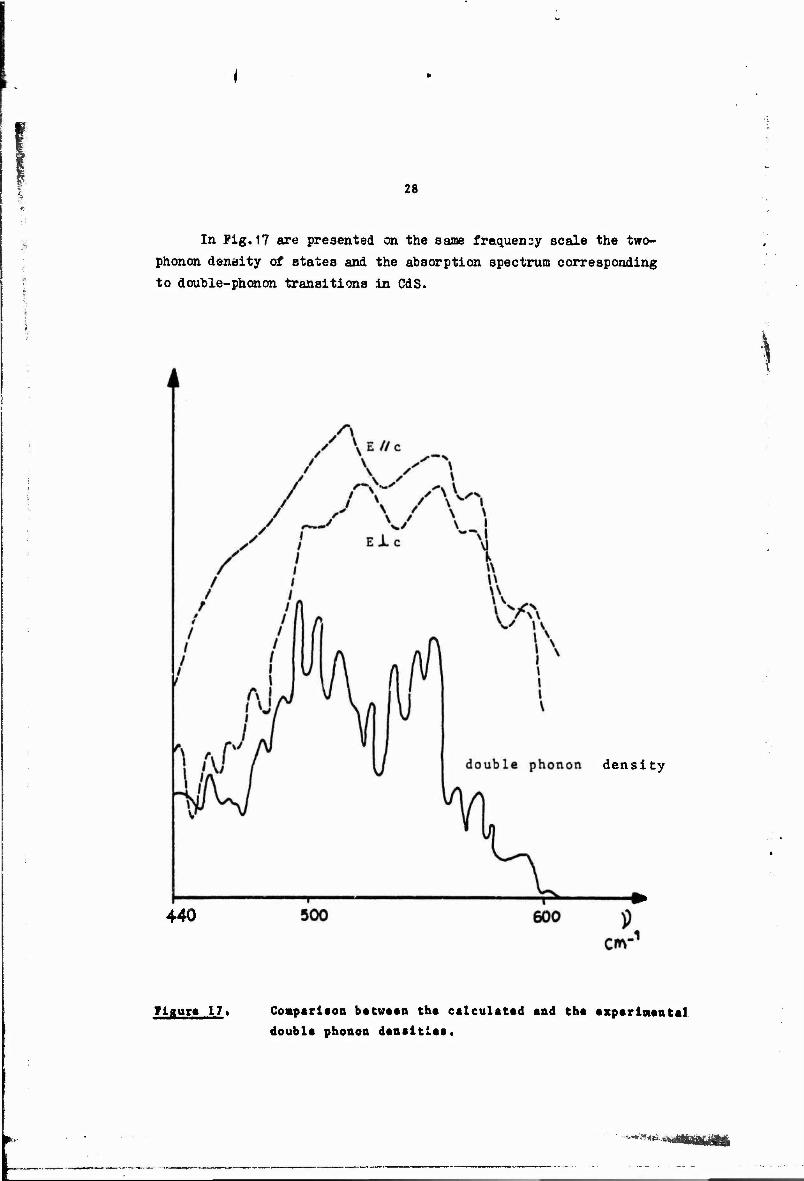
In Pig.17 are presented on the same fraquensy scale the two- phonon density of states and the absorption spectrum corresponding to double-phonon transitions in CdS.
density
440
Figure 17. Comparison between the calculated and the experimental
double phonon densities.
WS*!£|4£j;
-'"-.■ ■:■'*-"x
.«V*"*-**«-V-*»t •*?J»- ^
29
5. Localized Modes of Vibrations.
5.1. Localized Surface Modes.
POT a finite crystal the surface atoms vibrates in a nanner
different from the atoms in the volume. Wallis has studied di-
atomic cubic crystals and find that in addition to the normal modes
of vibrations it appears localized surface modes whose frequencies
are situated in the forbidden frequency gap between the acoustical
and optical bands. The surface modes have non-vanishing electric di-
poie moments and may give rise to infrared absorption. Such absorp-
tion has not yet been observed experimentally.
In order to be able to observe localized surface modes it is
necessary that the ratio surface/volume is as large as possible. If
one considers thin film samples the surface atoms can be seen as in- 14
dependent impurities atoms. There are approximatively 10 atoms per 2
cm at the surface and for a layer of thickness d this would ccrre- It %
spond to 10 /d per cm impurity atoms. Localized modes for impur- 18 -3 ities become observable for concentration of the order of 10 cm
and this means that surface modes can be observed in thin films of
thickness d{ 1 n .
5.2. Localized modes of vibrations due to impurity atoms in II-VI
compounds.
Localized modes have been observed by means of infrared spectro- .15 scopy in homopolar semiconductors like Si containing light impurities ,
wj 19
16 17 in intermetallic semiconductors like GaAs with Li and P ' and InSb
with Al 18
as well as in ionic crystals The frequencies of the
localized modes due to substitutions! atoms and their coupling with 20
the radiation field can be deduced on the basis of simple theory
when no changes in force constant are involved.
Some semiconductor crystals of the II-VI group such as ZnSe and 21
CdS doped with Li and Al have been investigated recently. Infra-
red absorption due to localized vibrations in CdSe containing S and 22
CdTe containing Se and Li has also been investigated . Here the
frequencies of the absorption peaks attributed to localized modes
are compared with that calculated for a mass defect in wurtzite CdS
subject to appropriate normal modes frequency scaling.
23
"****M***"Wi<iiimiiiinittWBi«iti<iiai*h ■
30
5.2.1. Theoretical considerations.
The perfect lattice vibrational frequencies a are roots of the
secular equation
Det |Mu2-«| = 0 (5.1)
where * is the potential energy matrix for the perfect crystal formed
by atoms with mass M. The introduction of an imperfection into the
crystal brings a perturbation c to the potential energy. The matrix
representing the potential energy of vibration of the crystal with
impurities is *+c. Tbe secular equation for the perturbed crystal is
then
Det |Mu)2-«-c| = 0 . (5.2)
It is possible to define a matrix g whose coefficients are the Green's functions of the crystal :
g(Mw2-*-c) = 1 - go . (5.3)
The localized modes, due to presence of impurities, are then solu-
tions of the secular equation
Det |1 - g(u>) c(w)| = 0 . (5.4)
•In the wurtzite structure CdS the unit cell 1 contains four atoms k = 1, 2, 3» 4 which are respectively Cd_, Cd.,, S,, S,- . We just consider a single mass defect (the force constants are left unchanged). The defect subspace is three dimensional and localized mode frequency is a solution of the secular equation (5.4).
The matrix c is a unit three dimensional matrix multiplied by
(NL-M1)" where M1 is the impurity mass and M. the mass of the re- placed host ion.
The matrix fj Green's functions elements are deduced from the phonon eigenvectors jj(ja) and eigenfrequencies u (jq) :
rilOrJh T-^^^k'^expiq^-rD (5.5)
^^.-Mi$mifäk
j> x ; wmm rW
31
Prom the point group symmetry of the crystal around the defect the
Green1 e. functions satisfy the following relations :
and ««k,«'k'(0'0) (»2) - 6«a« ««k,«k(C'0) ^
6*^(0,0)^) = gyk>yk(0,0) (a.2) .
5.6)
The impurity may replace either Cd or S and four different Green's functions are used in this problem :
«? = Mi <Wi(0'0)(w2) • (5.7) g3 = M3 gz3,z3(0»0)(ü,2) »
64sM3gx3,x3(°'0)(u,2)
where M and M, are respectively the mass of Cd and the mass of S.
For many defect vibration problems and especially for band resonance calculations it is convenient to know
ill. lim 0g(w*i<p) - g'(u) ♦ *Jv(») (5.8)
The values of
v«k,«'k'(1'1,)(u) si^aak{ii) Vk'^ exp ^pl-rl') ß[»(3a)-w] ig (5.9)
are obtained by using the computed CdS spectrum * for 125 values of a in the reduced Brillouin zone. The frequency band (u> \ ajj) is di- vided into Z = 61 equally spaced regions and the sum (5.9) carried over m(cü^Z) («( (m+l)(w^2) to from a hystogram for v. The va- lues of g'(u) are then obtained at the mid points of the hystogram sections by using the Kramers-Krönig relation
*"* vi(ui') dw' Sj(«) - { 2 2
"*** '""'^'^^***i&K4ttmisA*t*iM&i
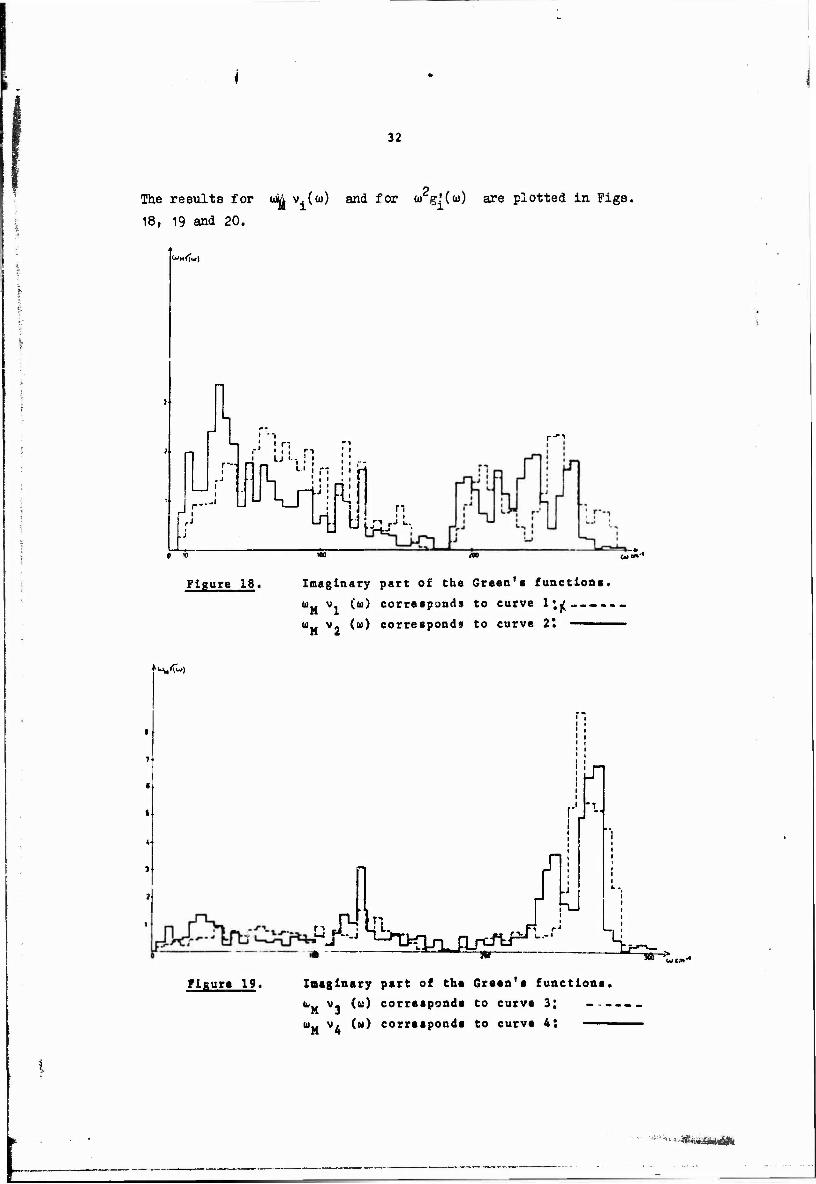
32
The results for oil V.(ü)) and for u> g!(w) are plotted in Figs.
18, 19 and 20.
WM(fw|
"-I ,-'> :n r-- ri « " > ■ ' ' r-
/Ml „ a.«
Figure 18. Imaginary part of the Green1a functions. WM vl ^ corresponds to curve l;^----. uu vo (u) corresponds to curve 2! —— M 2
^U^^w)
Jl
ist. Figure 19. Imaginary part of the Green's functions.
"M V3 ^ corresponds to curve 3;
WM v4 ^ corresponds to curve 4: ——
'Äis^rtsöit
«:-'
:"18S
P\
33
<*,»••>
* .
-»-
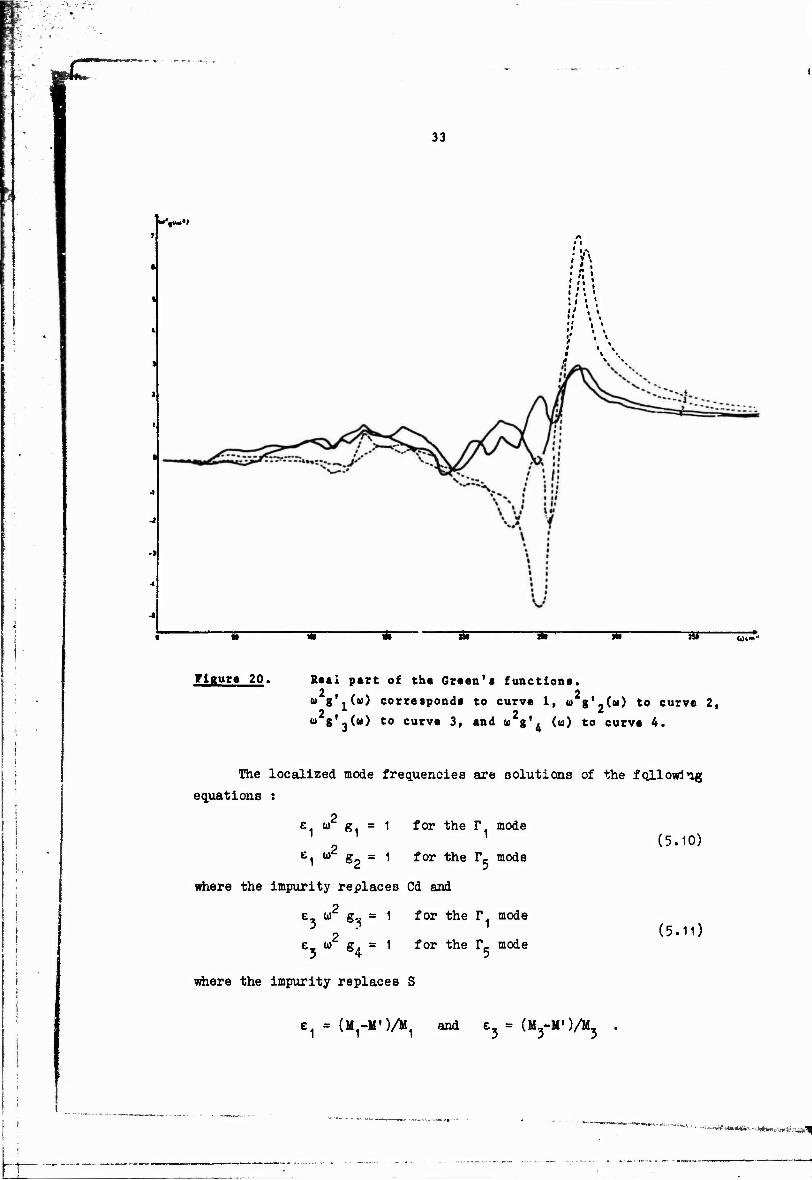
Figur« 20. Re&i part of the Green's function«. 2 2
(i) g'.(u) corresponds to curve 1, u g'-(w) to curve 2, 2 2
u s*3<»> to curve 3, end <o g'4 (a) to curve 4.
The localized mode frequencies are solutions of the following
equations :
e a) g = 1 for the r mode
e, a) 1 » gp = 1 for the IV mode
where the impurity replaces Cd and
2 ei u 6u ■ 1 for the T. mode
2 E, u) g. = 1 for the rc mode 3 4 5
where the impurity replaces S
(5.10)
(5.11)
€1 = (M^M'J/M, and t^ = (ny-M')/«^
■■■'v# ua*3nts.ii • ■ii^w,i.i,. UlefeA|
34
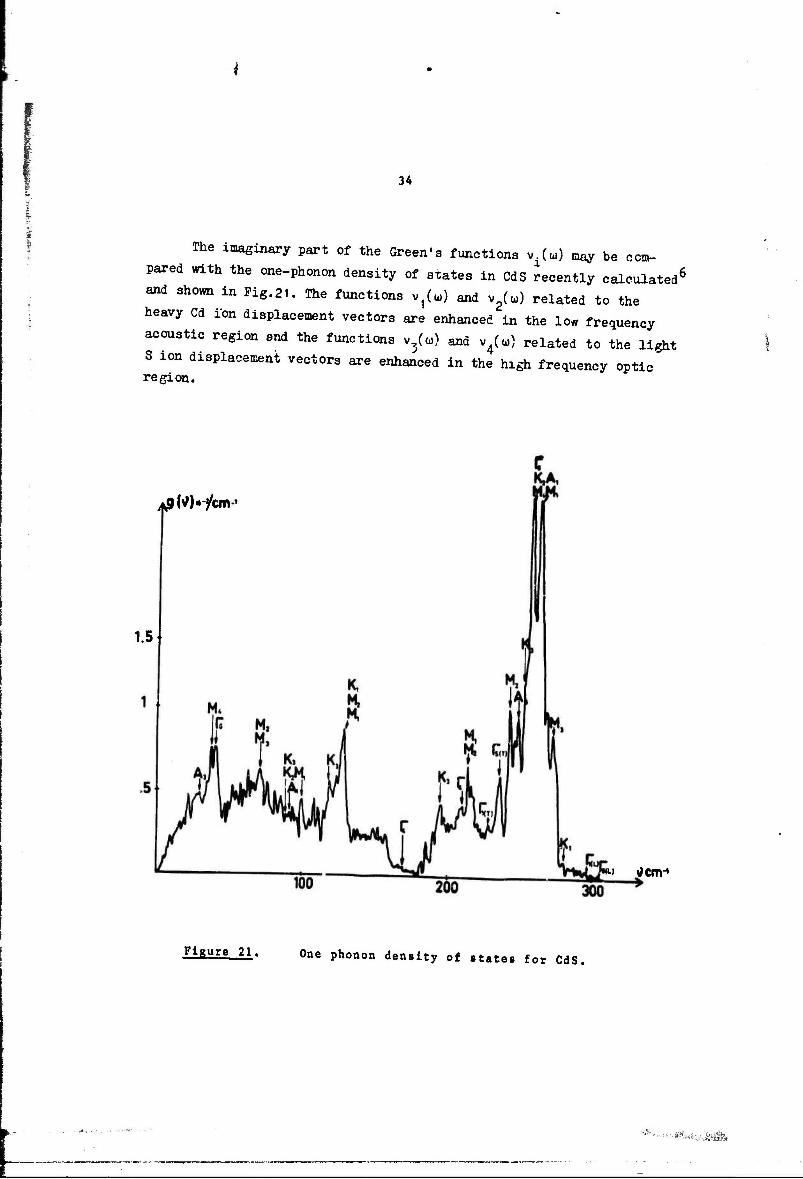
The imaginary part of the Green's functions v.(to) may be ccm- pared with the one-phonon density of states in CdS recently calculated and shown in Pig.21. The functions v (UJ) and v (u) related to the
heavy Cd ion displacement vectors are enhanced in the low frequency acoustic region snd the functions v,(c»>) and v,(w) related to the light S ion displacement vectors are enhanced in the high frequency optic region.
ApUHcm
1.5
ii tfcm-«
F18ure 21' 0ne Phon°° density of states for CdS.
35
a) Localized godea.
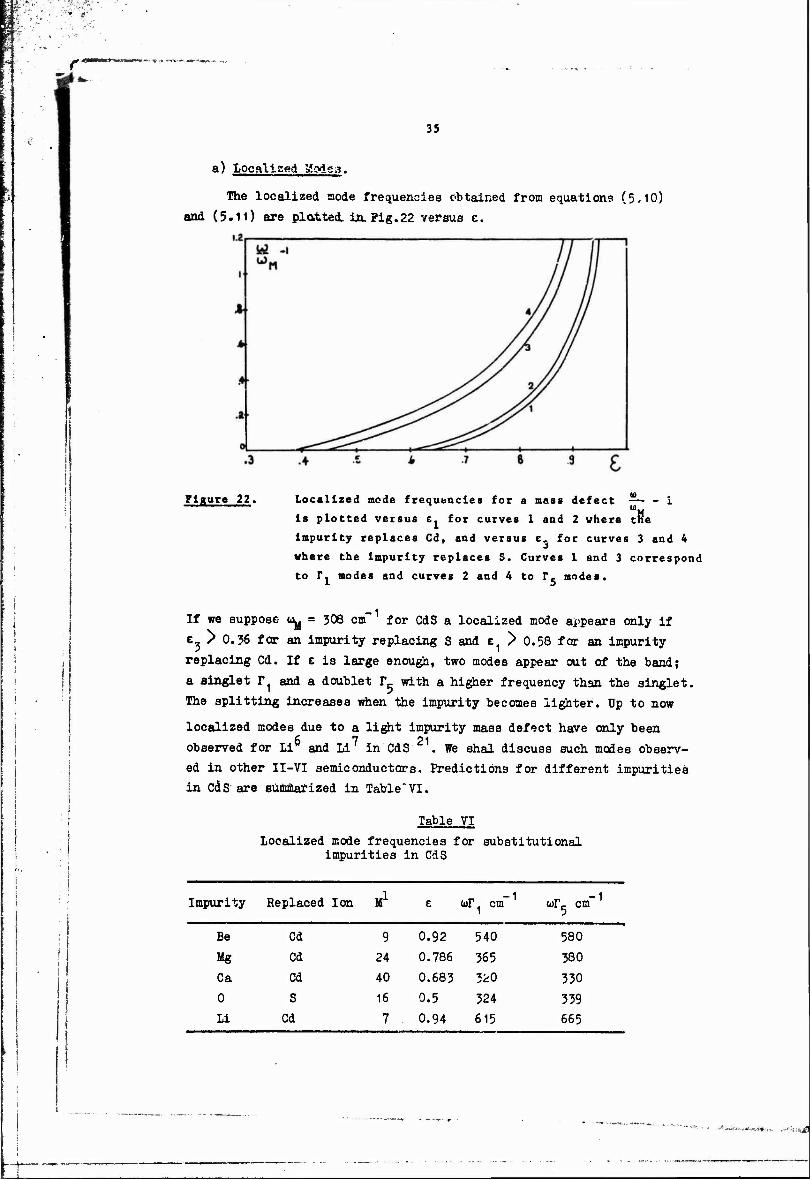
The localized mode frequencies obtained from equations (5,10)
and (5.11) are platted, in. Pig.22 versus e.
Figure 22. Localized mode frequencies for a mass defect — - I
Is plotted versus t^ for curves 1 and 2 where tne
impurity replaces Cd, and versus E. for curves 3 and 4
where the impurity replaces S. Curves 1 and 3 correspond
to r. modes and curves 2 and 4 to r, modes.
If we suppose Uy = 308 cm" for CdS a localized mode appears only if
e_ > 0.36 for an impurity replacing S and e )> 0.58 far an impurity
replacing Cd. If e is large enough, two modes appear out of the band;
a singlet 1^ and a doublet r_ with a higher frequency than the singlet.
The splitting increases when the impurity becomes lighter. Up to now
localized modes due to a light impurity mass defect have only been f% 7 01
observed for Li and Li in CdS . We shal discuss such modes observ- ed in other II-VI semiconductors. Predictions for different impurities in CdS are summarized in Table"VI.
Table VI
Localized mode frequencies for substitutions! impurities in CdS
' I
Impurity Replaced Ion M1 e <i>r. cm" loIV cm" 5
Be Cd 9 0.92 540 580
Mg Cd 24 0.786 365 380
Ca Cd 40 0.683 320 330
0 S 16 0.5 324 339 Li Cd 7 0.94 615 665
» If-—■ ■
36
For light impurities (e - 1) all the localized mode frequencies
tend to infinity. This can be shown from the limit form of the Green's
functions vhen w is much bigger than w(ig) :
but
w 2v ^- lff»k(te)l 1
^ff0k(i3ä) V^ = &aß «Jfc, .
then when w -» «
and the solution for e is e ~ 1 .
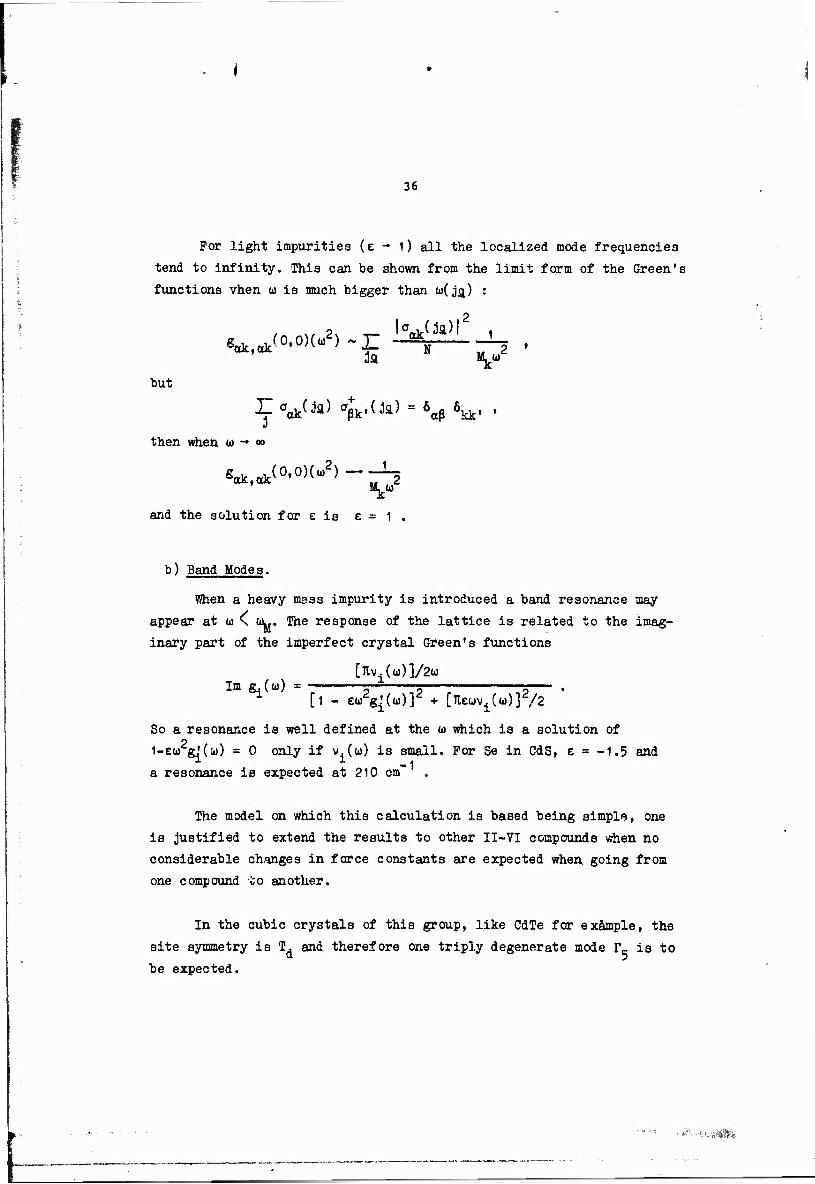
b) Band Modes.
When a heavy msss impurity is introduced a band resonance may
appear at u \ i±,. The response of the lattice is related to the imag-
inary part of the imperfect crystal Green's functions
[nv.(w)]/2w Im g.(w) = r 5— .
1 [1 - £(02g^(ü))]2 + [KEUV^ü))]2,^
So a resonance is well defined at the u which is a solution of
1-eu gJ(w) = 0 only if v. (to) is small. For 3e in CdS, e * -1.5 and — 1
a resonance is expected at 210 cm
The model on which this calculation is based being simple, one
is justified to extend the results to other II-VT compounds when no
considerable changes in force constants are expected when going from
one compound to another.
In the cubic crystals of this group, like CdTe for example, the
site symmetry is T. and therefore one triply degenerate mode IV is to
be expected.
..*»»%
SSf^pFT
tP •
37
5.2.2. Experimental observations of localized band and gap
mode8.
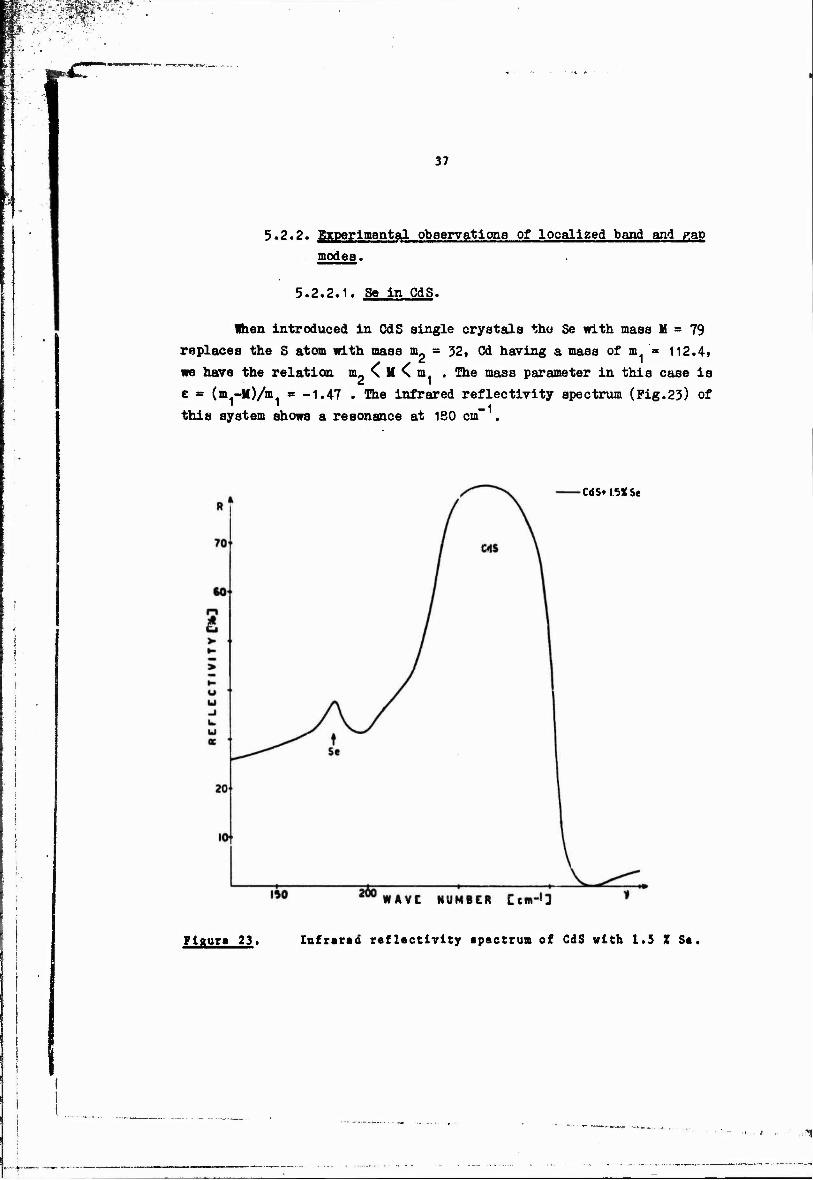
5.2.2.1. Se in CdS.
Ihen introduced in CdS single crystals tho Se with mass M = 79
replaces the S atom with mass m - 32, Cd having a mass of m = 112.4,
we have the relation m_ \ M \ m The mass parameter in this case is
e = (m -M)/m = -1.47 . The infrared reflectivity spectrum (Pig.23) of
this system shows a resonance at 1B0 cm -1
CdS«l.5XSe
""WAVE NUMBER Cem-'D
Figur« 23. Infrared reflectivity ipectrum of CdS with 1.5 Z Se.
-1—
38
This frequency being out of the restraWen region the corresponding
mode could be considered as a gap mode. The density of mode at this
frequency (see Pig.21) is very low, practically zero, one can there-
fore consider that this mode is situated in a forbidden frequency
region , the frequency gap , and is therefore called a gap mode.
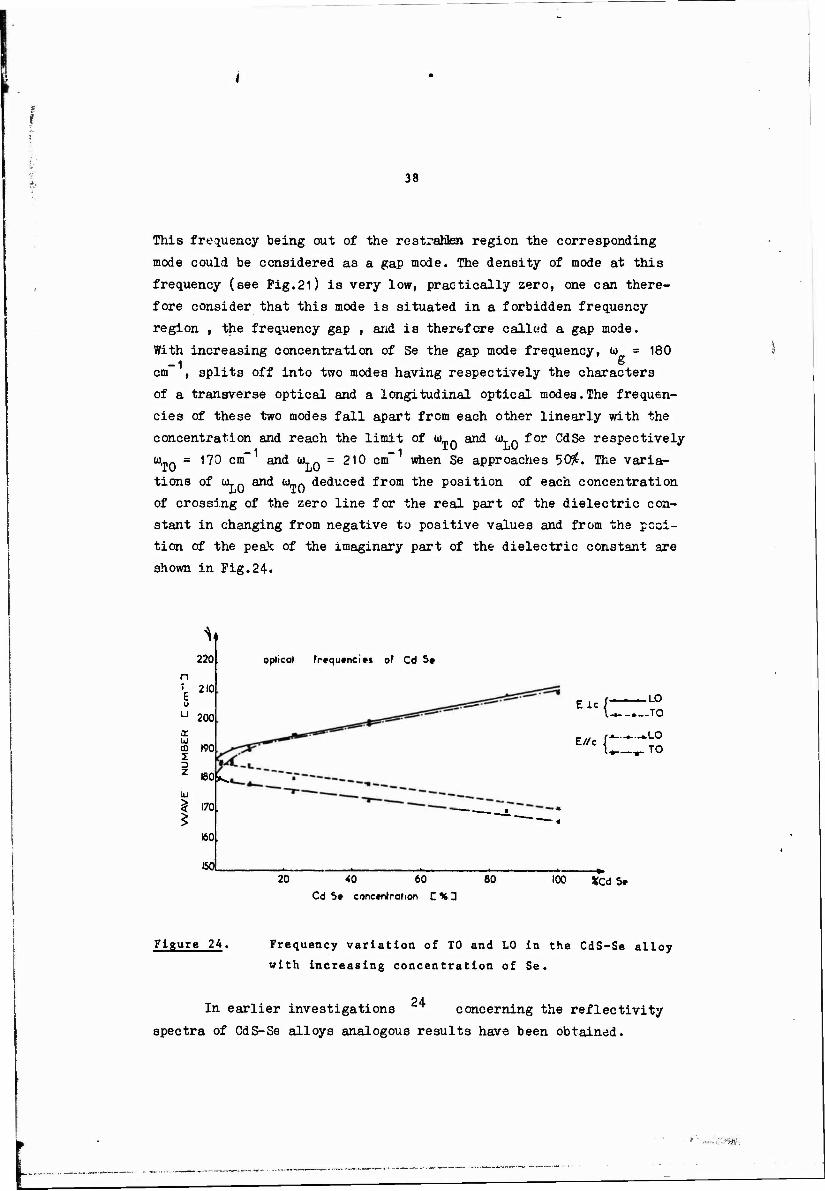
With increasing concentration of Se the gap mode frequency, a> = 180 -1 ^
cm , splits off into two modes having respectively the characters
of a transverse optical and a longitudinal optical modes.The frequen-
cies of these two modes fall apart from each other linearly with the
concentration and reach the limit of (ü„0 and üL« for CdSe respectively
(o,_0 = 170 cm" and a.» = 210 cm" when Se approaches 50^. The varia-
tions of ÖL.» and UJ_0 deduced from the position of each concentration
of crossing of the zero line for the real part of the dielectric con-
stant in changing from negative to positive values and from the posi-
tion of the peak of the imaginary part of the dielectric constant are
shown in Pig.24.
n 7
E
220
210
200 tr UJ m 190 3 Z
UJ
I BOk.
170
160
1501
optical frequencies of Cd Se
Eic {T. — LO —TO
E//C r"£ U -r- TO
20 40 60
Cd Se coneenJrahon C%2
80 100 *Cd Se
Figure 24. Frequency variation of TO and LO in the CdS-Se alloy
with increasing concentration of Se.
In earlier investigations concerning the reflectivity spectra of CdS-Se alloys analogous results have been obtained.
MB»».
39
5.2.2.2. SinCdSe.
For concentration higher than 50$ of Se in OdS the situation
will be inverted, the impurity will be now S in CdSe. S is a light
impurity If = 32 in Ci.Se substituting Se with m? = 79. the defect mass
parameter e here is E = (79-32)/79 = 0.595.
In -the wurtzite structure CdS have a unit ceil 1 containing
four atoms k = 1, 2, 3» 4, which are respectively Cd-, Cd.--, ST and
EL,.. The point defect introduced in the perfect crystal substitutes
one of these atoms. In a first approximation only the mass defect is
considered assuming that substitution of an atom for another does not
introduce changes in the force constants of the perfect crystal. The
localized mode frequency is a solution of the secular equation (5.4).
To solve this equation it is necessary to take only a 3><3 submatrix
G(u ) corresponding to the defect subspace. Substitution of the Cd
and S atoms are studied with the mass coefficients respectively
et = AM/M1 , e = AM/M-
In the wurtzite crystal the point defect has no more the site sym- metry IV. but Cfi and the triply degenerate localized mode r._ is now split into two modes I' and IV simply and doubly degenerate. The local- ized mode frequencies are solutions of the following equations when the impurity replaces Cd atoms :
2 . e.u g_ = 1 for the IV mode doubly degenerate corresponding to
vibrations of the impurity atoms perpendicular to the c axis of the crystal ;
2 . e.u» g. = 1 for the r, mode non-degenerate corresponding to
vibrations of the impurity atoms parallel to the c axis of the crystal.
When the impurity replaces the S atoms the localized mode fre-
quencies are solutions of the following equations :
2 e,ü> g. = 1 for the rc mode , 3 4 5
2 e,w gT = 1 for the IV mode. 3 3 1
The position of the localized modes is obtained directly accord- 2 2 ing to these equations from the plot of us g(u ) as a function of the
9 9 ! frequency in taking u> g(u ) = — .
«0
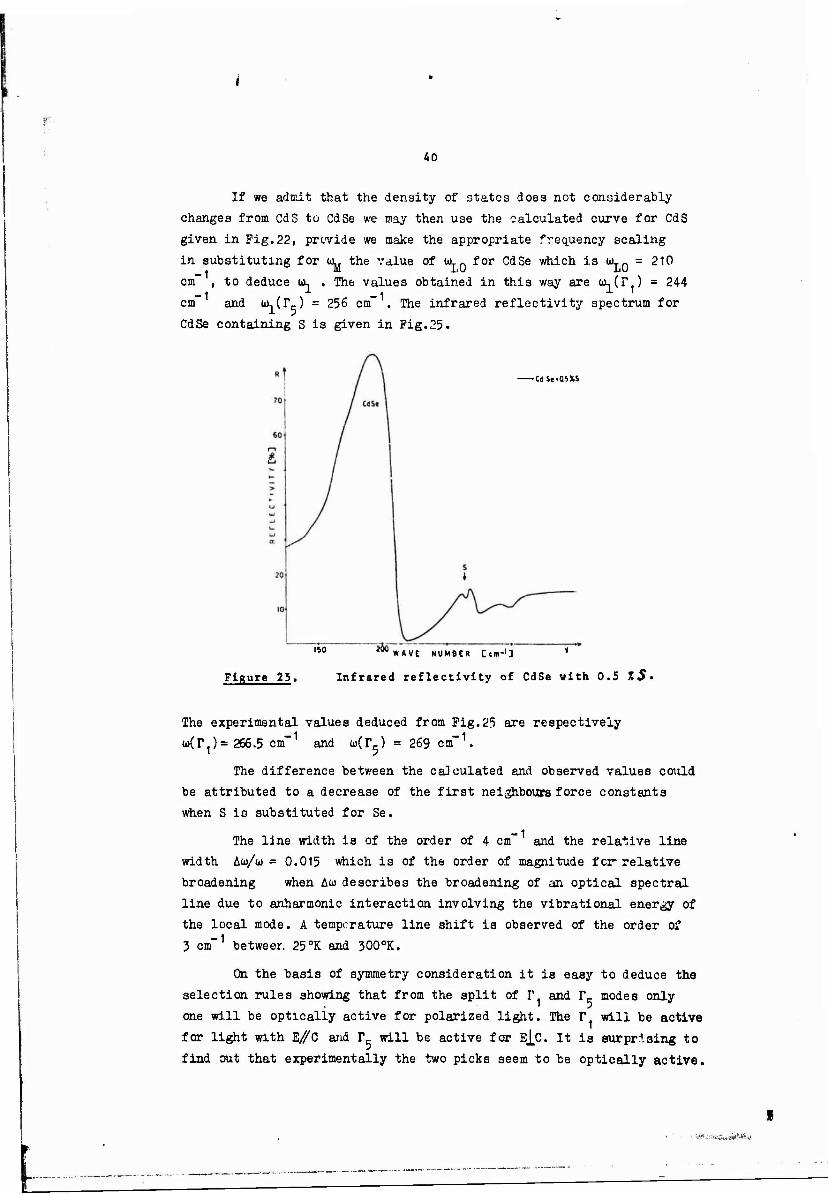
If we admit that the density of states does not considerably
changes from CdS to CdSe we may then use the calculated curve for CdS
given in Pig.22, provide we make the appropriate frequency scaling
in substituting for UL. the value of OIL. for CdSe which is UL- = 210
cm" , to deduce to, . The values obtained in this way are ^(T.) = 244
cm" and ^(r^) = 256 cm" . The infrared reflectivity spectrum for
CdSe containing S is given in Fig.25.
CdSfOsks
ISO 2C0WAVC NUMBER Cem-'D '
Figure 25. Infrared reflectivity of CdSe with 0.5 XS»
The experimental values deduced from Pig.25 are respectively
u(r.)= 266.5 cm"1 and w(rc) = 269 cm"1.
The difference between the calculated and observed values could
be attributed to a decrease of the first neighbours force constants
when S io substituted for Se.
The line width is of the order of 4 cm" and the relative line
width Aw/to = 0.015 which is of the order of magnitude far relative
broadening when Aw describes the broadening of an optical spectral
line due to anharmonic interaction involving the vibrational energy of
the local mode. A temperature line shift is observed of the order of
3 cm"1 betweer. 25°K and 300°K.
On the basis of symmetry consideration it is easy to deduce the
selection rules showing that from the split of r and r_ modes only
one wj.ll be optically active for polarized light. The r will be active
for light with E/C and IV will be active for EJ,C. It is surprising to
find out that experimentally the two picks seem to be optically active.
.v«'»v
f™
41
When the concentration of S in CdSe increases the two localized
modes 3hifta in frequency until reaching the limit frequencies corre-
sponding to the normal modes in CdS respectively <4-Q = 240 cm" and
WL 0 = 300 cm"1.
6.2.2.3. Light impurities in CdTe.
CdTe has the cubic zinc-blende (sphalerite) structure band on
the cubic space group Tl. The dispersion curves calculated for a
hypothetical cubic CdS show only slight difference from that of wurtz-
ite. If it is acceptable to use the same frequency distribution as in
CdS it will be possible with an appropriate frequency scaling for LO
to deduce a value for la. for each impurity. The frequency of the
localized mode obtained in this way may represent a good order of
magnitude to compare with the exprimeatal results.
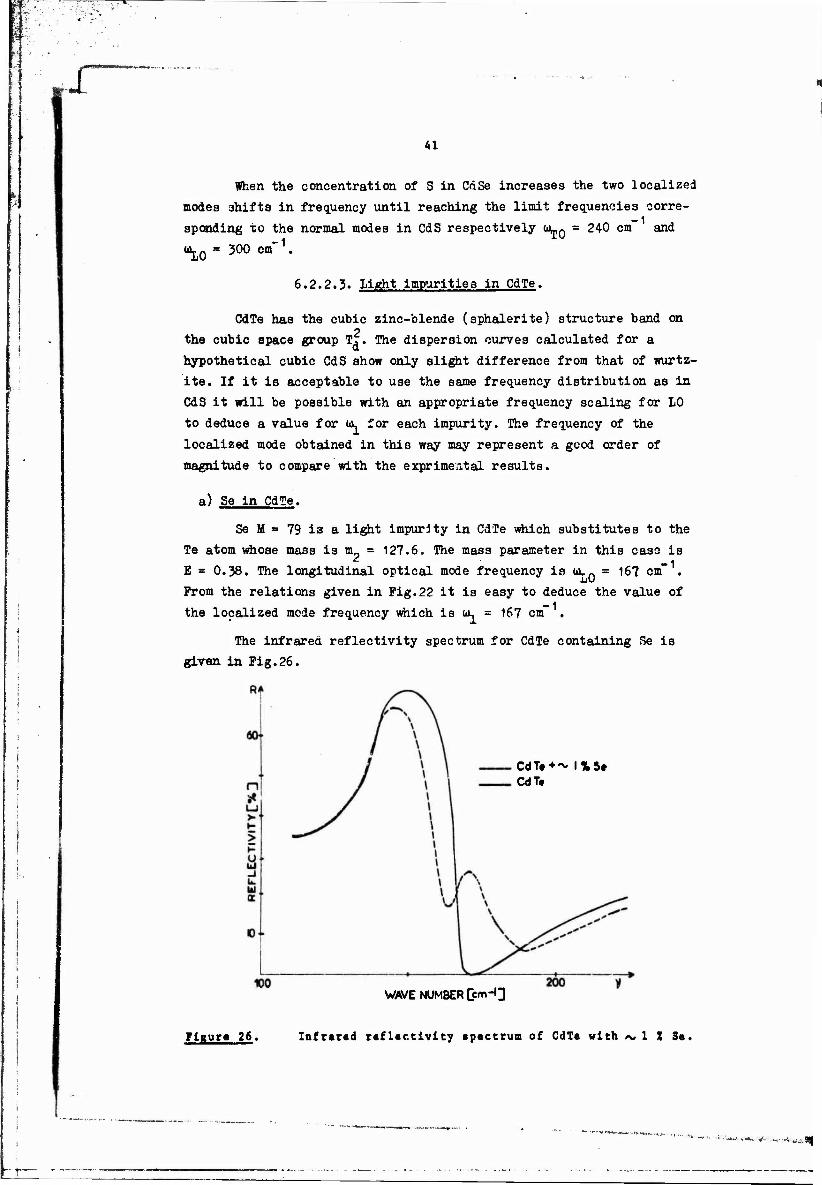
a) Se in CdTe.
Se H = 79 is a light impurity in CdTe which substitutes to the
Te atom whose mass is m? = 127.6. The mass parameter in this case is
E = 0.38. The longitudinal optical mode frequency is 0^- = 167 cm . JJU
Prom the relations given in Pig.22 it is easy to deduce the value of
the localized mode frequency which is UL = 167 cm" .
The infrared reflectivity spectrum for CdTe containing Se is
given in Pig.26.
CdT« + ~ |%5» CdTt
WAVE NUMBER Cem"Q
Figur« 26, Infrared reflectivity spectrum of CdTe with *» 1 X Se.
42
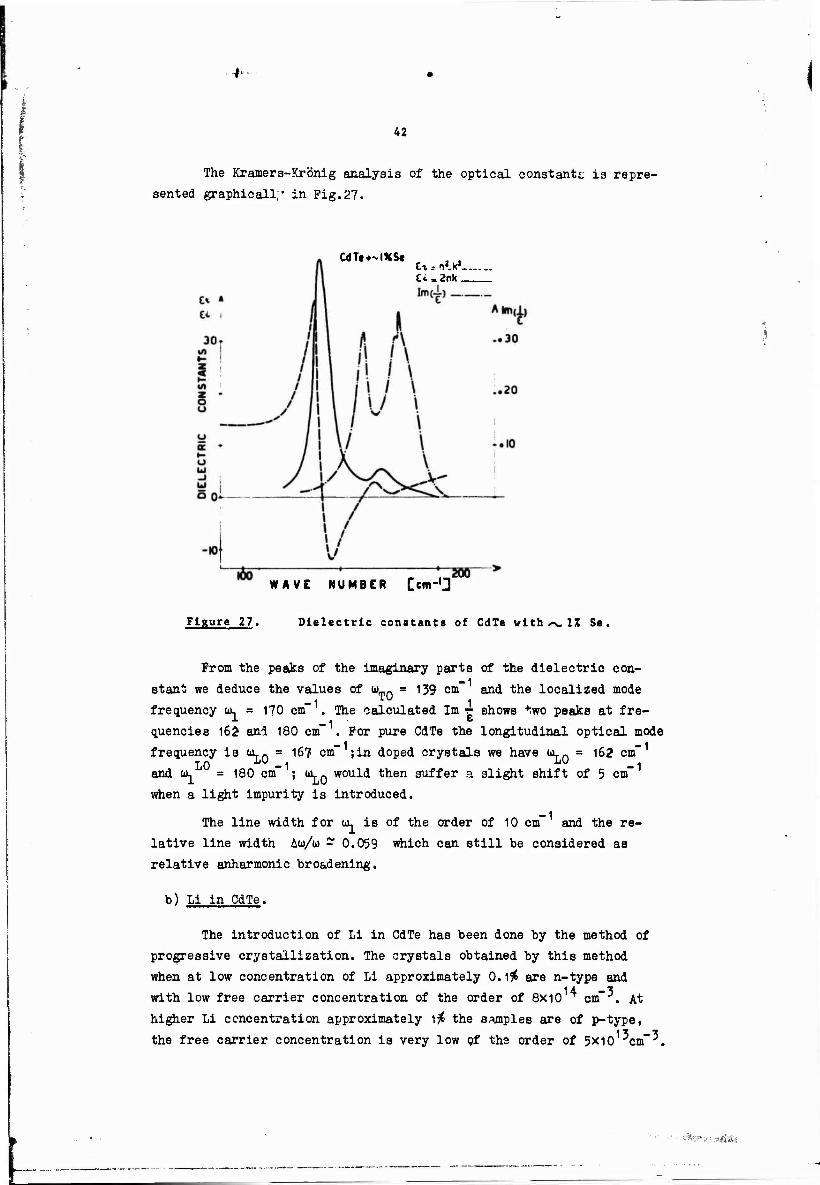
The Kramers-Xröhig analysis of the optical constants; is repre-
sented graphicall," in Fig.27.
CdTt*~IXSe
U . 2nk
WAVE NUMBER Cem-'J
Figure 27. Dielectric constants of CdTe with ^s. IX Se,
From the peaks of the imaginary parts of the dielectric con-
stant we deduce the values of <»)_» = 139 cm" and the localized mode -1 1 frequency I»L = 170 cm . The calculated Im -r shows ^wo peaks at fre-
quencies 162 and 180 cm~ . For pure CdTe the longitudinal optical mode
frequency is ULQ = 16? cm" ;in doped crystals we have üLQ = 1G2 cm
and co, = 180 cm" ; UL» would then suffer a slight shift of 5 cm
when a light impurity is introduced.
The line width for w. is of the order of 10 cm" and the re-
lative line width Au/u - 0.059 which can still be considered as
relative enharmonic broadening.
b) Li in CdTe,
The introduction of Li in CdTe has been done by the method of
progressive crystallization. The crystals obtained by this method
when at low concentration of Li approximately 0.1# are n-type and 14 -^ with low free carrier concentration of the order of 8x10 cm , At
higher Li concentration approximately 1# the samples are of p-type,
the free carrier concentration is very low of the order of 5x10 cm"*.
JÜ:
-
43
The samplea with low Li concentration are opaque in the infra-
red. At highsr Li concentration the samples become transparent proba-
bly because of a partial compensation.
At low concentration Li is supposed to occupy interstitial
sites and tc act as a donor whereas at high concentration the occupa-
tion of substitutional sites where Li acts as an acceptor becomes
predominant. In the neighbourhood of 1$ of Li a partial compensation
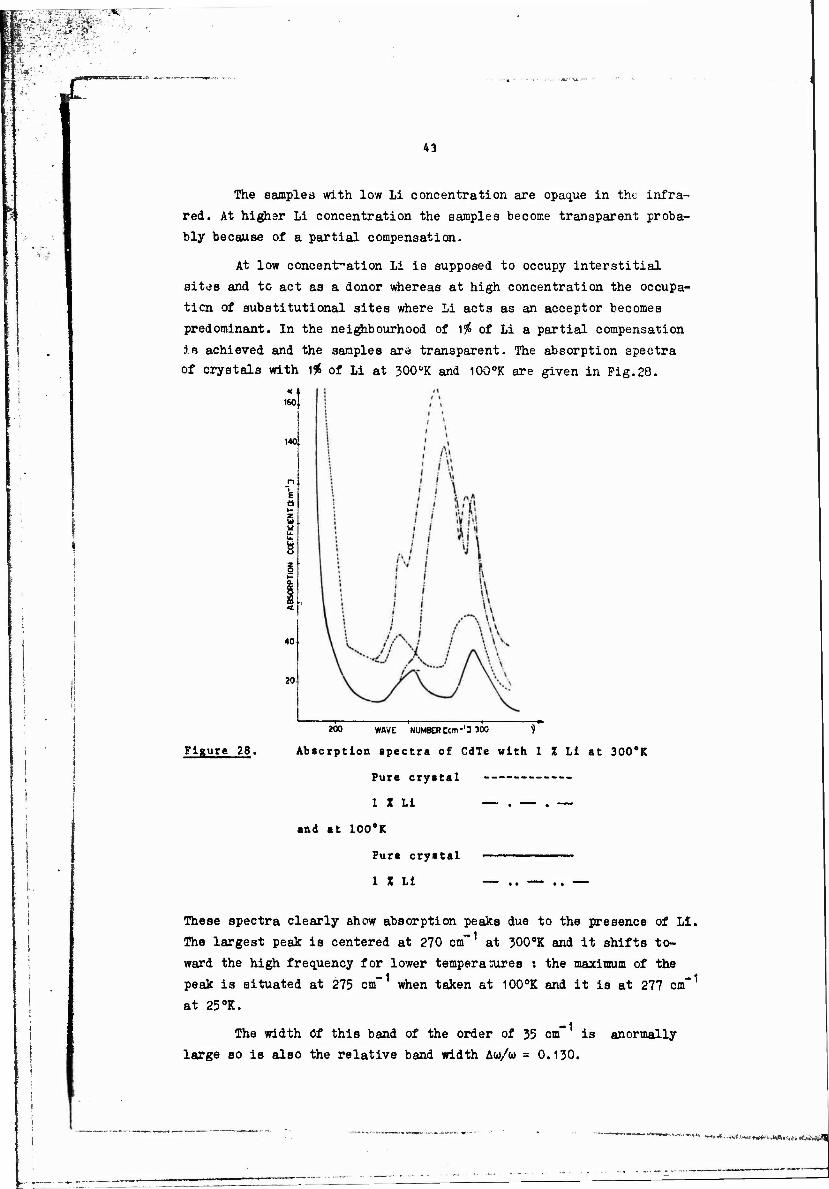
in achieved and the samples are transparent. The absorption spectra
of crystals with \$ of Li at 300°K and 100°K are given in Pig.28.
« 160
140
E a
3 u
40
20
Figure 28,
200 WAVE NUMBER Ccm-'3 300 ?
Absorption spectra of CdTe with 1 % Li at 300*K
Pure crystal
1 X Li — . — . —-
and at 100'K
Pure crystal ■
1 X Li — .. — .. —
These spectra clearly enow absorption peaks due to the presence of LI.
The largest peak is centered at 270 cm" at 300°K and it shifts to-
ward the high frequency for lower tempera cures : the maximum of the
peak is situated at 275 cm"1 when taken at 100°K and it is at 277 cm"1
at 25°K.
The width öf this band of the order of 35 cm is anormally
large so is also the relative band width Aw/w = 0.130.
**■""'m*fa *«''*--"**'***■***>-.*«**%£, aftnft^l
44
5.2.2.4. Impurities in ZnSe.
ZnSe is again a cubic zinc-blende crystal for which the analysis
of the infrared spectra concerning the phonon interaction with the
radiation field can be treated on the ba3is of the equivalent disper-
sion relation for the sphalerite CdS. The tacite assumption in calcula-
tion the local mode frequencies OL is that the frequency distribution
is analogous to that of CdS. The experimental results are very close
to that calculated in this hypothesis which can be therefore consider-
ed as a satisfactory first order approximation.
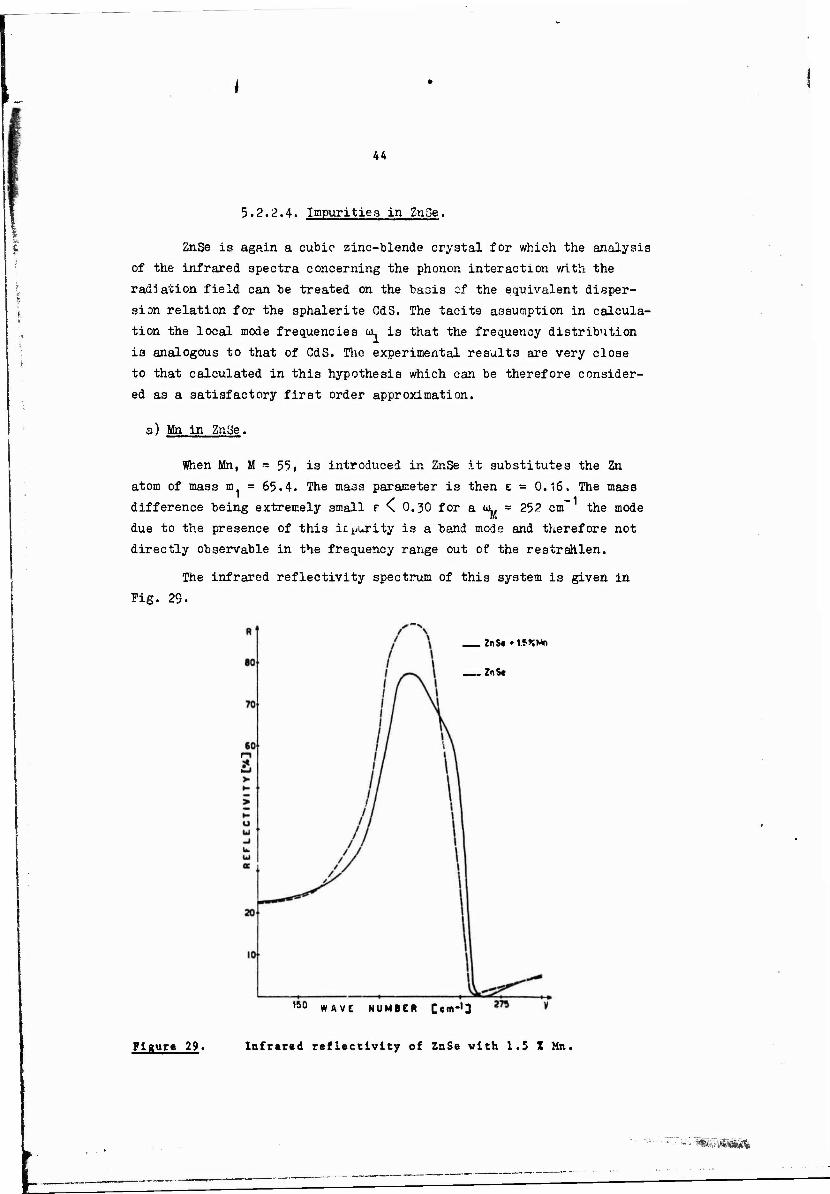
a) Mn in Znije.
When Mn, M = 55, is introduced in ZnSe it substitutes the Zn
atom of mass m = 65.A. The mass parameter is then e = 0.16. The mass
difference being extremely small r \ 0.30 for a (i. = 25? cm~ the mode
due to the presence of this icpurity is a band mode and therefore not
directly observable in the frequency range out of the restrahlen.
The infrared reflectivity spectrum of this system is given in
Fig. 29.
ZnSt *t*«Mn
2nS«
WAVE NUMBER Ccm-'J
Plgure 29. Infrared reflectivity of ZnSe with 1.5 Z Mn.
■WSÖ3S
S"
45
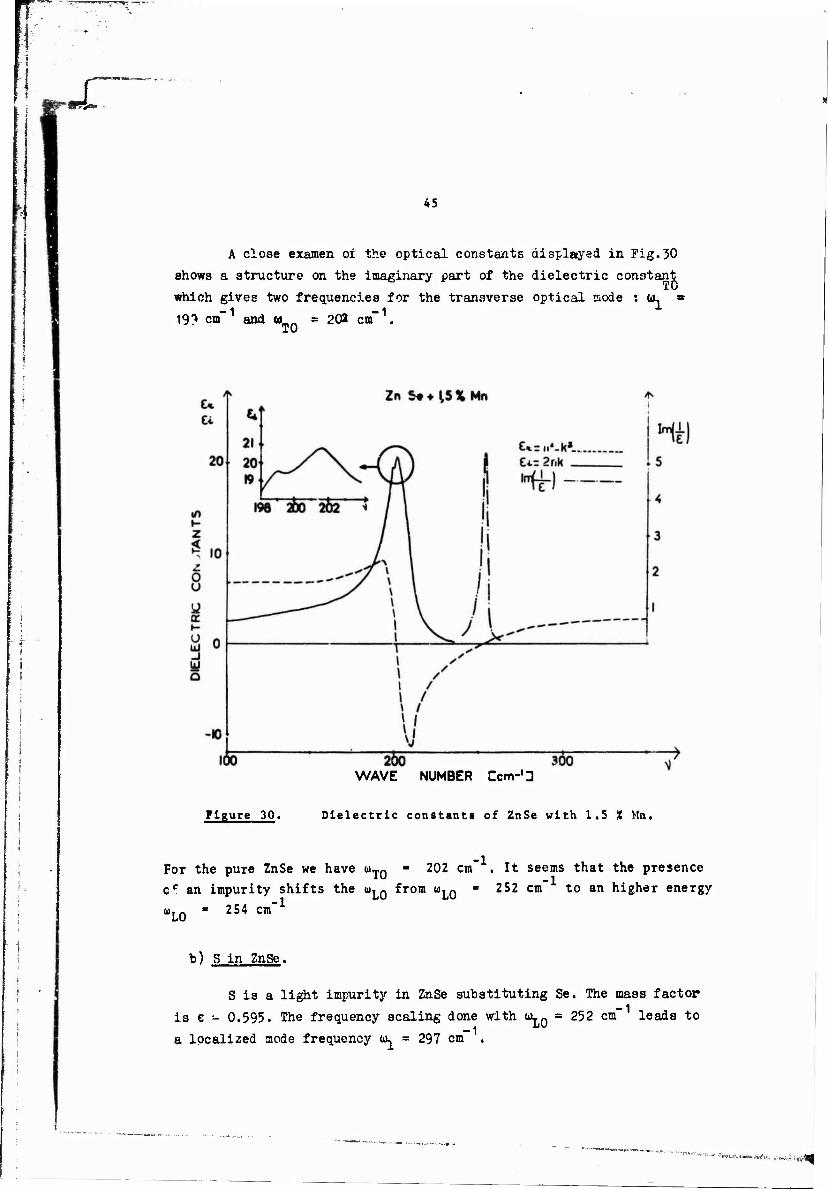
A close examen of the optical constants displayed in Fig.30
shows a structure on the imaginary part of the dielectric constant TO
which gives two frequencies for the transverse optical mode : u. ■
19? cm" and w TO
= 202 cm -1
WAVE NUMBER Ccm-'3
Figure 30. Dielectric constants of ZnSe with 1.5 % Mn.
For the pure ZnSe we have uT0 - 202 cm . It seems that the presence
cf an impurity shifts the wLQ from uLQ - 252 cm" to an higher energy
WL0 " 254 Cm"
b) S In ZnSe,
S is a light impurity in ZnSe substituting Se. The mass factor
is e - 0.595. The frequency scaling done with üLQ = 252 cm" leads to
a localized mode frequency w. = 297 cm" .
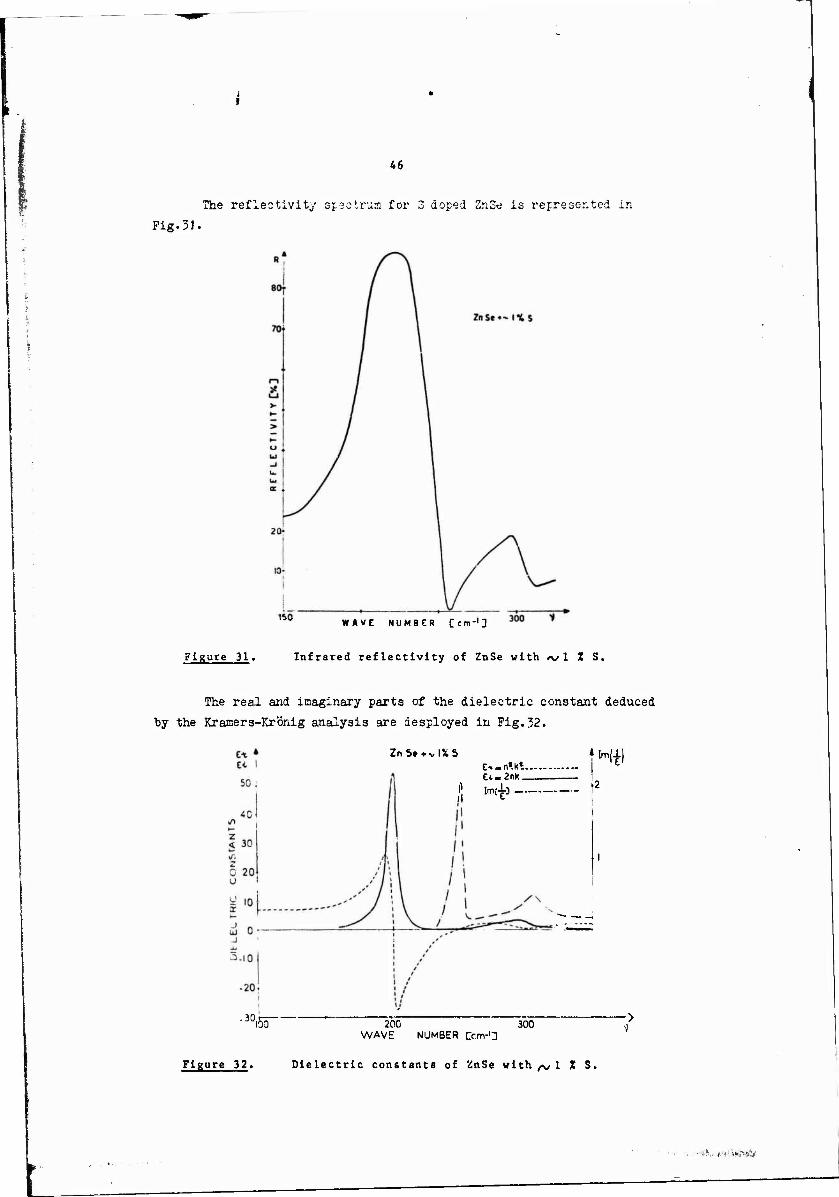
46
The reflectivity spectrum for 3 doped ZnSd is represented in
Pig.31.
WAVE NUMBER Ccm-1}
Figure 31. Infrared reflectivity of ZnSe with <vl X S.
The real and imaginary parts of the dielectric constant deduced
by the Kramers-Krönig analysis are desployed in Pig.32.
Zn5t*vl%5
100
E*-n».K*. C*»2nK.
(I imClL3
fHi)
l
200 300 WAVE NUMBER Ccm-'3
Figure 32. Dielectric constants of ünSe with ^1 2 S,
::?;. *■> : S^%J^
"^"
47
The normal mode frequencies for £he undoped crystal are üL0 = 252 cm ', WT0 = 2C'2 cm ' and for the S doPed tiie local mode frequencies are <üjT° = 297 cm"1 and u^10-505.5 cm"1.
The line width which is function of the concentration is in this
case (~1# S) Au = 22 cm" and the relative line broadening is AU/OJ =
0.074.
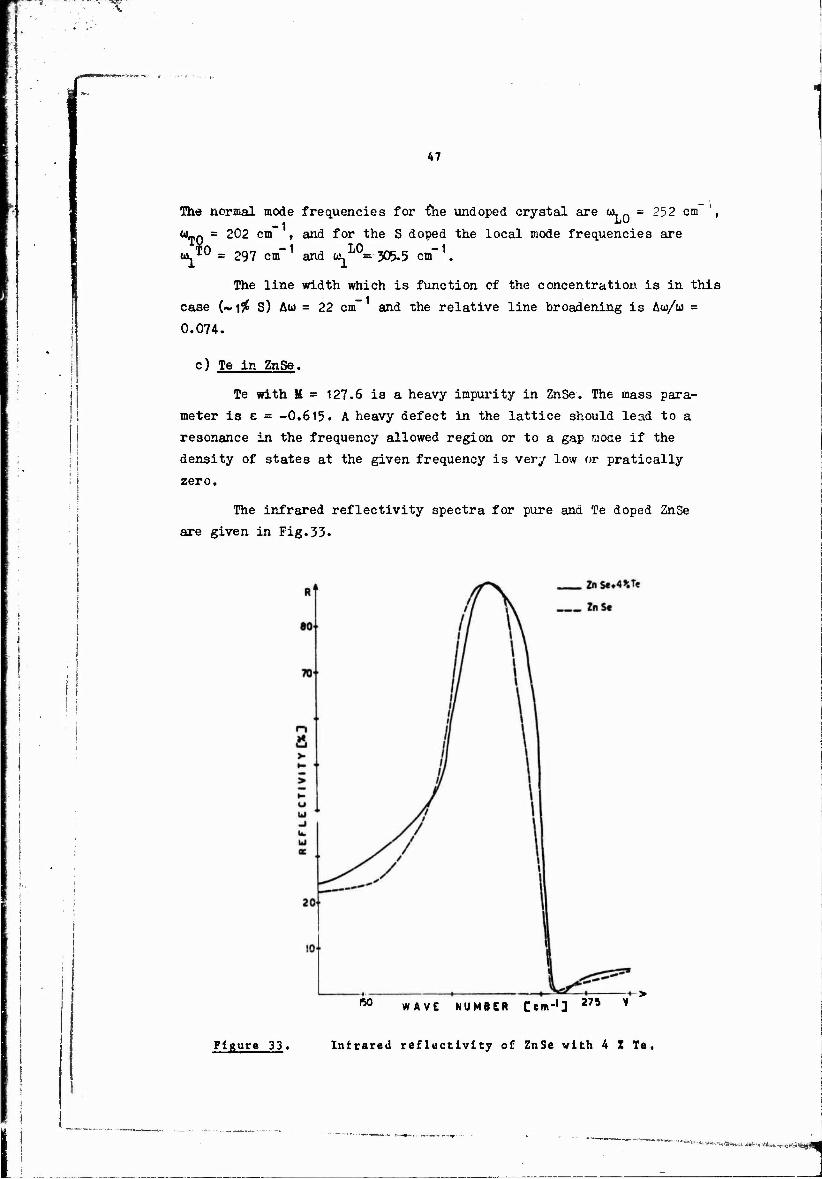
c) Te In ZnSe.
Te with M = 127.6 is a heavy impurity in ZnSe. The mass para-
meter is e = -0.615. A heavy defect in the lattice should lead to a
resonance in the frequency allowed region or to a gap mode if the
density of states at the given frequency is very low or pratically
zero.
The infrared reflectivity spectra for pure and Te doped ZnSe
are given in Fig.33.
50 WAVE NUMBER Ccm-'} 275 *
Figure 33, Infrared reflectivity of ZnSe with 4 X Te,
■;•'-=*.<.-.>, *■»; :*.^„rt -^.üt&i^gU
48
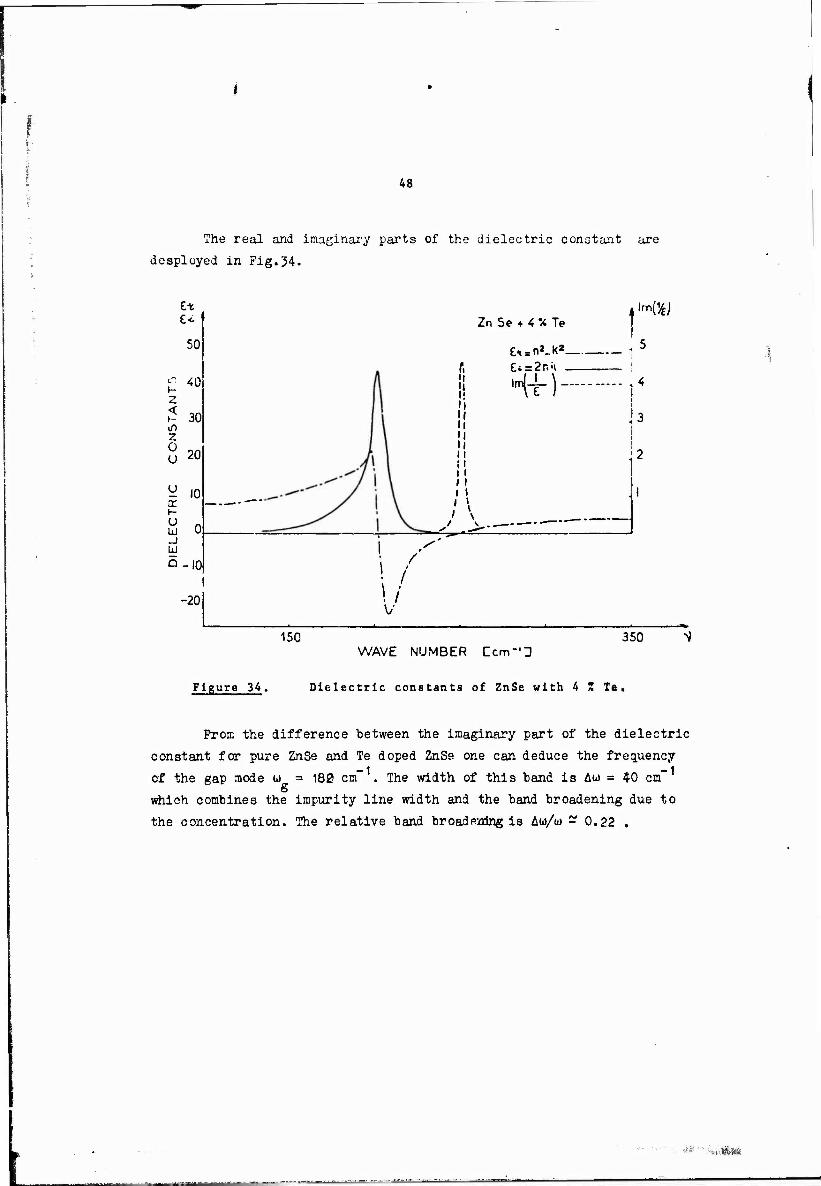
The real and imaginary parts of the dielectric constant are
desployed in Fig.34-
£< t
50
40 h- Z <
30 if) Z 0 u 20
u 10 X
u Id 0 _l UJ D -10
Zn Se + 4 % Te i%)
(S ll
I! it
!! M II 11 H i i I l i I
Hf)~
-20
/
/ ! /
i4
I
]3 I i
2
I
150 350 WAVE NUMBER Ccm-'D
Fl_gure_34. Dielectric constants of ZnSe with 4 Z Te.
Prom the difference between the imaginary part of the dielectric
constant for pure ZnSe and Te doped ZnSe one can deduce the frequency
of the gap mode u) = 182 cm -1 -1 The width of this band is Au> = 40 cm
which combines the impurity line width and the band broadening due to
the concentration. The relative band broadening is Au>A> - 0*22 .
4» "-,-,.; ftjia
r 49
7. Discussion.
• |
In spite of the considerable amount of work presently under way
in the lattice dynamics of the II-VT compounds and the considerable
progress it still remains much to be done.
The dispersion relations for CdS have teen calculated in terms
cf an extremely simplified model whose physical significance remains
to be explicited. Although the first results are satisfactory and the
eigenvalues and eigenfunctions have served as basis for the calculation
of the local mode frequencies which are in good agreement with the
experiment, it is certainly suitable t< improve this model including
physical parameter such as the electron polarizability of the ions.
The calculated double-phonon density of states do not allow a direct
comaprison with the two-phonon optical spectra in the whole
spectral range. Such a descrepency should be understood eather in
terms on unsatisfactory physical implications in the calculation of
the frequency distribution curve or in terms of second order matrix
elements for optical transitions employing more than two particles.
The qualitative features of the normal mode spectra are well
understood and the spectral measurements give satisfactory quantita-
tive data for those modes which are coupled to the radiation field
at the appropriate points of the Briilouin zone which are eather the
center or high symmetry edges.
Studies on thin films have proved to be extremely useful far
the experimental determination of the normal mode frequencies.
Surface modes are still to be seen experimentally.
Elementary calculations using Green function technics and
assuming isotopic substitution without force constant changes have
proved to be an extremely useful guide in the discussion of the
experimentally determined localized modes due to impurities. The
orders of magnitude calculated even in drastic assumptions coincide
very closely to with the experimentally measured values. The reason
ia probably the fact that the calculated density of states obtained
in a very rough model which is used for the calculation of the local-
ized modes frequencies is insensitive to 3light changes in force con-
tents when an ion is replaced with a similar ion from the same groups.
Only an improved initial model may lead to results more sensitive on
subtile force constant changes produced by the substitution of analog-
ous ions.
50
The first measured localized mode frequencies in II-VI compounds 21
are those concerning the Li doped ZnSe and CdS . In the case of CdS
doped with Li anormally large bands have been observed and attributed 7 -1 6 -' to the presence of Li at 457 cm and Li at 474 cm .
If Li wa3 substituting Cd atom the mass difference parameter 7 ft
would be e = 0.938 for Li and t = 0.946 for Li , this would give in
tha simplest approximation of isotcpic mast- substitution for the
localized mode frequency of the impurity atom vibration along the c
axis the following values s
7 -1 for Li , Wp. = 492 cm ,
for Li , wr. = 503 cm
The calculated values are larger than that observed experiment-
ally there would indicate that Li interacts stronger with the host
lattice than a simple mass defect. A change of force constant v/ould
explain tbia difference. Increase in the deviation of force constant
from the host lattice force constant acts in the same direction as a
reduction of mass i.e. increase of the localized mode frequency.
The presence of 5 in CdSe crystals introduces a mass defect
parameter e = 0.595 and hence
top = 244 cm" , Wjv = 255 cm"
Experimentally two peaks are observed at 266.5om~ and 269 cm" at
room temperature. The calculated values now are smaller than the ob-
served ones. This discrepency could be also attributed to a change
in force constant where Se is replaced by S,in this case the substi-
tution would means a decrease of force constant.
The j.ine 'width is of the order of 4 cm" and the relative line
width &w/w ig O.O15 which is of the order of magnitude for relative
broadening 2' of the defect mode frequency when AID describes the
broadening due to anharmonic interaction of an optical spectral line
involving the vibracional energy of tha local mode.
A temperature line shift is observed of the order of 3 cm"
between 25°K and J00°K.
In the case of Li doped CdTe an absorption band is observed -1 centered at 270 cm which could be attributed to localized modes due
to the presence of Li but whose interpretation is difficult for many
reasons a i particularly because of the band width which is of the
order of 35 cm" and does not seem to vary considerably with temper-
ature. The relative band width Aui/w here is 0.130 what is by a factor
of 10 larger than what would be expected in the case of single subs-
titutional impurity vibrations.
.Vi-.'.ivsfe».;;,;:*
ujiiiLu ii» pHipn
i
51
The essential contribution to the residual line width when
T - 0 comes from the contribution of the spontaneous decay of the
excited localized vibrations into bana modes. In this process the
energy conservation principal J3 % ~ u should be respected. In the
case of Li in CdTe, as well as in the other cases we have examined
here, u \ 2 u , consequently the decay of a localized mode into two-
band modes, is possible through the third order anharmonic potential
and this decay eould be the dominant process at room temperature 26,27
In order to understand the possibility to obtain optically
transparent CdTe with relatively high concentration of li we had to
suppose that at low concentration Li is donor and at high concentra-
tion gives rise to acceptor levels. This leads to the possibility of
an almost complete compensation for a given concentration of dopant.
The interaction of an interstitial atom with the lattice is not the
same as that on a substitutional impurity. It is therefore clear
that although the mass is the same due to changes inthe force con-
stant the frequencies of the localized modes should be different for
the two situations. One should in such a case observe two absorption 6 7
peaks. In addition Li has two isotopes Li and Li constituting each
one a mass defect and therefore giving rise to an absorption band each.
All these are reasons to believe that the large band at 270 cm"
contains a certain number of peaks remaining to be resolved in the
simplest case.
Experiments are now undertaken at different concentrations of
Li in order to further investigate this situation.
The presence of Se in CdTe leads to a typical localized mode
whose frequency deduced from the Kramers-Krönig analysis of the re-
flectivity spectrum inii = 170 cm" whereas the calculated value -1
with the appropriate normal mode frequency scaling is u. = 167 cm .
The presence of impurities at relatively high concentration seems to
have an effect on the longitudinal mole frequency which is expressed
by a slight shift of the normal mode frequency w Q is now 162 cm"
and a longitudinal part to the local mode frequency appears at 180
cm- . At high impurity concentration one can therefore define a trans- TO -1
verse and a longitudinal part for the local mode uu = 170 cm and
a,h = 130 cm" the calculated value for the local mode frequency is ■*■ _ i
within these limits .• w. = 167 cm
Analogous situation has been formed in ZnSe doped with S where
the calculated value ux, = 297 cm" is within the limits of that ob-
tained experimentally : OL = 297 cm" and w. = 30^5 cm" .
, A*,*, <* *tw**»we*^H.jiw>^.«*$^
52
Gap modes or band resonances have also been observed in the
case of heavy impurities as for example 7e in ZnSe where a = 182 cm"
has been deduced from the analysis of the reflectivity spectra.
' A quite complete investigation on the effec ;s of heavy doping
i has been carried in the case of the system CdSe-S. For Cd3 containing
\ low concentration of Se the dopant acts as a heavy impurity and gives
a gap mode at ui = 180 cm" . The increase of the 3e concentration
brings up two constituants of the u> band having respectively the LO ° TO character of a longitudinal to and a transverse mode w . The fre-
LO TO * ® quencies u> and u are linearly dependent on the impurity concen- g g
tration and tends toward the normal modes frequencies of CdSe at tne
; high concentration limit.
S in CdSe gives two localized modes t^(r )= 266.5 cm" and
üLCTJ-) = 269 cm whose frequencies are also concentrations dependent
and reach at high S concentration the normal modes frequencies for CdS.
It seems experimentally that we have a continuous relation
between localized and normal modes frequencies depending on concentra-
tion. It will be highly interesting to undersee theoremoally such a
continuous relation when we pass from a perfect lattice to a desorder-
ed system.
8. Conclusion.
The discussion of lattice dynamics of II-VI compounds is quite
general and interesting in one of the fact that the bonding spanes
the whole range from covalent to ionic. A complete calculation of the
dispersion relations is now available based on a simple model in which
short range forces simulate covalent band contribution and Coulomb
forces are functions whose origin is the ionic nature of the bounding.
The parameters used in the calculation are plotted with the optically
measured normal modes frequencies at the center of the Brillouin zone.
The calculated phonon frequencies of the edge of the Brillouin zone
in the principal symmetry directions compares well with the experiment-
al values.
;!*#*■*«* A*
IPflB
'-l<
53
Analysis of the coupling of the radiation field with the phonon
field is developed in the frame of a macroscopic theory which account
well for all the experimental situations. Measurements in blende and
wurtzite structures are consistently analysed.
It is shown that numerous arbitrary assignments in the multi-
phonon optical spectra can be easily erroneous because while it is
clear that critical points in the combined density of states give rise
to absorption band it is not necessary that this critical point cor-
responds to critical point in the single phonon density of states. In
order to have a critical point in the combined two-phonon density of
states the condition grad w(q) = 0 can be satisfied also when
grad <D(^) = * grad u(^) which corresponds to equal and opposite of
sign slops in the two-phonon branches. It is then cl'ar that the only
correct assignments will come from the comparison of the optical ab-
sorption spectra with the calculated density of states when the dis-
persion relations are known. An example concerning CdS is given here.
The introduction of imperfections in the crystal depending on
the impurity mass gives rise to localized modes, to resonances or to
gap modes. The examen of a certain number of systems has shown that
at high impurity concentration the localized as well as the gap modes
give rise to a restrahTen band in the reflectivity spectra which sub-
mitted to a Kramers-Krönig shows contributions having transverse op-
tical and longitudinal optical characters. With the increase of con-
centration and forming the ternaryalloy& the frequencies of these two
parts depart from each other and at about 50$ in, the concentration
reach the values of the normal modes frequencies of the system. This
frequency shift seams to be linear with concentration and offers an
interesting feature in the study of the transition from perfect crystal
with low impurity ccncentasctlai to the disordered ternary system.
With the development of the investigations of the dispersion
relations of perfect crystals we hope to see also further studies con-
cerning the disordered alloys.
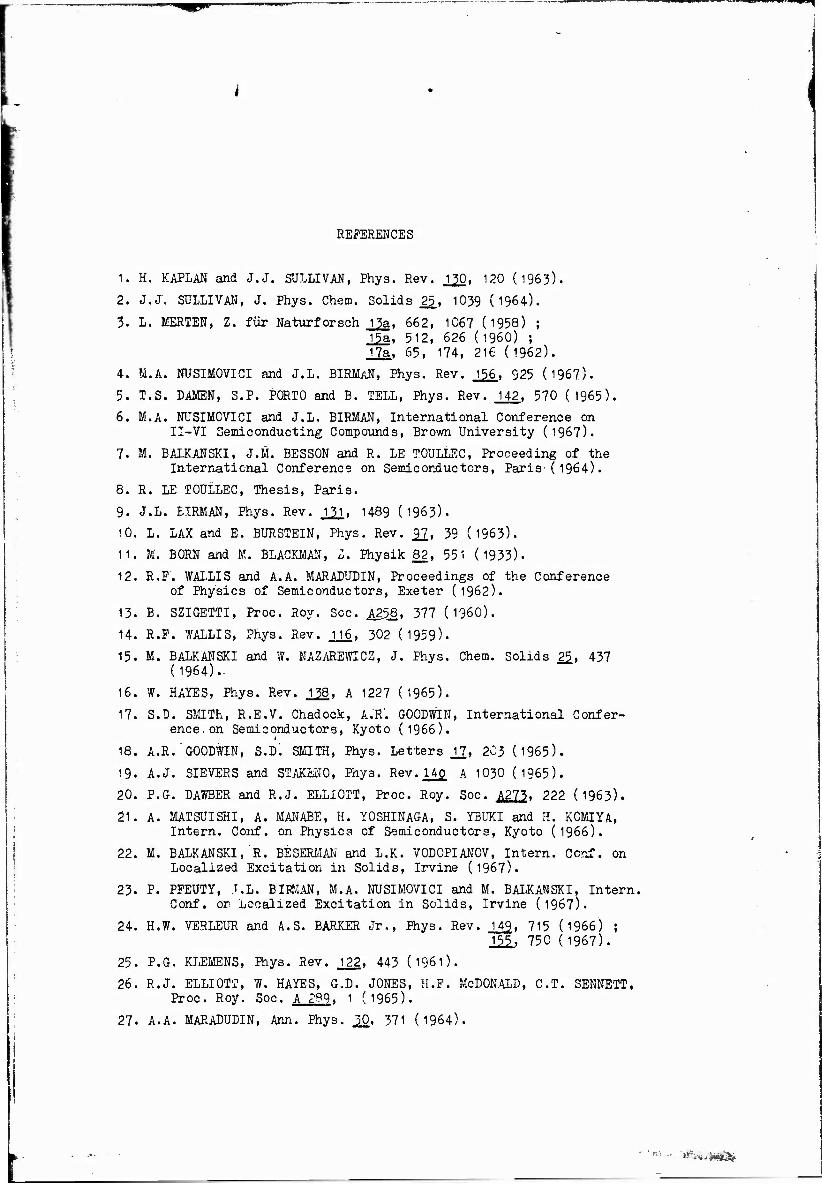
REFERENCES
1. H. KAPLAN and J.J. SULLIVAN, Phys. Rev. .JJ50, 120 (1963).
2. J.J". SULLIVAN, J. Phys. Chem. Solids 22» 1039 (1964).
3. L. MERTEN, Z. für Naturforech 13a, 662, 1Ö67 (1958) ; 15a, 512, 626 (i960) ; 17a, 65, 174, 216 (1962).
4. M.A. NUSIMOVICI and J.L. BIRMAN, Phys. Rev. 156, 925 0967).
5. T.S. DAMEN, S.P. PORTO and B. TELL, Phys. Rev. 142. 570 (1965).
6. M.A. NUSIMOVICI and J.L. BIRMAN, International Conference on II-VI Semiconducting Compounds, Brown University (1967).
7. M. BALKANSKI, J.M. BESSON and R. LE TOULLEC, Proceeding of the International Conference on Semiconductors, Paris-(1964).
8. R. LE TOULLEC, Thesis, Paris.
9. J.L. EIRMAN, Phys. Rev. V£, 1489 0963).
10. L. LAX and E. BUR3TEIN, Phys. Rev. £7, 39 0963).
11. M. BORN and M. BLACKMAN, Z. Physik 82, 551 (1933).
12. R.F. WALLIS and A.A. MARADUDIN, Proceedings of the Conference of Physics of Semiconductors, Exeter (1962).
13. B. SZIGETTI, Proc. Roy. Sec. A25J3, 377 (i960).
14. R.P. WALLIS, Phys. Rev. _n6, 302 (1959)-
15. M. BALKANSKI and W. NAZAREWICZ, J. Phys. Chem. Solids 25_, 437 0964).-
16. W. HAYES. Phys. Rev. JJ>8, A 1227 0965).
17. S.D. SMITh, R.E.V. Chadock, A.R. GOODWIN, International Confer- ence on Semiconductors, Kyoto (1966).
18. A.R.GOODWIN, S.D. SMITH, Phys. Letters JJ, 2C3 (1965).
19. A.J. SIEVEES and STAKMO, Phys. Rev.H£ A 1030 (1965).
20. P.G. DAWBER and R.J. ELLIOTT, Proc. Roy. Soc. A273. 222 (1963).
21. A. MATSUISHI, A. MANABE, H. YOSHINAGA, S. YBUKI and H. KOMIYA, Intern. Conf. on Physics of Semiconductors, Kyoto (1966).
22. M. BALKANSKI, R. BE5ERMAN and L.K. VODOPIANOV, Intern. Conf. on Localized Excitation in Solids, Irvine 0967).
23. P. PPEUTY, .T.I. BIPKAN, M.A. NUSIMOVICI and M. BALKAN SKI. Intern. Conf. or Localized Excitation in Solids, Irvine (1967).
24. H.W. VERLEUR and A.S. BARKER Jr., Phys. Rev. J4^, 715 0966) ; 155, 750 (1967).
25. P.G. KLEMENS, Phys. Rev. .122, 443 0961).
26. R.J. ELLIOTT, W. HAYES, G.D. JONES, H.P. McDONALD, CT. SENNETT, Proc. Roy. Soc. A 289, 1 0965).
27. A.A. MARADUDIN, Ann. Phys. ^0, 371 0964).
'tfSft
m^mmmm—*
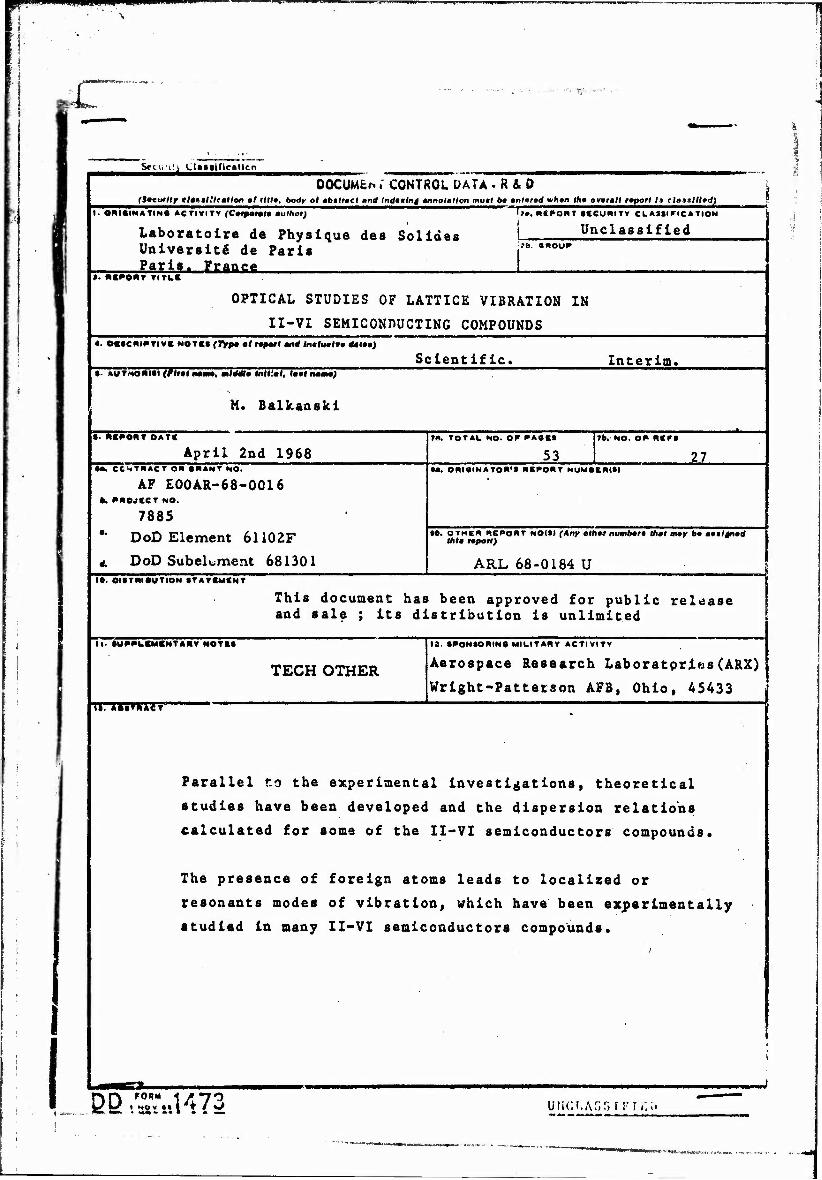
Sectiuij Cl«t»ific«llcn
DOCUMtM' CONTROL DATA . R & 0 (Strut I ly tlattlHettton ol Hit», body of «bilf.cl «nrf Indtnlng annotation mutt 6« «nf»f«d whrnn In» ovwrall r«poff li claatlllad)
I?». RCPORT SECURITY CLASSIFICATION
Unclassified I. ORIGIN» TthO ACTIVITY fCorporat« author)
Laboratoire de Physique des Solides University de Paris P»?jf» France
?t». GROUP
»• REPORT TITLK
OPTICAL STUDIES OP LATTICE VIBRATION IK
II-VI SEMICONDUCTING COMPOUNDS 4. OESCRIPTIVE MOTH (Trp* 0/ report and incfml»« iatam)
Scientific. ■■ »UTMORIStfr'iMln««., ÜÜ733S Mtt;«(, (a.t IMMMJ
M. Balkanski
• ■ »«»OUT DATI ""~"—-
Interim.
April 2nd 1968 7«. TOTAL NO. OP PAS.CS
53 7b. NO. OP- MFI
27 M. CC^TRACT OW «KANT NO.
A? EOOAR-68-OC16 *. »HOJICT NO.
7885
* DoD Element 61102F
A DoD Subeltment 681301
M. ORIOINATOR'S REPORT NUMBKNlS)
•b. OTHER REPORT NOItt (Any olhmr numbara that may b. aaitgnad thia raport)
ARL 68-0184 U I«. DISTRIBUTION ITATIMtNT
This document has been approved for public release and sale ; its distribution is unlimited
11 »UPPLSMENTAP.V NOT!»
TECH OTHER
{,. Afci»RACT
13. SPONSORING MILITARY ACTIVITY
Aerospace Research Laboratories(ARX)
Wright-Patterson AFB, Ohio, 45433
Parallel to the experimental investigations, theoretical
studies have been developed and the dispersion relations
calculated for some of the II-VI semiconductors compounds.
The presence of foreign atoms leads to localized or
resonants modes of vibration, which have been experimentally
studied in many II-VI semiconductors compounds.
BB ..«""«1473 uticr./vnrnFTr,;»
r|'i*»*;!ffll.WM9^:i rf'.tn
11*41 win. muwmmmmmm r~* il !l i. i| WjP.W4. k
UNCLASSIFIED Security Classification
|u. KEY WORDS
LINK A MHK B LINK C
ROLE IvV p"<«LE WT ROLE WT
No
UNCLASSIFIED
Security Ciasnification
END