2000 JME (51)278-285
8
Ancyromonadida: A New Phylogenetic Lineage Among the Protozoa Closely Related to the Common Ancestor of Metazoans, Fungi, and Choanoflagellates (Opisthokonta) Michael S. Atkins, 1 Andrew G. McArthur, 2 Andreas P. Teske 1 1 Biology Department MS 33, Woods Hole Oceanographic Institution, Woods Hole, MA 02543, USA 2 The Josephine Bay Paul Center for Comparative Molecular Biology and Evolution, Marine Biological Laboratory, Woods Hole, MA 02543-1015, USA Received: 27 March 2000 / Accepted: 12 June 2000 Abstract. Molecular and morphological evidence points to the ancyromonad Ancyromonas as a plausible candidate for the closest relative to the common ancestor of metazoans, fungi, and choanoflagellates (the Opistho- konta). Using 18S rDNA sequences from most of the major eukaryotic lineages, maximum-likelihood, mini- mum-evolution, and maximum-parsimony analyses yielded congruent phylogenies supporting this hypoth- esis. Combined with ultrastructural similarities between Ancyromonas and opisthokonts, the evidence presented here suggests that Ancyromonas may form an indepen- dent lineage, the Ancyromonadida Cavalier-Smith 1997, closer in its relationship to the opisthokonts than is its nearest protist relatives, the Apusomonadida. However, the very low bootstrap support for deep nodes and hy- pothesis testing indicate that the resolving power of 18S rDNA sequences is limited for examining this aspect of eukaryotic phylogeny. Alternate branching positions for the Ancyromonas lineage cannot be robustly rejected, revealing the importance of ultrastructure when examin- ing the origins of multicellularity. The future use of a multigene approach may additionally be needed to re- solve this aspect of eukaryotic phylogeny. Key words: Protozoa — Flagellate — Ancyromo- nas — Apusomonas — Opisthokont — 18S small sub- unit ribosomal DNA — Phylogeny Introduction Animals and true fungi, along with their protist relatives, the choanoflagellates and chytrids, comprise the largest major eukaryotic lineage, with over 1 million species (Patterson 1999). Together, and exclusive of green plants, this group was hypothesized to form a single clade, the Opisthokonta, based on shared ultrastructural characteristics (Cavalier-Smith and Chao 1995). These characteristics include the presence of a unicellular mo- tile stage (sperm in the case of animals) bearing a single posterior flagellum, similarities in flagellar root structure between choanoflagellates and chytrids (Cava- lier-Smith 1987), and flattened mitochondrial cristae (Cavalier-Smith and Chao 1995). This hypothesis has found strong support from molecular research with the discovery of an insertion in the amino acid sequence of protein synthesis elongation factor 1a (EF-1a), shared exclusively by animals and fungi (Baldauf and Palmer 1993), and in the molecular phylogenies of ribosomal RNAs (Van de Peer and De Wachter 1997; Wainright et al. 1993), actin, a-tubulin, b-tubulin, and EF-1a proteins (Baldauf 1999), and other protein phylogenies (Nikoh et al. 1994). Recent molecular evidence also suggests that the Opisthokonta should include the Myxospora (previ- ously considered a group of protozoa) as a subgroup within the Cnidaria (Smothers et al. 1994) and the Mi- crospora as close relatives to the fungi (Hirt et al. 1999; Roger 1999). While all opisthokonts have origins among the proto- zoa, it is uncertain whether these origins are mono- or Correspondence to: Michael S. Atkins; e-mail: [email protected] J Mol Evol (2000) 51:278–285 DOI: 10.1007/s002390010089 © Springer-Verlag New York Inc. 2000
-
Upload
michael-atkins -
Category
Documents
-
view
299 -
download
0
Transcript of 2000 JME (51)278-285
Ancyromonadida: A New Phylogenetic Lineage Among the Protozoa CloselyRelated to the Common Ancestor of Metazoans, Fungi, andChoanoflagellates (Opisthokonta)
Michael S. Atkins,1 Andrew G. McArthur, 2 Andreas P. Teske1
1 Biology Department MS 33, Woods Hole Oceanographic Institution, Woods Hole, MA 02543, USA2 The Josephine Bay Paul Center for Comparative Molecular Biology and Evolution, Marine Biological Laboratory,Woods Hole, MA 02543-1015, USA
Received: 27 March 2000 / Accepted: 12 June 2000
Abstract. Molecular and morphological evidencepoints to the ancyromonadAncyromonasas a plausiblecandidate for the closest relative to the common ancestorof metazoans, fungi, and choanoflagellates (the Opistho-konta). Using 18S rDNA sequences from most of themajor eukaryotic lineages, maximum-likelihood, mini-mum-evolution, and maximum-parsimony analysesyielded congruent phylogenies supporting this hypoth-esis. Combined with ultrastructural similarities betweenAncyromonasand opisthokonts, the evidence presentedhere suggests thatAncyromonasmay form an indepen-dent lineage, the Ancyromonadida Cavalier-Smith 1997,closer in its relationship to the opisthokonts than is itsnearest protist relatives, the Apusomonadida. However,the very low bootstrap support for deep nodes and hy-pothesis testing indicate that the resolving power of 18SrDNA sequences is limited for examining this aspect ofeukaryotic phylogeny. Alternate branching positions forthe Ancyromonaslineage cannot be robustly rejected,revealing the importance of ultrastructure when examin-ing the origins of multicellularity. The future use of amultigene approach may additionally be needed to re-solve this aspect of eukaryotic phylogeny.
Key words: Protozoa — Flagellate —Ancyromo-nas — Apusomonas— Opisthokont — 18S small sub-unit ribosomal DNA — Phylogeny
Introduction
Animals and true fungi, along with their protist relatives,the choanoflagellates and chytrids, comprise the largestmajor eukaryotic lineage, with over 1 million species(Patterson 1999). Together, and exclusive of greenplants, this group was hypothesized to form a singleclade, the Opisthokonta, based on shared ultrastructuralcharacteristics (Cavalier-Smith and Chao 1995). Thesecharacteristics include the presence of a unicellular mo-tile stage (sperm in the case of animals) bearing asingle posterior flagellum, similarities in flagellar rootstructure between choanoflagellates and chytrids (Cava-lier-Smith 1987), and flattened mitochondrial cristae(Cavalier-Smith and Chao 1995). This hypothesis hasfound strong support from molecular research with thediscovery of an insertion in the amino acid sequence ofprotein synthesis elongation factor 1a (EF-1a), sharedexclusively by animals and fungi (Baldauf and Palmer1993), and in the molecular phylogenies of ribosomalRNAs (Van de Peer and De Wachter 1997; Wainright etal. 1993), actin,a-tubulin,b-tubulin, and EF-1a proteins(Baldauf 1999), and other protein phylogenies (Nikoh etal. 1994). Recent molecular evidence also suggests thatthe Opisthokonta should include the Myxospora (previ-ously considered a group of protozoa) as a subgroupwithin the Cnidaria (Smothers et al. 1994) and the Mi-crospora as close relatives to the fungi (Hirt et al. 1999;Roger 1999).
While all opisthokonts have origins among the proto-zoa, it is uncertain whether these origins are mono- orCorrespondence to:Michael S. Atkins;e-mail: [email protected]
J Mol Evol (2000) 51:278–285DOI: 10.1007/s002390010089
© Springer-Verlag New York Inc. 2000
polyphyletic. Some have argued for independent evolu-tion of specific taxa, especially among the metazoa(Harbison 1985; Wilmer 1990), but many lines of evi-dence appear to favor monophyletic origins for opistho-konts (Baldauf 1999; Van de Peer and De Wachter1997). One intriguing hypothesis posits that mitochon-drial cristal morphology delineates large groups of or-ganisms (Cavalier-Smith 1997; Taylor 1976; Taylor1978), including the opisthokonts, of which all are platy-cristate (Cavalier-Smith and Chao 1995; Patterson 1999).With rare exceptions (e.g., among trypanosome life-history stages which alternate between discoid and tubu-lar and in the mitochondria of mammalian adrenal cortexcells which are tubulo- rather than platycristate), cristalmorphology appears to be highly conservative amongand strikingly characteristic of groups of eukaryotic taxa.Based on this hypothesis, Wainright et al. (1993) pre-dicted that the hypothetical protist representing the mostrecent common ancestor to the opisthokonts would haveflattened mitochondrial cristae and other taxon-definingultrastructural characteristics. A recent molecular analy-sis of 18S rDNA sequences from several species offlagellates isolated from deep-sea hydrothermal vents re-vealed thatAncyromonas,a flagellate with platycristatemitochondria, is related to the common ancestor of theopisthokonts (Atkins et al. 2000). The current paperpresents the phylogenetic position ofAncyromonas sig-moides based on maximum-likelihood, minimum-evolution, and maximum-parsimony analyses of 18SrDNA sequences from the major crown group lineages.
Materials and Methods
DNA Isolation, PCR, and Sequencing. Ancyromonas sigmoidesKentstrain ATCC50267 (Fig. 1) was grown to a high density ($106 cells/ml) in seawater media (sterilized Vineyard Sound Seawater, 0.01%yeast extract,Halomonas halodurensbacteria as prey), then filteredover Millipore 2.0-mm TTTP isopore membrane filters (Catalog No.TTTP04700) to remove bacteria and PCR-inhibiting substances.Nucleic acids were isolated by hot phenol extraction: cells bound onindividual filters were incubated in 500ml lysis buffer (10 g sucrose, 2ml 1 M Tris, pH 8.0, brought up to 40 ml with MQH2O), 75 ml 10%SDS, and 25ml proteinase K (20 mg/ml) for 1 h at65°C, then 600mlhot (65°C) phenol:chloroform:isoamyl alcohol (25:24:1) (Tris equili-brated to pH 8.0) was added and incubation proceeded at 65°C for anadditional 5–10 min. Continued phenol extraction and precipitation ofgenomic DNA were performed as described by Treco (1987).
Amplification of small subunit ribosomal (18S) DNA from DNAextracts was performed using standard polymerase chain reaction(PCR) protocols and general PCR primers A and B (Medlin et al.1988). The standard protocol included a hot start at 95°C for 5 min andcontinued with 35 cycles of denaturation at 94°C for 1 min, annealingat 55°C for 45 s, and extension at 72°C for 2 min, concluded by a finalextension at 72°C for 10 min. PCR product was column-purified usinga Wizard PCR Prep (Promega, Madison, WI) following the manufac-turer’s protocols and sequenced directly on an ABI 377 automatedsequencer using fluorescence-labeled sequencing dideoxyoligonucleo-tides. Internal sequencing primers (primer 514F, 58-GTG CCA GCASCC GCG G-38; primer 920F, 58-GAA ACT TAA AGR AAT TG-3 8;primer 690R, 38-S TCT CCA CTT TAA GAA-58; and primer 1055R,
38-CC ACC ACG TAC CGG CRA-58) and flanking primers A and Bwere used to generate overlapping sequence contigs which covered thelength of the 18S rDNA gene in both the 38 and the 58 directions.Overlapping sequence contigs were aligned and assembled using theAssemblyLIGN application within the MacVector Sequence AnalysisProgram (version 6.5; Oxford Molecular Limited). The sequence wasdeposited in GenBank under the accession number AF174363 (Atkinset al. 2000).
Database Search and Phylogenetic Analysis.Phylogenetically rel-evant 18S rRNA sequences were obtained for species representingmost of the major “crown group” eukaryotes and euglenozoan flagel-lates. Initial alignments obtained with ClustalW (Thompson et al. 1994)were edited manually based on eukaryotic secondary structure consen-sus (Van de Peer et al. 1997). In the final analyses, regions which didnot allow an unambiguous sequence alignment were excluded. Theseincluded motifs and helices whose length differed considerably be-tween different phyla and sequences in the alignment: the variableregion between helix 8 and helix 9, the tip of helix 10, the distal halvesof helices E10-1 and 11, the unpaired distal loop of helix 17, thecomplete helices E23-1 and 23-2, the tetraloop of helix 23-7, the un-paired distal loop of helix 29, the distal half of helix 43, the unpaireddistal loop of helix 44, and the unpaired region connecting helices 45and 46. Incompletely sequenced terminal regions of the 18S rRNAgene (helices 1–4, 49, 50) also were excluded from the alignment (Vande Peer et al. 1997). After masking these regions (655 alignment po-sitions), the residual sequence alignment used in phylogenetic analyses(available upon request) included 1455 nucleotide positions.
Phylogenetic analyses were performed using maximum-parsimony,minimum-evolution and maximum-likelihood optimality criteria as
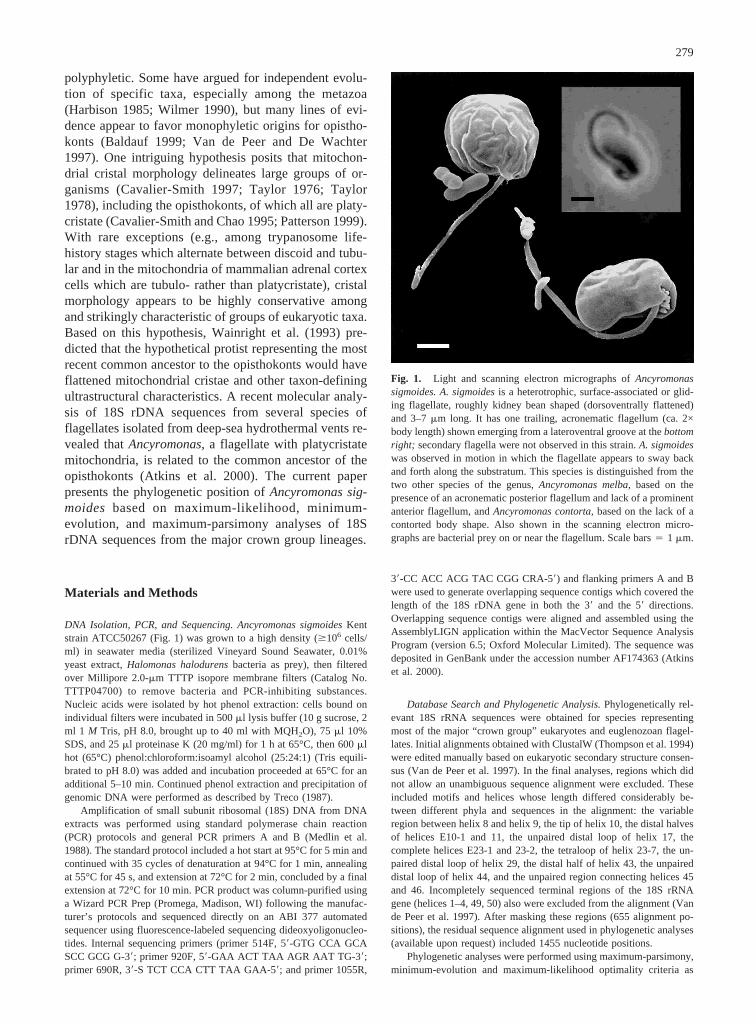
Fig. 1. Light and scanning electron micrographs ofAncyromonassigmoides. A. sigmoidesis a heterotrophic, surface-associated or glid-ing flagellate, roughly kidney bean shaped (dorsoventrally flattened)and 3–7mm long. It has one trailing, acronematic flagellum (ca. 2×body length) shown emerging from a lateroventral groove at thebottomright; secondary flagella were not observed in this strain.A. sigmoideswas observed in motion in which the flagellate appears to sway backand forth along the substratum. This species is distinguished from thetwo other species of the genus,Ancyromonas melba,based on thepresence of an acronematic posterior flagellum and lack of a prominentanterior flagellum, andAncyromonas contorta,based on the lack of acontorted body shape. Also shown in the scanning electron micro-graphs are bacterial prey on or near the flagellum. Scale bars4 1 mm.
279
performed by the computed program PAUP 4.0b2 (Swofford 1999). Toobtain a sample of many equally parsimonious local minima, parsi-mony analyses were performed using 300 random-addition replicateswith tree–bisection–reconnection (TBR) branch swapping and restric-tion to a maximum of 20 trees per replicate. Since this random-additional approach would not find all equally parsimonious trees butinstead a sample of each local minimum, the shortest nonidenticaltrees found were then subjected to further TBR swapping to find allequally or more parsimonious trees. Initial sampling of local minima inthis manner saves computation time by avoiding complete swapping ofpossibly identical topologies found in different random-addition repli-cates. Bootstrapping of parsimony analyses used 1000 bootstrapreplicates of 10 random-addition replicates each. Heuristic searchesunder the minimum evolution criterion were performed using 1000random-addition replicates with TBR branch swapping. Bootstrappingof minimum-evolution analyses used 1000 bootstrap replicates of 10random-addition replicates each. Heuristic searches under the maxi-mum-likelihood criterion were performed using five random-additionreplicates with TBR branch swapping. Bootstrapping of maximum-likelihood analyses used 100 bootstrap replicates of 1 random-additionreplicate each. Models for use in minimum-evolution and maximum-likelihood searches were chosen using the likelihood-ratio test (LRT) inthe Modeltest program version 2 (Posada and Crandall 1998) (Table 1).In maximum-likelihood analyses, models, their parameters and likeli-hood scores were initially estimated from the most parsimonious treetopologies. In case substitution dynamics may have severely misledparsimony, models and parameters were then reestimated from the besttrees found under the initial likelihood criteria and the likelihood searchwas repeated. The significance of differences in likelihood among dif-
ferent topologies was examined using the test of Kishino and Hasagawa(1989) as implemented in PAUP (Table 2).
Results and Discussion
To examine the phylogenetic position ofAncyromonas,we included the lineages of the Opisthokont clade (ani-mals, DRIPs, choanoflagellates, and fungi) and the eu-karyotic sister lineages basal to this clade, all of whichconstitute the “crown group.” We use this term as short-hand for the dense clustering of protist and plant lin-eages near the animal–fungal divergence that includesthe stramenopiles, alveolates, green plants, green algae,red algae, cryptomonads, coccolithophores, and thechlorarachniophyte lineage (Van de Peer and DeWachter 1997). Sequences of known unstable phyloge-netic position (Acanthamoeba, Hartmanella) were ex-cluded from the final analysis, after initial heuristicsearches and bootstrap runs had shown that these organ-isms are not related toApusomonasand Ancyromonas.Acanthamoeba,for example, was shown to branch offthe Opisthokont clade in one analysis (Wainright et al.1993), and in another it was suggested that bothAcan-thamoebaand Hartmannella branch together off theplant lineage (Weekers et al. 1994).
The best maximum-likelihood tree (Fig. 2A) and thebest minimum-evolution tree (Fig. 2B) consistently placeAncyromonas sigmoidesclosest to the basal node of ani-mals, DRIPs, choanoflagellates, and fungi. Here, itshares a common node withApusomonas proboscoidea,with low bootstrap support (30 ML/44 ME/40 MP). Par-simony analysis separatesAncyromonasand Apusomo-nas into two distinct lineages that are intertwined withthe green plants, red algae, cryptomonads, and hapto-phytes; bootstrap does not support a specific branchingorder among these groups (Fig. 2C). The main lineagesof the opisthokonts and the crown group remain mutuallyexclusive in all three trees and always show a high boot-strap support of over 80%. The shared node ofApusomo-nas and Ancyromonasin the maximum-likelihood andminimum-evolution tree does not have this strong boot-strap support and is also not retrieved by parsimonyanalysis. A conservative interpretation of the sequencedata holds thatAncyromonasandApusomonasform phy-
Table 2. Results from Kishino–Hasagawa (1989) tests comparing different trees under maximum likelihooda
Tree −ln likelihood Difference SD t value P valueNullhypothesis
1 17251.26452 Best2 17269.89549 18.63096 15.59707 1.1945 0.2325 Cannot reject3 17262.09868 10.83416 12.83096 0.8444 0.3986 Cannot reject
a Tree 1 is the very best maximum-likelihood tree shown in Fig. 2A; tree 2 used the same data but constrainedAncyromonasandApusomonastobe within the Cercomonad clade; tree 3 enforced separation ofAncyromonasandApusomonasinto two discrete clades (same as the parsimony treein Fig. 2C). The null hypothesis states that there is no significant difference between the best likelihood tree (Fig. 2A) and the other trees tested.
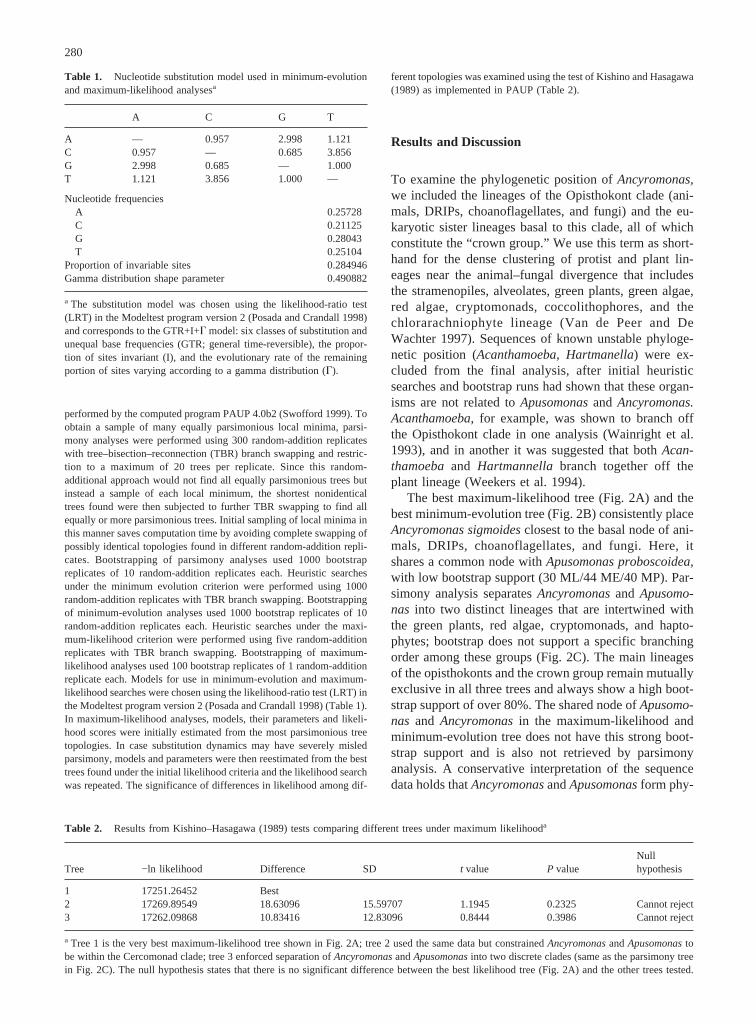
Table 1. Nucleotide substitution model used in minimum-evolutionand maximum-likelihood analysesa
A C G T
A — 0.957 2.998 1.121C 0.957 — 0.685 3.856G 2.998 0.685 — 1.000T 1.121 3.856 1.000 —
Nucleotide frequenciesA 0.25728C 0.21125G 0.28043T 0.25104
Proportion of invariable sites 0.284946Gamma distribution shape parameter 0.490882
a The substitution model was chosen using the likelihood-ratio test(LRT) in the Modeltest program version 2 (Posada and Crandall 1998)and corresponds to the GTR+I+G model: six classes of substitution andunequal base frequencies (GTR; general time-reversible), the propor-tion of sites invariant (I), and the evolutionary rate of the remainingportion of sites varying according to a gamma distribution (G).
280
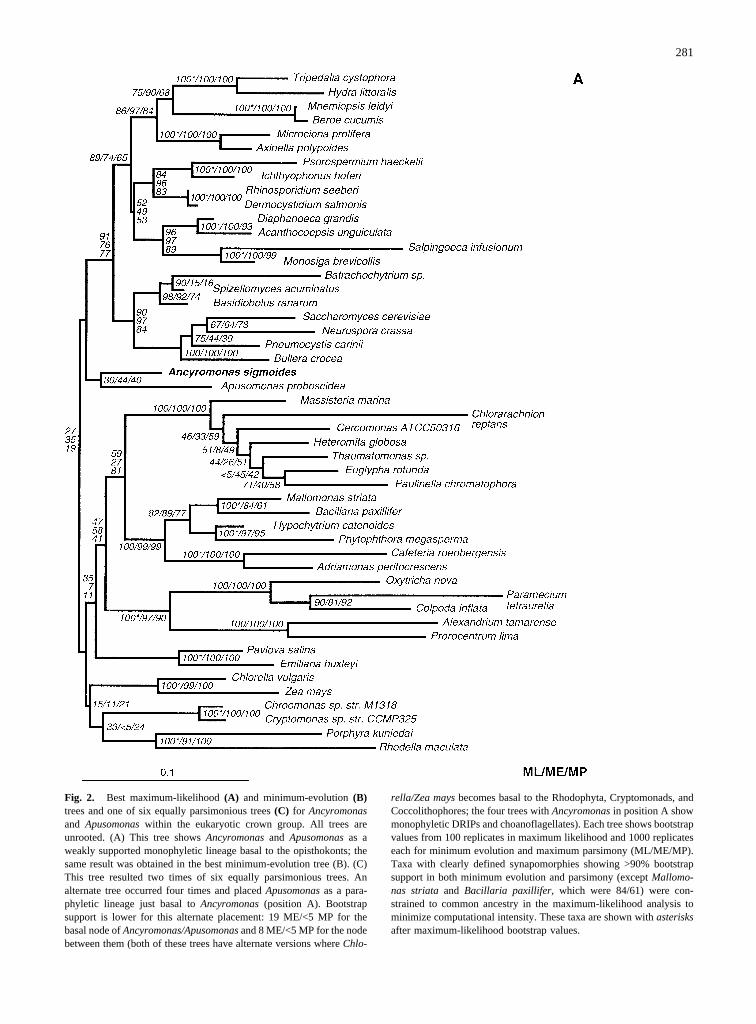
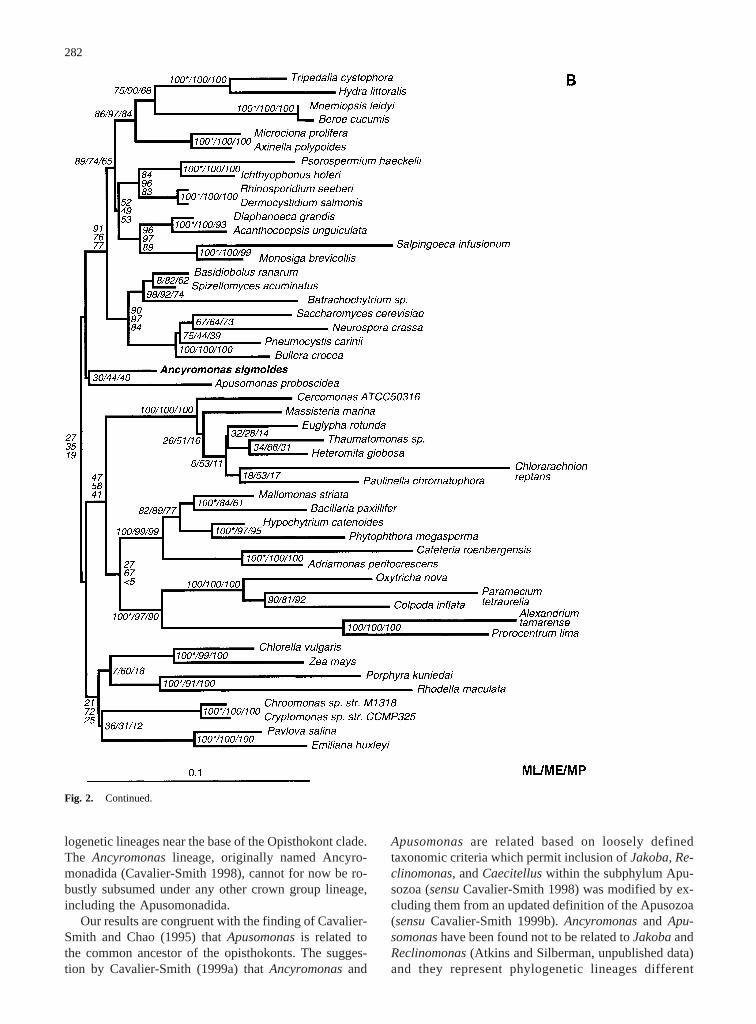
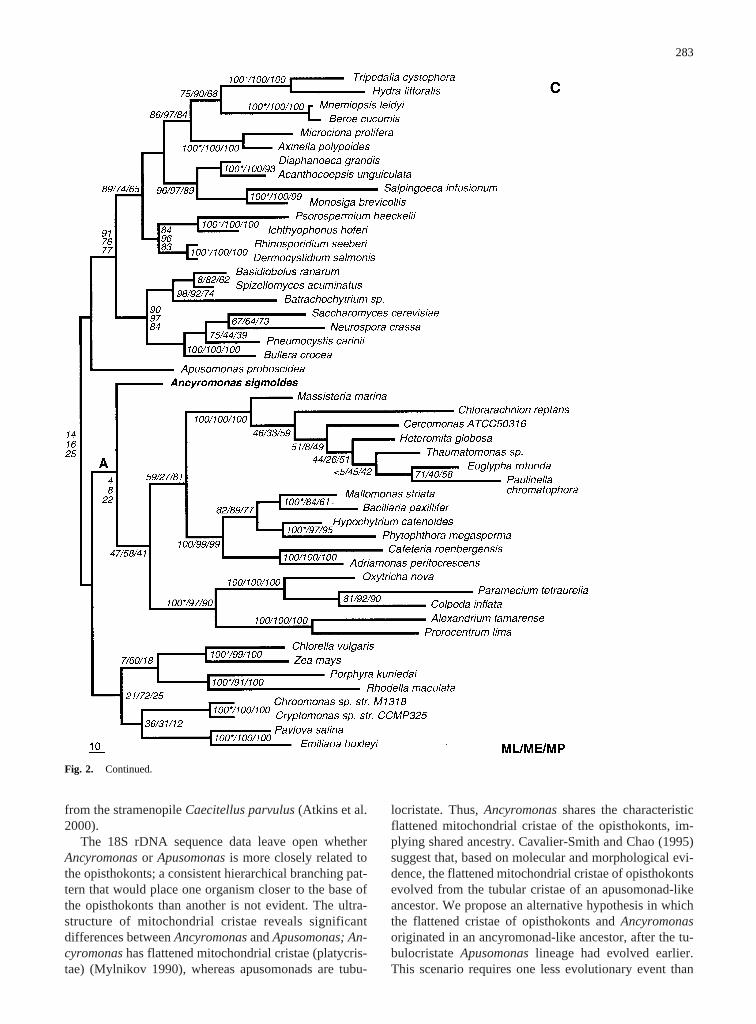
Fig. 2. Best maximum-likelihood(A) and minimum-evolution(B)trees and one of six equally parsimonious trees(C) for Ancyromonasand Apusomonaswithin the eukaryotic crown group. All trees areunrooted. (A) This tree showsAncyromonasand Apusomonasas aweakly supported monophyletic lineage basal to the opisthokonts; thesame result was obtained in the best minimum-evolution tree (B). (C)This tree resulted two times of six equally parsimonious trees. Analternate tree occurred four times and placedApusomonasas a para-phyletic lineage just basal toAncyromonas(position A). Bootstrapsupport is lower for this alternate placement: 19 ME/<5 MP for thebasal node ofAncyromonas/Apusomonasand 8 ME/<5 MP for the nodebetween them (both of these trees have alternate versions whereChlo-
rella/Zea maysbecomes basal to the Rhodophyta, Cryptomonads, andCoccolithophores; the four trees withAncyromonasin position A showmonophyletic DRIPs and choanoflagellates). Each tree shows bootstrapvalues from 100 replicates in maximum likelihood and 1000 replicateseach for minimum evolution and maximum parsimony (ML/ME/MP).Taxa with clearly defined synapomorphies showing >90% bootstrapsupport in both minimum evolution and parsimony (exceptMallomo-nas striata and Bacillaria paxillifer, which were 84/61) were con-strained to common ancestry in the maximum-likelihood analysis tominimize computational intensity. These taxa are shown withasterisksafter maximum-likelihood bootstrap values.
281
logenetic lineages near the base of the Opisthokont clade.The Ancyromonaslineage, originally named Ancyro-monadida (Cavalier-Smith 1998), cannot for now be ro-bustly subsumed under any other crown group lineage,including the Apusomonadida.
Our results are congruent with the finding of Cavalier-Smith and Chao (1995) thatApusomonasis related tothe common ancestor of the opisthokonts. The sugges-tion by Cavalier-Smith (1999a) thatAncyromonasand
Apusomonasare related based on loosely definedtaxonomic criteria which permit inclusion ofJakoba, Re-clinomonas,andCaecitelluswithin the subphylum Apu-sozoa (sensuCavalier-Smith 1998) was modified by ex-cluding them from an updated definition of the Apusozoa(sensuCavalier-Smith 1999b).Ancyromonasand Apu-somonashave been found not to be related toJakobaandReclinomonas(Atkins and Silberman, unpublished data)and they represent phylogenetic lineages different
Fig. 2. Continued.
282
from the stramenopileCaecitellus parvulus(Atkins et al.2000).
The 18S rDNA sequence data leave open whetherAncyromonasor Apusomonasis more closely related tothe opisthokonts; a consistent hierarchical branching pat-tern that would place one organism closer to the base ofthe opisthokonts than another is not evident. The ultra-structure of mitochondrial cristae reveals significantdifferences betweenAncyromonasandApusomonas; An-cyromonashas flattened mitochondrial cristae (platycris-tae) (Mylnikov 1990), whereas apusomonads are tubu-
locristate. Thus,Ancyromonasshares the characteristicflattened mitochondrial cristae of the opisthokonts, im-plying shared ancestry. Cavalier-Smith and Chao (1995)suggest that, based on molecular and morphological evi-dence, the flattened mitochondrial cristae of opisthokontsevolved from the tubular cristae of an apusomonad-likeancestor. We propose an alternative hypothesis in whichthe flattened cristae of opisthokonts andAncyromonasoriginated in an ancyromonad-like ancestor, after the tu-bulocristateApusomonaslineage had evolved earlier.This scenario requires one less evolutionary event than
Fig. 2. Continued.
283
the alternative, a reversal to tubulocristate mitochondriawithin the Apusomonaslineage after the emergence offlattened cristae in the ancestor of opisthokonts,Apu-somonasand Ancyromonas.It has to be noted that thisparsimony argument for a closer relationship ofAncy-romonasand opisthokonts would evaporate without mo-lecular data, since other eukaryotic lineages (green algae,land plants,Jakoba libera) also have flattened mitochon-drial cristae without being more closely related toAncy-romonas.As a final twist, the DRIPs show that evenmembers of a well-supported phylogenetic clade can dif-fer in cristal morphology (Ragan et al. 1996). In otherwords, divergent cristal types do not necessarily invali-date a potentialAncyromonas/Apusomonasclade.
General Phylogenetic Patterns.We note some re-curring features of this crown group phylogeny whichhave been found in previous attempts to resolve deepnodes between crown group lineages. The distance treeplaces alveolates and stramenopiles as sister groups(Fig. 2B, bootstrap support 67%), as previously foundin distance analyses that took 18S rDNA site-to-site ratevariation into account (Van de Peer and De Wachter1996, 1997). In the maximum-likelihood tree and themaximum-parsimony tree, the cercomonad lineage, in-cluding Heteromita globosa, Massisteria marina,andChlorarachnion reptans,appears as the sister group ofthe stramenopiles, and cercomonads and stramenopilestogether form the sister group to the alveolates. Indepen-dently of these differing branching patterns, the cerco-monads, stramenopiles, and alveolates always share acommon basal node, with weak bootstrap support (47ML/58 ME/41 MP). The green plants and algae, the redalgae, cryptomonads, and coccolithophores (hapto-phytes) do not fall into this group; these lineagesbranched off in variable configurations between the al-veolate/stramenopile/cercomonad group on one side andAncyromonas, Apusomonas,and the opisthokont cladeon the other. Although this pattern has no significantbootstrap support, it has been found independently sev-eral times in methodologically different crown groupphylogenies (Cavalier-Smith and Chao 1995; Van dePeer and De Wachter 1997).
The poor or nonexistent bootstrap support for thesehierarchical deep nodes among the crown group lin-eages indicates that 18S rDNA data have reached thelimits of their resolving power and do not resolve deepnode topologies reliably (if the assumption of a suddenevolutionary radiation is no longer taken for granted)(Philippe and Laurent 1998). It becomes impossible todecide with certainty between alternative connectivenodes for deeply branching phylogenetic lineages. Like-lihood scores for different topologies for the placementof AncyromonasandApusomonaswere examined usingthe Kishino–Hasagawa (1989) test (Table 2). Two alter-native topologies to the best maximum-likelihood tree(Fig. 2A) were tested: a common root forAncyromonas,
Apusomonas,and the Cercomonad clade (tree 2, Table 2)and no shared node forAncyromonasand Apusomonas(tree 3, Table 2 and Fig. 2C). The first alternative topol-ogy reflects shared ancestry ofAncyromonas, Apusomo-nas,and cercomonads in the phylum Opalozoa as sug-gested previously (Cavalier-Smith 1993). The secondalternative topology corresponds to major ultrastructuraldifferences betweenAncyromonasandApusomonas,es-pecially with respect to the mitochondrial cristae. In bothcases, the alternative topologies cannot be ruled outbased on 18S rDNA data alone.
In the case ofAncyromonas sigmoides,ultrastructuraldata suggest how to resolve the ambiguous phylogeneticplacement found by our 18S rDNA sequence analyses.Since 18S rDNA phylogeny and mitochondrial cristaemorphology are not inconsistent (Taylor 1999), theshared feature of platycristate mitochondria tiesAncy-romonasmore strongly to the base of the opisthokontclade than 18S rDNA sequence alone. Additional genephylogenies forAncyromonasand Apusomonascouldfurther clarifyAncyromonas’role as a possible precursorof multicellular life.
Acknowledgments. A.G.M. was supported by funds to M. Sogin fromthe G. Unger Vetlesen Foundation and NASA Astrobiology Coopera-tive Agreement NCC2-1054; A.P.T. was supported by a WHOI sub-contract of this NASA Astrobiology Cooperative Agreement. This isWoods Hole Oceanographic Institution contribution number 10210.
References
Atkins MS, Teske AP, Anderson OR (2000) A survey of flagellatediversity at four deep-sea hydrothermal vents in the eastern PacificOcean using structural and molecular approaches. J Euk Microbiol47:400–411
Baldauf SL (1999) A search for the origins of Animals and Fungi:Comparing and combining molecular data. Am Nat 154(Suppl):S178–S188
Baldauf SL, Palmer JD (1993) Animals and fungi are each other’sclosest relatives: Congruent evidence from multiple proteins. ProcNat Acad Sci USA 90:11558–11562
Cavalier-Smith T (1987) The origin of Fungi and pseudofungi. In:Rayner ADM, Brasier CM, Moore D (eds) Evolutionary biology ofthe fungi. Cambridge University Press, Cambridge, pp 339–353
Cavalier-Smith T (1993) The protozoan phylum Opalozoa. J Euk Mi-crobiol 40:609–615
Cavalier-Smith T (1997) Amoeboflagellates and mitochondrial cristaein eukaryote evolution: Megasystematics of the new protozoan sub-kingdoms Eozoa and Neozoa. Arch Protistenkd 147:237–258
Cavalier-Smith T (1998) Neomonadida and the origin of animals andfungi. In: Coombs GH, Vickerman K, Sleigh MA, Warren A (eds)Evolutionary relationships among protozoa. Klewer Academic,London, pp 375–407
Cavalier-Smith T (1999a) Zooflagellate phylogeny and the systematicsof protozoa. Biol Bull 196:393–396
Cavalier-Smith T (1999b) Principles of protein and lipid targeting insecondary symbiogenesis: Euglenoid, dinoflagellate, and sporozoanplastid origins and the eukaryote family tree. J Euk Microbiol 46:347–366
Cavalier-Smith T, Chao EE (1995) The opalozoan Apusomonas is
284
related to the common ancestor of animals, fungi and choanofla-gellates. Proc Roy Soc Lond B Biol Sci 261:1–6
Harbison GR (1985) In: Conway Morris S, George JD, Gibson R, PlattHM (eds) The origins and relationships of lower invertebrates.Clarendon Press, Oxford, pp 78–100
Hirt RP, Logsdon JM, Healy B, Dorey MW, Doolittle WF, Embley TM(1999) Microsporidia are related to fungi: Evidence from the largestsubunit of RNA polymerase II and other proteins. Proc Nat AcadSci USA 95:580–585
Kishino H, Hasegawa M (1989) Evaluation of the maximum likelihoodestimate of the evolutionary tree topologies from DNA sequencedata, and the branching order of Hominoidea. J Mol Evol 29:170–179
Medlin L, Elwood HJ, Stickel S, Sogin ML (1988) The characterizationof enzymatically amplified eukaryotic 16S-like rRNA-coding re-gions. Gene 71:491–499
Mylnikov AP (1990) Characteristic features of the ultrastructure ofcolourless flagellateHeteromita sp. Tsitologiya 32:567–571 (InRussian)
Nikoh N, Hayase N, Iwabe E, Kuma K, Miyata T (1994) Phylogeneticrelationship of the kingdoms Animalia, Plantae, and Fungi, inferredfrom 23 different protein species. Mol Biol Evol 11:762–768
Patterson DJ (1999) The diversity of eukaryotes. Am Nat 154(Suppl):S96–S124
Philippe H, Laurent J (1998) How good are deep phylogenetic trees?Curr Opin Gen Dev 8:616–623
Posada D, Crandall KA (1998) MODELTEST: Testing the model ofDNA substitution. Bioinformatics 14(9):817–818
Ragan MA, Goggins CL, Cawthorn RJ, Cerenius L, Jamieson AVC,Plourde SM, Rand TG, So¨derhall K, Gutell RR (1996) A novelclade of protistan parasites near the animal-fungal divergence. ProcNat Acad Sci USA 93:11907–11912
Roger AJ (1999) Reconstructing early events in eukaryotic evolution.Am Nat 154(Suppl):S146–S163
Smothers JF, von Dohlen CD, Smith LHJ, Spall RD (1994) Molecular
evidence that the Myxozoan protists are metazoans. Science 265:1719–1721
Swofford DL (1999) PAUP*, phylogenetic analysis using parsimony(* and other methods). Sinauer Associates, Sunderland, MA
Taylor FJR (1976) Flagellate phylogeny: A study in conflicts. J Pro-tozool 23:28–40
Taylor FJR (1978) Problems in the development of an explicit hypo-thetical phylogeny of the lower eukaryotes. BioSystems 10:67–89
Taylor FJR (1999) Ultrastructure as a control for protistan molecularphylogeny. Am Nat 154(Suppl):S125–S136
Thompson JD, Higgins DG, Gibson TJ (1994) CLUSTAL W: Improv-ing the sensitivity of progressive multiple sequence alignmentthrough sequence weighting, positions-specific gap penalties andweight matrix choice. Nucleic Acids Res 22:4673–4680
Treco DA (1987) Preparation of genomic DNA. In: Ausubel FM, BrentR, Kingston RE, Moore DD, Seidman JG, Smith JA, Struhl K (eds)Current protocols in molecular biology, 1. John Wiley and Sons,New York, pp 2.1.1–2.1.3
Van de Peer Y, De Wachter R (1996) The evolution of stramenopilesand alveolates as derived by “substitution rate calibration” of smallribosomal subunit RNA. J Mol Evol 42:201–210
Van de Peer Y, De Wachter R (1997) Evolutionary relationships amongthe eukaryotic crown taxa taking into account site-to-site rate varia-tion in 18S rRNA. J Mol Evol 45:619–630
Van de Peer Y, Jensen J, De Rijk P, De Wachter R (1997) Database onthe structure of small ribosomal subunit RNA. Nucleic Acids Res25:111–116
Wainright PO, Hinkle G, Sogin ML, Stickel SK (1993) Monophyleticorigins of the metazoa: an evolutionary link with fungi. Science260:340–342
Weekers PHH, Gast RJ, Fuerst PA, Byers TJ (1994) Sequence variationin small-subunit ribosomal RNAs ofHartmannella vermiformisandtheir phylogenetic implications. Mol Biol Evol 11(4):684–690
Wilmer P (1990) Invertebrate relationships: Patterns in animal evolu-tion. Cambridge University Press, Cambridge
285