
researchrepository.ucd.ie · Web viewProf. Anne des Rieux. Université catholique de Louvain....
35
A human intestinal M-like cell model derived from Caco-2 cells for investigating the particle, antigen and microorganism translocation Ana Beloqui 1 , David J. Brayden 2 , Per Artursson 3,4 , Véronique Préat 1 , Anne des Rieux 1,5 * 1 Université catholique de Louvain, Louvain Drug Research Institute, Advanced Drug Delivery and Biomaterials, 1200 Brussels, Belgium 2 UCD School of Veterinary Medicine and Conway Institute, University College Dublin, Belfield, Dublin 4, Ireland 3 Department of Pharmacy, Uppsala University, S-751 23 Uppsala, Sweden 4 Science for Life Laboratory, Uppsala University, S-751 23 Uppsala, Sweden 5 Université catholique de Louvain, Institute of the Condensed Matter and Nanosciences, 1348 Louvain-la-Neuve, Belgium
Transcript of researchrepository.ucd.ie · Web viewProf. Anne des Rieux. Université catholique de Louvain....
A human intestinal M-like cell model derived from Caco-2 cells for investigating the particle, antigen and microorganism translocation
Ana Beloqui1, David J. Brayden2, Per Artursson3,4, Véronique Préat1, Anne des Rieux1,5*
1Université catholique de Louvain, Louvain Drug Research Institute, Advanced Drug Delivery and Biomaterials, 1200 Brussels, Belgium
2UCD School of Veterinary Medicine and Conway Institute, University College Dublin, Belfield, Dublin 4, Ireland
3Department of Pharmacy, Uppsala University, S-751 23 Uppsala, Sweden
4Science for Life Laboratory, Uppsala University, S-751 23 Uppsala, Sweden
5Université catholique de Louvain, Institute of the Condensed Matter and Nanosciences, 1348 Louvain-la-Neuve, Belgium
*Corresponding author:
Prof. Anne des RieuxUniversité catholique de LouvainLouvain Drug Research Institute Advanced Drug Delivery and Biomaterials Avenue Mounier 73 bte B1 73.12B-1200 Brussels, BelgiumPhone:+32 2 764 7357; Fax:+32 2 764 7398E-mail address: [email protected]
Abstract
The specialized microfold cells (M cells) in the follicle-associated epithelium (FAE) of the intestinal Peyer's patches serve as antigen sampling cells of the intestinal innate immune system. Unlike “classical” enterocytes, they are able to translocate diverse particulates without digesting them. M cells are ‘key players’ in food tolerance. They act as pathways for micro-organism invasion, and also as targets for oral immunization and oral drug delivery strategies. This protocol describes a reproducible and versatile human M cell-like in vitro model. This model can be exploited for evaluating M cell transport of nanoparticle delivery systems for protein, drug, or vaccine delivery and to study bacteria adherence and translocation across M cells. The differentiated model is obtained after 3 weeks and transport experiments across the differentiated model can be carried out over periods up to 10 hours.
INTRODUCTION
In vitro models of the intestinal barrier have been commonly used to study the permeability of orally administrated drugs and the transport of newly developed formulations (e.g. nanoparticles). Permeability studies of drugs have been mainly performed on enterocyte-like cell monolayers, typically obtained by growing Caco-2 cells on permeable supports1. However, the intestinal barrier contains another cell type, M cells (microfold cells), which are part of the mucosal immune system and are predominantly located in the follicle-associated epithelium (FAE) of Peyer’s patches. They are specialized epithelial cells with capacity to transport particulate matter, including antigens, bacteria and viruses. M cells therefore have an important role in tolerance and mucosal immune response induction, but they are also exploited by many pathogens as a route of intestinal invasion. Due to their high transcytotic capacities and their ability to transport a broad range of materials, including micro- and nanoparticles, these cells offer potential in the oral delivery of encapsulated therapeutic peptides and vaccines2, 3.
M cells are highly variable in proportion and phenotype among different species4. The scarcity of human tissues and the lack of success in maintaining differentiated primary human intestinal M cells in culture are two of the reasons why an in vitro model of the human M cells containing “M-like” cells is essential to understand human M cell physiology and function. A major challenge regarding M like cell models are to obtain a reproducible levels of M-like cell function on every filter, but a key advantage is the use of human cell lines and not primary cell cultures.
In order to obtain a model of the human M cells, two human cells lines are typically used and co-cultured: Caco-2 and Raji cells. They are expanded separately with Caco-2 cells initially seeded on Matrigel™-coated cell culture filter inserts, where they are differentiated for ̴14 days. From that point, either the inserts are maintained in their normal orientation5, 6 or they are inverted7 (this protocol) to mimic the more physiological condition where B lymphocytes come into direct contact with enterocytes via migration through the filter pores. Raji cells are then placed in the basolateral compartment and co-cultured with Caco-2 cells for 5 days. The conversion of Caco-2 cells into M-like cells is then assessed by a set of electrophysiological, histological, biochemical and functional read-outs: e.g. decreased transepithelial electrical resistance (TEER), increased nanoparticle translocation, and loss of microvilli, decreased apical alkaline phosphatase activity, and increased bacterial adherence and translocation.
2
This model is especially useful for the study of oral delivery of bioactive molecules in nanoparticulate systems, but it can also be used to study intestinal M cell physiology. Researchers can examine the role of M cells in oral drug or protein/peptide delivery8, in oral vaccination9, or in the development of drug-laden (nano)particles targeting M cell-expressed receptors 10, 11, as well as the interaction of bacteria and viruses including Salmonella or HIV with the intestinal epithelium12.
The main advantages of this model are that it (i) is based on co-culture with a well-established differentiated human cell lines, (ii) is reproducible under the conditions described herein, (iii) can be easily mastered, and (iv) does not require the isolation of primary cells cells and thus contributes to support of the 3 Rs. Other models also exist including tri-culture models13 or ex vivo models14 that are complementary. M cell properties and characteristics vary between species so it is crucial to work with human cells. In that regards, in vitro models are easier to set up and to use when the objective is to compare different types of particles, their mechanisms of endocytosis or when studying bacterial interactions with M cells. Validation of these observations can be then preformed on human intestinal explants, but cannot be used for screening and mechanical studies.
Inverting the inserts reduces the potential for growth of Caco-2 cells on the basolateral side of the filter, thus averting formation of a bilayer, and it allows direct contact between Raji cells and Caco-2 cells, ensuring a successful conversion of Caco-2 cells into M-like cells. However, this model comprises also some limitations, including a higher proportion of M-like cells (15-30 %) compared to the proportion of M cells in Peyer’s Patches in vivo (̴ 10 % in rodents and ̴ 5 % in humans).
The present protocol consists of three main parts: (i) Caco-2 cell seeding onto permeable supports (steps 1-9), (ii) inversion of the inserts (steps 10-13) and (iii) Raji cell seeding in the basolateral compartment (step 14). Part two is illustrated by a video provided as supplementary information. BOX 1 describes controls to evaluate the functionality of the co-cultured M-like cell model. BOX 2 describes the steps to evaluate the transport of commercial nanoparticles across M cell monolayers. The evolution of the M cell model since it was first described is summarized in BOX 3. BOX 4 provides the protocol to visualize fluorescent particles within cell monolayers by confocal microscopy. BOX 5 gives examples of the evaluation of bacteria transport across M cells.
MATERIALS
REAGENTS
Caco-2 cells (C2BBe1 clone) (ATCC) CRITICAL Caco-2 cell passage number is crucial depending on the type of experiments that are going to be conducted15. We thus recommend using early passages. We use Caco-2 cells between passages x+12 and x+30.
Raji cells (ATCC) CRITICAL Raji cell passage number is critical when developing the in vitro M cell model. Use only Raji cells from early passages. We use Raji cells between passages x+1 and x+10.
Salmonella enterica serovar typhimurium SL1344 was donated by Dr. Mark Jepson, School of Medical Sciences, University of Bristol, UK.
Vibrio parahaemolyticus, RIMD2210633, O3:K6 serotype sequence was defined in 2000 by the Osaka University, Japan, and was described in Makino et al16.
3
Dulbecco’s modified Eagle Medium (DMEM) (with 4.5 g/l D-glucose and L-glutamine and without pyruvate) from Gibco (Invitrogen, cat. no. 41965-039) (for culture medium preparation see REAGENT SETUP).CRITICAL DMEM contains a sodium bicarbonate buffer system (3.7 g/l), and thus requires a 5–10% CO2 environment to maintain physiological pH.
Roswell Park Memorial Institute (RPMI) medium with L-glutamine from Gibco (Invitrogen, cat. no. 21875-034) (for culture medium preparation see REAGENT SETUP).CRITICAL RPMI contains a sodium bicarbonate buffer system (2.0 g/l), and thus requires a 5–10% CO2 environment to maintain physiological pH.
HyClone fetal bovine serum (FBS) (Thermo Scientific, cat. no. SV30160.03). CRITICAL The FBS batch can significantly impact cell behavior. Ideally, different batches should be tested and the FBS batch that ensures the fastest Caco-2 cell growth should be selected.
Dulbecco’s Phosphate Buffered Saline (PBS) from Gibco (Invitrogen, cat. no. 14190-094).
Mueller Hinton (MH)-2 agar plates were from Sigma-Aldrich® (Ireland, cat. no. 70191). Luria-Bertani broth was from Sigma-Aldrich® (Ireland, cat. no. L3022). Penicillin (10,000 Units/ml)-Streptomycin (10,000 g/ml) (PEST) from Gibco
(Invitrogen, cat. no. 15140-122). Non-essential amino acids (NEAA) 100x from Gibco (Invitrogen, cat. no. 11140-035). L-glutamine 200 mM from Gibco (Invitrogen, cat. no. 25030-054). Hank’s balanced salt solution (HBSS) phenol red free from Gibco (Invitrogen, cat.
no.14025-050) (for transport buffer preparation see REAGENT SETUP). Trypsin-EDTA (0.05%) from Gibco (Invitrogen, cat. no. 25300-054). Triton X-100 (Sigma-Aldrich, cat. no. T8787). HEPES (Sigma-Aldrich, cat. no. H3375). MES (Sigma-Aldrich, cat. no. M8250). Dimethyl sulfoxide (DMSO) (Sigma-Aldrich, cat. no. D2650). Trypan Blue solution (Sigma-Aldrich, cat. no. T8154). Matrigel™ basement membrane matrix, phenol red free (BD Bioscience, cat.no. 356237). Dyes for cell monolayer staining: Alexa Fluor488-phalloidin or rhodamine-phalloidin to
stain cell cytoskeleton (Molecular Probes, cat. no. A12379 and R415, respectively), 4’,6-diamidino-2-phenylindole (DAPI) to stain cell nuclei (Molecular Probes, cat. no. D21490). CRITICAL Different dyes are employed for the localization of the nanoparticles within the cell monolayers. The dyes selected for the visualization of the cell monolayers should be chosen based on the emission wavelength of the dye used for the nanoparticle preparation.
Solvents for analytical methods (e.g. acetonitrile for HPLC).
EQUIPMENT
Two cell incubators (37C), one set at 5% CO2 (RPMI medium in Raji cell culture) and another at 10% CO2 (DMEM medium in Caco-2 cells culture) with water-saturated atmosphere.
Epithelial volt/ohmmeter for trans-epithelial electrical resistance (TEER) measurement (EVOM, World Precission Instruments) or similar device connected to a chopstick electrode or a measurement chamber. CRITICAL The volt/ohmmeter should be charged prior to measuring the TEER as the connection of the volt/ohmmeter to an electric socket can alter TEER values. Equilibrate the volt/ohmmeter prior to taking measurements.
4
Laminar flow hood. A heating plate. Confocal microscope, for example, a Zeiss LSM 150. Flow cytometer, for example, a BD FACSVerse. Cell culture flasks 75 cm2 (Corning Costar, cat. no. 430641U) and 162 cm2 (Corning
Costar, cat. no. 3151). Inserts: The most commonly used are Transwell 12-well filters, 12 mm diameter, 3 m
pore size, 1.12 cm2 growth area, polycarbonate membrane (Corning Costar, cat. no. 3402). 12-well cell culture plates (Corning Costar cat. no. 3512). FluoSpheres carboxylated 0.2 m yellow-green nanoparticles (Molecular Probes, cat. no.
F8811). Sphero fluorescent nile red 2.27 m particles (Gentaur, cat. no. FH-2056-2). Silicon tubes presenting an internal diameter of 14 mm and external diameter of 20 mm
(Labo-moderne reference AX38824). Large glass Petri dishes (diameter: 185 mm, height: 40 mm). Pipettes (volumes 1-10 l, 10-100 l and 100-1000 l). Flow cytometry tubes, 5 ml polystyrene 12x75 mm round-bottom tubes (Corning Falcon,
cat. no. 352054). Falcon 15 and 50 ml tubes. Microscope slides, Superfrost plus 25x75x1 mm (Thermo Scientific, cat. no.
J1800AMNZ). Microscope cover glasses 24x50 mm. Neubauer haemocytometer. Analytical equipment (fluorescence plate reader, scintillation counter, HPLC or
LC-MS/MS, etc).
REAGENT SETUP
Caco-2 culture medium Depending on whether the medium will be used to maintain the cells in flasks (flask medium) or to seed the cells in inserts (insert medium), the composition of medium will be slightly different. Flask medium: 500 ml DMEM + 5 ml NEAA + 5 ml L-glutamine + 50 ml FBS. Insert medium: 500 ml DMEM + 5 ml NEAA + 5 ml L-glutamine + 50 ml FBS + 5 ml PEST. Freezing medium: flask growth medium (95%) and DMSO (5%).
Raji culture medium 500 ml RPMI + 5 ml NEAA + 5 ml L-glutamine + 50 ml FBS + 5 mL PEST. Freezing medium: complete medium (95%) and DMSO (5%). CRITICAL Caco-2 cell insert medium will be used for seeding Raji cells on Transwell inserts (Step 14).
Transport buffer Typically, HBSS buffered at pH 7.4 with HEPES (25 mM final concentration) is used as transport buffer on both sides of monolayers. However, the transport buffer selection will be dependent on molecule/nanoparticle to be tested (e.g. pH sensitive molecules). CRITICAL Do not use FBS in the HBSS when evaluating nanoparticle transport across cell monolayers as it can influence nanoparticle transport across cells by forming a corona on particle17. Prior to any nanoparticle transport study, the dispersion and stability of the nanocarrier in the transport medium should be assessed and the analytical method for the molecule of interest selected.
PROCEDURE
5
Cultivation of Caco-2/Raji cell monolayers grown on permeable supports – TIMING Start 30-35 d ahead of the planned experiment
1) Defrost cells:
- Caco-2 cells: defrost 1 vial of Caco-2 cells (3x10⁶ cells). Re-suspend the cells in 10-15 ml of flask medium and seed them in 75 cm2 cell culture flasks. Change medium every other day for one week or until the cells reach 90% of confluence. Pass them to expand in 165 cm2 cell culture flasks. Place the cells in an incubator at 10% CO2 and 37 C.- Raji cells: defrost 1 vial of Raji cells (3x10⁶ cells). Re-suspend the cells in 40 ml Raji cell medium and seed them in 75 cm2 cell culture flasks placed vertically in the incubator (5% CO2). Raji cells grow in suspension so just let them settle at the bottom of the flask. Change medium two times a week by aspirating 30 ml of the medium and adding 30 ml of fresh medium without disturbing cells. Pass the cells once every 10 days by re-suspending the cells, retrieving 10 ml of cell suspension and adding 30 ml of fresh medium. Place the cells in an incubator set at 5% CO2 and 37 C.
CRITICAL STEP Pass the cells at least once between thawing and seeding them in the inserts. Be careful not to aspirate Raji cells while changing medium.
?TROUBLESHOOTING
2) Place the desired number of inserts in 12-well cell culture plates. Coat the inserts with Matrigel (10 l/ml of medium; 200 l of medium per insert to cover the whole insert surface) and allow it to adsorb at the insert surface for 1 h under a laminar flow hood at room temperature (RT).
CRITICAL STEP Coating the insert with Matrigel is crucial to ensure a better adhesion of the cells on their surface before the inversion process at day 3-5 (Step 12). It is also crucial to hinder Caco-2 cells migrating from one side of the Transwell to the other through filter pores.
3) After 1 h, rinse the inserts three times with PBS to remove traces of non-adsorbed Matrigel. After washing, either directly add Caco-2 cells at the apical side of the inserts (Step 2) or add medium, but do not let them dry.
PAUSE POINT Inserts can be coated with Matrigel up to two days in advance. The coated-inserts can be then kept in the fridge at 4C. It is important to add medium in the apical and the basolateral chambers to prevent their drying.
CRITICAL STEP Do not let the inserts dry and do not open the plates outside the laminar flow hood as this is a risk for contamination.
4) Trypsinize Caco-2 cells from 90 % confluent Caco-2 cultures in 165 cm2 flasks (90% confluency in our laboratory corresponds to an average of 15 x 106 cells/flask): remove the medium, rinse gently with PBS (30 ml per 165 cm2 flask), remove the PBS and add trypsin/EDTA (5 ml per 165 cm2 flask). Ensure that the whole flask is covered with the trypsin. Incubate the flask at 37C under a 10% CO2/90% air atmosphere for 15 min. Once cells are detached, immediately add at least double the volume of trypsin in flask
6

medium to stop trypsinization. For example, per 165 cm2 flasks, we normally use 5 mL of trypsin and 25 mL of medium to inactivate it.
?TROUBLESHOOTING
5) Transfer the cell suspension to a falcon tube (evaluate the volume with the pipette) and pipette gently in order to disperse cell aggregates. Take an aliquot and count the cells using a Neubauer haemocytometer.
CRITICAL STEP Use a Neubauer chamber to ensure accurate cell counting and Trypan Blue dye to distinguish between dead and living cells. The percentage of dead cells should not exceed 5%. Caco-2 cells aggregate, so carry out repeated mixing using the pipette to avoid clumping.
6) Centrifuge the volume of cells that corresponds to the desired number of cells to be placed on the inserts (5 min at 250 g) (5x10⁵ cells per insert x number of inserts +1).
7) Remove the supernatant and re-suspend the cells in medium in order to obtain 106
cells/ml.
8) Remove PBS/medium from the inserts (Step 3) and seed 5x10⁵ cells in 0.5 ml per insert.
CRITICAL STEP For this model, use Matrigel™-coated Transwell® inserts (or equivalent) with a 12 mm diameter. The pore size should be 3 µm to allow Raji cells to cross the insert membrane to an extent and to partially intercalate the Caco-2 cell monolayer. Avoid touching the inserts with the pipette in order to prevent damage to the monolayer and/or the insert. Transport experiments are always carried out in parallel in both Caco-2 cell (mono-cultures) and Caco-2/Raji cell (co-cultures) monolayers in order to compare transport under the same conditions and with the same numbers of test and control inserts.
?TROUBLESHOOTING
9) Replace the medium supporting Caco-2 cells every second day. The maximum volume used for 12-well plates is 0.5 ml for the apical side and 1.5 ml for the basolateral side.
10) On day 3-5, take the inserts out of the 12-well plates. Fill one Petri dish per each cell culture (one for mono- and one for co-culture) with one bottle (500 ml) of insert medium (Figure 1-step 1).
CRITICAL STEP This model was originally used without the inversion of the insert step (e.g. Gullberg et al.5). Reasons as to why the “inverted model” was developed are discussed in BOX 3.
11) Invert the inserts and wrap a silicon tube (see EQUIPMENT) around the insert’s basolateral side with a forceps so that 1 cm of tube exceeds the height of the insert (Figure 1 -steps 2-3, Supplementary data 1 (video)). Silicon is a biocompatible, flexible material. It is inert, can be sterilized by autoclaving and can be re-used.
CRITICAL STEP Sterilize the silicon tubes and the forceps before use in an autoclave at 120 ºC for 20 min.
7
?TROUBLESHOOTING
12) Immerse the inverted insert with the attached silicon tube in a large Petri dish filled with 500 ml (Figure 1-step 4).
CRITICAL STEP Since transport experiments will be carried out in parallel mono- and co-cultures, two glass Petri dishes are needed: one for Caco-2 monolayers on inserts and another one for Caco-2/Raji cell co-cultures on inserts. Sterilize large Petri dishes using a laboratory oven set at 180 C for 1 h, to avoid water condensation inside of the Petri dishes observed when autoclaved.
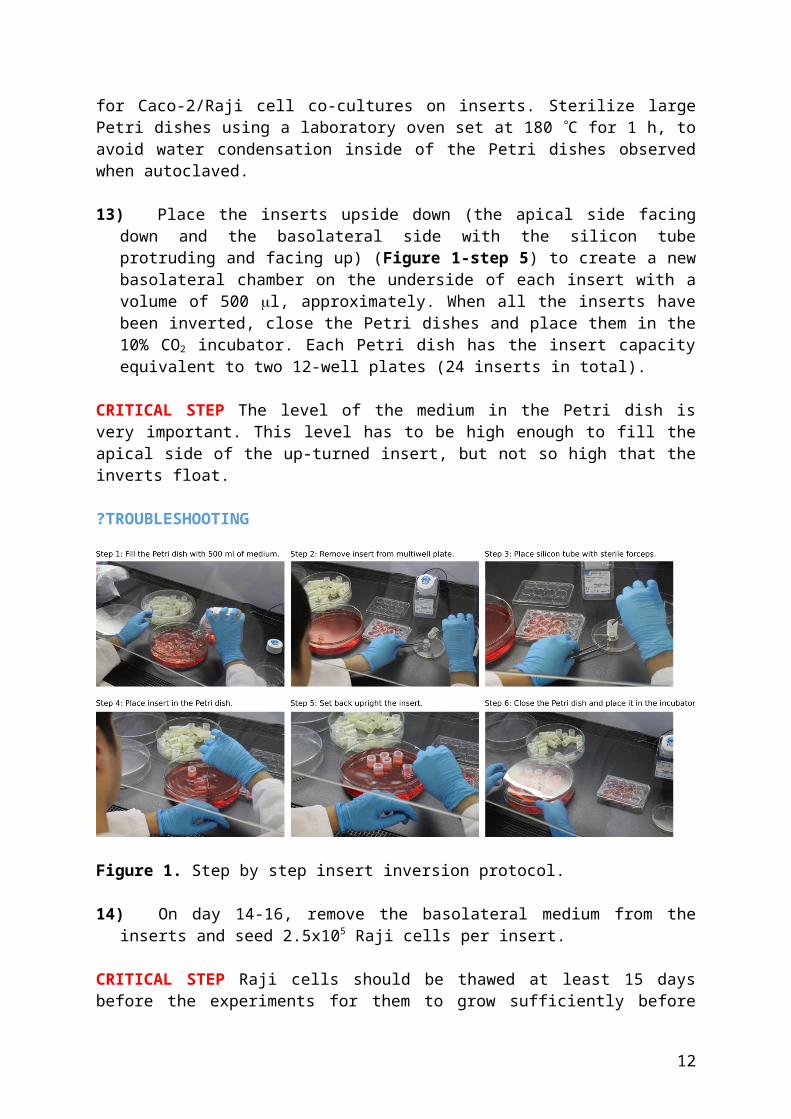
13) Place the inserts upside down (the apical side facing down and the basolateral side with the silicon tube protruding and facing up) (Figure 1-step 5) to create a new basolateral chamber on the underside of each insert with a volume of 500 l, approximately. When all the inserts have been inverted, close the Petri dishes and place them in the 10% CO 2
incubator. Each Petri dish has the insert capacity equivalent to two 12-well plates (24 inserts in total).
CRITICAL STEP The level of the medium in the Petri dish is very important. This level has to be high enough to fill the apical side of the up-turned insert, but not so high that the inverts float.
?TROUBLESHOOTING
Figure 1. Step by step insert inversion protocol.
14) On day 14-16, remove the basolateral medium from the inserts and seed 2.5x10⁵ Raji cells per insert.
CRITICAL STEP Raji cells should be thawed at least 15 days before the experiments for them to grow sufficiently before their addition to Caco-2 cells. Do not remove the medium of the basolateral side of the inserts of co-cultures (e.g. the compartment created by the silicone
8
tube once Raji cells have been added until the day of the experiment). Treat mono-cultures similarly.
15) On day 19-21 since Caco-2 cell seeding (4-6 days after co-culture), inverted mono- and co-cultures are ready for transport studies.
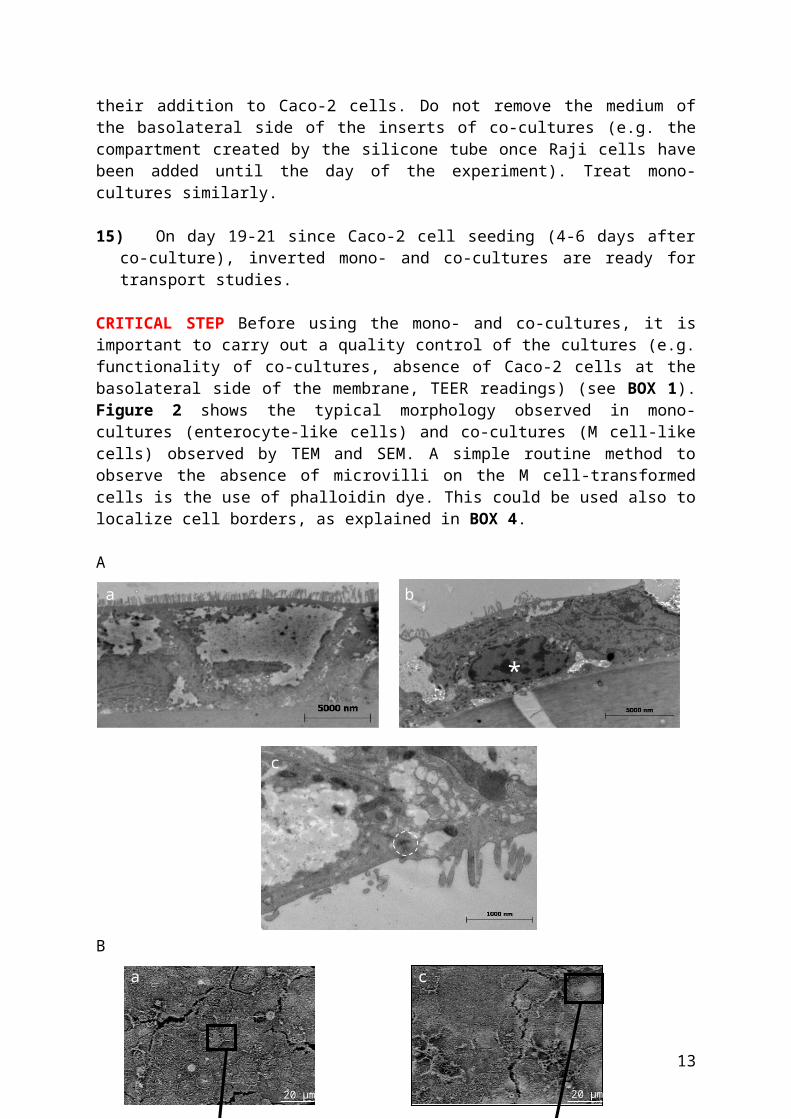
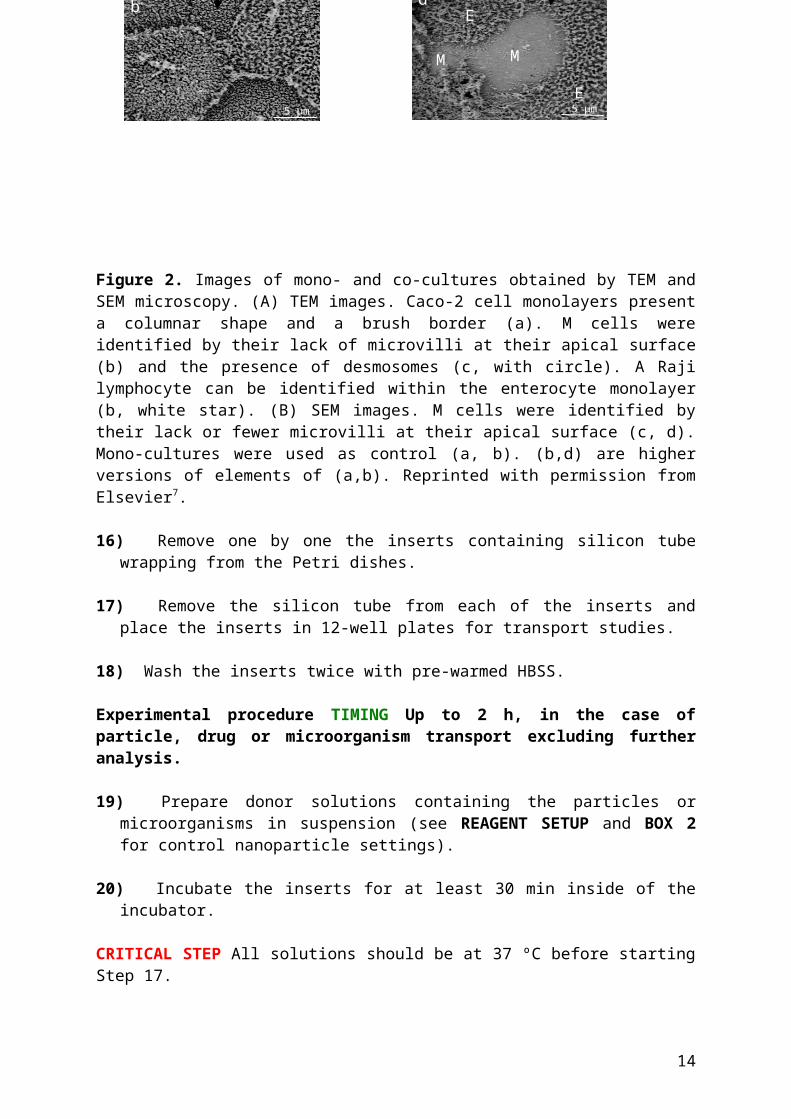
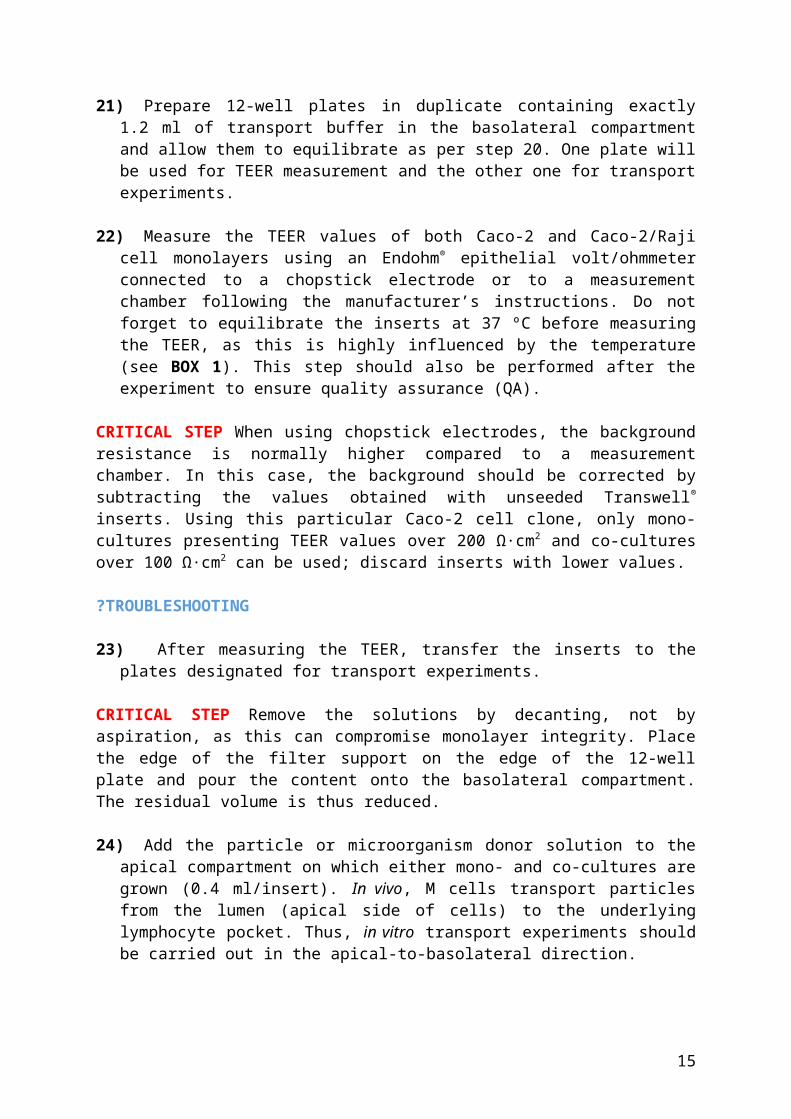
CRITICAL STEP Before using the mono- and co-cultures, it is important to carry out a quality control of the cultures (e.g. functionality of co-cultures, absence of Caco-2 cells at the basolateral side of the membrane, TEER readings) (see BOX 1). Figure 2 shows the typical morphology observed in mono-cultures (enterocyte-like cells) and co-cultures (M cell-like cells) observed by TEM and SEM. A simple routine method to observe the absence of microvilli on the M cell-transformed cells is the use of phalloidin dye. This could be used also to localize cell borders, as explained in BOX 4.
A
B
Figure 2. Images of mono- and co-cultures obtained by TEM and SEM microscopy. (A) TEM images. Caco-2 cell monolayers present a columnar shape and a brush border (a). M cells were identified by their lack of microvilli at their apical surface (b) and the presence of
c
ba
*
b
c
a
5 µm5 µm
20 µm 20 µm
db
ca
E
MM
E
9
desmosomes (c, with circle). A Raji lymphocyte can be identified within the enterocyte monolayer (b, white star). (B) SEM images. M cells were identified by their lack or fewer microvilli at their apical surface (c, d). Mono-cultures were used as control (a, b). (b,d) are higher versions of elements of (a,b). Reprinted with permission from Elsevier7.
16) Remove one by one the inserts containing silicon tube wrapping from the Petri dishes.
17) Remove the silicon tube from each of the inserts and place the inserts in 12-well plates for transport studies.
18) Wash the inserts twice with pre-warmed HBSS.
Experimental procedure TIMING Up to 2 h, in the case of particle, drug or microorganism transport excluding further analysis.
19) Prepare donor solutions containing the particles or microorganisms in suspension (see REAGENT SETUP and BOX 2 for control nanoparticle settings).
20) Incubate the inserts for at least 30 min inside of the incubator.
CRITICAL STEP All solutions should be at 37 ºC before starting Step 17.
21) Prepare 12-well plates in duplicate containing exactly 1.2 ml of transport buffer in the basolateral compartment and allow them to equilibrate as per step 20. One plate will be used for TEER measurement and the other one for transport experiments.
22) Measure the TEER values of both Caco-2 and Caco-2/Raji cell monolayers using an Endohm® epithelial volt/ohmmeter connected to a chopstick electrode or to a measurement chamber following the manufacturer’s instructions. Do not forget to equilibrate the inserts at 37 ºC before measuring the TEER, as this is highly influenced by the temperature (see BOX 1). This step should also be performed after the experiment to ensure quality assurance (QA).
CRITICAL STEP When using chopstick electrodes, the background resistance is normally higher compared to a measurement chamber. In this case, the background should be corrected by subtracting the values obtained with unseeded Transwell® inserts. Using this particular Caco-2 cell clone, only mono-cultures presenting TEER values over 200 Ω·cm2 and co-cultures over 100 Ω·cm2 can be used; discard inserts with lower values.
?TROUBLESHOOTING
23) After measuring the TEER, transfer the inserts to the plates designated for transport experiments.
CRITICAL STEP Remove the solutions by decanting, not by aspiration, as this can compromise monolayer integrity. Place the edge of the filter support on the edge of the 12-well plate and pour the content onto the basolateral compartment. The residual volume is thus reduced.
10
24) Add the particle or microorganism donor solution to the apical compartment on which either mono- and co-cultures are grown (0.4 ml/insert). In vivo, M cells transport particles from the lumen (apical side of cells) to the underlying lymphocyte pocket. Thus, in vitro transport experiments should be carried out in the apical-to-basolateral direction.
CRITICAL STEP Be careful not to spill or accidently add drops of donor solution to the basolateral side. Generally, we retain at least three inserts of mono- and co-cultures as controls for QA. These controls are incubated with commercial polystyrene nanoparticles (e.g. FluoSpheres carboxylated 0.2 m yellow-green nanoparticles) (see BOX 2). The objective is to assess the functionality and reproducibility of the co-culture model (see BOX 1) by evaluating the ability of the co-cultures to transport at least 2-fold more nanoparticles compared to mono-cultures (see BOX 2). Regarding bacterial adherence translocation, the apical buffer will depend on the bacteria type and strain (see BOX 5).
25) Typically, particle transport is carried out for 2 h and a unique measurement is done at this time point (see BOX 2). It is also possible, however, to quantify the number of particles transported at intermediate time points. In this case, half of the 1.2 ml volume of the basolateral compartment is sampled and replaced by the same volume of pre-warmed HBSS. The inserts are then further incubated until the next time-point. For bacterial translocation protocols, see BOX 5.
26) At the end of the incubation period, remove the donor solution from the apical side by decanting. At that point, two alternatives are possible: i) wash the inserts 3x with pre-warmed HBSS and measure the TEER as described in Step 22, or ii) process the inserts for imaging by transferring and washing the inserts in cold HBSS in order to stop further particle transport. Then, transfer the inserts to a new 12-well plate containing cold 4% paraformaldehyde (PFA) to fix the cells. Further staining and confocal analysis can be done later (maintain at 4°C otherwise) (see BOX 4).
CRITICAL STEP Use only inserts and corresponding basolateral solutions for further analysis if their TEER values are not significantly different from initial values obtained before the transport experiment.
27) Sample the basolateral solution into a FACS tube for analysis of fluorescent nanoparticle translocation or use a fluorescence plate reader. It is also possible to evaluate drug transport by HPLC or LC-MS/MS (see Analytical procedures). In the case of microorganisms, the number of translocated bacteria is determined by plating serial dilutions from the basolateral compartments on agar plates and calculating the number of colony forming units per ml (CFU/ml) (see BOX 5).
CRITICAL STEP 1% serum (final concentration) can be added to FACS tubes to prevent particle adsorption at their surface.
Analytical procedures
The analytical procedures depend on whether the transport of particles or interactions with selected pathogens with the epithelium are investigated.
Regarding detection of fluorescent (nano)particles on the receiver side, analysis can be made based on the nanoparticles flux per se by measuring either the absolute number of particles,
11
the fluorescence associated with particles, or the concentration of the encapsulated molecule. In particular, investigation of the human M cell role in particle and antigen translocation across the intestinal barrier can be studied quantitatively by FACS or by using a fluorescence plate reader, or qualitatively by use of confocal microscopy:
1) Quantification by FACS analysis. The number of fluorescence nanoparticles transported to the basolateral compartment can be quantified by flow cytometry. The nanoparticle donor solution (diluted) is used to calculate the percentage of transported nanoparticles or the apparent permeability (Papp).
CRITICAL If nanoparticle fluorescence intensity is too low, this technique is not appropriate. 2) Quantification of nanoparticle fluorescence. The quantification of the fluorescence present
in the basolateral compartment can also be done by fluorimetry. Dilutions of the nanoparticle donor solution can be used to obtain a calibration curve. This technique is easier and less time-consuming.
CRITICAL Note that if the fluorescent marker is not covalently linked to the nanoparticle (i.e. encapsulated), the fluorescence signal measured in the basolateral compartment might correspond, at least partially, to nanoparticle-leaked free dye and not to the nanoparticle associated with the dye. The rate/extent of release from the nanoparticle for each dye and nanoparticle, as well as nanoparticle stability, should be assessed in the same transport medium before conducting in vitro transport studies. The background fluorescence of the basolateral compartment (inserts cultured with medium only) must be subtracted from the measure. If the noise/signal ratio is too low, this technique is not appropriate.
3) Quantification of payload transport. If the nanoparticles are not fluorescently-labelled, it is still possible to estimate nanoparticle transport across the co-cultures by directly measuring the fluxed payload. The quantification of the cargo can be carried out using different techniques depending on its nature. For instance, (i) HPLC or LC-MS/MS can be used to quantify small molecules (e.g. atropine (passive transport) or digoxin (P-gp substrate)1) or peptides (e.g. helodermin8); (ii) the cargo can also be radiolabelled and quantification can be done by liquid scintillation counting, 14C being the label of choice14; (iii) peptides and antigens can be quantified by ELISA; (iv) antibodies can be quantified by fast protein liquid chromatography (FPLC).
The transport of peptides and proteins can be quantified in the basolateral compartment using specific kits and/or assays18. Specific ELISA kits are used in most of cases. Quantification of bacteria translocation across M cells is summarized in BOX 5.
4) Visualization by confocal microscopy (see BOX 4).
CRITICAL When quantifying the transport of fluorescent nanoparticles, the fluorescent dyes incorporated in nanoparticles should be carefully selected, as some dyes diffuse from the nanoparticles and to stain the surrounding tissues/cells19 to cause an artifact. This will preclude quantification.?TROUBLESHOOTING
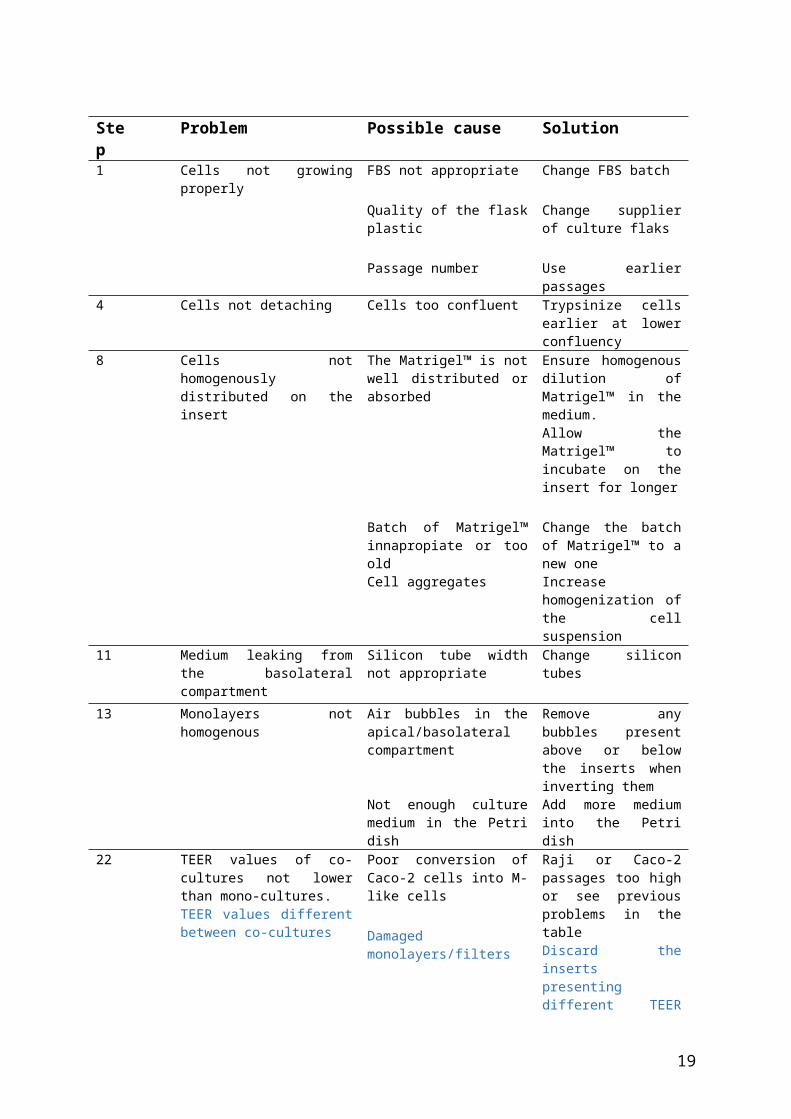
Step Problem Possible cause Solution
12
1 Cells not growing properly FBS not appropriate
Quality of the flask plastic
Change FBS batch
Change supplier of culture flaks
Passage number Use earlier passages4 Cells not detaching Cells too confluent Trypsinize cells earlier at
lower confluency8 Cells not homogenously
distributed on the insertThe Matrigel™ is not well distributed or absorbed
Ensure homogenous dilution of Matrigel™ in the medium.Allow the Matrigel™ to incubate on the insert for longer
Batch of Matrigel™ innapropiate or too old
Change the batch of Matrigel™ to a new one
Cell aggregates Increase homogenization of the cell suspension
11 Medium leaking from the basolateral compartment
Silicon tube width not appropriate
Change silicon tubes
13 Monolayers not homogenous Air bubbles in the apical/basolateral compartment
Remove any bubbles present above or below the inserts when inverting them
Not enough culture medium in the Petri dish
Add more medium into the Petri dish
22 TEER values of co-cultures not lower than mono-cultures.TEER values different between co-cultures
Poor conversion of Caco-2 cells into M-like cells
Damaged monolayers/filters
Raji or Caco-2 passages too high or see previous problems in the tableDiscard the inserts presenting different TEER values
Commercial nanoparticle transport in co-cultures not significantly higher compared to mono-cultures
Poor conversion of Caco-2 cells into M-like cells
Raji or Caco-2 passages too high or see previous problems in the table
13
ANTICIPATED RESULTS
Following the quantification of the encapsulated compound of interest in the basolateral compartment (e.g. by HPLC or LC-MS/MS method), the apparent permeability coefficient (Papp, cm/s) can be calculated according to the following equation:
Papp= dQ/dt x 1/AC0
where dQ/dt is the transport rate (μg/s), A is the surface area of the membrane filter (cm2) and C0 is the initial drug concentration on the apical side (μg/ml).
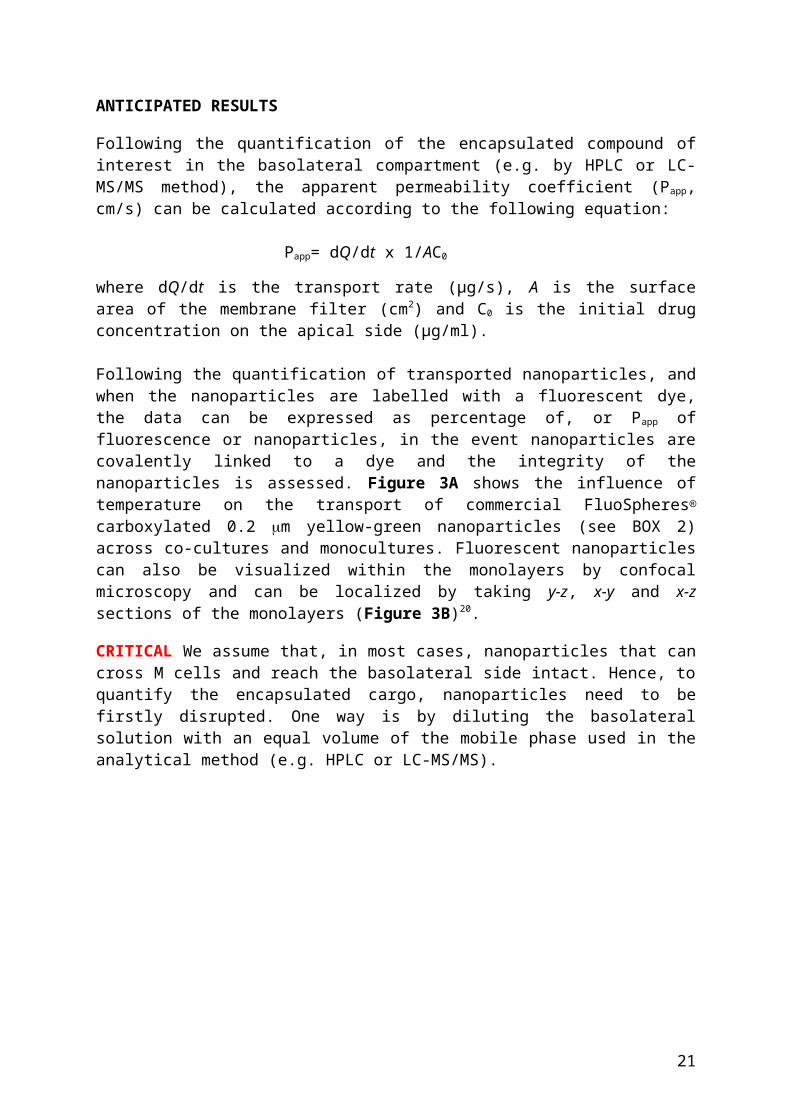
Following the quantification of transported nanoparticles, and when the nanoparticles are labelled with a fluorescent dye, the data can be expressed as percentage of, or Papp of fluorescence or nanoparticles, in the event nanoparticles are covalently linked to a dye and the integrity of the nanoparticles is assessed. Figure 3A shows the influence of temperature on the transport of commercial FluoSpheres carboxylated 0.2 m yellow-green nanoparticles (see BOX 2) across co-cultures and monocultures. Fluorescent nanoparticles can also be visualized within the monolayers by confocal microscopy and can be localized by taking y-z, x-y and x-z sections of the monolayers (Figure 3B)20.
CRITICAL We assume that, in most cases, nanoparticles that can cross M cells and reach the basolateral side intact. Hence, to quantify the encapsulated cargo, nanoparticles need to be firstly disrupted. One way is by diluting the basolateral solution with an equal volume of the mobile phase used in the analytical method (e.g. HPLC or LC-MS/MS).
Figure 3. (A) Influence of temperature on the transport of FluoSpheres carboxylated 0.2 m yellow-green nanoparticles (4.5 × 10⁹ nanoparticles/ml) suspended in HBSS. Results were expressed as percentages of the donor solution. The number of transported nanoparticles was evaluated by flow cytometry. (a) *p<0.05 versus mono-cultures (b) *p<0.05 versus co-cultures when incubated at 4 and 10 °C; (B) y-z, x-y and x-z sections of saquinavir-loaded lipid-based nanoparticles labelled with coumarin-6 within cell monolayers. Nanoparticles
14
(green) can be localized within the cell monolayers. Reprinted and adapted with permission from Elsevier20.
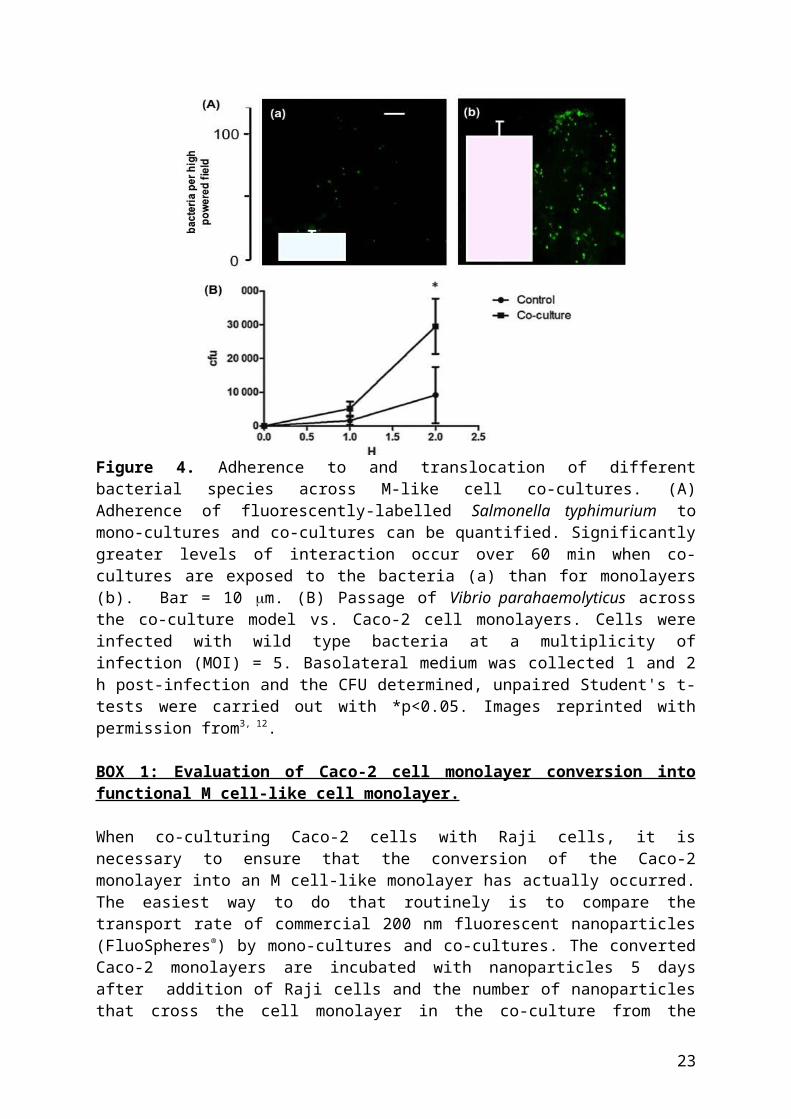
Bacterial association with epithelia can be measured using fluorescence microscopy. In the example below (Fig 4A), fluorescently-labelled Salmonella typhimurium was used to probe the model. Following washing steps, the number of fluorescent bacteria could be visualised and quantified. The number of translocated bacteria across M cells can be determined by calculating the number of colony forming units per ml (CFU/ml). Results can be expressed as percentage of bacteria translocated across co-cultured monolayers relative to control monolayers, or as CFU. Figure 4B reveals an increased number of Vibrio parahaemolyticus CFU traversing co-cultures compared to mono-cultures.
Figure 4. Adherence to and translocation of different bacterial species across M-like cell co-cultures. (A) Adherence of fluorescently-labelled Salmonella typhimurium to mono-cultures and co-cultures can be quantified. Significantly greater levels of interaction occur over 60 min when co-cultures are exposed to the bacteria (a) than for monolayers (b). Bar = 10 m. (B) Passage of Vibrio parahaemolyticus across the co-culture model vs. Caco-2 cell monolayers. Cells were infected with wild type bacteria at a multiplicity of infection (MOI) = 5. Basolateral medium was collected 1 and 2 h post-infection and the CFU determined, unpaired Student's t-tests were carried out with *p<0.05. Images reprinted with permission from3, 12.
BOX 1: Evaluation of Caco-2 cell monolayer conversion into functional M cell-like cell monolayer.
When co-culturing Caco-2 cells with Raji cells, it is necessary to ensure that the conversion of the Caco-2 monolayer into an M cell-like monolayer has actually occurred. The easiest way to do that routinely is to compare the transport rate of commercial 200 nm fluorescent nanoparticles (FluoSpheres®) by mono-cultures and co-cultures. The converted Caco-2 monolayers are incubated with nanoparticles 5 days after addition of Raji cells and the number of nanoparticles that cross the cell monolayer in the co-culture from the apical to the
15
basolateral side can be quantified by FACS (see BOX 2). The number of nanoparticles transported by co-cultures should be higher than the number of particles transported by mono-cultures. In our hands, we typically detect that ~80,000 nanoparticles can translocate across co-cultures versus ~100 for mono-cultures over 120 min?, approximately a 100-fold difference20. This control needs to be performed for each experiment.
CRITICAL STEP The TEER measurement at the beginning and end of particle translocation studies is highly dependent on temperature1. Perform the measurement at 37°C after letting the cell equilibrate in pre-warmed HBSS at 37°C.
Co-cultures have lower TEER values than Caco-2 cell monolayers (100-150 Ω·cm2 and over 200-250 Ω·cm2, respectively (values obtained in our laboratory when using a measurement chamber)). Alkaline phosphatase (AP) activity can be estimated by incubating the AP substrate p-nitrophenyl phosphate (500 l) per insert. Significant AP down-regulation is observed in co-cultures compared to mono-cultures. Another way of evaluating the degree of conversion of Caco-2 cells into M cell-like cells is to measure the Papp of the monolayers using [14C]-mannitol, a paracellular marker. We observed that Papp of [14C]-mannitol is around 2-fold higher in co-cultures and in general the increased flux is reciprocal to the reduced TEER values. These Papp values are in the range of 10-6 cm/s in Caco-2 monolayers, and around 5-fold higher in co-cultures.21
Other techniques can be used to validate the conversion of Caco-2 cells into M cell-like cells but are more difficult to routinely implement and should only be done when significant changes are made in the culture conditions, for example when a new batch of serum or new Caco-2 cells are brought. Scanning electronic microscopy (SEM) and transmission electron microscopy (TEM) can be used to visualize morphological changes that are characteristic of M cells (lack of microvilli at the apical surface, presence of desmosomes) (Figure 2). SEM analysis of the monolayer apical surface can be used to quantify the percentage of cells in the co-cultures that have lost the brush border.
16
BOX 2: Determination of commercial nanoparticle transport in the apical-to-basal direction by mono- and co-cultures.
TIMING 30 min-2 h without the FACS analysis. Start 1 h before the experiment.
1. Nanoparticle transport by co-cultures is temperature dependent, so all solutions and buffers used during the transport experiment should be pre-warmed at 37°C (30 min minimum).
2. Prepare the donor solution at a concentration of 4.5x10⁹ nanoparticles/ml in HBSS and incubate at 37°C. When using FluoSpheres®, this value is obtained when dispersing 5 µl of nanoparticles in 5 ml of HBSS.
3. Prepare receiver plates. Incubate at 37°C 12-well plates containing 1.2 ml of HBSS/well for each insert in as many wells as there are sampling points plus one.
4. Label FACS tubes for nanoparticle quantification.5. Wash the cell monolayers two times with HBSS (0.5 ml and 1.5 ml at the apical and
basolateral side, respectively) in 12-well plates and incubate at 37°C for 30 min. 6. Measure TEER values.7. Remove HBSS from the apical side and place the inserts in the pre-warmed 12-well
plate prepared at step 3. 8. Add 400 µl of the donor solution to each insert apically being careful not to spill any
in the basolateral compartment (1 ml of HBSS). Keep a volume of the donor solution to measure the exact number of nanoparticles in the donor solution by FACS.
9. Incubate at 37°C, 10% CO2 in a humidified chamber.10. Transport can be evaluated as one endpoint or as a kinetic (nanoparticle transport can
be evaluated every 30 min for instance or only after 2 h). For each time point, move each insert from one HBSS-containing well to the next. Be careful not to transfer one solution from the other if a kinetic is performed. Note that the duration of the experiment can be related to the subsequent transport experiment.
11. Place 500 µl of the basolateral compartment + 2.5 µl of red beads (Sphero™, Gentaur) + 5 µl of FBS in FACS tubes for FACS analysis. FBS is added to avoid the adherence of the nanoparticles to the tube walls.
12. To visualize the nanoparticles in the monolayer by confocal microscopy (see BOX 4), wash cells in cold HBSS and fix them 15-20 min at 4°C in 4% paraformaldehyde (PFA) if you want to mount them in microscopy slides.
PAUSE POINT Inserts fixed in 4% PFA can be kept in the fridge at 4°C until mounted on microscopy slides. We recommend not to keep them longer than one week in the fridge.
CAUTION! Use PFA under a chemical hood and avoid inhalation as this product is toxic.
13. Add 10 l of FBS to each well of the receiver plates to avoid nanoparticle adsorption on plastic (in FACS tubes). Transfer HBSS from the basolateral side of each well in FACS tubes and add 5 µl of Sphero fluorescent Nile red nanoparticles per ml of cell suspension as an internal standard for FACS analysis.
17
BOX 3: Evolution of the in vitro M cell models
The first M cell in vitro model to be reported was developed by Kerneis et al. 22. It consisted of a “mixed” co-culture of Caco-2 cells (human cells), seeded on the basolateral side of porous Transwell® inserts, and mouse lymphocytes isolated from Peyer’s Patches added in the apical compartment. The authors observed a higher transcytotic activity of particles triggered by Raji cells presenting B cell markers. To obtain a model based strictly on human cells and easier to set up, Gullberg et al.5 replaced mouse primary B lymphocytes by a human cell line (Raji cells), thus exploiting the findings of Kerneis et al for a fully human model. A human M-like cell model could enable the identification of surface markers, the study of the mechanisms involved in microoganism translocation and the development of M cell-targeted drug and vaccine delivery systems.23-25 For this purpose, Caco-2 cells were seeded at the upper side of the insert while Raji cells were grown at the lower side. This model had the advantage of keeping the two cells types apart so as to enable gene expression studies in a search for M-like cell surface targets for ligands that could be used in oral vaccine studies.26 Moreover, it allowed to study the B-cell released type 1 cytokines and other growth factors, including IL-6 and TNF-α, as it has been suggested that M-like cell conversion was akin to an acute inflammatory stimulus.27 The “inverted” protocol to address two main limitations encountered when working with the “non-inverted” Gullberg model:
i) inconsistencies between different experiments in the functionality of the M cell model regarding nanoparticle transport
ii) lack of intimate contact between the Caco-2 cells and the Raji cells as observed in vivo7.
The inversion of the inserts permitted an increase model reproducibility and to create an environment closer to the in vivo situation by placing the Raji cells in direct contact via filter pores with the Caco-2 cells growing on the opposite side of the membrane.
Since the development of this model, several groups have been working on further modifications of the initial human model described by Gullberg et al.5 Recently, a tri-culture model has been proposed by two groups, combining Caco-2 cells and HT29-MTX cells with Raji cells, thus adding mucus-secreting cells.28, 29 Also a murine and a bovine/murine mixed M cell model have been reported.30, 31 We note that in a recent paper examining uptake and translocation of nanoparticles comparing combined Caco-2, HT29 mucus-secreting cells and Raji B cells (triple culture) with a Caco-2/ Raji B co-culture, that the data was very similar between them, with the Raji-B presence being the most important factor in driving uptake. 32 Ragnarsson et al. also reported that Caco-2 cell incubation with Yersinia pseudotuberculosis resulted in an increased transport of nanoparticles similar to the one observed with co-culture M cell models33, perhaps also via an acute inflammatory trigger mechanism.
A recent culture system for M cell study came from ‘enteroid’ cultures treated with the cytokine receptor activator of NF-B (RANKL).34 RANKL and the transcription factor Spi-B are required for epithelial stem cell differentiation into M cells. This culture system consists of a three-dimensional culture technique using a growth factor-containing scaffold established with small intestinal crypts from mice.35 This model has been used to investigate the signaling pathways involved in M cell differentiation.
Among these M cell culture systems, the in vitro inverted M cell model provides several advantages over the rest: (i) it is based on co-culture with a well-established differentiated
18
human cell lines, (ii) is reproducible under the conditions described herein, (iii) can be easily mastered, and (iv) does not require the isolation of primary cells nor the use of animals. However, the selection of a model to study M cell depends on the question to be answered and the combination of different models is often required to gather complementary information.
BOX 4: Visualization of nanoparticles in the cell monolayers by confocal microscopy
After a nanoparticle transport experiment, cell monolayers can be fixed with PFA and nanoparticle localization can be visualized by confocal microscopy, providing that they are fluorescent.
TIMING 30 min-2 h, not including confocal analysis1. Take fixed inserts out of the fridge (Step 24, BOX 2) and wash them 2x in HBSS at
RT.2. Stain the cell cytoskeleton (Actin) with phalloidin labelled with a fluorescent dye
(Rhodamine or Alexa 568-phalloidin if the nanoparticles are “green” for instance). To stain actin, incubate each insert with 250 μl of fluorescent-phalloidin (4 U/ml) in HBSS+0.2% (v/v) Triton X-100 for 10 min away from direct light.
CAUTION! Triton X-100 is used to permeabilize the cell membranes, but it is also known to wash out the signal of certain dyes from the carbocyanine family (e.g. DiD)36. In these cases, Triton X-100 should be not used and the incubation time should be prolonged from 10 min to 2 h.
3. Wash the inserts gently with PBS and cut the filter out of the insert.4. Place on a microscopy slide, cells up and add a coverslip on top using a hardsetting
mounting medium containing DAPI, staining cell nuclei in blue, like VECTASHIELD HardSet Antifade Mounting Medium (Vector laboratories).
5. Let the mounting medium polymerize overnight protected from light.
PAUSE POINT Mounted inserts can be kept at -20°C for better preservation until confocal analysis.
6. Analyze using a confocal microscope to acquire x-y, x-z and y-z views of the cell monolayer to localize nanoparticles on the cell apical side, in the cells or at the cell basolateral side (see Figure 3B).
19

BOX 5 Study of M-like cell interaction with bacteria
Adherence and translocation of bacteria, and viruses are also signature of M-like cell conversion in co-cultures since Peyer’s patch M cells have specific receptors for uptake (e.g. Salmonella typhimurium, Vibrio parahaemolyticus, and viruses (reovirus, polio)). Salmonella enterica serovar typhimurium and Vibrio parahaemolyticus are suitable strains to examine for adherence and translocation respectively.
(a) Salmonella typhimurium adherence and internalization: TIMING 4 h
1. Using Mueller Hinton (MH)-2 agar plates at 37°C, a fluorescently-labelled colony is used to inoculate 50 ml of MH-2 broth and grown overnight at 100 rpm at 37°C. Green fluorescent protein (GFP)-transfected Salmonella are used37.
2. 100 µl of overnight culture is inoculated into 25 ml of MH-2 broth and grown for 180 min to obtain mid-log phase bacteria for invasion assay. 1 ml of mid-log phase bacteria is centrifuged at 15,000 g for 2 min. The pellet is washed twice with HBSS and re-suspended in 1 ml HBSS.
3. Filter-grown monolayers and co-cultures at Day 22 (5 days in co-culture) are infected apically for 60 min by diluting bacteria in an appropriate volume of HBSS to yield OD600 values (optical density of a sample measured at a wavelength of 600 nm) equivalent to the required multiplicity of infection (MOI) of 100 (e.g. 100 bacteria per epithelial cells). OD600 values are measured using a plate reader (e.g., UVM 340, ASYS Hitech, Austria).
4. GFP-labelled Salmonella are visualized on inserts associated with M-like cells using the FITC filter of a fluorescent microscope. The assay does not discriminate between adhered to internalized bacteria, but this can be done effectively using an anti-Salmonella primary antibody followed by TRITC-conjugated secondary antibody, neither of which can access intracellular locations and which therefore give a measure of adhered bacteria.
5. Results are expressed as mean bacterial count per high powered microscopic field (0.4 mm2). The bacteria preferentially adhere to and invade co-cultures with a high proportion of M-like cells. Sample data of co-culture associated bacteria versus monocultures is shown in Figure 4.
(b) Vibrio parahaemolyticus translocation: TIMING 4 h
1. Vibrio parahaemolyticus is grown at 37 °C in Luria–Bertani medium (LBM) (10.0 g l−1 tryptone, 5.0 g l−1yeast extract, 10.0 g l−1 sodium chloride) supplemented with 3% (w/v) NaCl (LBN) and the addition of 1.5% (w/v) agar where appropriate.
2. Bacteria are grown to mid-log phase in LBN at 37 °C with agitation. The bacteria are then washed with PBS, and OD600 values are measured to determine bacterial numbers.
3. Cells are washed twice with PBS, and fresh DMEM minus PEST is added 2 h before infection. In all experiments, cells are infected at an MOI = 5. Bacteria are added to
20
the apical chamber of the inserts, and monolayers are incubated at 37 °C for 1 h with agitation. Following incubation, all basolateral medium is removed and replaced with pre-warmed DMEM minus PEST.
4. The monolayers are then incubated at 37 °C for a further hour with agitation, and the basolateral medium is again collected.
5. The basolateral medium is then serially diluted and plated on LBN. 6. TEER is measured at 0, 1 and 2 h time points. All LBN plates are incubated at 37 °C
overnight. 7. The number of translocated bacteria is determined by plating serial dilutions from the
basolateral compartments on MH-2 agar plates and calculating the number of colony forming units per ml (CFU/ml). Results can be expressed as percentage of bacteria translocated across co-cultured monolayers relative to control monolayers12.
ACKNOWLEDGMENTS
A. Beloqui is a postdoctoral researcher from the Belgian Fonds National de la Recherche Scientifique (F.R.S. — FNRS), Belgium. A. des Rieux is a research associate of the Fonds de la Recherche Scientifique (F.R.S. — FNRS), Belgium. We thank Dr. Tauseef Ahmad for assistance with interpreting the microbiology studies at University College Dublin. The research leading to some of these results has received funding from the European Union Seventh Framework Programme (FP7 / 2007-2013) under grant agreement n° 281035"
1. Hubatsch, I., Ragnarsson, E.G. & Artursson, P. Determination of drug permeability and prediction of drug absorption in Caco-2 monolayers. Nat Protoc 2, 2111-2119 (2007).
2. des Rieux, A., Fievez, V., Garinot, M., Schneider, Y.J. & Préat, V. Nanoparticles as potential oral delivery systems of proteins and vaccines: a mechanistic approach. J Control Release 116, 1-27 (2006).
3. Brayden, D.J., Jepson, M.A. & Baird, A.W. Keynote review: intestinal Peyer's patch M cells and oral vaccine targeting. Drug Discov Today 10, 1145-1157 (2005).
4. Brayden, D.J. & Baird, A.W. Microparticle vaccine approaches to stimulate mucosal immunisation. Microbes Infect 3, 867-876 (2001).
5. Gullberg, E. et al. Expression of specific markers and particle transport in a new human intestinal M-cell model. Biochem Biophys Res Commun 279, 808-813 (2000).
6. des Rieux, A. et al. Transport of nanoparticles across an in vitro model of the human intestinal follicle associated epithelium. Eur J Pharm Sci 25, 455-465 (2005).
7. des Rieux, A. et al. An improved in vitro model of human intestinal follicle-associated epithelium to study nanoparticle transport by M cells. Eur J Pharm Sci 30, 380-391 (2007).
8. des Rieux, A. et al. Helodermin-loaded nanoparticles: characterization and transport across an in vitro model of the follicle-associated epithelium. J Control Release 118, 294-302 (2007).
9. Slutter, B. et al. Mechanistic study of the adjuvant effect of biodegradable nanoparticles in mucosal vaccination. J Control Release 138, 113-121 (2009).
10. Garinot, M. et al. PEGylated PLGA-based nanoparticles targeting M cells for oral vaccination. J Control Release 120, 195-204 (2007).
21
11. Fievez, V. et al. In vitro identification of targeting ligands of human M cells by phage display. Int J Pharm 394, 35-42 (2010).
12. Finn, R. et al. Translocation of Vibrio parahaemolyticus across an in vitro M cell model. FEMS Microbiol Lett 350, 65-71 (2014).
13. Antunes, F., Andrade, F., Araujo, F., Ferreira, D. & Sarmento, B. Establishment of a triple co-culture in vitro cell models to study intestinal absorption of peptide drugs. Eur J Pharm Biopharm 83, 427-435 (2013).
14. Coco, R. et al. Drug delivery to inflamed colon by nanoparticles: comparison of different strategies. Int J Pharm 440, 3-12 (2013).
15. Siissalo, S. et al. Effect of cell differentiation and passage number on the expression of efflux proteins in wild type and vinblastine-induced Caco-2 cell lines. Eur J Pharm Biopharm 67, 548-554 (2007).
16. Makino, K. et al. Genome sequence of Vibrio parahaemolyticus: a pathogenic mechanism distinct from that of V cholerae. Lancet 361, 743-749 (2003).
17. Cedervall, T. et al. Understanding the nanoparticle-protein corona using methods to quantify exchange rates and affinities of proteins for nanoparticles. Proc Natl Acad Sci U S A 104, 2050-2055 (2007).
18. Velin, A.K., Ericson, A.C., Braaf, Y., Wallon, C. & Söderholm, J.D. Increased antigen and bacterial uptake in follicle associated epithelium induced by chronic psychological stress in rats. Gut 53, 494-500 (2004).
19. Beloqui, A., des Rieux, A. & Préat, V. Mechanisms of transport of polymeric and lipidic nanoparticles across the intestinal barrier. Adv Drug Deliv Rev (2016).
20. Beloqui, A. et al. Mechanism of transport of saquinavir-loaded nanostructured lipid carriers across the intestinal barrier. J Control Release 166, 115-123 (2013).
21. Artursson, P., Palm, K. & Luthman, K. Caco-2 monolayers in experimental and theoretical predictions of drug transport. Adv Drug Deliv Rev 46, 27-43 (2001).
22. Kerneis, S., Bogdanova, A., Kraehenbuhl, J.P. & Pringault, E. Conversion by Peyer's patch lymphocytes of human enterocytes into M cells that transport bacteria. Science 277, 949-952 (1997).
23. Ohno, H. Intestinal M cells. J Biochem 159, 151-160 (2016). 24. des Rieux, A., Pourcelle, V., Cani, P.D., Marchand-Brynaert, J. & Préat, V.
Targeted nanoparticles with novel non-peptidic ligands for oral delivery. Adv Drug Deliv Rev 65, 833-844 (2013).
25. Gullberg, E. et al. Identification of cell adhesion molecules in the human follicle-associated epithelium that improve nanoparticle uptake into the Peyer's patches. J Pharmacol Exp Ther 319, 632-639 (2006).
26. Lo, D. et al. Cell culture modeling of specialized tissue: identification of genes expressed specifically by follicle-associated epithelium of Peyer's patch by expression profiling of Caco-2/Raji co-cultures. Int Immunol 16, 91-99 (2004).
27. Miyake, M., Ragnarsson, E., Nakai, D. & Artursson, P. The Pro-inflammatory Cytokine Interleukin-6 Regulates Nanoparticle Transport Across Model Follicle-Associated Epithelium Cells. J Pharm Sci 105, 2099-2104 (2016).
28. Araujo, F. et al. In vitro M-like cells genesis through a tissue-engineered triple-culture intestinal model. J Biomed Mater Res B Appl Biomater (2015).
22
29. Schimpel, C. et al. Development of an advanced intestinal in vitro triple culture permeability model to study transport of nanoparticles. Mol Pharm 11, 808-818 (2014).
30. Gonzalez-Hernandez, M.B. et al. Murine norovirus transcytosis across an in vitro polarized murine intestinal epithelial monolayer is mediated by M-like cells. J Virol 87, 12685-12693 (2013).
31. Miyazawa, K. et al. Transcytosis of murine-adapted bovine spongiform encephalopathy agents in an in vitro bovine M cell model. J Virol 84, 12285-12291 (2010).
32. Banerjee, A., Qi, J., Gogoi, R., Wong, J. & Mitragotri, S. Role of nanoparticle size, shape and surface chemistry in oral drug delivery. J Control Release 238, 176-185 (2016).
33. Ragnarsson, E.G. et al. Yersinia pseudotuberculosis induces transcytosis of nanoparticles across human intestinal villus epithelium via invasin-dependent macropinocytosis. Lab Invest 88, 1215-1226 (2008).
34. de Lau, W. et al. Peyer's patch M cells derived from Lgr5(+) stem cells require SpiB and are induced by RankL in cultured "miniguts". Mol Cell Biol 32, 3639-3647 (2012).
35. Wood, M.B., Rios, D. & Williams, I.R. TNF-α augments RANKL-dependent intestinal M cell differentiation in enteroid cultures. Am J Physiol Cell Physiol 311, C498-507 (2016).
36. Carradori, D., Barreau, K. & Eyer, J. The carbocyanine dye DiD labels in vitro and in vivo neural stem cells of the subventricular zone as well as myelinated structures following in vivo injection in the lateral ventricle. J Neurosci Res 94, 139-148 (2016).
37. Clark, L., Martinez-Argudo, I., Humphrey, T.J. & Jepson, M.A. GFP plasmid-induced defects in Salmonella invasion depend on plasmid architecture, not protein expression. Microbiology 155, 461-467 (2009).
23


![Liposomes the potential drug carriers - IOSR-PHR · Liposomes – the potential drug carriers 28 1.3.1.2. Membrane Additives [Sterols] Cholesterol is the most commonly used sterol,](https://static.fdocuments.fr/doc/165x107/5ec63da195aa25320c743ecf/liposomes-the-potential-drug-carriers-iosr-liposomes-a-the-potential-drug-carriers.jpg)