
Clash of Civilizations and the Impact of Cultural Di ... · Clash of Civilizations and the Impact...
53
Clash of Civilizations and the Impact of Cultural Di/erences on Trade Gunes Gokmen New Economic School November 2013 Abstract Using data on bilateral trade and measures of culture, this paper evaluates how the impact of cultural di/erences on trade evolves over time. Moreover, this is the rst study to probe Huntingtons Clash of Civilizations hypothesis from an economic perspective. We analyze the dynamics of the e/ect of cultural di/erences on trade and provide evi- dence that the negative inuence of cultural di/erences on trade is more prominent in the post-Cold War era than during the Cold War. For instance, two countries with distinct religious majorities have 35% lower bilateral trade ows during the post-Cold War period compared to countries sharing the same majority religion, whereas this negative e/ect is less than half, at 16%, during the Cold War. In addition, we provide an explanation for the di/erential impact of cultural di/erences over time. By mapping out the transition of the e/ects of cultural and ideological dissimilarities, we show that cold-war ideological blocs are the reason for the suppression of cultural di/erences during the Cold War. Keywords: Cold War, culture, economic clash, trade. JEL Classication: F1, Z10. [email protected]. New Economic School. I am indebted to Alberto Alesina, Maristella Botticini, Gio- vanni Bruno, Klaus Desmet, Marc Dincecco, Simeon Djankov, Paolo Epifani, Alessandra Fogli, Selim Gulesci, Andreas Madestam, Kiminori Matsuyama, Matthias Messner, Tommaso Nannicini, Michele Pelizzari, Barbara Petrongolo, Giovanni Pica, Massimiliano Onorato, Guido Tabellini, Silvana Tenreyro, Pierre-Louis Vezina, Romain Wacziarg, Shlomo Weber and to the seminar participants at Bocconi University, SantAnna School of Advanced Studies, IMT Lucca, Catholic University of Milan, Augustin Cournot Doctoral Days, XIII Con- ference on International Economics, 21st Silvaplana Workshop in Political Economy, EDGE Jamboree and ETSG2012 for their help and support. 1
Transcript of Clash of Civilizations and the Impact of Cultural Di ... · Clash of Civilizations and the Impact...
Clash of Civilizations and the Impact of Cultural Di¤erences
on Trade
Gunes Gokmen�
New Economic School
November 2013
Abstract
Using data on bilateral trade and measures of culture, this paper evaluates how the
impact of cultural di¤erences on trade evolves over time. Moreover, this is the �rst study
to probe Huntington�s Clash of Civilizations hypothesis from an economic perspective.
We analyze the dynamics of the e¤ect of cultural di¤erences on trade and provide evi-
dence that the negative in�uence of cultural di¤erences on trade is more prominent in the
post-Cold War era than during the Cold War. For instance, two countries with distinct
religious majorities have 35% lower bilateral trade �ows during the post-Cold War period
compared to countries sharing the same majority religion, whereas this negative e¤ect is
less than half, at 16%, during the Cold War. In addition, we provide an explanation for
the di¤erential impact of cultural di¤erences over time. By mapping out the transition
of the e¤ects of cultural and ideological dissimilarities, we show that cold-war ideological
blocs are the reason for the suppression of cultural di¤erences during the Cold War.
Keywords: Cold War, culture, economic clash, trade.
JEL Classi�cation: F1, Z10.
�[email protected]. New Economic School. I am indebted to Alberto Alesina, Maristella Botticini, Gio-vanni Bruno, Klaus Desmet, Marc Dincecco, Simeon Djankov, Paolo Epifani, Alessandra Fogli, Selim Gulesci,Andreas Madestam, Kiminori Matsuyama, Matthias Messner, Tommaso Nannicini, Michele Pelizzari, BarbaraPetrongolo, Giovanni Pica, Massimiliano Onorato, Guido Tabellini, Silvana Tenreyro, Pierre-Louis Vezina,Romain Wacziarg, Shlomo Weber and to the seminar participants at Bocconi University, Sant�Anna Schoolof Advanced Studies, IMT Lucca, Catholic University of Milan, Augustin Cournot Doctoral Days, XIII Con-ference on International Economics, 21st Silvaplana Workshop in Political Economy, EDGE Jamboree andETSG2012 for their help and support.
1
1 Introduction
Cultural di¤erences play an important role in economic interactions between countries (Fel-
bermayr and Toubal, 2010; Guiso et al., 2009; Melitz, 2008; Rauch and Trindade, 2002). In
this context, cultural di¤erences are considered a source of informational cost and/or a source
of uncertainty that acts as a barrier in bilateral trade relations between countries. We add to
this line of discussion by scrutinizing how the impact of cultural di¤erences on trade evolves
over time and how this impact interacts with the Cold War.
We start by examining whether cultural di¤erences between countries are a trade bar-
rier. Using data on bilateral imports over 1950-2006 and Huntington�s (1998) typology of
civilizations, we provide evidence that when two countries belong to di¤erent civilizations
their imports are 20% lower than those of two countries from the same civilization. We fur-
ther extend the analysis using Ellingsen�s measure of religious, ethnic and linguistic groups
within countries and examine whether sharing any of these cultural heritages has an impact
on countries�trade relations. We show that when two countries have distinct religious ma-
jorities, distinct ethnic majorities or distinct linguistic majorities, their trade relations are
impeded. For instance, two countries with di¤erent dominant ethnicities have 38% lower im-
ports than those sharing the same ethnicity, controlling for standard bilateral trade barriers
and time-varying multilateral resistance terms.
However, the main contribution of this paper lies in examining Huntington�s Clash of
Civilizations hypothesis from an economic point of view. Huntington (1993a, 1993b) argues
that the great divisions among humankind and the dominating source of clashes in the post-
Cold War era will be cultural, and states from di¤erent cultures will compete for economic
and political power. Although the Clash of Civilizations in the post-Cold War hypothesis
has enticed a number of authors into testing it for militarized disputes between countries,1
its general implications for economic interaction among cultural groups remained overlooked.
This is the aim of the present paper.
We analyze the dynamics of the e¤ect of cultural di¤erences on trade and provide evidence
1See Chiozza (2002), Henderson and Tucker (2001), Russett et al. (2000).
2
that the negative in�uence of cultural di¤erences on trade is larger in the post-Cold War era
than during the Cold War. For instance, in the post-Cold War period, two countries with
distinct religious majorities have 35% lower imports than those sharing the same religion,
whereas this negative e¤ect is less than half, at 16%, during the Cold War. We additionally
ask what costs cultural di¤erences bring about and quantify the tari¤ equivalent costs of
cultural di¤erences for standard levels of elasticities of substitution in the literature. While
the tari¤ equivalent cost of cultural di¤erences varies between 0.5% and 8.7% during the Cold
War, this additional cost is between 5.8% and 30.4% in the post-Cold War era.
Furthermore, we provide an explanation for the di¤erential e¤ect of culture in the Cold
War and the post-Cold War periods. We �rst assign each country to a cold-war bloc to create
an indicator of di¤erent ideological alignments. We next show that belonging to di¤erent cold-
war blocs signi�cantly hampered bilateral trade relations during the Cold War. Subsequently,
by mapping out the transition of the e¤ects of cultural and ideological di¤erences throughout
years, we show that cold-war ideological blocs are the reason for the suppression of cultural
di¤erences. That is why the impact of cultural di¤erences was not as salient during the Cold
War and was dwarfed by the e¤ect of ideology. Thus, when the Cold War came to an end,
the in�uence of separate ideological camps was lifted and cultural di¤erences became more
prominent. To further support this hypothesis, we show that cultural di¤erences did not
negatively a¤ect trade relations when two countries were in the same bloc during the Cold
War.
Our results are robust to alternative speci�cations. We estimate a theory-based gravity
model of international trade so as to take into account multilateral resistance terms, omission
of which leads to biased estimates (Anderson and Van Wincoop, 2003; Baldwin and Taglioni,
2007). We also employ a set of cultural-di¤erence measures that allow us to capture di¤erent
aspects of culture. Unlike other existing studies (Felbermayr and Toubal, 2010; Giuliano et
al., 2006; Guiso et al., 2009; Rauch and Trindade, 2002), our data set contains the entire range
of world countries. We control for a large array of measures of geographic barriers as well as
historical and policy-related determinants of trade. Moreover, we include time-varying origin
3
and destination-�xed e¤ects to account for the multilateral resistance terms, while standard
errors are clustered at the country pair level. Our results hold when including a rich set of
geographic controls, genetic distance as an alternative measure of culture, taking into account
political proximity and lagged imports, and carrying out a principal component analysis of
cultural di¤erence. The two-step Heckman selection model, the hyperbolic sine transformation
method and a probit model also show that our results are robust to the omission of zero trade
�ows.
This paper adds to the literature on trade and culture by bringing in the dynamics and
showing the evolution of the e¤ects of culture. For instance, Felbermayr and Toubal (2010)
establish a correlation between culture and trade using scores from the Eurovision Song Con-
test as a proxy for cultural proximity. Giuliano et al. (2006) question the validity of genetic
distance as a proxy for cultural distance in explaining trade relations and show that genetic
distance only captures geographic barriers that are re�ected in transportation costs across
Europe. Guiso et al. (2009), on the other hand, show that bilateral trust between pairs of
European countries leads to higher trade between them. Melitz (2008) disentangles the chan-
nels of linguistic commonality and �nds that ease of communication facilitates trade rather
through the ability to communicate directly than through translation.
This study also contributes to the literature in political science and international relations
on Clash of Civilizations thesis by adding an economic perspective. This strand of the liter-
ature has focused largely on the militarized disputes aspect of the thesis and has overlooked
its economic implications.2
Another strand of related literature looks at trade in the context of the Cold War. Berger
et al. (2013) show that during the Cold War imports from the US increased as a result of
stronger political in�uence arising from CIA interventions. Djankov and Freund (2002) study
trade between nine Russian regions and fourteen former Soviet republics and �nd that there
is an increasing bias toward domestic trade after the disintegration of the Soviet Union.
The paper proceeds as follows. Section 2 lays out the methodology and describes the data.
2For a discussion on the militarized con�ict aspect of the thesis, see Chiozza (2002), Henderson and Tucker(2001), Russett et al. (2000).
4
Section 3 provides baseline estimation results. Section 4 tests Huntington�s "The Clash of
Civilizations?" hypothesis from an economic perspective. Section 5 proposes an underlying
mechanism. Section 6 challenges the sensitivity and robustness of our results. Section 7
concludes.
2 Methodology and Data
We use the standard gravity equation following Anderson and Van Wincoop (2003), who
facilitate the estimation of key parameters in a theoretical gravity equation relating bilateral
trade to size, bilateral trade barriers and multilateral resistance terms. From the theory, we
can derive the gravity equation as:
Mij = GYiYj
���1ij
(1)
where G � 1Y
�1
iPj
�(1��):
Mij is the nominal value of imports from country i to country j; Yi and Yj are country i�s
and country j�s economic sizes, respectively; � ij is bilateral trade costs; Y is world nominal
income; � is the elasticity of substitution between goods; i and Pj can be thought of as price
indices.
� ij re�ects all trade costs, natural and man-made, between country i and country j: In
addition to transportation costs, these trade costs might re�ect information costs, legal costs,
regulatory and institutional costs, cost of business norms and all the remaining costs that
altogether accrue up to bilateral trade barriers. This is where we see our measures of cultural
di¤erence come into play as one of the bilateral trade barriers. Cultural dissimilarities between
countries might act as a source of informational cost and a source of uncertainty that create
a barrier in bilateral trade relations.
The gravity equation relates bilateral imports positively to the size of the countries and
negatively to the trade barriers between countries (� > 1). Bilateral trade barriers, � ij , are
also referred to as "bilateral resistance" terms. Moreover, it is important to notice that the G
5
term bears the price indices of the two countries.3 Although i and Pj could be interpreted
as price indices in the model, they cannot be interpreted as price levels in general.4 These
unobservable variables should be better thought of as nonpecuniary trade costs a country has
with all its trading partners. Hence, i and Pj represent average trade barriers of country i
and country j, respectively, which we refer to as "multilateral resistance" terms.
Log-linearization of equation (1) gives us the empirical counterpart of the gravity equation
that we are going to use throughout:
logMij = � log Y + log YiYj + (1� �) log � ij + (� � 1) log iPj (2)
Bilateral import �ows and income variables are measured in current US Dollars (millions).
Using real income variables instead would require us to de�ate nominal trade values as well.
Unfortunately, good price indices for bilateral trade �ows are often unavailable. Hence, most
authors de�ate the nominal trade values using some price index for the U.S. This inappropriate
de�ation of nominal trade values is a common mistake that yields biased results (Baldwin and
Taglioni, 2007). As suggested by Baldwin and Taglioni (2007), this problem can be overcome
by including time dummies, which will account for some of the proper conversion factor
between U.S. dollars in di¤erent years and will thus reduce the bias. Moreover, time-�xed
e¤ects allow the intercept to vary across periods in order to account for di¤erent distributions
in di¤erent time periods, which takes care of time-varying trends.
One last pending issue is how to treat multilateral resistance terms. Although multilateral
resistance terms are unobservable, their omission might lead to biased estimates as they are
a function of bilateral resistance terms (Anderson and Van Wincoop, 2003). To remedy this
problem, Anderson and Van Wincoop (2003) suggest that multilateral resistance terms can
be accounted for with country-speci�c dummies in order to get consistent estimates. Feenstra
(2002) shows that an estimation strategy with exporting and importing country �xed e¤ects
produces consistent estimates. Hence, our estimation strategy is to replace multilateral resis-
3Under the assumption of symmetric trade costs, � ij = � ji, i will be equal to Pi:4With asymmetric trade costs, i will not be identical to a CES price index. In the literature, it is commonly
thought of as exporter�s market potential, market openness or remoteness.
6
tance terms with country �xed e¤ects. It is important to note that the gravitational constant
of the physical gravity equation, G, is an unconstant in economics, and it varies over time
(Baldwin and Taglioni, 2007). Therefore, with panels such importing and exporting country
�xed e¤ects should be time-varying as well. Finally, we have our empirical speci�cation that
is a log-linearized version of equation (1) together with time-varying importing and exporting
country �xed e¤ects.
Although it is well-acknowledged in the literature that time-varying country �xed e¤ects
are required to obtain consistent estimates of the gravity model, execution of such an es-
timation strategy has proved di¢ cult due to the very high dimensionality of the problem.5
Depending on the time period and the number of countries covered, the number of dummies
can go up to twenty thousand. In a recent paper, Guimarães and Portugal (2010) propose an
alternative iterative procedure to estimate linear models with high dimensional �xed e¤ects.
This procedure, dubbed "cyclic-ascent" or "zigzag" algorithm, requires running regressions
with k explanatory variables in a �rst step and then computing means of residuals in a second
step to acquire the �xed e¤ect estimates that are to be used to reestimate the coe¢ cients of
the k explanatory variables. The same steps are repeated until convergence. Consequently,
the "zigzag" algorithm allows us to estimate the gravity model with high dimensional time-
varying importer and exporter �xed e¤ects and get consistent estimates.
Our focus in estimation is on the cultural barriers to trade. Cultural variables re�ect,
among other things, business norms, customs, beliefs, trust and information costs. They
accrue up to bilateral barriers to trade and, in turn, might impede trade relations between
countries. We disaggregate the bilateral trade barriers term and write our variable of interest �
namely, cultural di¤erence�from other bilateral trade barriers. Hence, we restate the empirical
speci�cation in the following �nal form:
log Importsijt = a+ Cij + �k�kijt +Ri � Y eart +Rj � Y eart + �ijt (3)
where Importsijt is imports from country i to j; a is a constant; Cij is our variable of
5See, for instance, Head et al. (2010).
7
interest, which is a binary variable that captures cultural di¤erences across country pairs; �kijt
represents all of the k control variables we account for as bilateral trade barriers other than
culture; Ri is exporting country �xed e¤ects; Rj is importing country �xed e¤ects; Y eart is
yearly time �xed e¤ects; and �ijt is the unaccounted-for error term.
2.1 Data
Measure of Trade. As in Berger et al. (2013), trade data come from the Correlates of War
Trade Data Set (Barbieri et al., 2008).6 Within this data set, the majority of the post-WWII
data were obtained from the International Monetary Fund�s Direction of Trade Statistics.
Measures of Culture. As a �rst measure of culture 179 countries are classi�ed as mem-
bers of various civilizations. As described in Huntington (1998), these civilizations are West-
ern, Sinic, Islamic, Hindu, Orthodox, Latin American, African, Buddhist and "Lone" States.
The classi�cation and the construction of civilization membership is based on Huntington
(1998). Accordingly, each country is assigned to a civilization.
Furthermore, country pairs are formed by pairing each country with one another. To
indicate civilizational dissimilarity within a pair we construct a variable, labeled "Di¤erent
Civilizations," denoting whether a pair of countries belong to di¤erent civilizations. This
variable is coded as one if in a pair the two countries i and j belong to di¤erent civilizations
and as zero if both countries belong to the same civilization. Out of 15931 country-pairs, 2875
pairs are formed of countries belonging to the same civilization and 13056 pairs belonging to
di¤erent civilizations.
As a further measure of cultural di¤erence we use Tanja Ellingsen�s "Ethnic Witches�
Brew Data Set," which provides us with data on religious, linguistic and ethnic fragmentation
within countries between 1945-2001.7 Ellingsen (2000) collected data on the size, the name
and the number of the linguistic, religious, and ethnic dominant groups; the size and the name
of the linguistic, religious, and ethnic minority groups as well as ethnic a¢ nities.8 What is
6This data set is available at http://www.correlatesofwar.org/.7The original data by Tanja Ellingsen runs from 1945 to 1994. We use the version of the data by Gartzke
and Gleditsch (2006).8She has obtained information from three reference books: Handbook of the Nations, Britannica Book of
8
particularly important for our purposes in this data set is the information on the name and
proportional size of the largest linguistic, religious, and ethnic groups. Similar to Gartzke and
Gleditsch (2006), we have indicator variables for whether the two countries in a pair have the
same dominant religion, language and ethnicity. However, we recode these variables so that
they take value one when two countries have di¤erent majority religion or di¤erent majority
ethnicity or di¤erent majority language.
Other Determinants of Trade. Geographic barriers are proxies for transportation as
well as information costs. Correspondingly, we have a range of geographic metrics such as a
contiguity variable that takes value one if there is any sort of land or water contiguity between
two countries in a pair, and value zero otherwise.9 Additional geographic distance metrics
such as the measure of the great circle (geodesic) distance between the major cities of the
countries are also taken into account.10
To control for historical, political and institutional links we include dummy variables for
whether a pair of countries ever had a colonial relationship, i.e. whether one was a colony
of the other at some point in time; had a common colonizer after 1945, i.e. whether the two
countries have been colonized by the same third country; and whether the two countries have
been part of the same polity.11 In addition, a dummy variable for whether two countries in a
pair have the same legal origins is created. The same legal origins in a pair of countries might
reduce information costs related to legal and regulatory systems. Moreover, sharing the same
legal origins might enhance trust between interacting parties (Guiso et al., 2009). Hence, we
have a binary variable that takes value one if the two countries in a pair have the same legal
origins, and zero otherwise. 12
We also take into account policy related dyadic variables. As such, free trade area (FTA),
GATT/WTO membership, common currency and generalized system of preferences (GSP)
the Year and Demographic Yearbook.9Contiguity data come from Correlates of War Project, Direct Contiguity Data, 1816-2006, Version 3.1
(Stinnett et al., 2002).10See Head and Mayer (2002) for details.11These data come from CEPII. The data are available at http://www.cepii.fr/anglaisgraph/bdd/distances.htm.12Legal origin indicators (common law, French civil law, German civil law, Scandinavian law, and Socialist
law) are from La Porta et al. (1999).
9
data are from Martin, Mayer and Thoenig (2008) and Thierry Mayer�s webpage.13 ;14
3 Baseline Results
We start o¤ with simple correlation coe¢ cients between imports and our measures of culture.
We observe in Table 1 that all of the variables of culture indicate a negative relationship
between trade �ows and dissimilar cultural heritage. Moreover, the di¤erent civilizations
indicator is highly correlated with di¤erent religion and di¤erent language. We also observe
a high correlation between di¤erent language and di¤erent ethnicity.
We next extend the standard "gravity" model of bilateral trade relating the natural loga-
rithm of trade to the joint income of the countries, the log of the distance between them and
border e¤ects (see Anderson and van Wincoop, 2003) by accounting for dyadic trade barriers
and time-varying multilateral resistance terms. Table 2 provides the estimation output. In
column (1) of Table 2 we look at how di¤erent civilizational memberships impact trade in a
gravity equation regression controlling for other determinants of trade �ows and time-varying
importing and exporting country �xed e¤ects. The e¤ect of di¤erent civilizations indicator is
both economically and statistically signi�cant. If two countries in a pair belong to di¤erent
civilizations their import �ows drop by 20%.15
We extend the basic speci�cation by accounting for a full set of geographic, historical and
political, and economic barriers to trade. Distance decreases trade, while contiguity increases
trade. Colonial links and common history are commonly considered to re�ect historical and
institutional backgrounds (Blomberg and Hess, 2006; Glick and Taylor, 2005). Since they
might be capturing an element of culture as well, the coe¢ cient on di¤erent civilizations
variable is reduced with the inclusion of colonial links, common colonizer and same country
dummies. Colonial links and common history increase trade relations. Sharing the same legal
13Available at http://econ.sciences-po.fr/node/131.14As noted by Anderson and van Wincoop (2004), regional trade agreements may not be exogenous, and
therefore, FTA included contemporaneously may su¤er from reverse causality. A reasoning for this is thatcountries might have agreed on a trade agreement since they already have been trading lots for many reasonsthat are not observed by the econometrician. Consequently, we tried lagging FTA variable to overcome reversecausality up to four-period lags. The results concerning our variables of interest carry over.15Since [exp(�0:227)� 1] � 100 ' �20%
10
origins might proxy for informational costs as well as norms of dealing with property rights
(Guiso et al., 2009). Table 2 tells us that countries with the same legal origin trade signi�-
cantly more. We also take into account policy related variables such as free trade agreements
(FTA), GATT/WTO membership, common currency and GSP. As expected, FTAs, common
GATT/WTO memberships, common currency and GSP positively a¤ect trade �ows. With
this entire set of controls, our di¤erent civilizations indicator maintains its signi�cant e¤ect.
To reiterate our �ndings further we investigate the e¤ect of other measures of cultural
di¤erences. Using Ellingsen�s Measure of majority religions, ethnicities and languages within
countries we probe the relationship between trade �ows and sharing dominant religious, ethnic
and linguistic heritages. To this end, we bring in new indicator variables for when the two
countries in a pair have di¤erent majority religions or di¤erent majority ethnicities or di¤erent
majority languages.
The second column of Table 2 shows that having di¤erent dominant religion negatively
a¤ects trade relations. Columns (3) and (4) do the same exercise when the two countries have
di¤erent majority ethnicities and di¤erent majority languages, respectively. When the two
countries have di¤erent dominant ethnicities they have about 38% lower import �ows than
the two countries with the same dominant ethnicity. On the other hand, two countries with
di¤erent majority languages have 46% less imports. Columns (5), (6) and (7) look at the
e¤ects of three indicators of cultural di¤erence when language is controlled for. We do that in
order to show that cultural di¤erence variables on civilizations, religion and ethnicity do not
only capture the e¤ect coming from communication channels. As such, we show that even
when the communication channel is taken into account previous results carry over. In column
(8), we include all of the measures of cultural dissimilarity together and observe that only
the di¤erent civilizations variable does not survive, and hence, all the variation in cultural
dissimilarity can be explained by religion, ethnicity and language.
From the analysis of this section we can conclude that cultural di¤erences negatively a¤ect
countries�bilateral trade relations and countries of di¤erent cultures trade signi�cantly less
than those of the same culture.
11
4 Economic Clash of Civilizations?
When Samuel Huntington put "The Clash of Civilizations?" hypothesis forward, arguing that
"the great divisions among humankind and the dominating source of con�ict in the post-
Cold War era will be cultural" (Huntington, 1993a), he did not only have military clashes in
mind but also economic and political ones. At the micro level, the violent struggles among
peoples will result from the fault lines between civilizations, while at the macro level states
from di¤erent civilizations will compete for economic and political power (Huntington, 1993a).
Dissimilarity in culture engenders di¤erences over issues ranging from human rights to immi-
gration and, more importantly in this paper�s context, to trade and commerce. Huntington�s
"The Clash of Civilizations?" hypothesis drew a lot of attention to military con�icts between
countries and some authors have tested it from di¤erent angles (Chiozza, 2002; Henderson and
Tucker, 2001; Russett et al., 2000). Nevertheless, to our knowledge, the economic clash aspect
has never been put to rigorous econometric testing. Therefore, we test whether there has been
an ampli�cation in the negative e¤ect of cultural di¤erences on trade in the post-Cold War
era.
Huntington takes civilizations as the main unit of his analyses. A civilization is de�ned as
"a cultural entity, the highest cultural grouping of people and the broadest level of cultural
identity people have short of what distinguishes humans from other species. It is de�ned both
by common objective elements, such as language, history, religion, customs, institutions, and
by the subjective self-identi�cation of people�.16 He considers the central de�ning charac-
teristic of a civilization as its religion; hence, the major civilizations in human history have
been closely identi�ed with the world�s great religions. These civilizations outlined include the
Sinic, Japanese, Hindu, Islamic, Orthodox, Western, Latin American, Buddhist and possibly
African civilizations plus "Lone" countries that do not belong to any of the major civilizations.
Huntington argues that identity at any level - personal, tribal, racial, cultural - can only be
de�ned in relation to an "other", a di¤erent person, tribe, race, or culture. This brings about
a group identity in the simple form of "us" and "them" that nurtures clashes with those that
16Huntington (1993a), p.23-24.
12
are di¤erent. Thus, viewing culture as the �cause,�peoples tend to clash with other peoples
that do not share their culture, world view and values (Huntington, 1998). Such vehement
tendencies, long held in check by the Cold War,17 have been unleashed by the end of the
Cold War and form the dominant pattern of global con�ict in a post-Cold War world. Such
a pattern is not restricted to militarized clashes between cultures, but also economic ones
might ensue. For example, economic issues between the United States and Europe are no
less serious than those between the United States and Japan, but they do not have the same
political salience and emotional intensity, because the di¤erences between American culture
and European culture are so much less than those between the American culture and the
Japanese culture.18
Therefore, using civilizations, religion, ethnicity and language measures, we test whether
cultural di¤erences exacerbate economic clashes in the post-Cold War era. First o¤, to see
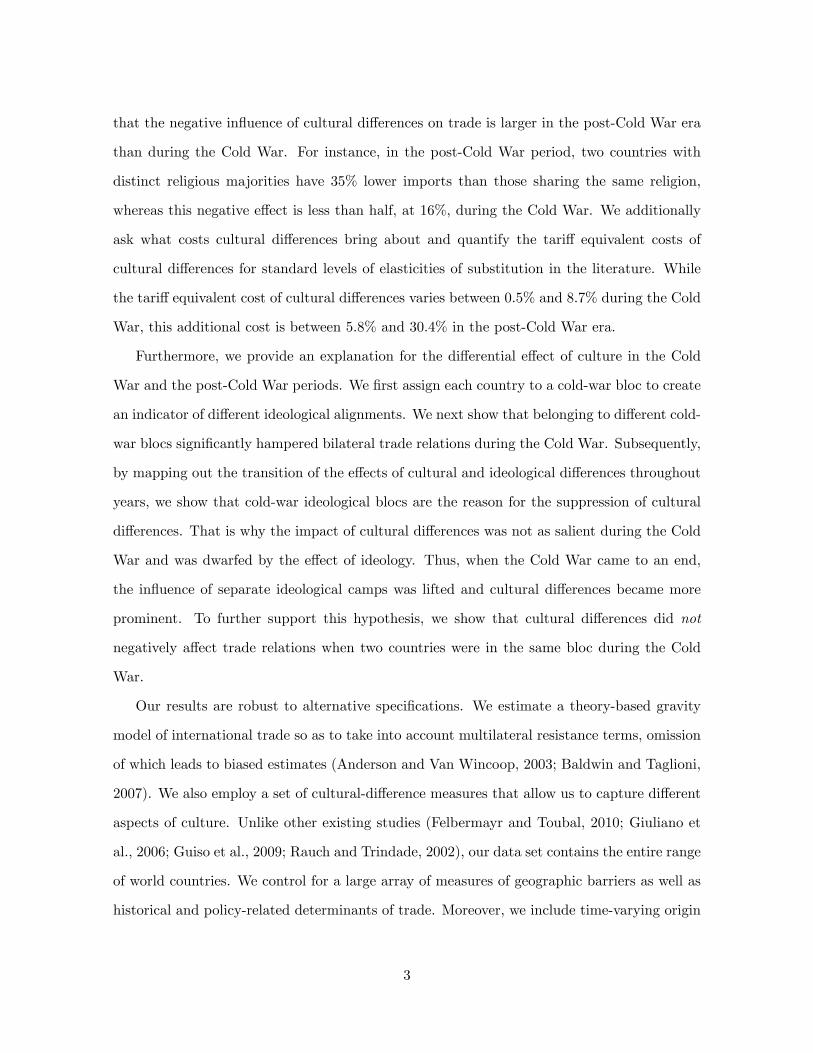
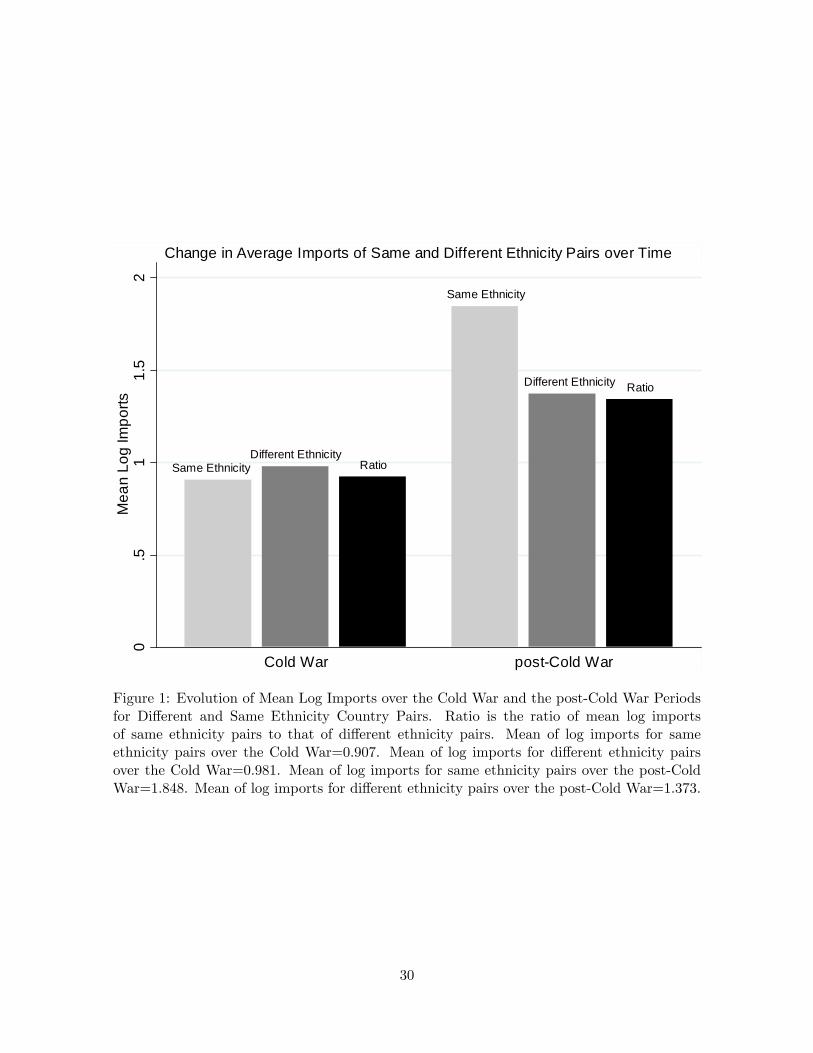
whether there is seemingly an economic clash of di¤erent culture pairs we plot mean log
imports calculated for di¤erent and same ethnicity pairs and their ratios over the Cold War
and the post-Cold War periods.19 As such, Figure 1 delivers a �rst-pass understanding of
how trade relations between countries with di¤erent and same ethnicities evolved over these
two time periods. Average imports have increased from the Cold War to the post-Cold War
period for both same ethnicity and di¤erent ethnicity pairs. This is not very informative, as
the two seem to evolve in a similar pattern. However, if we look at the evolution of the ratio
of the mean imports of the same ethnicity and di¤erent ethnicity pairs, we notice that same
ethnicity pairs have more improved trade relations from one period to the next with respect
to di¤erent ethnicity pairs. The ratio of same ethnicity trade to di¤erent ethnicity trade is
larger in the post-Cold War era than in the Cold War era, which means that the increase
in average trade of same ethnicity pairs is more than the increase in mean trade of di¤erent
ethnicity pairs.
Next, we carry out regression analyses. A cursory look at Table 3 would convince one that
there is a surge in economic clashes in the post-Cold War era. Each cell of a row reports the17By most scholars, Cold War is considered to have lasted between 1945-1991.18Huntington (1993a), p.34.19Same exercise can also be repeated for other measures of culture.
13
coe¢ cient of a cultural variable of interest from a separate regression in the two respective
time periods. The negative e¤ect of belonging to two di¤erent civilizations on bilateral trade
is much bigger in the post-Cold War era, and the e¤ect is statistically insigni�cant during the
Cold War. In the post-Cold War era, two countries that belong to di¤erent civilizations have
about 40% less imports than two countries that share the same civilization. This �nding is
robust and is not subject to the de�nition of culture. In the following rows of Table 3 we
perform the same exercise with our various measures of culture. Both economic signi�cance
and statistical signi�cance is stronger in the post-Cold War era than in the Cold War era.
For instance, when the two trading partners do not share the same dominant ethnicity, their
imports are reduced by 27% during the Cold War; whereas in the post-Cold War epoch they
import 51% less than a pair of countries that share these values. Alternatively, in the post-
Cold War period, two countries with distinct religious majorities have 35% lower imports than
those sharing the same religion, whereas this negative e¤ect is less than half, 16%, during the
Cold War.20
These �ndings suggest that in the post-Cold War period countries of di¤erent cultural
heritage display a stronger economic clash than in the Cold War era, and Chow tests con-
�rm that these coe¢ cients are statistically di¤erent from one another. Whether the cultural
heritage is a civilization as Huntington classi�ed or a more concrete de�nition of dominant
religious, ethnic and linguistic populations, the results do not change. These results show that
the end of the Cold War brought about more con�ictual economic relations among countries
of heterogeneous cultural backgrounds. In Table 4 we carry out the same analysis with a
di¤erence-in-di¤erence strategy instead of splitting the sample. Previous results and interpre-
tations carry over.21
In Table 5, we ask what if cultural di¤erence was a tari¤ and we run an exercise on how20These �ndings are not in�ated due to the time-invariant nature of our variables of interest. On the contrary,
they are closer to the lower bound estimates. When we collapse the data to a cross-section by taking the meanimports as dependent variable, the results are qualitatively the same, and in some cases the coe¢ cients oncultural di¤erence variables are even bigger. This is because when we run the regressions in a panel setupwe control for many dyadic time-varying determinants of trade as well as time-varying importer and exporter�xed e¤ects.21As a robustness check, we run the same regressions excluding those countries that gained their independence
only after the end of the Cold War. These regressions reveal the same conclusions. Therefore, our �ndings arenot an artefact of the newly independent countries. Results are available upon request.
14
the tari¤ equivalent costs of cultural dissimilarity would be for di¤erent elasticities in the two
time periods we consider.22 From the theory, the regression coe¢ cients correspond to the
estimates of [(1� �) ln � ], where (� � 1) would be the tari¤ equivalent of the cultural barriers
to trade. In line with the literature, we calculate the tari¤ equivalent of cultural trade barriers
for elasticities of � = 5; � = 8; � = 10 (see Anderson and van Wincoop, 2004).
We observe in Table 5 that the minimum tari¤ equivalent cost of cultural dissimilarity is
0.42% during the Cold War, whereas this lower bound estimate is about 5% in the post-Cold
War. On the other hand, the maximum tari¤ equivalent cost of culture during the Cold
War is about 9%, while this upper bound estimate is about 31% in the post-Cold War. For
example, if we consider an elasticity of 5, the tari¤ equivalent cost of di¤erent ethnicities is 8%
during the Cold War, whereas its counterpart in the post-Cold War is about 20%. Anderson
and van Wincoop (2003), for instance, calculate a maximum tari¤ equivalent cost of national
borders as 48% (for � = 5). In our case, in the post-Cold War period, di¤erent languages
account for more than half of the estimate of the national border barrier. Di¤erent religions
and di¤erent ethnicities in the post-Cold War period are equal to one forth and forty percent
of the estimate of the national border barrier, respectively.
5 Underlying Mechanism
A possible explanation for the mechanism beneath the di¤erential impact of cultural dissimi-
larity in the Cold War and the post-Cold War periods could be the role ideology and political
institutions play during these two time periods. Although cultural di¤erences have always
been present, they were suppressed by ideology during the Cold War. Once the Cold War
ended, cultural di¤erences are not suppressed anymore and they resurface.
Thus, to understand how the e¤ect of ideology on bilateral trade evolves we construct a
di¤erent blocs dummy. First, based on Huntington (1998), each and every country is assigned
to either the �rst world or the second world or the third world as they were in the heights of
22See, for instance, Blomberg and Hess (2006) and Rose and van Wincoop (2001) for examples on the tari¤equivalent costs of trade barriers.
15
the Cold War. The �rst world is composed of the United States and its allies, the second world
is composed of the Soviet Union and its allies, and the third world is composed of unaligned
countries. Then, we create an indicator variable, labelled "Di¤erent Blocs," that takes one if
the two countries belong to two di¤erent superpower camps. In other words, this variable is
equal to one if a country in the pair belongs to the �rst world and the other one belongs to
the second world, zero otherwise.
Results are presented in Table 6. A pair of countries that are in di¤erent blocs during
the Cold War have much lower import �ows than those of the same bloc. The e¤ect of
belonging to di¤erent blocs during the Cold War is so strong that it dwarfs the e¤ect of
cultural dissimilarity. However, in the post-Cold War period, the country pairs that were
formerly in di¤erent blocs started trading and making up for their low levels of prior trade.23
One explanation that logically derives from Table 6 is that the impact of ideological
di¤erences were so great during the Cold War that suppressed cultural dissimilarities did not
play such an important role in trade relations. In fact, if we compare the impact of being in
di¤erent blocs to belonging to di¤erent cultures during the Cold War, the impact of blocs is
at least four times greater than the impact of any measure of culture, and this e¤ect is even
more than eight times bigger when we contrast ideological blocs with religion (see Table 6,
column (2)).
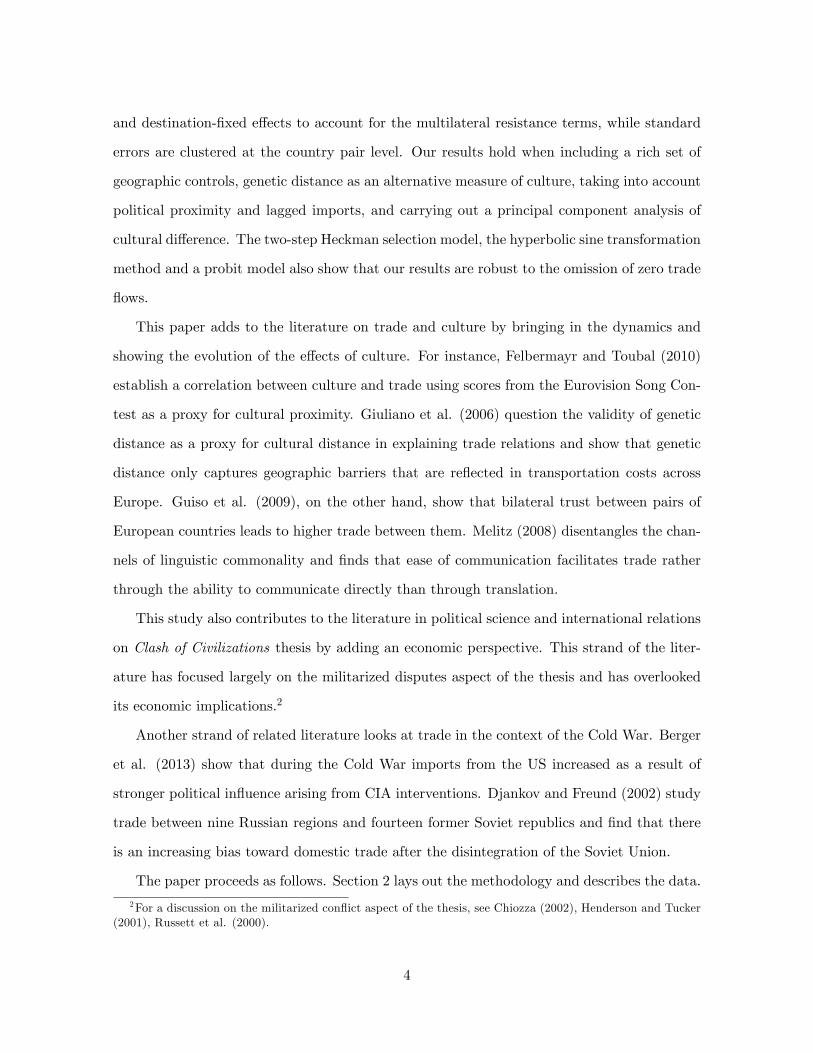
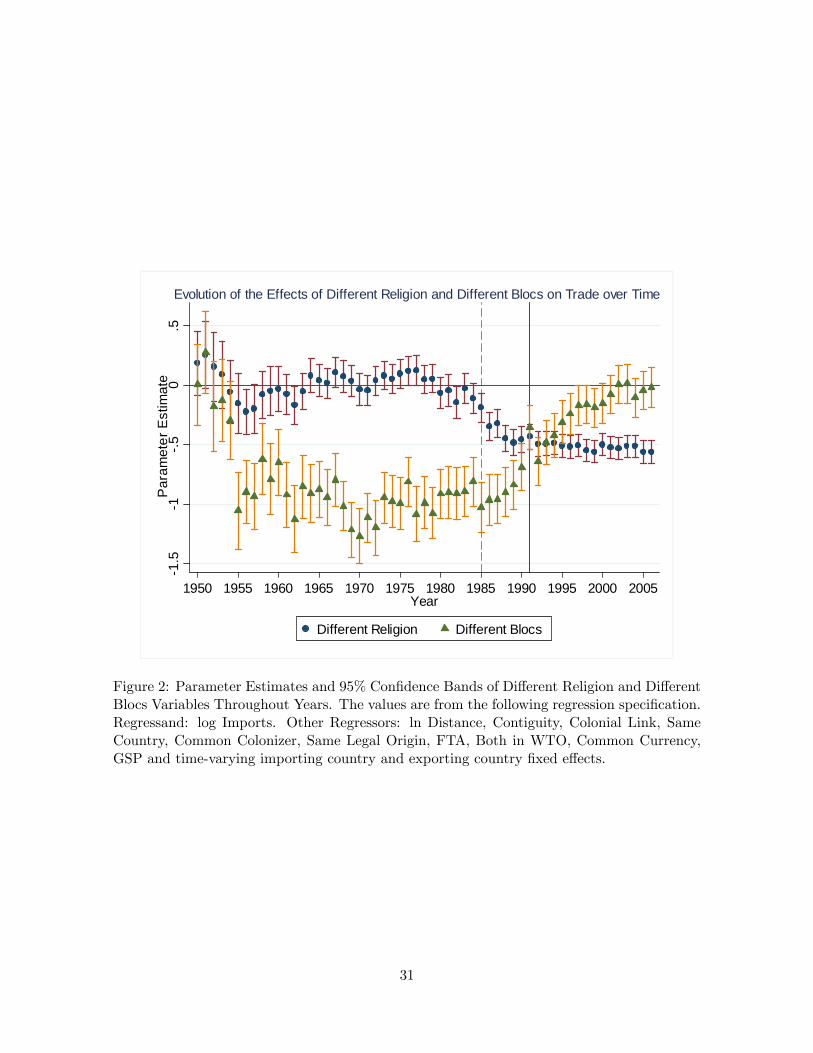
To track the evolution of the impact of cultural dissimilarity and the impact of di¤erent
blocs, we carry out a further exercise. In estimating the gravity model of imports, we include
the interactions of di¤erent cultures variables and di¤erent blocs variables with year dummies.
This way, we can calculate the e¤ects of di¤erent cultures and di¤erent blocs on imports for
every year from 1950 to 2006. In Figure 2, we plot the coe¢ cients of di¤erent religion and
di¤erent blocs together with 95% con�dence interval in each year from a regression of log
imports on di¤erent religion-year interactions, di¤erent blocs-year interactions together with
all the control variables and time-varying country �xed e¤ects.24 The results are striking.
23An example in a similar vein on political in�uence is Berger et al. (2013). They show that, during the ColdWar, when the CIA intervened in another country successfully, imports from the US increased dramatically.24We carry out the same exercise for di¤erent civilizations, di¤erent ethnicity and di¤erent language variables.
The results are similar and available upon request.
16
Being part of di¤erent blocs impedes trade relations during the Cold War. This e¤ect is
sizeable both economically and statistically. The impact of di¤erent ideological blocs is salient
starting from 1955. This could be attributed to the fact that in 1955 Warsaw Pact was formed
and communist bloc countries started acting in unison, which can thus be seen as the initiation
of two separate camps. From 1955 on this e¤ect remains negative and signi�cant. Toward
the �nal years of the Cold War, however, we observe a decreasing trend (in absolute values)
in the negative e¤ect of ideological di¤erences. This e¤ect is less and less negative, and after
the demise of the Cold War it is not signi�cant anymore.
On the other hand, throughout most of the Cold War the e¤ect of having di¤erent religious
backgrounds on bilateral trade lingers around zero and is mostly insigni�cant. However,
towards the end of the Cold War the impact of di¤erent religion variable exhibits a jump and
almost doubles. This jump is in the year 1986. In 1985 the coe¢ cient on di¤erent religion
variable is about -0.18, whereas in 1986 this coe¢ cient doubles to -0.35, signi�cant in both
cases.
This evidence in the data overlaps with the �rst signs of the end of the Cold War. In
1985, Mikhail Gorbachev assumed power in the Soviet Union. Immediately after coming to
power, liberal-minded Gorbachev started implementing reforms. Consequently, both economic
(Perestroika) and political (Glasnost) liberalization packages were put into e¤ect. At the same
time, the relations with the leaders of the U.S. and the U.K. at the time -Ronald Reagan
and Margaret Thatcher, respectively- improved considerably.25 All of these developments,
signalled the de facto end of the Cold War, which led to a surge in the impact of cultural
dissimilarity on trade relations. Therefore, by the demise of the Cold War, ideological blocs
and their political institutions are gone and cultural di¤erences are more prominent. Any
country can trade with any other, and former ideological foes turn into friends now with an
increased trend in their bilateral imports. Cultural di¤erences are at the forefront of the trade
fault lines, and as a matter of fact, the impact of cultural identities on economic exchange in
the post-Cold War period is enhanced.25For example, the Reykjavík Summit between Ronald Reagan and Mikhail Gorbachev led to the eventual
Intermediate-Range Nuclear Forces Treaty between the U.S. and the Soviet Union in 1987. Another example,Margaret Thatcher addressed Mikhail Gorbachev as a man she can do business with.
17
An alternative interpretation of these �ndings could be that we are just observing a nor-
malization of trade relations. Cultural di¤erences have always been at the core of inter-group
struggle, and this, in turn, plays a role in trade relations. However, Cold War was just an
ideological shock that subdued cultural dissimilarity and paci�ed the salience of the in�u-
ence of culture. Once the ideological shock of the Cold War is over, a normalization process
starts and what is of importance now for inter-group contention is the cultural di¤erences and
propinquities between nations that go back long in history.
Lastly, we perform the following test. Suppose in the Cold War era cultural di¤erences
were curbed by ideology, then, during the Cold War, if two countries were in the same bloc
their trade relations should not be negatively a¤ected by cultural dissimilarity. To examine
this hypothesis, we create a Same Bloc indicator and regress trade on the triple interaction
of Di¤erent Religion, Same Bloc and post-Cold War variables. In Table 7, Panel A is the
regression of trade on the triple interaction together with usual controls; and Panel B reports
the composite e¤ect of Di¤erent Religion on trade when the two countries were in the same
bloc or not during and after the Cold War.
In Panel B of Table 7, we observe that when two countries were in the same bloc during the
Cold War, di¤erent religious backgrounds did not negatively a¤ect their trade relations; and,
in fact, it is positive. However, for those countries that were not in the same bloc this e¤ect
is negative and signi�cant. Whereas, in the post-Cold War period, independently of their
former blocs, di¤erent religion reduces two countries�imports. Thus, this is further evidence
that ideology might have played a role in the di¤erential impact of cultural dissimilarity on
trade during and after the Cold War.26
6 Sensitivity Analysis
In this section we run robustness tests �rst by controlling for a rich set of geographic variables.
Second, we probe a popular measure of cultural distance �namely, genetic distance variable�
26We perform the same exercise for other measures of cultural di¤erence; and the results are similar, by andlarge. The e¤ect of cultural dissimilarity on trade for the same bloc countries in the Cold War period is eitheraround zero or positive, though less robust.
18
and test whether our measures of culture survive the inclusion of genetic distance. Third, we
investigate whether the impact of culture might actually be capturing the in�uence of political
proximity on trade. Fourth, we test the robustness of our results to the omission of zero trade
�ows. Fifth, we take lagged patterns of trade into consideration. Finally, we run a principal
component analysis.27
6.1 Culture vs. Geography
In this subsection we aim at isolating the e¤ect of geography on trade from that of culture.
This way we can fend o¤ concerns that what our measures of cultural di¤erence might actually
be capturing is the di¤erences in geography and climate.
We start o¤by creating continental pair dummies among partners. These dummies capture
the interaction between and within continents for trading countries. For instance, if both
countries in a pair are in Europe that would be captured by a Europe-Europe dummy, or if
one country is in Europe and the other one is in Asia that would be captured by an Asia-
Europe dummy. All in all, this makes up a total of 21 continental pair dummies.28
In addition, we control for a rich set of variables on geographic and climatic di¤erences
between countries. These are log of absolute di¤erence in mean elevation of countries (meters
above sea level), log of absolute di¤erence in latitudes, log of absolute di¤erence in longitudes,
number of landlocked countries, number of island countries, log of absolute di¤erence in mean
distance to nearest coastline or navigable river (km), absolute di¤erence in percentage of land
area in geographical tropics, absolute di¤erence in percentage of land area in geographical
subtropics, absolute di¤erence in percentage of land area in geographical polar regions, ab-
solute di¤erence in percentage of land area in geographical boreal regions, absolute di¤erence
in percentage of land area in temperate deserts, absolute di¤erence in percentage of land area
27On top of the robustness checks that are presented in this section, we also run robustness tests for con�ictinvolvement, role of minorities and di¤erences in GDP per capita of countries. These regressions are notincluded in the paper, however, previous results on the e¤ect of cultural di¤erences on trade remain the same.28The whole list of continental pair dummies for trade partner countries is as follows: Africa-Africa,
Africa-Asia, Africa-Europe, Africa-Oceania, Africa-North America, Africa-South America, Asia-Asia, Asia-Europe, Asia-Oceania, Asia-North America, Asia-South America, Europe-Europe, Europe-Oceania, Europe-North America, Europe-South America, Oceania-Oceania, Oceania-North America, Oceania-South America,North America-North America, North America-South America and South America-South America.
19
in tropical deserts, absolute di¤erence in percentage of land area in dry regions, absolute dif-
ference in percentage of land area in wet regions and absolute di¤erence in log of hydrocarbons
per capita.29
Inclusion of geographic and climatic controls would allow us to take into account geo-
graphic similarities, and this way we better isolate the e¤ect of cultural di¤erences. The
results are presented in Table 8. A very persistent negative e¤ect of cultural di¤erences on
bilateral trade in the post-Cold War era holds even when we control for a rich set geographic
variables. Thus we may conclude that our measures of cultural di¤erence do not capture any
e¤ect coming from geographical di¤erences.
6.2 Our Measures of Culture vs. Genetic Distance
Using genetic distance variable as a proxy for cultural distance has recently become a wide-
spread practice among researchers (Giuliano, Spilimbergo and Tonon, 2006; Guiso, Sapienza
and Zingales, 2009; Spolaore and Wacziarg, 2009a, 2009b). Moreover, Desmet et al. (2006)
provide empirical support for choosing genetic distance as a proxy for cultural di¤erences
measured by the World Values Survey. To that end, we would like to test the sensitivity of
our measures of culture against genetic distance variable and see how they fare in comparison.
Genetic distance is a summary measure of di¤erences in allele frequencies across a range
of neutral genes (or chromosomal loci). Correspondingly, the index constructed measures
the genetic variance between populations as a fraction of the total genetic variance. Given
that genetic characteristics are transmitted throughout generations at a regular pace, genetic
distance is closely linked to the times when two populations shared common ancestors. It is
argued that the degree of genetic distance also re�ects cultural distance, for culture can be
transmitted across genetically related individuals, and therefore populations that are farther
apart genealogically show an average tendency toward greater di¤erence in characteristics
that are transmitted with variations from parents to children.30
In this strand of the literature, for instance, using genetic distance as a measure of cultural29Data on geography and climate come from Gallup, Mellinger and Sachs (2010).30See Cavalli-Sforza and Feldman (1981), Cavalli-Sforza et al. (1994), Giuliano, Spilimbergo and Tonon
(2006) and Spolaore and Wacziarg (2009a).
20
dissimilarity, researchers tried to explain the di¤erences in the level of development across
countries (Spolaore and Wacziarg, 2009a), the e¤ect of culture on the likelihood of con�ict
involvement of country pairs (Spolaore and Wacziarg, 2009b) or the level of trust populations
have for each other (Guiso, Sapienza and Zingales, 2009).
Given the above discussion and the importance of genetic distance in recent times, we
deem it necessary to establish the robustness of our results to the inclusion of this variable.
The genetic distance data we use are from Spolaore and Wacziarg (2009a) as the genetic
distance information on populations is mapped onto countries.
We present the results in Table 9. Before contrasting our measures of culture with genetic
distance we, �rst, would like to consider whether genetic distance has any explanatory power
in trade relations when we take into account basic determinants of trade barriers and how it
changes after the demise of the Cold War. Giuliano, Spilimbergo and Tonon (2006) suggest
that the e¤ect captured by genetic distance is geographic barriers, not cultural ones. The
authors show that the same geographic determinants that explain transportation costs also
explain genetic distance. In addition, they provide evidence that genetic distance in a gravity
equation of bilateral trade has no signi�cance once one controls for transportation costs.
Having said that, in the �rst column of Table 9, without including our measures of culture,
we regress import �ows on genetic distance, its interaction with a post-Cold War dummy and
the entire set of control variables. Genetic distance has a signi�cant negative e¤ect on imports,
and this impact is much stronger in the post-Cold War period, a �nding that supports our
previous results.31
Subsequently, we carry on with tests of whether our measures of culture survive genetic
distance. In column (2) of Table 9 we observe that, in the post-Cold War period, our binary
indicator of di¤erent civilizations not only maintains its negative sign and high statistical
signi�cance, but it also has a sizeable economic magnitude. In columns (3), (4) and (5)
we carry out similar exercises for the robustness of di¤erent religious, ethnic and linguistic
heritage variables to the inclusion of genetic distance variable. In all three cases our measures31We have run the same speci�cation replacing genetic distance with genetic distance in 1500. The conclusion
is the same. Taking genetic distance in 1500 as a long run component of cultural distance, the negative e¤ectis much stronger in the post-Cold War period compared to the Cold War period.
21
of culture do not su¤er from the inclusion of genetic distance, and they are signi�cant. That is
to say that even after controlling for genetic distance, countries that have di¤erent dominant
religions, ethnicities or languages trade less with one another than country pairs that share
the same values and this e¤ect is much stronger in the post-Cold War period.
All in all, we can con�dently conclude from the above analysis that our measures of culture
are not sensitive to the inclusion of genetic distance as a proxy for culture. Therefore, if we
believe that genetic distance captures an element of culture, our measures of culture explain
some additional constituent of it that is not explained by genetic distance.
6.3 Political Proximity or Cultural Proximity?
Political factors and political interests might be an in�uential constituent of trade �ows be-
tween countries. Political proximity might facilitate trade agreements and GSP grants or po-
litical tension might ignite economic sanctions and protests among consumers. For instance,
Michaels and Zhi (2007) show that American-French relations soured due to the opposition
of France to the Iraq War in the United Nations Security Council, and this, in turn, led to a
reduction in American imports from France by about 15% and a reduction in French imports
from US by about 8%.32 Moreover, Umana Dajud (2013) demonstrates that political di¤er-
ences, measured in various ways, have an impact on economic exchange and that politically
proximate countries trade more. Given the aforementioned �ndings in the literature on polit-
ical proximity and trade, in this section we would like to test whether the e¤ect our measures
of cultural dissimilarity capture is due to political proximity or political distance.
Political proximity, measured as correlations of votes at the United Nations General As-
sembly, has shown to positively impact bilateral trade (Umana Dajud, 2013). On the other
hand, it is well established that democratic countries trade more, as promoted by the liberal
peace argument (see, for instance, Bliss and Russett, 1998; Yu, 2010). Umana Dajud (2013)
also shows that more distant countries on the democracy/autocracy axis trade less. Fur-
thermore, Long (2003) and Morrow et al. (1998) provide evidence that countries in mutual
32Another example is the repudiation of GSP (generalized system of preferences) grants to Laos, Myanmarand Sudan by the US due to political accounts (Sekkel, 2009).
22
security alliances and defense pacts have increased levels of trade. On these grounds, we bring
United Nations voting correlations, regime distance and security alliances into the analysis.
Erik Gartzke created The A¢ nity of Nations Index based on the United Nations General
Assembly roll-call data.33 This index takes values between -1 and 1 for the correlation of votes
between countries at the United Nations General Assembly over the period 1948-2006.34 In
addition, we create a variable of political distance based on the democracy scores from the
Polity IV project. We measure the extent of democracy using the 21-point institutionalized
democracy scale in a modi�ed version of the Polity IV data, where -10 means a hereditary
monarchy and +10 a consolidated democracy. As in Umana Dajud (2013), we generate
a variable labelled "Regime Di¤erence," which equals the absolute value of the di¤erence
between two countries� Polity IV democracy/autocracy scores. Lastly, we control for the
security alliances of countries, as allied states often have political and economic interests in
common (Russet et al., 2000). To control for the in�uence of alliances on trade, we include a
dummy variable for whether a pair of countries are in an alliance.35
In Table 10, we present results when UN vote correlations, regime di¤erences and security
alliances are taken into account as a measure of political proximity or political distance.
Previous �ndings on the e¤ect of cultural dissimilarity on trade carry over. The negative
e¤ect of cultural dissimilarity on trade is much stronger in the post-Cold War period, and the
negative impact of cultural dissimilarity on trade during the Cold War seems to disappear
when political variables are controlled for. Moreover, political proximity promotes trade, and
politically more distant regimes trade less; this �nding con�rms Umana Dajud (2013).
6.4 Zero Flows
6.4.1 Heckman Procedure
The question of how to deal with zero trade �ows has generated an on-going debate in the
literature. The most common strategy for bypassing the zero-�ow problem is to drop all zero-
33Available at http://dss.ucsd.edu/~egartzke/htmlpages/data.htmland at http://www9.georgetown.edu/faculty/ev42/UNVoting.htm.34 -1 corresponds to least similar interests and 1 corresponds to most similar interests.35Alliances data are Version 3.03 from Correlates of War Project (Gibler, 2009).
23
�ow observations. For instance, Linders and de Groot (2006) show that such a simple solution
often leads to acceptable results. Alternatively, many researchers opt to add some arbitrary
number to trade �ows so that the logarithm of zero-�ows is included in the sample. However,
this approach might lead to biased results, as the choice of constant-to-be-added is neither
theoretically nor empirically justi�ed (Linders and de Groot, 2006). In fact, King (1988) shows
that you can produce any estimate you prefer by playing around with the constant-to-be-
added. Recently, some researchers moved away from OLS to non-linear estimators. The most
commonly suggested ones in this family are the Poisson Pseudo-Maximum-Likelihood (PPML)
estimator and modi�ed PPML estimators (Santos Silva and Tenreyro, 2006). However, Martin
and Pham (2008) show that PPML might result in biased estimates in the presence of frequent
zero �ows, and they propose that the threshold Tobit estimator á la Eaton and Tamura (1994)
and the Heckman selection model perform better. So far in this debate, the Heckman selection
model seems to be the most preferred method of dealing with zero trade �ows, especially after
the contribution by Helpman et al. (2008).
Therefore, as in Helpman et al. (2008), we apply the Heckman two-step selection method.
The Heckman model introduces in the speci�cation the inverse of the so-called Mills ratio
in order to account for possible biases due to the omission of zero trade �ows (Heckman,
1979). In a �rst step selection equation, a Probit model is estimated to identify trading and
non-trading countries. In the second step, the inverse of the Mills ratio from the �rst stage is
included into the estimation so as to correct for selection bias.
We present the results from the Heckman model both with and without exclusion re-
strictions in Table 11. In Panel A of Table 11, the Heckman procedure with no exclusion
restrictions is provided (as in Linders and de Groot, 2006). In Panel B of Table 11, on
the other hand, we use the number of islands in the pair as an exclusion restriction (as in
Martínez-Zarzoso, 2013). Results show that, both with and without exclusion restrictions,
our previous �ndings hold. The trade-dampening impact of cultural dissimilarity is much
more pronounced in the post-Cold War era than during the Cold War, although, now the
magnitudes are smaller than the baseline case.
24
6.4.2 Inverse Hyperbolic Sine Transformation
Adding an ad hoc constant to imports in the log function is a common practice that renders
each observation positive. Instead, in this subsection we opt for an alternative transformation
function, namely inverse hyperbolic sine transformation. Although this method is widely
used in household literature, its bene�ts remained rather underutilized in the empirical gravity
literature.36 Inverse hyperbolic sine transformation is an easy-to-apply method that is de�ned
for any real number and formally de�ned as: sinh�1(x) = log(x+ (x2 + 1)1=2) (see Burbidge
et al., 1988). Burbidge et al. (1988) shows that inverse hyperbolic sine transformation is a
viable alternative to log transformation when the dependent variable can take on zero values.
We apply this transformation to import �ows so that the log function is de�ned for the zero
values of the dependent variable as well.37 Moreover, this way we refrain from adding the same
ad hoc constant to each observation of import �ows. Instead, each value to be added to the
dependent variable changes and is determined by the dependent variable itself. The beauty of
the inverse hyperbolic sine transformation is that it behaves exactly like log-transformation,
while it is also de�ned at zero values.
Results with the new transformed dependent variable that includes zero import �ows are
presented in Table 12. The previous �ndings are qualitatively con�rmed. Although in most
cases the magnitudes are reduced now with respect to the baseline results in Table 4, the
direction of the results do not change and they remain economically signi�cant. The negative
impact of cultural dissimilarity on bilateral trade �ows is much more punctuated in the post-
Cold War period than during the Cold War.
6.4.3 Extensive Margin
Now we look into whether cultural variables a¤ect the extensive margin of trade rather than
the intensive margin of trade. We use a positive trade indicator as a dependent variable, which
takes one whenever imports from i to j are positive and zero if there is no trade. This way we
take into account all zero-trade �ow observations. Table 13 presents the results from a probit
36For instance, see Pence (2006).37For an example of inverse hyperbolic sine transformation in gravity models, see Kristjánsdóttir (2012).
25
model for three time periods: the entire sample period of 1950-2006, the Cold War period and
the post-Cold War period. We observe that, for any measure, cultural di¤erences reduce the
probability of trade. Therefore, cultural di¤erences do not only impact the intensive margin
of trade but also the extensive margin of trade. Moreover, the reduction in the likelihood of
trade due to cultural dissimilarity is much larger in the post-Cold War era than in the Cold
War era. As such, our results on the more negative e¤ect of culture on trade in the post-Cold
War period are also con�rmed on the extensive margin of trade.
We incorporated the two-step Heckman procedure, inverse hyperbolic sine transformation
and a probit model of positive trade into the analysis in order to account for zero trade �ows.
Consequently, we can conclude that our results are robust and are not driven by the omission
of zero trade �ows from the estimation analysis.
6.5 Dynamic Gravity Equation
In this subsection we include lagged imports as an independent variable in the regressions.
Countries with historically strong trade relations can be expected to continue trading in the
following periods for reasons that are not captured by the explanatory variables, and these
unobserved dyadic linkages would end up in the error term.38 Therefore, we incorporate
lagged imports into the estimation analysis so that slowly-evolving unobserved elements that
impact trade relations are controlled for. The results are in Table 14. We see that lagged
values of log imports have a big and signi�cant impact on current imports with a coe¢ cient
of about 0.8 and the size of this coe¢ cient is consistent with Head et al. (2010) and Umana
Dajud (2013).39 The interpretation of the coe¢ cients on the cultural di¤erence variables is
analogous to previous �ndings. The impact of cultural di¤erences on trade is adverse, and this
in�uence is much greater in the post-Cold War period than in the Cold War period. Notice
that the coe¢ cients are much smaller now, although the interpretations remain the same.38For instance, sunk costs of entering a particular market and consumers� habits and tastes for products
from past trade partners could be examples of such unobserved terms (Martínez-Zarzoso et al. 2009).39By including a lagged endogenous variable on the right-hand side one also brings about endogeneity
problems, as the lagged endogenous variable is going to be correlated with the error terms. We run analternative exercise to cure such problems, as in Martínez-Zarzoso et al. (2009), and carry dynamic panelsystem GMM estimations using second to fourth lags of the dependent variable as instruments (see Blundelland Bond, 1998). Previous results carry over and are consistent with those in Martínez-Zarzoso et al. (2009).
26
6.6 Principal Component Analysis
Finally, we construct a synthetic measure of cultural di¤erence from the principal components
of the underlying determinants of a latent variable of cultural di¤erence.40 One might think
that when all of the measures of cultural di¤erence are included together the estimates are not
very precise, since all four measures are correlated. On the other hand, if they are included in
the regression separately, then other elements of culture are ignored. In such a scenario the
estimates might be capturing these other elements, which would render them imprecise. Thus
we create a variable labelled "Cultural Di¤erence" from the largest principal component as a
linear combination of our four measures of cultural di¤erence. The �rst principal component
is taken as it explains the largest ratio of the variance in the underlying data. Then, the new
variable of cultural di¤erence is created as a weighted average of four variables of cultural
di¤erence with the loadings of the �rst principal component as weights:
Cultural Di¤erence = 0:5416 �N(Di¤erent Civilizations)
+0:4351 �N(Di¤erent Religion)
+0:4642 �N(Di¤erent Ethnicity)
+0:5495 �N(Di¤erent Language)
where N(�) is a function of standard normalization. Cultural di¤erence variable will be lowest
when the two countries belong to the same civilization, same religion, same ethnicity and
same language.41 Cultural di¤erence variables will be highest when the two countries have
di¤erent civilizations, religions, ethnicities and languages.42 The correlation coe¢ cients of
the cultural di¤erence variable are as follows: with di¤erent civilizations 0.76, with di¤erent
religions 0.61, with di¤erent ethnicities 0.65 and with di¤erent languages 0.78.
The results with the new variable of cultural di¤erence are in Table 15. In the �rst column,
we show the negative impact of cultural di¤erence on trade over the entire sample period. In
40For an example of principal component analysis in the context of gravity models of trade, see Blombergand Hess (2006).41For example, United States-United Kingdom pair, Guatemala-Bolivia pair or Sierra Leone-Tanzania pair.42For example, Kenya-Japan pair, Bulgaria-Libya pair or Israel-Sri Lanka pair.
27
the second column, we show how this e¤ect is much stronger in the post-Cold War period. In
column (3), we additionally control for language indicator, though correlated, to show that
even when the communication channel is controlled for, the e¤ect of cultural di¤erence is still
persistent. In the last column, we again contrast the evolution of cultural di¤erence with that
of di¤erent blocs, and previous results and interpretations carry over.
7 Conclusion
This paper �rst establishes the negative link between cultural dissimilarity and bilateral im-
ports of countries. However, the main novelty of this study is to test Huntington�s Clash of
Civilizations hypothesis from an economic perspective. We study the dynamics of the e¤ect
of cultural dissimilarity on trade and show that the negative e¤ect of cultural di¤erence on
trade is stronger in the post-Cold War period than in the Cold War period.
More speci�cally, by estimating a theory-based gravity model of international trade and
by using measures capturing di¤erent aspects of culture, we show that cultural di¤erences
between countries is a larger barrier to trade in the post-Cold War period than it is in the
Cold War period. For instance, two countries with distinct religious majorities have 35%
lower bilateral import �ows during the post-Cold War period compared to those countries
sharing the same majority religion, whereas this negative e¤ect is less than half, 16%, during
the Cold War. Alternatively, when the two trading partners do not share the same dominant
ethnicity, their imports are reduced by 27% during the Cold War, whereas in the post-Cold
War epoch they trade 51% less than a pair of countries that share these values.
Furthermore, we provide an explanation for the di¤erential impact of cultural dissimilarity
over time. By mapping out the transition of the e¤ects of cultural and ideological dissimilari-
ties, we �nd that cold-war ideological blocs could be the reason for the suppression of cultural
di¤erences. And that is why cultural di¤erences come to the forefront as a trade barrier only
in the post-Cold War period, after the demise of ideological rivalries.
Unstable trade relations might be a source of concern for policy makers. This paper
highlights a threat to the world trade system as found in cultural di¤erences. Clashes are
28
generated by psychological notions of in-group/out-group and notions of identity, especially
group identity. If this is an emergent phenomenon, then we might observe a shift in the be-
havior of the mass of individual economic actors via considerations of cultural and ideological
identity. Such a destabilizing phenomenon at a global scale needs better understanding. A
natural line of further investigation would be to look in more detail at the causes underneath
the evolution of the impact of cultural dissimilarity. More disaggregated trade �ows data, for
example, could shed some more light on this question by showing which components of trade
and what types of goods drive the �ndings. Also, the role minorities play could be worth
investigating.
29
Same EthnicityDifferent Ethnicity
Ratio
Same Ethnicity
Different Ethnicity Ratio
0.5
11.
52
Mea
n Lo
g Im
ports
Cold War postCold War
Change in Average Imports of Same and Different Ethnicity Pairs over Time
Figure 1: Evolution of Mean Log Imports over the Cold War and the post-Cold War Periodsfor Di¤erent and Same Ethnicity Country Pairs. Ratio is the ratio of mean log importsof same ethnicity pairs to that of di¤erent ethnicity pairs. Mean of log imports for sameethnicity pairs over the Cold War=0.907. Mean of log imports for di¤erent ethnicity pairsover the Cold War=0.981. Mean of log imports for same ethnicity pairs over the post-ColdWar=1.848. Mean of log imports for di¤erent ethnicity pairs over the post-Cold War=1.373.
30
1.5
1.5
0.5
Par
amet
er E
stim
ate
1950 1955 1960 1965 1970 1975 1980 1985 1990 1995 2000 2005Year
Different Religion Different Blocs
Evolution of the Effects of Different Religion and Different Blocs on Trade over Time
Figure 2: Parameter Estimates and 95% Con�dence Bands of Di¤erent Religion and Di¤erentBlocs Variables Throughout Years. The values are from the following regression speci�cation.Regressand: log Imports. Other Regressors: ln Distance, Contiguity, Colonial Link, SameCountry, Common Colonizer, Same Legal Origin, FTA, Both in WTO, Common Currency,GSP and time-varying importing country and exporting country �xed e¤ects.
31
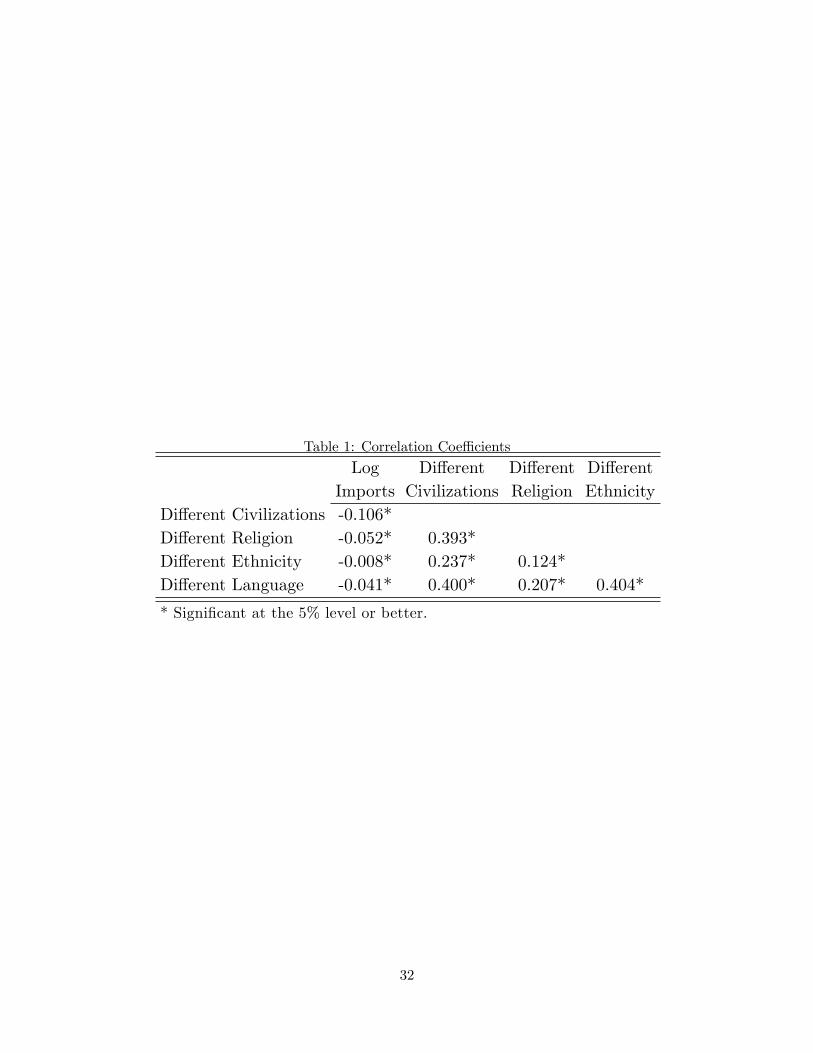
Table 1: Correlation Coe¢ cients
Log Di¤erent Di¤erent Di¤erentImports Civilizations Religion Ethnicity
Di¤erent Civilizations -0.106*Di¤erent Religion -0.052* 0.393*Di¤erent Ethnicity -0.008* 0.237* 0.124*Di¤erent Language -0.041* 0.400* 0.207* 0.404*
* Signi�cant at the 5% level or better.
32
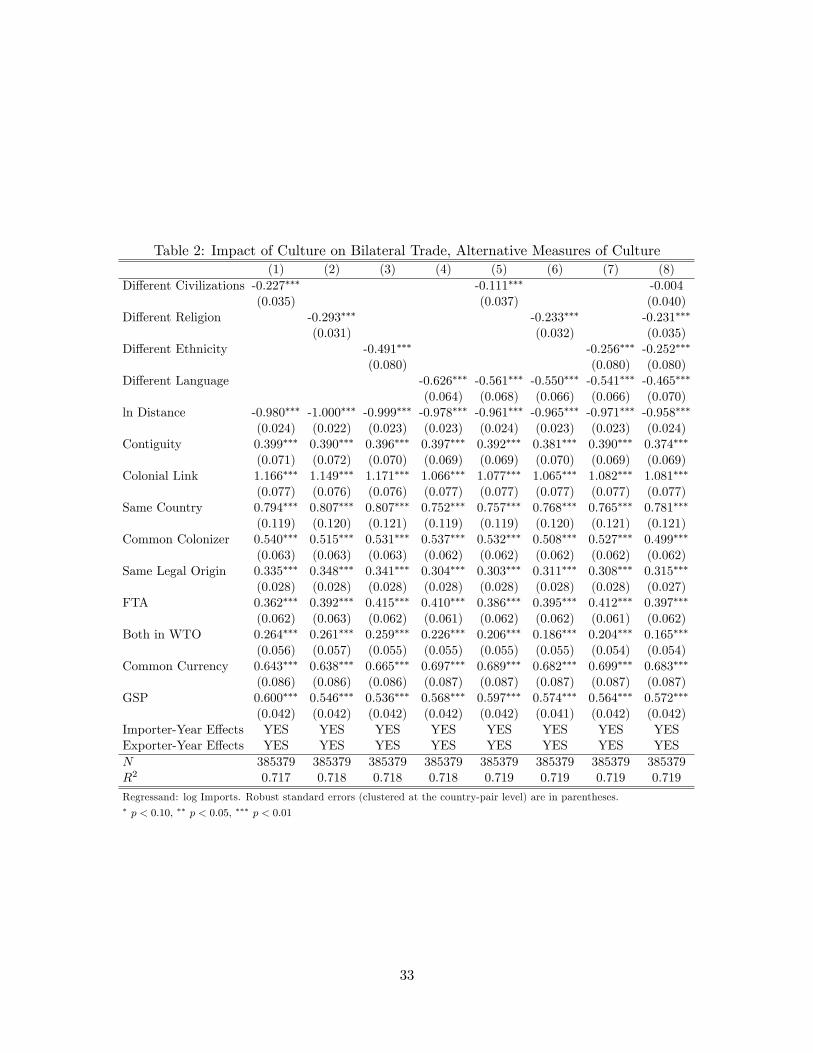
Table 2: Impact of Culture on Bilateral Trade, Alternative Measures of Culture(1) (2) (3) (4) (5) (6) (7) (8)
Di¤erent Civilizations -0.227��� -0.111��� -0.004(0.035) (0.037) (0.040)
Di¤erent Religion -0.293��� -0.233��� -0.231���
(0.031) (0.032) (0.035)Di¤erent Ethnicity -0.491��� -0.256��� -0.252���
(0.080) (0.080) (0.080)Di¤erent Language -0.626��� -0.561��� -0.550��� -0.541��� -0.465���
(0.064) (0.068) (0.066) (0.066) (0.070)ln Distance -0.980��� -1.000��� -0.999��� -0.978��� -0.961��� -0.965��� -0.971��� -0.958���
(0.024) (0.022) (0.023) (0.023) (0.024) (0.023) (0.023) (0.024)Contiguity 0.399��� 0.390��� 0.396��� 0.397��� 0.392��� 0.381��� 0.390��� 0.374���
(0.071) (0.072) (0.070) (0.069) (0.069) (0.070) (0.069) (0.069)Colonial Link 1.166��� 1.149��� 1.171��� 1.066��� 1.077��� 1.065��� 1.082��� 1.081���
(0.077) (0.076) (0.076) (0.077) (0.077) (0.077) (0.077) (0.077)Same Country 0.794��� 0.807��� 0.807��� 0.752��� 0.757��� 0.768��� 0.765��� 0.781���
(0.119) (0.120) (0.121) (0.119) (0.119) (0.120) (0.121) (0.121)Common Colonizer 0.540��� 0.515��� 0.531��� 0.537��� 0.532��� 0.508��� 0.527��� 0.499���
(0.063) (0.063) (0.063) (0.062) (0.062) (0.062) (0.062) (0.062)Same Legal Origin 0.335��� 0.348��� 0.341��� 0.304��� 0.303��� 0.311��� 0.308��� 0.315���
(0.028) (0.028) (0.028) (0.028) (0.028) (0.028) (0.028) (0.027)FTA 0.362��� 0.392��� 0.415��� 0.410��� 0.386��� 0.395��� 0.412��� 0.397���
(0.062) (0.063) (0.062) (0.061) (0.062) (0.062) (0.061) (0.062)Both in WTO 0.264��� 0.261��� 0.259��� 0.226��� 0.206��� 0.186��� 0.204��� 0.165���
(0.056) (0.057) (0.055) (0.055) (0.055) (0.055) (0.054) (0.054)Common Currency 0.643��� 0.638��� 0.665��� 0.697��� 0.689��� 0.682��� 0.699��� 0.683���
(0.086) (0.086) (0.086) (0.087) (0.087) (0.087) (0.087) (0.087)GSP 0.600��� 0.546��� 0.536��� 0.568��� 0.597��� 0.574��� 0.564��� 0.572���
(0.042) (0.042) (0.042) (0.042) (0.042) (0.041) (0.042) (0.042)Importer-Year E¤ects YES YES YES YES YES YES YES YESExporter-Year E¤ects YES YES YES YES YES YES YES YESN 385379 385379 385379 385379 385379 385379 385379 385379R2 0.717 0.718 0.718 0.718 0.719 0.719 0.719 0.719
Regressand: log Imports. Robust standard errors (clustered at the country-pair level) are in parentheses.� p < 0:10, �� p < 0:05, ��� p < 0:01
33
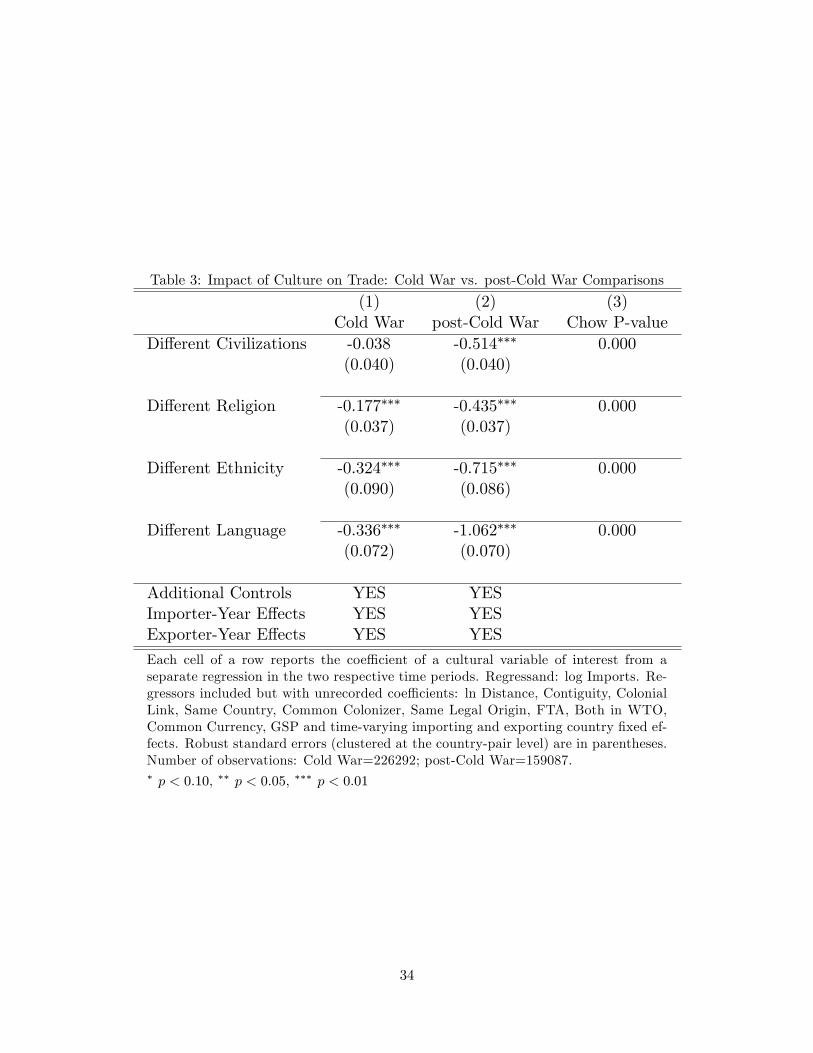
Table 3: Impact of Culture on Trade: Cold War vs. post-Cold War Comparisons
(1) (2) (3)Cold War post-Cold War Chow P-value
Di¤erent Civilizations -0.038 -0.514��� 0.000(0.040) (0.040)
Di¤erent Religion -0.177��� -0.435��� 0.000(0.037) (0.037)
Di¤erent Ethnicity -0.324��� -0.715��� 0.000(0.090) (0.086)
Di¤erent Language -0.336��� -1.062��� 0.000(0.072) (0.070)
Additional Controls YES YESImporter-Year E¤ects YES YESExporter-Year E¤ects YES YES
Each cell of a row reports the coe¢ cient of a cultural variable of interest from aseparate regression in the two respective time periods. Regressand: log Imports. Re-gressors included but with unrecorded coe¢ cients: ln Distance, Contiguity, ColonialLink, Same Country, Common Colonizer, Same Legal Origin, FTA, Both in WTO,Common Currency, GSP and time-varying importing and exporting country �xed ef-fects. Robust standard errors (clustered at the country-pair level) are in parentheses.Number of observations: Cold War=226292; post-Cold War=159087.� p < 0:10, �� p < 0:05, ��� p < 0:01
34
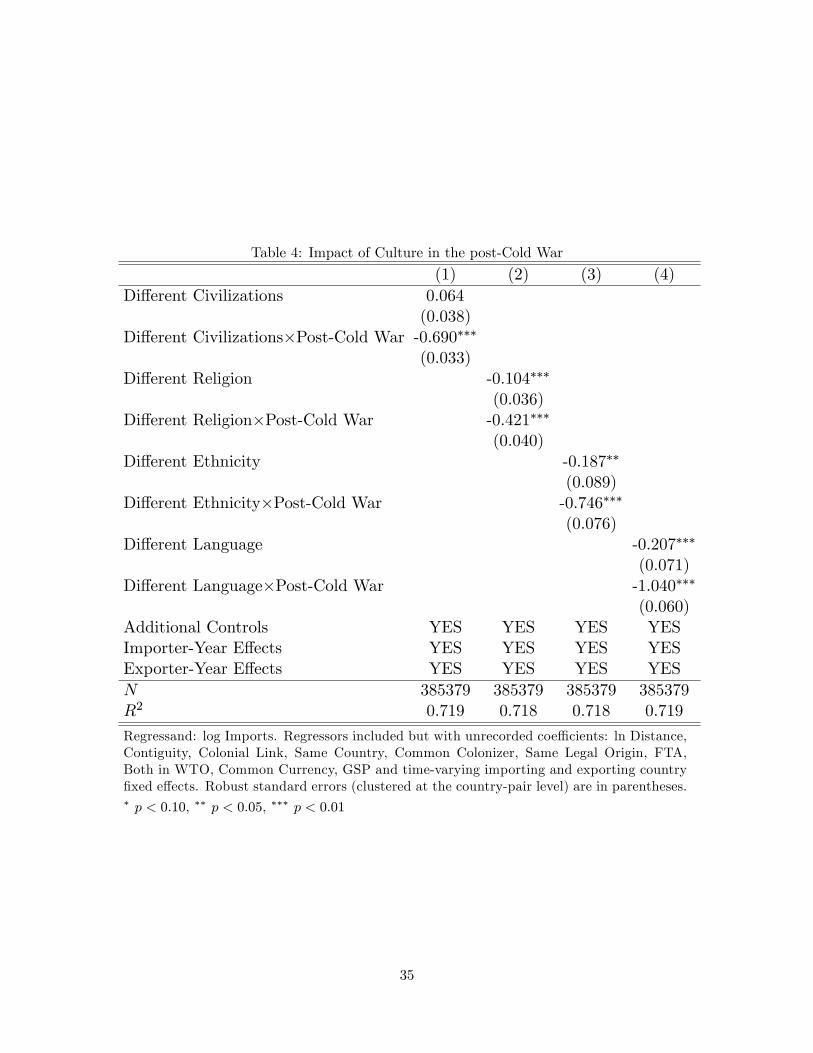
Table 4: Impact of Culture in the post-Cold War
(1) (2) (3) (4)Di¤erent Civilizations 0.064
(0.038)Di¤erent Civilizations�Post-Cold War -0.690���
(0.033)Di¤erent Religion -0.104���
(0.036)Di¤erent Religion�Post-Cold War -0.421���
(0.040)Di¤erent Ethnicity -0.187��
(0.089)Di¤erent Ethnicity�Post-Cold War -0.746���
(0.076)Di¤erent Language -0.207���
(0.071)Di¤erent Language�Post-Cold War -1.040���
(0.060)Additional Controls YES YES YES YESImporter-Year E¤ects YES YES YES YESExporter-Year E¤ects YES YES YES YESN 385379 385379 385379 385379R2 0.719 0.718 0.718 0.719
Regressand: log Imports. Regressors included but with unrecorded coe¢ cients: ln Distance,Contiguity, Colonial Link, Same Country, Common Colonizer, Same Legal Origin, FTA,Both in WTO, Common Currency, GSP and time-varying importing and exporting country�xed e¤ects. Robust standard errors (clustered at the country-pair level) are in parentheses.� p < 0:10, �� p < 0:05, ��� p < 0:01
35
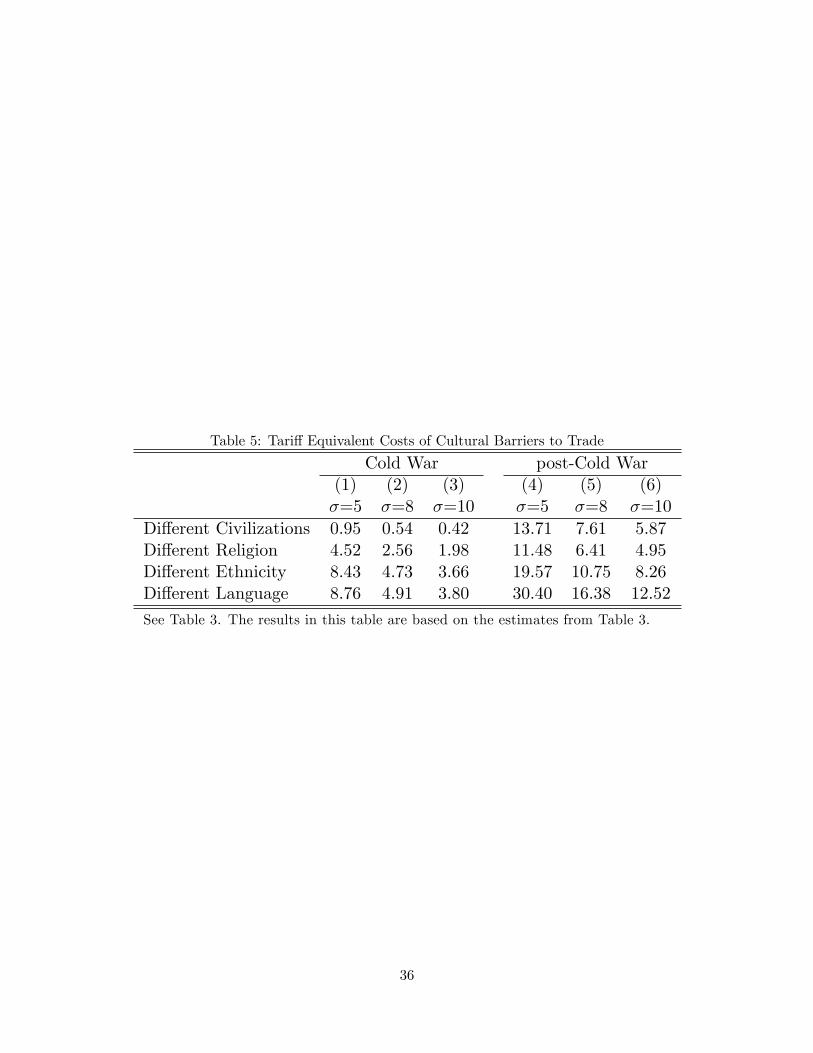
Table 5: Tari¤ Equivalent Costs of Cultural Barriers to Trade
Cold War post-Cold War(1) (2) (3) (4) (5) (6)�=5 �=8 �=10 �=5 �=8 �=10
Di¤erent Civilizations 0.95 0.54 0.42 13.71 7.61 5.87Di¤erent Religion 4.52 2.56 1.98 11.48 6.41 4.95Di¤erent Ethnicity 8.43 4.73 3.66 19.57 10.75 8.26Di¤erent Language 8.76 4.91 3.80 30.40 16.38 12.52
See Table 3. The results in this table are based on the estimates from Table 3.
36
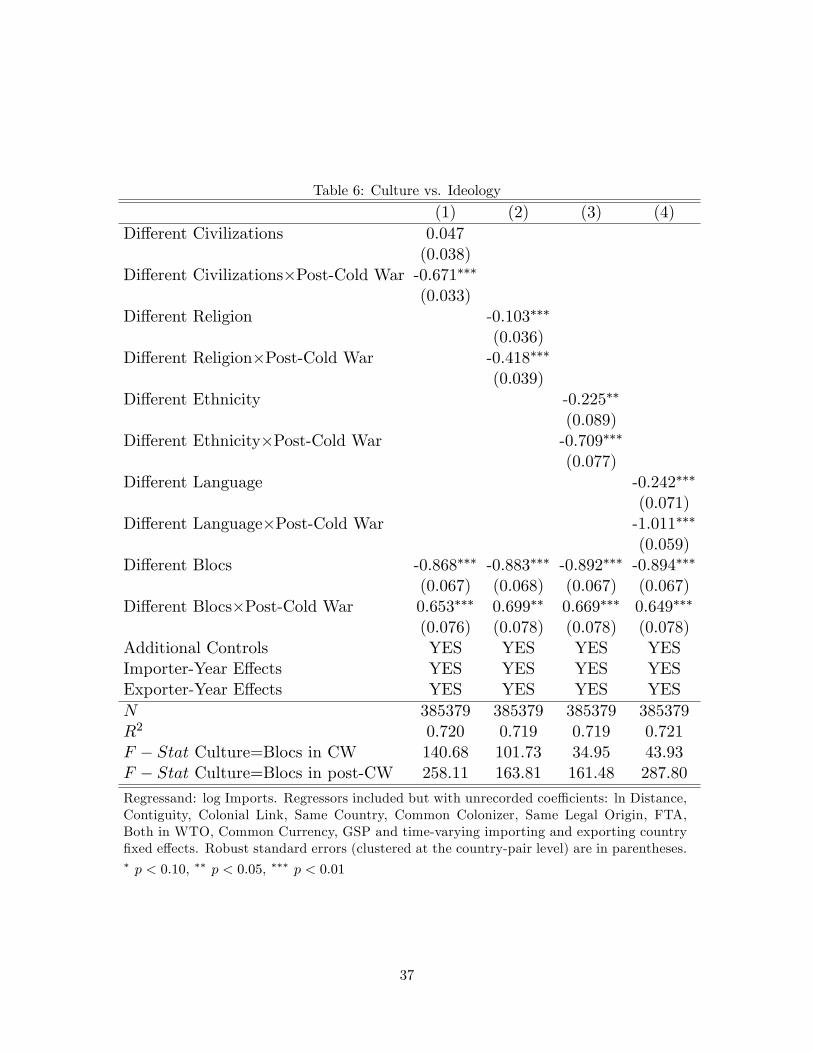
Table 6: Culture vs. Ideology
(1) (2) (3) (4)Di¤erent Civilizations 0.047
(0.038)Di¤erent Civilizations�Post-Cold War -0.671���
(0.033)Di¤erent Religion -0.103���
(0.036)Di¤erent Religion�Post-Cold War -0.418���
(0.039)Di¤erent Ethnicity -0.225��
(0.089)Di¤erent Ethnicity�Post-Cold War -0.709���
(0.077)Di¤erent Language -0.242���
(0.071)Di¤erent Language�Post-Cold War -1.011���
(0.059)Di¤erent Blocs -0.868��� -0.883��� -0.892��� -0.894���
(0.067) (0.068) (0.067) (0.067)Di¤erent Blocs�Post-Cold War 0.653��� 0.699�� 0.669��� 0.649���
(0.076) (0.078) (0.078) (0.078)Additional Controls YES YES YES YESImporter-Year E¤ects YES YES YES YESExporter-Year E¤ects YES YES YES YESN 385379 385379 385379 385379R2 0.720 0.719 0.719 0.721F � Stat Culture=Blocs in CW 140.68 101.73 34.95 43.93F � Stat Culture=Blocs in post-CW 258.11 163.81 161.48 287.80
Regressand: log Imports. Regressors included but with unrecorded coe¢ cients: ln Distance,Contiguity, Colonial Link, Same Country, Common Colonizer, Same Legal Origin, FTA,Both in WTO, Common Currency, GSP and time-varying importing and exporting country�xed e¤ects. Robust standard errors (clustered at the country-pair level) are in parentheses.� p < 0:10, �� p < 0:05, ��� p < 0:01
37
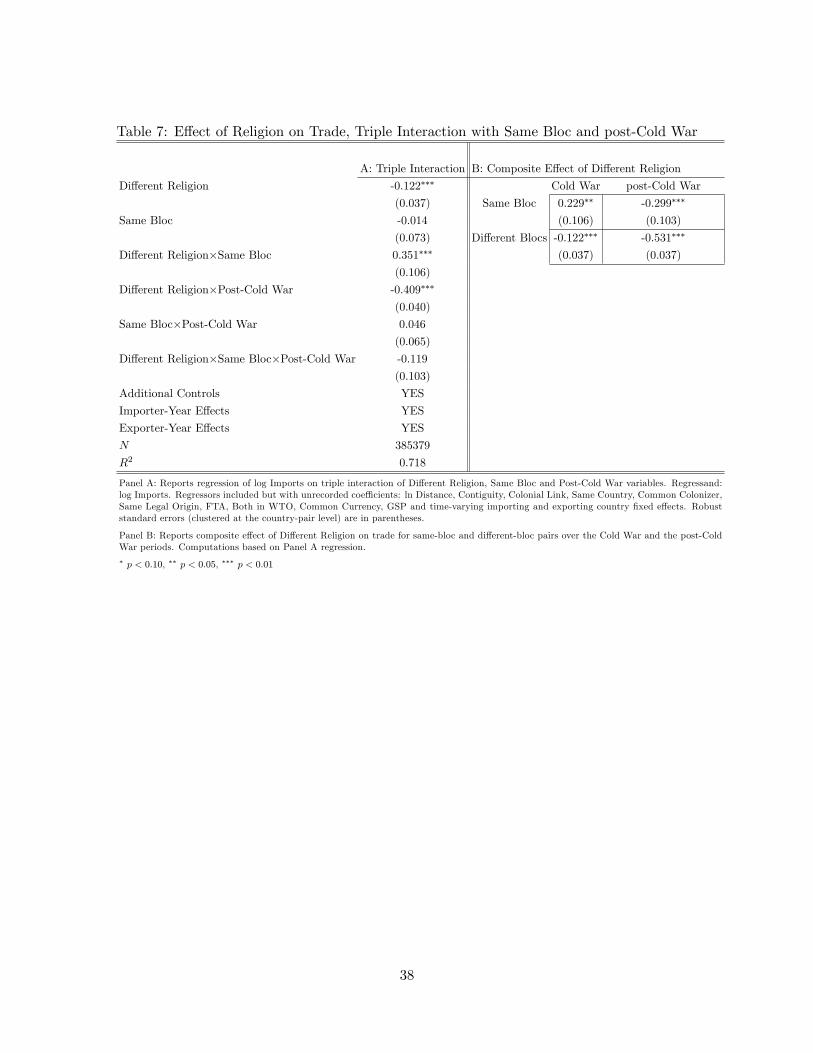
Table 7: E¤ect of Religion on Trade, Triple Interaction with Same Bloc and post-Cold War
A: Triple Interaction B: Composite E¤ect of Di¤erent Religion
Di¤erent Religion -0.122��� Cold War post-Cold War
(0.037) Same Bloc 0.229�� -0.299���
Same Bloc -0.014 (0.106) (0.103)
(0.073) Di¤erent Blocs -0.122��� -0.531���
Di¤erent Religion�Same Bloc 0.351��� (0.037) (0.037)
(0.106)
Di¤erent Religion�Post-Cold War -0.409���
(0.040)
Same Bloc�Post-Cold War 0.046
(0.065)
Di¤erent Religion�Same Bloc�Post-Cold War -0.119
(0.103)
Additional Controls YES
Importer-Year E¤ects YES
Exporter-Year E¤ects YES
N 385379
R2 0.718
Panel A: Reports regression of log Imports on triple interaction of Di¤erent Religion, Same Bloc and Post-Cold War variables. Regressand:log Imports. Regressors included but with unrecorded coe¢ cients: ln Distance, Contiguity, Colonial Link, Same Country, Common Colonizer,Same Legal Origin, FTA, Both in WTO, Common Currency, GSP and time-varying importing and exporting country �xed e¤ects. Robuststandard errors (clustered at the country-pair level) are in parentheses.
Panel B: Reports composite e¤ect of Di¤erent Religion on trade for same-bloc and di¤erent-bloc pairs over the Cold War and the post-ColdWar periods. Computations based on Panel A regression.� p < 0:10, �� p < 0:05, ��� p < 0:01
38
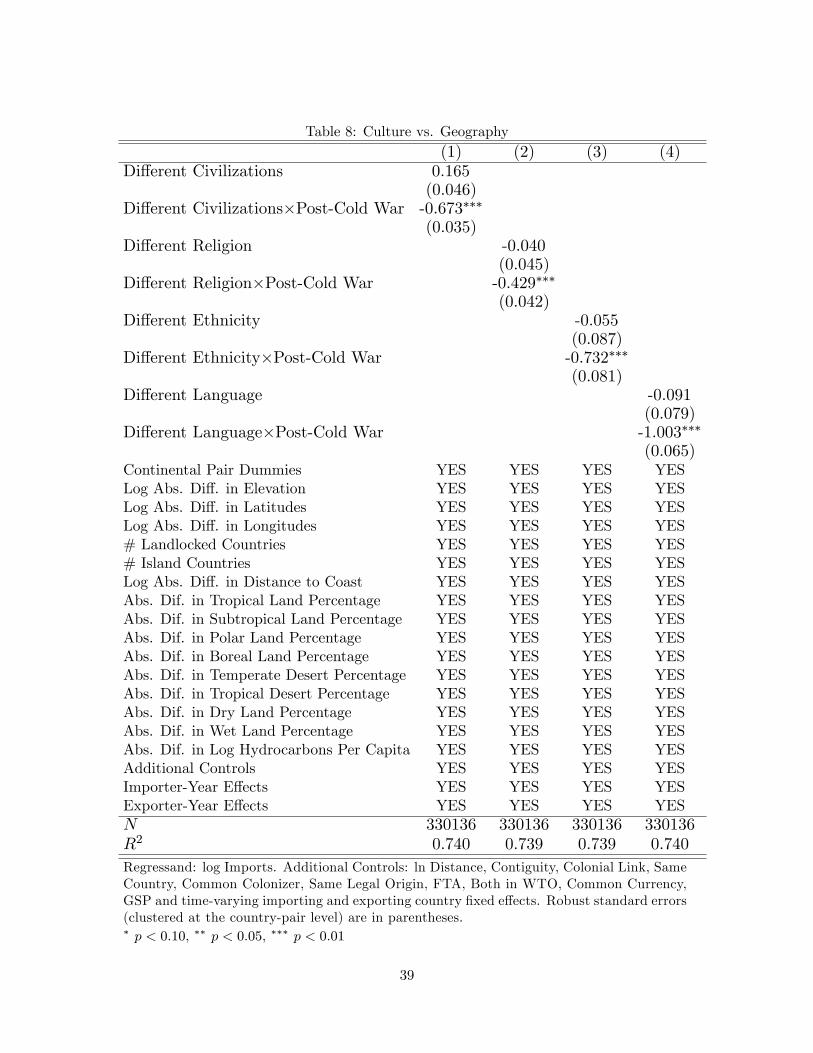
Table 8: Culture vs. Geography
(1) (2) (3) (4)Di¤erent Civilizations 0.165
(0.046)Di¤erent Civilizations�Post-Cold War -0.673���
(0.035)Di¤erent Religion -0.040
(0.045)Di¤erent Religion�Post-Cold War -0.429���
(0.042)Di¤erent Ethnicity -0.055
(0.087)Di¤erent Ethnicity�Post-Cold War -0.732���
(0.081)Di¤erent Language -0.091
(0.079)Di¤erent Language�Post-Cold War -1.003���
(0.065)Continental Pair Dummies YES YES YES YESLog Abs. Di¤. in Elevation YES YES YES YESLog Abs. Di¤. in Latitudes YES YES YES YESLog Abs. Di¤. in Longitudes YES YES YES YES# Landlocked Countries YES YES YES YES# Island Countries YES YES YES YESLog Abs. Di¤. in Distance to Coast YES YES YES YESAbs. Dif. in Tropical Land Percentage YES YES YES YESAbs. Dif. in Subtropical Land Percentage YES YES YES YESAbs. Dif. in Polar Land Percentage YES YES YES YESAbs. Dif. in Boreal Land Percentage YES YES YES YESAbs. Dif. in Temperate Desert Percentage YES YES YES YESAbs. Dif. in Tropical Desert Percentage YES YES YES YESAbs. Dif. in Dry Land Percentage YES YES YES YESAbs. Dif. in Wet Land Percentage YES YES YES YESAbs. Dif. in Log Hydrocarbons Per Capita YES YES YES YESAdditional Controls YES YES YES YESImporter-Year E¤ects YES YES YES YESExporter-Year E¤ects YES YES YES YESN 330136 330136 330136 330136R2 0.740 0.739 0.739 0.740Regressand: log Imports. Additional Controls: ln Distance, Contiguity, Colonial Link, SameCountry, Common Colonizer, Same Legal Origin, FTA, Both in WTO, Common Currency,GSP and time-varying importing and exporting country �xed e¤ects. Robust standard errors(clustered at the country-pair level) are in parentheses.� p < 0:10, �� p < 0:05, ��� p < 0:01
39
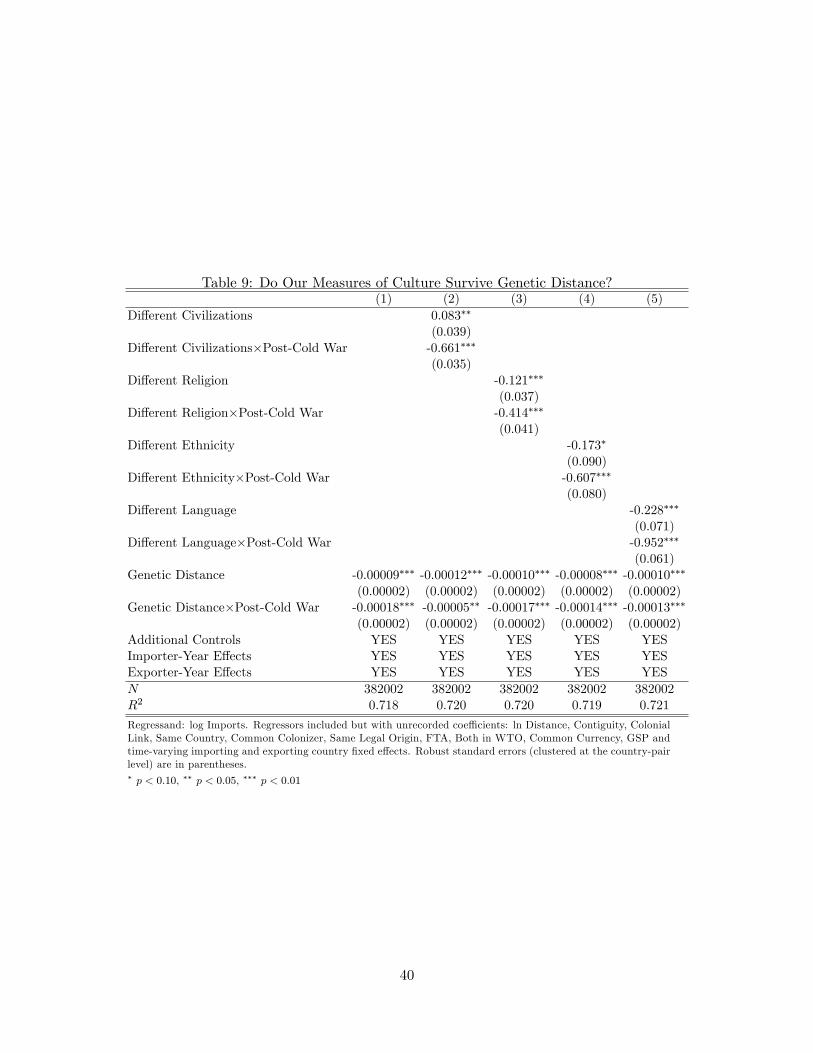
Table 9: Do Our Measures of Culture Survive Genetic Distance?(1) (2) (3) (4) (5)
Di¤erent Civilizations 0.083��
(0.039)Di¤erent Civilizations�Post-Cold War -0.661���
(0.035)Di¤erent Religion -0.121���
(0.037)Di¤erent Religion�Post-Cold War -0.414���
(0.041)Di¤erent Ethnicity -0.173�
(0.090)Di¤erent Ethnicity�Post-Cold War -0.607���
(0.080)Di¤erent Language -0.228���
(0.071)Di¤erent Language�Post-Cold War -0.952���
(0.061)Genetic Distance -0.00009��� -0.00012��� -0.00010��� -0.00008��� -0.00010���
(0.00002) (0.00002) (0.00002) (0.00002) (0.00002)Genetic Distance�Post-Cold War -0.00018��� -0.00005�� -0.00017��� -0.00014��� -0.00013���
(0.00002) (0.00002) (0.00002) (0.00002) (0.00002)Additional Controls YES YES YES YES YESImporter-Year E¤ects YES YES YES YES YESExporter-Year E¤ects YES YES YES YES YESN 382002 382002 382002 382002 382002R2 0.718 0.720 0.720 0.719 0.721
Regressand: log Imports. Regressors included but with unrecorded coe¢ cients: ln Distance, Contiguity, ColonialLink, Same Country, Common Colonizer, Same Legal Origin, FTA, Both in WTO, Common Currency, GSP andtime-varying importing and exporting country �xed e¤ects. Robust standard errors (clustered at the country-pairlevel) are in parentheses.� p < 0:10, �� p < 0:05, ��� p < 0:01
40
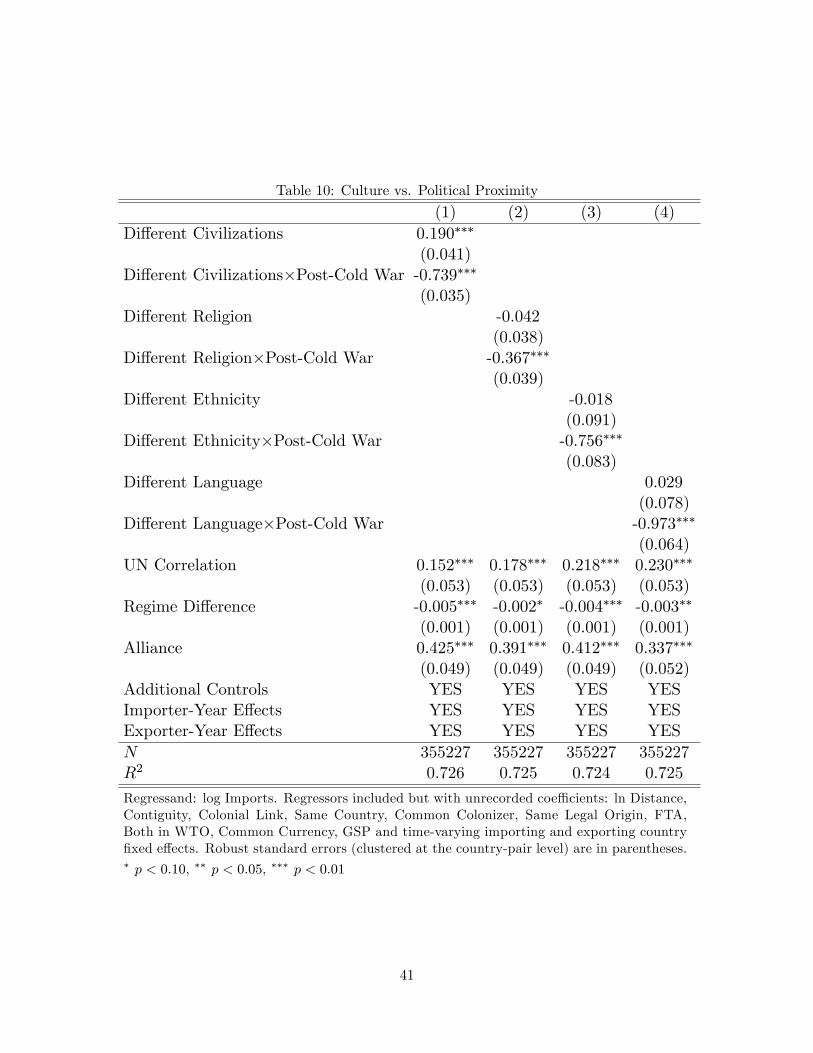
Table 10: Culture vs. Political Proximity
(1) (2) (3) (4)Di¤erent Civilizations 0.190���
(0.041)Di¤erent Civilizations�Post-Cold War -0.739���
(0.035)Di¤erent Religion -0.042
(0.038)Di¤erent Religion�Post-Cold War -0.367���
(0.039)Di¤erent Ethnicity -0.018
(0.091)Di¤erent Ethnicity�Post-Cold War -0.756���
(0.083)Di¤erent Language 0.029
(0.078)Di¤erent Language�Post-Cold War -0.973���
(0.064)UN Correlation 0.152��� 0.178��� 0.218��� 0.230���
(0.053) (0.053) (0.053) (0.053)Regime Di¤erence -0.005��� -0.002� -0.004��� -0.003��
(0.001) (0.001) (0.001) (0.001)Alliance 0.425��� 0.391��� 0.412��� 0.337���
(0.049) (0.049) (0.049) (0.052)Additional Controls YES YES YES YESImporter-Year E¤ects YES YES YES YESExporter-Year E¤ects YES YES YES YESN 355227 355227 355227 355227R2 0.726 0.725 0.724 0.725
Regressand: log Imports. Regressors included but with unrecorded coe¢ cients: ln Distance,Contiguity, Colonial Link, Same Country, Common Colonizer, Same Legal Origin, FTA,Both in WTO, Common Currency, GSP and time-varying importing and exporting country�xed e¤ects. Robust standard errors (clustered at the country-pair level) are in parentheses.� p < 0:10, �� p < 0:05, ��� p < 0:01
41
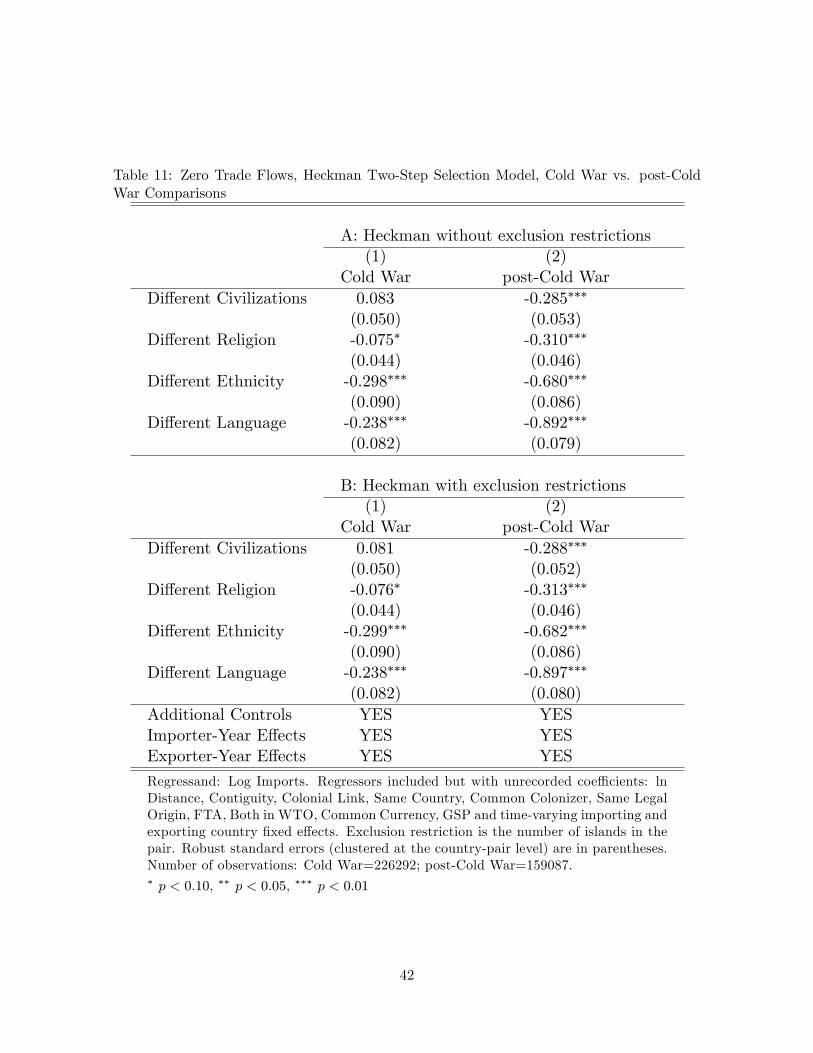
Table 11: Zero Trade Flows, Heckman Two-Step Selection Model, Cold War vs. post-ColdWar Comparisons
A: Heckman without exclusion restrictions(1) (2)
Cold War post-Cold WarDi¤erent Civilizations 0.083 -0.285���
(0.050) (0.053)Di¤erent Religion -0.075� -0.310���
(0.044) (0.046)Di¤erent Ethnicity -0.298��� -0.680���
(0.090) (0.086)Di¤erent Language -0.238��� -0.892���
(0.082) (0.079)
B: Heckman with exclusion restrictions(1) (2)
Cold War post-Cold WarDi¤erent Civilizations 0.081 -0.288���
(0.050) (0.052)Di¤erent Religion -0.076� -0.313���
(0.044) (0.046)Di¤erent Ethnicity -0.299��� -0.682���
(0.090) (0.086)Di¤erent Language -0.238��� -0.897���
(0.082) (0.080)Additional Controls YES YESImporter-Year E¤ects YES YESExporter-Year E¤ects YES YES
Regressand: Log Imports. Regressors included but with unrecorded coe¢ cients: lnDistance, Contiguity, Colonial Link, Same Country, Common Colonizer, Same LegalOrigin, FTA, Both in WTO, Common Currency, GSP and time-varying importing andexporting country �xed e¤ects. Exclusion restriction is the number of islands in thepair. Robust standard errors (clustered at the country-pair level) are in parentheses.Number of observations: Cold War=226292; post-Cold War=159087.� p < 0:10, �� p < 0:05, ��� p < 0:01
42
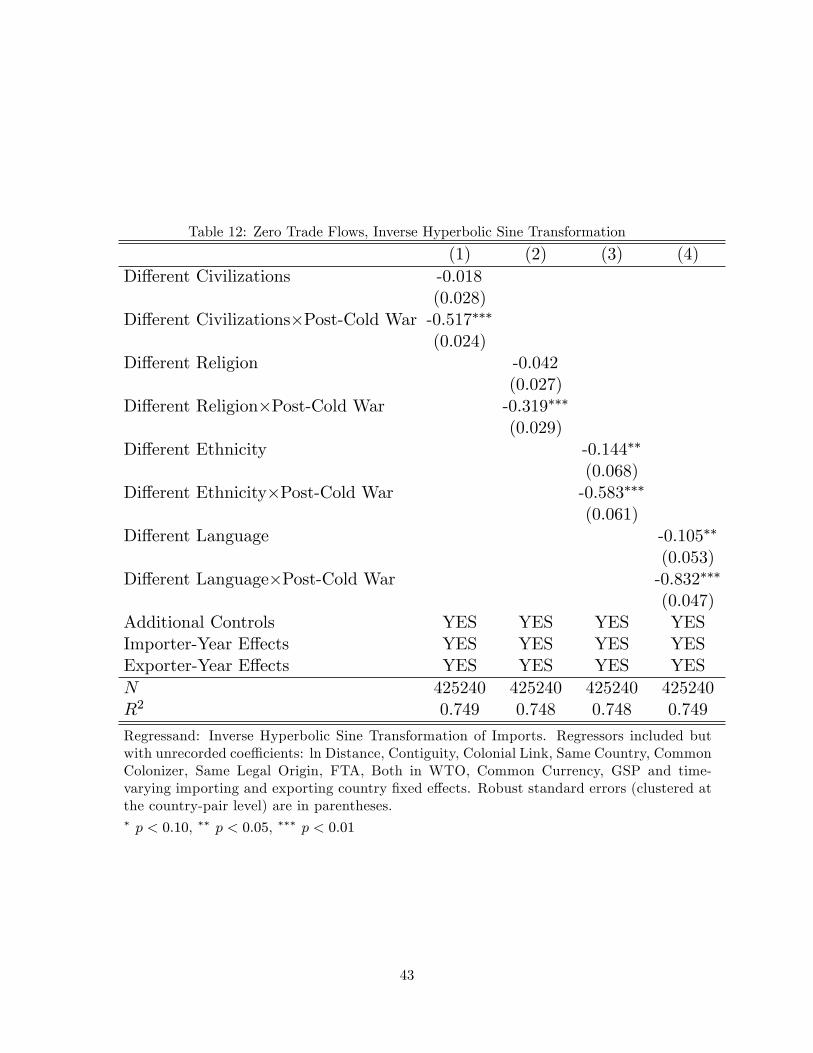
Table 12: Zero Trade Flows, Inverse Hyperbolic Sine Transformation
(1) (2) (3) (4)Di¤erent Civilizations -0.018
(0.028)Di¤erent Civilizations�Post-Cold War -0.517���
(0.024)Di¤erent Religion -0.042
(0.027)Di¤erent Religion�Post-Cold War -0.319���
(0.029)Di¤erent Ethnicity -0.144��
(0.068)Di¤erent Ethnicity�Post-Cold War -0.583���
(0.061)Di¤erent Language -0.105��
(0.053)Di¤erent Language�Post-Cold War -0.832���
(0.047)Additional Controls YES YES YES YESImporter-Year E¤ects YES YES YES YESExporter-Year E¤ects YES YES YES YESN 425240 425240 425240 425240R2 0.749 0.748 0.748 0.749
Regressand: Inverse Hyperbolic Sine Transformation of Imports. Regressors included butwith unrecorded coe¢ cients: ln Distance, Contiguity, Colonial Link, Same Country, CommonColonizer, Same Legal Origin, FTA, Both in WTO, Common Currency, GSP and time-varying importing and exporting country �xed e¤ects. Robust standard errors (clustered atthe country-pair level) are in parentheses.� p < 0:10, �� p < 0:05, ��� p < 0:01
43
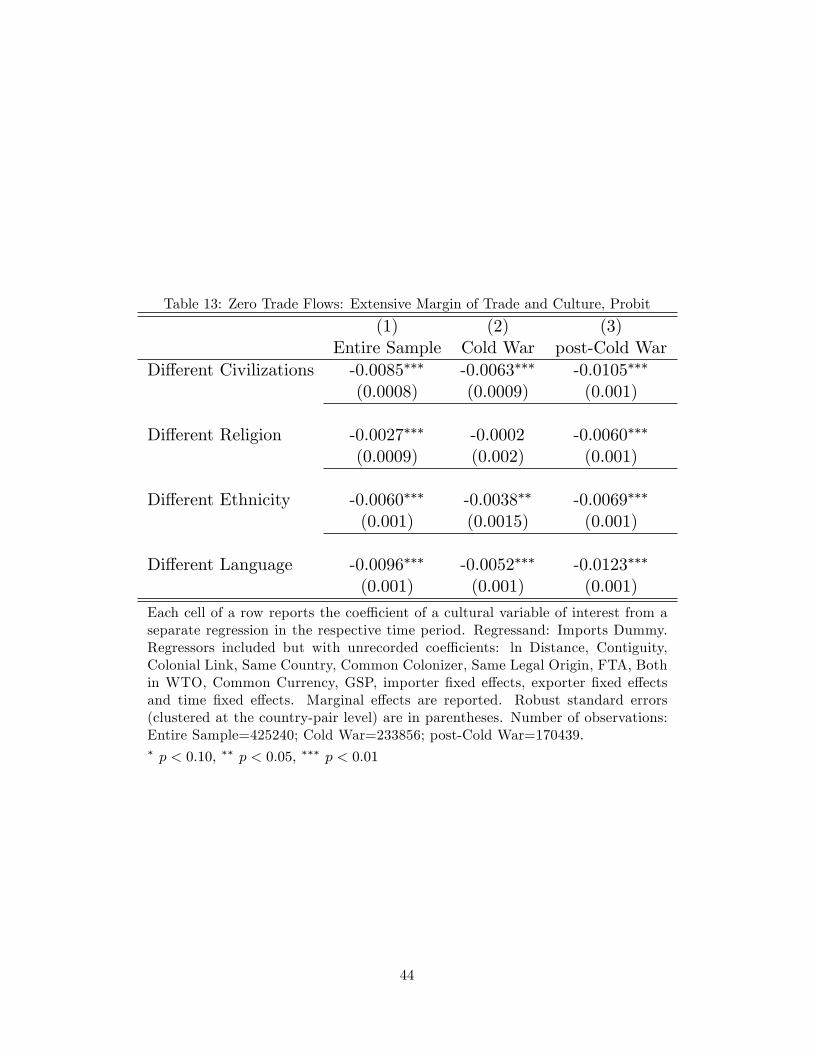
Table 13: Zero Trade Flows: Extensive Margin of Trade and Culture, Probit
(1) (2) (3)Entire Sample Cold War post-Cold War
Di¤erent Civilizations -0.0085��� -0.0063��� -0.0105���
(0.0008) (0.0009) (0.001)
Di¤erent Religion -0.0027��� -0.0002 -0.0060���
(0.0009) (0.002) (0.001)
Di¤erent Ethnicity -0.0060��� -0.0038�� -0.0069���
(0.001) (0.0015) (0.001)
Di¤erent Language -0.0096��� -0.0052��� -0.0123���
(0.001) (0.001) (0.001)
Each cell of a row reports the coe¢ cient of a cultural variable of interest from aseparate regression in the respective time period. Regressand: Imports Dummy.Regressors included but with unrecorded coe¢ cients: ln Distance, Contiguity,Colonial Link, Same Country, Common Colonizer, Same Legal Origin, FTA, Bothin WTO, Common Currency, GSP, importer �xed e¤ects, exporter �xed e¤ectsand time �xed e¤ects. Marginal e¤ects are reported. Robust standard errors(clustered at the country-pair level) are in parentheses. Number of observations:Entire Sample=425240; Cold War=233856; post-Cold War=170439.� p < 0:10, �� p < 0:05, ��� p < 0:01
44
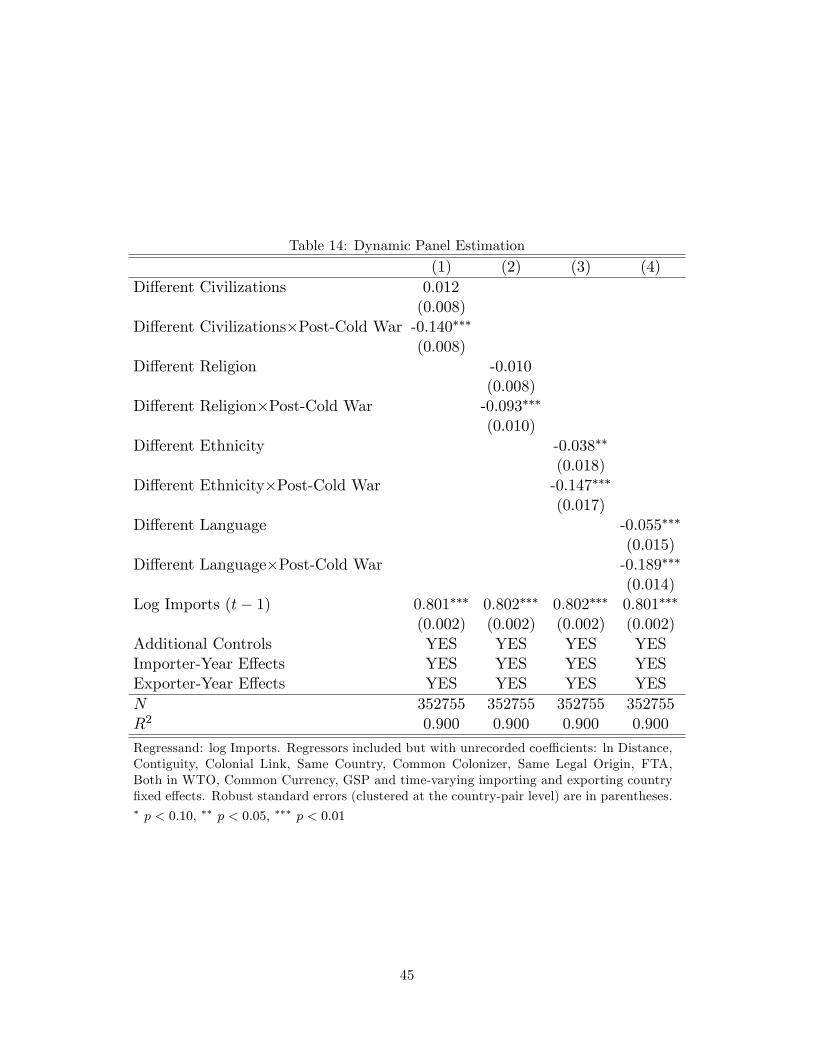
Table 14: Dynamic Panel Estimation
(1) (2) (3) (4)Di¤erent Civilizations 0.012
(0.008)Di¤erent Civilizations�Post-Cold War -0.140���
(0.008)Di¤erent Religion -0.010
(0.008)Di¤erent Religion�Post-Cold War -0.093���
(0.010)Di¤erent Ethnicity -0.038��
(0.018)Di¤erent Ethnicity�Post-Cold War -0.147���
(0.017)Di¤erent Language -0.055���
(0.015)Di¤erent Language�Post-Cold War -0.189���
(0.014)Log Imports (t� 1) 0.801��� 0.802��� 0.802��� 0.801���
(0.002) (0.002) (0.002) (0.002)Additional Controls YES YES YES YESImporter-Year E¤ects YES YES YES YESExporter-Year E¤ects YES YES YES YESN 352755 352755 352755 352755R2 0.900 0.900 0.900 0.900
Regressand: log Imports. Regressors included but with unrecorded coe¢ cients: ln Distance,Contiguity, Colonial Link, Same Country, Common Colonizer, Same Legal Origin, FTA,Both in WTO, Common Currency, GSP and time-varying importing and exporting country�xed e¤ects. Robust standard errors (clustered at the country-pair level) are in parentheses.� p < 0:10, �� p < 0:05, ��� p < 0:01
45
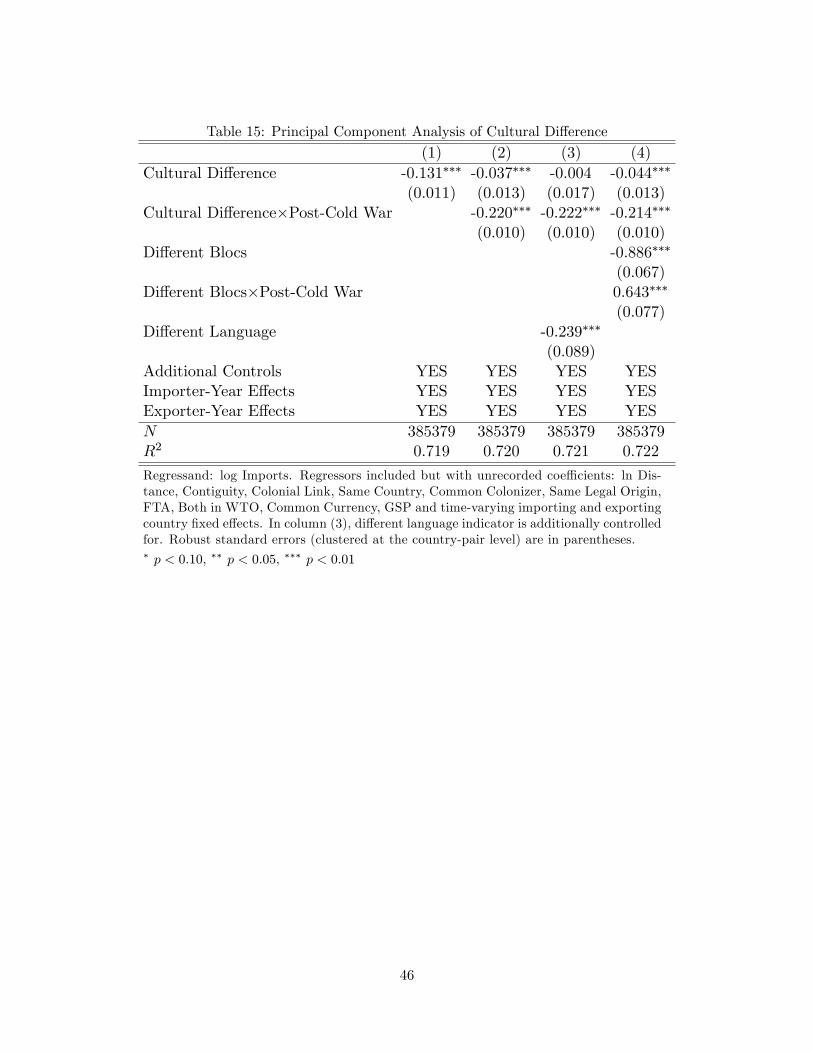
Table 15: Principal Component Analysis of Cultural Di¤erence
(1) (2) (3) (4)Cultural Di¤erence -0.131��� -0.037��� -0.004 -0.044���
(0.011) (0.013) (0.017) (0.013)Cultural Di¤erence�Post-Cold War -0.220��� -0.222��� -0.214���
(0.010) (0.010) (0.010)Di¤erent Blocs -0.886���
(0.067)Di¤erent Blocs�Post-Cold War 0.643���
(0.077)Di¤erent Language -0.239���
(0.089)Additional Controls YES YES YES YESImporter-Year E¤ects YES YES YES YESExporter-Year E¤ects YES YES YES YESN 385379 385379 385379 385379R2 0.719 0.720 0.721 0.722
Regressand: log Imports. Regressors included but with unrecorded coe¢ cients: ln Dis-tance, Contiguity, Colonial Link, Same Country, Common Colonizer, Same Legal Origin,FTA, Both in WTO, Common Currency, GSP and time-varying importing and exportingcountry �xed e¤ects. In column (3), di¤erent language indicator is additionally controlledfor. Robust standard errors (clustered at the country-pair level) are in parentheses.� p < 0:10, �� p < 0:05, ��� p < 0:01
46
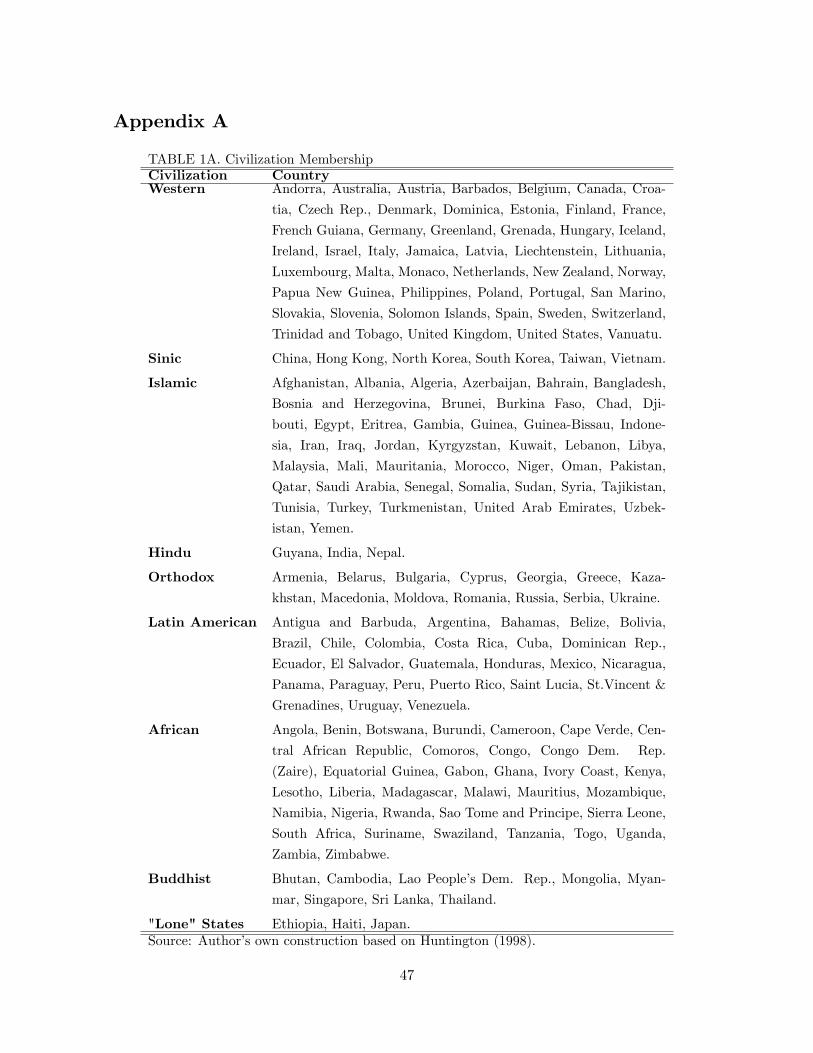
Appendix A
TABLE 1A. Civilization MembershipCivilization CountryWestern Andorra, Australia, Austria, Barbados, Belgium, Canada, Croa-
tia, Czech Rep., Denmark, Dominica, Estonia, Finland, France,
French Guiana, Germany, Greenland, Grenada, Hungary, Iceland,
Ireland, Israel, Italy, Jamaica, Latvia, Liechtenstein, Lithuania,
Luxembourg, Malta, Monaco, Netherlands, New Zealand, Norway,
Papua New Guinea, Philippines, Poland, Portugal, San Marino,
Slovakia, Slovenia, Solomon Islands, Spain, Sweden, Switzerland,
Trinidad and Tobago, United Kingdom, United States, Vanuatu.
Sinic China, Hong Kong, North Korea, South Korea, Taiwan, Vietnam.
Islamic Afghanistan, Albania, Algeria, Azerbaijan, Bahrain, Bangladesh,
Bosnia and Herzegovina, Brunei, Burkina Faso, Chad, Dji-
bouti, Egypt, Eritrea, Gambia, Guinea, Guinea-Bissau, Indone-
sia, Iran, Iraq, Jordan, Kyrgyzstan, Kuwait, Lebanon, Libya,
Malaysia, Mali, Mauritania, Morocco, Niger, Oman, Pakistan,
Qatar, Saudi Arabia, Senegal, Somalia, Sudan, Syria, Tajikistan,
Tunisia, Turkey, Turkmenistan, United Arab Emirates, Uzbek-
istan, Yemen.
Hindu Guyana, India, Nepal.
Orthodox Armenia, Belarus, Bulgaria, Cyprus, Georgia, Greece, Kaza-
khstan, Macedonia, Moldova, Romania, Russia, Serbia, Ukraine.
Latin American Antigua and Barbuda, Argentina, Bahamas, Belize, Bolivia,
Brazil, Chile, Colombia, Costa Rica, Cuba, Dominican Rep.,
Ecuador, El Salvador, Guatemala, Honduras, Mexico, Nicaragua,
Panama, Paraguay, Peru, Puerto Rico, Saint Lucia, St.Vincent &
Grenadines, Uruguay, Venezuela.
African Angola, Benin, Botswana, Burundi, Cameroon, Cape Verde, Cen-
tral African Republic, Comoros, Congo, Congo Dem. Rep.
(Zaire), Equatorial Guinea, Gabon, Ghana, Ivory Coast, Kenya,
Lesotho, Liberia, Madagascar, Malawi, Mauritius, Mozambique,
Namibia, Nigeria, Rwanda, Sao Tome and Principe, Sierra Leone,
South Africa, Suriname, Swaziland, Tanzania, Togo, Uganda,
Zambia, Zimbabwe.
Buddhist Bhutan, Cambodia, Lao People�s Dem. Rep., Mongolia, Myan-
mar, Singapore, Sri Lanka, Thailand.
"Lone" States Ethiopia, Haiti, Japan.Source: Author�s own construction based on Huntington (1998).
47
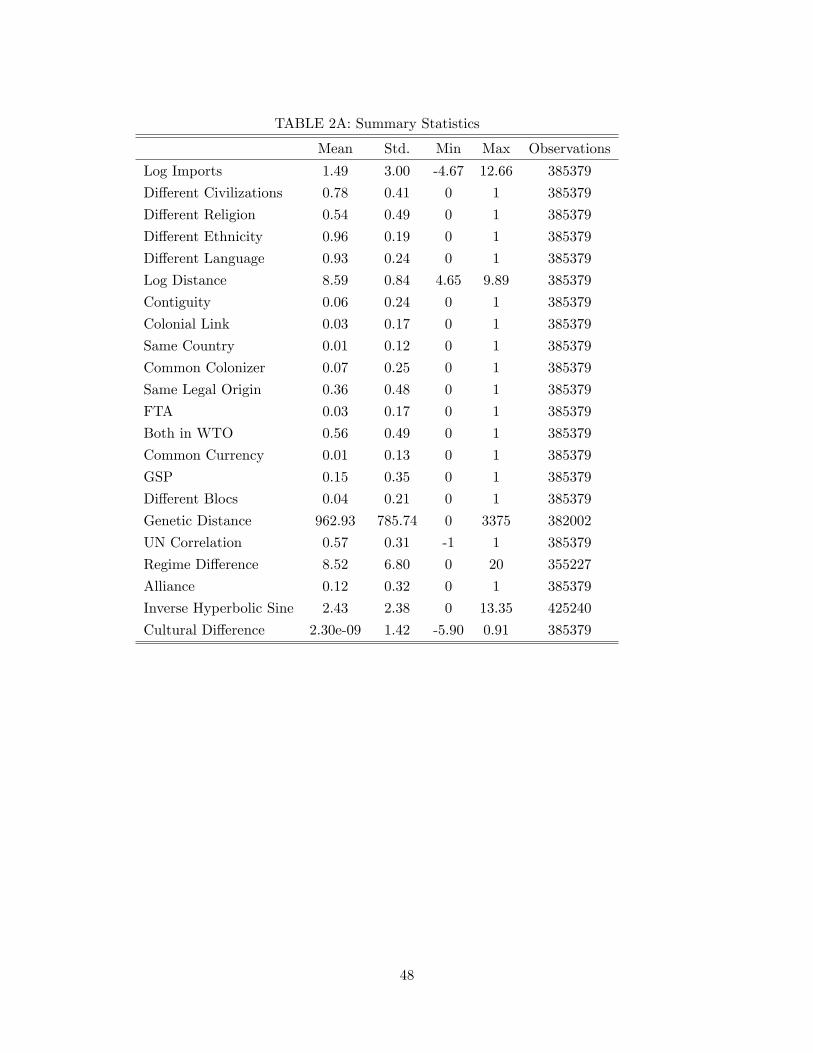
TABLE 2A: Summary Statistics
Mean Std. Min Max Observations
Log Imports 1.49 3.00 -4.67 12.66 385379
Di¤erent Civilizations 0.78 0.41 0 1 385379
Di¤erent Religion 0.54 0.49 0 1 385379
Di¤erent Ethnicity 0.96 0.19 0 1 385379
Di¤erent Language 0.93 0.24 0 1 385379
Log Distance 8.59 0.84 4.65 9.89 385379
Contiguity 0.06 0.24 0 1 385379
Colonial Link 0.03 0.17 0 1 385379
Same Country 0.01 0.12 0 1 385379
Common Colonizer 0.07 0.25 0 1 385379
Same Legal Origin 0.36 0.48 0 1 385379
FTA 0.03 0.17 0 1 385379
Both in WTO 0.56 0.49 0 1 385379
Common Currency 0.01 0.13 0 1 385379
GSP 0.15 0.35 0 1 385379
Di¤erent Blocs 0.04 0.21 0 1 385379
Genetic Distance 962.93 785.74 0 3375 382002
UN Correlation 0.57 0.31 -1 1 385379
Regime Di¤erence 8.52 6.80 0 20 355227
Alliance 0.12 0.32 0 1 385379
Inverse Hyperbolic Sine 2.43 2.38 0 13.35 425240
Cultural Di¤erence 2.30e-09 1.42 -5.90 0.91 385379
48
TABLE 3A. Blocs of CountriesBloc Country1st World Andorra, Australia, Belgium, Canada, Denmark, France, Ger-
many, Greece, Iceland, Israel, Italy, Japan, Luxembourg, Malta,
Monaco, Netherlands, New Zealand, Norway, Philippines, Portu-
gal, San Marino, South Korea, Spain, Taiwan, Thailand, Turkey,
United Kingdom, United States.
2nd World Albania, Armenia, Azerbaijan, Belarus, Bulgaria, China, Cuba,
Czech Rep., Estonia, Georgia, Hungary, Kazakhstan, Kyrgyzstan,
Lao People�s Dem. Rep., Latvia, Lithuania, Moldova, Mongolia,
North Korea, Poland, Romania, Russia, Slovakia, Turkmenistan,
Ukraine, Uzbekistan, Vietnam.
3rd World Afghanistan, Algeria, Angola, Antigua and Barbuda, Argentina,
Austria, Bahamas, Bahrain, Bangladesh, Barbados, Belize, Benin,
Bhutan, Bolivia, Bosnia and Herzegovina, Botswana, Brazil,
Brunei, Burkina Faso, Burundi, Cambodia, Cameroon, Cape
Verde, Central African Republic, Chad, Chile, Colombia, Co-
moros, Congo, Costa Rica, Croatia, Cyprus, Congo Dem. Rep.
(Zaire), Djibouti, Dominica, Dominican Rep., Ecuador, Egypt,
El Salvador, Equatorial Guinea, Eritrea, Ethiopia, Fiji, Finland,
Gabon, Gambia, Ghana, Grenada, Guatemala, Guinea, Guinea-
Bissau, Guyana, Haiti, Honduras, India, Indonesia, Iran, Iraq,
Ireland, Ivory Coast, Jamaica, Jordan, Kenya, Kuwait, Lebanon,
Lesotho, Liberia, Libya, Liechtenstein, Macedonia, Madagascar,
Malawi, Malaysia, Mali, Mauritania, Mauritius, Mexico, Morocco,
Mozambique, Myanmar, Namibia, Nepal, Nicaragua, Niger, Nige-
ria, Oman, Pakistan, Panama, Papua New Guinea, Paraguay,
Peru, Puerto Rico, Qatar, Rwanda, Saint Lucia, St.Vincent and
Grenadines, Sao Tome and Principe, Saudi Arabia, Senegal, Ser-
bia, Sierra Leone, Singapore, Slovenia, Solomon Islands, Somalia,
South Africa, Sri Lanka, Sudan, Suriname, Swaziland, Sweden,
Switzerland, Syria, Tajikistan, Tanzania, Togo, Trinidad and To-
bago, Tunisia, Uganda, United Arab Emirates, Uruguay, Vanuatu,
Venezuela, Yemen, Zambia, Zimbabwe.Source: Author�s own construction based on Huntington (1998).
49
References
[1] Anderson, J. E. and van Wincoop, E. 2003. "Gravity with Gravitas: A Solution to theBorder Puzzle." The American Economic Review, 93 (1), 170�192.
[2] Anderson, J. E. and van Wincoop, E. 2004. "Trade Costs." Journal of Economic Litera-ture, Vol. XLII, 691-751.
[3] Baldwin, R. and Taglioni, D. 2007. "Trade E¤ects of the Euro: A Comparison of Esti-mators." Journal of Economic Integration, 22 (4), 780-818.
[4] Barbieri, K., Keshk, O. and Pollins, B. 2008. "Correlates of War Project Trade Data SetCodebook, Version 2.01."
[5] Berger, D., Easterly, W., Nunn, N. and Satyanath, S. 2013. "Commercial Imperialism?Political In�uence and Trade During the Cold War." The American Economic Review,Vol. 103(2), 863-896.
[6] Bliss, H. and Russett, B. 1998. "Democratic Trading Partners: The Liberal Connection,1962-1989." The Journal of Politics, 60(4), 1126-1147.
[7] Blomberg, S. B. and Hess, G. D. 2006. "How Much Does Violence Tax Trade?" TheReview of Economics and Statistics, 88(4), 599-612.
[8] Blundell, R. and Bond., S. 1998. "Initial Conditions and Moment Restrictions in DynamicPanel Data Models." Journal of Econometrics, 87, 115-143.
[9] Burbidge, J. B., Magee L. and Robb, A. L. 1988. "Alternative Transformations to Han-dle Extreme Values of the Dependent Variable." Journal of the American StatisticalAssociation, 83, 401, 123-127.
[10] Cavalli-Sforza, L. L. and Feldman, M. W. 1981. "Cultural Transmission and Evolution."Princeton: Princeton University Press.
[11] Cavalli-Sforza, L. L., Menozzi, P. and Piazza, A. 1994. "The History and Geography ofHuman Genes." Princeton, New Jersey: Princeton University Press.
[12] Chiozza, G. 2002. "Is There a Clash of Civilizations? Evidence from Patterns of Inter-national Con�ict Involvement, 1946�97." Journal of Peace Research 39: 711�34.
[13] Desmet, K., Le Breton, M., Ortuno-Ortin, I. and Weber, S. 2006. "Nation Formation andGenetic Diversity." CORE Discussion Papers 2006095, Université Catholique de Louvain,Center for Operations Research and Econometrics (CORE).
[14] Djankov, S. and Freund, C. 2002. "Trade Flows in the Former Soviet Union, 1987 to1996." Journal of Comparative Economics, Vol. 30(1), 76-90.
[15] Eaton, J. and Tamura, A. 1994. "Bilateralism and Regionalism in Japanese and US Tradeand Direct Foreign Investment." Journal of the Japanese and International Economies,8, 478-510.
50
[16] Ellingsen, T. 2000. "Colorful Community or Ethnic Witches�Brew? Multiethnicity andDomestic Con�ict during and after the Cold War." Journal of Con�ict Resolution, 44(2),228-249.
[17] Feenstra, R. C. 2002. "Border E¤ects and the Gravity Equation: Consistent Methods forEstimation." Scottish Journal of Political Economy, Vol. 49, No.5, 491-506.
[18] Felbermayr, G. J. and Toubal, F. 2010. "Cultural Proximity and Trade." European Eco-nomic Review, Vol. 54, 279-293.
[19] Gallup, J. L., Mellinger, A. D. and Sachs, J. D. 2010. "Geography Datasets." The Centerfor International Development at Harvard University.
[20] Gartzke, E. 2010. "The A¢ nity of Nations: Similarity of State Voting Positions in theUNGA." http://dss.ucsd.edu/~egartzke/htmlpages/data.html.
[21] Gartzke, E. and Gleditsch, K. S. 2006. "Identity and Con�ict: Ties that Bind and Dif-ferences that Divide." European Journal of International Relations, 12(1): 53-87.
[22] Gibler, D. M. 2009. "International Military Alliances from 1648 to 2008." Washington:Congressional Quarterly Press.
[23] Giuliano, P., Spilimbergo, A. and Tonon, G. 2006. "Genetic, Cultural and GeographicalDistances." IZA Discussion Paper No. 2229.
[24] Glick, R. and Taylor, A. 2005. "Collateral Damage: Trade Disruption and the EconomicImpact of War." The Review of Economics and Statistics, 92(1), 102-127.
[25] Guimarães, P. and Portugal, P. 2010. "A Simple Feasible Alternative Procedure to Esti-mate Models with High-Dimensional Fixed E¤ects." Stata Journal, 10(4), 628-649.
[26] Guiso, L., Sapienza, P. and Zingales, L. 2009. "Cultural Biases in Economic Exchange."The Quarterly Journal of Economics, 124 (3): 1095-1131.
[27] Head, K. and Mayer, T. 2002. "Illusory Border E¤ects: Distance Mismeasurement In�atesEstimates of Home Bias in Trade." CEPII, Working Paper No 2002-01.
[28] Head, K., Mayer, T. and Ries, J. 2010. "The Erosion of Colonial Trade Linkages AfterIndependence." Journal of International Economics, 81, 1�14.
[29] Heckman, J., J. 1979. "Sample Selection Bias as a Speci�cation Error." Econometrica,47, 153�61.
[30] Helpman, E., Melitz, M. and Rubinstein, Y. 2008. "Estimating Trade Flows: TradingPartners and Trading Volumes." The Quarterly Journal of Economics, 123, 441�87.
[31] Henderson, E., A. and Tucker, R., M. 2001. "Clear and Present Strangers: The Clash ofCivilizations and International Con�ict." International Studies Quarterly 45: 317�38.
[32] Huntington, S. P. 1993a. "The Clash of Civilizations?" Foreign A¤airs 72(3): 22-49.
51
[33] Huntington, S. P. 1993b. "If Not Civilizations, What? Paradigms of the Post-Cold WarWorld." Foreign A¤airs 72(5): 186�94.
[34] Huntington, S. P. 1998. "The Clash of Civilizations and the Remaking of the WorldOrder." Simon & Schuster Ltd. West Garden Place Kendal Street London W2 2AQ.
[35] King, G. 1988. "Statistical Models for Political Science Event Counts: Bias in Conven-tional Procedures and Evidence for the Exponential Poisson Regression Model." Ameri-can Journal of Political Science, 32, 838-863.
[36] Kristjánsdóttir, H. 2012. "Exports From a Remote Developed Region: Analysed by anInverse Hyperbolic Sine Transformation of the Gravity Model." The World Economy, 35,7, 953-966.
[37] La Porta, R., Lopez-de-Silanes, F., Shleifer, A. and Vishny, R. 1999. "The Quality ofGovernment." Journal of Law, Economics and Organization 15(1), 222-279.
[38] Linders, G. M. and de Groot, H. L. F. 2006. "Estimation of the Gravity Equation in thePresence of Zero Flows." Tinbergen Institute Discussion Paper.
[39] Long, A. 2003. "Defense Pacts and International Trade." Journal of Peace Research, 40,5, 537-552.
[40] Martin, P., Mayer, T. and Thoenig, M. 2008. "Make Trade Not War?" Review of Eco-nomic Studies, 75, 865-900.
[41] Martin, W. and Pham, C. S. 2008. "Estimating the Gravity Model When Zero TradeFlows are Frequent." Mimeo.
[42] Martínez-Zarzoso, I. 2013. "The Log of Gravity Revisited." Applied Economics, 45, 311�327.
[43] Martínez-Zarzoso, I., Felicitas, N-L. D. and Horsewood, N. 2009. "Are Regional TradingAgreements Bene�cial? Static and Dynamic Panel Gravity Models." North AmericanJournal of Economics and Finance, 20, 46�65.
[44] Melitz, J. 2008. "Language and Foreign Trade." European Economic Review, 52, 667-699.
[45] Michaels, G. and Zhi, X. 2007. "Freedom Fries." Centre for Economic Performance Dis-cussion Papers.
[46] Morrow, J. D., Siverson, R. M. and Tabares, T. E. 1998. "The Political Determinantsof International Trade: The Major Powers, 1907-90." The American Political ScienceReview, 92(3), 649-661.
[47] Pence, K. M. 2006. "The Role of Wealth Transformations: An Application to Estimatingthe E¤ect of Tax Incentives on Saving." Contributions to Economic Analysis & Policy,5, 1.
[48] Rauch, J. and Trindade, V. 2002. "Ethnic Chinese Networks in International Trade."Review of Economics and Statistics, 84, 116�130.
52
[49] Rose, A. K. and van Wincoop, E. 2001. "National Money as a Barrier to InternationalTrade: The Real Case for Currency Union." The American Economic Review, Vol. 91,No. 2, 386-390.
[50] Russett, B., M., Oneal, J., R. and Cox, M. 2000. "Clash of Civilizations, or Realism andLiberalism D�ej´a Vu?" Journal of Peace Research, 37(5): 583�608.
[51] Santos Silva, J. M. C. and Tenreyro, S. 2006. "The Log of Gravity." The Review ofEconomics and Statistics, 88(4): 641�658.
[52] Sekkel, J. 2009. "Summary of Major Trade Preference Programs." Center for GlobalDevelopment.
[53] Spolaore, E. and Wacziarg, R. 2009a. "The Di¤usion of Development." The QuarterlyJournal of Economics, 124 (2): 469-529.
[54] Spolaore, E. and Wacziarg, R. 2009b. "War and Relatedness." NBER Working PaperSeries, Working Paper 15095.
[55] Stinnett, D. M., Tir, J., Schafer, P., Diehl, P. F. and Gochman, C. 2002. "The Correlatesof War Project Direct Contiguity Data, Version 3." Con�ict Management and PeaceScience 19 (2):58-66.
[56] Umana Dajud, C. 2013. "Political Proximity and International Trade." Economics andPolitics, Vol 25(3), 283-312.
[57] Yu, M. 2010. "Trade, Democracy and the Gravity Equation." Journal of DevelopmentEconomics, 91(2), 289-300.
New Economic School, Moscow
53


![LES LAURIERS DE LA MONTAGNE - serbica.u-bordeaux-montaigne.fr†_Duško... · Dans son livre Sukob civilizacija [The Clash of Civilizations and the Remaking of World Order ], Podgorica,](https://static.fdocuments.fr/doc/165x107/5e0ba7fa82174b14756dac54/les-lauriers-de-la-montagne-serbicau-bordeaux-duko-dans-son-livre-sukob.jpg)