Best Practices in Utility Demand Response Programs · Synapse Energy Economics, Inc. Best Practices...
50
485 Massachusetts Avenue, Suite 2 Cambridge, Massachusetts 02139 617.661.3248 | www.synapse-energy.com Best Practices in Utility Demand Response Programs With Application to Hydro-Québec’s 2017–2026 Supply Plan Prepared for Regroupement national des conseils régionaux de l’environnement du Québec (RNCREQ) March 31, 2017 AUTHORS Asa S. Hopkins, PhD Melissa Whited
Transcript of Best Practices in Utility Demand Response Programs · Synapse Energy Economics, Inc. Best Practices...
485 Massachusetts Avenue, Suite 2
Cambridge, Massachusetts 02139
617.661.3248 | www.synapse-energy.com
Best Practices in Utility Demand
Response Programs
With Application to Hydro-Québec’s 2017–2026
Supply Plan
Prepared for Regroupement national des conseils régionaux de l’environnement du Québec (RNCREQ)
March 31, 2017
AUTHORS
Asa S. Hopkins, PhD
Melissa Whited
Synapse Energy Economics, Inc. Best Practices in Utility Demand Response Programs
CONTENTS
EXECUTIVE SUMMARY ............................................................................................... 1
1. INTRODUCTION ................................................................................................ 3
2. DEMAND RESPONSE AS A RESOURCE ..................................................................... 3
2.1. Why Demand Response? ..................................................................................................3
2.2. Types of Demand Response ..............................................................................................4
3. THE QUÉBEC CONTEXT FOR DEMAND RESPONSE ...................................................... 5
3.1. Comparison with Demand Response Elsewhere .............................................................. 11
4. BEST PRACTICES IN UTILITY DEMAND RESPONSE PROGRAMS ..................................... 15
4.1. Design for Context ......................................................................................................... 15
Vermont................................................................................................................................... 15
Pennsylvania ............................................................................................................................ 16
4.2. Potential and Planning ................................................................................................... 17
The Pacific Northwest ............................................................................................................. 18
4.3. Taking Advantage of Technology .................................................................................... 20
Advanced metering infrastructure .......................................................................................... 20
Time-varying rates ................................................................................................................... 21
Networks and smart appliances .............................................................................................. 25
Standards ................................................................................................................................. 26
4.4. Measure and Customer Diversity .................................................................................... 28
Heating, ventilation, and air conditioning (HVAC) .................................................................. 28
Water heating .......................................................................................................................... 28
Interruptible loads ................................................................................................................... 30
Distributed electric storage ..................................................................................................... 31
Electric vehicles ....................................................................................................................... 32
4.5. Customer Engagement and Communication ................................................................... 34
Behavioral demand response .................................................................................................. 35
Synapse Energy Economics, Inc. Best Practices in Utility Demand Response Programs
Coupling energy efficiency and demand response customer engagement ............................ 36
Activating markets and innovation with third-party DR aggregators ..................................... 37
4.6. Cost and Benefit Analysis ............................................................................................... 38
5. APPLICATION OF BEST PRACTICES TO QUÉBEC ........................................................ 40
5.1. Planning ........................................................................................................................ 40
5.2. Avoided Costs ................................................................................................................ 41
5.3. Peak-Time Rate or Rebate Programs ............................................................................... 42
5.4. Pilots to Programs .......................................................................................................... 43
5.5. Standards ...................................................................................................................... 44
5.6. Quantify Impacts ........................................................................................................... 44
5.7. Customer Engagement with Energy Efficiency ................................................................. 45
5.8. Flexible and Inclusive Program Design ............................................................................ 45
ABOUT THE AUTHORS ............................................................................................. 46
ACKNOWLEDGEMENTS ............................................................................................ 47
Synapse Energy Economics, Inc. Best Practices in Utility Demand Response Programs 1
EXECUTIVE SUMMARY
Demand response (DR) has long been used by electric utilities to provide capacity, energy, or reliability
to the grid. To determine the need and potential for demand response, every jurisdiction must assess its
own unique characteristics for power supply and demand profile. In Québec, the primary features
include the following:
• The power supply portfolio is almost invariant in cost and availability, except during a few peak periods.
• Those peak periods are almost exclusively driven by the coldest winter weather.
• Electric rates are quite low, compared with other provinces or U.S. states and with the cost of fossil fuels for heating. This results in extensive use of electric space and water heating.
• HydroQuébec Distribution (HQD or the Distributor) has deployed advanced metering infrastructure (AMI) throughout its service territory.
• Québec is taking serious and concerted action to reduce greenhouse gas emissions through the electrification of additional end-uses, particularly electric vehicles.
These features combine to produce an environment in which demand response can play a more central
role in the HQD’s supply planning than it would play in other jurisdictions. However, HQD’s current DR
programs are somewhat smaller (as a fraction of winter peak) than those of other large, winter-peaking
utilities.
While demand response in every jurisdiction has its own unique characteristics, the broad strokes of
best practices for utility DR programs remain relatively consistent:
• Programs should be designed for their context and with consideration for their objectives.
• Program administrators should know the DR potential and plan carefully to meet it.
• Programs should take advantage of technology, such as AMI and smart appliances.
• Programs should address a range of measures and sectors to identify and capture least-cost resources.
• Programs should engage with customers on terms that make sense to them, and capture economies of scale with other customer engagement strategies.
• Programs should be cognizant of costs and benefits, and update both as circumstances change.
Applying the lessons learned from examination of HQD programs in light of these best practices, we
recommend the following actions:
Synapse Energy Economics, Inc. Best Practices in Utility Demand Response Programs 2
• HQD should re-orient how it plans for DR resources to an approach based on achieving the cost-effective potential, rather than projecting only continuation of existing programs. Stochastic supply planning, which accounts for variations in supply, may also be useful. This orientation includes conducting DR potential studies on a regular basis.
• HQD’s approach to calculating avoided costs should be revised (and updated regularly) to take into account the differences in avoided costs between HQD’s peak and other hours and to allow customized avoided costs to be calculated for different kinds of DR interventions.
• To identify and harness the full cost-effective residential flexible capacity resource, HQD should build on its 2008–2010 time-of-use and critical peak price rate pilot by testing new peak time rebate or critical peak price programs. If they prove promising and cost-effective, HQD should then introduce them as general opt-in or opt-out options to all customers. We hypothesize that an opt-out peak time rebate program appears most likely to maximize cost-effective demand savings and meet with customer acceptance, but market testing is necessary.
• As HQD develops new DR programs and moves them from pilot to implementation, it is important to move with all due haste to launch programs and capture the cost-effective potential. HQD’s water heater program is particularly promising and the Distributor should continue to advocate for it.
• HQD should incorporate the use of standards (such as the Universal Smart Network Access Port or OpenADR) in its program design to maximize its ability to adopt technologies developed elsewhere.
• HQD should quantify the impacts of its occasional appeals for peak reduction, and use best practices for evaluation, measurement, and verification of DR programs.
• HQD should integrate demand response into its energy efficiency offerings where cost-effective opportunities exist.
• We encourage HQD to continue to diversify its DR program offerings or make them more flexible, especially for commercial and industrial customers. This will encourage greater participation on terms that make sense for both participant and Distributor. In particular, we recommend that DR program designs encompass aggregators.
Synapse Energy Economics, Inc. Best Practices in Utility Demand Response Programs 3
1. INTRODUCTION
On November 1, 2016, HydroQuébec Distribution (HQD or the Distributor) filed its 2017–2026 Supply
Plan. This Supply Plan identifies a need for additional winter peak capacity beginning in the winter of
2017–2018, driven primarily by continued growth in the Distributor’s winter peak. The Supply Plan
anticipates meeting this near-term peak capacity need through market purchases. By the end of the
Supply Plan period, however, the capacity shortfall is beyond the reach of the short-term market. The
Supply Plan also discusses the demand response (DR) and other demand-side resources that HQD
expects to be able to deploy in each year to help meet this demand. These resources reflect a maturing
set of programs that retain significant growth potential, although the Supply Plan does not quantify
some aspects of that potential.
The purpose of this report is to identify best practices regarding the use of demand response as a utility
resource, drawing on examples from around the United States and Canada. The report also puts those
best practices into the Québec context to develop a set of recommendations regarding how HQD could
improve both its DR programs and how those programs are accounted for in its Supply Plans.
In Québec, the primary need is for winter capacity. The Distributor’s energy costs do not vary
substantially aside from near winter peak, and optimizing use of patrimonial energy and short-term
markets can reduce cost of service. In addition, there may be locational needs for DR capacity where the
Distributor has growing loads. The discussion of best practices contained here includes measures and
tools designed to address both summer and winter peaks: even programs aimed at summer peaks have
lessons to teach winter programs.
2. DEMAND RESPONSE AS A RESOURCE
2.1. Why Demand Response?
Electric utilities often use demand response to provide capacity, energy, or reliability to the grid. By
reducing demand during a small number of peak demand hours per year, demand response enables
utilities to avoid costly capital investments in generation capacity that would be infrequently used.
Demand response may also be used to provide capacity in constrained local areas of the grid, thereby
avoiding transmission or distribution upgrades. As an energy resource, demand response can be
deployed when energy costs are high, for example when fuel prices spike suddenly. Demand response
also may operate as a reliability resource that is deployed during emergencies. To give an example, it
can help avoid brownouts, blackouts, or more expensive emergency generation during a power plant
forced outage.
In recent years, demand response has begun to be used to enhance grid flexibility through the provision
of ancillary services, such as frequency response or load following. In this capacity, demand response
Synapse Energy Economics, Inc. Best Practices in Utility Demand Response Programs 4
may quickly decrease or increase load, depending on the needs of the utility or system operator. Such
services facilitate the integration of variable renewable resources by absorbing excess energy during
periods of oversupply and maintaining the minute-to-minute balance between electricity supply and
demand. DR resources that provide these types of services often are automated and utilize some form
of energy storage such as batteries, water heaters, or other forms of thermal storage.
Demand response’s load modifying capability enables more efficient use of current electricity
generation resources, while yielding economic, reliability, and environmental benefits. Yet demand
response is not a homogenous resource; it is provided by a highly diverse set of actors in numerous
different ways, and with varying capabilities. This diversity precludes any simple characterization of DR
types and also contributes to the flexibility of demand response to meet multiple system needs. The
following section provides an overview of the various forms of demand response.
2.2. Types of Demand Response
All categories of customers (industrial, commercial, and residential) employing many different
technologies or strategies can provide demand response. However, the deployment of such resources
generally varies by customer type.
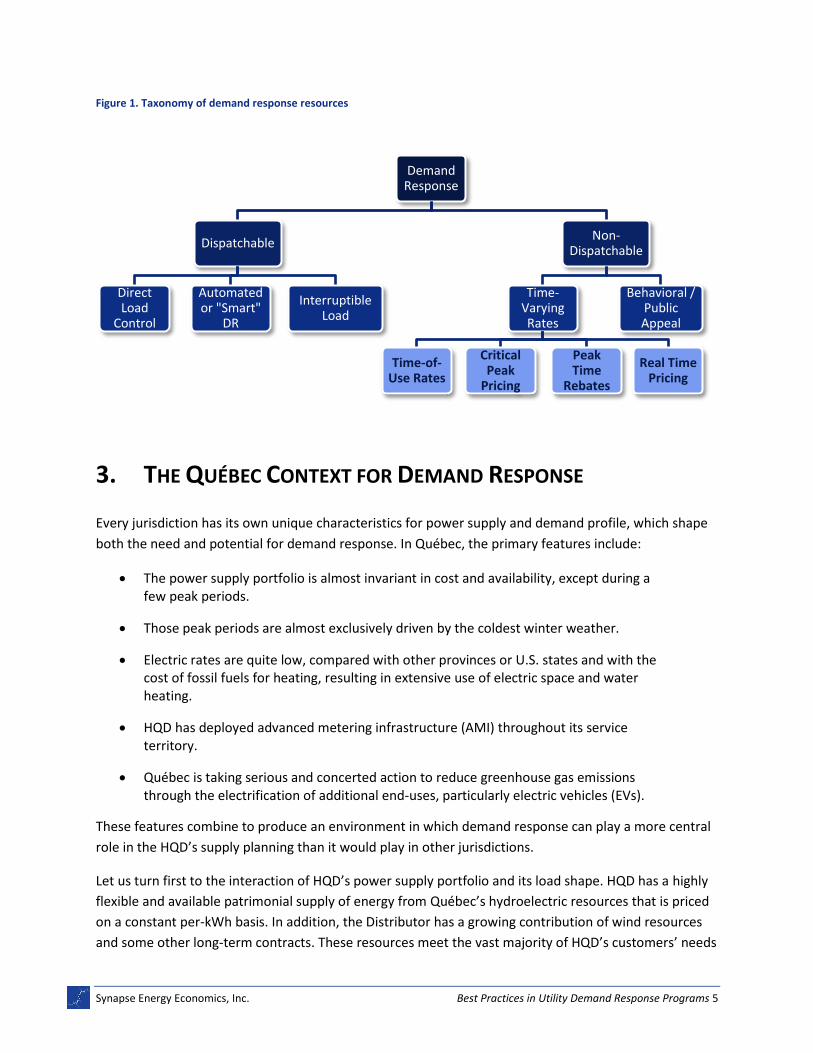
DR resources are typically deployed in two distinct ways: either the utility (or other system operator)
directly dispatches the resources, or customers voluntarily elect to adjust their consumption in response
to price signals (referred to as “non-dispatchable” DR). Customers with dispatchable resources typically
enter into contracts to receive payments for demand reductions, and they may face penalties for non-
performance. Dispatchable programs are common in the commercial and industrial sectors (including
agriculture).
In contrast, non-dispatchable resources generally participate in price-based DR programs such as real-
time pricing, critical peak pricing, peak time rebates, and time-of-use tariffs. These price-based programs
provide users with ongoing price signals to encourage lower energy consumption during periods of high
electricity prices. Non-dispatchable demand response programs have been used for many years for large
commercial and industrial users, and they are becoming more common for residential and small
commercial users. The adoption of advanced metering technologies has spurred the expansion of price-
based programs to residential and small commercial.
Figure 1, below, depicts common types of demand-side resources.
Synapse Energy Economics, Inc. Best Practices in Utility Demand Response Programs 5
Figure 1. Taxonomy of demand response resources
3. THE QUÉBEC CONTEXT FOR DEMAND RESPONSE
Every jurisdiction has its own unique characteristics for power supply and demand profile, which shape
both the need and potential for demand response. In Québec, the primary features include:
• The power supply portfolio is almost invariant in cost and availability, except during a few peak periods.
• Those peak periods are almost exclusively driven by the coldest winter weather.
• Electric rates are quite low, compared with other provinces or U.S. states and with the cost of fossil fuels for heating, resulting in extensive use of electric space and water heating.
• HQD has deployed advanced metering infrastructure (AMI) throughout its service territory.
• Québec is taking serious and concerted action to reduce greenhouse gas emissions through the electrification of additional end-uses, particularly electric vehicles (EVs).
These features combine to produce an environment in which demand response can play a more central
role in the HQD’s supply planning than it would play in other jurisdictions.
Let us turn first to the interaction of HQD’s power supply portfolio and its load shape. HQD has a highly
flexible and available patrimonial supply of energy from Québec’s hydroelectric resources that is priced
on a constant per-kWh basis. In addition, the Distributor has a growing contribution of wind resources
and some other long-term contracts. These resources meet the vast majority of HQD’s customers’ needs
Demand Response
Dispatchable
Direct Load
Control
Automated or "Smart"
DR
Interruptible Load
Non-Dispatchable
Time-Varying Rates
Time-of-Use Rates
Critical Peak
Pricing
Peak Time
Rebates
Real Time Pricing
Behavioral / Public Appeal
Synapse Energy Economics, Inc. Best Practices in Utility Demand Response Programs 6
for energy, supplemented by short-term bilateral and market purchases. Since these other resources
can be considerably more expensive than the Distributor’s legacy supply, efforts to reduce these costs
can have a substantial impact on the overall cost of service. Because these peaks are highly correlated
with the weather, they are also quite predictable. Due to these characteristics, demand response and
other resources that are dispatchable with a day’s notice are a good fit. Given the unique characteristics
of the patrimonial supply, where “bâtonnets” are assigned to each hour of load, it may also be beneficial
to have some resources that are dispatchable with shorter lead times. This would include “smart DR”
enabled by two-way communication. Smart DR would also enable the targeting of DR activation to
circuits experiencing specific constraints due to load growth or changes (including increasing air
conditioning in summer).
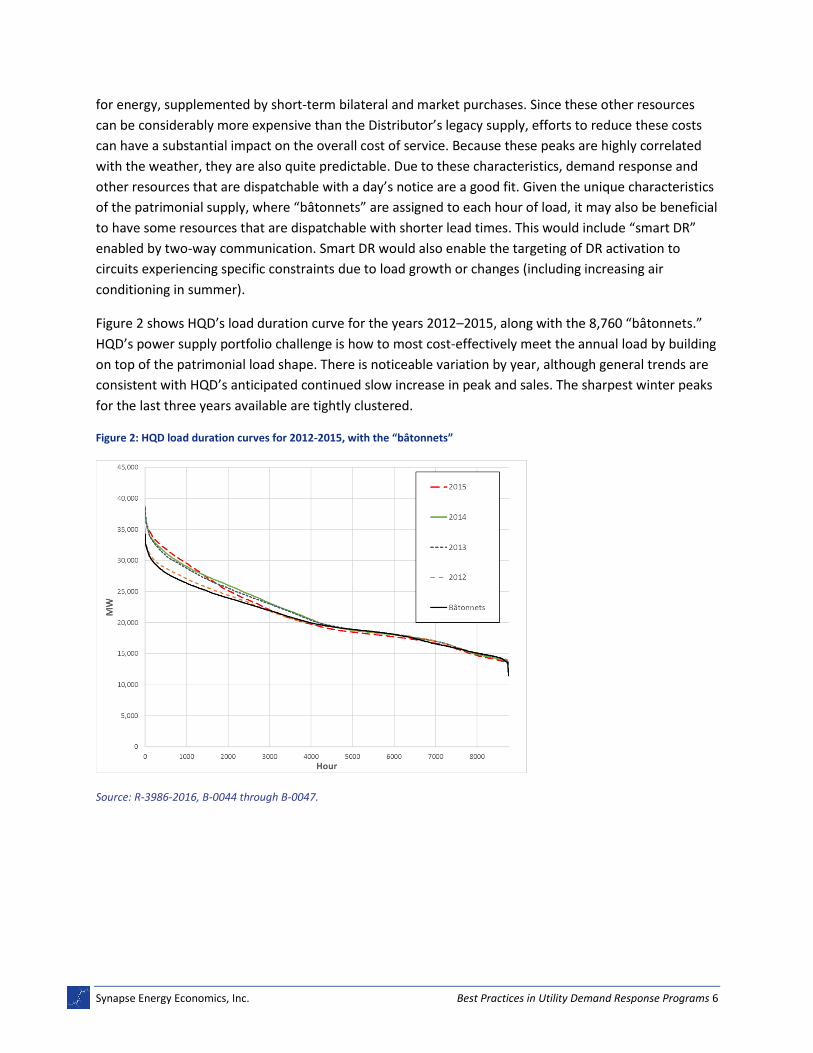
Figure 2 shows HQD’s load duration curve for the years 2012–2015, along with the 8,760 “bâtonnets.”
HQD’s power supply portfolio challenge is how to most cost-effectively meet the annual load by building
on top of the patrimonial load shape. There is noticeable variation by year, although general trends are
consistent with HQD’s anticipated continued slow increase in peak and sales. The sharpest winter peaks
for the last three years available are tightly clustered.
Figure 2: HQD load duration curves for 2012-2015, with the “bâtonnets”
Source: R-3986-2016, B-0044 through B-0047.
Synapse Energy Economics, Inc. Best Practices in Utility Demand Response Programs 7
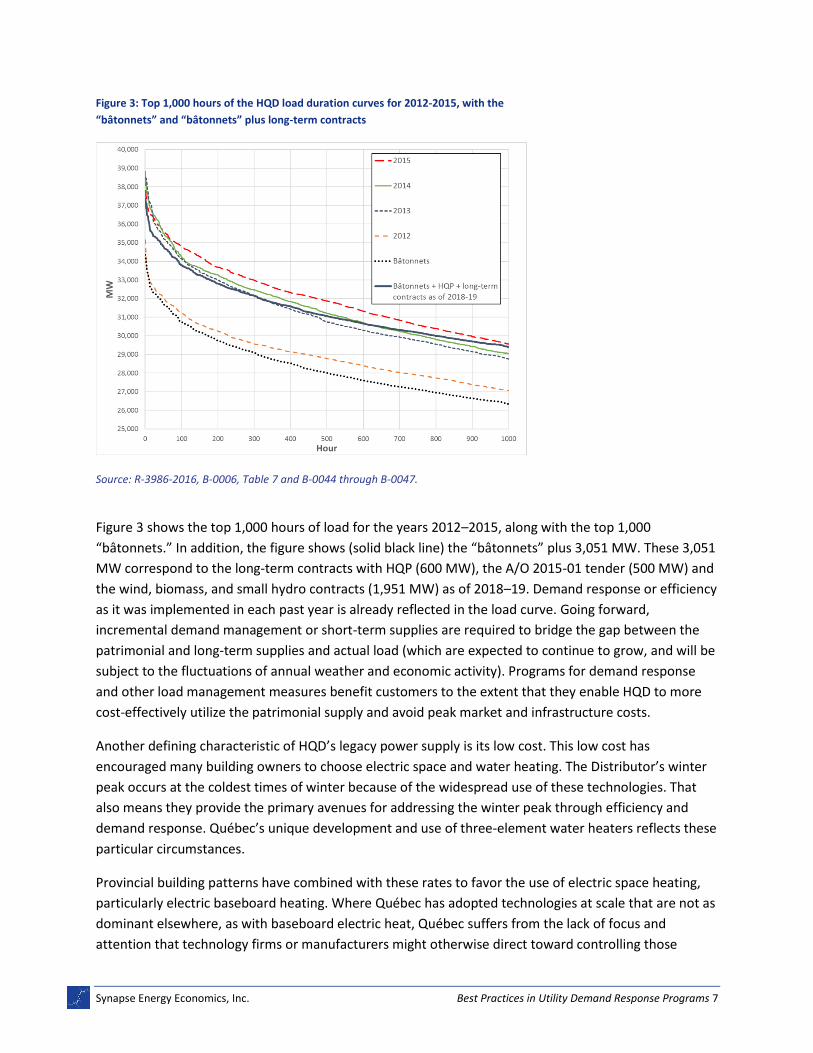
Figure 3: Top 1,000 hours of the HQD load duration curves for 2012-2015, with the
“bâtonnets” and “bâtonnets” plus long-term contracts
Source: R-3986-2016, B-0006, Table 7 and B-0044 through B-0047.
Figure 3 shows the top 1,000 hours of load for the years 2012–2015, along with the top 1,000
“bâtonnets.” In addition, the figure shows (solid black line) the “bâtonnets” plus 3,051 MW. These 3,051
MW correspond to the long-term contracts with HQP (600 MW), the A/O 2015-01 tender (500 MW) and
the wind, biomass, and small hydro contracts (1,951 MW) as of 2018–19. Demand response or efficiency
as it was implemented in each past year is already reflected in the load curve. Going forward,
incremental demand management or short-term supplies are required to bridge the gap between the
patrimonial and long-term supplies and actual load (which are expected to continue to grow, and will be
subject to the fluctuations of annual weather and economic activity). Programs for demand response
and other load management measures benefit customers to the extent that they enable HQD to more
cost-effectively utilize the patrimonial supply and avoid peak market and infrastructure costs.
Another defining characteristic of HQD’s legacy power supply is its low cost. This low cost has
encouraged many building owners to choose electric space and water heating. The Distributor’s winter
peak occurs at the coldest times of winter because of the widespread use of these technologies. That
also means they provide the primary avenues for addressing the winter peak through efficiency and
demand response. Québec’s unique development and use of three-element water heaters reflects these
particular circumstances.
Provincial building patterns have combined with these rates to favor the use of electric space heating,
particularly electric baseboard heating. Where Québec has adopted technologies at scale that are not as
dominant elsewhere, as with baseboard electric heat, Québec suffers from the lack of focus and
attention that technology firms or manufacturers might otherwise direct toward controlling those
Synapse Energy Economics, Inc. Best Practices in Utility Demand Response Programs 8
technologies. Advanced communicating thermostats, such as the Nest or Ecobee, are not generally
compatible with baseboard heating. Moreover, if they were compatible, they would be less cost-
effective because the room-by-room control of baseboard heat would necessitate a separate expensive
thermostat for each room.
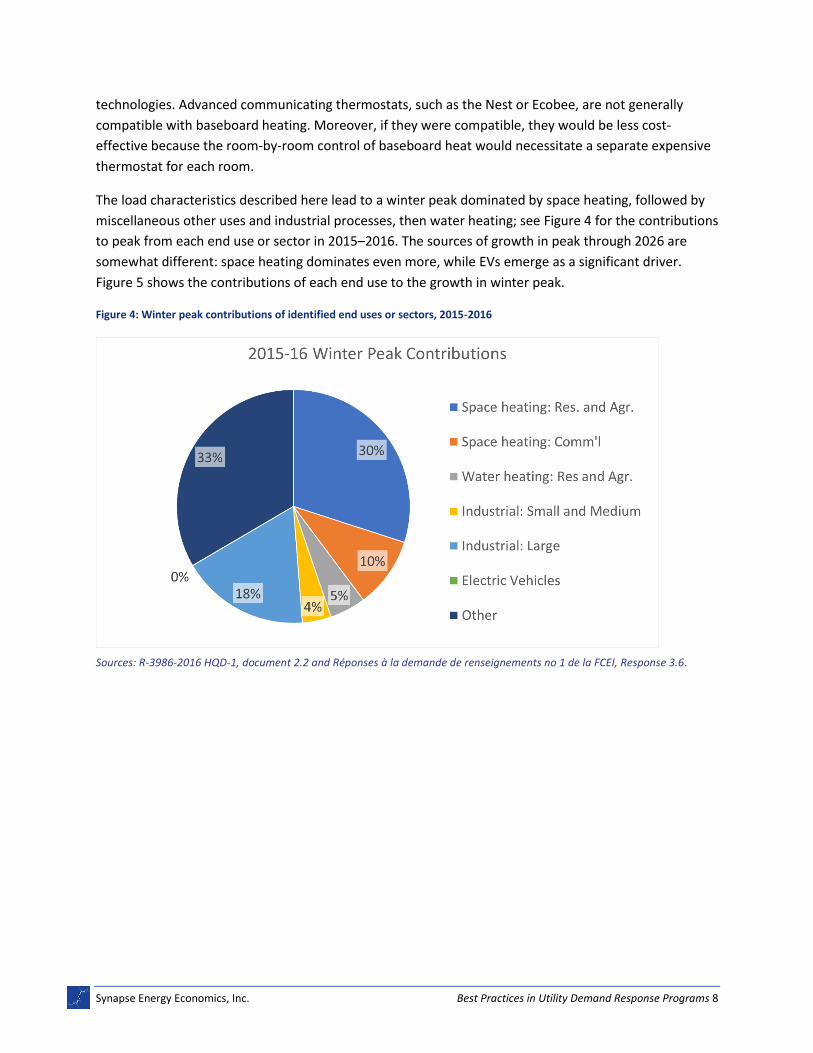
The load characteristics described here lead to a winter peak dominated by space heating, followed by
miscellaneous other uses and industrial processes, then water heating; see Figure 4 for the contributions
to peak from each end use or sector in 2015–2016. The sources of growth in peak through 2026 are
somewhat different: space heating dominates even more, while EVs emerge as a significant driver.
Figure 5 shows the contributions of each end use to the growth in winter peak.
Figure 4: Winter peak contributions of identified end uses or sectors, 2015-2016
Sources: R-3986-2016 HQD-1, document 2.2 and Réponses à la demande de renseignements no 1 de la FCEI, Response 3.6.
Synapse Energy Economics, Inc. Best Practices in Utility Demand Response Programs 9
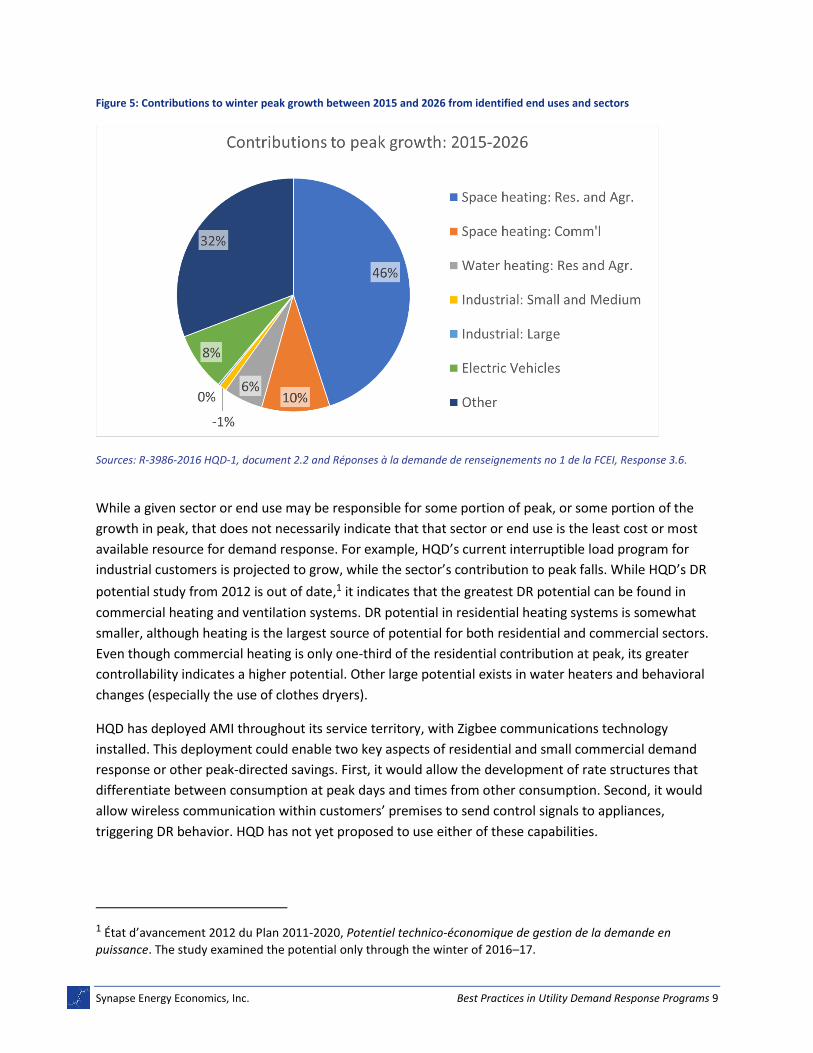
Figure 5: Contributions to winter peak growth between 2015 and 2026 from identified end uses and sectors
Sources: R-3986-2016 HQD-1, document 2.2 and Réponses à la demande de renseignements no 1 de la FCEI, Response 3.6.
While a given sector or end use may be responsible for some portion of peak, or some portion of the
growth in peak, that does not necessarily indicate that that sector or end use is the least cost or most
available resource for demand response. For example, HQD’s current interruptible load program for
industrial customers is projected to grow, while the sector’s contribution to peak falls. While HQD’s DR
potential study from 2012 is out of date,1 it indicates that the greatest DR potential can be found in
commercial heating and ventilation systems. DR potential in residential heating systems is somewhat
smaller, although heating is the largest source of potential for both residential and commercial sectors.
Even though commercial heating is only one-third of the residential contribution at peak, its greater
controllability indicates a higher potential. Other large potential exists in water heaters and behavioral
changes (especially the use of clothes dryers).
HQD has deployed AMI throughout its service territory, with Zigbee communications technology
installed. This deployment could enable two key aspects of residential and small commercial demand
response or other peak-directed savings. First, it would allow the development of rate structures that
differentiate between consumption at peak days and times from other consumption. Second, it would
allow wireless communication within customers’ premises to send control signals to appliances,
triggering DR behavior. HQD has not yet proposed to use either of these capabilities.
1 État d’avancement 2012 du Plan 2011-2020, Potentiel technico-économique de gestion de la demande en
puissance. The study examined the potential only through the winter of 2016–17.
Synapse Energy Economics, Inc. Best Practices in Utility Demand Response Programs 10
Québec has established ambitious goals for the deployment of plug-in EVs as a key component of its
policy to mitigate global climate change and reduce dependence on fuels not produced in the province.
These goals include the use of 100,000 EVs by 2020 and 300,000 EVs by 2026.2 HQD has incorporated
energy use and peak impacts of these new loads in its energy and demand forecasts, including an
estimate of 0.6 kW of peak impact for each EV. This results in a contribution of 189 MW by 2025, or 8.5
percent of the increase in winter peak forecast over the 10-year Supply Plan.3 EVs are a much more
flexible load than other appliances or services, and as such can play a role akin to electric storage on the
grid. HQD has not yet launched or piloted any DR programs aimed at mitigating these new loads’ impact
on winter peak, and the Supply Plan does not discuss demand response or controllability of EV loads.
HQD’s Supply Plan identifies two classes of DR resource: “interruptible electricity” (primarily industrial
customers) and “new demand response programs” (which includes residential controlled or
interruptible loads; “GDP Affaires” or commercial/industrial building interruptible loads; and controlling
or interrupting loads in Hydro-Québec’s own facilities). The existing industrial program is projected to
achieve 850 MW of DR capability in the winter of 2016–17, rising to 1000 MW by the winter of 2018–19.
It remains flat for the rest of the study period. Historical participation in this program has varied, but in
the last two winters it has exceeded the amount planned for in the Supply Plan; see Table 1.
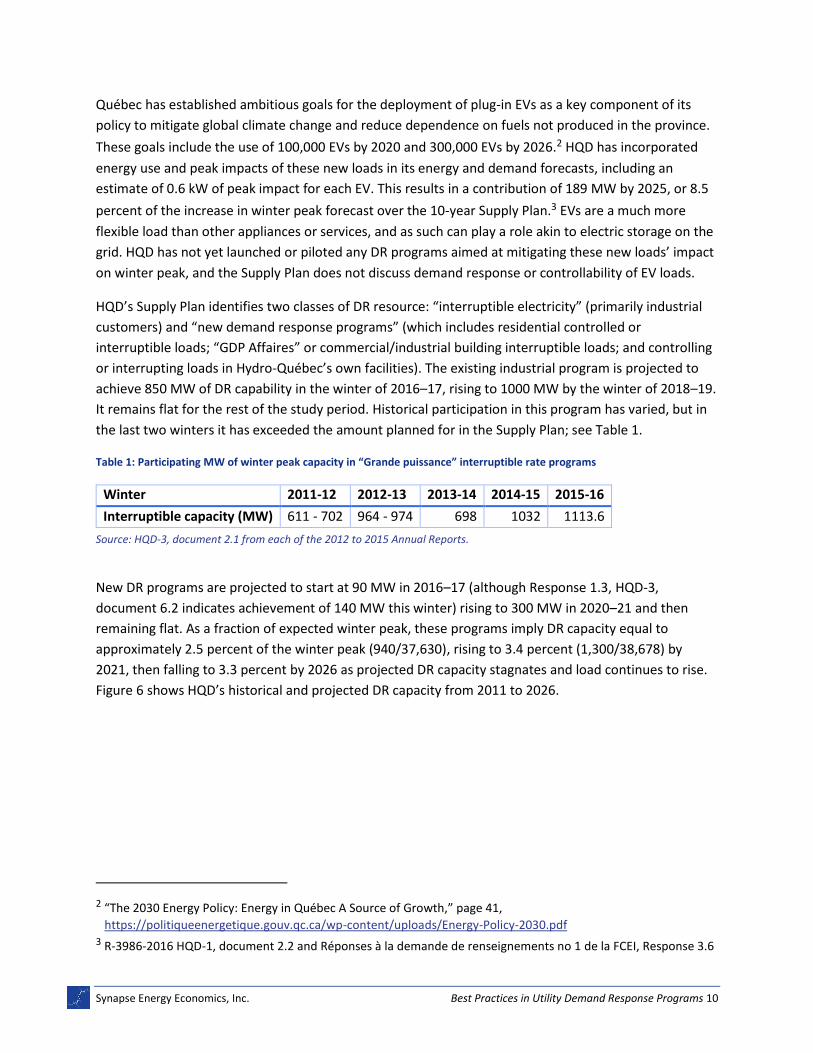
Table 1: Participating MW of winter peak capacity in “Grande puissance” interruptible rate programs
Winter 2011-12 2012-13 2013-14 2014-15 2015-16
Interruptible capacity (MW) 611 - 702 964 - 974 698 1032 1113.6
Source: HQD-3, document 2.1 from each of the 2012 to 2015 Annual Reports.
New DR programs are projected to start at 90 MW in 2016–17 (although Response 1.3, HQD-3,
document 6.2 indicates achievement of 140 MW this winter) rising to 300 MW in 2020–21 and then
remaining flat. As a fraction of expected winter peak, these programs imply DR capacity equal to
approximately 2.5 percent of the winter peak (940/37,630), rising to 3.4 percent (1,300/38,678) by
2021, then falling to 3.3 percent by 2026 as projected DR capacity stagnates and load continues to rise.
Figure 6 shows HQD’s historical and projected DR capacity from 2011 to 2026.
2 “The 2030 Energy Policy: Energy in Québec A Source of Growth,” page 41,
https://politiqueenergetique.gouv.qc.ca/wp-content/uploads/Energy-Policy-2030.pdf 3 R-3986-2016 HQD-1, document 2.2 and Réponses à la demande de renseignements no 1 de la FCEI, Response 3.6
Synapse Energy Economics, Inc. Best Practices in Utility Demand Response Programs 11
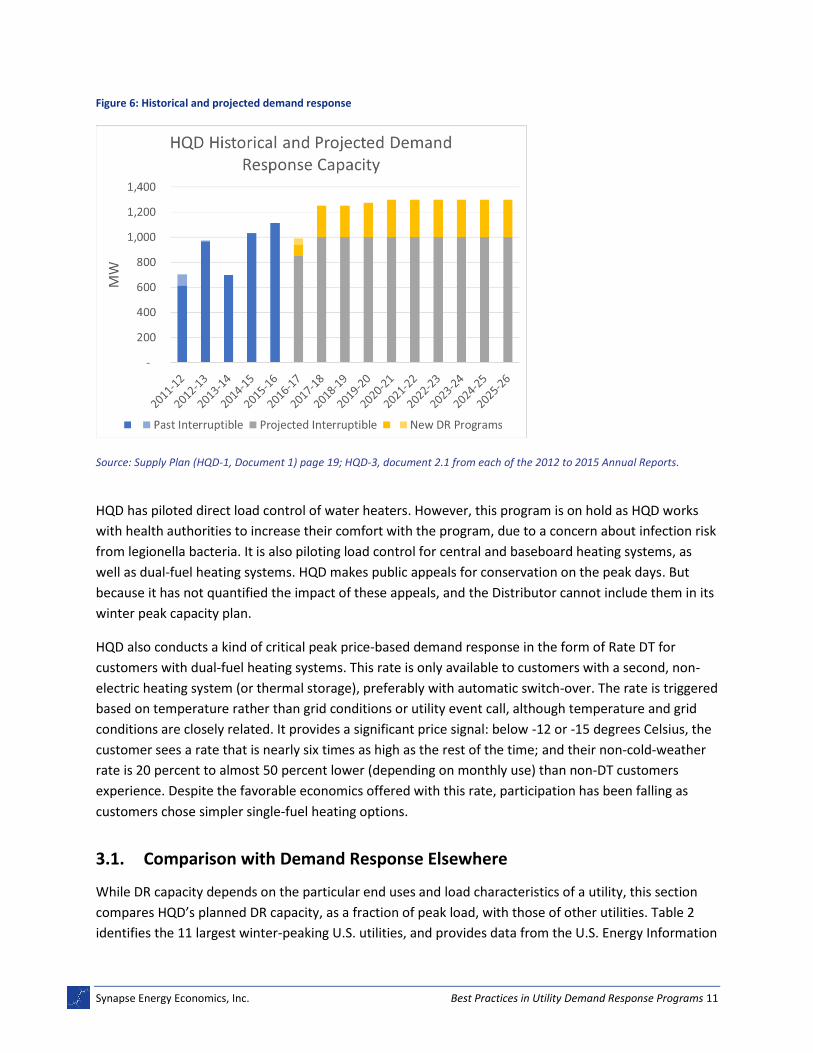
Figure 6: Historical and projected demand response
Source: Supply Plan (HQD-1, Document 1) page 19; HQD-3, document 2.1 from each of the 2012 to 2015 Annual Reports.
HQD has piloted direct load control of water heaters. However, this program is on hold as HQD works
with health authorities to increase their comfort with the program, due to a concern about infection risk
from legionella bacteria. It is also piloting load control for central and baseboard heating systems, as
well as dual-fuel heating systems. HQD makes public appeals for conservation on the peak days. But
because it has not quantified the impact of these appeals, and the Distributor cannot include them in its
winter peak capacity plan.
HQD also conducts a kind of critical peak price-based demand response in the form of Rate DT for
customers with dual-fuel heating systems. This rate is only available to customers with a second, non-
electric heating system (or thermal storage), preferably with automatic switch-over. The rate is triggered
based on temperature rather than grid conditions or utility event call, although temperature and grid
conditions are closely related. It provides a significant price signal: below -12 or -15 degrees Celsius, the
customer sees a rate that is nearly six times as high as the rest of the time; and their non-cold-weather
rate is 20 percent to almost 50 percent lower (depending on monthly use) than non-DT customers
experience. Despite the favorable economics offered with this rate, participation has been falling as
customers chose simpler single-fuel heating options.
3.1. Comparison with Demand Response Elsewhere
While DR capacity depends on the particular end uses and load characteristics of a utility, this section
compares HQD’s planned DR capacity, as a fraction of peak load, with those of other utilities. Table 2
identifies the 11 largest winter-peaking U.S. utilities, and provides data from the U.S. Energy Information
Synapse Energy Economics, Inc. Best Practices in Utility Demand Response Programs 12
Administration regarding their deployable DR potential and customer participation in 2015.4 The
demand response identified here does not include changes in load resulting from rate programs such as
peak time rebates. The variation among utility approaches to demand response is apparent from this
table: some utilities target almost exclusively commercial and industrial customers; others rely on large
residential programs. Regardless, their weighted average of deployable DR potential as a fraction of
winter peak is 5.7 percent. On this metric, HQD would rank tenth of 12 if inserted onto this list, with
plans over the next decade to climb to ninth. Figure 7 shows the DR capacity as a fraction of winter peak
for the 11 U.S. utilities along with HQD, broken out by sector. The lighter area on the HQD bar shows the
Distributor’s proposed program growth.
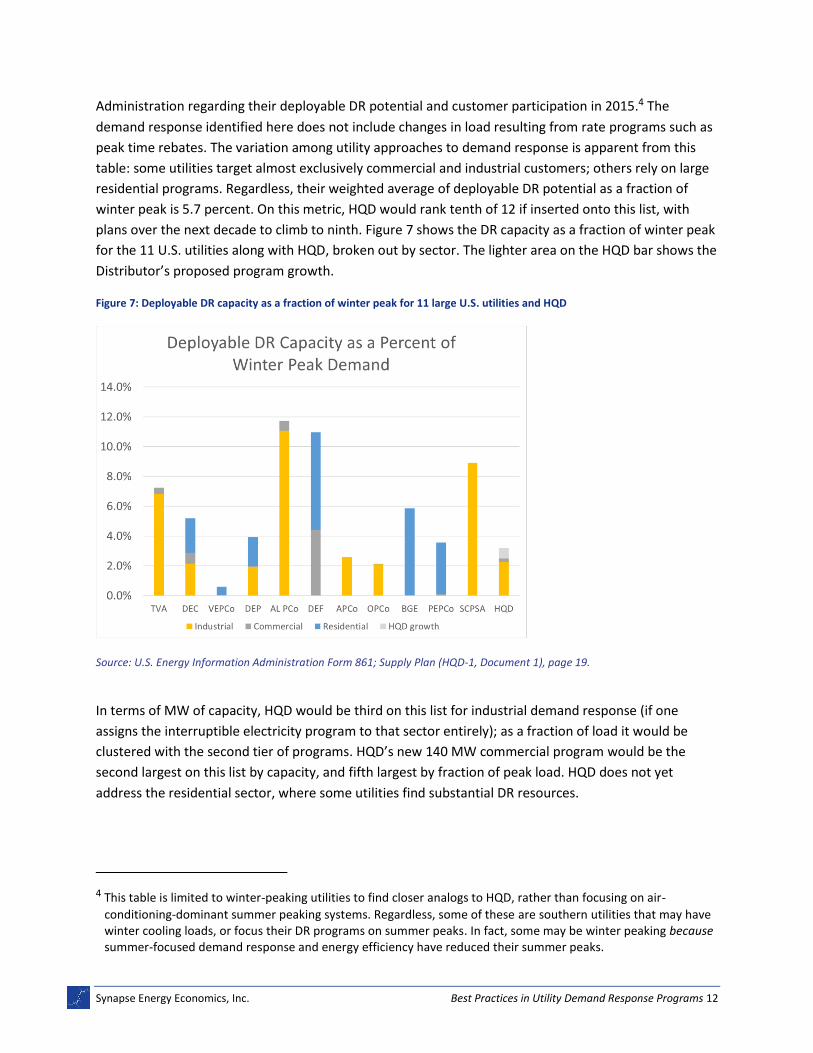
Figure 7: Deployable DR capacity as a fraction of winter peak for 11 large U.S. utilities and HQD
Source: U.S. Energy Information Administration Form 861; Supply Plan (HQD-1, Document 1), page 19.
In terms of MW of capacity, HQD would be third on this list for industrial demand response (if one
assigns the interruptible electricity program to that sector entirely); as a fraction of load it would be
clustered with the second tier of programs. HQD’s new 140 MW commercial program would be the
second largest on this list by capacity, and fifth largest by fraction of peak load. HQD does not yet
address the residential sector, where some utilities find substantial DR resources.
4 This table is limited to winter-peaking utilities to find closer analogs to HQD, rather than focusing on air-
conditioning-dominant summer peaking systems. Regardless, some of these are southern utilities that may have winter cooling loads, or focus their DR programs on summer peaks. In fact, some may be winter peaking because summer-focused demand response and energy efficiency have reduced their summer peaks.
Synapse Energy Economics, Inc. Best Practices in Utility Demand Response Programs 13
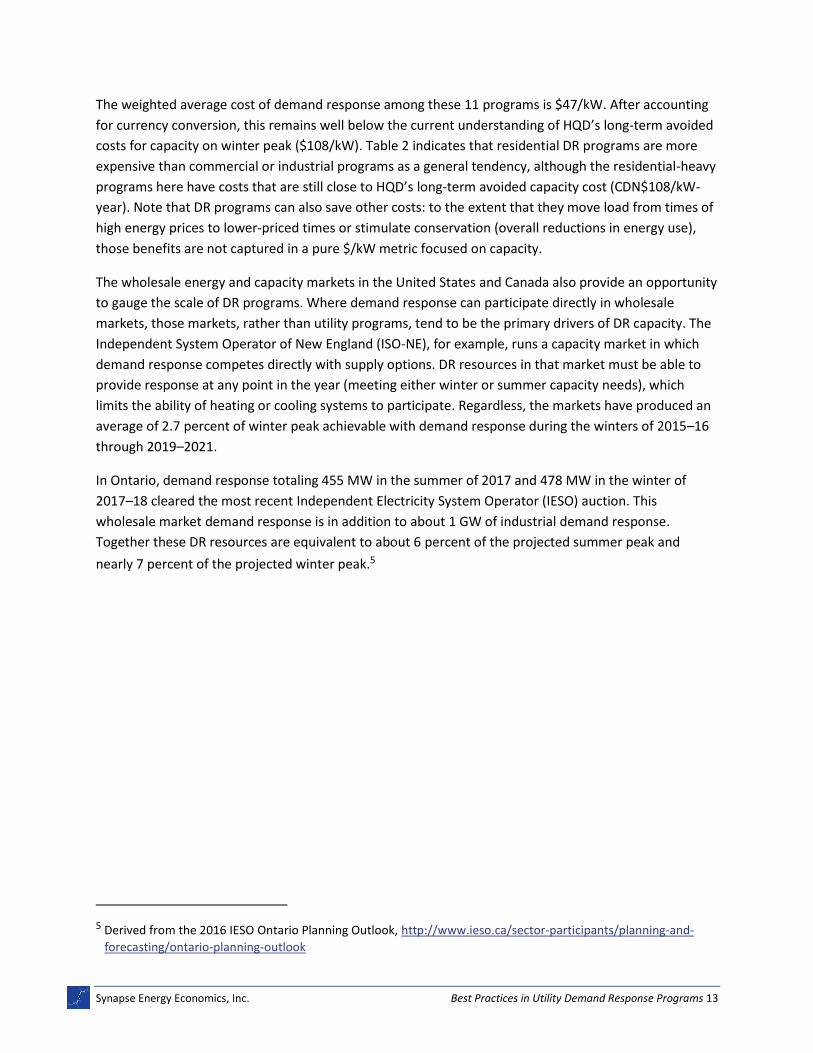
The weighted average cost of demand response among these 11 programs is $47/kW. After accounting
for currency conversion, this remains well below the current understanding of HQD’s long-term avoided
costs for capacity on winter peak ($108/kW). Table 2 indicates that residential DR programs are more
expensive than commercial or industrial programs as a general tendency, although the residential-heavy
programs here have costs that are still close to HQD’s long-term avoided capacity cost (CDN$108/kW-
year). Note that DR programs can also save other costs: to the extent that they move load from times of
high energy prices to lower-priced times or stimulate conservation (overall reductions in energy use),
those benefits are not captured in a pure $/kW metric focused on capacity.
The wholesale energy and capacity markets in the United States and Canada also provide an opportunity
to gauge the scale of DR programs. Where demand response can participate directly in wholesale
markets, those markets, rather than utility programs, tend to be the primary drivers of DR capacity. The
Independent System Operator of New England (ISO-NE), for example, runs a capacity market in which
demand response competes directly with supply options. DR resources in that market must be able to
provide response at any point in the year (meeting either winter or summer capacity needs), which
limits the ability of heating or cooling systems to participate. Regardless, the markets have produced an
average of 2.7 percent of winter peak achievable with demand response during the winters of 2015–16
through 2019–2021.
In Ontario, demand response totaling 455 MW in the summer of 2017 and 478 MW in the winter of
2017–18 cleared the most recent Independent Electricity System Operator (IESO) auction. This
wholesale market demand response is in addition to about 1 GW of industrial demand response.
Together these DR resources are equivalent to about 6 percent of the projected summer peak and
nearly 7 percent of the projected winter peak.5
5 Derived from the 2016 IESO Ontario Planning Outlook, http://www.ieso.ca/sector-participants/planning-and-
forecasting/ontario-planning-outlook
Synapse Energy Economics, Inc. Best Practices in Utility Demand Response Programs 14
Table 2: 2015 demand response portfolios of the eleven largest U.S. winter-peaking utilities
Utility 2015 Peak (MW)
Deployable DR (MW)
Deployable DR % of
winter peak
Program costs
(US$/kW)
Residential Commercial Industrial
Winter Summer MW %
particip. MW
# particip.
MW #
particip.
Tennessee Valley Authority
32,751 29,043 2,370 7.2% $33 - - 128 951 2,242 541
Duke Energy Carolinas
18,490 17,353 961 5.2% $35 431 9% 133 172 397 307
Virginia Electric & Power Co
18,434 16,502 110 0.6% $95 103 6% 7 6 - -
Duke Energy Progress
14,814 12,280 582 3.9% $34 289 11% 7 16 286 90
Alabama Power Co 12,398 11,600 1,452 11.7% $17 0 0% 81 63 1,371 124
Duke Energy Florida 9,475 9,219 1,039 11.0% $78 623 27% 416 772 - -
Appalachian Power Co
8,690 5,729 223 2.6% - 2 0% - - 221 10
Ohio Power Co 6,784 3,423 144 2.1% - 1 0% - - 143 2
Baltimore Gas & Electric
6,712 6,507 394 5.9% $94 394 36% - - - -
Potomac Electric Power (Pepco)
6,042 5,485 216 3.6% $117 210 28% 6 1,756 - -
South Carolina Public Service Authority
5,869 4,979 523 8.9% $101 - 0% - - 523 20
Source: U.S. Energy Information Administration Form 861.
Synapse Energy Economics, Inc. Best Practices in Utility Demand Response Programs 15
4. BEST PRACTICES IN UTILITY DEMAND RESPONSE PROGRAMS
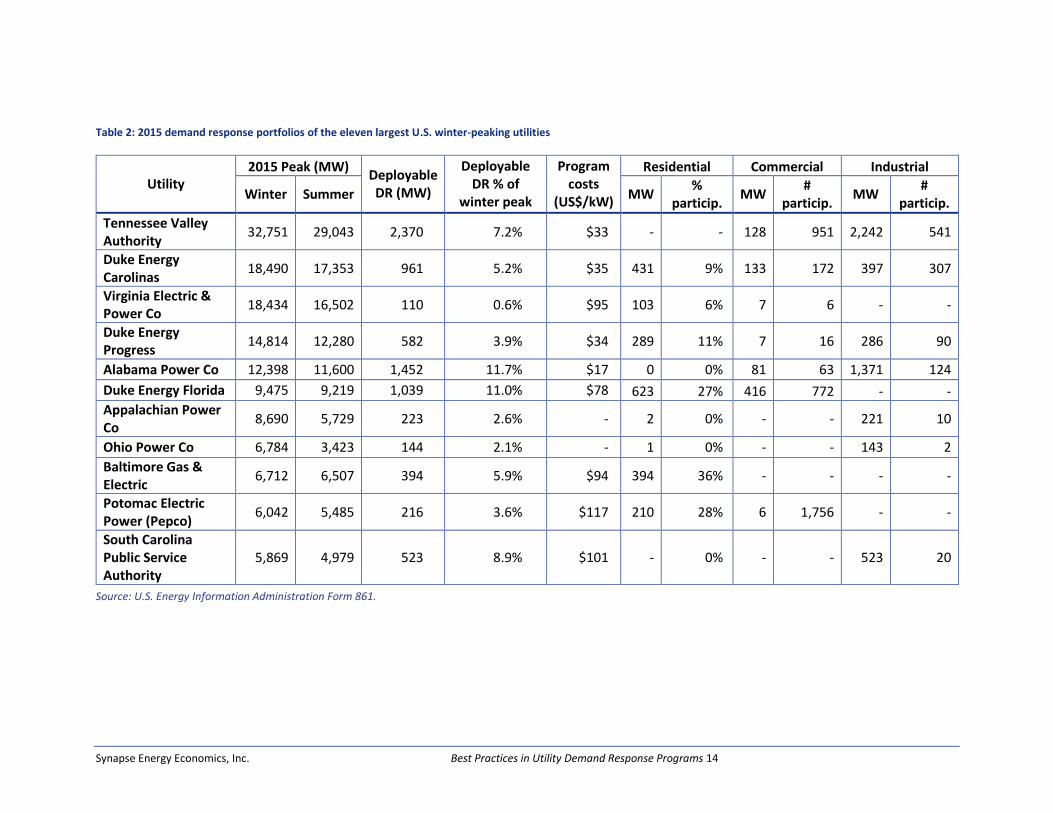
Despite variations across jurisdictions, some basic principles and best practices for utility DR programs
remain relatively consistent:
4.1. Design for Context
Utility DR programs reflect the needs of the electric system in which they operate. Where the drivers of
cost are summer peaks, DR programs focus on end uses driven by hot summer weather, such as air
conditioning. Where electric rates are low enough that electric water heating is common, DR programs
can be designed to harness the controllability of that resource. Situations in which the grid is stressed by
the integration of variable generation favor “smart” DR programs that can dynamically increase or
decrease load (including in specific locations).
Weather-dependent peaks, such as in Québec, put a premium on the interaction of weather and load
forecasting to identify when the grid will be stressed. Customers with DR resources expect to be called
to perform a limited number of hours each winter; calling events when the system ends up not needing
them wastes customer engagement and willingness to participate.
Vermont
One example of an emerging utility practice for joint load and weather forecasting is the Vermont
Weather Analytics Center (VTWAC), developed by IBM Research and the Vermont Electric Power
Distributors and system operators implementing demand response programs should:
Design programs appropriate for the jurisdiction's context and objectives
Quantify the DR potential and develop a plan to meet it
Take advantage of AMI, smart appliances, and other technologies
Address a range of measures and sectors to identify and capture least-cost resources
Effectively engage with customers, and capture economies of scale with other customer engagement initiatives
Continually assess costs and benefits and update both as circumstances change
Synapse Energy Economics, Inc. Best Practices in Utility Demand Response Programs 16
Company.6 The center combines hyper-local weather forecasting from IBM’s Deep Thunder platform
with machine learning on the interaction of weather and utility load (informed by AMI data from 90+
percent of Vermont electric customers) to predict hourly load up to 72 hours in advance. Weather is also
the driver of solar and wind production, so the resulting power flows can take that into account. VTWAC
claims 97.6 percent accuracy for statewide energy demand forecasting, including 95.1 percent solar
forecast accuracy and 92.8 percent wind forecast accuracy, both 24 hours ahead. Vermont utilities use
the load forecast to determine when to deploy their DR resources.
Another critical part of context for program design is the cost drivers that are being avoided by demand
response. In the Vermont context, for example, utilities face a monthly peak cost associated with
regional transmission costs as well as a larger annual summer peak associated with capacity. Regional
energy prices vary in a small enough range over the course of the day that shifting load a few hours over
the day does not produce enough energy market savings to make a program aimed at that resource
cost-effective. As variable distributed generation resources continue to increase, circuit-specific DR
resources may become cost-effective. As we will see, other jurisdictions have different cost drivers and
opportunities. For instance, energy arbitrage alone can be cost-effective in some places.
Pennsylvania
Pennsylvania’s Act 129 of 2008 required electric utilities in that state to acquire energy efficiency
equivalent to 3 percent of sales by 2013, along with reducing peak demand 4.5 percent in the top 100
hours of load. Beginning in 2012, the Pennsylvania Public Utilities Commission (PPUC) required that
utilities begin to implement DR programs as part of their efforts to hit the 4.5 percent target. Unusually,
the PPUC specified the parameters for when DR events would be called in some detail, likely driven by
the requirement to target 100 hours. When the PPUC set about to revisit those requirements to set new
goals for the period after 2013, it took a careful path through cost-effectiveness review that provides an
example of responsive regulation and the importance of characterizing the programs’ objective in
context.
The PPUC commissioned a potential study7 which showed that the programs initiated after the 2012
requirement were not cost-effective. The study’s authors suggested that this was in part because the
programs were being pulled into low-reward implementation by the requirement to target the 100
highest load hours. They found that in most summers fewer than 30 hours were cost-effective for
demand response. They suggested that a program that targeted a more limited number of hours could
be cost-effective. The PPUC took stakeholder input (from utilities, generators, and DR providers) and
adopted a revised program that, while still prescribing the calling of DR events, better reflects the
market reality: no more than six, four-hour events each summer, called when PJM load is expected to
exceed 96 percent of the summer peak demand forecast.
6 More information is available at http://www.velco.com/our-work/innovation/vtwac2
7 Available at http://www.puc.pa.gov/pcdocs/1256728.docx
Synapse Energy Economics, Inc. Best Practices in Utility Demand Response Programs 17
This example shows both the downside of a regulatory scheme for DR program design that does not
reflect the actual cost context, and the benefits of a responsive framework that changes that design in
response to market conditions.
4.2. Potential and Planning
A utility must plan carefully, with a long planning horizon, to be able to harness the most cost-effective
resources for its customers. While a new supply contract may be signed just before power is required (if
excess is available from a nearby generator), demand-side resources require time to acquire due to the
time to ramp up programs and engage customers in operational or hardware changes in their end uses.
If a utility fails to plan appropriately, it may be forced to choose a more expensive supply option, rather
than the less expensive demand-side resource. Circumstances also change: supply prices may rise or fall,
new technologies may become available, or public policy may change. This results in the need to revisit
plans on a regular basis with the most up-to-date information.
Planning also provides a critical juncture in a utility’s operations to engage with stakeholders and
regulators. Decisions informed by integrated planning exercises can be among the most expensive and
consequential that a utility makes, and at the same time planning is among the more approachable
aspects of utility operations or regulation.
Planning for demand-side resources, whether they are passive energy efficiency measures or active
demand response, generally begins with an assessment of the resource potential. After the potential,
and the cost to acquire that potential, is known, the demand-side resource can be integrated and
compared with other supply-side options on a level playing field. Resource assessment can be
undertaken from a variety of perspectives, such as the utility ratepayer perspective or a societal
perspective. The assessment should reflect the public policy priorities and perspective set by elected
and appointed leaders, and it may include externalities (such as greenhouse gas emissions) or local
economic impacts. Such comparisons need to encompass a sufficiently lengthy time horizon: while a
supply resource may be contracted for a limited period, a demand-side resource typically delivers over
the life of the measure. In addition, programs that shape markets cannot be casually turned on or off as
prices change. For example, a facility may acquire an energy management system justified in part on the
revenues from demand response; program credibility depends on either a long-term stream of
predictable revenues or economics that reflect the risk of the investment and offer a short payback.
Long-term assessments of the costs and benefits of supply resources must also make a fair comparison.
The technical or economic potential of energy efficiency or demand response is typically much greater
than can be acquired in a short period by a new program, and not all customers will make the
economically preferred choice even once the program is mature. The achievable potential takes these
practical considerations into account. Policymakers in 26 U.S. states have set explicit policies that
utilities must acquire all available energy efficiency potential over time or have set quantified targets for
Synapse Energy Economics, Inc. Best Practices in Utility Demand Response Programs 18
demand-side resource acquisition informed by potential studies;8 demand response has not yet
generally received the same level of regulatory and policy scrutiny.
The Pacific Northwest
One region that has taken a comprehensive look at supply and demand-side resources is the Pacific
Northwest. As we will see, the electrical characteristics of the region are similar to Québec’s, and they
indicate how a very open planning process can perform in a similar energy context. The Northwest
Power and Conservation Council (NWPCC) coordinates energy and water resource planning in the
region. Its mission is “to ensure, with public participation, an affordable and reliable energy system
while enhancing fish and wildlife in the Columbia River Basin.”9 Hydropower from the Columbia River
Basin is the region’s primary electric resource, accounting for over 55 percent of the region’s electric
energy. Wind is both the region’s fastest growing resource and the source of significant integration
challenges.10 Careful management of electric loads has been a hallmark of the region’s approach
throughout the NWPCC’s seven regional power plans (now conducted approximately every five years),
as the region seeks to maximize the use of hydropower while maintaining healthy river ecosystems.
The Northwest region covered by the NWPCC has a peak load of about 30–31 GW, which occurs in
winter. This is projected to grow to 32–36 GW by 2035, with the residential and commercial sectors
accounting for the bulk in demand growth.11 The seventh Northwest Power Plan12 was completed in
2016 and concludes that demand-side resources can meet all load growth through 2030, even after
accounting for coal plant retirements. These resources are primarily energy efficiency, with demand
response identified as a key resource to handle critical water and weather conditions.
The NWPCC and the Bonneville Power Administration (BPA), which coordinates transmission and
hydroelectric generation in the Northwest, have found that the region is pushing up against the limits of
variation in hydroelectric output to accommodate the variation in load and variable renewable
generation. This is the primary driver of the need for demand response in the region. While the region is
winter peaking, the hydroelectric flexibility is more reduced in the summer, due to the seasonality of
river flows. This means the region is interested in both winter and summer DR capacity.
8 Seven of the 26 states have requirements to achieve all cost-effective energy efficiency; the remainder have
quantified targets. American Council for an Energy-Efficient Economy, State Energy Efficiency Resource Standard (EERS) Activity Policy Brief, January 9, 2017. http://aceee.org/policy-brief/state-energy-efficiency-resource-standard-activity
9 https://www.nwcouncil.org/about/mission/
10 NWPCC Seventh Northwest Power Plan, page 2-4.
11 NWPCC Seventh Northwest Power Plan, page 1-4.
12 The NWPCC’s Seventh Northwest Power Plan is available at
https://www.nwcouncil.org/energy/powerplan/7/plan/

Synapse Energy Economics, Inc. Best Practices in Utility Demand Response Programs 19
The Seventh Northwest Power Plan includes a careful analysis of demand response in the region. This
analysis began with a potential study13 which identifies the summer and winter potential of
technologies or measures in the residential, commercial, and industrial sectors. The potential study
differentiates between measures available with “base” demand response and those available with
“smart” demand response, as well as the potential for balancing (offering dynamic loads to balance
changes in renewable generation). The study looked out to 2030 and identified the potential available as
it changes over time. Through this process, the NWPCC identified more than 4,300 MW of potential, of
which 1,500 MW was available at costs of less than $25 per kW-year.14
The NWPCC uses an extensive stakeholder process to vet study inputs and shape the plan. This includes
the Pacific Northwest Demand Response Project, a collaborative effort led by the NWPCC and the
Regulatory Assistance Project that began in 2005. Its membership meets approximately annually to
review regional progress on demand response in the context of the NWPCC’s planning responsibilities.
Among other things, it reviewed the potential study and the planning methodology that the NWPCC
used for incorporation of demand response into its plan. The Seventh Northwest Power Plan
recommends a DR Advisory Committee, which has since been formed. It includes representatives of the
NWPCC, investor-owned and public utilities, state agencies, non-governmental organizations, and
vendors.15 Its scope is the following:
• “Development and implementation of Action Plan items for the Power Plan
• Defining implementation barriers and developing strategies to overcome them
• Determining near-term and long-term achievability rates
• Understanding the regulatory environment
• Quantifying demand response program costs and savings
• Development of an avoided cost methodology” 16
The NWPCC uses a stochastic modeling methodology that accounts for variation in hydroelectric
resource, weather, resource costs, and load. This allows them to plan for robust solutions that are cost-
effective in a wide range of futures, not simply a median expected load situation. In the Seventh Power
Plan, the NWPCC identifies that 600 MW of DR capability is required for least-cost capacity needs by
13 Available at https://www.nwcouncil.org/media/7148943/npcc_assessing-dr-potential-for-seventh-power-
plan_updated-report_1-19-15.pdf 14 Seventh Northwest Power Plan, page 1–10.
15 The current membership of this committee may be found at https://www.nwcouncil.org/media/7150627/drac-
members-2016-2018.pdf 16 https://www.nwcouncil.org/energy/dr/drac-home
Synapse Energy Economics, Inc. Best Practices in Utility Demand Response Programs 20
2021 in nearly all futures. It will determine in three years if the region is making “sufficient progress”
toward this goal.
The NWPCC planning process is a model in another respect as well: it builds its demand-side forecasts
from the achievable potential, rather than “bottom up” from existing programs. As a result, the load
forecast it uses in supply-side planning already reflects an aggressive energy efficiency program that
achieves all available cost-effective efficiency potential. The achievable potential considers the ramp
times for new programs and the limited pace of customer adoption (e.g. limited by the lifetime of
appliances). Exceptional utility programs can exceed the achievable potential. In fact, northwestern
utilities achieved 125 percent of the energy efficiency planned for in the previous (sixth) Northwest
Power Plan.17
Building a plan from the identified potential is essential when looking out to decadal horizons, because
the form of programs and technology available will shift over time. It is clearly a superior technique to
assuming programs will maintain the same form throughout a long period. Revisiting the potential and
goals on a regular basis, such as every five years for the NWPCC, ensures that changes can be taken into
account. While the maturity of energy efficiency analysis allows this process to take place more clearly
for energy efficiency than for demand response in the Northwest, lessons learned apply to both.
Portland General Electric
One of the utilities that would be responsible for developing the 600 MW of demand response
envisioned in the NWPCC’s Seventh Power Plan is Portland General Electric (PGE). PGE commissioned a
DR potential study in 2015.18 This update does a clear job of defining and distinguishing the achievable
potential from the technical or economic potential. To estimate what is achievable for PGE, the study
assumes PGE can achieve a level of participation that would put PGE at the 75th percentile among all
similar utility programs. PGE also has near-universal AMI, so this study comprehensively treats the
opportunity from different kinds of rate-based DR programs.
4.3. Taking Advantage of Technology
Advanced metering infrastructure
AMI is a foundational component of DR programs based on time-varying rates. Time-varying rates
provide a price signal to customers to encourage reductions in consumption during peak hours. AMI
collects and records customer consumption on an hourly or sub-hourly basis, enabling utilities to
implement sophisticated rate structures that better reflect the costs of energy production and delivery.
17 Seventh Northwest Power Plan, page 2–15.
18 Hledik, R., A. Faruqui, and L. Bressan. 2016. "Demand Response Market Research: Portland General Electric,
2016 to 2035” Preparted by Brattle Group. Available at: https://www.portlandgeneral.com/-/media/public/our-company/energy-strategy/documents/2016-02-01-demand-response-market-research.pdf?la=en.
Synapse Energy Economics, Inc. Best Practices in Utility Demand Response Programs 21
AMI also supports additional technologies, such as web-based portals that allow customers to view their
hourly energy usage, compare their usage to their neighbors, evaluate other energy rates, and receive
information about ways to better manage their electricity consumption. These capabilities are described
below.
Time-varying rates
An important lesson from other programs is that customers tend to want to retain control of their
electricity use. Ensuring that control has proven to be a key component in encouraging expanded
customer participation in DR programs. Time-varying rates allow customers to determine how they
would like to respond, based on a price signal from the utility. The most common forms of time-varying
rates are described below, along with a stylized depiction of how each rate could be implemented.
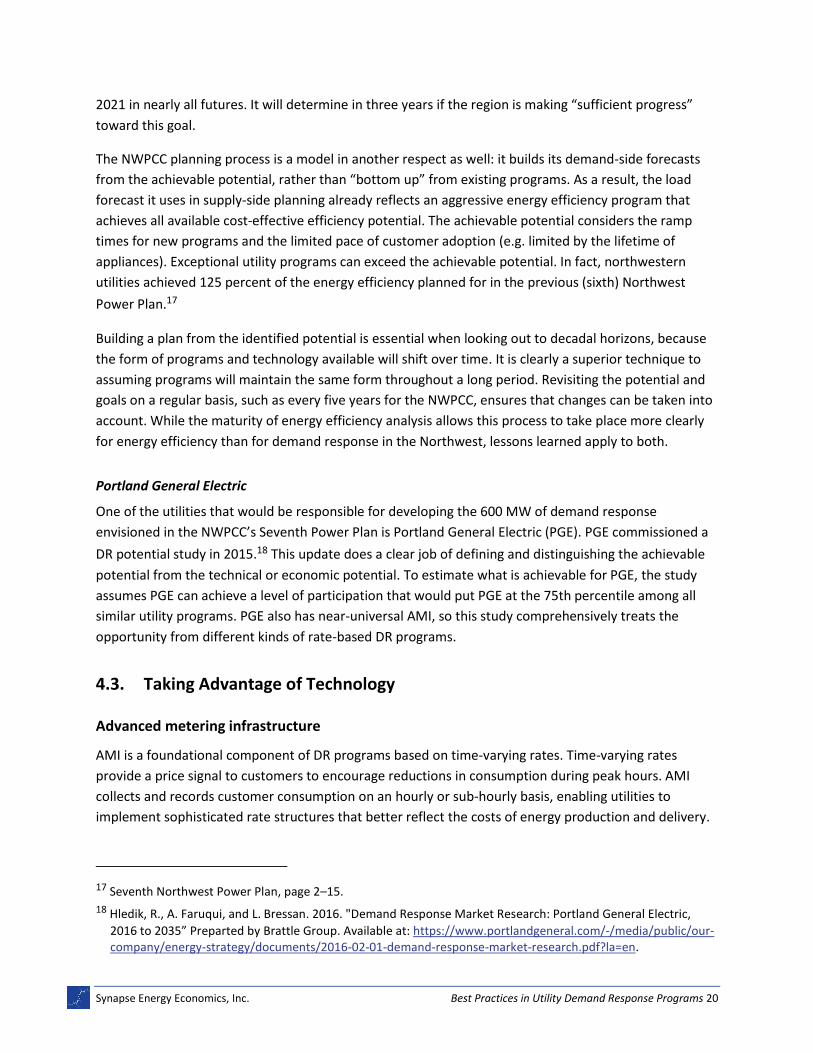
• Time-of-Use (TOU) Rates: TOU rates consist of two or more pricing tiers, based on pre-set time periods. Electricity is priced higher during hours when the peak is more likely to occur, and lower during hours that are generally off-peak. An advantage of this type of rate structure is that it has low financial risks to customers, because the pricing is known ahead of time and customers choose whether to curtail their electricity use.
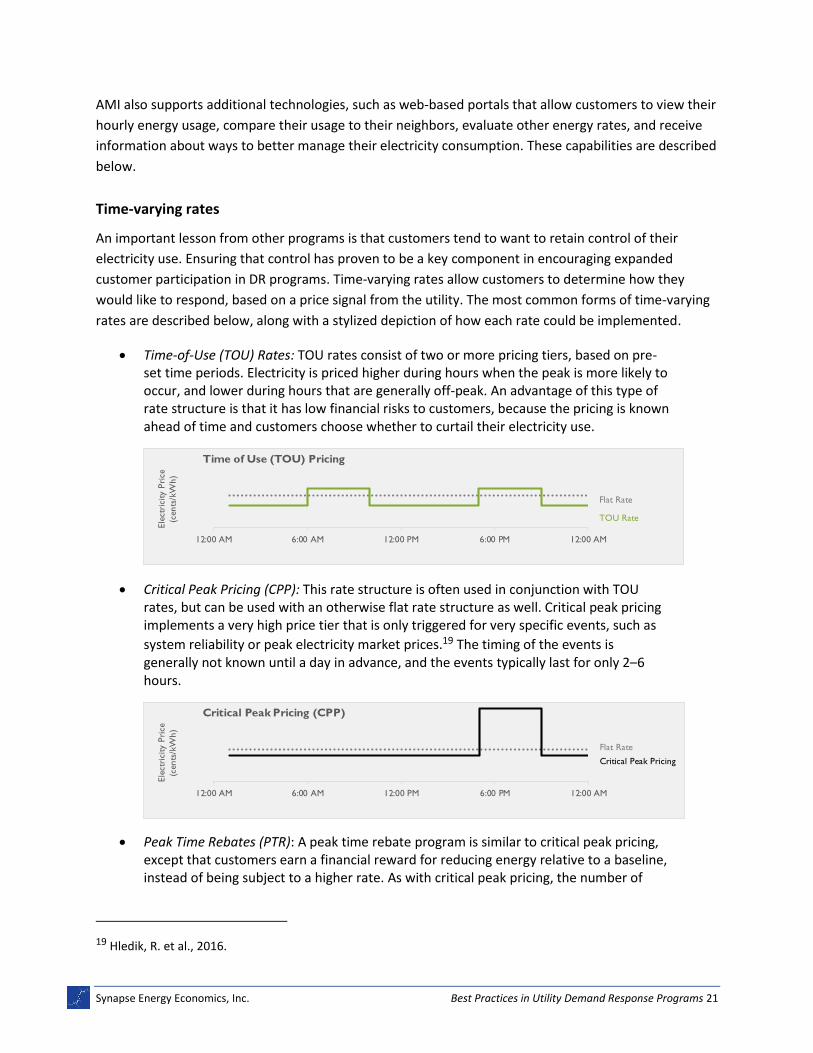
• Critical Peak Pricing (CPP): This rate structure is often used in conjunction with TOU rates, but can be used with an otherwise flat rate structure as well. Critical peak pricing implements a very high price tier that is only triggered for very specific events, such as
system reliability or peak electricity market prices.19 The timing of the events is generally not known until a day in advance, and the events typically last for only 2–6 hours.
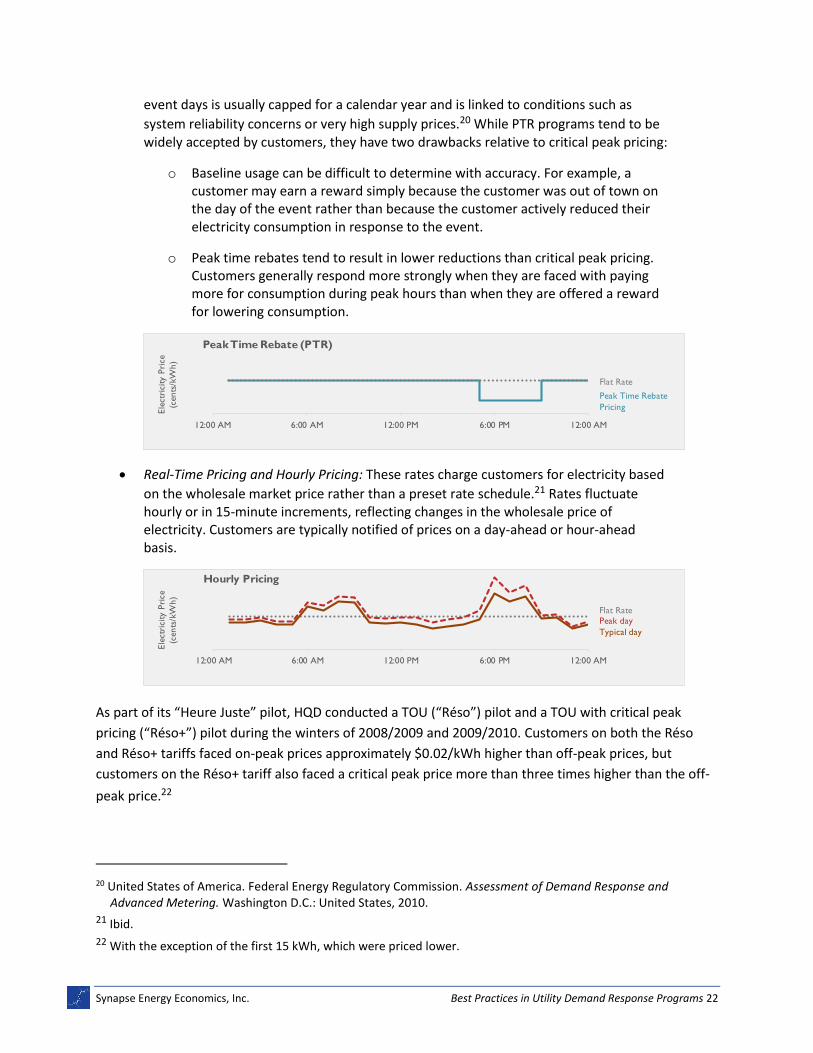
• Peak Time Rebates (PTR): A peak time rebate program is similar to critical peak pricing, except that customers earn a financial reward for reducing energy relative to a baseline, instead of being subject to a higher rate. As with critical peak pricing, the number of
19 Hledik, R. et al., 2016.
12:00 AM 6:00 AM 12:00 PM 6:00 PM 12:00 AM
Ele
ctr
icity P
rice
(cents
/kW
h)
Time of Use (TOU) Pricing
TOU Rate
Flat Rate
12:00 AM 6:00 AM 12:00 PM 6:00 PM 12:00 AM
Ele
ctr
icity P
rice
(cents
/kW
h)
Critical Peak Pricing (CPP)
Flat Rate
Critical Peak Pricing
Synapse Energy Economics, Inc. Best Practices in Utility Demand Response Programs 22
event days is usually capped for a calendar year and is linked to conditions such as
system reliability concerns or very high supply prices.20 While PTR programs tend to be widely accepted by customers, they have two drawbacks relative to critical peak pricing:
o Baseline usage can be difficult to determine with accuracy. For example, a customer may earn a reward simply because the customer was out of town on the day of the event rather than because the customer actively reduced their electricity consumption in response to the event.
o Peak time rebates tend to result in lower reductions than critical peak pricing. Customers generally respond more strongly when they are faced with paying more for consumption during peak hours than when they are offered a reward for lowering consumption.
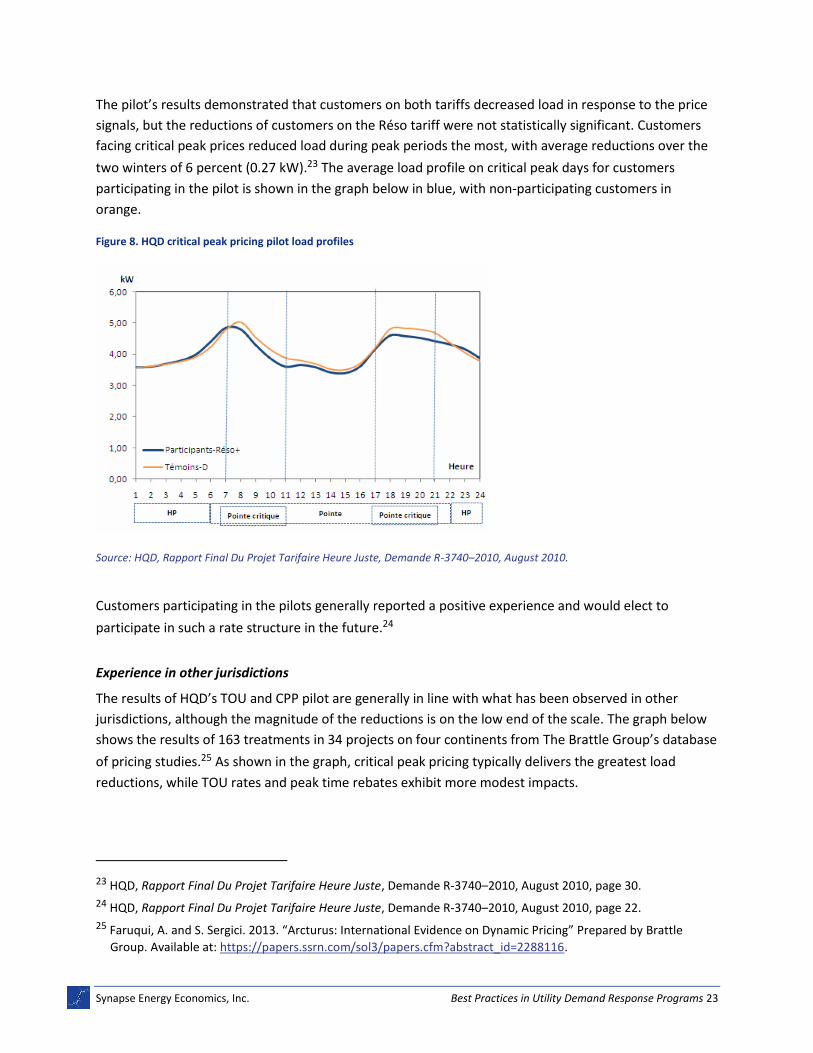
• Real-Time Pricing and Hourly Pricing: These rates charge customers for electricity based
on the wholesale market price rather than a preset rate schedule.21 Rates fluctuate hourly or in 15-minute increments, reflecting changes in the wholesale price of electricity. Customers are typically notified of prices on a day-ahead or hour-ahead basis.
As part of its “Heure Juste” pilot, HQD conducted a TOU (“Réso”) pilot and a TOU with critical peak
pricing (“Réso+”) pilot during the winters of 2008/2009 and 2009/2010. Customers on both the Réso
and Réso+ tariffs faced on-peak prices approximately $0.02/kWh higher than off-peak prices, but
customers on the Réso+ tariff also faced a critical peak price more than three times higher than the off-
peak price.22
20 United States of America. Federal Energy Regulatory Commission. Assessment of Demand Response and Advanced Metering. Washington D.C.: United States, 2010.
21 Ibid.
22 With the exception of the first 15 kWh, which were priced lower.
12:00 AM 6:00 AM 12:00 PM 6:00 PM 12:00 AM
Ele
ctr
icity P
rice
(cents
/kW
h)
Peak Time Rebate (PTR)
Flat Rate
Peak Time Rebate
Pricing
12:00 AM 6:00 AM 12:00 PM 6:00 PM 12:00 AM
Ele
ctri
city
Pri
ce
(cents
/kW
h)
Hourly Pricing
Flat Rate
Peak day
Typical day
Synapse Energy Economics, Inc. Best Practices in Utility Demand Response Programs 23
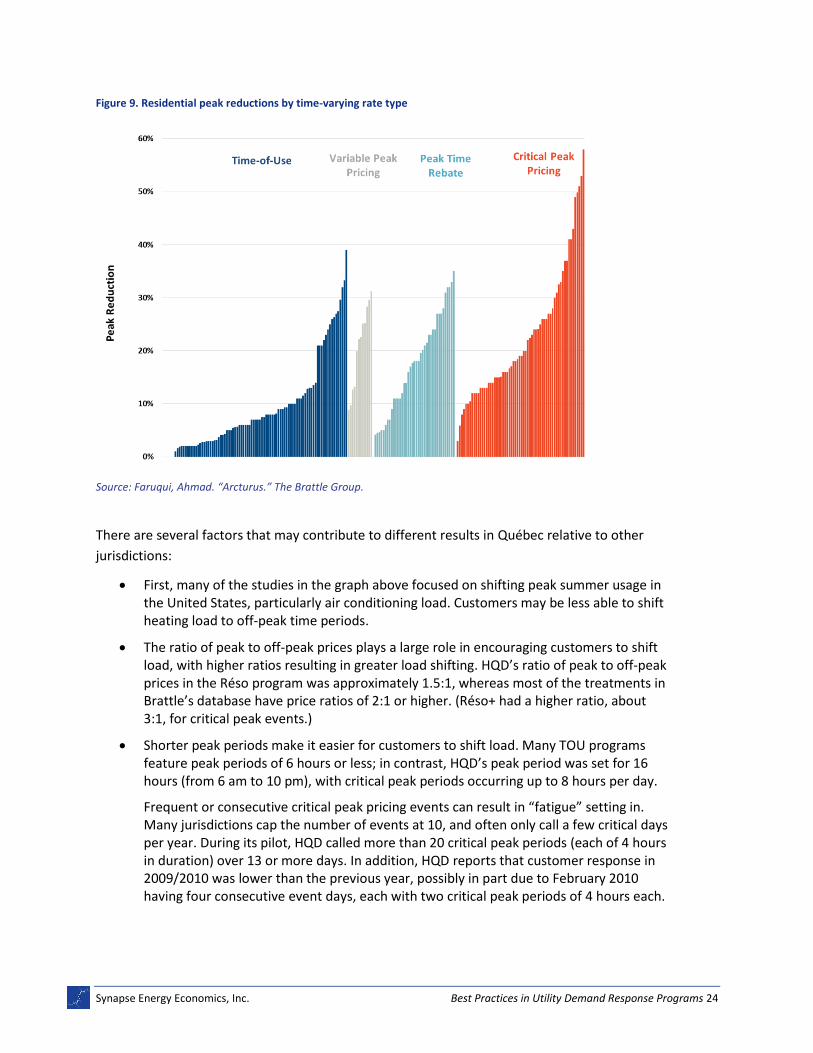
The pilot’s results demonstrated that customers on both tariffs decreased load in response to the price
signals, but the reductions of customers on the Réso tariff were not statistically significant. Customers
facing critical peak prices reduced load during peak periods the most, with average reductions over the
two winters of 6 percent (0.27 kW).23 The average load profile on critical peak days for customers
participating in the pilot is shown in the graph below in blue, with non-participating customers in
orange.
Figure 8. HQD critical peak pricing pilot load profiles
Source: HQD, Rapport Final Du Projet Tarifaire Heure Juste, Demande R-3740–2010, August 2010.
Customers participating in the pilots generally reported a positive experience and would elect to
participate in such a rate structure in the future.24
Experience in other jurisdictions
The results of HQD’s TOU and CPP pilot are generally in line with what has been observed in other
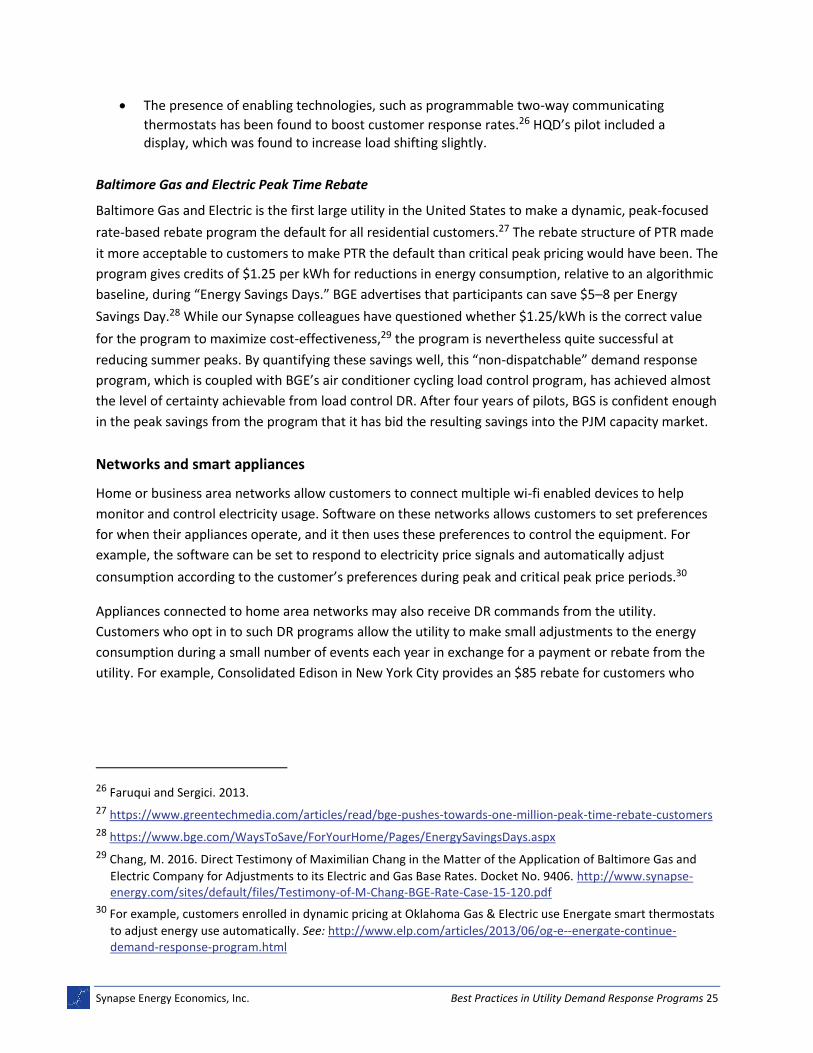
jurisdictions, although the magnitude of the reductions is on the low end of the scale. The graph below
shows the results of 163 treatments in 34 projects on four continents from The Brattle Group’s database
of pricing studies.25 As shown in the graph, critical peak pricing typically delivers the greatest load
reductions, while TOU rates and peak time rebates exhibit more modest impacts.
23 HQD, Rapport Final Du Projet Tarifaire Heure Juste, Demande R-3740–2010, August 2010, page 30.
24 HQD, Rapport Final Du Projet Tarifaire Heure Juste, Demande R-3740–2010, August 2010, page 22.
25 Faruqui, A. and S. Sergici. 2013. “Arcturus: International Evidence on Dynamic Pricing” Prepared by Brattle
Group. Available at: https://papers.ssrn.com/sol3/papers.cfm?abstract_id=2288116.
Synapse Energy Economics, Inc. Best Practices in Utility Demand Response Programs 24
Figure 9. Residential peak reductions by time-varying rate type
Source: Faruqui, Ahmad. “Arcturus.” The Brattle Group.
There are several factors that may contribute to different results in Québec relative to other
jurisdictions:
• First, many of the studies in the graph above focused on shifting peak summer usage in the United States, particularly air conditioning load. Customers may be less able to shift heating load to off-peak time periods.
• The ratio of peak to off-peak prices plays a large role in encouraging customers to shift load, with higher ratios resulting in greater load shifting. HQD’s ratio of peak to off-peak prices in the Réso program was approximately 1.5:1, whereas most of the treatments in Brattle’s database have price ratios of 2:1 or higher. (Réso+ had a higher ratio, about 3:1, for critical peak events.)
• Shorter peak periods make it easier for customers to shift load. Many TOU programs feature peak periods of 6 hours or less; in contrast, HQD’s peak period was set for 16 hours (from 6 am to 10 pm), with critical peak periods occurring up to 8 hours per day.
Frequent or consecutive critical peak pricing events can result in “fatigue” setting in. Many jurisdictions cap the number of events at 10, and often only call a few critical days per year. During its pilot, HQD called more than 20 critical peak periods (each of 4 hours in duration) over 13 or more days. In addition, HQD reports that customer response in 2009/2010 was lower than the previous year, possibly in part due to February 2010 having four consecutive event days, each with two critical peak periods of 4 hours each.
Synapse Energy Economics, Inc. Best Practices in Utility Demand Response Programs 25
• The presence of enabling technologies, such as programmable two-way communicating
thermostats has been found to boost customer response rates.26 HQD’s pilot included a display, which was found to increase load shifting slightly.
Baltimore Gas and Electric Peak Time Rebate
Baltimore Gas and Electric is the first large utility in the United States to make a dynamic, peak-focused
rate-based rebate program the default for all residential customers.27 The rebate structure of PTR made
it more acceptable to customers to make PTR the default than critical peak pricing would have been. The
program gives credits of $1.25 per kWh for reductions in energy consumption, relative to an algorithmic
baseline, during “Energy Savings Days.” BGE advertises that participants can save $5–8 per Energy
Savings Day.28 While our Synapse colleagues have questioned whether $1.25/kWh is the correct value
for the program to maximize cost-effectiveness,29 the program is nevertheless quite successful at
reducing summer peaks. By quantifying these savings well, this “non-dispatchable” demand response
program, which is coupled with BGE’s air conditioner cycling load control program, has achieved almost
the level of certainty achievable from load control DR. After four years of pilots, BGS is confident enough
in the peak savings from the program that it has bid the resulting savings into the PJM capacity market.
Networks and smart appliances
Home or business area networks allow customers to connect multiple wi-fi enabled devices to help
monitor and control electricity usage. Software on these networks allows customers to set preferences
for when their appliances operate, and it then uses these preferences to control the equipment. For
example, the software can be set to respond to electricity price signals and automatically adjust
consumption according to the customer’s preferences during peak and critical peak price periods.30
Appliances connected to home area networks may also receive DR commands from the utility.
Customers who opt in to such DR programs allow the utility to make small adjustments to the energy
consumption during a small number of events each year in exchange for a payment or rebate from the
utility. For example, Consolidated Edison in New York City provides an $85 rebate for customers who
26 Faruqui and Sergici. 2013.
27 https://www.greentechmedia.com/articles/read/bge-pushes-towards-one-million-peak-time-rebate-customers
28 https://www.bge.com/WaysToSave/ForYourHome/Pages/EnergySavingsDays.aspx
29 Chang, M. 2016. Direct Testimony of Maximilian Chang in the Matter of the Application of Baltimore Gas and
Electric Company for Adjustments to its Electric and Gas Base Rates. Docket No. 9406. http://www.synapse-energy.com/sites/default/files/Testimony-of-M-Chang-BGE-Rate-Case-15-120.pdf
30 For example, customers enrolled in dynamic pricing at Oklahoma Gas & Electric use Energate smart thermostats
to adjust energy use automatically. See: http://www.elp.com/articles/2013/06/og-e--energate-continue-demand-response-program.html
Synapse Energy Economics, Inc. Best Practices in Utility Demand Response Programs 26
enroll in their two-year DR program that allows the utility to adjust their thermostat a maximum of 10
times each year.31
Standards
Standardization can lower barriers and reduce costs in DR program design and participation. There are
two emerging standards of particular note: USNAP and OpenADR.
Universal Smart Network Access Port
Universal Smart Network Access Port (USNAP or CTA-2045) is an emerging standard published by the
Consumer Technology Association in 2013 for a “modular communication interface for energy
management.” In effect, this is a standardized hardware plug and associated standards for
communication across that plug, akin to USB or VGA. It would be built into appliances such as water
heaters, thermostats, or air conditioners. A utility can then provide a communication module that plugs
into the appliance’s port and receives communications from the utility telling it when to change its
behavior; the module may also send messages back to the utility. The use of a standardized port will
allow appliance manufacturers to develop products that are DR-ready and able to be used in multiple
utility territories. It will also allow utilities to enable those appliances to participate in DR programs with
the addition of a single standardized device, rather than developing custom means of interfacing with
each appliance type. The standard port allows the utility to provide interfaces that communicate via
their choice of radio frequency, Wi-Fi, power-line carrier, or Zigbee. Standardization should also allow
lower costs for all parties.
The Electric Power Research Institute (EPRI) ran a field demonstration of the USNAP standard (then
called CEA-2045) in 2014–15 along with 21 utility and program partners.32 One of them, PGE of Oregon,
has been a leading utility for the deployment of USNAP-enabled hot water heaters for demand
response. In late 2015 and early 2016, PGE tested 14 smart water heaters with its employees, calling DR
events throughout the winter peaking season.33 PGE has since designed a program, launching this year,
to deploy an increasing number of enabled water heaters (eventually more than 5,000) over the next
several years in the multi-family residential market.34 AO Smith, one of the world’s largest water heater
manufacturers, produces a line of water heaters with USNAP capability built in.35
31 Consolidated Edison, “Register Your Smart Thermostat and Get Up to $110,” ConEdison, 2017,
https://www.coned.com/en/save-money/rebates-incentives-tax-credits/rebates-incentives-tax-credits-for-residential-customers/bring-your-thermostat-and-get-$85.
32 http://smartgrid.epri.com/doc/ICT%20Informational%20Webcast%20CEA-2045%2009APR2015.pdf
33 http://aceee.org/sites/default/files/files/pdf/conferences/hwf/2016/Keeling_Session7C_HWF16_2.23.16.pdf
34 http://aceee.org/sites/default/files/pdf/conferences/hwf/2017/Naleway_Session3A_HWF17_2.27.17.pdf
35 https://www.hotwater.com/lit/spec/res_elec/aosre50600.pdf
Synapse Energy Economics, Inc. Best Practices in Utility Demand Response Programs 27
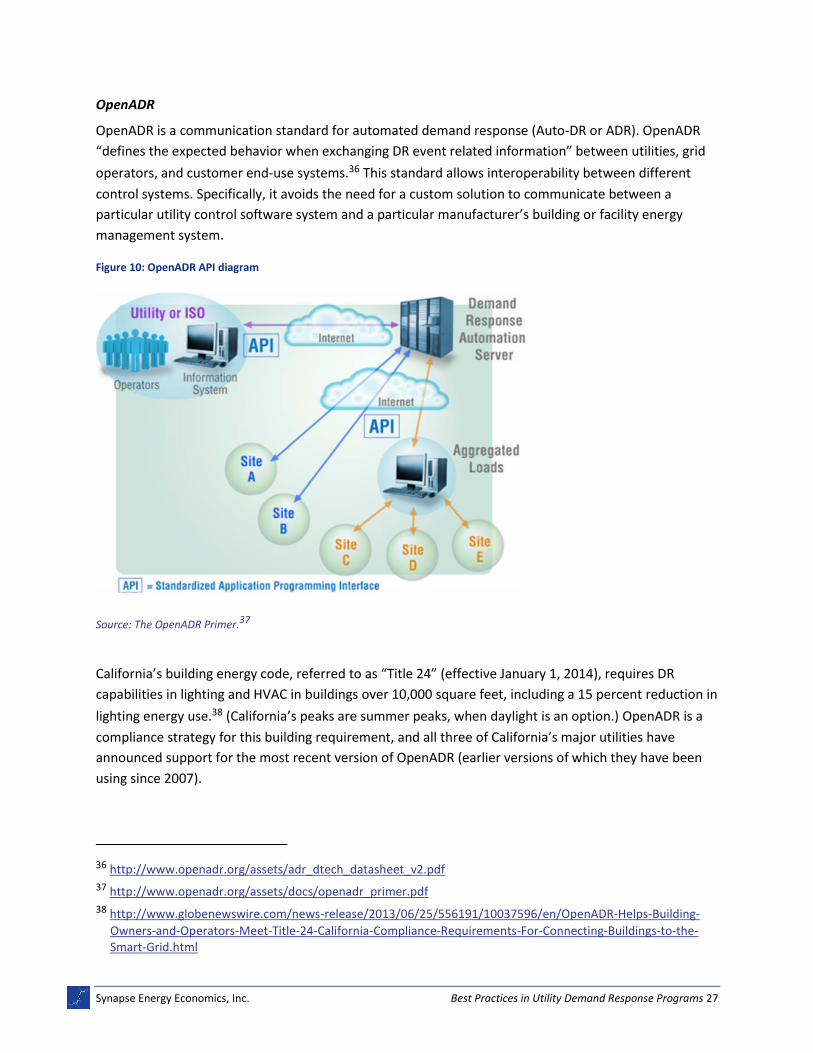
OpenADR
OpenADR is a communication standard for automated demand response (Auto-DR or ADR). OpenADR
“defines the expected behavior when exchanging DR event related information” between utilities, grid
operators, and customer end-use systems.36 This standard allows interoperability between different
control systems. Specifically, it avoids the need for a custom solution to communicate between a
particular utility control software system and a particular manufacturer’s building or facility energy
management system.
Figure 10: OpenADR API diagram
Source: The OpenADR Primer.37
California’s building energy code, referred to as “Title 24” (effective January 1, 2014), requires DR
capabilities in lighting and HVAC in buildings over 10,000 square feet, including a 15 percent reduction in
lighting energy use.38 (California’s peaks are summer peaks, when daylight is an option.) OpenADR is a
compliance strategy for this building requirement, and all three of California’s major utilities have
announced support for the most recent version of OpenADR (earlier versions of which they have been
using since 2007).
36 http://www.openadr.org/assets/adr_dtech_datasheet_v2.pdf
37 http://www.openadr.org/assets/docs/openadr_primer.pdf
38 http://www.globenewswire.com/news-release/2013/06/25/556191/10037596/en/OpenADR-Helps-Building-
Owners-and-Operators-Meet-Title-24-California-Compliance-Requirements-For-Connecting-Buildings-to-the-Smart-Grid.html
Synapse Energy Economics, Inc. Best Practices in Utility Demand Response Programs 28
4.4. Measure and Customer Diversity
Utility DR programs rely on a wide range of resources, depending on the resources available within the
customer base of the utility and the timing and character of the utility’s needs. This section discusses the
different kinds of measures seen most commonly in utility DR programs. It also identifies some
programs or approaches that have been particularly successful. It concludes with a discussion of up and
coming opportunities in distributed storage and EVs.
Heating, ventilation, and air conditioning (HVAC)
Direct load control programs been used for decades and have often focused on HVAC systems. These
programs involve the installation of control technologies on a customer’s appliance. They allow the
utility to cycle the appliance during peak hours in exchange for a financial incentive to the customer.
While these programs have often focused on air conditioners, there has also been some attention given
to space heat. For example, PGE’s 2016 DR potential study found that direct load control would likely be
cost-effective for residential and small commercial customers when customers have both electric heat
and air conditioning.39
One emerging area of interest for cost-effective residential HVAC DR programs is a “bring your own
thermostat” (BYOT) option. Customer interest in smart thermostats, driven by desire to remotely
control heating and cooling systems by smart phone, has resulted in deployment of these thermostats
outside of utility programs. They are also deployed by utility programs as energy efficiency measures,
without explicit expectation of DR program participation. Once the thermostat is installed, however,
costs to enable DR capabilities in the household are substantially lower.
Water heating
Electric water heaters are essentially thermal batteries. While the use of hot water results in electric
consumption, those two events do not need to be simultaneous, resulting in a highly capable DR
resource. Customers’ general lack of engagement with hot water heating is a strength in this regard: if a
utility can assure customers that their quality of hot water service will not be impaired, customers have
shown a willingness to turn over control to the utility. Water heater control has been deployed at scale
in the United States. For example, the four utilities of Duke Energy, which serve customers in six states,
control two million water heaters.40
Utility use of hot water heaters spans a wide range with respect to the dynamism of the engagement
with each water heater. At one end of the spectrum are scheduled water heater controls: water heaters
39 Ryan Hledik, Ahmad Faruqui, and Lucas Bressan, “Demand Response Market Research: Portland General
Electric, 2016 to 2035” (Brattle Group, January 2016), https://www.portlandgeneral.com/-/media/public/our-company/energy-strategy/documents/2016-02-01-demand-response-market-research.pdf?la=en.
40https://www.bpa.gov/EE/NewsEvents/presentations/Documents/DER%20Utility%20Brown%20Bag%202016102
0%20final.pdf, slide 12

Synapse Energy Economics, Inc. Best Practices in Utility Demand Response Programs 29
are simply turned off for a number of hours each weekday on a set schedule (typically 4 or 8 hours at
each window; large thermal storage water heaters may be allowed to charge only during an 8-hour
overnight period). These times may correspond to morning and evening peaks in the winter, and to an
afternoon peak in the summer. This almost does not qualify as demand response, because it is a change
in the baseline behavior of the appliance. Utilities may divide the water heaters into groups that turn
back on at separate times to ease recovery peaks. Scheduled recovery also allows the utility to plan for
these changes in load with supply ramps.
At the next level of dynamism are one-way communications that trigger water heater shutoffs; these
may be communicated via radio frequency or power line carrier communication methods. Utilities may
address all water heaters as a block, or address them individually. Individual treatment allows customers
to ask for their unit to be turned back on for a “comfort bump” and the utility to re-engage the heaters
in waves, avoiding a demand spike at the end of the DR event.
Two-way communications are a relative new entry into this space. They allow the utility to provide both
higher quality service (by ensuring that the water is fully hot before the beginning of a DR event) and
more effectively use the heater for ancillary services.41 In the PJM region, for example, water heaters
provide 69 percent of the 65 MW of demand response participating in wholesale frequency regulation
service and 9 percent of the 514 MW of synchronous reserve provided by demand response.42
In our research and conversations with industry experts, we have not encountered any concern
regarding legionella or other public health concerns associated with the use of water heaters as a grid
resource.
Great River Energy
Great River Energy (GRE) is a Minnesota generation and transmission cooperative, providing service to
28 member distribution cooperatives. Its members serve about 665,000 customers (1.7 million people).
GRE operates five residential load management programs: cycled air conditioning, interruptible water
heating, electric thermal storage (ETS) water heater, ETS space heating, and dual-fuel heating.43 Over
200,000 customers participate in one of these programs, including over 100,000 in one of the water
heater programs.44 This means that about 15 percent of GRE’s members’ customers participate in a
41 One-way communication can facilitate ancillary services as well, but it is more complex due to the uncertainty
regarding the state of the water heater. 42 https://pjm.com/~/media/markets-ops/dsr/2017-demand-response-activity-report.ashx, page 9-10
43 GRE also has programs for residential and commercial EVs, interruptible irrigation, and interruptible commercial
and industrial with and without customer-sited backup generation. See http://greatriverenergy.com/we-use-energy-wisely/great-river-energy-load-management-programs/.
44 67,000 customers participate in the thermal storage water heater program, in which electricity is only supplied
to the water heater between 11pm and 7am each day. These customers have large (80–120 gallon) tanks that last them all day. GRE considers this to be the equivalent of a 1 GWh battery. About 40,000 customers with smaller tanks participate in a peak shaving water heater program in which heaters are shut off for 5 to 7 hours.
Synapse Energy Economics, Inc. Best Practices in Utility Demand Response Programs 30
water heater program. GRE primarily controls these water heaters to shift loads from high-cost periods
to low-cost periods in the wholesale markets. They are also available to respond to system emergencies
and provide capacity to meet resource adequacy requirements.45 The predictable nature of the water
heaters allows GRE to plan for the load increase that comes at the end of a DR event and when the
thermal storage systems start to recharge each night.
GRE has been able to get high participation rates through consistent program availability over nearly
four decades, with customer engagement focused on water heater replacement and new construction.
About 70 percent of the new housing in Minnesota has been in their service territory, and about a third
of those new homes have signed up for a controlled water heater program.46
GRE partnered with the National Rural Electric Cooperative Association, Natural Resources Defense
Council, and Peak Load Management Alliance to commission a report from the Brattle Group, “The
Hidden Battery: Opportunities in Electric Water Heating”47 which indicates that “community storage” in
the form of water heaters has the potential to be a significant grid resource for peak shaving, load
shifting with thermal storage, and fast response. The report recommends that programs be tied to the
needs of the utility and market in which it operates. For example, where fast response is not necessary
or aggregated demand resources are not allowed to contribute, the infrastructure cost for two-way
communication is unlikely to be cost-effective. GRE is requiring its members to use two-way
communication based on their AMI networks within the next eight years, allowing time for their
member distribution utilities to transition.
Bonneville Power Administration two-way communication pilots
Bonneville Power Administration (BPA) and PGE are testing 600 controlled water heaters with two-way
communication using the CTA-2045 communication protocol. The objectives of the pilot are to
demonstrate a 24/7 control regime to shape load and account for wind forecast error, and to determine
the appropriate on-peak kW reduction that can be obtained with these appliances.48 PGE plans to build
on this technology pilot with a market pilot in 2017–19, eventually reaching over 5,000 units deployed.49
Interruptible loads
Large industrial users are often capable of supplying large amounts of demand response. Historically,
this has taken the form of load reductions during emergency conditions. More recently, it has evolved to
include the provision of ancillary services (such as balancing and frequency regulation), which facilitates
45 http://greatriverenergy.com/wp-content/uploads/2015/10/when_why_control.pdf
46 Gary Connett, Great River Energy, personal communication, March 23, 2017.
47 http://www.electric.coop/wp-content/uploads/2016/07/The-Hidden-Battery-01-25-2016.pdf
48 https://www.bpa.gov/Doing%20Business/TechnologyInnovation/TIPProjectBriefs/2017-DR-TIP-336.pdf
49 http://aceee.org/sites/default/files/pdf/conferences/hwf/2017/Naleway_Session3A_HWF17_2.27.17.pdf
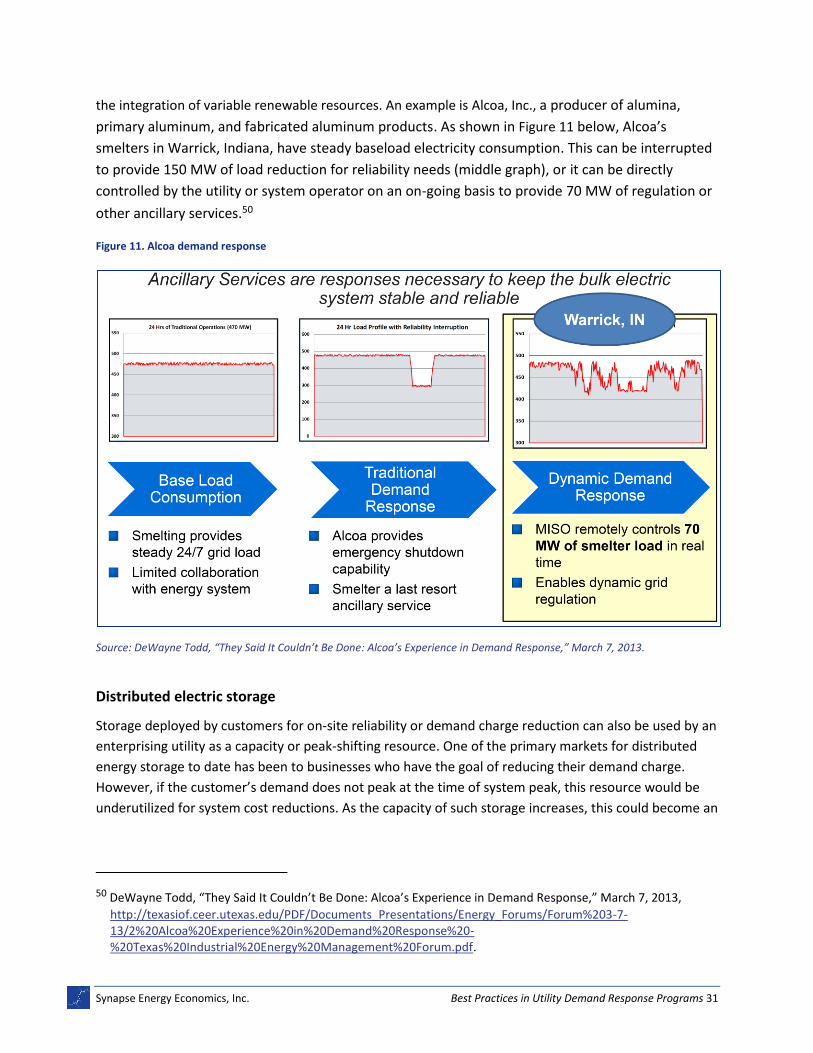
Synapse Energy Economics, Inc. Best Practices in Utility Demand Response Programs 31
the integration of variable renewable resources. An example is Alcoa, Inc., a producer of alumina,
primary aluminum, and fabricated aluminum products. As shown in Figure 11 below, Alcoa’s
smelters in Warrick, Indiana, have steady baseload electricity consumption. This can be interrupted
to provide 150 MW of load reduction for reliability needs (middle graph), or it can be directly
controlled by the utility or system operator on an on-going basis to provide 70 MW of regulation or
other ancillary services.50
Figure 11. Alcoa demand response
Source: DeWayne Todd, “They Said It Couldn’t Be Done: Alcoa’s Experience in Demand Response,” March 7, 2013.
Distributed electric storage
Storage deployed by customers for on-site reliability or demand charge reduction can also be used by an
enterprising utility as a capacity or peak-shifting resource. One of the primary markets for distributed
energy storage to date has been to businesses who have the goal of reducing their demand charge.
However, if the customer’s demand does not peak at the time of system peak, this resource would be
underutilized for system cost reductions. As the capacity of such storage increases, this could become an
50 DeWayne Todd, “They Said It Couldn’t Be Done: Alcoa’s Experience in Demand Response,” March 7, 2013,
http://texasiof.ceer.utexas.edu/PDF/Documents_Presentations/Energy_Forums/Forum%203-7-13/2%20Alcoa%20Experience%20in%20Demand%20Response%20-%20Texas%20Industrial%20Energy%20Management%20Forum.pdf.
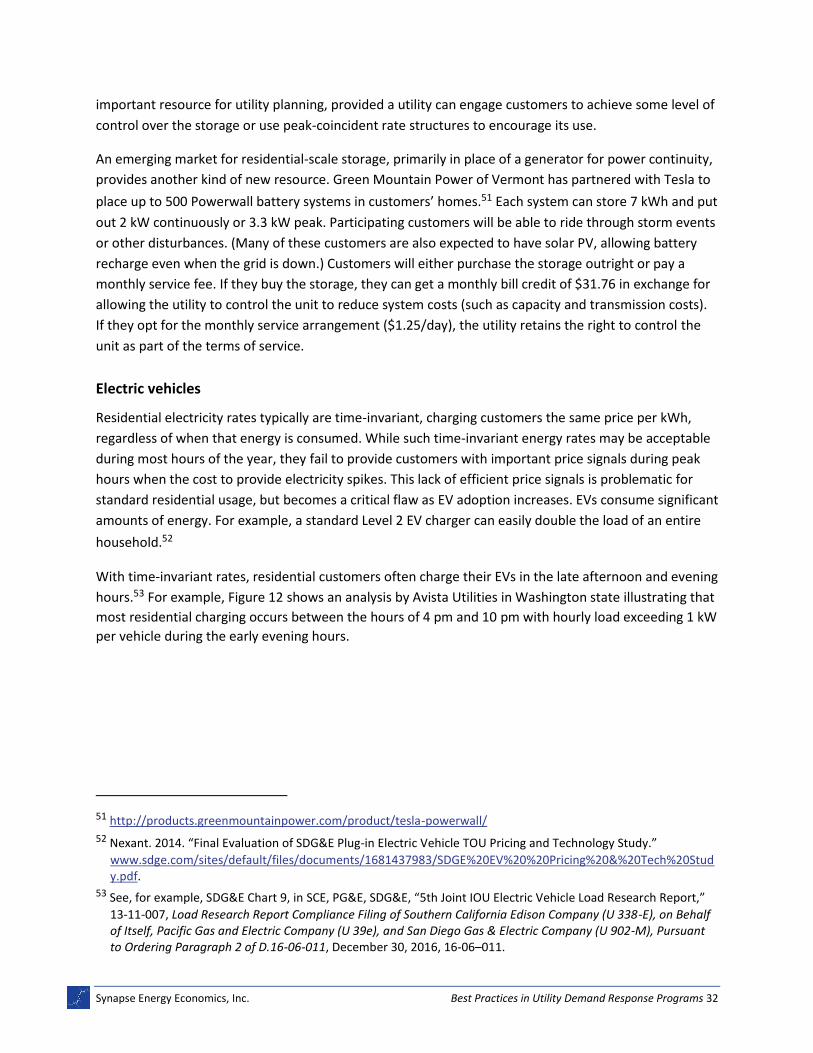
Synapse Energy Economics, Inc. Best Practices in Utility Demand Response Programs 32
important resource for utility planning, provided a utility can engage customers to achieve some level of
control over the storage or use peak-coincident rate structures to encourage its use.
An emerging market for residential-scale storage, primarily in place of a generator for power continuity,
provides another kind of new resource. Green Mountain Power of Vermont has partnered with Tesla to
place up to 500 Powerwall battery systems in customers’ homes.51 Each system can store 7 kWh and put
out 2 kW continuously or 3.3 kW peak. Participating customers will be able to ride through storm events
or other disturbances. (Many of these customers are also expected to have solar PV, allowing battery
recharge even when the grid is down.) Customers will either purchase the storage outright or pay a
monthly service fee. If they buy the storage, they can get a monthly bill credit of $31.76 in exchange for
allowing the utility to control the unit to reduce system costs (such as capacity and transmission costs).
If they opt for the monthly service arrangement ($1.25/day), the utility retains the right to control the
unit as part of the terms of service.
Electric vehicles
Residential electricity rates typically are time-invariant, charging customers the same price per kWh,
regardless of when that energy is consumed. While such time-invariant energy rates may be acceptable
during most hours of the year, they fail to provide customers with important price signals during peak
hours when the cost to provide electricity spikes. This lack of efficient price signals is problematic for
standard residential usage, but becomes a critical flaw as EV adoption increases. EVs consume significant
amounts of energy. For example, a standard Level 2 EV charger can easily double the load of an entire
household.52
With time-invariant rates, residential customers often charge their EVs in the late afternoon and evening
hours.53 For example, Figure 12 shows an analysis by Avista Utilities in Washington state illustrating that
most residential charging occurs between the hours of 4 pm and 10 pm with hourly load exceeding 1 kW
per vehicle during the early evening hours.
51 http://products.greenmountainpower.com/product/tesla-powerwall/
52 Nexant. 2014. “Final Evaluation of SDG&E Plug-in Electric Vehicle TOU Pricing and Technology Study.”
www.sdge.com/sites/default/files/documents/1681437983/SDGE%20EV%20%20Pricing%20&%20Tech%20Study.pdf.
53 See, for example, SDG&E Chart 9, in SCE, PG&E, SDG&E, “5th Joint IOU Electric Vehicle Load Research Report,”
13-11-007, Load Research Report Compliance Filing of Southern California Edison Company (U 338-E), on Behalf of Itself, Pacific Gas and Electric Company (U 39e), and San Diego Gas & Electric Company (U 902-M), Pursuant to Ordering Paragraph 2 of D.16-06-011, December 30, 2016, 16-06–011.
Synapse Energy Economics, Inc. Best Practices in Utility Demand Response Programs 33
Figure 12: Avista average residential charging profile
Source: Avista Corp., Avista Utilities Quarterly Report on Electric Vehicle Supply Equipment Pilot Program, Docket No. UE-160082, February 1, 2017, p. 11.
Such charging profiles would likely exacerbate peak demand on HQD’s system, potentially to an even
greater extent than anticipated in HQD’s filing, which assumes only 0.6 kW per EV. Utilities in many
jurisdictions have implemented a variety of DR programs to cope with this challenge and incentivize
customers to change their charging habits. These programs range from time-varying rates for EV owners
to utility direct control of EV charging. They are typically implemented for residential or workplace
installations where vehicles are parked for many hours, rather than public installations where EVs are
only parked for a few hours.
Time-varying rates
Time-of-use (TOU) rates are one of the most common forms of time-varying rates implemented for EV
customers,54 and researchers have repeatedly found these rates to be effective at reducing costs and
emissions. A pilot study in San Diego concluded that TOU rates are very effective at encouraging
customers to charge during low-cost times—the rate of overnight charging reached 90 percent for
customers facing high ratios of off-peak to peak prices.55 This shift in electricity usage is estimated to
54 In the United States, at least 17 large investor-owned utilities that have implemented time-of-use rates for EV
customers. 55 Nexant, 2014.
Synapse Energy Economics, Inc. Best Practices in Utility Demand Response Programs 34
result in significant savings if applied across the states, potentially saving California $1.2 billion between
2015 and 2030.56
Interruptible load
Since 2015, PG&E in California has implemented a demand response EV pilot program with BMW. The
pilot requires BMW to provide a minimum of 100 kW of capacity at any given time in the form of day-
ahead or real-time energy services. Between July 2015 and June 2016, BMW reliably provided demand
response in 134 DR events, meeting performance requirements for 94 percent of the events called.
Customers participating in the pilot have reported high levels of satisfaction, with 92 percent indicating
they are satisfied with the program.57
Similarly, Avista plans to implement a pilot that curtails charging during peak demand hours, while also
ensuring that the EV is fully charged by the time the customer needs to use the vehicle.58 Avista will
make use of customer notifications and provide the right to opt out of any event.
Vehicle to grid (V2G)
EVs are effectively storage devices. When EVs draw electricity from the grid, that electricity is not
immediately used to propel the vehicle. Instead, the electricity is stored in the vehicle’s battery for later
use. When the vehicle is not being used by the customer, it could be tapped directly by the utility or
system operator to either inject electricity into the grid when needed, or draw electricity from the grid
when there is overgeneration. Such vehicle to grid (V2G) integration has been tested in several locations
in the United States, and it is now fully operational in Denmark.59
4.5. Customer Engagement and Communication
Traditional utility practice, focusing on static rate designs and supply-side resources, provides no
monetary or psychological reward for customer engagement. DR programs, on the other hand, provide
an opportunity for utilities to engage with customers “beyond the bill.” Demand response is a relatively
clear concept to explain to customers and provides an opportunity for customers to contribute to the
broader good (reducing costs for everyone) while also, depending on program design, saving money
56 Energy and Environmental Economics, Inc. 2014. “California Transportation Electrification Assessment Phase 2:
Grid Impacts.” Available at https://www.researchgate.net/publication/267694861. 57 PG&E, “Pacific Gas and Electric Company Smart Grid Annual Report – 2016,” Smart Grid Technologies, Order
Instituting Rulemaking 08-12-009, CPUC, 2016. 58 Avista Corp., Cover Letter to the Washington Utilities and Transportation Commission, Re: Tariff WN U-28 (New
Tariff Schedule 77), Docket UE-160082, January 14, 2016. 59 Frederiksberg Forsyning in Denmark purchased a fleet of cars from Nissan and is using Enel charging stations.
The software to control the vehicles was developed at the University of Delaware and is being licensed by Nuvve in Europe. See: Karen Roberts, “UD-Developed V2G Technology Launches in Denmark,” UDaily, August 29, 2016, http://www.udel.edu/udaily/2016/august/vehicle-to-grid-denmark/.
Synapse Energy Economics, Inc. Best Practices in Utility Demand Response Programs 35
themselves. Customer engagement on one front, such as demand response, can provide an opportunity
to engage on others, such as energy efficiency or consideration of energy supply or transmission issues.
Empowering customers also provides an opportunity to activate new markets and innovative firms as
customers look for assistance to maximize their return or meet their unique needs. Participation in
demand response also commonly requires the customer to make an investment with the expectation of
return over time. Offering predictable or guaranteed programs (such as multi-year contracts) respects
the customer’s contribution and expectations.
Behavioral demand response
It is common practice for utilities to make public appeals on peak days, asking customers to constrain
energy use during times when the grid is stressed (whether that is a summer afternoon in southern
California or a winter evening in Québec). However, to understand such appeals, plan for their effects,
and measure whether their effectiveness is changing, their impacts must first be measured. This means
explicitly designing tests to measure the effects of appeals.
The design of such a test depends on the mechanisms to be tested. A public appeal (e.g. via the
broadcast media) would need to be tested by comparing loads on days with and without appeals but
with similar weather (or adjusting the load for weather), after accounting for DR resources deployed
through other means (such as interruptible rates). If an appeal is made through email or text message, it
can be targeted to particular customers, while other customers do not receive it. This opens the door to
a randomized controlled trial experimental design.
Opower Inc. and its utility partners have tested the impacts of purely behavioral demand response using
a randomized controlled trail (RCT) approach. RCT assigns some customers to the treatment group—
those who will get the appeal to reduce demand—and some to a statistically indistinguishable control
group. When the utility contacts the treatment group, the changes in their load relative to the control
group provide a measure of the effectiveness of the appeal. Such testing requires AMI, because the
utility needs to be able to distinguish both targeted and control-group customers’ loads during the DR
event from load at other times. In Opower’s test of this approach in Glendale, California,60 they
measured a 3.4 percent peak reduction impact attributable to the DR appeal. The impact was even
higher among customers already participating in another Opower program.
When peak events are associated with prices (such as through critical peak pricing or peak-time
rebates), the impact of appeals may be increased, although the impact of the appeal may be harder to
distinguish from the impact of the price change. Engaging customers through direct communications
around DR events also provides an opportunity to identify other energy efficiency or DR opportunities
with those customers (such as enrollment in direct load control programs).
60 http://www2.opower.com/l/17572/2015-06-01/22v3lc/17572/104364/Glendale_BDR_Case_Study.pdf
Synapse Energy Economics, Inc. Best Practices in Utility Demand Response Programs 36
In some cases, appeals may increase the response from DR resources that are contractually obligated to
respond at a certain level. HQD experienced this on January 24, 2013, when 307 MW of load responded
to an extraordinary appeal. This has been observed on several occasions in Texas. For example, on
February 2, 2011, Texas experienced an extreme cold weather event that led the system operator
(ERCOT) to deploy 889 MW of Load Resources early in the morning (5:20 am). More than 99 percent of
the requested load reduction was achieved. Half an hour later, an additional 140 MW of Load Resources
that were not committed also responded to the system-wide request from ERCOT operators.
At 5:48 am, ERCOT activated an additional program of Emergency Interruptible Load Service resources
(384 MW). Some additional Emergency Interruptible Load Service resources (83 MW) that were not
obligated to respond also made themselves available. Due to the severity of system conditions (as more
and more generators failed to operate for a variety of reasons) the Emergency Interruptible Load Service
resources remained dispatched for 28 hours. The average Emergency Interruptible Load Service
obligation for the entire 28-hour event was 462.8 MW; the average actual load reduction for the entire
event was 577.7 MW.61
Coupling energy efficiency and demand response customer engagement
When utilities engage with customers, particularly large commercial or industrial customers, they can
achieve economies by engaging on several issues at once. In particular, energy efficiency and DR audits
draw on very similar auditor expertise. The overlap is even greater in facilities with comprehensive
energy management systems. In 2007, National Grid of Massachusetts conducted a pilot program to
address a congested area on its grid in Everett, Massachusetts. This program combined assessment of
participating facilities for demand response, energy efficiency, and renewable energy potential.62
National Grid is piloting a DR program this year, and is again equipping its account representatives with
information regarding both energy efficiency and demand response in order to maximize customer
engagement and savings.63 National Grid uses contracted efficiency and DR experts for on-site audits,
and third-party aggregators will deploy the DR resources.
On a programmatic level, some jurisdictions are incorporating DR and energy efficiency into joint
programs.64 In Maryland, for example, about one third of “EmPOWER” program funding is dedicated to
demand response. Pennsylvania’s experience with demand response and energy efficiency integration
under Act 129 was discussed earlier, and reflects about 10 percent of energy efficiency funding
dedicated to demand response. New York utilities plan to leverage marketing and administrative
61 ERCOT. "2011 EILS Deployments." QMWG. 2012.
62 Patil et al.(2007), Case Studies from Industrial Demand Response Audits Integrated with Renewable Energy
Assessments,” available at http://aceee.org/files/proceedings/2007/data/papers/18_2_110.pdf 63 Grayson Bryant, National Grid, personal communication, March 24, 2017.
64 See Buckley (2016), “Putting More Energy into Peak Savings: Integrating Demand Response and Energy
Efficiency Programs in the Northeast and Mid-Atlantic,” available at http://aceee.org/files/proceedings/2016/data/papers/6_968.pdf, for more information.
Synapse Energy Economics, Inc. Best Practices in Utility Demand Response Programs 37
resources for efficiency and demand response, even though the programs remain separate for cost
recovery and evaluation purposes. The Bonneville Power Administration’s “Energy Smart” industrial
energy efficiency program has identified opportunities for joint energy efficiency and DR
implementation in municipal water, cold storage, and food processing applications.65
Activating markets and innovation with third-party DR aggregators
Aggregators or other third parties can play a valuable role in collecting and coordinating demand
response for utilities as well as in wholesale markets. Where utility programs or market rules may
require a certain compensation or risk structure for each participant, aggregators can collect and shift
those risks among participants, hedging across their pool of resources. For example, a particular DR
resource may only be willing to be deployed eight times per winter, while a utility program requires up
to 20 deployments. Without an aggregator, the resource would be untapped. If an aggregator can
combine that resource with others, it can bring that capacity to the system while respecting the
customer’s needs. Rick Goddard of Rodan Energy Solutions has identified a list of the benefits of
aggregators, in the Ontario context:66
• “Shoulder prudential requirements on behalf of the contributor to allow them to participate in DR without encumbering their own balance sheets with onerous performance securities;
• Bundle smaller loads that would be unmanageable for the [system operator] to enroll on their own;
• Provide pre-enrollment services to assist organizations of any size without the necessary staff and expertise to properly assess their curtailment potential, develop curtailment strategies;
• Provide the expertise to handle all of the technical and administrative overhead required to enroll and maintain a facility and to navigate the various governmental agencies on the contributor’s behalf;
• Provide telemetry to foster greater energy awareness and facilitate curtailment events;
• Shield the contributor from the full brunt of the [system operator] penalties and their related complexities;
• Submit weekly meter data on the contributor’s behalf to protect them from meter data penalties resulting from late or incorrect data.”
Aggregators also provide notable advantages to utilities who wish to increase their use of demand
response. For example, utilities may not have the customer engagement and technological expertise
65https://www.bpa.gov/EE/NewsEvents/presentations/Documents/DER%20Utility%20Brown%20Bag%202016102
0%20final.pdf, slide 30 66 http://rodanenergy.com/the-evolution-of-demand-response-in-ontario/
Synapse Energy Economics, Inc. Best Practices in Utility Demand Response Programs 38
across diverse industries that an aggregator can provide. It likely does not make sense for ratepayers to
pay for utility staff to develop this expertise for the purpose of DR programs alone; where demand
response is closely coupled with energy efficiency programs, utilities may already have some of this
expertise.
The primary examples of aggregators playing these critical roles are in wholesale markets, although
aggregators also work productively with utilities. EnerNOC, for example, provides 186 MW of demand
response to the Tennessee Valley Authority from roughly 500 customers and 1,300 facilities.67 They will
also deliver about 4 GW in the PJM capacity (Reliability Pricing Model) construct in 2017–2018.68 In ISO-
NE, 799 MW of demand response is providing capacity in the winter of 2020–2021.69 Enerwise Global
Technologies has collected 416 MW, while EnerNOC has aggregated 184 MW. In Ontario, EnerNOC will
provide 139 MW of demand response in the winter of 2017–18 while Enershift Corp. will provide 124
MW.70
4.6. Cost and Benefit Analysis
Cost-effectiveness is a critical screen for DR resources: if other resources would be less costly they
should be deployed instead. In order to deploy a cost-effectiveness screen, however, a number of items
must be established first. These include the form of the cost-effectiveness test (or tests) to be used, the
costs to be included, and current estimates of the costs that will be avoided.
For screening tests, options include tests from a societal cost, total resource cost, program administrator
cost, participant cost, or rate impact perspective. Each of these tests measures cost-effectiveness from a
different perspective, and thus includes different costs and benefits. A societal test, for example, might
include avoided environmental externalities from the use of relatively inefficient peaking generation,
while not including the transfer of an incentive from the utility to the participant. Meanwhile, the
program administrator cost test does not include the customer’s cost to implement DR measures. Our
Synapse colleagues worked with the Regulatory Assistance Project to develop “A Framework for
Evaluating the Cost-Effectiveness of Demand Response” for the National Forum on the National Action
Plan on Demand Response: Cost-effectiveness Working Group in 2013.71 This report identifies the
reasons to select each of these tests and example calculations of their application.
67 Sarah McAuley, EnerNOC, Personal communication, March 16, 2017.
68 http://investor.enernoc.com/releasedetail.cfm?ReleaseID=850534
69 See https://www.iso-ne.com/markets-operations/markets/forward-capacity-market/?key-
topic=FCM%20Capacity%20Commitment%20Period%202020-2021 70 http://reports.ieso.ca/public/DR-PostAuctionSummary/PUB_DR-PostAuctionSummary_2017.xml
71 http://www.synapse-energy.com/sites/default/files/SynapseReport.2013-02.LBL_.DR-Cost-Effectiveness.11-
106A.pdf
Synapse Energy Economics, Inc. Best Practices in Utility Demand Response Programs 39
Costs to implement DR programs can be divided into enablement or set-up costs and on-going or
implementation costs. The NWPCC potential study discussed previously72 takes a societal perspective.
Their enablement costs include technology costs and installation costs, including both customer costs
and program incentives. Implementation costs include costs of program administration, DR
management systems, and evaluation studies. When evaluating the total costs, the evaluator must
determine a reasonable lifetime for measures, so that the up-front costs can be levelized over all years
(or alternatively, the implementation costs can be present-valued).
Benefits of DR programs come primarily in the form of costs avoided. These may be energy, capacity,
ancillary services or wires (transmission or distribution) costs. There may also be market price effects or
avoided environmental impacts. To be accurate, these avoided costs must reflect the particular
circumstances, including existing and projected utility portfolios and the local and market costs of
supply-side resources. Costs and benefits include avoiding some energy cost, but (in the case of load
shifting) purchasing some other energy at a different time. Line losses rise with the square of the power
demanded, so marginal losses of energy and capacity are reduced by flattening loads.
Both the costs and benefits of demand response may change substantially over time. If a market moves
from surplus into shortage on capacity, for example, the benefits of avoiding capacity costs can increase
rapidly (and vice versa). In ISO-NE, for example, capacity costs rose from their administrative floor price
of $3.15/kW-month ($37.80/kW-year) for delivery in 2016–17 to $9.55/kW-month ($114.60/kW-year) in
2018–19, then fell to $5.30/kW-month ($63.60/kW-year) for 2020–21 delivery. Costs and benefits
should also be considered in total, rather than in isolation. Where a resource may provide a stack of
benefits—both winter peaking capacity and balancing to enable renewable energy integration, for
example—all benefits relevant to the cost-effectiveness test should be included.
Benefits may not flow to the parties incurring costs: program design or public policy may need to
intervene to make a societally cost-effective choice favorable to both utility and participant. Program
design should reflect benefits and what is necessary to move a sufficient market to provide the resource
necessary, while limiting free-ridership. Changes in the economics of a program should reflect the costs
or the benefits sides of a cost-effectiveness calculation. HQD has shown this flexibility by paying $70/kW
for demand response through its commercial GDP Affaires program.73 Updating costs and benefits on a
regular basis, and in a transparent and well documented fashion, allows stakeholders and regulators to
ensure that programs are capturing all of the cost-effective potential. Sudden changes in program
design should be avoided, however, as it takes time for DR participants to make changes to their
facilities and they may react negatively to continually changing compensation or program design that
puts their investments at risk.
72 https://www.nwcouncil.org/media/7148943/npcc_assessing-dr-potential-for-seventh-power-plan_updated-
report_1-19-15.pdf 73 http://www.hydroquebec.com/business/energy-efficiency/demand-side-management/financial-assistance/
Synapse Energy Economics, Inc. Best Practices in Utility Demand Response Programs 40
5. APPLICATION OF BEST PRACTICES TO QUÉBEC
Informed by the best practices detailed above, and our understanding of the HQD system, DR programs
and planning to date, we have the following suggestions. Implementation of these suggestions will
depend on engagement and actions from both HQD and its regulator. While implementation of any of
these suggestions would improve HQD’s DR planning and programs, there are synergies between them
that would make the combined portfolio of changes more effective.
5.1. Planning
If all cost-effective DR potential is not harnessed, customers will pay more for electricity service from
HQD than they otherwise would. HQD does not have an established structure for DR planning that is
grounded in achievement of all cost-effective DR potential. As a symptom of this lack of structure, HQD
has not conducted a DR potential study since 2012. In addition, that study did not consider the
achievable potential or how quickly programs could ramp up to capture the potential. Instead, HQD has
taken a piecemeal, “bottom up” approach to DR planning, such that only current or immediately
foreseen DR programs are included in the Supply Plan. HQD has made some steps in the appropriate
direction by including in the Supply Plan the expected growth in current programs. Where it falls short is
in recognizing the impacts of additional programs over the coming decade.
An improved planning approach could take a structure like this:
• Conduct potential studies on a regular basis (e.g. every three years in preparation for the Supply Plan), including assessment of the achievable potential and of avoided costs.
• Determine an appropriate fraction of the cost-effective DR resource to pursue in the long term, informed by the size of the utility’s peak demand gap. (Note that the cost-effective and achievable potential may exceed the Distributor’s needs.)
• Identify a program portfolio that can cumulatively generate that amount of demand response, favoring programs that can ramp more quickly or whose impacts are more assured.
• Taking into account the pace of program development and roll-out, map out the amount of demand response achievable in each year over the course of the Supply plan, and include that resource as the planned DR resource in the Supply Plan.
Documentation of avoided costs, achievable potential, program implementation plans, and the Supply
Plan itself should all be made available to the public, stakeholders, and the Régie de l’énergie on the
appropriate and recurring schedule.
Jurisdictions that have adopted explicit expectations that energy efficiency programs will achieve “all
reasonably available cost-effective energy efficiency,” or similar goals, have generally experienced
greater success at meeting power system needs at least cost. Therefore, we suggest that the Régie
consider adopting such an explicit formulation for HQD’s demand response.
Synapse Energy Economics, Inc. Best Practices in Utility Demand Response Programs 41
DR planning must be consistent with other aspects of supply planning. In the current Supply Plan, HQD
has identified an impact of 189 MW by 2026 from EVs, but has not addressed EV demand response in
any way. EVs are eminently controllable loads, and excluding any impact from “smart” charging
programs or rate structures into the forecast is a significant oversight. This is a result of the bottom-up
modeling approach that HQD has chosen—there are no EV DR savings because there is no current
program. This is backwards: HQD should assess the potential and include all cost-effective EV demand
response in the Supply Plan, and then commit to developing the tools necessary to achieve that savings
over the coming decade.
Stochastic planning for supply might be particularly useful in the Québec context because of the impact
of weather variability and the patrimonial supply construct. Different DR strategies might, for example,
enable more robust use of the patrimonial supply in the face of year-to-year load variability.
5.2. Avoided Costs
To plan well while considering the cost-effectiveness of each DR program, accurate avoided costs are
essential. Québec has a particularly complicated structure in which to calculate avoided costs, due to the
dynamics between the patrimonial supply structure, other long-term contracts, market interactions with
neighboring states and provinces, and possible additional U.S. interties.
The patrimonial supply structure places a premium on a load duration curve as similar as possible to the
patrimonial curve, with predictable deviations allowing the cost-effective purchase of additional supply.
Designing demand response and other load control as tools to make the deviations from the patrimonial
“bâtonnets” more predictable, and quantifying the benefits, will be a fascinating challenge. As load rises,
the relationship between load and the patrimonial supply structure also changes, so avoided costs must
be re-evaluated on a regular basis as part of the planning process. Avoided costs will also differ by the
shape and duration of each particular DR or load shaping program—the cost savings from load changes
in the top 20 hours, top 300 hours, and top 2000 hours of the year are quite different. HQD’s approach
to calculating avoided costs should be revised (and updated regularly) to take into account the
differences in avoided costs in relation to HQD’s peak hours and to allow customized avoided costs to be
calculated for different kinds of DR interventions.
In order to best match DR potential with avoided costs, HQD may require more extensive data and
models regarding the load shapes of different classes or sectors of customers than it currently
possesses.74
74 In response to RNCREQ’s DDR 9.1.3, 9.1.4, and 9.5, HQD says that it does not model the contributions of some
sectors to winter peak, possess hourly consumption data, or model winter peak stochastically. Data from AMI deployment should make it possible to do so.
Synapse Energy Economics, Inc. Best Practices in Utility Demand Response Programs 42
5.3. Peak-Time Rate or Rebate Programs
The Distributor offers several programs today that are very similar in nature to critical peak price or peak
time rebate programs. However, it should consider expanding these options to more customers and
classes to both capture cost-effective DR capacity and empower customers to take greater control of
their electricity usage and costs.
Commercial and industrial interruptible load programs, which compensate participants based on their
reduction from an established baseline over a set period of time at the utility’s request, are functionally
very similar to peak time rebate programs. In HQD’s case, these are reflected in the interruptible forms
of Rates M, G-9, and L, as well as the GDP Affaires program. These programs are more certain—unlike a
PTR program, participants generally must curtail load, rather than only having the option. They also
require a certain size of resource. Aggregation can address both of these concerns, from a customer
perspective.
For residential customers, Rate DT has the form of a critical peak price rate, with some limitations and
differences. First, it is triggered by temperature, rather than a utility call. As a result, it may trigger on a
weekend, or overnight, when HQD would not have chosen to call a DR event. Second, it is available only
to customers with the heating hardware necessary to switch to another fuel. HQD is piloting the use of
an interruption signal, rather than temperature, and hardware without automatic fuel switching
(behavioral savings), and these changes would shift the program closer to critical peak pricing.
HQD piloted TOU with critical peak pricing (“Réso+”) during the winters of 2008/2009 and 2009/2010.
This program demonstrated average savings of about 6 percent on peak. If a 6 percent effect were to be
scaled to HQD’s full residential and agricultural class, it could reduce winter peak by more than 1 GW.75
HQD’s marginal energy and capacity prices are nearly flat over all hours except around winter peaks. As
a result, a daily TOU rate is not justified, based on cost of service.76 However, a program that targets
winter peak in particular, when the marginal costs are significantly higher, would be economically
efficient (assigning costs to those who are causing them). It would likely incent consumer behavior that
would lower the overall cost of service. As suggested earlier, a more granular approach to calculating
avoided costs based on time of use (in relation to the system peak) would greatly facilitate the
quantification of DR benefits.
HQD’s current rate structure for medium to large commercial and industrial customers (such as Rates M
and L) have a demand charge component, reflecting some peak costs. However, these demand charges
do not depend on coincidence with system peak. Peak-coincident demand drives capacity costs, but is
not reflected in the structure of these rates. A customer whose industrial process results in a peak at
some time other than the system peak has no incentive to shift their load away from the winter peak,
75 If at least 28% of the “other” end uses on winter peak are from residential and agricultural customers.
76 R-3972-2016, HQD-2, document 1 (report from Christensen Associates), page 46.
Synapse Energy Economics, Inc. Best Practices in Utility Demand Response Programs 43
unless they have had the foresight, are eligible, and are willing to take the risk of the Distributor’s
interruptible load programs. HQD is missing an opportunity to better align rates with cost causation and
to provide this economic incentive to these customers, by integrating a coincident peak component into
these rates or making a peak time rebate structure the default.
A peak time rebate program available to all customers (or even made the default for all customers, since
their bills can only go down for participating), could be well aligned with HQD’s marginal cost structure
and meet with customer acceptance. Such a program, while it may be implemented through rates, is in
effect a DR program with a very flexible opt-in structure. It would allow customers who are willing and
able to take actions to help the system to exercise control over their electric bills. HQD’s 2012 DR
potential study identifies a series of behavior change measures in the residential sector that, if they
were fully additive, would total 1,600 MW. Even just convincing customers to delay use of the dryer
could reduce the peak by more than 500 MW. Such a program would also serve to reduce, perhaps to a
de minimis level, the winter peak impacts of EV charging.
To identify and harness the full cost-effective residential flexible capacity resource, HQD should build on
its 2008–2010 TOU and CPP pilot by testing new PTR or CPP programs, grounded in updated and more
granular avoided costs. If they prove promising and cost-effective, HQD should then introduce them as
general opt-in or opt-out options to all customers.
5.4. Pilots to Programs
HQD is actively pursuing new DR interventions, particularly in water and space heating, in ways that
reflect the specific needs and markets in Québec, and it is to be applauded for this. This is necessary
groundwork for the achievement of the cost-effective potential just discussed. As new programs are
developed and are able to move from pilot to implementation, it is important that HQD move with all
due haste to launch programs and capture the cost-effective potential.
While we appreciate that HQD has great respect for stakeholders concerned with its proposed water
heater DR program, we encourage HQD and the Régie to move this program into implementation as
quickly as possible. HydroQuébec has a history of intervening in the water heater market, through the
development of the three-element water heater, although adoption of that water heater has not
reached its potential.77 Water heaters provide a large resource, particularly in the Québec context. As a
resource, they can be applied not just to winter peak but also to localized distribution constraints, daily
load flattening, frequency regulation, or wind energy integration. Other utilities interrupt water heaters
more than 20 times per year,78 and use them to target specific cost drivers; HQD can do the same. If
77 HQD’s reply to RNCREQ’s DDR 5.2.1 indicates that three-element heaters have only a marginal impact on winter
peak. 78 GRE uses its peak shaving water heaters 40 to 60 times per year, for 5 to 7 hours at a stretch. Thermal storage
water heaters are curtailed for 16 hours every day. (Gary Connett, GRE, personal communication, March 23, 2017)
Synapse Energy Economics, Inc. Best Practices in Utility Demand Response Programs 44
water heater control could achieve its full potential (identified by HQD as 450 MW79) over the course of
the coming decade, that one program would meet more than one-quarter of the additional peak power
identified in the Supply Plan.
HQD should consider enlisting the assistance, through shared business opportunities, of third-party DR
experts and aggregators. While HQD has deep knowledge of the unique factors that shape its peaks and
the Québec markets, insights from third parties could bring new vision and technologies. Québec is a
large enough market to catch the attention of technology developers who may be able to bring
entrepreneurial spirit to the benefit of the system.
5.5. Standards
HQD has a unique ability and role in the market for electric appliances and control systems in Québec . If
it were to be consistent and clear that it would develop and harness systems that use standardized
systems for integration and communication, such as USNAP/CTA-2045 and OpenADR, it could move the
market to adopt these standards throughout the province. At the same time, using these standards
would allow HQD and its customers to take advantage of products and technologies developed for other
markets. Actions in this area could include working with the manufacturers of three-element water
heaters to incorporate USNAP, and integrating OpenADR expectations into energy efficiency program
offerings around building or facility energy management systems.
5.6. Quantify Impacts
To adequately plan for utilizing DR measures, their impacts must be quantified. The Supply Plan
indicates that appeals to the public are a means of last resort and their contribution has not been
quantified. However, if HQD were to measure the impact of such appeals, it would at least have some
indication of their effectiveness. In particular, assessment of the impact of public appeals on a regular
basis would allow HQD to know whether the effect of such appeals is increasing or decreasing. If HQD
were to implement a widely applied and peak-focused program through rates (as recommended below),
quantification of appeals prior to the implementation of that program would allow comparison of
behavioral and financial programs. This would inform a more refined cost-effectiveness determination.
A personalized behavioral DR program (with appeals by text, email, or automated phone call) would
both enable and require the separation of a control group to measure program impacts so they could be
included in planning. At minimum, as HQD expands its DR offerings, it should employ best practices in
evaluation, measurement, and verification of programmatic impacts.
79 HQD-1, Document 1, Page 21
Synapse Energy Economics, Inc. Best Practices in Utility Demand Response Programs 45
5.7. Customer Engagement with Energy Efficiency
HQD operates a significant portfolio of energy efficiency programs; governmental programs (such as
Renoclimat) can also produce significant energy savings. These programs already engage HQD customers
on energy issues, and should be encouraged to further integrate DR opportunities. As of February 15,
2017, HQD has improved its programs in this respect by including power management for winter peak as
an eligible measure in its industrial retrofit program.80 This has the potential to contribute to the
increase in DR savings from industrial customers that is projected in the Supply Plan, and may allow HQD
to increase its projections above those levels as customer response is gauged. HQD should build on this
example and integrate demand response into its other energy efficiency offerings where cost-effective
opportunities exist.81
5.8. Flexible and Inclusive Program Design
In contrast to supply-side resources, harnessing demand-side resources requires the active participation
and engagement of a broad range of customers. These customers operate diverse facilities, and have
unique financial situations. Flexible program design that meets these customers where they are and
offers them a way to participate is therefore essential to fully capture the potential. HQD has
experienced this recently, with changes in the interruptible load program driving increased participation
and giving HQD confidence that this program can grow from 850 MW to 1,000 MW. The new GDP
Affaires commercial interruptible load program provides options to an underserved market, and has
seen faster success than projected. We encourage HQD to continue to diversify their offerings or make
them more flexible, especially for commercial and industrial customers, to encourage greater
participation on terms that make sense for both participant and Distributor.
The GDP Affaires program includes two features that we encourage HQD to consider as it develops
other programs: a minimum or capacity payment, and the welcoming of aggregators. By offering a
capacity payment regardless of whether a DR event is called, the program allows the customer to be
assured of a minimal payback on their costs to join the program and any associated changes in their
infrastructure or controls. Aggregators can be a key partner to attract and include smaller variable loads
(e.g. smaller than the 200 kW minimum for direct participation in the GDP Affaires program).
Aggregators can also insulate their participants from the vagaries of program design and introduce
flexibility and diversity in customer economics that might be difficult to implement by tariff.
80 http://www.hydroquebec.com/business/energy-efficiency/programs/industrial-systems-
program/retrofit/financial-assistance/ 81 DR and energy efficiency planning might benefit from being done jointly as well.
Synapse Energy Economics, Inc. Best Practices in Utility Demand Response Programs 46
ABOUT THE AUTHORS
Synapse Energy Economics is a research and consulting firm specializing in energy, economic, and
environmental topics. Since its inception in 1996, Synapse has grown to become a leader in providing
rigorous analysis of the electric power sector for public interest and governmental clients.
Synapse’s staff of 30 includes experts in energy and environmental economics, resource planning,
electricity dispatch and economic modeling, energy efficiency, renewable energy, transmission and
distribution, rate design and cost allocation, risk management, benefit-cost analysis, environmental
compliance, climate science, and both regulated and competitive electricity and natural gas markets.
Several of our senior-level staff members have more than 30 years of experience in the economics,
regulation, and deregulation of the electricity and natural gas sectors. They have held positions as
regulators, economists, and utility commission and ISO staff.
Services provided by Synapse include economic and technical analyses, regulatory support, research and
report writing, policy analysis and development, representation in stakeholder committees, facilitation,
trainings, development of analytical tools, and expert witness services. Synapse is committed to the idea
that robust, transparent analyses can help to inform better policy and planning decisions. Many of our
clients seek out our experience and expertise to help them participate effectively in planning,
regulatory, and litigated cases, and other forums for public involvement and decision-making.
Synapse’s clients include public utility commissions throughout the United States and Canada, offices of
consumer advocates, attorneys general, environmental organizations, foundations, governmental
associations, public interest groups, and federal clients such as the U.S. Environmental Protection
Agency and the Department of Justice. Our work for international clients has included projects for the
United Nations Framework Convention on Climate Change, the Global Environment Facility, and the
International Joint Commission, among others.
Dr. Asa S. Hopkins
Asa Hopkins, PhD, is an expert in the development and analysis of public policy and regulation regarding
energy and greenhouse gas emissions, including cost-benefit analysis, stakeholder engagement, state
energy planning, and utility planning. He has provided analysis and testimony in both legislative and
regulatory contexts, including state utility regulation and state and federal rulemaking.
As the Director of Energy Policy and Planning at the Vermont Department of Public Service, Dr. Hopkins
was responsible for development and analysis of state policy regarding renewable energy, ratepayer-
funded energy efficiency, energy-related economic development, and innovative utility rates and
programs. He was responsible for developing the state’s Comprehensive Energy Plan, reviewing utility
integrated resource plans, and directing the actions of the Planning and Energy Resources Division. He
also served on the Board of Directors of the National Association of State Energy Officials. During his
tenure, Vermont rose in the rankings on national clean energy state scorecards.

Synapse Energy Economics, Inc. Best Practices in Utility Demand Response Programs 47
Prior to 2011, Dr. Hopkins was an AAAS Science and Technology Policy Fellow in the Office of the Under
Secretary for Science at the U.S. Department of Energy. In that role, he managed stakeholder
engagement for and the overall project flow of DOE’s first Quadrennial Technology Review. Dr. Hopkins
came to DOE from Lawrence Berkeley National Laboratory, where he worked on economic and market
analysis of appliance energy efficiency standards.
Dr. Hopkins holds a B.S. in Physics from Haverford College and a Masters and PhD in Physics from
California Institute of Technology.
Melissa Whited
Melissa Whited specializes in issues related to utility regulation, distributed energy resources, and the
water-energy nexus. Much of her work focuses on alternative regulatory models to respond to
fundamental changes in the electricity landscape spurred by declining demand, new technologies,
environmental policies, and the integration of large amounts of renewable energy. Ms. Whited consults
on the tools to effectively address this shift, including utility performance incentives, revenue
decoupling mechanisms for energy efficiency, innovative demand response programs, and alternative
ratemaking.
Recently, Ms. Whited was integrally involved in the development of a benefit-cost analysis framework
for distributed energy resources within the context of New York’s “Reforming the Energy Vision”
proceeding. Her other recent work includes consulting on decoupling cases in Maine, Hawaii, and
Nevada; conducting a comparative analysis of demand response programs across the United States;
analyzing experiences with performance incentives for utilities; and evaluating proposals for time-
varying rates in the Northeast.
Ms. Whited’s expertise also encompasses water resource issues. In 2013, Ms. Whited led a study
examining the water resource impacts and vulnerabilities of the U.S. power sector. Prior to rejoining
Synapse as an associate in 2012, she published in the Journal of Regional Analysis and Policy regarding
the economic impacts of irrigation water transfers, and analyzed water resource efficiency options for
Wisconsin. Ms. Whited holds two master’s degrees from the University of Wisconsin: an MA in
agricultural and applied economics, and an MS in environment and resources.
ACKNOWLEDGEMENTS
The authors would like to thank Mr. Philip Raphals for his assistance and insights regarding the details of
the Québec electric system.