


Langages
Pages
Légal


公司簡介 (8454 TT/TW)
2020年4月

2
免責聲明
本簡報資料所提供之資訊,包含所有前瞻性的看法,將不會因任何
新的資訊、未來事件、或任何狀況的產生而更新相關資訊。富邦媒
體科技股份有限公司(本公司)並不負有更新或修正本 簡報資料內
容之責任。
本簡報資料中所提供之資訊並未明示或暗示的表達或保證其具有正
確性、完整性、或可靠性,亦不代 表本公司、產業狀況或後續重大
發展的完整論述。
3
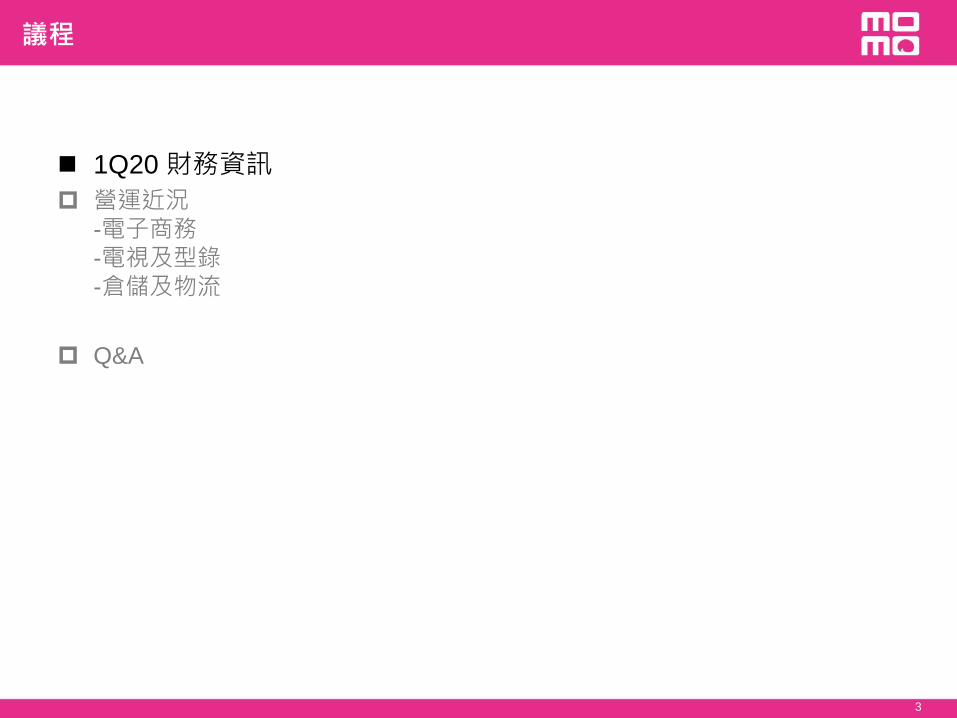
議程
1Q20 財務資訊
營運近況
-電子商務
-電視及型錄
-倉儲及物流
Q&A
4
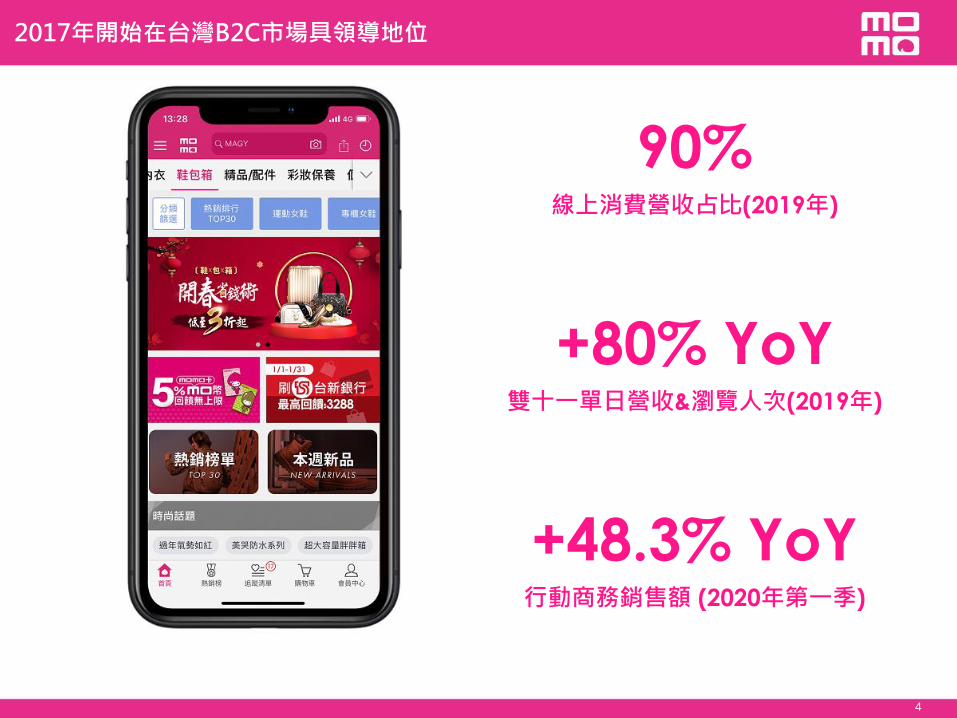
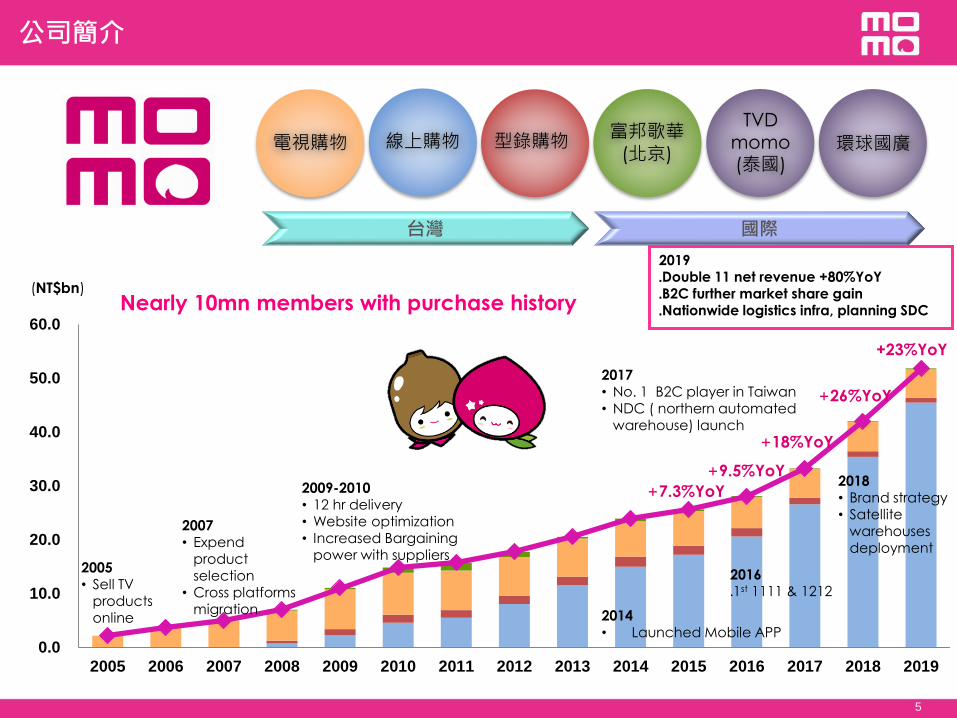
90% 線上消費營收占比(2019年)
+80% YoY 雙十一單日營收&瀏覽人次(2019年)
+48.3% YoY 行動商務銷售額 (2020年第一季)
2017年開始在台灣B2C市場具領導地位
0.0
10.0
20.0
30.0
40.0
50.0
60.0
2005 2006 2007 2008 2009 2010 2011 2012 2013 2014 2015 2016 2017 2018 2019
2018 • Brand strategy • Satellite
warehouses deployment
國際 台灣
型錄購物 電視購物 富邦歌華
(北京)
TVD momo (泰國)
環球國廣 線上購物
5
2017 • No. 1 B2C player in Taiwan • NDC ( northern automated
warehouse) launch
2016 ․1st 1111 & 1212
2005 • Sell TV
products online
2007 • Expend
product selection
• Cross platforms migration
2009-2010 • 12 hr delivery • Website optimization • Increased Bargaining
power with suppliers
2014 • Launched Mobile APP
(NT$bn)
+26%YoY
+18%YoY
2019 ․Double 11 net revenue +80%YoY ․B2C further market share gain ․Nationwide logistics infra, planning SDC
+9.5%YoY
+7.3%YoY
+23%YoY
公司簡介
Nearly 10mn members with purchase history
6
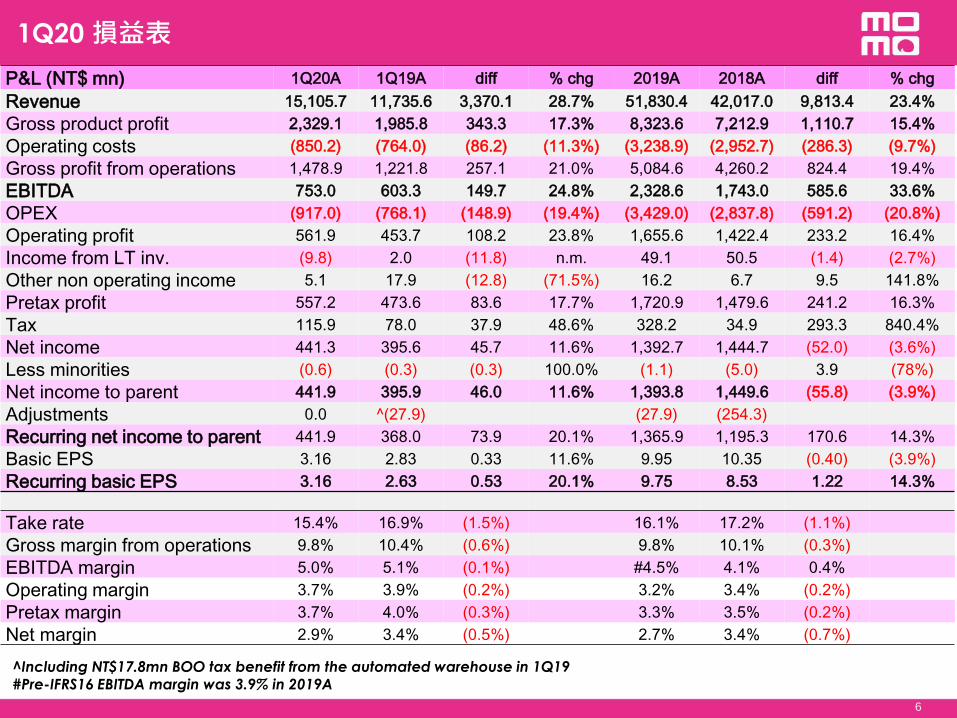
P&L (NT$ mn) 1Q20A 1Q19A diff % chg 2019A 2018A diff % chg
Revenue 15,105.7 11,735.6 3,370.1 28.7% 51,830.4 42,017.0 9,813.4 23.4%
Gross product profit 2,329.1 1,985.8 343.3 17.3% 8,323.6 7,212.9 1,110.7 15.4%
Operating costs (850.2) (764.0) (86.2) (11.3%) (3,238.9) (2,952.7) (286.3) (9.7%)
Gross profit from operations 1,478.9 1,221.8 257.1 21.0% 5,084.6 4,260.2 824.4 19.4%
EBITDA 753.0 603.3 149.7 24.8% 2,328.6 1,743.0 585.6 33.6%
OPEX (917.0) (768.1) (148.9) (19.4%) (3,429.0) (2,837.8) (591.2) (20.8%)
Operating profit 561.9 453.7 108.2 23.8% 1,655.6 1,422.4 233.2 16.4%
Income from LT inv. (9.8) 2.0 (11.8) n.m. 49.1 50.5 (1.4) (2.7%)
Other non operating income 5.1 17.9 (12.8) (71.5%) 16.2 6.7 9.5 141.8%
Pretax profit 557.2 473.6 83.6 17.7% 1,720.9 1,479.6 241.2 16.3%
Tax 115.9 78.0 37.9 48.6% 328.2 34.9 293.3 840.4%
Net income 441.3 395.6 45.7 11.6% 1,392.7 1,444.7 (52.0) (3.6%)
Less minorities (0.6) (0.3) (0.3) 100.0% (1.1) (5.0) 3.9 (78%)
Net income to parent 441.9 395.9 46.0 11.6% 1,393.8 1,449.6 (55.8) (3.9%)
Adjustments 0.0 ^(27.9) (27.9) (254.3)
Recurring net income to parent 441.9 368.0 73.9 20.1% 1,365.9 1,195.3 170.6 14.3%
Basic EPS 3.16 2.83 0.33 11.6% 9.95 10.35 (0.40) (3.9%)
Recurring basic EPS 3.16 2.63 0.53 20.1% 9.75 8.53 1.22 14.3%
Take rate 15.4% 16.9% (1.5%) 16.1% 17.2% (1.1%)
Gross margin from operations 9.8% 10.4% (0.6%) 9.8% 10.1% (0.3%)
EBITDA margin 5.0% 5.1% (0.1%) #4.5% 4.1% 0.4%
Operating margin 3.7% 3.9% (0.2%) 3.2% 3.4% (0.2%)
Pretax margin 3.7% 4.0% (0.3%) 3.3% 3.5% (0.2%)
Net margin 2.9% 3.4% (0.5%) 2.7% 3.4% (0.7%)
^Including NT$17.8mn BOO tax benefit from the automated warehouse in 1Q19 #Pre-IFRS16 EBITDA margin was 3.9% in 2019A
1Q20 損益表
90.1% 85.6%
87.6%
84.1%
8.5%
12.0%
10.3%
13.1%
1.1%
2.1%
1.7%
2.4%
0
10,000
20,000
30,000
40,000
50,000
60,000
1Q20A 1Q19A 2019A 2018A
NT$ mn
7
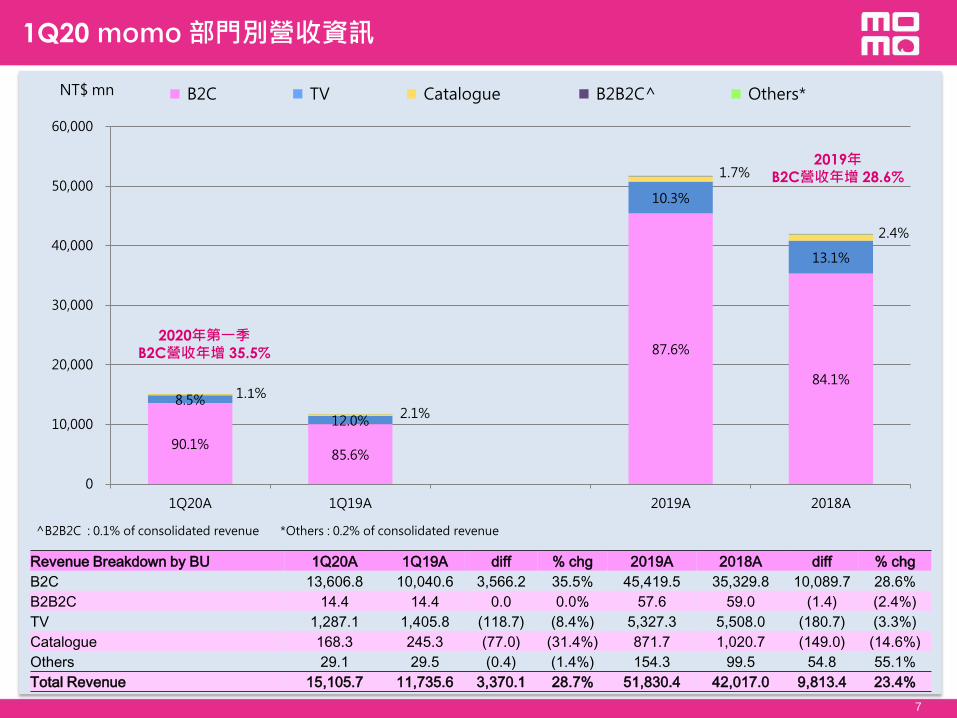
^B2B2C : 0.1% of consolidated revenue *Others : 0.2% of consolidated revenue
B2C TV Catalogue B2B2C^ Others*
Revenue Breakdown by BU 1Q20A 1Q19A diff % chg 2019A 2018A diff % chg
B2C 13,606.8 10,040.6 3,566.2 35.5% 45,419.5 35,329.8 10,089.7 28.6%
B2B2C 14.4 14.4 0.0 0.0% 57.6 59.0 (1.4) (2.4%)
TV 1,287.1 1,405.8 (118.7) (8.4%) 5,327.3 5,508.0 (180.7) (3.3%)
Catalogue 168.3 245.3 (77.0) (31.4%) 871.7 1,020.7 (149.0) (14.6%)
Others 29.1 29.5 (0.4) (1.4%) 154.3 99.5 54.8 55.1%
Total Revenue 15,105.7 11,735.6 3,370.1 28.7% 51,830.4 42,017.0 9,813.4 23.4%
2020年第一季 B2C營收年增 35.5%
2019年 B2C營收年增 28.6%
1Q20 momo 部門別營收資訊
74.4% 64.6%
66.7%
62.6% 24.8%
33.7%
31.0%
37.0%
(500)
0
500
1,000
1,500
2,000
2,500
1Q20A 1Q19A 2019A 2018A
NT$ mn
1Q20 momo 部門別 EBITDA
B2C TV Catalogue B2B2C^ Others*
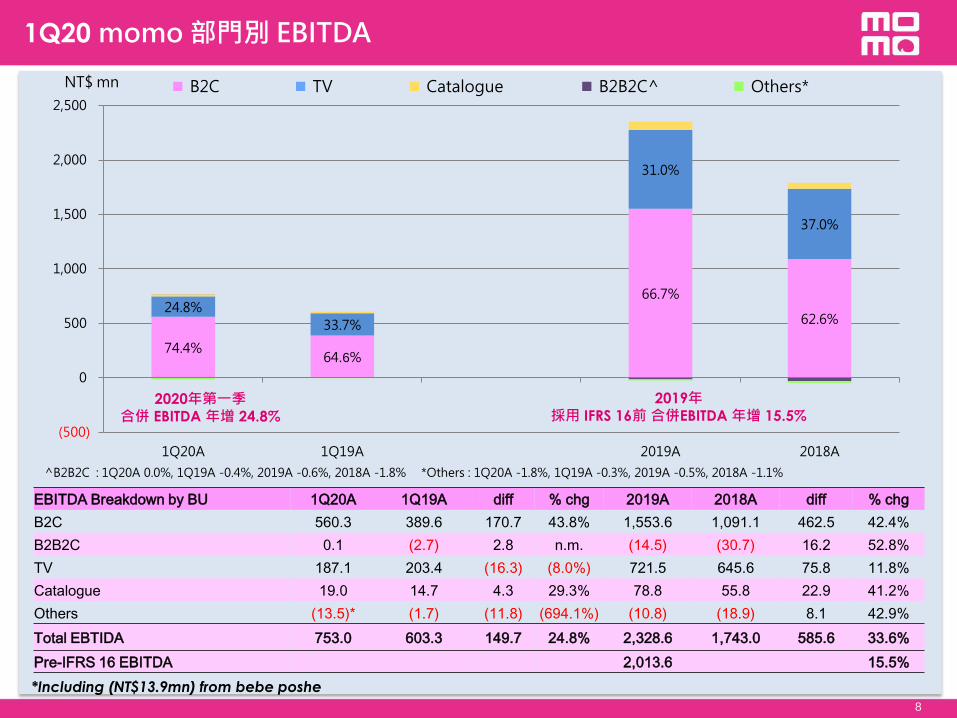
^B2B2C : 1Q20A 0.0%, 1Q19A -0.4%, 2019A -0.6%, 2018A -1.8% *Others : 1Q20A -1.8%, 1Q19A -0.3%, 2019A -0.5%, 2018A -1.1%
8
EBITDA Breakdown by BU 1Q20A 1Q19A diff % chg 2019A 2018A diff % chg
B2C 560.3 389.6 170.7 43.8% 1,553.6 1,091.1 462.5 42.4%
B2B2C 0.1 (2.7) 2.8 n.m. (14.5) (30.7) 16.2 52.8%
TV 187.1 203.4 (16.3) (8.0%) 721.5 645.6 75.8 11.8%
Catalogue 19.0 14.7 4.3 29.3% 78.8 55.8 22.9 41.2%
Others (13.5)* (1.7) (11.8) (694.1%) (10.8) (18.9) 8.1 42.9%
Total EBTIDA 753.0 603.3 149.7 24.8% 2,328.6 1,743.0 585.6 33.6%
Pre-IFRS 16 EBITDA 2,013.6 15.5%
2019年 採用 IFRS 16前 合併EBITDA 年增 15.5%
2020年第一季 合併 EBITDA 年增 24.8%
*Including (NT$13.9mn) from bebe poshe
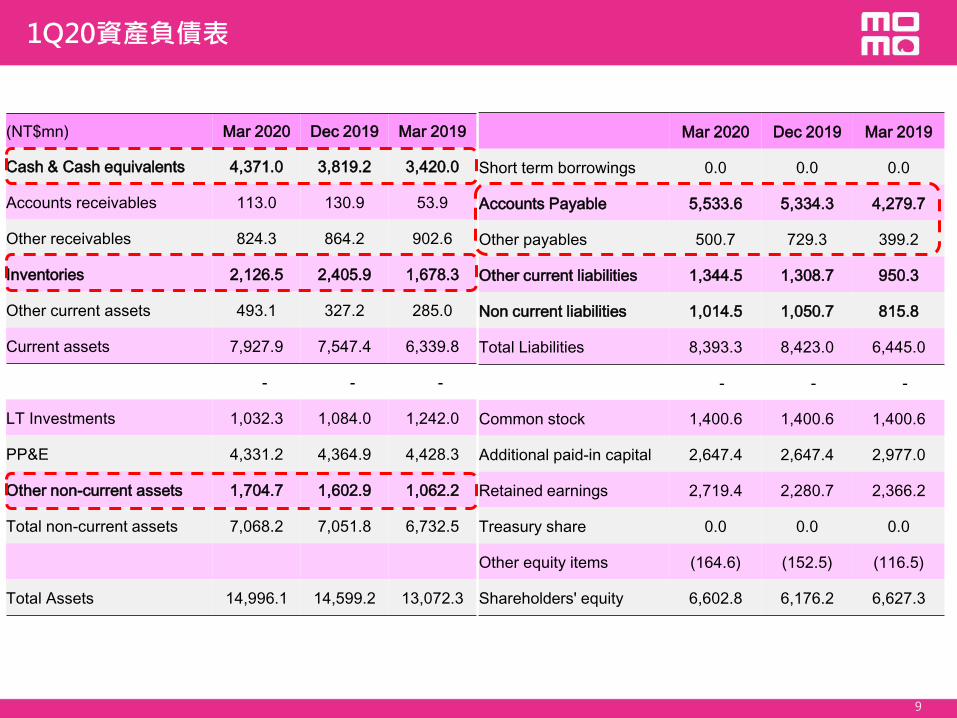
(NT$mn) Mar 2020 Dec 2019 Mar 2019
Cash & Cash equivalents 4,371.0 3,819.2 3,420.0
Accounts receivables 113.0 130.9 53.9
Other receivables 824.3 864.2 902.6
Inventories 2,126.5 2,405.9 1,678.3
Other current assets 493.1 327.2 285.0
Current assets 7,927.9 7,547.4 6,339.8
- - -
LT Investments 1,032.3 1,084.0 1,242.0
PP&E 4,331.2 4,364.9 4,428.3
Other non-current assets 1,704.7 1,602.9 1,062.2
Total non-current assets 7,068.2 7,051.8 6,732.5
Total Assets 14,996.1 14,599.2 13,072.3
Mar 2020 Dec 2019 Mar 2019
Short term borrowings 0.0 0.0 0.0
Accounts Payable 5,533.6 5,334.3 4,279.7
Other payables 500.7 729.3 399.2
Other current liabilities 1,344.5 1,308.7 950.3
Non current liabilities 1,014.5 1,050.7 815.8
Total Liabilities 8,393.3 8,423.0 6,445.0
- - -
Common stock 1,400.6 1,400.6 1,400.6
Additional paid-in capital 2,647.4 2,647.4 2,977.0
Retained earnings 2,719.4 2,280.7 2,366.2
Treasury share 0.0 0.0 0.0
Other equity items (164.6) (152.5) (116.5)
Shareholders' equity 6,602.8 6,176.2 6,627.3
1Q20資產負債表
9
10
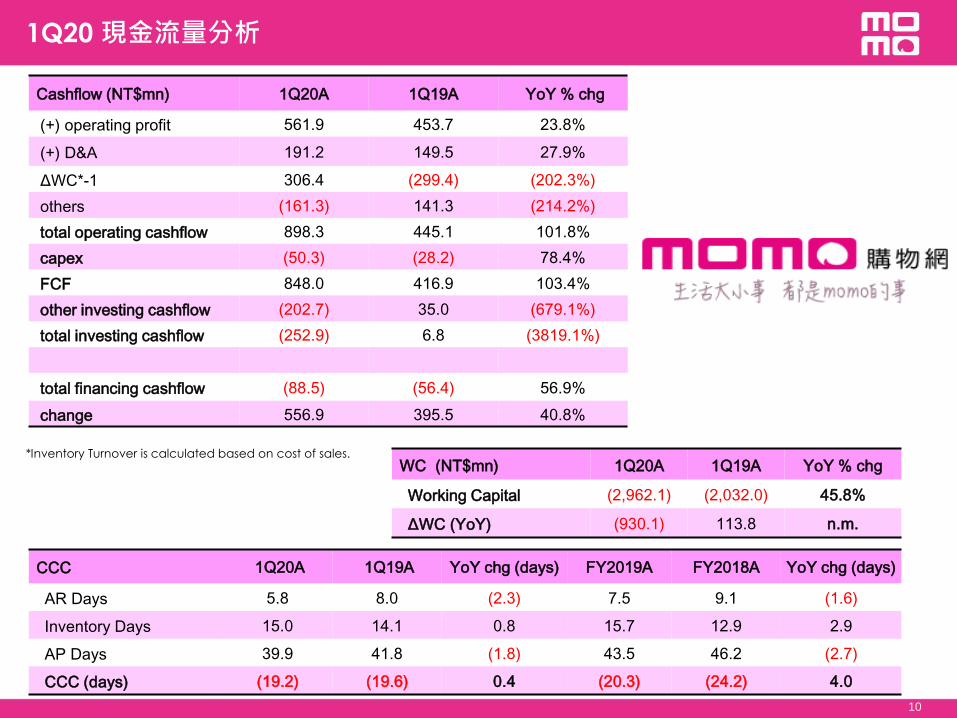
1Q20 現金流量分析
Cashflow (NT$mn) 1Q20A 1Q19A YoY % chg
(+) operating profit 561.9 453.7 23.8%
(+) D&A 191.2 149.5 27.9%
ΔWC*-1 306.4 (299.4) (202.3%)
others (161.3) 141.3 (214.2%)
total operating cashflow 898.3 445.1 101.8%
capex (50.3) (28.2) 78.4%
FCF 848.0 416.9 103.4%
other investing cashflow (202.7) 35.0 (679.1%)
total investing cashflow (252.9) 6.8 (3819.1%)
total financing cashflow (88.5) (56.4) 56.9%
change 556.9 395.5 40.8%
WC (NT$mn) 1Q20A 1Q19A YoY % chg
Working Capital (2,962.1) (2,032.0) 45.8%
ΔWC (YoY) (930.1) 113.8 n.m.
CCC 1Q20A 1Q19A YoY chg (days) FY2019A FY2018A YoY chg (days)
AR Days 5.8 8.0 (2.3) 7.5 9.1 (1.6)
Inventory Days 15.0 14.1 0.8 15.7 12.9 2.9
AP Days 39.9 41.8 (1.8) 43.5 46.2 (2.7)
CCC (days) (19.2) (19.6) 0.4 (20.3) (24.2) 4.0
*Inventory Turnover is calculated based on cost of sales.
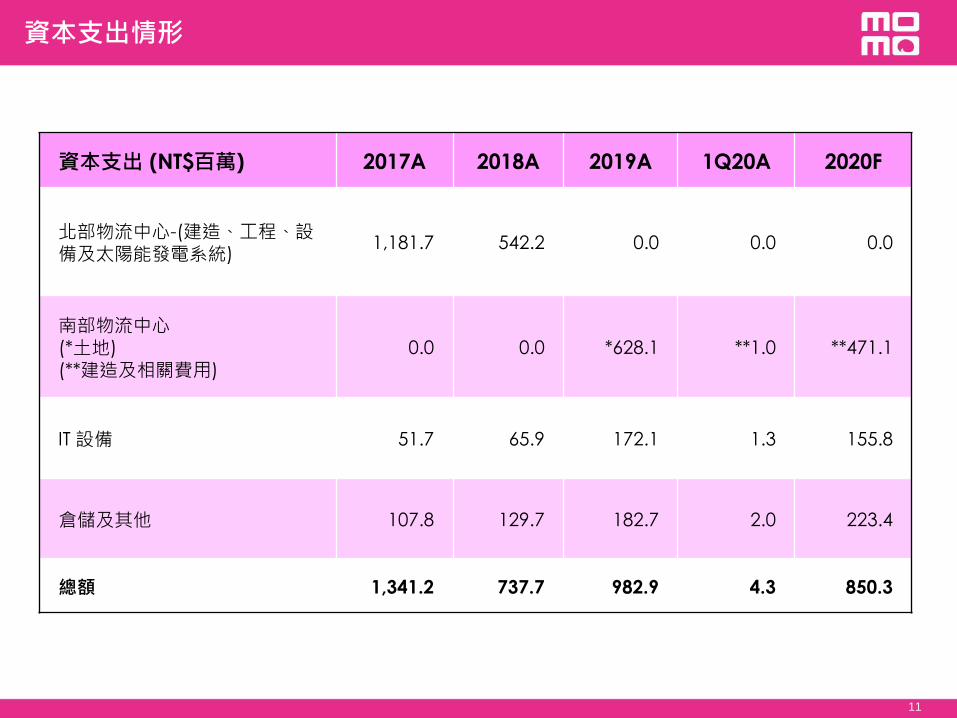
資本支出情形
11
資本支出 (NT$百萬) 2017A 2018A 2019A 1Q20A 2020F
北部物流中心-(建造、工程、設備及太陽能發電系統)
1,181.7 542.2 0.0 0.0 0.0
南部物流中心 (*土地) (**建造及相關費用)
0.0 0.0 *628.1 **1.0 **471.1
IT 設備 51.7 65.9 172.1 1.3 155.8
倉儲及其他 107.8 129.7 182.7 2.0 223.4
總額 1,341.2 737.7 982.9 4.3 850.3
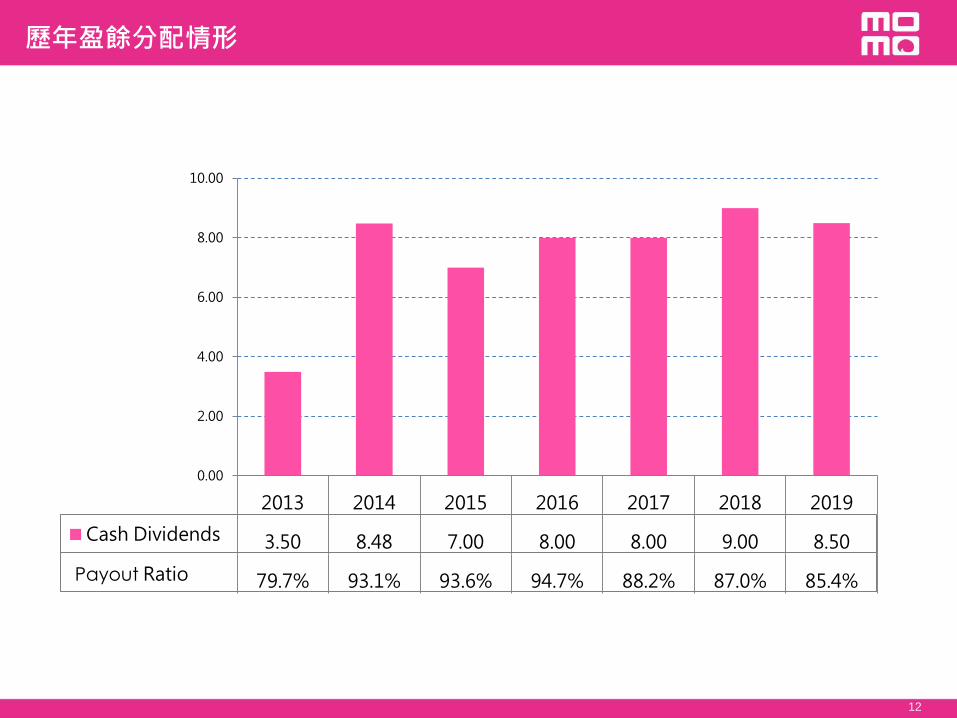
0.00
2.00
4.00
6.00
8.00
10.00
2013 2014 2015 2016 2017 2018 2019
3.50 8.48 7.00 8.00 8.00 9.00 8.50
79.7% 93.1% 93.6% 94.7% 88.2% 87.0% 85.4%
Cash Dividends
Payout Ratio
12
歷年盈餘分配情形
13
議程
1Q20 財務資訊
營運近況
-電子商務
-電視及型錄
-倉儲及物流
Q&A
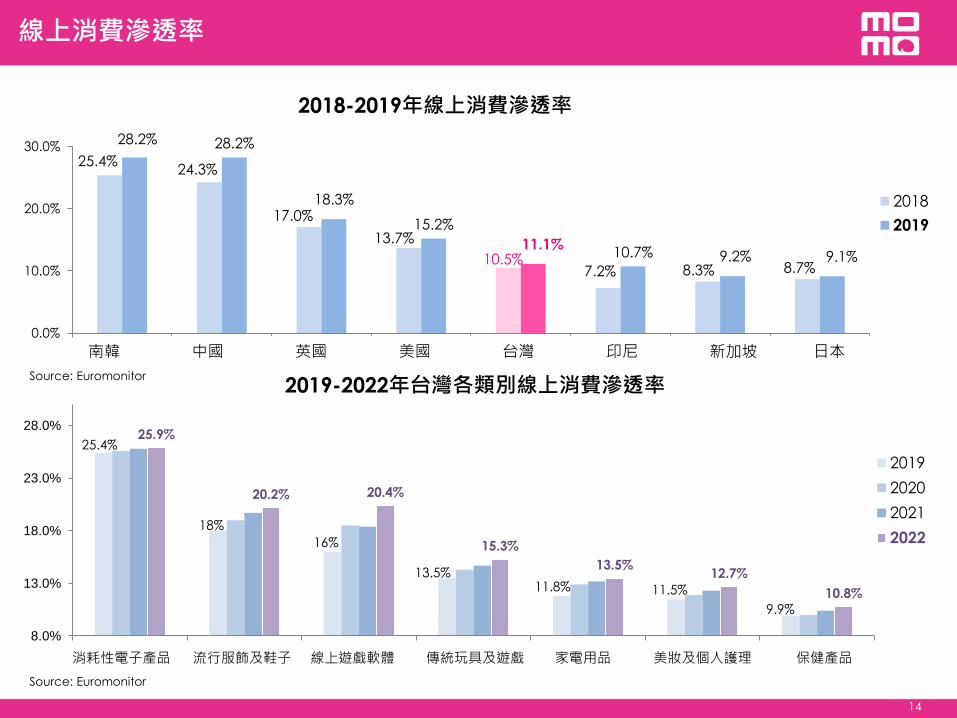
25.4% 24.3%
17.0%
13.7%
10.5% 7.2% 8.3% 8.7%
28.2% 28.2%
18.3%
15.2%
11.1% 10.7% 9.2% 9.1%
0.0%
10.0%
20.0%
30.0%
South Korea China United
Kingdom
USA Taiwan Indonesia Singapore Japan
2018-2019年線上消費滲透率
2018
2019
南韓 中國 英國 美國 台灣 印尼 新加坡 日本
25.4%
18%
16%
13.5% 11.8% 11.5%
9.9%
25.9%
20.2% 20.4%
15.3%
13.5% 12.7%
10.8%
8.0%
13.0%
18.0%
23.0%
28.0%
Consumer
Electronics
Apparel and
Footwear
Video Games
Hardware
Traditional Toys
and Games
Consumer
Appliances
Beauty and
Personal Care
Consumer Health
2019-2022年台灣各類別線上消費滲透率
2019
2020
2021
2022
14
Source: Euromonitor
線上消費滲透率
消耗性電子產品 流行服飾及鞋子 線上遊戲軟體 傳統玩具及遊戲 家電用品 美妝及個人護理 保健產品
Source: Euromonitor
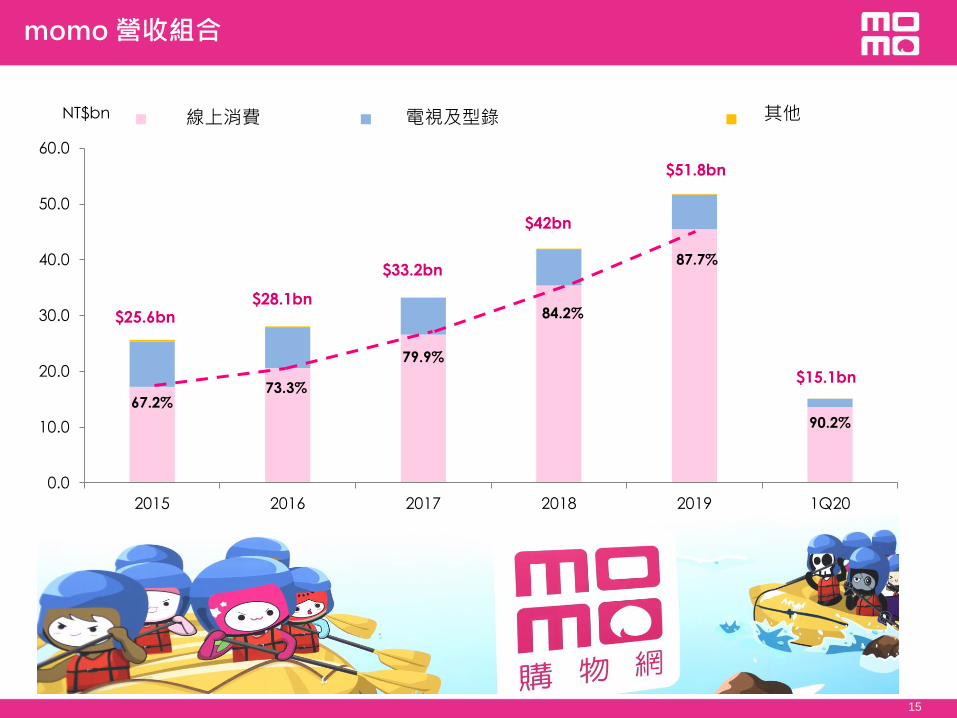
67.2% 73.3%
79.9%
84.2%
87.7%
90.2%
0.0
10.0
20.0
30.0
40.0
50.0
60.0
2015 2016 2017 2018 2019 1Q20
Online shopping TV home shopping & catalogue Others
15
momo 營收組合
線上消費 電視及型錄 其他 NT$bn
$25.6bn $28.1bn
$33.2bn
$42bn
$51.8bn
$15.1bn
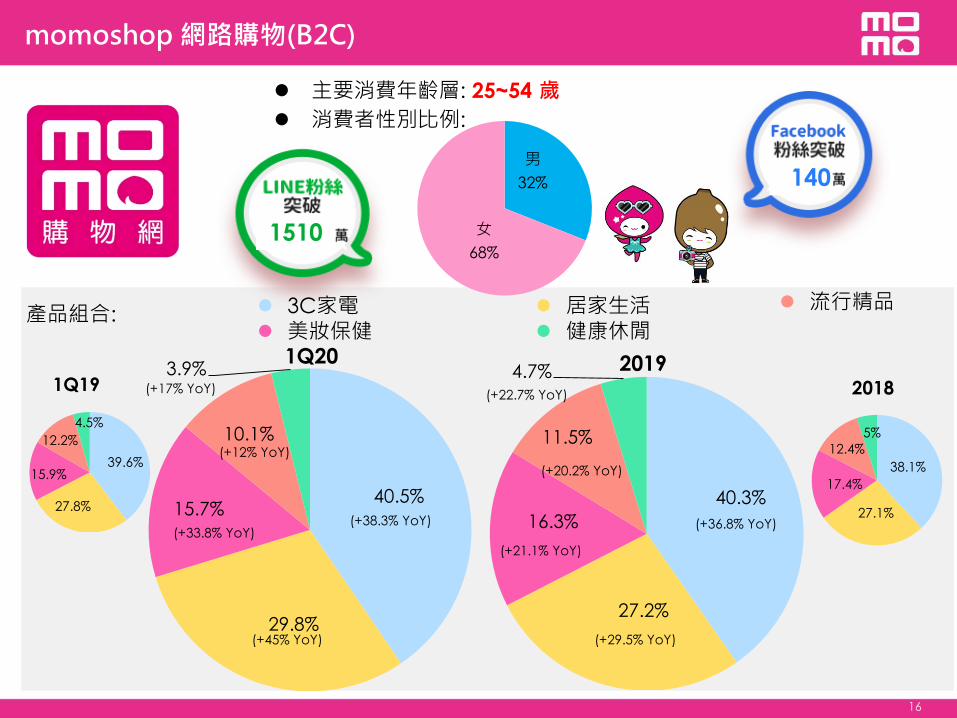
40.5%
29.8%
15.7%
10.1%
3.9%
40.3%
27.2%
16.3%
11.5%
4.7%
男
32%
女
68%
2018
2019 1Q19
1Q20
產品組合:
16
(+17% YoY)
(+12% YoY)
(+33.8% YoY)
(+45% YoY)
(+38.3% YoY)
(+20.2% YoY)
(+22.7% YoY)
(+21.1% YoY)
(+29.5% YoY)
(+36.8% YoY)
38.1%
27.1%
17.4%
12.4%
5%
39.6%
27.8%
12.2%
15.9%
4.5%
momoshop 網路購物(B2C)
1510
主要消費年齡層: 25~54 歲
消費者性別比例:
140
3C家電
美妝保健
居家生活
健康休閒
流行精品
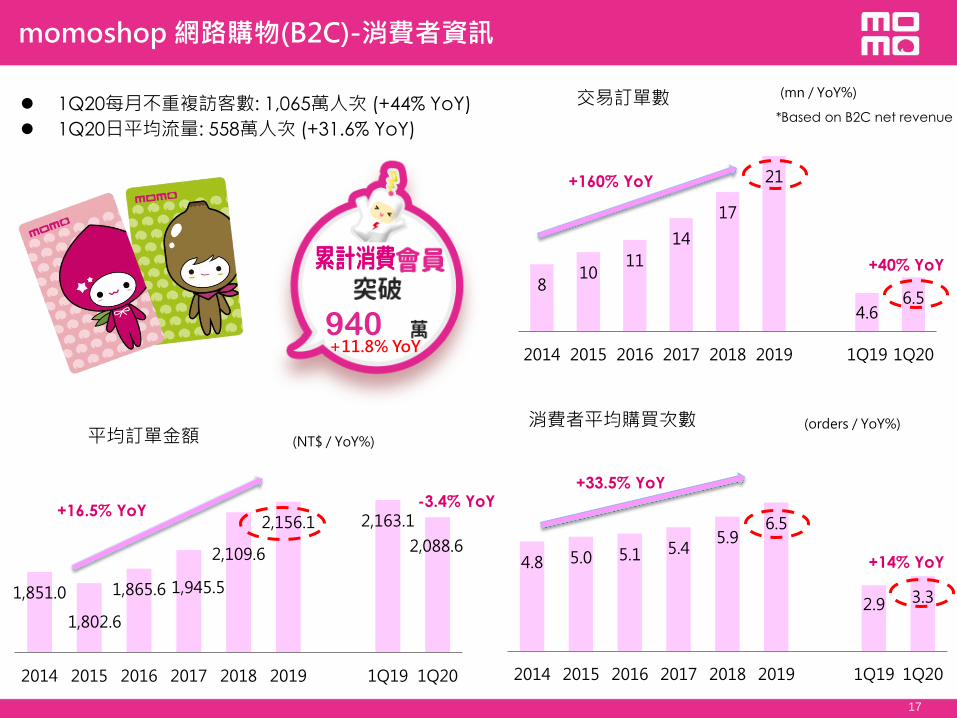
4.8 5.0 5.1 5.4 5.9
6.5
2.9 3.3
2014 2015 2016 2017 2018 2019 1Q19 1Q20
消費者平均購買次數 (orders / YoY%)
1,851.0
1,802.6
1,865.6 1,945.5
2,109.6
2,156.1 2,163.1
2,088.6
2014 2015 2016 2017 2018 2019 1Q19 1Q20
平均訂單金額 (NT$ / YoY%)
8 10
11
14
17
21
4.6 6.5
2014 2015 2016 2017 2018 2019 1Q19 1Q20
交易訂單數 1Q20每月不重複訪客數: 1,065萬人次 (+44% YoY)
1Q20日平均流量: 558萬人次 (+31.6% YoY) *Based on B2C net revenue
17
+40% YoY
+14% YoY
+160% YoY
(mn / YoY%)
+16.5% YoY
+33.5% YoY
-3.4% YoY
momoshop 網路購物(B2C)-消費者資訊
940 +11.8% YoY
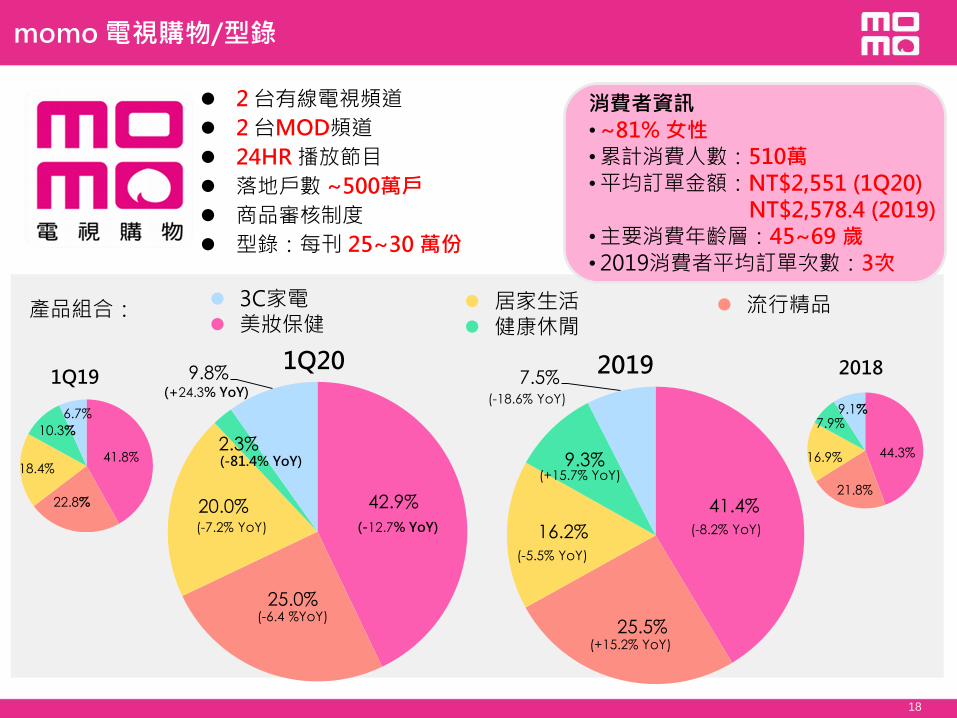
42.9%
25.0%
20.0%
2.3%
9.8% 1Q19
產品組合:
18
2018
41.8%
22.8%
18.4%
10.3%
6.7%
(+24.3% YoY)
(-81.4% YoY)
(-7.2% YoY) (-12.7% YoY)
(-6.4 %YoY)
1Q20
41.4%
25.5%
16.2%
9.3%
7.5% 2019
(-18.6% YoY)
(+15.7% YoY)
(-5.5% YoY)
(+15.2% YoY)
(-8.2% YoY)
7.9%
21.8%
9.1%
44.3% 16.9%
2 台有線電視頻道
2 台MOD頻道
24HR 播放節目
落地戶數 ~500萬戶
商品審核制度
型錄:每刊 25~30 萬份
消費者資訊
•~81% 女性 •累計消費人數:510萬
•平均訂單金額:NT$2,551 (1Q20)
NT$2,578.4 (2019) •主要消費年齡層:45~69 歲
• 2019消費者平均訂單次數:3次
3C家電 美妝保健
居家生活 健康休閒
流行精品
momo 電視購物/型錄
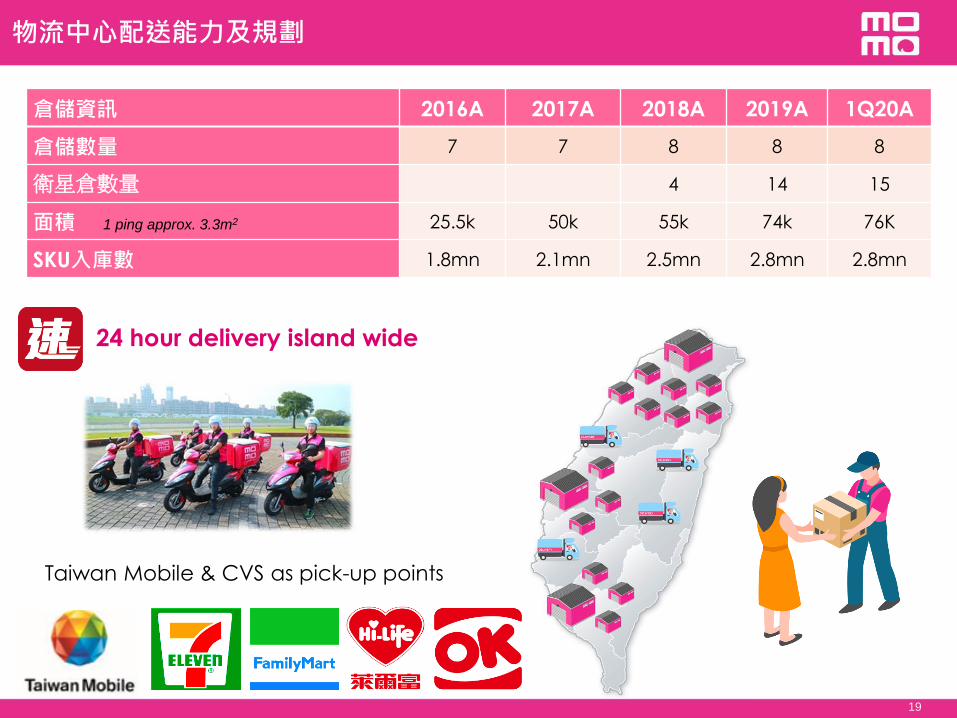
倉儲資訊 2016A 2017A 2018A 2019A 1Q20A
倉儲數量 7 7 8 8 8
衛星倉數量 4 14 15
面積 25.5k 50k 55k 74k 76K
SKU入庫數 1.8mn 2.1mn 2.5mn 2.8mn 2.8mn
1 ping approx. 3.3m2
Taiwan Mobile & CVS as pick-up points
24 hour delivery island wide
19
物流中心配送能力及規劃
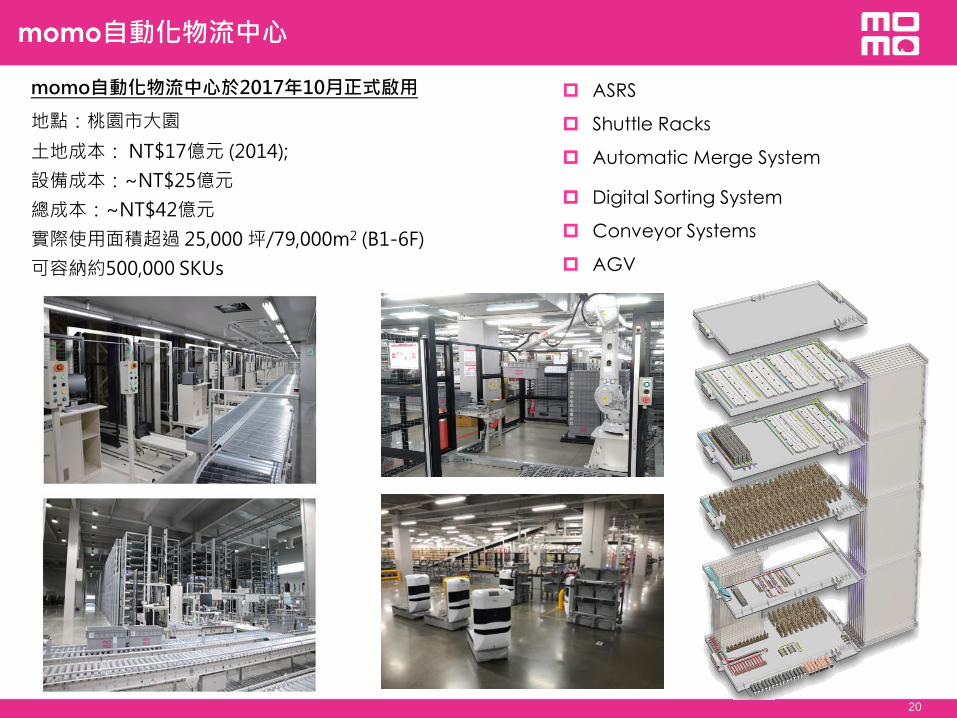
momo自動化物流中心
20
momo自動化物流中心於2017年10月正式啟用
地點:桃園市大園
土地成本: NT$17億元 (2014);
設備成本:~NT$25億元
總成本:~NT$42億元
實際使用面積超過 25,000 坪/79,000m2 (B1-6F)
可容納約500,000 SKUs
ASRS
Shuttle Racks
Automatic Merge System
Digital Sorting System
Conveyor Systems
AGV
21
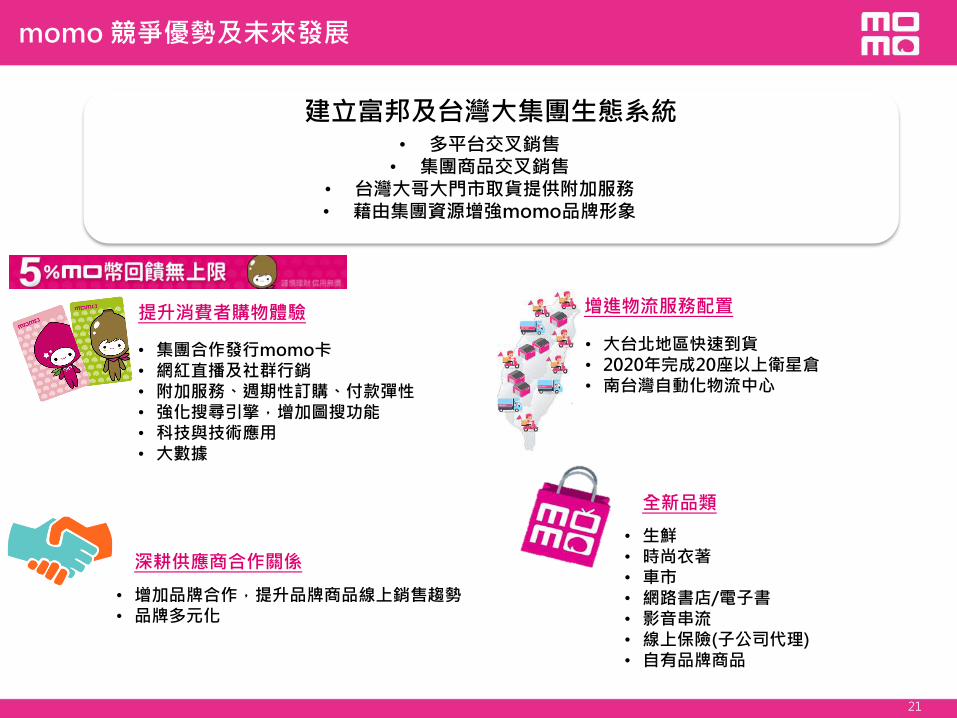
momo 競爭優勢及未來發展
建立富邦及台灣大集團生態系統 • 多平台交叉銷售 • 集團商品交叉銷售
• 台灣大哥大門市取貨提供附加服務 • 藉由集團資源增強momo品牌形象
提升消費者購物體驗
• 集團合作發行momo卡 • 網紅直播及社群行銷 • 附加服務、週期性訂購、付款彈性 • 強化搜尋引擎,增加圖搜功能 • 科技與技術應用 • 大數據
增進物流服務配置
• 大台北地區快速到貨 • 2020年完成20座以上衛星倉 • 南台灣自動化物流中心
深耕供應商合作關係
• 增加品牌合作,提升品牌商品線上銷售趨勢 • 品牌多元化
全新品類
• 生鮮 • 時尚衣著 • 車市 • 網路書店/電子書 • 影音串流 • 線上保險(子公司代理) • 自有品牌商品

22
• 連續3年獲「公司治理評鑑」名列 Top 5% (第3-5屆, 2016-2018)
• 獲得「臺北市績優健康職場」第四名
• 獲得台灣永續能源研究基金會
2017年台灣企業永續獎-企業永續報告類-服務業組-金獎
• 2017年度企業社會責任報告書獲國際認證機構BSI授證
• 榮獲經濟部「第四屆潛力中堅企業」認證
• 《經理人雜誌》 2018年度台灣MVP經理人 團隊 富邦媒體科技 網路處
• 《天下雜誌》「服務業二千大企業調查-電子商務類」第一名
獎項與肯定
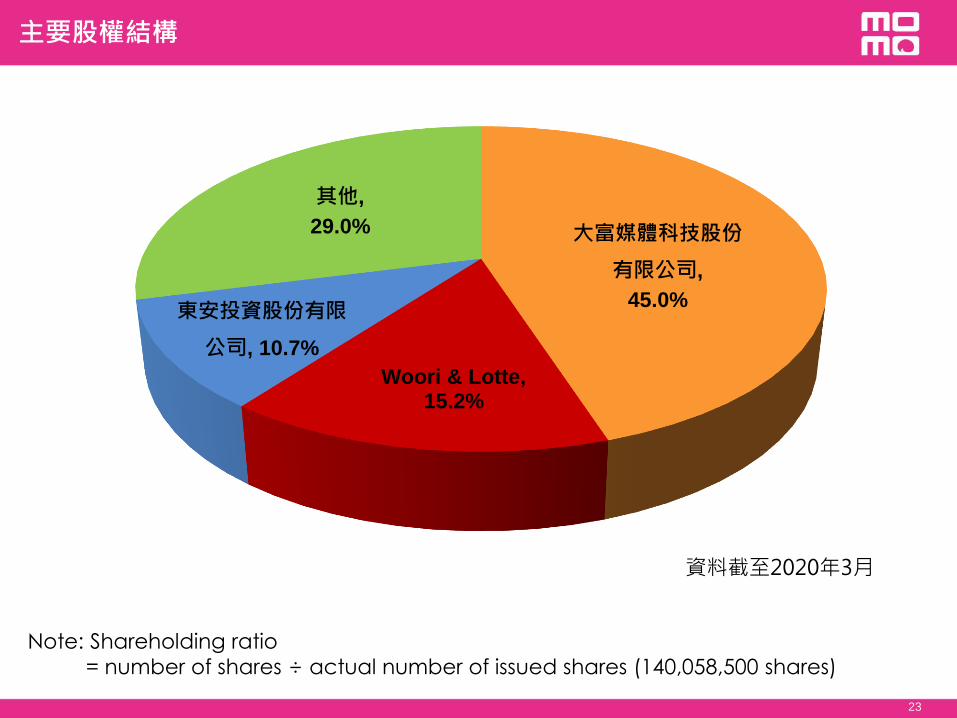
大富媒體科技股份
有限公司,
45.0%
Woori & Lotte, 15.2%
東安投資股份有限
公司, 10.7%
其他,
29.0%
主要股權結構
資料截至2020年3月
Note: Shareholding ratio
= number of shares ÷ actual number of issued shares (140,058,500 shares)
23
議程
24
1Q20 財務資訊
營運近況
-電子商務
-電視及型錄
-倉儲及物流
Q&A

Q&A
25
Top Related