Zeppelin-led study on the onset of new particle formation ...
15
Atmos. Chem. Phys., 21, 12649–12663, 2021 https://doi.org/10.5194/acp-21-12649-2021 © Author(s) 2021. This work is distributed under the Creative Commons Attribution 4.0 License. Zeppelin-led study on the onset of new particle formation in the planetary boundary layer Janne Lampilahti 1 , Hanna E. Manninen 2 , Tuomo Nieminen 1 , Sander Mirme 3 , Mikael Ehn 1 , Iida Pullinen 4 , Katri Leino 1 , Siegfried Schobesberger 1,4 , Juha Kangasluoma 1 , Jenni Kontkanen 1 , Emma Järvinen 5 , Riikka Väänänen 1 , Taina Yli-Juuti 4 , Radovan Krejci 6 , Katrianne Lehtipalo 1,7 , Janne Levula 1 , Aadu Mirme 3 , Stefano Decesari 8 , Ralf Tillmann 9 , Douglas R. Worsnop 1,4,10 , Franz Rohrer 9 , Astrid Kiendler-Scharr 9 , Tuukka Petäjä 1,11 , Veli-Matti Kerminen 1 , Thomas F. Mentel 9 , and Markku Kulmala 1,11,12 1 Institute for Atmospheric and Earth System Research/Physics, Faculty of Science, University of Helsinki, Helsinki, Finland 2 CERN, 1211 Geneva, Switzerland 3 Institute of Physics, University of Tartu, Tartu, Estonia 4 Department of Applied Physics, University of Eastern Finland, Kuopio, Finland 5 National Center for Atmospheric Research, Boulder, CO, USA 6 Department of Environmental Science and Bolin Centre for Climate research, Stockholm University, Stockholm, Sweden 7 Finnish Meteorological Institute, Helsinki, Finland 8 Istituto di Scienze dell’Atmosfera e del Clima, CNR, Bologna, Italy 9 Institute for Energy and Climate Research, IEK-8, Forschungszentrum Jülich GmbH, Jülich, Germany 10 Aerodyne Research Inc, Billerica, MA, USA 11 Joint International Research Laboratory of Atmospheric and Earth System Sciences, Nanjing University, Nanjing, China 12 Aerosol and Haze Laboratory, Beijing Advanced Innovation Center for Soft Matter Science and Engineering, Beijing University of Chemical Technology, Beijing, China Correspondence: Janne Lampilahti (janne.lampilahti@helsinki.fi) Received: 2 April 2021 – Discussion started: 16 April 2021 Revised: 14 July 2021 – Accepted: 16 July 2021 – Published: 26 August 2021 Abstract. We compared observations of aerosol particle for- mation and growth in different parts of the planetary bound- ary layer at two different environments that have frequent new particle formation (NPF) events. In summer 2012 we had a campaign in Po Valley, Italy (urban background), and in spring 2013 a similar campaign took place in Hyytiälä, Finland (rural background). Our study consists of three case studies of airborne and ground-based measurements of ion and particle size distribution from ∼ 1 nm. The airborne measurements were performed using a Zeppelin inside the boundary layer up to 1000 m altitude. Our observations show the onset of regional NPF and the subsequent growth of the aerosol particles happening almost uniformly inside the mixed layer (ML) in both locations. However, in Hyytiälä we noticed local enhancement in the intensity of NPF caused by mesoscale boundary layer (BL) dynamics. Additionally, our observations indicate that in Hyytiälä NPF was probably also taking place above the ML. In Po Valley we observed NPF that was limited to a specific air mass. 1 Introduction The boundary layer (BL) is the lowest layer of the earth’s atmosphere (Stull, 1988). The BL is an interface control- ling the exchange of mass and energy between atmosphere and surface. Ground-based measurements are often used as representative observations for the whole BL. However, they cannot cover vertical internal variability of BL, and this can be addressed only by airborne observations. Figure 1 show the typical BL evolution over land during the time span of 1 d. Shortly after sunrise, convective mix- ing creates a mixed layer (ML) that rapidly grows during the morning by entraining air from above and can reach an alti- Published by Copernicus Publications on behalf of the European Geosciences Union.
Transcript of Zeppelin-led study on the onset of new particle formation ...
Atmos. Chem. Phys., 21, 12649–12663, 2021https://doi.org/10.5194/acp-21-12649-2021© Author(s) 2021. This work is distributed underthe Creative Commons Attribution 4.0 License.
Zeppelin-led study on the onset of new particle formation in theplanetary boundary layerJanne Lampilahti1, Hanna E. Manninen2, Tuomo Nieminen1, Sander Mirme3, Mikael Ehn1, Iida Pullinen4,Katri Leino1, Siegfried Schobesberger1,4, Juha Kangasluoma1, Jenni Kontkanen1, Emma Järvinen5,Riikka Väänänen1, Taina Yli-Juuti4, Radovan Krejci6, Katrianne Lehtipalo1,7, Janne Levula1, Aadu Mirme3,Stefano Decesari8, Ralf Tillmann9, Douglas R. Worsnop1,4,10, Franz Rohrer9, Astrid Kiendler-Scharr9,Tuukka Petäjä1,11, Veli-Matti Kerminen1, Thomas F. Mentel9, and Markku Kulmala1,11,12
1Institute for Atmospheric and Earth System Research/Physics, Faculty of Science, University of Helsinki, Helsinki, Finland2CERN, 1211 Geneva, Switzerland3Institute of Physics, University of Tartu, Tartu, Estonia4Department of Applied Physics, University of Eastern Finland, Kuopio, Finland5National Center for Atmospheric Research, Boulder, CO, USA6Department of Environmental Science and Bolin Centre for Climate research, Stockholm University, Stockholm, Sweden7Finnish Meteorological Institute, Helsinki, Finland8Istituto di Scienze dell’Atmosfera e del Clima, CNR, Bologna, Italy9Institute for Energy and Climate Research, IEK-8, Forschungszentrum Jülich GmbH, Jülich, Germany10Aerodyne Research Inc, Billerica, MA, USA11Joint International Research Laboratory of Atmospheric and Earth System Sciences, Nanjing University, Nanjing, China12Aerosol and Haze Laboratory, Beijing Advanced Innovation Center for Soft Matter Science and Engineering,Beijing University of Chemical Technology, Beijing, China
Correspondence: Janne Lampilahti ([email protected])
Received: 2 April 2021 – Discussion started: 16 April 2021Revised: 14 July 2021 – Accepted: 16 July 2021 – Published: 26 August 2021
Abstract. We compared observations of aerosol particle for-mation and growth in different parts of the planetary bound-ary layer at two different environments that have frequentnew particle formation (NPF) events. In summer 2012 wehad a campaign in Po Valley, Italy (urban background), andin spring 2013 a similar campaign took place in Hyytiälä,Finland (rural background). Our study consists of three casestudies of airborne and ground-based measurements of ionand particle size distribution from ∼ 1 nm. The airbornemeasurements were performed using a Zeppelin inside theboundary layer up to 1000 m altitude. Our observations showthe onset of regional NPF and the subsequent growth ofthe aerosol particles happening almost uniformly inside themixed layer (ML) in both locations. However, in Hyytiälä wenoticed local enhancement in the intensity of NPF caused bymesoscale boundary layer (BL) dynamics. Additionally, ourobservations indicate that in Hyytiälä NPF was probably also
taking place above the ML. In Po Valley we observed NPFthat was limited to a specific air mass.
1 Introduction
The boundary layer (BL) is the lowest layer of the earth’satmosphere (Stull, 1988). The BL is an interface control-ling the exchange of mass and energy between atmosphereand surface. Ground-based measurements are often used asrepresentative observations for the whole BL. However, theycannot cover vertical internal variability of BL, and this canbe addressed only by airborne observations.
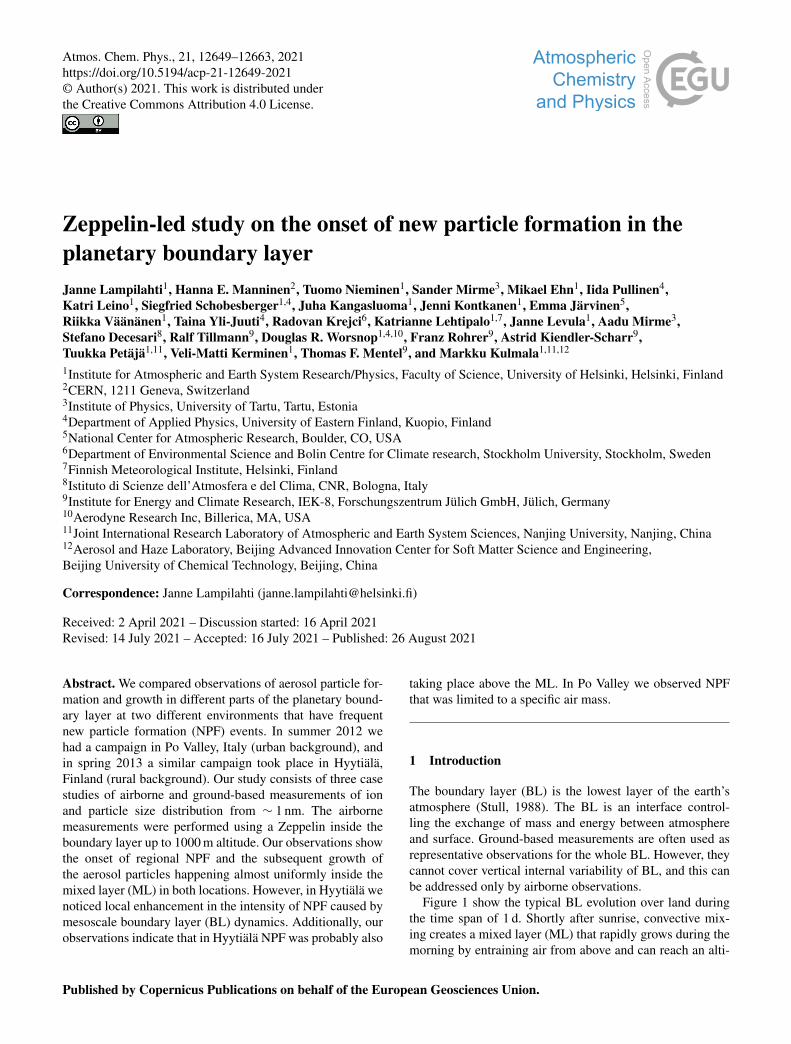
Figure 1 show the typical BL evolution over land duringthe time span of 1 d. Shortly after sunrise, convective mix-ing creates a mixed layer (ML) that rapidly grows during themorning by entraining air from above and can reach an alti-
Published by Copernicus Publications on behalf of the European Geosciences Union.
12650 J. Lampilahti et al.: Zeppelin-led study on the onset of new particle formation
Figure 1. A schematic diagram of different atmospheric layers inthe lower troposphere and their development during the morninghours. A generic Zeppelin measurement profile (dashed gray line)is displayed on top. The figure is adapted from Stull (1988).
tude of ∼ 1–2 km above the surface. The ML is capped by astable layer at the top. Above the BL is the free troposphere(FT), which is decoupled from the surface. Here we defineBL to mean all the layers below the FT. Around sunset, con-vective mixing and turbulence diminishes, and the ML be-comes what is known as the residual layer (RL). During thenight a stable boundary layer develops due to interaction withthe ground surface. This layer has only weak intermittent tur-bulence, and it smoothly blends into the RL.
We studied where new particle formation (NPF) occursin the BL and how it relates to BL evolution, comparingtwo different environments. NPF refers to the formation ofnanometer-sized clusters from low-volatility vapors presentin the atmosphere and their subsequent growth to largeraerosol particles (Kulmala et al., 2013). Understanding NPFbetter is of major interest, since it is a dominant source ofcloud condensation nuclei in the atmosphere and thereforecan have important indirect effects on climate (Dunne et al.,2016; Gordon et al., 2017; Pierce and Adams, 2009; Yu andLuo, 2009).
Nilsson et al. (2001) studied NPF in a boreal forest envi-ronment and observed that in addition to increased solar ra-diation the onset of turbulence appears to be a necessary trig-ger for NPF. Several explanations for this connection wereproposed: NPF might be starting in the RL or at the top ofthe shallow ML, from where the aerosol particles are mixedto the surface as the ML starts to grow. NPF starts in theML due to dilution of pre-existing aerosol and drop in vaporsink. Convective mixing brings different precursor gases, onepresent in the RL and the other in the ML, into contact witheach other, initiating NPF inside the ML.
Airborne measurements of nanoparticles from differentenvironments show that NPF occurs in many parts of theBL. Multiple observations from central Europe suggest thataerosol particles are formed on top of a shallow ML (Platiset al., 2015; Siebert et al., 2004; Chen et al., 2018) or insidethe RL (Stratmann et al., 2003; Wehner et al., 2010). Otherresults come from a boreal forest environment in southernFinland. Lampilahti et al. (2021a) showed evidence that NPFmay occur in the interface between the RL and the FT.O’Dowd et al. (2009) observed the first signs of NPF in thesurface ML, and Leino et al. (2019) showed that sub-3 nmparticles have a higher concentration close to the surface.Laakso et al. (2007) performed hot-air balloon measurementsand concluded that NPF either took place throughout the MLor in the lower part of the ML. Measurements by Schobes-berger et al. (2013) suggested that NPF was more intense inthe top parts of a developed ML. More measurements areneeded in order to understand these mixed results.
Here we present NPF measurements on board a Zeppelinairship carried out during the EU-supported PEGASOS (Pan-European Gas-AeroSOls climate interaction Study) project.The Zeppelin flights were used to observe radicals, tracegases and aerosol particles inside the lower troposphere overEurope in several locations during 2012–2013.
By using a Zeppelin NT (Neue Technologie) airship, wewere able to sample up to 1000 m above sea level (a.s.l.).The high payload capacity of the Zeppelin enabled us tocarry state-of-the-art instrumentation, specifically designedto collect information on the feedback processes betweenthe chemical compounds and the smallest aerosol particlesto better estimate their role in climate and air quality.
The NPF focused campaigns presented here were per-formed in Po Valley, Italy, and Hyytiälä, Finland. At both lo-cations NPF events happen frequently. Po Valley representsurban background conditions where anthropogenic emis-sions are an important source of gaseous precursors for NPF(e.g. Kontkanen et al., 2016). Hyytiälä represents rural back-ground conditions where organic vapors from the surround-ing forests play a major role in NPF (e.g. Dada et al., 2017).
Here we combine comprehensive ground-based and air-borne measurements from the Zeppelin to investigate twoNPF cases from Po Valley and one case from Hyytiälä. TheZeppelin allowed us to repeatedly profile the lowest 1 km ofthe atmosphere, providing a full picture of what is happeningin the BL during the onset of NPF. We will show in whichpart or parts of the BL the onset of NPF and the subsequentparticle growth occurred at the two measurement sites as wellas determine formation and growth rates for the aerosol par-ticles.
2 Methods
The two ground-based measurement sites that were stud-ied here were San Pietro Capofiume in Po Valley, Italy, and
Atmos. Chem. Phys., 21, 12649–12663, 2021 https://doi.org/10.5194/acp-21-12649-2021
J. Lampilahti et al.: Zeppelin-led study on the onset of new particle formation 12651
Hyytiälä in southern Finland. The vertical measurement pro-files analyzed in this study were performed in a close prox-imity to the ground-based measurement sites. All times inthis paper are given in UTC time unless stated otherwise.
2.1 San Pietro Capofiume, Italy
San Pietro Capofiume (SPC; 44◦39′ N, 11◦37′ E; 11 m a.s.l.)is located in the eastern part of Po Valley, Italy, between thecities of Bologna and Ferrara. Po Valley is considered a pol-lution hot spot, although the station itself is surrounded byvast agricultural fields away from point sources. Thus theaerosol concentration and composition at SPC reflect the PoValley regional background. NPF is frequently observed inSPC (36 % of days) with maxima in May and July (Hamedet al., 2007; Laaksonen et al., 2005).
The instruments measuring the aerosol particle numbersize distribution were a scanning mobility particle sizer(SMPS, 10–700 nm, 5 min time resolution; Wiedensohleret al., 2012) and a neutral cluster and air ion spectrom-eter (NAIS, particles: ∼ 2–40 nm, ions: 0.8–40 nm, 4 mintime resolution; Mirme and Mirme, 2013). We used theNAIS’s positive polarity for the particle number size distri-bution data. The ML height was determined from ceilome-ter (Lufft CHM 15k) measurements. Basic meteorology andSO2 gas concentration data (Thermo 43iTLE monitor) werealso available at surface level (2–3 m above ground level).
2.2 Hyytiälä, Finland
In Finland the ground-based measurements were performedat the SMEAR II (Station for Measuring Forest Ecosystem–Atmosphere Relations II) station located in Hyytiälä, Finland(HTL; 61◦51′ N, 24◦17′ E; 181 m a.s.l.; Hari and Kulmala,2005). The station is equipped with extensive facilities tomeasure the forest ecosystem and the atmosphere. The mea-surement site is surrounded by coniferous boreal forest.
The forest emits biogenic volatile organic compounds(Hakola et al., 2003), which can be oxidized in the atmo-sphere to form low-volatility vapors that contribute to aerosolparticle formation and growth (Ehn et al., 2014; Mohr etal., 2019). NPF is frequently observed in HTL (23 % of alldays), especially in spring and autumn (Dal Maso et al.,2005; Nieminen et al., 2014).
Aerosol particle and ion number size distributions weremeasured by the station’s differential mobility particle sizer(DMPS, 3–1000 nm, 10 min time resolution; Aalto et al.,2001) and the NAIS (Manninen et al., 2009). Sub-3 nm par-ticle number size distribution was measured by a particlesize magnifier running in scanning mode (PSM, 1.2–2.5 nm,10 min time resolution; Vanhanen et al., 2011). Also a PSMmeasured at SPC but we were not able to reliably calcu-late formation rates from the data. Basic meteorological vari-ables, radiation and SO2 were measured from the station’smast at 16.8 m above ground. In addition, a supporting NPF
forecast tool was developed to aid the planning of researchflights (Nieminen et al., 2015).
2.3 Zeppelin NT airship
A Zeppelin NT airship was used for monitoring the atmo-sphere below 1 km. The aerosol particles and trace gaseswere sampled with instrumentation installed inside the Zep-pelin’s cabin. The Zeppelin operated with three different in-strument layouts. A specific layout was chosen according tothe flight plan and scientific aim of the flight.
Here we analyzed data from measurement flights that car-ried the so-called nucleation layout. Instruments specific tothis layout were the atmospheric pressure interface time-of-flight mass spectrometer (APi-TOF; Junninen et al., 2010),used for measuring the elemental composition of naturallycharged ions, and the NAIS for particle and ion number sizedistributions. We also used the aerosol number size distribu-tion data from the SMPS (10–400 nm, 4 min time resolution)and PSM running in scanning mode, which were on boardduring all the measurement flights. The size range and timeresolution of the onboard NAIS and PSM were the same asfor the instruments in HTL (see Sect. 2.1).
During a measurement flight, the Zeppelin did multiplevertical profiles over a small area (∼ 10 km2). The profilingspot was picked typically downwind from the measurementsite in order to not compromise the ground-based measure-ments with any emissions. The vertical extent of the profileswas ∼ 100–1000 m above the ground. The airspeed duringmeasurement was∼ 20 m s−1, and the vertical speeds duringascent and descent were ∼ 0.5 and ∼ 3 m s−1, respectively.
2.4 Cessna 172 airplane
During the PEGASOS northern mission in spring 2013, aCessna 172 airplane carrying scientific instrumentation wasdeployed to measure aerosol particles, trace gases and mete-orological variables in the lower troposphere alongside theZeppelin. The measurement setup and instrumentation onboard have been described in previous studies (Lampilahtiet al., 2020b; Schobesberger et al., 2013; Leino et al., 2019;Väänänen et al., 2016)
Basic meteorological variables (temperature, pressure, rel-ative humidity) were measured on board. Particle numbersize distribution was measured using a SMPS (10–400 nmsize range, 2 min time resolution) and the number concen-tration of >3 nm particles was measured using an ultrafinecondensation particle counter (UF-CPC, TSI model 3776) at1 s time resolution. The altitude range of the airplane was∼ 100–3000 m above ground, and the measurement airspeedwas 36 m s−1.
https://doi.org/10.5194/acp-21-12649-2021 Atmos. Chem. Phys., 21, 12649–12663, 2021
12652 J. Lampilahti et al.: Zeppelin-led study on the onset of new particle formation
2.5 Flight profiles and atmospheric conditions
Our measurements focused on the time of BL developmentfrom sunrise until noon (Fig. 1). This is the time when the on-set of NPF is typically observed at the ground level. The ver-tical profile measurements represent the particle and gas con-centrations in the lower parts of the atmosphere: the mixedlayer, the residual layer and the nocturnal boundary layer.At the same time, the ground-based measurements recordedconditions in the surface layer. Here we consider the BL toinclude all the atmospheric layers below the free troposphere.
The basic conditions for the Zeppelin flights in both Italyand Finland were clear sky and low wind speed. Under theseconditions, the sun heats the surface during the morning,which drives intense vertical mixing.
2.6 Data analysis
The onset of NPF occurs when low-volatility vapors in theatmosphere form nanometer-sized clusters that continue togrow to larger aerosol particles (Kulmala et al., 2013).
We determined the onset of a NPF event visually from theinitial increase in the number concentration of intermediate(2–4 nm) air ions at the beginning of the NPF event. An in-crease in the intermediate ion concentration has been identi-fied as a good indicator for NPF (Leino et al., 2016). This isbecause an increase in the number concentration of interme-diate ions is usually due to NPF and otherwise the numberconcentration is extremely low (below 5 cm−3).
Particle growth rates (GRs), formation rates and coagula-tion sinks were calculated in different size ranges accordingto the methods described by Kulmala et al. (2012). For parti-cles and ions in the 1–2 and 2–3 nm size ranges, the GR wasdetermined from the ion number size distribution measuredby the NAIS. During NPF the number concentration in eachsize channel increased sequentially as the freshly formed par-ticles grew larger. We determined the time when the numberconcentration began to rise in each size bin by fitting a sig-moid function to the rising concentration edge and findingthe point where the sigmoid reached 75 % of its maximumvalue (appearance time method; Lehtipalo et al., 2014). Thecorresponding diameter in each size bin was the bin’s geo-metric mean diameter. Before the fitting procedure, the num-ber concentrations were averaged using a 15 min median andafter that divided by the maximum concentration value ineach size channel.
For larger particles and ions (3–7 and 7–20 nm) the GRwas determined by fitting a log-normal distribution over thegrowing nucleation mode at each time step and assigning thefitted curve’s peak value as the corresponding mode diameter.In each size range a value for the GR was obtained as theslope of a linear least squares fit to the time–diameter valuepairs.
The formation rate of 1.5 nm particles and ions was deter-mined from the PSM data and the NAIS ion data, respectively
(Kulmala et al., 2012). The formation rate of 3 nm particlesand ions was determined from the NAIS data. Coagulationsinks were calculated from the SMPS or DMPS data. Con-densation sink for sulfuric acid was calculated from the Zep-pelin’s onboard SMPS.
Sulfuric acid (SA) is a key compound in atmospheric nu-cleation (Sipilä et al., 2010). As we did not have direct mea-surements of SA concentration, we used [HSO−4 ] from theAPi-TOF measurements as a qualitative indicator of [H2SO4]and named it pseudo-SA. To determine this pseudo-SA, wesummed up all ions containing HSO−4 , e.g. the ion itselfbut also larger clusters, like (H2SO4)n ·HSO−4 . We assumedsteady-state conditions and that the concentration of SA-containing ions is much lower than the total ion concentra-tion. Under these conditions, [HSO−4 ] (including all clusterswhere this ion was present) can be considered close to a lin-ear function of [H2SO4] (Eisele and Tanner, 1991). At thehighest SA loadings, ions with HSO−4 can be a dominantfraction of the total ions (Ehn et al., 2010), in which casethe linearity no longer holds. In addition, this assumes a con-stant concentration of ions, although, for example, the sinksfor ions can vary by an increased particle concentration. Assuch, the pseudo-SA parameter should indeed only be con-sidered a qualitative indicator for SA.
In SPC the ML height was derived from the ceilometermeasurements. However, in HTL, weak scattering signal pre-vented reliable determination of ML height using the on-sitelidar. For this reason in HTL the ML height was determinedfrom vertical profiles of meteorological variables and aerosolparticle concentrations on board the Zeppelin and the Cessna172 airplane. In these profiles the top of the ML was revealedby the maximum positive gradient in potential temperatureand minimum negative gradient in humidity and total parti-cle number concentration (Stull, 1988).
The origin of the air masses was investigated using back-trajectory analysis. The trajectories were calculated with theHYSPLIT (HYbrid Single-Particle Lagrangian IntegratedTrajectory; Stein et al., 2015) model using the GDAS (GlobalData Assimilation System) archived data sets.
3 Results and discussion
3.1 Case study description
During the campaigns, there were a limited number of flightswith the nucleation instrument payload (Po Valley: 19, 27,28, 29 and 30 June 2012; Hyytiälä: 6 May, 8 May, 16 May,3 June, 8 June and 10 June 2013). Here we present a side-by-side comparison of two case studies: one from SPC(28 June 2012) and the other from HTL (8 May 2013). Onthese days the NPF event was fully captured during the Zep-pelin measurement. In addition the horizontal extent of NPFin SPC was investigated by studying the measurement flightfrom 30 June 2012.
Atmos. Chem. Phys., 21, 12649–12663, 2021 https://doi.org/10.5194/acp-21-12649-2021
J. Lampilahti et al.: Zeppelin-led study on the onset of new particle formation 12653
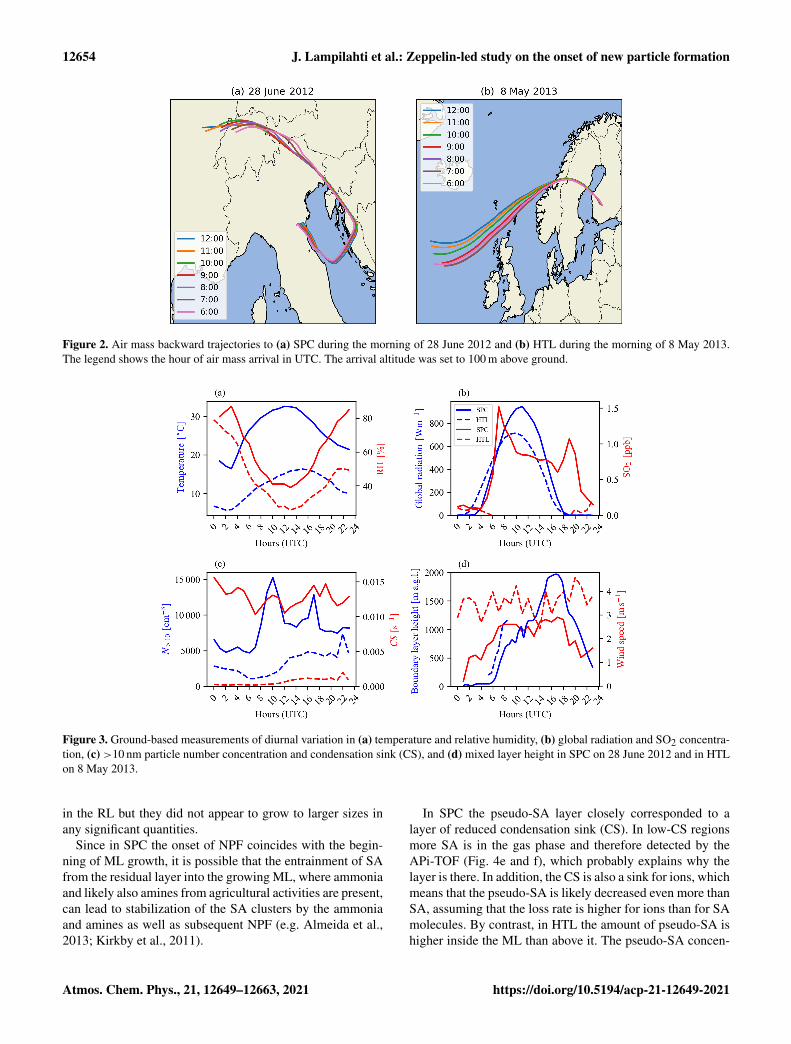
The 28 June 2012 was a hot and sunny day in Po Val-ley. The 24 h back-trajectories arriving to SPC during themorning revealed that the incoming air masses circulatedfrom central Europe and over the Adriatic Sea before arriv-ing to SPC from the southwest (Fig. 2a). Figure 3 shows thetime series for some environmental parameters on the NPFevent days from SPC and HTL. In SPC temperature and RHshowed a large diurnal variation; the temperature increasedfrom 16 to 32 ◦C during the morning while the RH decreasedfrom 87 % to 39 %. The mean wind speed at 10 m heightwas 2.0 m s−1. These meteorological conditions and air masshistories are common during NPF event days in Po Valley(Hamed et al., 2007; Sogacheva et al., 2007).
The 8 May 2013 in HTL was a sunny and warm day withclear skies marked by broad diurnal variation in temperatureand RH. During the morning the temperature increased from5 to 17 ◦C, and the RH decreased from 82 % to 25 %. Themean wind speed at 33.6 m height was 3.5 m s−1. The airmasses originated from the North Atlantic Ocean, arrivingto HTL from the northwest via Scandinavia and the Gulf ofBothnia (Fig. 2b). Most NPF event days in HTL are clear-sky days with the arriving air masses spending most of theirtime in the northwest sector (Dada et al., 2017; Nilsson et al.,2001; Sogacheva et al., 2008).
In SPC the solar radiation began to increase after 04:00and according to the ceilometer measurements the MLstarted to increase in height around 06:00, at the same timethe SO2 concentration and N>10 (number concentration ofparticles larger than 10 nm) began to increase. This is likelyexplained by the entrainment of pollutants from the RL andthe onset of NPF. CS is higher during the night and decreasesslightly during the day, which is likely due to dilution relatedto ML growth.
At HTL after sunrise the SO2 concentration and N>10 de-creased probably due to the dilution caused by the grow-ing ML coupled with the lack of pollution sources. WhileSO2 concentration remained low the whole day, N>10 andCS began to increase later during the day because of theNPF event. The average SO2, N>10 and CS in SPC were0.57 ppb, 8102 cm−3 and 0.0128 s−1, respectively. While inHTL the corresponding values were 0.02 ppb, 3293 cm−3
and 0.0007 s−1.
3.2 Onset of NPF
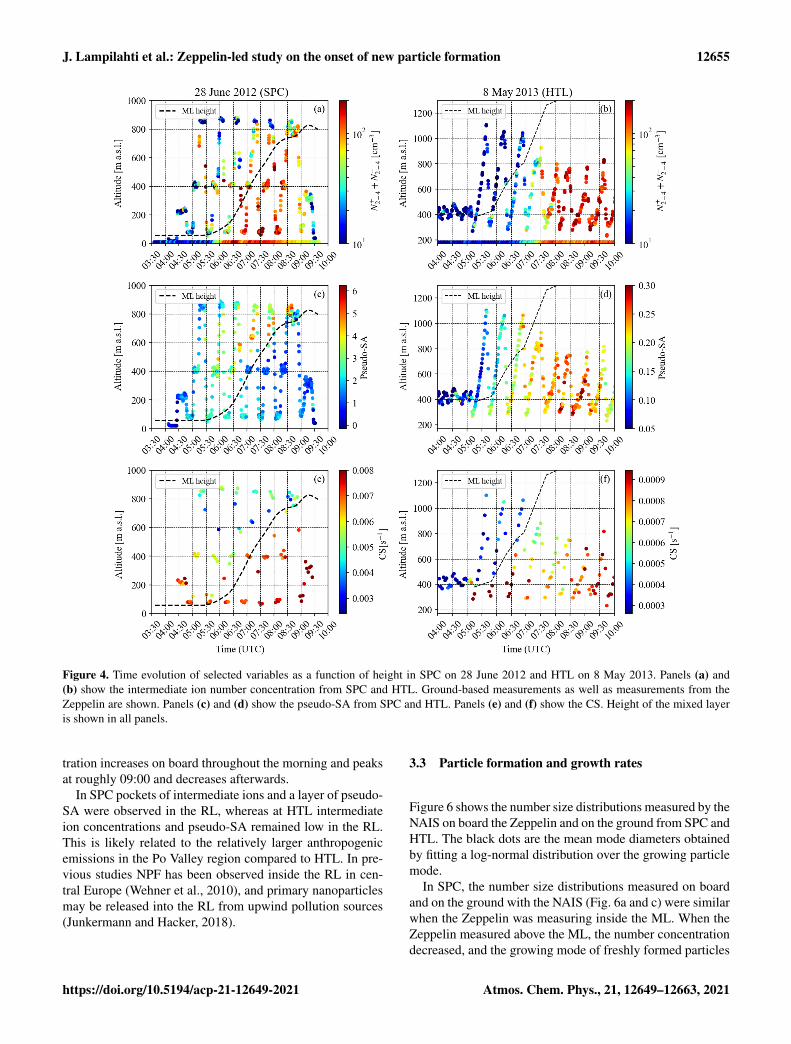
Figure 4a and b show the altitude of the Zeppelin as a func-tion of time colored by the number concentration of inter-mediate ions measured by the NAIS at SPC and HTL. Theplots also show the number concentration of intermediateions measured on the ground as well as the ML height.
In SPC, the intermediate ion concentration began to in-crease on the ground at 05:48, which coincides with the be-ginning of convective mixing and the breakup of the noctur-nal surface layer. Similarly, Kontkanen et al. (2016) observedthat in Po Valley the onset of NPF coincided with the begin-
ning of boundary layer growth. Around this time the Zep-pelin was profiling the layers above the ML. “Pockets” ofelevated intermediate ion concentration were present insidethe RL (e.g. around 700 m at 05:15). These pockets were notlinked to the NPF event inside the ML. When the Zeppelinlater entered the ML at around 06:45, NPF was already tak-ing place throughout the developing ML and seemed to beconfined to it.
In HTL, the number concentration of intermediate ions be-gan to increase at around 06:47 on the ground level. The MLat this point had grown to around 600 m above ground, whichallowed us to better resolve the onset of NPF vertically. InHTL there was no increase in intermediate ion concentration,indicating no NPF was observed above the ML on board theZeppelin. Before 06:40 there was no sign of NPF inside thegrowing ML. Between 06:40 and 07:00 the Zeppelin brieflymeasured in the RL and re-entered the ML at 07:00. At thispoint the intermediate ion concentration was already increas-ing on board similar to the ground level, indicating the onsetof NPF.
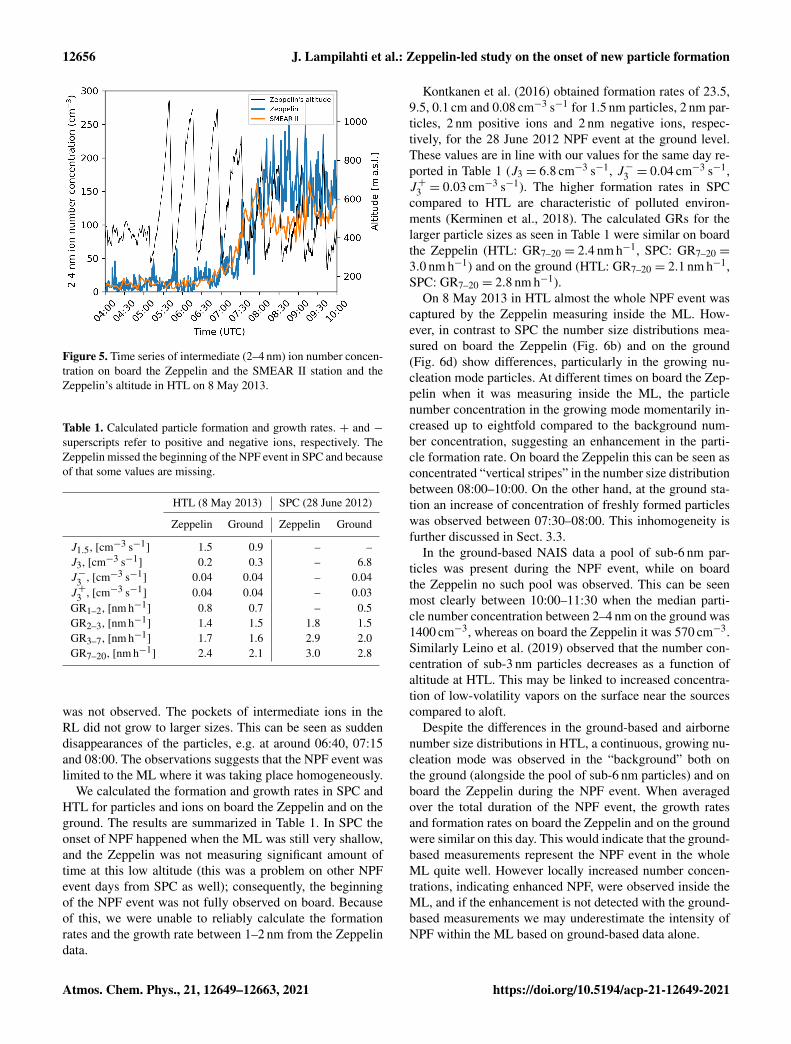
Figure 5 shows the intermediate ion number concentrationas a function of time from the Zeppelin and the SMEAR IIstation. At the beginning of the NPF event, between 07:00–07:15, the Zeppelin ascended from 300 to 800 m. Duringthe ascent the intermediate ion concentrations increased ata similar rate and stayed at similar values on board the Zep-pelin and at the ground level. The lack of vertical gradient inthe number concentration suggests that the aerosol particleswere forming homogeneously throughout the ML. However,intense turbulent mixing and strong updrafts moving up atroughly the same rate as the Zeppelin might have also re-sulted in a homogeneous number concentration, even if theaerosol particles were formed close to the surface.
Figure 4c and d show the Zeppelin’s measurement pro-files colored with the pseudo-SA. In SPC, the highest amountof pseudo-SA appears to be in the residual layer above thegrowing morning ML (also observed on 27 June 2012) af-ter sunrise. This is in line with the observation that the SO2concentration increases at the surface when the ML starts togrow (Fig. 3b), indicating that the SO2 was entrained fromthe RL. The entrainment of SO2 from the residual layer isalso supported by previous observations (Kontkanen et al.,2016). The increased pseudo-SA in the residual layer wasnot associated with NPF in the residual layer.
In SPC the nighttime SO2 concentration at the surface islow likely due to deposition (Kontkanen et al., 2016). How-ever ammonia concentration can be high (>30 µg m−3) at thesurface due to agricultural activities, and the concentrationhas been observed to peak during the night and early morn-ing (Sullivan et al., 2016). In addition oxidized VOCs are im-portant for aerosol particle growth (Ehn et al., 2014). VOCswere measured on board the Zeppelin in Po Valley in 2012,and the results showed higher VOC concentrations close toground (Jäger, 2014). This may at least partly explain whywe measured increased concentrations of intermediate ions
https://doi.org/10.5194/acp-21-12649-2021 Atmos. Chem. Phys., 21, 12649–12663, 2021
12654 J. Lampilahti et al.: Zeppelin-led study on the onset of new particle formation
Figure 2. Air mass backward trajectories to (a) SPC during the morning of 28 June 2012 and (b) HTL during the morning of 8 May 2013.The legend shows the hour of air mass arrival in UTC. The arrival altitude was set to 100 m above ground.
Figure 3. Ground-based measurements of diurnal variation in (a) temperature and relative humidity, (b) global radiation and SO2 concentra-tion, (c) >10 nm particle number concentration and condensation sink (CS), and (d) mixed layer height in SPC on 28 June 2012 and in HTLon 8 May 2013.
in the RL but they did not appear to grow to larger sizes inany significant quantities.
Since in SPC the onset of NPF coincides with the begin-ning of ML growth, it is possible that the entrainment of SAfrom the residual layer into the growing ML, where ammoniaand likely also amines from agricultural activities are present,can lead to stabilization of the SA clusters by the ammoniaand amines as well as subsequent NPF (e.g. Almeida et al.,2013; Kirkby et al., 2011).
In SPC the pseudo-SA layer closely corresponded to alayer of reduced condensation sink (CS). In low-CS regionsmore SA is in the gas phase and therefore detected by theAPi-TOF (Fig. 4e and f), which probably explains why thelayer is there. In addition, the CS is also a sink for ions, whichmeans that the pseudo-SA is likely decreased even more thanSA, assuming that the loss rate is higher for ions than for SAmolecules. By contrast, in HTL the amount of pseudo-SA ishigher inside the ML than above it. The pseudo-SA concen-
Atmos. Chem. Phys., 21, 12649–12663, 2021 https://doi.org/10.5194/acp-21-12649-2021
J. Lampilahti et al.: Zeppelin-led study on the onset of new particle formation 12655
Figure 4. Time evolution of selected variables as a function of height in SPC on 28 June 2012 and HTL on 8 May 2013. Panels (a) and(b) show the intermediate ion number concentration from SPC and HTL. Ground-based measurements as well as measurements from theZeppelin are shown. Panels (c) and (d) show the pseudo-SA from SPC and HTL. Panels (e) and (f) show the CS. Height of the mixed layeris shown in all panels.
tration increases on board throughout the morning and peaksat roughly 09:00 and decreases afterwards.
In SPC pockets of intermediate ions and a layer of pseudo-SA were observed in the RL, whereas at HTL intermediateion concentrations and pseudo-SA remained low in the RL.This is likely related to the relatively larger anthropogenicemissions in the Po Valley region compared to HTL. In pre-vious studies NPF has been observed inside the RL in cen-tral Europe (Wehner et al., 2010), and primary nanoparticlesmay be released into the RL from upwind pollution sources(Junkermann and Hacker, 2018).
3.3 Particle formation and growth rates
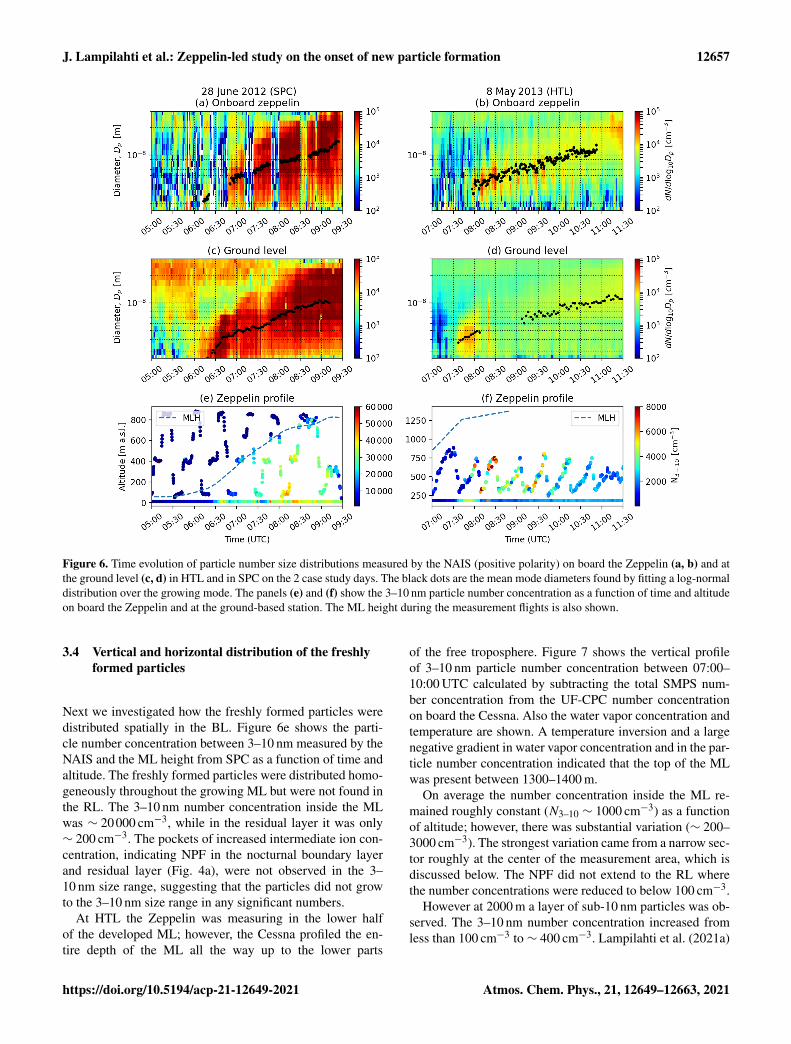
Figure 6 shows the number size distributions measured by theNAIS on board the Zeppelin and on the ground from SPC andHTL. The black dots are the mean mode diameters obtainedby fitting a log-normal distribution over the growing particlemode.
In SPC, the number size distributions measured on boardand on the ground with the NAIS (Fig. 6a and c) were similarwhen the Zeppelin was measuring inside the ML. When theZeppelin measured above the ML, the number concentrationdecreased, and the growing mode of freshly formed particles
https://doi.org/10.5194/acp-21-12649-2021 Atmos. Chem. Phys., 21, 12649–12663, 2021
12656 J. Lampilahti et al.: Zeppelin-led study on the onset of new particle formation
Figure 5. Time series of intermediate (2–4 nm) ion number concen-tration on board the Zeppelin and the SMEAR II station and theZeppelin’s altitude in HTL on 8 May 2013.
Table 1. Calculated particle formation and growth rates. + and −superscripts refer to positive and negative ions, respectively. TheZeppelin missed the beginning of the NPF event in SPC and becauseof that some values are missing.
HTL (8 May 2013) SPC (28 June 2012)
Zeppelin Ground Zeppelin Ground
J1.5, [cm−3 s−1] 1.5 0.9 – –J3, [cm−3 s−1] 0.2 0.3 – 6.8J−3 , [cm−3 s−1] 0.04 0.04 – 0.04J+3 , [cm−3 s−1] 0.04 0.04 – 0.03GR1–2, [nm h−1] 0.8 0.7 – 0.5GR2–3, [nm h−1] 1.4 1.5 1.8 1.5GR3–7, [nm h−1] 1.7 1.6 2.9 2.0GR7–20, [nm h−1] 2.4 2.1 3.0 2.8
was not observed. The pockets of intermediate ions in theRL did not grow to larger sizes. This can be seen as suddendisappearances of the particles, e.g. at around 06:40, 07:15and 08:00. The observations suggests that the NPF event waslimited to the ML where it was taking place homogeneously.
We calculated the formation and growth rates in SPC andHTL for particles and ions on board the Zeppelin and on theground. The results are summarized in Table 1. In SPC theonset of NPF happened when the ML was still very shallow,and the Zeppelin was not measuring significant amount oftime at this low altitude (this was a problem on other NPFevent days from SPC as well); consequently, the beginningof the NPF event was not fully observed on board. Becauseof this, we were unable to reliably calculate the formationrates and the growth rate between 1–2 nm from the Zeppelindata.
Kontkanen et al. (2016) obtained formation rates of 23.5,9.5, 0.1 cm and 0.08 cm−3 s−1 for 1.5 nm particles, 2 nm par-ticles, 2 nm positive ions and 2 nm negative ions, respec-tively, for the 28 June 2012 NPF event at the ground level.These values are in line with our values for the same day re-ported in Table 1 (J3 = 6.8 cm−3 s−1, J−3 = 0.04 cm−3 s−1,J+3 = 0.03 cm−3 s−1). The higher formation rates in SPCcompared to HTL are characteristic of polluted environ-ments (Kerminen et al., 2018). The calculated GRs for thelarger particle sizes as seen in Table 1 were similar on boardthe Zeppelin (HTL: GR7–20 = 2.4 nm h−1, SPC: GR7–20 =
3.0 nm h−1) and on the ground (HTL: GR7–20 = 2.1 nm h−1,SPC: GR7–20 = 2.8 nm h−1).
On 8 May 2013 in HTL almost the whole NPF event wascaptured by the Zeppelin measuring inside the ML. How-ever, in contrast to SPC the number size distributions mea-sured on board the Zeppelin (Fig. 6b) and on the ground(Fig. 6d) show differences, particularly in the growing nu-cleation mode particles. At different times on board the Zep-pelin when it was measuring inside the ML, the particlenumber concentration in the growing mode momentarily in-creased up to eightfold compared to the background num-ber concentration, suggesting an enhancement in the parti-cle formation rate. On board the Zeppelin this can be seen asconcentrated “vertical stripes” in the number size distributionbetween 08:00–10:00. On the other hand, at the ground sta-tion an increase of concentration of freshly formed particleswas observed between 07:30–08:00. This inhomogeneity isfurther discussed in Sect. 3.3.
In the ground-based NAIS data a pool of sub-6 nm par-ticles was present during the NPF event, while on boardthe Zeppelin no such pool was observed. This can be seenmost clearly between 10:00–11:30 when the median parti-cle number concentration between 2–4 nm on the ground was1400 cm−3, whereas on board the Zeppelin it was 570 cm−3.Similarly Leino et al. (2019) observed that the number con-centration of sub-3 nm particles decreases as a function ofaltitude at HTL. This may be linked to increased concentra-tion of low-volatility vapors on the surface near the sourcescompared to aloft.
Despite the differences in the ground-based and airbornenumber size distributions in HTL, a continuous, growing nu-cleation mode was observed in the “background” both onthe ground (alongside the pool of sub-6 nm particles) and onboard the Zeppelin during the NPF event. When averagedover the total duration of the NPF event, the growth ratesand formation rates on board the Zeppelin and on the groundwere similar on this day. This would indicate that the ground-based measurements represent the NPF event in the wholeML quite well. However locally increased number concen-trations, indicating enhanced NPF, were observed inside theML, and if the enhancement is not detected with the ground-based measurements we may underestimate the intensity ofNPF within the ML based on ground-based data alone.
Atmos. Chem. Phys., 21, 12649–12663, 2021 https://doi.org/10.5194/acp-21-12649-2021
J. Lampilahti et al.: Zeppelin-led study on the onset of new particle formation 12657
Figure 6. Time evolution of particle number size distributions measured by the NAIS (positive polarity) on board the Zeppelin (a, b) and atthe ground level (c, d) in HTL and in SPC on the 2 case study days. The black dots are the mean mode diameters found by fitting a log-normaldistribution over the growing mode. The panels (e) and (f) show the 3–10 nm particle number concentration as a function of time and altitudeon board the Zeppelin and at the ground-based station. The ML height during the measurement flights is also shown.
3.4 Vertical and horizontal distribution of the freshlyformed particles
Next we investigated how the freshly formed particles weredistributed spatially in the BL. Figure 6e shows the parti-cle number concentration between 3–10 nm measured by theNAIS and the ML height from SPC as a function of time andaltitude. The freshly formed particles were distributed homo-geneously throughout the growing ML but were not found inthe RL. The 3–10 nm number concentration inside the MLwas ∼ 20000 cm−3, while in the residual layer it was only∼ 200 cm−3. The pockets of increased intermediate ion con-centration, indicating NPF in the nocturnal boundary layerand residual layer (Fig. 4a), were not observed in the 3–10 nm size range, suggesting that the particles did not growto the 3–10 nm size range in any significant numbers.
At HTL the Zeppelin was measuring in the lower halfof the developed ML; however, the Cessna profiled the en-tire depth of the ML all the way up to the lower parts
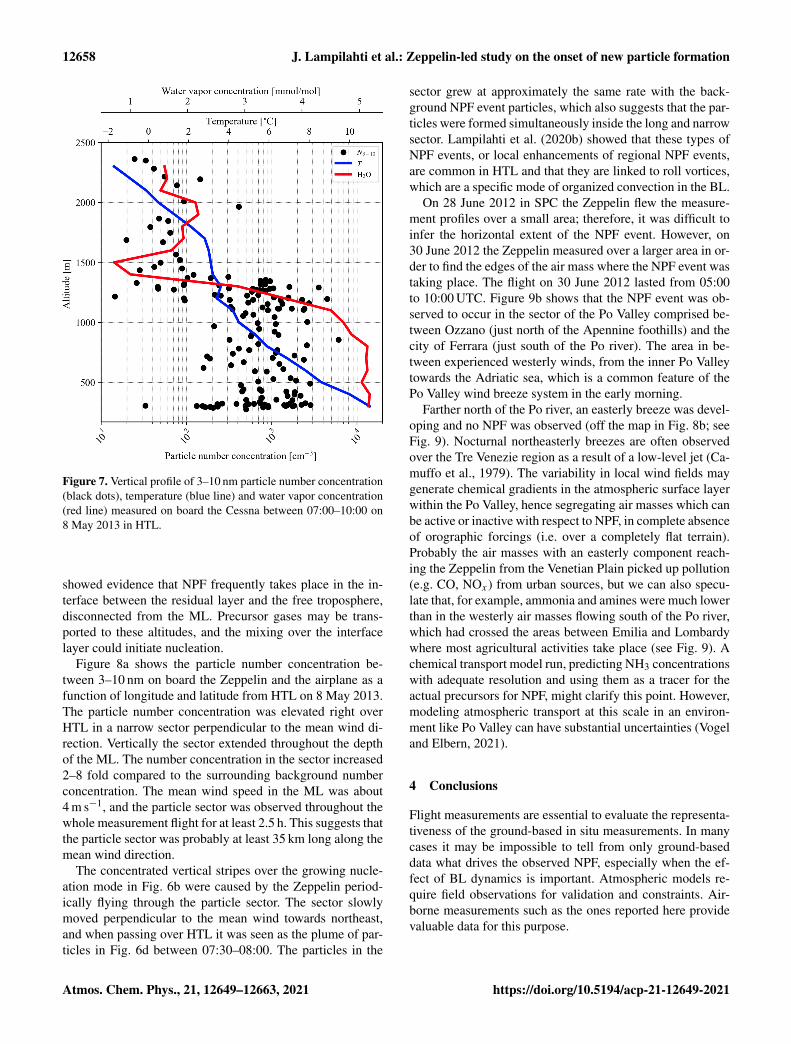
of the free troposphere. Figure 7 shows the vertical profileof 3–10 nm particle number concentration between 07:00–10:00 UTC calculated by subtracting the total SMPS num-ber concentration from the UF-CPC number concentrationon board the Cessna. Also the water vapor concentration andtemperature are shown. A temperature inversion and a largenegative gradient in water vapor concentration and in the par-ticle number concentration indicated that the top of the MLwas present between 1300–1400 m.
On average the number concentration inside the ML re-mained roughly constant (N3–10 ∼ 1000 cm−3) as a functionof altitude; however, there was substantial variation (∼ 200–3000 cm−3). The strongest variation came from a narrow sec-tor roughly at the center of the measurement area, which isdiscussed below. The NPF did not extend to the RL wherethe number concentrations were reduced to below 100 cm−3.
However at 2000 m a layer of sub-10 nm particles was ob-served. The 3–10 nm number concentration increased fromless than 100 cm−3 to ∼ 400 cm−3. Lampilahti et al. (2021a)
https://doi.org/10.5194/acp-21-12649-2021 Atmos. Chem. Phys., 21, 12649–12663, 2021
12658 J. Lampilahti et al.: Zeppelin-led study on the onset of new particle formation
Figure 7. Vertical profile of 3–10 nm particle number concentration(black dots), temperature (blue line) and water vapor concentration(red line) measured on board the Cessna between 07:00–10:00 on8 May 2013 in HTL.
showed evidence that NPF frequently takes place in the in-terface between the residual layer and the free troposphere,disconnected from the ML. Precursor gases may be trans-ported to these altitudes, and the mixing over the interfacelayer could initiate nucleation.
Figure 8a shows the particle number concentration be-tween 3–10 nm on board the Zeppelin and the airplane as afunction of longitude and latitude from HTL on 8 May 2013.The particle number concentration was elevated right overHTL in a narrow sector perpendicular to the mean wind di-rection. Vertically the sector extended throughout the depthof the ML. The number concentration in the sector increased2–8 fold compared to the surrounding background numberconcentration. The mean wind speed in the ML was about4 m s−1, and the particle sector was observed throughout thewhole measurement flight for at least 2.5 h. This suggests thatthe particle sector was probably at least 35 km long along themean wind direction.
The concentrated vertical stripes over the growing nucle-ation mode in Fig. 6b were caused by the Zeppelin period-ically flying through the particle sector. The sector slowlymoved perpendicular to the mean wind towards northeast,and when passing over HTL it was seen as the plume of par-ticles in Fig. 6d between 07:30–08:00. The particles in the
sector grew at approximately the same rate with the back-ground NPF event particles, which also suggests that the par-ticles were formed simultaneously inside the long and narrowsector. Lampilahti et al. (2020b) showed that these types ofNPF events, or local enhancements of regional NPF events,are common in HTL and that they are linked to roll vortices,which are a specific mode of organized convection in the BL.
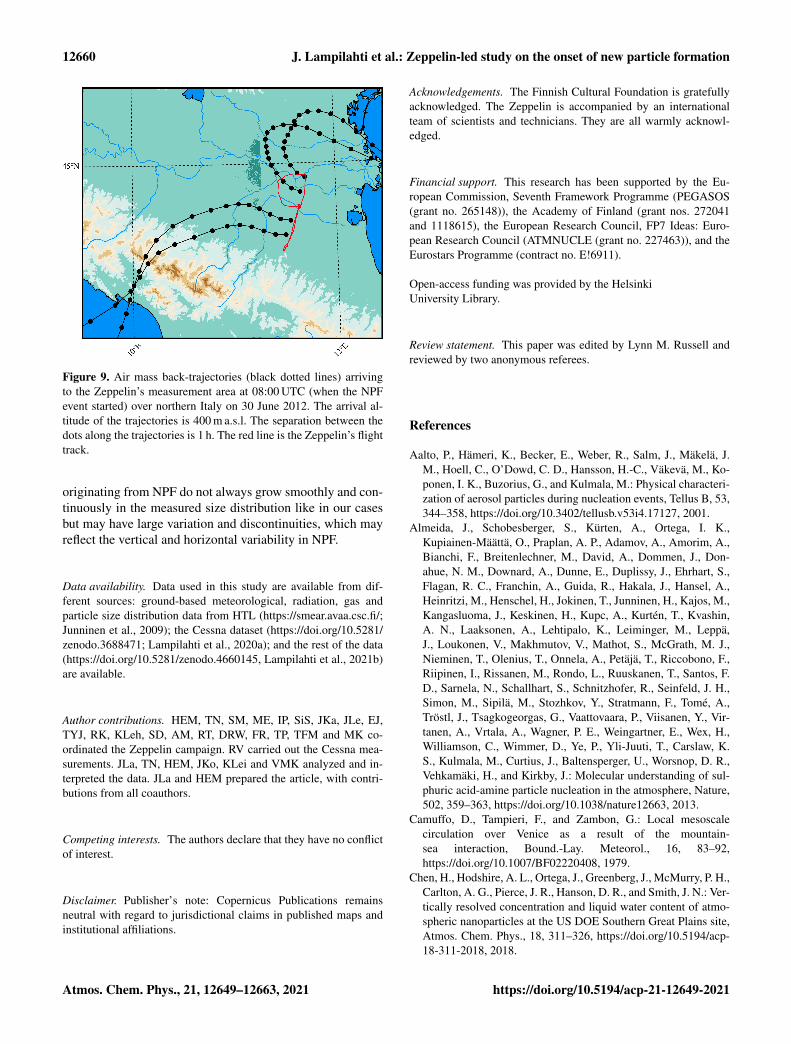
On 28 June 2012 in SPC the Zeppelin flew the measure-ment profiles over a small area; therefore, it was difficult toinfer the horizontal extent of the NPF event. However, on30 June 2012 the Zeppelin measured over a larger area in or-der to find the edges of the air mass where the NPF event wastaking place. The flight on 30 June 2012 lasted from 05:00to 10:00 UTC. Figure 9b shows that the NPF event was ob-served to occur in the sector of the Po Valley comprised be-tween Ozzano (just north of the Apennine foothills) and thecity of Ferrara (just south of the Po river). The area in be-tween experienced westerly winds, from the inner Po Valleytowards the Adriatic sea, which is a common feature of thePo Valley wind breeze system in the early morning.
Farther north of the Po river, an easterly breeze was devel-oping and no NPF was observed (off the map in Fig. 8b; seeFig. 9). Nocturnal northeasterly breezes are often observedover the Tre Venezie region as a result of a low-level jet (Ca-muffo et al., 1979). The variability in local wind fields maygenerate chemical gradients in the atmospheric surface layerwithin the Po Valley, hence segregating air masses which canbe active or inactive with respect to NPF, in complete absenceof orographic forcings (i.e. over a completely flat terrain).Probably the air masses with an easterly component reach-ing the Zeppelin from the Venetian Plain picked up pollution(e.g. CO, NOx) from urban sources, but we can also specu-late that, for example, ammonia and amines were much lowerthan in the westerly air masses flowing south of the Po river,which had crossed the areas between Emilia and Lombardywhere most agricultural activities take place (see Fig. 9). Achemical transport model run, predicting NH3 concentrationswith adequate resolution and using them as a tracer for theactual precursors for NPF, might clarify this point. However,modeling atmospheric transport at this scale in an environ-ment like Po Valley can have substantial uncertainties (Vogeland Elbern, 2021).
4 Conclusions
Flight measurements are essential to evaluate the representa-tiveness of the ground-based in situ measurements. In manycases it may be impossible to tell from only ground-baseddata what drives the observed NPF, especially when the ef-fect of BL dynamics is important. Atmospheric models re-quire field observations for validation and constraints. Air-borne measurements such as the ones reported here providevaluable data for this purpose.
Atmos. Chem. Phys., 21, 12649–12663, 2021 https://doi.org/10.5194/acp-21-12649-2021
J. Lampilahti et al.: Zeppelin-led study on the onset of new particle formation 12659
Figure 8. (a) The flight tracks of the Zeppelin (circular track) and the airplane (track with back and fourth segments) colored by 3–10 nm par-ticle number concentration from HTL on 8 May 2013. (b) The flight track of the Zeppelin colored by 3–10 nm particle number concentrationfrom SPC on 30 June 2012. The Zeppelin flight track has gaps, because the NAIS was measuring in the ion mode during that time.
We compared case studies from two different environ-ments where NPF occurs frequently: a suburban area in PoValley, Italy, and a boreal forest in Hyytiälä, Finland. Weaimed to answer in which part of the BL the onset of NPFand the growth of the freshly formed particles took place andto study the vertical and horizontal extent of NPF.
To detect directly the very first steps of NPF in the BL,we used airborne Zeppelin and airplane measurements, sup-ported by ground-based in situ measurements. The Zeppelinmeasurements allowed us to study the vertical extent of NPFin the BL. The high time resolution and low cut-off size ofthe instruments on board allowed us to observe the startingtime, location and altitude of an NPF event.
Within the limits of the Zeppelin’s vertical profiling speed(∼ 0.5 m s−1 ascent) and the time resolution of the NAIS, weobserved that the onset of NPF happened simultaneously in-side the ML. However particles formed close to the surfacecould probably still be mixed by strong updrafts fast enoughso that the number concentrations measured on board theZeppelin appear homogeneous. The newly formed particles
were observed to grow to larger sizes at the same rate withinthe ML. However, in HTL we observed local enhancementsin NPF that were induced by roll vortices in the BL.
In addition a separate layer of sub-10 nm particles wasobserved above the ML in HTL. Lampilahti et al. (2021a)showed that such layers in HTL are likely the result of NPFin the topmost part of the RL. Furthermore it was estimatedthat around 42 % of the NPF events observed in HTL at thesurface are entrained from such elevated layers. In SPC weobserved how NPF could be happening in one air mass butbe completely absent in an adjacent air mass with a differentorigin.
The conditions on our case study days represent the typ-ical conditions in these locations when NPF events usuallyoccur. That is to say, a sunny day with the air masses origi-nating from a certain area during a specific time of the year(May in HTL and June in SPC) when NPF is common. Nev-ertheless it is not certain that our case studies represent a typ-ical NPF event day. NPF events also occur under differentkinds of conditions. The growing nucleation mode particles
https://doi.org/10.5194/acp-21-12649-2021 Atmos. Chem. Phys., 21, 12649–12663, 2021
12660 J. Lampilahti et al.: Zeppelin-led study on the onset of new particle formation
Figure 9. Air mass back-trajectories (black dotted lines) arrivingto the Zeppelin’s measurement area at 08:00 UTC (when the NPFevent started) over northern Italy on 30 June 2012. The arrival al-titude of the trajectories is 400 m a.s.l. The separation between thedots along the trajectories is 1 h. The red line is the Zeppelin’s flighttrack.
originating from NPF do not always grow smoothly and con-tinuously in the measured size distribution like in our casesbut may have large variation and discontinuities, which mayreflect the vertical and horizontal variability in NPF.
Data availability. Data used in this study are available from dif-ferent sources: ground-based meteorological, radiation, gas andparticle size distribution data from HTL (https://smear.avaa.csc.fi/;Junninen et al., 2009); the Cessna dataset (https://doi.org/10.5281/zenodo.3688471; Lampilahti et al., 2020a); and the rest of the data(https://doi.org/10.5281/zenodo.4660145, Lampilahti et al., 2021b)are available.
Author contributions. HEM, TN, SM, ME, IP, SiS, JKa, JLe, EJ,TYJ, RK, KLeh, SD, AM, RT, DRW, FR, TP, TFM and MK co-ordinated the Zeppelin campaign. RV carried out the Cessna mea-surements. JLa, TN, HEM, JKo, KLei and VMK analyzed and in-terpreted the data. JLa and HEM prepared the article, with contri-butions from all coauthors.
Competing interests. The authors declare that they have no conflictof interest.
Disclaimer. Publisher’s note: Copernicus Publications remainsneutral with regard to jurisdictional claims in published maps andinstitutional affiliations.
Acknowledgements. The Finnish Cultural Foundation is gratefullyacknowledged. The Zeppelin is accompanied by an internationalteam of scientists and technicians. They are all warmly acknowl-edged.
Financial support. This research has been supported by the Eu-ropean Commission, Seventh Framework Programme (PEGASOS(grant no. 265148)), the Academy of Finland (grant nos. 272041and 1118615), the European Research Council, FP7 Ideas: Euro-pean Research Council (ATMNUCLE (grant no. 227463)), and theEurostars Programme (contract no. E!6911).
Open-access funding was provided by the HelsinkiUniversity Library.
Review statement. This paper was edited by Lynn M. Russell andreviewed by two anonymous referees.
References
Aalto, P., Hämeri, K., Becker, E., Weber, R., Salm, J., Mäkelä, J.M., Hoell, C., O’Dowd, C. D., Hansson, H.-C., Väkevä, M., Ko-ponen, I. K., Buzorius, G., and Kulmala, M.: Physical characteri-zation of aerosol particles during nucleation events, Tellus B, 53,344–358, https://doi.org/10.3402/tellusb.v53i4.17127, 2001.
Almeida, J., Schobesberger, S., Kürten, A., Ortega, I. K.,Kupiainen-Määttä, O., Praplan, A. P., Adamov, A., Amorim, A.,Bianchi, F., Breitenlechner, M., David, A., Dommen, J., Don-ahue, N. M., Downard, A., Dunne, E., Duplissy, J., Ehrhart, S.,Flagan, R. C., Franchin, A., Guida, R., Hakala, J., Hansel, A.,Heinritzi, M., Henschel, H., Jokinen, T., Junninen, H., Kajos, M.,Kangasluoma, J., Keskinen, H., Kupc, A., Kurtén, T., Kvashin,A. N., Laaksonen, A., Lehtipalo, K., Leiminger, M., Leppä,J., Loukonen, V., Makhmutov, V., Mathot, S., McGrath, M. J.,Nieminen, T., Olenius, T., Onnela, A., Petäjä, T., Riccobono, F.,Riipinen, I., Rissanen, M., Rondo, L., Ruuskanen, T., Santos, F.D., Sarnela, N., Schallhart, S., Schnitzhofer, R., Seinfeld, J. H.,Simon, M., Sipilä, M., Stozhkov, Y., Stratmann, F., Tomé, A.,Tröstl, J., Tsagkogeorgas, G., Vaattovaara, P., Viisanen, Y., Vir-tanen, A., Vrtala, A., Wagner, P. E., Weingartner, E., Wex, H.,Williamson, C., Wimmer, D., Ye, P., Yli-Juuti, T., Carslaw, K.S., Kulmala, M., Curtius, J., Baltensperger, U., Worsnop, D. R.,Vehkamäki, H., and Kirkby, J.: Molecular understanding of sul-phuric acid-amine particle nucleation in the atmosphere, Nature,502, 359–363, https://doi.org/10.1038/nature12663, 2013.
Camuffo, D., Tampieri, F., and Zambon, G.: Local mesoscalecirculation over Venice as a result of the mountain-sea interaction, Bound.-Lay. Meteorol., 16, 83–92,https://doi.org/10.1007/BF02220408, 1979.
Chen, H., Hodshire, A. L., Ortega, J., Greenberg, J., McMurry, P. H.,Carlton, A. G., Pierce, J. R., Hanson, D. R., and Smith, J. N.: Ver-tically resolved concentration and liquid water content of atmo-spheric nanoparticles at the US DOE Southern Great Plains site,Atmos. Chem. Phys., 18, 311–326, https://doi.org/10.5194/acp-18-311-2018, 2018.
Atmos. Chem. Phys., 21, 12649–12663, 2021 https://doi.org/10.5194/acp-21-12649-2021
J. Lampilahti et al.: Zeppelin-led study on the onset of new particle formation 12661
Dada, L., Paasonen, P., Nieminen, T., Buenrostro Mazon, S., Kon-tkanen, J., Peräkylä, O., Lehtipalo, K., Hussein, T., Petäjä,T., Kerminen, V.-M., Bäck, J., and Kulmala, M.: Long-termanalysis of clear-sky new particle formation events and non-events in Hyytiälä, Atmos. Chem. Phys., 17, 6227–6241,https://doi.org/10.5194/acp-17-6227-2017, 2017.
Dal Maso, M., Kulmala, M., Riipinen, I., Wagner, R., Hussein, T.,Aalto, P. P., and Lehtinen, K. E.: Formation and growth of freshatmospheric aerosols: eight years of aerosol size distribution datafrom SMEAR II, Hyytiälä, Finland, Boreal Environ. Res., 10,323–336, 2005.
Dunne, E. M., Gordon, H., Kürten, A., Almeida, J., Duplissy,J., Williamson, C., Ortega, I. K., Pringle, K. J., Adamov, A.,Baltensperger, U., Barmet, P., Benduhn, F., Bianchi, F., Breit-enlechner, M., Clarke, A., Curtius, J., Dommen, J., Donahue,N. M., Ehrhart, S., Flagan, R. C., Franchin, A., Guida, R.,Hakala, J., Hansel, A., Heinritzi, M., Jokinen, T., Kangasluoma,J., Kirkby, J., Kulmala, M., Kupc, A., Lawler, M. J., Lehti-palo, K., Makhmutov, V., Mann, G., Mathot, S., Merikanto,J., Miettinen, P., Nenes, A., Onnela, A., Rap, A., Reddington,C. L. S., Riccobono, F., Richards, N. A. D., Rissanen, M. P.,Rondo, L., Sarnela, N., Schobesberger, S., Sengupta, K., Simon,M., Sipilä, M., Smith, J. N., Stozkhov, Y., Tomé, A., Tröstl,J., Wagner, P. E., Wimmer, D., Winkler, P. M., Worsnop, D.R., and Carslaw, K. S.: Global atmospheric particle formationfrom CERN CLOUD measurements, Science, 354, 1119–1124,https://doi.org/10.1126/science.aaf2649, 2016.
Ehn, M., Junninen, H., Petäjä, T., Kurtén, T., Kerminen, V.-M.,Schobesberger, S., Manninen, H. E., Ortega, I. K., Vehkamäki,H., Kulmala, M., and Worsnop, D. R.: Composition and tem-poral behavior of ambient ions in the boreal forest, Atmos.Chem. Phys., 10, 8513–8530, https://doi.org/10.5194/acp-10-8513-2010, 2010.
Ehn, M., Thornton, J. A., Kleist, E., Sipilä, M., Junninen, H.,Pullinen, I., Springer, M., Rubach, F., Tillmann, R., Lee, B.,Lopez-Hilfiker, F., Andres, S., Acir, I.-H., Rissanen, M., Joki-nen, T., Schobesberger, S., Kangasluoma, J., Kontkanen, J.,Nieminen, T., Kurtén, T., Nielsen, L. B., Jørgensen, S., Kjaer-gaard, H. G., Canagaratna, M., Maso, M. D., Berndt, T.,Petäjä, T., Wahner, A., Kerminen, V.-M., Kulmala, M., Worsnop,D. R., Wildt, J., and Mentel, T. F.: A large source of low-volatility secondary organic aerosol, Nature, 506, 476–479,https://doi.org/10.1038/nature13032, 2014.
Eisele, F. L. and Tanner, D. J.: Ion-assisted troposphericOH measurements, J. Geophys. Res.-Atmos., 96, 9295–9308,https://doi.org/10.1029/91JD00198, 1991.
Gordon, H., Kirkby, J., Baltensperger, U., Bianchi, F., Breit-enlechner, M., Curtius, J., Dias, A., Dommen, J., Donahue,N. M., Dunne, E. M., Duplissy, J., Ehrhart, S., Flagan, R.C., Frege, C., Fuchs, C., Hansel, A., Hoyle, C. R., Kul-mala, M., Kürten, A., Lehtipalo, K., Makhmutov, V., Molteni,U., Rissanen, M. P., Stozkhov, Y., Tröstl, J., Tsagkogeor-gas, G., Wagner, R., Williamson, C., Wimmer, D., Winkler,P. M., Yan, C., and Carslaw, K. S.: Causes and importanceof new particle formation in the present-day and preindus-trial atmospheres, J. Geophys. Res.-Atmos., 122, 8739–8760,https://doi.org/10.1002/2017JD026844, 2017.
Hakola, H., Tarvainen, V., Laurila, T., Hiltunen, V., Hellén, H., andKeronen, P.: Seasonal variation of VOC concentrations above
a boreal coniferous forest, Atmos. Environ., 37, 1623–1634,https://doi.org/10.1016/S1352-2310(03)00014-1, 2003.
Hamed, A., Joutsensaari, J., Mikkonen, S., Sogacheva, L., DalMaso, M., Kulmala, M., Cavalli, F., Fuzzi, S., Facchini, M. C.,Decesari, S., Mircea, M., Lehtinen, K. E. J., and Laaksonen,A.: Nucleation and growth of new particles in Po Valley, Italy,Atmos. Chem. Phys., 7, 355–376, https://doi.org/10.5194/acp-7-355-2007, 2007.
Hari, P. and Kulmala, M.: Station for measuring ecosystem-atmosphere relations (SMEAR II), Boreal Environ. Res., 10,315–322, 2005.
Jäger, J.: Airborne VOC measurements on board the Zeppelin NTduring the PEGASOS campaigns in 2012 deploying the im-proved Fast-GC-MSD System, dissertation, ForschungszentrumJülich GmbH, ISBN 978-3-89336-936-2, 2014.
Junkermann, W. and Hacker, J. M.: Ultrafine Particles in the LowerTroposphere: Major Sources, Invisible Plumes, and Meteorolog-ical Transport Processes, B. Am. Meteorol. Soc., 99, 2587–2602,https://doi.org/10.1175/BAMS-D-18-0075.1, 2018.
Junninen, H., Lauri, A., Keronen, P., AaIto, P., HiItunen, V., Hari, P.,and KuImaIa, M.: Smart-SMEAR: on-line data exploration andvisualization tool tor SMEAR stations, Boreal Environ. Res., 14,447–457, 2009 (data available at: https://smear.avaa.csc.fi/, lastaccess: 25 August 2021).
Junninen, H., Ehn, M., Petäjä, T., Luosujärvi, L., Kotiaho, T., Kos-tiainen, R., Rohner, U., Gonin, M., Fuhrer, K., Kulmala, M., andWorsnop, D. R.: A high-resolution mass spectrometer to mea-sure atmospheric ion composition, Atmos. Meas. Tech., 3, 1039–1053, https://doi.org/10.5194/amt-3-1039-2010, 2010.
Kerminen, V.-M., Chen, X., Vakkari, V., Petäjä, T., Kulmala, M.,and Bianchi, F.: Atmospheric new particle formation and growth:review of field observations, Environ. Res. Lett., 13, 103003,https://doi.org/10.1088/1748-9326/aadf3c, 2018.
Kirkby, J., Curtius, J., Almeida, J., Dunne, E., Duplissy, J., Ehrhart,S., Franchin, A., Gagné, S., Ickes, L., Kürten, A., Kupc, A., Met-zger, A., Riccobono, F., Rondo, L., Schobesberger, S., Tsagko-georgas, G., Wimmer, D., Amorim, A., Bianchi, F., Breitenlech-ner, M., David, A., Dommen, J., Downard, A., Ehn, M., Fla-gan, R. C., Haider, S., Hansel, A., Hauser, D., Jud, W., Junni-nen, H., Kreissl, F., Kvashin, A., Laaksonen, A., Lehtipalo, K.,Lima, J., Lovejoy, E. R., Makhmutov, V., Mathot, S., Mikkilä, J.,Minginette, P., Mogo, S., Nieminen, T., Onnela, A., Pereira, P.,Petäjä, T., Schnitzhofer, R., Seinfeld, J. H., Sipilä, M., Stozhkov,Y., Stratmann, F., Tomé, A., Vanhanen, J., Viisanen, Y., Vrtala,A., Wagner, P. E., Walther, H., Weingartner, E., Wex, H., Win-kler, P. M., Carslaw, K. S., Worsnop, D. R., Baltensperger, U.,and Kulmala, M.: Role of sulphuric acid, ammonia and galac-tic cosmic rays in atmospheric aerosol nucleation, Nature, 476,429–433, https://doi.org/10.1038/nature10343, 2011.
Kontkanen, J., Järvinen, E., Manninen, H. E., Lehtipalo, K., Kan-gasluoma, J., Decesari, S., Gobbi, G. P., Laaksonen, A., Petäjä,T., and Kulmala, M.: High concentrations of sub-3nm clus-ters and frequent new particle formation observed in the PoValley, Italy, during the PEGASOS 2012 campaign, Atmos.Chem. Phys., 16, 1919–1935, https://doi.org/10.5194/acp-16-1919-2016, 2016.
Kulmala, M., Petäjä, T., Nieminen, T., Sipilä, M., Manninen,H. E., Lehtipalo, K., Dal Maso, M., Aalto, P. P., Junninen,H., Paasonen, P., Riipinen, I., Lehtinen, K. E. J., Laakso-
https://doi.org/10.5194/acp-21-12649-2021 Atmos. Chem. Phys., 21, 12649–12663, 2021
12662 J. Lampilahti et al.: Zeppelin-led study on the onset of new particle formation
nen, A., and Kerminen, V.-M.: Measurement of the nucleationof atmospheric aerosol particles, Nat. Protoc., 7, 1651–1667,https://doi.org/10.1038/nprot.2012.091, 2012.
Kulmala, M., Kontkanen, J., Junninen, H., Lehtipalo, K., Manni-nen, H. E., Nieminen, T., Petäjä, T., Sipilä, M., Schobesberger,S., Rantala, P., Franchin, A., Jokinen, T., Järvinen, E., Äijälä, M.,Kangasluoma, J., Hakala, J., Aalto, P. P., Paasonen, P., Mikkilä,J., Vanhanen, J., Aalto, J., Hakola, H., Makkonen, U., Ruuska-nen, T., Mauldin, R. L., Duplissy, J., Vehkamäki, H., Back,J., Kortelainen, A., Riipinen, I., Kurten, T., Johnston, M. V.,Smith, J. N., Ehn, M., Mentel, T. F., Lehtinen, K. E. J., Laakso-nen, A., Kerminen, V.-M., and Worsnop, D. R.: Direct observa-tions of atmospheric aerosol nucleation, Science, 339, 943–946,https://doi.org/10.1126/science.1227385, 2013.
Laakso, L., Grönholm, T., Kulmala, L., Haapanala, S., Hirsikko, A.,Lovejoy, E. R., Kazil, J., Kurten, T., Boy, M., Nilsson, E. D., So-gachev, A., Riipinen, I., Stratmann, F., and Kulmala, M.: Hot-airballoon as a platform for boundary layer profile measurementsduring particle formation, Boreal Environ. Res., 12, 279–294,2007.
Laaksonen, A., Hamed, A., Joutsensaari, J., Hiltunen, L., Cavalli,F., Junkermann, W., Asmi, A., Fuzzi, S., and Facchini, M. C.:Cloud condensation nucleus production from nucleation eventsat a highly polluted region, Geophys. Res. Lett., 32, L06812,https://doi.org/10.1029/2004GL022092, 2005.
Lampilahti, J., Manninen, H. E., Leino, K., Väänänen, R.,Manninen, A., Buenrostro Mazon, S., Nieminen, T., Leski-nen, M., Enroth, J., Bister, M., Zilitinkevich, S., Kangaslu-oma, J., Järvinen, H., Kerminen, V.-M., Petäjä, T., and Kul-mala, M.: Data set of airborne and ground-based atmo-spheric measurements from Hyytiälä, Finland, Zenodo [data set],https://doi.org/10.5281/zenodo.3688471, 2020a.
Lampilahti, J., Manninen, H. E., Leino, K., Väänänen, R., Man-ninen, A., Buenrostro Mazon, S., Nieminen, T., Leskinen, M.,Enroth, J., Bister, M., Zilitinkevich, S., Kangasluoma, J., Järvi-nen, H., Kerminen, V.-M., Petäjä, T., and Kulmala, M.: Rollvortices induce new particle formation bursts in the plane-tary boundary layer, Atmos. Chem. Phys., 20, 11841–11854,https://doi.org/10.5194/acp-20-11841-2020, 2020b.
Lampilahti, J., Leino, K., Manninen, A., Poutanen, P., Franck, A.,Peltola, M., Hietala, P., Beck, L., Dada, L., Quéléver, L., Öhrn-berg, R., Zhou, Y., Ekblom, M., Vakkari, V., Zilitinkevich, S.,Kerminen, V.-M., Petäjä, T., and Kulmala, M.: Aerosol particleformation in the upper residual layer, Atmos. Chem. Phys., 21,7901–7915, https://doi.org/10.5194/acp-21-7901-2021, 2021a.
Lampilahti, J., Manninen, H. E., Nieminen, T., Mirme, S., Ehn, M.,Pullinen, I., Leino, K., Schobesberger, S., Kangasluoma, J., Kon-tkanen, J., Järvinen, E., Väänänen, R., Yli-Juuti, T., Krecji, R.,Lehtipalo, K., Levula, J., Mirme, A., Decesari, S., Tillmann, R.,Worsnop, D. R., Rohrer, F., Petäjä, T., Kerminen, V.-M., Mentel,T. F., and Kulmala, M.: Zeppelin-led study on the onset of newparticle formation in the planetary boundary layer: dataset, Zen-odo [data set], https://doi.org/10.5281/zenodo.4660145, 2021b.
Lehtipalo, K., Leppä, J., Kontkanen, J., Kangasluoma, J., Franchin,A., Wimmer, D., Schobesberger, S., Junninen, H., Petäjä, T.,Sipilä, M., Mikkilä, J., Vanhanen, J., Worsnop, D. R., and Kul-mala, M.: Methods for determining particle size distribution andgrowth rates between 1 and 3 nm using the Particle Size Magni-fier, Boreal Environ. Res., 19, 215–236, 2014.
Leino, K., Nieminen, T., Manninen, H. E., Petäjä, T., Kerminen, V.-M., and Kulmala, M.: Intermediate ions as a strong indicator fornew particle formation bursts in boreal forest, Boreal Environ.Res., 21, 274–286, 2016.
Leino, K., Lampilahti, J., Poutanen, P., Väänänen, R., Manni-nen, A., Buenrostro Mazon, S., Dada, L., Franck, A., Wim-mer, D., Aalto, P. P., Ahonen, L. R., Enroth, J., Kangasluoma,J., Keronen, P., Korhonen, F., Laakso, H., Matilainen, T., Si-ivola, E., Manninen, H. E., Lehtipalo, K., Kerminen, V.-M.,Petäjä, T., and Kulmala, M.: Vertical profiles of sub-3 nm parti-cles over the boreal forest, Atmos. Chem. Phys., 19, 4127–4138,https://doi.org/10.5194/acp-19-4127-2019, 2019.
Manninen, H. E., Petäjä, T., Asmi, E., Riipinen, N., Nieminen, T.,Mikkilä, J., Horrak, U., Mirme, A., Mirme, S., Laakso, L., Ker-minen, V.-M., and Kulmala, M.: Long-term field measurementsof charged and neutral clusters using Neutral cluster and Air IonSpectrometer (NAIS), Boreal Environ. Res., 14, 591–605, 2009.
Mirme, S. and Mirme, A.: The mathematical principles and designof the NAIS – a spectrometer for the measurement of cluster ionand nanometer aerosol size distributions, Atmos. Meas. Tech., 6,1061–1071, https://doi.org/10.5194/amt-6-1061-2013, 2013.
Mohr, C., Thornton, J. A., Heitto, A., Lopez-Hilfiker, F. D., Lutz,A., Riipinen, I., Hong, J., Donahue, N. M., Hallquist, M., Petäjä,T., Kulmala, M., and Yli-Juuti, T.: Molecular identification oforganic vapors driving atmospheric nanoparticle growth, Nat.Commun., 10, 4442, https://doi.org/10.1038/s41467-019-12473-2, 2019.
Nieminen, T., Asmi, A., Dal Maso, M., Aalto, P. P., Keronen, P.,Petäjä, T., Kulmala, M., and Kerminen, V.-M.: Trends in atmo-spheric new-particle formation: 16 years of observations in aboreal-forest environment, Boreal Environ. Res., 19, 191–214,2014.
Nieminen, T., Yli-Juuti, T., Manninen, H. E., Petäjä, T., Kerminen,V.-M., and Kulmala, M.: Technical note: New particle forma-tion event forecasts during PEGASOS–Zeppelin Northern mis-sion 2013 in Hyytiälä, Finland, Atmos. Chem. Phys., 15, 12385–12396, https://doi.org/10.5194/acp-15-12385-2015, 2015.
Nilsson, E. D., Rannik, Ü., Kulmala, M., Buzorius, G., andO’dowd, C. D.: Effects of continental boundary layer evolu-tion, convection, turbulence and entrainment, on aerosol for-mation, Tellus B, 53, 441–461, https://doi.org/10.1034/j.1600-0889.2001.530409.x, 2001.
O’Dowd, C. D., Yoon, Y. J., Junkermann, W., Aalto, P., Kulmala,M., Lihavainen, H., and Viisanen, Y.: Airborne measurementsof nucleation mode particles II: boreal forest nucleation events,Atmos. Chem. Phys., 9, 937–944, https://doi.org/10.5194/acp-9-937-2009, 2009.
Pierce, J. R. and Adams, P. J.: Uncertainty in global CCNconcentrations from uncertain aerosol nucleation and pri-mary emission rates, Atmos. Chem. Phys., 9, 1339–1356,https://doi.org/10.5194/acp-9-1339-2009, 2009.
Platis, A., Altstädter, B., Wehner, B., Wildmann, N., Lampert, A.,Hermann, M., Birmili, W., and Bange, J.: An Observational CaseStudy on the Influence of Atmospheric Boundary-Layer Dynam-ics on New Particle Formation, Bound.-Layer Meteorol., 158,67–92, https://doi.org/10.1007/s10546-015-0084-y, 2015.
Schobesberger, S., Väänänen, R., Leino, K., Virkkula, A., Backman,J., Pohja, T., Siivola, E., Franchin, A., Mikkilä, J., Paramonov,M., Aalto, P. P., Krejci, R., Petäjä, T., and Kulmala, M.: Airborne
Atmos. Chem. Phys., 21, 12649–12663, 2021 https://doi.org/10.5194/acp-21-12649-2021
J. Lampilahti et al.: Zeppelin-led study on the onset of new particle formation 12663
measurements over the boreal forest of southern Finland duringnew particle formation events in 2009 and 2010, Boreal Environ.Res., 18, 145–164, 2013.
Siebert, H., Stratmann, F., and Wehner, B.: First observations of in-creased ultrafine particle number concentrations near the inver-sion of a continental planetary boundary layer and its relation toground-based measurements, Geophys. Res. Lett., 31, L09102,https://doi.org/10.1029/2003GL019086, 2004.
Sipilä, M., Berndt, T., Petäjä, T., Brus, D., Vanhanen, J., Strat-mann, F., Patokoski, J., Mauldin, R. L., Hyvärinen, A.-P., Lihavainen, H., and Kulmala, M.: The Role of SulfuricAcid in Atmospheric Nucleation, Science, 327, 1243–1246,https://doi.org/10.1126/science.1180315, 2010.
Sogacheva, L., Hamed, A., Facchini, M. C., Kulmala, M., andLaaksonen, A.: Relation of air mass history to nucleation eventsin Po Valley, Italy, using back trajectories analysis, Atmos.Chem. Phys., 7, 839–853, https://doi.org/10.5194/acp-7-839-2007, 2007.
Sogacheva, L., Saukkonen, L., Nilsson, E. D., Dal Maso,M., Schultz, D. M., De Leeuw, G., and Kulmala, M.:New aerosol particle formation in different synoptic situa-tions at Hyytiälä, Southern Finland, Tellus B, 60, 485–494,https://doi.org/10.1111/j.1600-0889.2008.00364.x, 2008.
Stein, A. F., Draxler, R. R., Rolph, G. D., Stunder, B. J. B., Co-hen, M. D., and Ngan, F.: NOAA’s HYSPLIT AtmosphericTransport and Dispersion Modeling System, B. Am. Meteo-rol. Soc., 96, 2059–2077, https://doi.org/10.1175/BAMS-D-14-00110.1, 2015.
Stratmann, F., Siebert, H., Spindler, G., Wehner, B., Althausen, D.,Heintzenberg, J., Hellmuth, O., Rinke, R., Schmieder, U., Sei-del, C., Tuch, T., Uhrner, U., Wiedensohler, A., Wandinger, U.,Wendisch, M., Schell, D., and Stohl, A.: New-particle forma-tion events in a continental boundary layer: first results fromthe SATURN experiment, Atmos. Chem. Phys., 3, 1445–1459,https://doi.org/10.5194/acp-3-1445-2003, 2003.
Stull, R. B.: An Introduction to Boundary Layer Meteorology, Soft-cover reprint of the original 1st edn., Springer, Dordrecht, theNetherlands, 670 pp., 1988.
Sullivan, A. P., Hodas, N., Turpin, B. J., Skog, K., Keutsch, F.N., Gilardoni, S., Paglione, M., Rinaldi, M., Decesari, S., Fac-chini, M. C., Poulain, L., Herrmann, H., Wiedensohler, A., Ne-mitz, E., Twigg, M. M., and Collett Jr., J. L.: Evidence for am-bient dark aqueous SOA formation in the Po Valley, Italy, At-mos. Chem. Phys., 16, 8095–8108, https://doi.org/10.5194/acp-16-8095-2016, 2016.
Väänänen, R., Krejci, R., Manninen, H. E., Manninen, A., Lampi-lahti, J., Buenrostro Mazon, S., Nieminen, T., Yli-Juuti, T.,Kontkanen, J., Asmi, A., Aalto, P. P., Keronen, P., Pohja, T.,O’Connor, E., Kerminen, V.-M., Petäjä, T., and Kulmala, M.:Vertical and horizontal variation of aerosol number size dis-tribution in the boreal environment, Atmos. Chem. Phys. Dis-cuss. [preprint], https://doi.org/10.5194/acp-2016-556, in review,2016.
Vanhanen, J., Mikkilä, J., Lehtipalo, K., Sipilä, M., Manninen, H.E., Siivola, E., Petäjä, T., and Kulmala, M.: Particle size magni-fier for nano-CN detection, Aerosol Sci. Technol., 45, 533–542,https://doi.org/10.1080/02786826.2010.547889, 2011.
Vogel, A. and Elbern, H.: Identifying forecast uncertainties for bio-genic gases in the Po Valley related to model configuration inEURAD-IM during PEGASOS 2012, Atmos. Chem. Phys., 21,4039–4057, https://doi.org/10.5194/acp-21-4039-2021, 2021.
Wehner, B., Siebert, H., Ansmann, A., Ditas, F., Seifert, P., Strat-mann, F., Wiedensohler, A., Apituley, A., Shaw, R. A., Man-ninen, H. E., and Kulmala, M.: Observations of turbulence-induced new particle formation in the residual layer, Atmos.Chem. Phys., 10, 4319–4330, https://doi.org/10.5194/acp-10-4319-2010, 2010.
Wiedensohler, A., Birmili, W., Nowak, A., Sonntag, A., Weinhold,K., Merkel, M., Wehner, B., Tuch, T., Pfeifer, S., Fiebig, M.,Fjäraa, A. M., Asmi, E., Sellegri, K., Depuy, R., Venzac, H., Vil-lani, P., Laj, P., Aalto, P., Ogren, J. A., Swietlicki, E., Williams,P., Roldin, P., Quincey, P., Hüglin, C., Fierz-Schmidhauser, R.,Gysel, M., Weingartner, E., Riccobono, F., Santos, S., Grün-ing, C., Faloon, K., Beddows, D., Harrison, R., Monahan, C.,Jennings, S. G., O’Dowd, C. D., Marinoni, A., Horn, H.-G.,Keck, L., Jiang, J., Scheckman, J., McMurry, P. H., Deng, Z.,Zhao, C. S., Moerman, M., Henzing, B., de Leeuw, G., Löschau,G., and Bastian, S.: Mobility particle size spectrometers: har-monization of technical standards and data structure to facili-tate high quality long-term observations of atmospheric parti-cle number size distributions, Atmos. Meas. Tech., 5, 657–685,https://doi.org/10.5194/amt-5-657-2012, 2012.
Yu, F. and Luo, G.: Simulation of particle size distribution witha global aerosol model: contribution of nucleation to aerosoland CCN number concentrations, Atmos. Chem. Phys., 9, 7691–7710, https://doi.org/10.5194/acp-9-7691-2009, 2009.
https://doi.org/10.5194/acp-21-12649-2021 Atmos. Chem. Phys., 21, 12649–12663, 2021


![LE LUPUS DU SUJET AGE - chu- · PDF fileboth late-onset lupus groups. Rev Med Interne. 2003 May;24(5):288-94. [Systemic lupus erythematosus with disease onset after age 65]](https://static.fdocuments.fr/doc/165x107/5a7e4fe37f8b9a49588e5171/le-lupus-du-sujet-age-chu-late-onset-lupus-groups-rev-med-interne-2003-may245288-94.jpg)