VAT - Gap Convergence in Central and Eastern Europe
7
VAT - Gap Convergence in Central and Eastern Europe Lóránd Králik Erzsébet Szász Partium Christian University, Faculty of Economics and Social Science, Oradea, Romania [email protected] [email protected] Abstract Tax system structure and the effectiveness of tax collection influences tax-gap. In the present research the authors analyse the improvement of tax collection practices in 26 European Union member states. The paper also explores the convergence characterizing the process of VAT-gap reduction in the Central and Eastern European region. The VAT-gap is investigated with the beta (β) convergence model developed by Barro and Sala-i-Martin (1992), initially used for the measurement of real income convergence. Beta-convergence means that countries with lower level of income grow faster than rich ones in the same period. No significant VAT-gap convergence could be identified between the 26 European countries, but a relatively strong convergence could be observed in the case of the CEE region. Key words: tax gap, tax collection, effectiveness, value added tax, convergence J.E.L. classification: H25, H26, G28, C18, O47 1. Introduction Tax evasion level and the impact of invisible economy is estimated by different methods. VAT- gap can be determined using two models: indirect and direct. The direct model, namely the bottom- up approach, employs microeconomic data resulting from audits or sample surveys, while the indirect, top-down model uses the National Accounts main macroeconomic indicators and financial prognosis. The indirect method can be classified in two submodels, one of them is applying macroeconomic data, whereas the latter is using advanced econometric formulae for estimating levels of value added tax evasion and the presence of invisible economy. Former research studies underline that value added tax gap in Romania could be decreased from the actual very high level, which situates the county in the top of tax evasion ranking within the European Union: the spread between the realizable and the certainly collected VAT was 37% in 2015. For tax collection improvement various pursuable examples can be identified inside the European Community and our region, too. These economies elaborated innovative methods and practices in order to diminish tax avoidance. Government revenues could be boosted in parallel with tax gap decrease with the adoption of tax collection best practices. The accomplishments of the CEE states – like the online cash registers – let us suppose that Romania can reduce tax gap in a concise interval through the implementation of effective VAT collection measures. The wealth of researches investigating tax policy convergence among EU member countries could not identify any evidence of long run convergence. The present paper analyzes the VAT-gap beta-convergence which indicates that states with a high incipient level of this indicator present a quicker decrease rate than states with lower initial levels. ß convergence appears during those periods when all counties are in similar steady states, so they converge in a long term to reach an absolute convergence level. “Ovidius” University Annals, Economic Sciences Series Volume XIX, Issue 2 /2019 772
Transcript of VAT - Gap Convergence in Central and Eastern Europe
VAT - Gap Convergence in Central and Eastern Europe
Lóránd Králik Erzsébet Szász
Partium Christian University, Faculty of Economics and Social Science, Oradea, Romania
[email protected] [email protected]
Abstract
Tax system structure and the effectiveness of tax collection influences tax-gap. In the present research the authors analyse the improvement of tax collection practices in 26 European Union member states. The paper also explores the convergence characterizing the process of VAT-gap reduction in the Central and Eastern European region. The VAT-gap is investigated with the beta (β) convergence model developed by Barro and Sala-i-Martin (1992), initially used for the measurement of real income convergence. Beta-convergence means that countries with lower level of income grow faster than rich ones in the same period. No significant VAT-gap convergence could be identified between the 26 European countries, but a relatively strong convergence could be observed in the case of the CEE region.
Key words: tax gap, tax collection, effectiveness, value added tax, convergence J.E.L. classification: H25, H26, G28, C18, O47 1. Introduction
Tax evasion level and the impact of invisible economy is estimated by different methods. VAT-gap can be determined using two models: indirect and direct. The direct model, namely the bottom-up approach, employs microeconomic data resulting from audits or sample surveys, while the indirect, top-down model uses the National Accounts main macroeconomic indicators and financial prognosis. The indirect method can be classified in two submodels, one of them is applying macroeconomic data, whereas the latter is using advanced econometric formulae for estimating levels of value added tax evasion and the presence of invisible economy.
Former research studies underline that value added tax gap in Romania could be decreased from the actual very high level, which situates the county in the top of tax evasion ranking within the European Union: the spread between the realizable and the certainly collected VAT was 37% in 2015. For tax collection improvement various pursuable examples can be identified inside the European Community and our region, too. These economies elaborated innovative methods and practices in order to diminish tax avoidance. Government revenues could be boosted in parallel with tax gap decrease with the adoption of tax collection best practices. The accomplishments of the CEE states – like the online cash registers – let us suppose that Romania can reduce tax gap in a concise interval through the implementation of effective VAT collection measures.
The wealth of researches investigating tax policy convergence among EU member countries could not identify any evidence of long run convergence. The present paper analyzes the VAT-gap beta-convergence which indicates that states with a high incipient level of this indicator present a quicker decrease rate than states with lower initial levels. ß convergence appears during those periods when all counties are in similar steady states, so they converge in a long term to reach an absolute convergence level.
“Ovidius” University Annals, Economic Sciences Series Volume XIX, Issue 2 /2019
772
2. Literature review
Economic research offers an evidence that country heterogeneity will prevent tax systems from absolute convergence. By the way, particularities, like country size, economic development, natural resources could make plausible the conditional convergence (Becher-Elsayyad, 2009). Some researchers found that policy coordination within European Union attains higher levels of convergence. Even so De la Feria (2013) remarked taht the EU countries VAT systems tend to rank below the OECD countries efficiency ratio. He concludes that since 2009 25 of the 33 OECD countries have increased their VAT rates and can be found a broad convergence of standard rate across the European Union around the twenty percent mark. D`Agosto and Pisani (2014) are testing the asymmetrics in the territorial VAT-gap in EU and they found that tax gap is positively correlated with the economic conditions, business cycle and the tax moral of the geographical area. Studying the VAT-gap in East Germany Möhlmann (2014) conclude that temporary economic shocks may affect the long-term convergence trend. In a correlation analisys Redo (2019) found in CEE countries within the 2000-2016 period a strong positive interdependence between GDP`s yearly nominal changes and yearly changes in value ad taxes revenue. The increased tax gap in the CEE countries situated in the lower income bracket and having higher public deficit heightens governmental debt, which in turn implies higher taxes and decreases the predictability of public expenditures and increases capital markets risk premium.
The worst performing EU countries in terms of VAT revenues collection are Lithuania, Romania, Slovakia. Nerudova and Dobranschi (2019) remarks that this countries have the largest differences between time-varying and persistent VAT-gap proving the high level of inefficiency of tax administration. Phua (2015) considered that improving tax administration would certainly reduce VAT-gap and enhance revenue yield. Tax evasion have increased in the globalization process with the mobility of capital. The complexity of cross-border transactions make it increasingly difficult for authorities to identify and monitor the collection of tax revenues.
3. Research methodology and data
In the 1990s the measurement of the disparity reduction in terms of country-level Gross Domestic Product per capita was realized using the beta-convergence model. Barro and Sala-i-Martin (1992) defined beta convergence as negative correlation between the initial level of real income and the GDP growth in time. This means that poor regions grow with a faster pace than the wealthier ones with the long term possibility for the former to catch up with the latter, supposing that all economies converge towards the same steady-state. The main formula of beta-convergence elaborated by Barro and Sala-i-Martin (1992) is the following:
The average real income per capita in the (t) period, which figures on the left side of the
regression equation, is dependent the initial GDP level ( ). α is the absolute term of the regression, β is the regression coefficient, refers to unexplained variation and N represents the count of observations in the data set. We transformed the Barro and Sala-i-Martin formula, substituting the real income per capita with a country tax gap indicator. In case of convergence ß becomes negative, higher initial indicator levels influence final growth negatively.
We extracted the annual data series of tax gap from the Studies and Reports on the VAT-gap in the EU-28 Member States released by the Center for Social and Economic Research and the Institute for Advanced Studies. The studied period was 2000-2016, but we could not identify complete data series for Cyprus and Croatia, so our research target consisted of the other 26 EU countries. In the second part of our study we analyzed the convergence in our region for seven CEE countries, namely Bulgaria, Czech Republic, Hungary, Poland, Romania, Slovakia and Slovenia. A data series structural break was found for the year 2010, so we split the whole interval into two sub-periods: 2000-2010, 2011-2016.
“Ovidius” University Annals, Economic Sciences Series Volume XIX, Issue 2 /2019
773
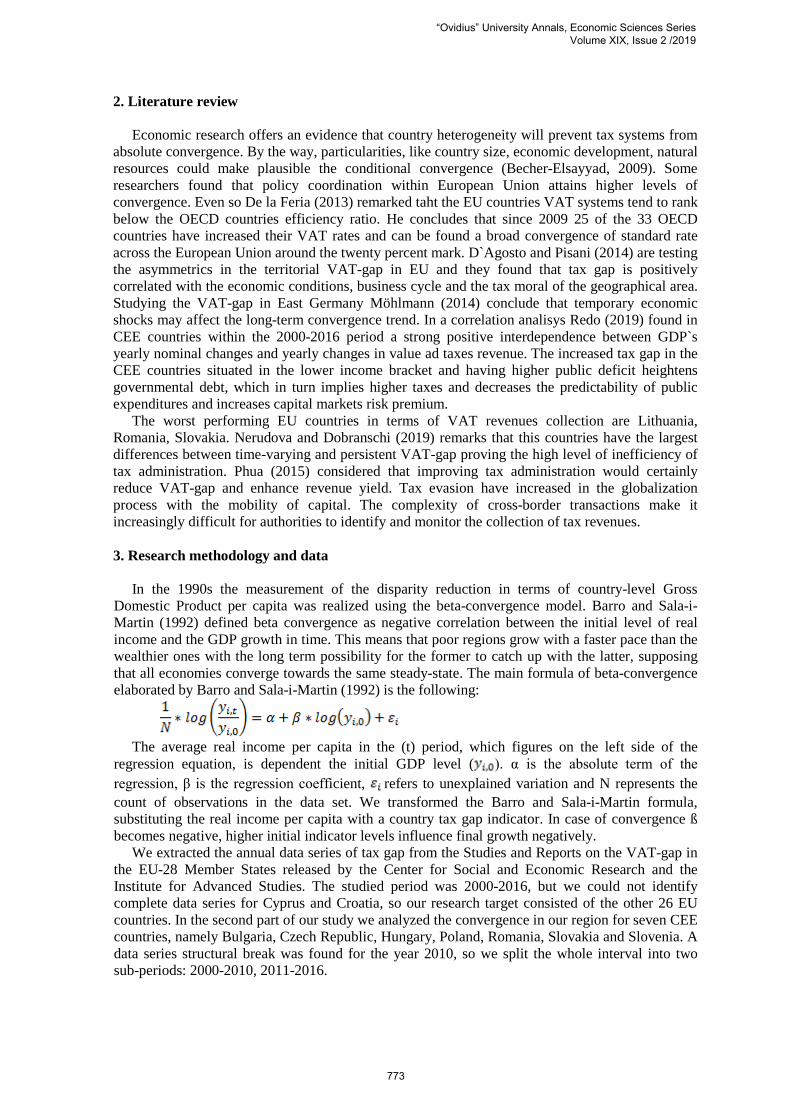
4. Results Studying the VAT-gap of the 26 examined EU-country for the whole period of 2000-2016 we
found not a visible convergence. We can deduce that the countries VAT-gap levels are extremely different and their variation are positively correlated with the economic conditions and business cycles. At the most of the EU-countries the VAT-gap is increasing between 2009 and 2011, and decreasing after 2013.
Figure no. 1. VAT-gap in the 26 EU countries between 2000 and 2016
Source: Studies and Reports on the VAT-gap in the EU-28 Member States 2012-2016
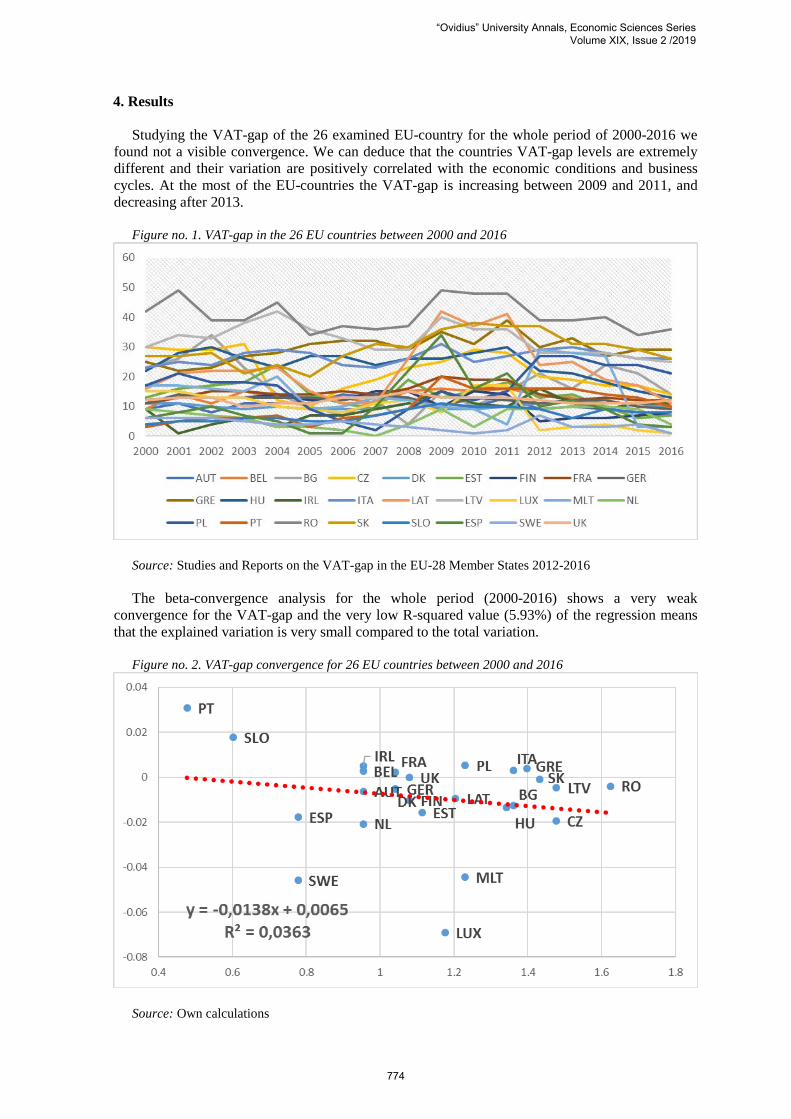
The beta-convergence analysis for the whole period (2000-2016) shows a very weak
convergence for the VAT-gap and the very low R-squared value (5.93%) of the regression means that the explained variation is very small compared to the total variation.
Figure no. 2. VAT-gap convergence for 26 EU countries between 2000 and 2016
Source: Own calculations
“Ovidius” University Annals, Economic Sciences Series Volume XIX, Issue 2 /2019
774
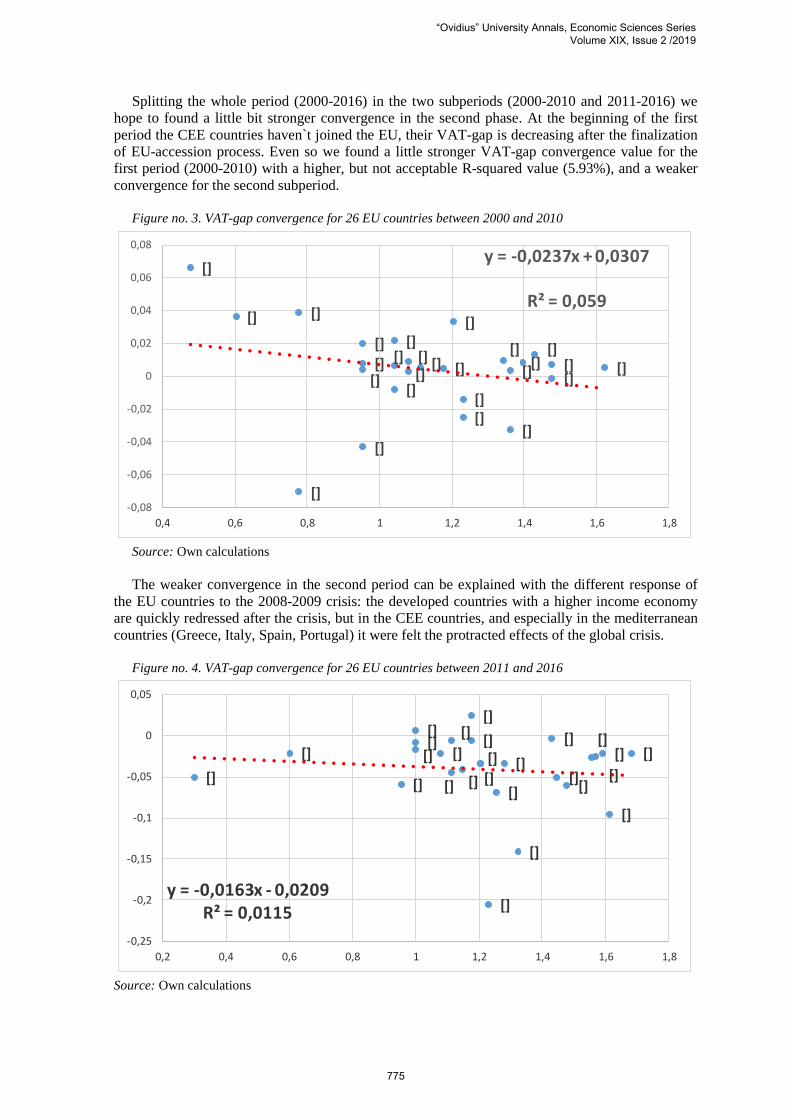
Splitting the whole period (2000-2016) in the two subperiods (2000-2010 and 2011-2016) we hope to found a little bit stronger convergence in the second phase. At the beginning of the first period the CEE countries haven`t joined the EU, their VAT-gap is decreasing after the finalization of EU-accession process. Even so we found a little stronger VAT-gap convergence value for the first period (2000-2010) with a higher, but not acceptable R-squared value (5.93%), and a weaker convergence for the second subperiod.
Figure no. 3. VAT-gap convergence for 26 EU countries between 2000 and 2010
[]
[]
[]
[][]
[][][]
[] [][]
[] []
[]
[][]
[]
[]
[]
[]
[][]
[] []
[]
[]
y = -0,0237x + 0,0307
R² = 0,059
-0,08
-0,06
-0,04
-0,02
0
0,02
0,04
0,06
0,08
0,4 0,6 0,8 1 1,2 1,4 1,6 1,8
Source: Own calculations
The weaker convergence in the second period can be explained with the different response of the EU countries to the 2008-2009 crisis: the developed countries with a higher income economy are quickly redressed after the crisis, but in the CEE countries, and especially in the mediterranean countries (Greece, Italy, Spain, Portugal) it were felt the protracted effects of the global crisis.
Figure no. 4. VAT-gap convergence for 26 EU countries between 2011 and 2016
[] []
[]
[]
[]
[][]
[][] []
[]
[] []
[]
[]
[]
[]
[]
[]
[] [][]
[]
[]
[]
[]
y = -0,0163x - 0,0209R² = 0,0115
-0,25
-0,2
-0,15
-0,1
-0,05
0
0,05
0,2 0,4 0,6 0,8 1 1,2 1,4 1,6 1,8
Source: Own calculations
“Ovidius” University Annals, Economic Sciences Series Volume XIX, Issue 2 /2019
775
By the way we found no remarkable convergence in tax revenue collection for the EU economies nor for the 2000-2016 period, nor for the two subperiods. On the other hand viewing the VAT-gap convergence graphs for the 26 EU countries we can remarks a convergence clubs. For the whole period we can identify a CEE countries convergence club with Romania, Hungary, Bulgaria, Slovakia, Czechia, Poland, Lithuania, Latvia (Slovenia taking not part of this club) and two mediterranean countries with a very close VAT-gap convergence level: Greece and Italy.
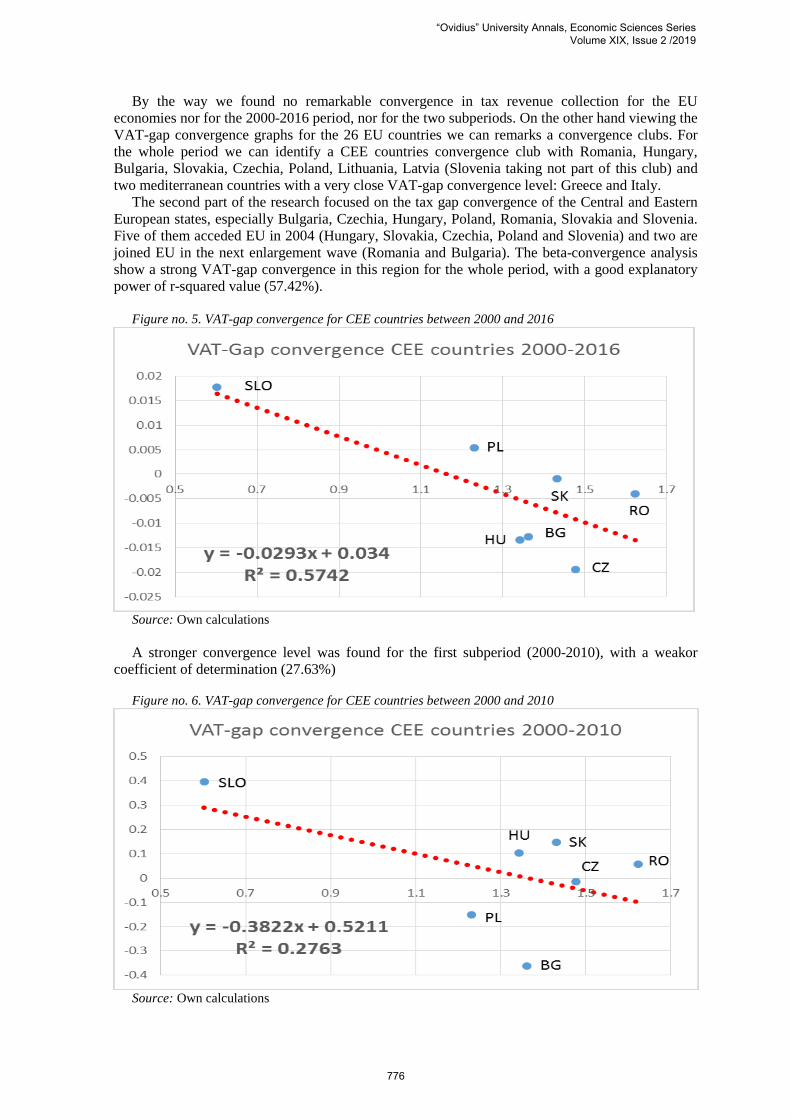
The second part of the research focused on the tax gap convergence of the Central and Eastern European states, especially Bulgaria, Czechia, Hungary, Poland, Romania, Slovakia and Slovenia. Five of them acceded EU in 2004 (Hungary, Slovakia, Czechia, Poland and Slovenia) and two are joined EU in the next enlargement wave (Romania and Bulgaria). The beta-convergence analysis show a strong VAT-gap convergence in this region for the whole period, with a good explanatory power of r-squared value (57.42%).
Figure no. 5. VAT-gap convergence for CEE countries between 2000 and 2016
Source: Own calculations
A stronger convergence level was found for the first subperiod (2000-2010), with a weakor
coefficient of determination (27.63%)
Figure no. 6. VAT-gap convergence for CEE countries between 2000 and 2010
Source: Own calculations
“Ovidius” University Annals, Economic Sciences Series Volume XIX, Issue 2 /2019
776
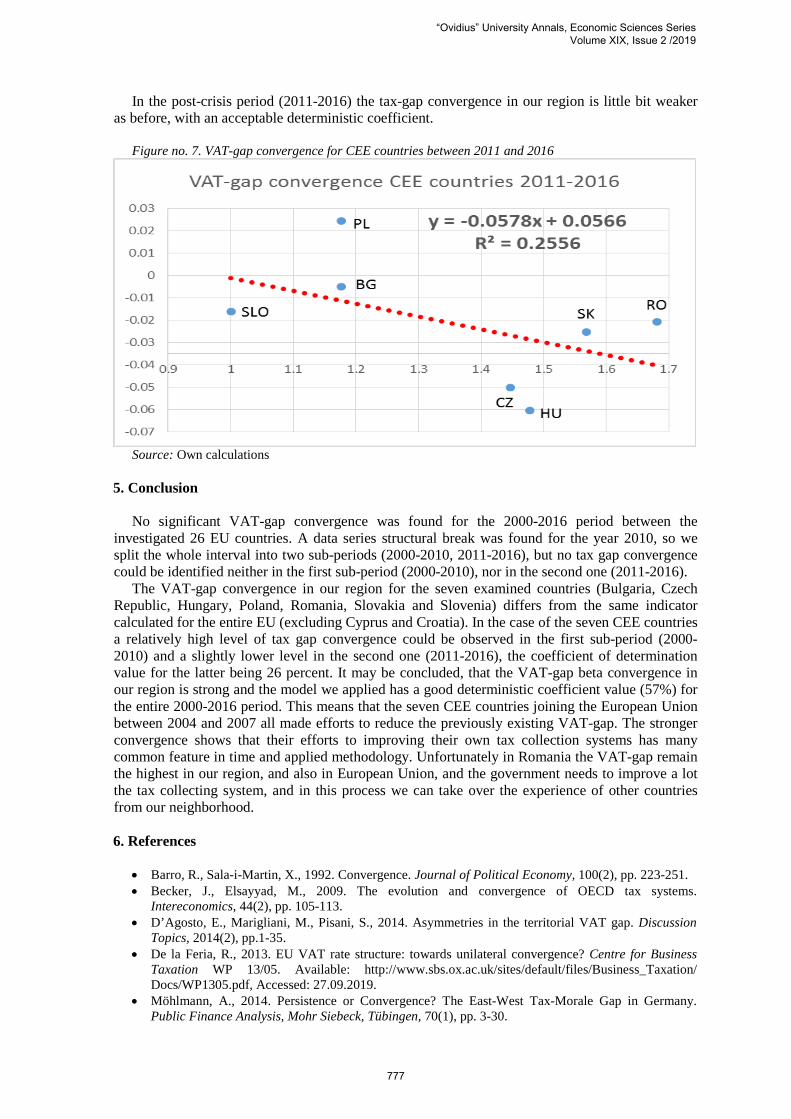
In the post-crisis period (2011-2016) the tax-gap convergence in our region is little bit weaker as before, with an acceptable deterministic coefficient.
Figure no. 7. VAT-gap convergence for CEE countries between 2011 and 2016
Source: Own calculations
5. Conclusion
No significant VAT-gap convergence was found for the 2000-2016 period between the investigated 26 EU countries. A data series structural break was found for the year 2010, so we split the whole interval into two sub-periods (2000-2010, 2011-2016), but no tax gap convergence could be identified neither in the first sub-period (2000-2010), nor in the second one (2011-2016).
The VAT-gap convergence in our region for the seven examined countries (Bulgaria, Czech Republic, Hungary, Poland, Romania, Slovakia and Slovenia) differs from the same indicator calculated for the entire EU (excluding Cyprus and Croatia). In the case of the seven CEE countries a relatively high level of tax gap convergence could be observed in the first sub-period (2000-2010) and a slightly lower level in the second one (2011-2016), the coefficient of determination value for the latter being 26 percent. It may be concluded, that the VAT-gap beta convergence in our region is strong and the model we applied has a good deterministic coefficient value (57%) for the entire 2000-2016 period. This means that the seven CEE countries joining the European Union between 2004 and 2007 all made efforts to reduce the previously existing VAT-gap. The stronger convergence shows that their efforts to improving their own tax collection systems has many common feature in time and applied methodology. Unfortunately in Romania the VAT-gap remain the highest in our region, and also in European Union, and the government needs to improve a lot the tax collecting system, and in this process we can take over the experience of other countries from our neighborhood.
6. References
• Barro, R., Sala-i-Martin, X., 1992. Convergence. Journal of Political Economy, 100(2), pp. 223-251. • Becker, J., Elsayyad, M., 2009. The evolution and convergence of OECD tax systems.
Intereconomics, 44(2), pp. 105-113. • D’Agosto, E., Marigliani, M., Pisani, S., 2014. Asymmetries in the territorial VAT gap. Discussion
Topics, 2014(2), pp.1-35. • De la Feria, R., 2013. EU VAT rate structure: towards unilateral convergence? Centre for Business
Taxation WP 13/05. Available: http://www.sbs.ox.ac.uk/sites/default/files/Business_Taxation/ Docs/WP1305.pdf, Accessed: 27.09.2019.
• Möhlmann, A., 2014. Persistence or Convergence? The East-West Tax-Morale Gap in Germany. Public Finance Analysis, Mohr Siebeck, Tübingen, 70(1), pp. 3-30.
“Ovidius” University Annals, Economic Sciences Series Volume XIX, Issue 2 /2019
777

• Nerudova, D., Dobranschi, M., 2019. Alternative method to measure the VAT gap in the EU: Stochastic tax frontier model approach. PLoS ONE, 14(1). Available: https://doi.org/10.1371/journal.pone.0211317. Accessed: 29.09.2019.
• Phua, S., 2015. Convergence in global tax compliance. Singapore Journal of Legal Studies, July 2015, pp. 77-104.
• Redo, M., 2019. The VAT gap as a limiting factor for economic development of the CEE countries. Challenges of the Future, 4(1), pp. 1-14.
• Study and Reports on the VAT Gap in the EU-28 Member States 2012-2018. CASE – Center for Social and Economic Research. https://ec.europa.eu/taxation_customs/sites/taxation/files/2018_vat_gap_report_en.pdf. Accessed: 17.07.2019.
“Ovidius” University Annals, Economic Sciences Series Volume XIX, Issue 2 /2019
778