Validation of the methodology for lithium-ion batteries ... monitoring algorithm into Battery...
12
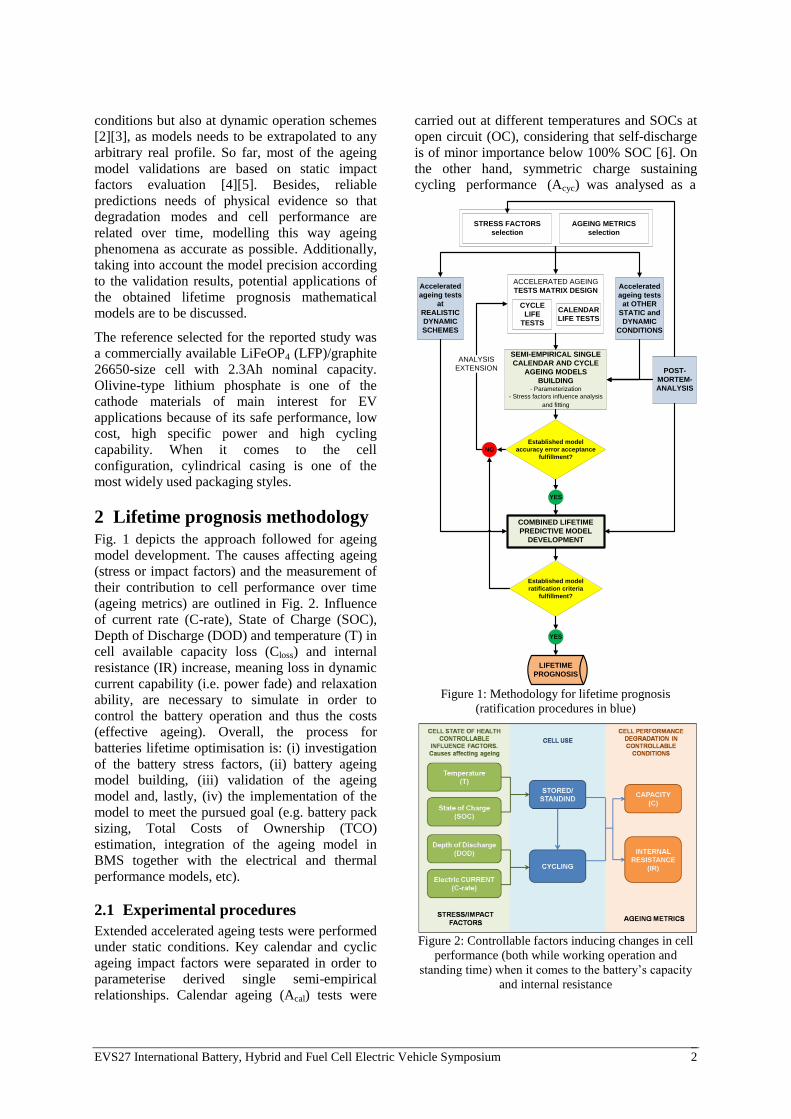
EVS27 International Battery, Hybrid and Fuel Cell Electric Vehicle Symposium 1 EVS27 Barcelona, Spain, November 17-20, 2013 Validation of the methodology for lithium-ion batteries lifetime prognosis E. Sarasketa-Zabala*, I. Laresgoiti, I. Alava, M. Rivas, I. Villarreal, F. Blanco IK4-Ikerlan, Energy Business Unit, Arabako Teknologi Parkea, Juan de La Cierva 1, E-01510 Miñao, Spain *E-mail: [email protected] Abstract Battery lifetime prognosis is a key requirement for successful market introduction of rechargeable Energy Storage Systems (ESS) based on lithium-ion (Li-ion) technology. In order to make decisions at the system design stage, a procedure for making efficient predictions of battery performance over time is necessary to be developed. In this paper, a general methodology for the evaluation of lifetime prediction is presented, covering the semi-empirical aging model precision and validity. Both calendar-life and cycle-life performance were investigated. Moreover, standing time and working operation were examined jointly using realistic operating profiles. The aim was the predictive model to be suitable for any application, including electric vehicle (EV), within the considered operating range. The efforts were especially focused on model ratification procedures and predictions goodness evaluation. The validation processes not only dealt with static impact factors evaluation but also with dynamic operation schemes. Besides, integration of ageing monitoring algorithm into Battery Management System (BMS) was evaluated. Battery pack design and operation strategies definition criteria were also discussed based on the stress factors influence on cell performance. The presented results correspond to a lithium iron phosphate (LFP) cathode 26650-size Li-ion cell. Keywords: Lithium-ion (Li-ion), lifetime prognosis, calendar life, cycle life, ageing model, State of Health (SOH) 1 Introduction Li-ion batteries are the leading candidate for EV and other transportation applications due to specially their high energy and power density. Ageing at cell level is one of the key issues for this technology based ESS improvement, as long lifespan is required for target applications (e.g. 10 years for EV). It is therefore necessary establishing concise algorithms for long-term lifetime performance predictions based on short-term cell accelerated test data [1], as real operation condition tests are highly time and cost intensive. This research work aims to present an innovative methodology for the development of ageing models that simulate jointly cells standing time and working operation. The defined protocol pursues to come up with a compromise between the accuracy of the models and the experimental work to be carried out, focusing particularly in model ratification procedures. Not only are they based on additional tests under constant stress
Transcript of Validation of the methodology for lithium-ion batteries ... monitoring algorithm into Battery...
EVS27 International Battery, Hybrid and Fuel Cell Electric Vehicle Symposium 1
EVS27
Barcelona, Spain, November 17-20, 2013
Validation of the methodology for lithium-ion batteries
lifetime prognosis
E. Sarasketa-Zabala*, I. Laresgoiti, I. Alava, M. Rivas, I. Villarreal, F. Blanco
IK4-Ikerlan, Energy Business Unit, Arabako Teknologi Parkea, Juan de La Cierva 1, E-01510 Miñao, Spain
*E-mail: [email protected]
Abstract
Battery lifetime prognosis is a key requirement for successful market introduction of rechargeable Energy
Storage Systems (ESS) based on lithium-ion (Li-ion) technology. In order to make decisions at the system
design stage, a procedure for making efficient predictions of battery performance over time is necessary to
be developed.
In this paper, a general methodology for the evaluation of lifetime prediction is presented, covering the
semi-empirical aging model precision and validity. Both calendar-life and cycle-life performance were
investigated. Moreover, standing time and working operation were examined jointly using realistic
operating profiles. The aim was the predictive model to be suitable for any application, including electric
vehicle (EV), within the considered operating range. The efforts were especially focused on model
ratification procedures and predictions goodness evaluation. The validation processes not only dealt with
static impact factors evaluation but also with dynamic operation schemes. Besides, integration of ageing
monitoring algorithm into Battery Management System (BMS) was evaluated. Battery pack design and
operation strategies definition criteria were also discussed based on the stress factors influence on cell
performance. The presented results correspond to a lithium iron phosphate (LFP) cathode 26650-size Li-ion
cell.
Keywords: Lithium-ion (Li-ion), lifetime prognosis, calendar life, cycle life, ageing model, State of Health (SOH)
1 Introduction Li-ion batteries are the leading candidate for EV
and other transportation applications due to
specially their high energy and power density.
Ageing at cell level is one of the key issues for
this technology based ESS improvement, as long
lifespan is required for target applications (e.g. 10
years for EV). It is therefore necessary
establishing concise algorithms for long-term lifetime performance predictions based on
short-term cell accelerated test data [1], as real
operation condition tests are highly time and cost
intensive. This research work aims to present an
innovative methodology for the development of
ageing models that simulate jointly cells standing
time and working operation. The defined protocol
pursues to come up with a compromise between
the accuracy of the models and the experimental
work to be carried out, focusing particularly in
model ratification procedures. Not only are they based on additional tests under constant stress
EVS27 International Battery, Hybrid and Fuel Cell Electric Vehicle Symposium 2
conditions but also at dynamic operation schemes
[2][3], as models needs to be extrapolated to any
arbitrary real profile. So far, most of the ageing
model validations are based on static impact
factors evaluation [4][5]. Besides, reliable
predictions needs of physical evidence so that
degradation modes and cell performance are
related over time, modelling this way ageing
phenomena as accurate as possible. Additionally,
taking into account the model precision according
to the validation results, potential applications of
the obtained lifetime prognosis mathematical
models are to be discussed.
The reference selected for the reported study was
a commercially available LiFeOP4 (LFP)/graphite
26650-size cell with 2.3Ah nominal capacity.
Olivine-type lithium phosphate is one of the
cathode materials of main interest for EV
applications because of its safe performance, low
cost, high specific power and high cycling
capability. When it comes to the cell
configuration, cylindrical casing is one of the
most widely used packaging styles.
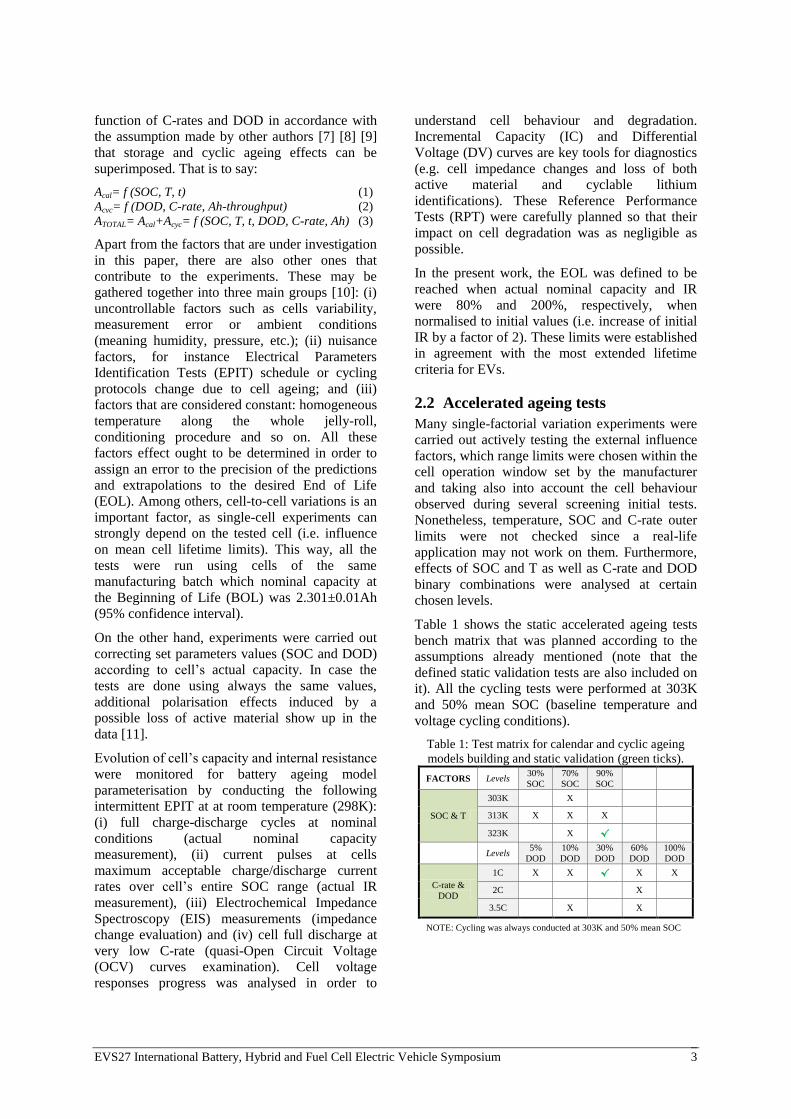
2 Lifetime prognosis methodology Fig. 1 depicts the approach followed for ageing
model development. The causes affecting ageing
(stress or impact factors) and the measurement of
their contribution to cell performance over time
(ageing metrics) are outlined in Fig. 2. Influence
of current rate (C-rate), State of Charge (SOC),
Depth of Discharge (DOD) and temperature (T) in
cell available capacity loss (Closs) and internal
resistance (IR) increase, meaning loss in dynamic
current capability (i.e. power fade) and relaxation
ability, are necessary to simulate in order to
control the battery operation and thus the costs
(effective ageing). Overall, the process for
batteries lifetime optimisation is: (i) investigation
of the battery stress factors, (ii) battery ageing
model building, (iii) validation of the ageing
model and, lastly, (iv) the implementation of the
model to meet the pursued goal (e.g. battery pack
sizing, Total Costs of Ownership (TCO)
estimation, integration of the ageing model in
BMS together with the electrical and thermal
performance models, etc).
2.1 Experimental procedures
Extended accelerated ageing tests were performed
under static conditions. Key calendar and cyclic
ageing impact factors were separated in order to
parameterise derived single semi-empirical
relationships. Calendar ageing (Acal) tests were
carried out at different temperatures and SOCs at
open circuit (OC), considering that self-discharge
is of minor importance below 100% SOC [6]. On
the other hand, symmetric charge sustaining
cycling performance (Acyc) was analysed as a
Figure 1: Methodology for lifetime prognosis
(ratification procedures in blue)
Figure 2: Controllable factors inducing changes in cell
performance (both while working operation and
standing time) when it comes to the battery’s capacity
and internal resistance
STRESS FACTORS
selection
AGEING METRICS
selection
ACCELERATED AGEING
TESTS MATRIX DESIGN
CYCLE
LIFE
TESTS
CALENDAR
LIFE TESTS
Accelerated
ageing tests
at
REALISTIC
DYNAMIC
SCHEMES
Accelerated
ageing tests
at OTHER
STATIC and
DYNAMIC
CONDITIONS
POST-
MORTEM-
ANALYSIS
SEMI-EMPIRICAL SINGLE
CALENDAR AND CYCLE
AGEING MODELS
BUILDING- Parameterization
- Stress factors influence analysis
and fitting
Established model
accuracy error acceptance
fulfillment?
NO
ANALYSIS
EXTENSION
YES
COMBINED LIFETIME
PREDICTIVE MODEL
DEVELOPMENT
Established model
ratification criteria
fulfillment?
YES
LIFETIME
PROGNOSIS
EVS27 International Battery, Hybrid and Fuel Cell Electric Vehicle Symposium 3
function of C-rates and DOD in accordance with
the assumption made by other authors [7] [8] [9]
that storage and cyclic ageing effects can be
superimposed. That is to say:
Acal= f (SOC, T, t) (1)
Acyc= f (DOD, C-rate, Ah-throughput) (2)
ATOTAL= Acal+Acyc= f (SOC, T, t, DOD, C-rate, Ah) (3)
Apart from the factors that are under investigation
in this paper, there are also other ones that
contribute to the experiments. These may be
gathered together into three main groups [10]: (i)
uncontrollable factors such as cells variability,
measurement error or ambient conditions
(meaning humidity, pressure, etc.); (ii) nuisance
factors, for instance Electrical Parameters
Identification Tests (EPIT) schedule or cycling
protocols change due to cell ageing; and (iii)
factors that are considered constant: homogeneous
temperature along the whole jelly-roll,
conditioning procedure and so on. All these
factors effect ought to be determined in order to
assign an error to the precision of the predictions
and extrapolations to the desired End of Life
(EOL). Among others, cell-to-cell variations is an
important factor, as single-cell experiments can
strongly depend on the tested cell (i.e. influence
on mean cell lifetime limits). This way, all the
tests were run using cells of the same
manufacturing batch which nominal capacity at
the Beginning of Life (BOL) was 2.301±0.01Ah
(95% confidence interval).
On the other hand, experiments were carried out
correcting set parameters values (SOC and DOD)
according to cell’s actual capacity. In case the
tests are done using always the same values,
additional polarisation effects induced by a
possible loss of active material show up in the
data [11].
Evolution of cell’s capacity and internal resistance
were monitored for battery ageing model
parameterisation by conducting the following
intermittent EPIT at at room temperature (298K):
(i) full charge-discharge cycles at nominal
conditions (actual nominal capacity
measurement), (ii) current pulses at cells
maximum acceptable charge/discharge current
rates over cell’s entire SOC range (actual IR
measurement), (iii) Electrochemical Impedance
Spectroscopy (EIS) measurements (impedance
change evaluation) and (iv) cell full discharge at
very low C-rate (quasi-Open Circuit Voltage
(OCV) curves examination). Cell voltage
responses progress was analysed in order to
understand cell behaviour and degradation.
Incremental Capacity (IC) and Differential
Voltage (DV) curves are key tools for diagnostics
(e.g. cell impedance changes and loss of both
active material and cyclable lithium
identifications). These Reference Performance
Tests (RPT) were carefully planned so that their
impact on cell degradation was as negligible as
possible.
In the present work, the EOL was defined to be
reached when actual nominal capacity and IR
were 80% and 200%, respectively, when
normalised to initial values (i.e. increase of initial
IR by a factor of 2). These limits were established
in agreement with the most extended lifetime
criteria for EVs.
2.2 Accelerated ageing tests
Many single-factorial variation experiments were
carried out actively testing the external influence
factors, which range limits were chosen within the
cell operation window set by the manufacturer
and taking also into account the cell behaviour
observed during several screening initial tests.
Nonetheless, temperature, SOC and C-rate outer
limits were not checked since a real-life
application may not work on them. Furthermore,
effects of SOC and T as well as C-rate and DOD
binary combinations were analysed at certain
chosen levels.
Table 1 shows the static accelerated ageing tests
bench matrix that was planned according to the
assumptions already mentioned (note that the
defined static validation tests are also included on
it). All the cycling tests were performed at 303K
and 50% mean SOC (baseline temperature and
voltage cycling conditions).
Table 1: Test matrix for calendar and cyclic ageing
models building and static validation (green ticks).
FACTORS Levels 30%
SOC
70%
SOC
90%
SOC
SOC & T
303K
X
313K X X X
323K
X √
Levels
5%
DOD
10%
DOD
30%
DOD
60%
DOD
100%
DOD
C-rate &
DOD
1C X X √ X X
2C
X
3.5C
X
X
NOTE: Cycling was always conducted at 303K and 50% mean SOC
EVS27 International Battery, Hybrid and Fuel Cell Electric Vehicle Symposium 4
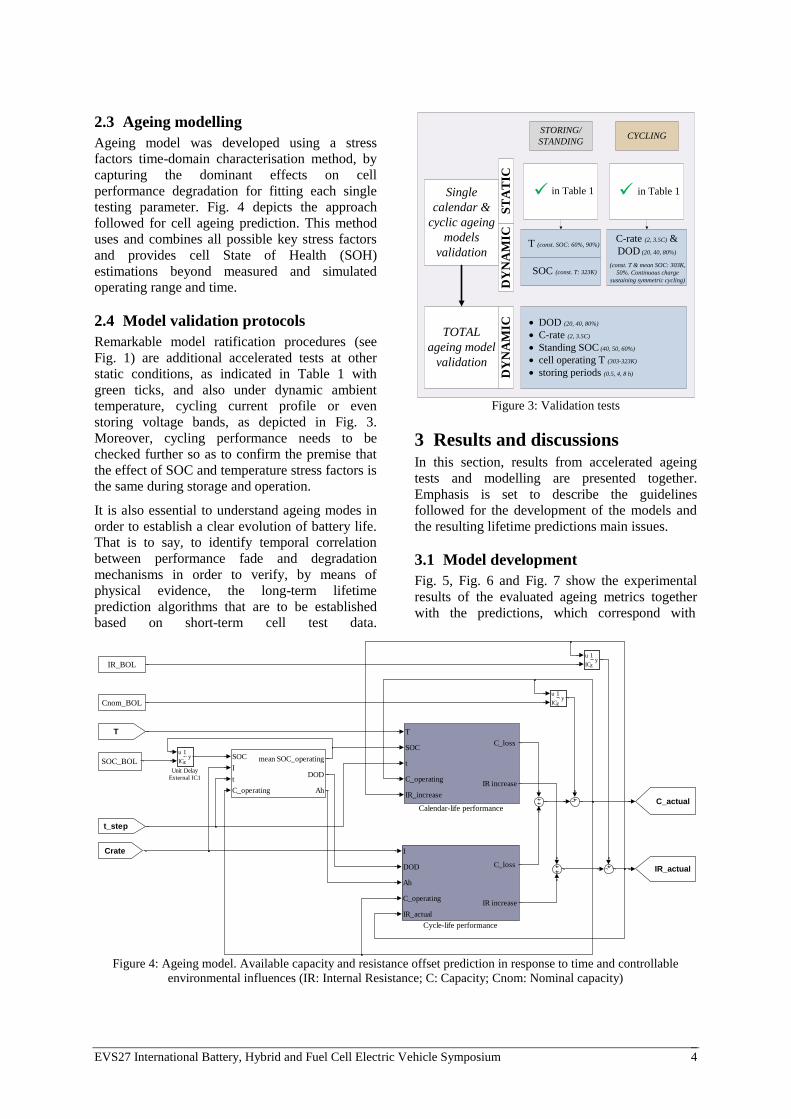
2.3 Ageing modelling
Ageing model was developed using a stress
factors time-domain characterisation method, by
capturing the dominant effects on cell
performance degradation for fitting each single
testing parameter. Fig. 4 depicts the approach
followed for cell ageing prediction. This method
uses and combines all possible key stress factors
and provides cell State of Health (SOH)
estimations beyond measured and simulated
operating range and time.
2.4 Model validation protocols
Remarkable model ratification procedures (see
Fig. 1) are additional accelerated tests at other
static conditions, as indicated in Table 1 with
green ticks, and also under dynamic ambient
temperature, cycling current profile or even
storing voltage bands, as depicted in Fig. 3.
Moreover, cycling performance needs to be
checked further so as to confirm the premise that
the effect of SOC and temperature stress factors is
the same during storage and operation.
It is also essential to understand ageing modes in
order to establish a clear evolution of battery life.
That is to say, to identify temporal correlation
between performance fade and degradation
mechanisms in order to verify, by means of
physical evidence, the long-term lifetime
prediction algorithms that are to be established
based on short-term cell test data.
Figure 3: Validation tests
3 Results and discussions In this section, results from accelerated ageing
tests and modelling are presented together.
Emphasis is set to describe the guidelines
followed for the development of the models and
the resulting lifetime predictions main issues.
3.1 Model development
Fig. 5, Fig. 6 and Fig. 7 show the experimental
results of the evaluated ageing metrics together
with the predictions, which correspond with
Figure 4: Ageing model. Available capacity and resistance offset prediction in response to time and controllable
environmental influences (IR: Internal Resistance; C: Capacity; Cnom: Nominal capacity)
Single
calendar &
cyclic ageing
models
validation
STORING/
STANDINGCYCLING
ST
AT
IC
in Table 1 in Table 1
DY
NA
MIC
T (const. SOC: 60%, 90%)
SOC (const. T: 323K)
TOTAL
ageing model
validation
DY
NA
MIC · DOD (20, 40, 80%)
· C-rate (2, 3.5C)
· Standing SOC (40, 50, 60%)
· cell operating T (303-323K)
· storing periods (0.5, 4, 8 h)
C-rate (2, 3.5C) &
DOD (20, 40, 80%)
(const. T & mean SOC: 303K,
50%. Continuous charge
sustaining symmetric cycling)
ü ü
u
ICy
1
z
u
ICy
1
z
Unit Delay
External IC1
u
ICy
1
z
SOC
I
t
C_operating
mean SOC_operating
DOD
Ah
IR_actual
C_actual
T
t_step
Crate I
DOD
Ah
C_operating
IR_actual
C_loss
IR increase
Cycle-life performance
T
SOC
t
C_operating
IR_increase
C_loss
IR increase
Calendar-life performance
SOC_BOL
Cnom_BOL
IR_BOL
EVS27 International Battery, Hybrid and Fuel Cell Electric Vehicle Symposium 5
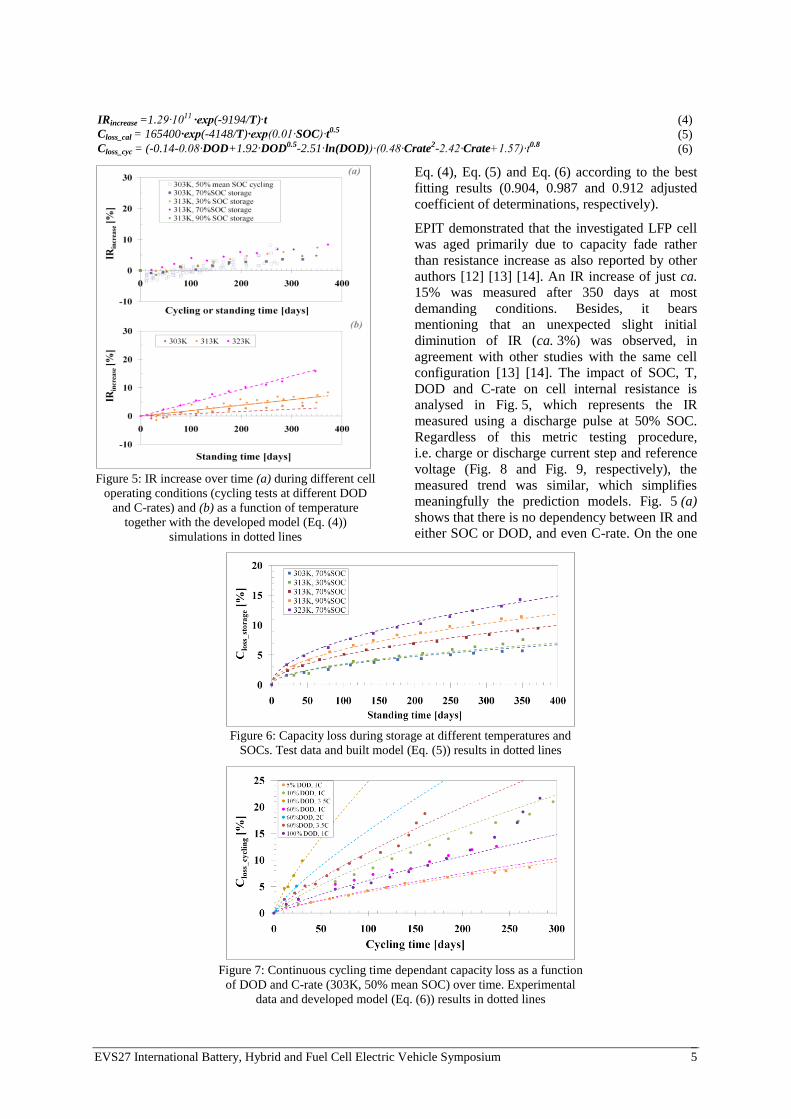
IRincrease =1.29∙1011 ∙exp(-9194/T)∙t (4) Closs_cal = 165400∙exp(-4148/T)∙exp(0.01∙SOC)∙t0.5 (5) Closs_cyc = (-0.14-0.08∙DOD+1.92∙DOD0.5-2.51∙ln(DOD))∙(0.48∙Crate2-2.42∙Crate+1.57)∙t0.8 (6)
Figure 5: IR increase over time (a) during different cell
operating conditions (cycling tests at different DOD
and C-rates) and (b) as a function of temperature
together with the developed model (Eq. (4))
simulations in dotted lines
Eq. (4), Eq. (5) and Eq. (6) according to the best
fitting results (0.904, 0.987 and 0.912 adjusted
coefficient of determinations, respectively).
EPIT demonstrated that the investigated LFP cell
was aged primarily due to capacity fade rather
than resistance increase as also reported by other
authors [12] [13] [14]. An IR increase of just ca. 15% was measured after 350 days at most
demanding conditions. Besides, it bears
mentioning that an unexpected slight initial
diminution of IR (ca. 3%) was observed, in
agreement with other studies with the same cell
configuration [13] [14]. The impact of SOC, T,
DOD and C-rate on cell internal resistance is
analysed in Fig. 5, which represents the IR
measured using a discharge pulse at 50% SOC.
Regardless of this metric testing procedure,
i.e. charge or discharge current step and reference
voltage (Fig. 8 and Fig. 9, respectively), the
measured trend was similar, which simplifies
meaningfully the prediction models. Fig. 5 (a)
shows that there is no dependency between IR and
either SOC or DOD, and even C-rate. On the one
Figure 6: Capacity loss during storage at different temperatures and
SOCs. Test data and built model (Eq. (5)) results in dotted lines
Figure 7: Continuous cycling time dependant capacity loss as a function
of DOD and C-rate (303K, 50% mean SOC) over time. Experimental
data and developed model (Eq. (6)) results in dotted lines
EVS27 International Battery, Hybrid and Fuel Cell Electric Vehicle Symposium 6
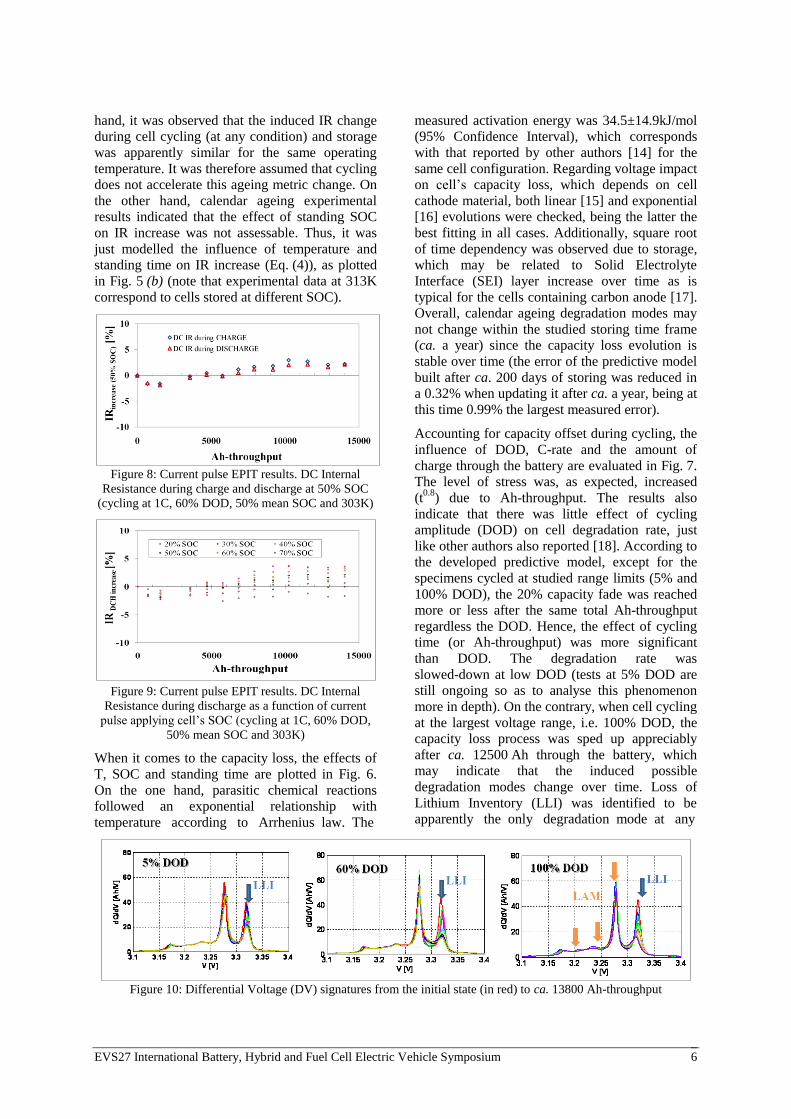
hand, it was observed that the induced IR change
during cell cycling (at any condition) and storage
was apparently similar for the same operating
temperature. It was therefore assumed that cycling
does not accelerate this ageing metric change. On
the other hand, calendar ageing experimental
results indicated that the effect of standing SOC
on IR increase was not assessable. Thus, it was
just modelled the influence of temperature and
standing time on IR increase (Eq. (4)), as plotted
in Fig. 5 (b) (note that experimental data at 313K
correspond to cells stored at different SOC).
Figure 8: Current pulse EPIT results. DC Internal
Resistance during charge and discharge at 50% SOC
(cycling at 1C, 60% DOD, 50% mean SOC and 303K)
Figure 9: Current pulse EPIT results. DC Internal
Resistance during discharge as a function of current
pulse applying cell’s SOC (cycling at 1C, 60% DOD,
50% mean SOC and 303K)
When it comes to the capacity loss, the effects of
T, SOC and standing time are plotted in Fig. 6.
On the one hand, parasitic chemical reactions
followed an exponential relationship with
temperature according to Arrhenius law. The
measured activation energy was 34.5±14.9kJ/mol
(95% Confidence Interval), which corresponds
with that reported by other authors [14] for the
same cell configuration. Regarding voltage impact
on cell’s capacity loss, which depends on cell
cathode material, both linear [15] and exponential
[16] evolutions were checked, being the latter the
best fitting in all cases. Additionally, square root
of time dependency was observed due to storage,
which may be related to Solid Electrolyte
Interface (SEI) layer increase over time as is
typical for the cells containing carbon anode [17].
Overall, calendar ageing degradation modes may
not change within the studied storing time frame
(ca. a year) since the capacity loss evolution is
stable over time (the error of the predictive model
built after ca. 200 days of storing was reduced in
a 0.32% when updating it after ca. a year, being at
this time 0.99% the largest measured error).
Accounting for capacity offset during cycling, the
influence of DOD, C-rate and the amount of
charge through the battery are evaluated in Fig. 7.
The level of stress was, as expected, increased
(t0.8
) due to Ah-throughput. The results also
indicate that there was little effect of cycling
amplitude (DOD) on cell degradation rate, just
like other authors also reported [18]. According to
the developed predictive model, except for the
specimens cycled at studied range limits (5% and
100% DOD), the 20% capacity fade was reached
more or less after the same total Ah-throughput
regardless the DOD. Hence, the effect of cycling
time (or Ah-throughput) was more significant
than DOD. The degradation rate was
slowed-down at low DOD (tests at 5% DOD are
still ongoing so as to analyse this phenomenon
more in depth). On the contrary, when cell cycling
at the largest voltage range, i.e. 100% DOD, the
capacity loss process was sped up appreciably
after ca. 12500 Ah through the battery, which
may indicate that the induced possible
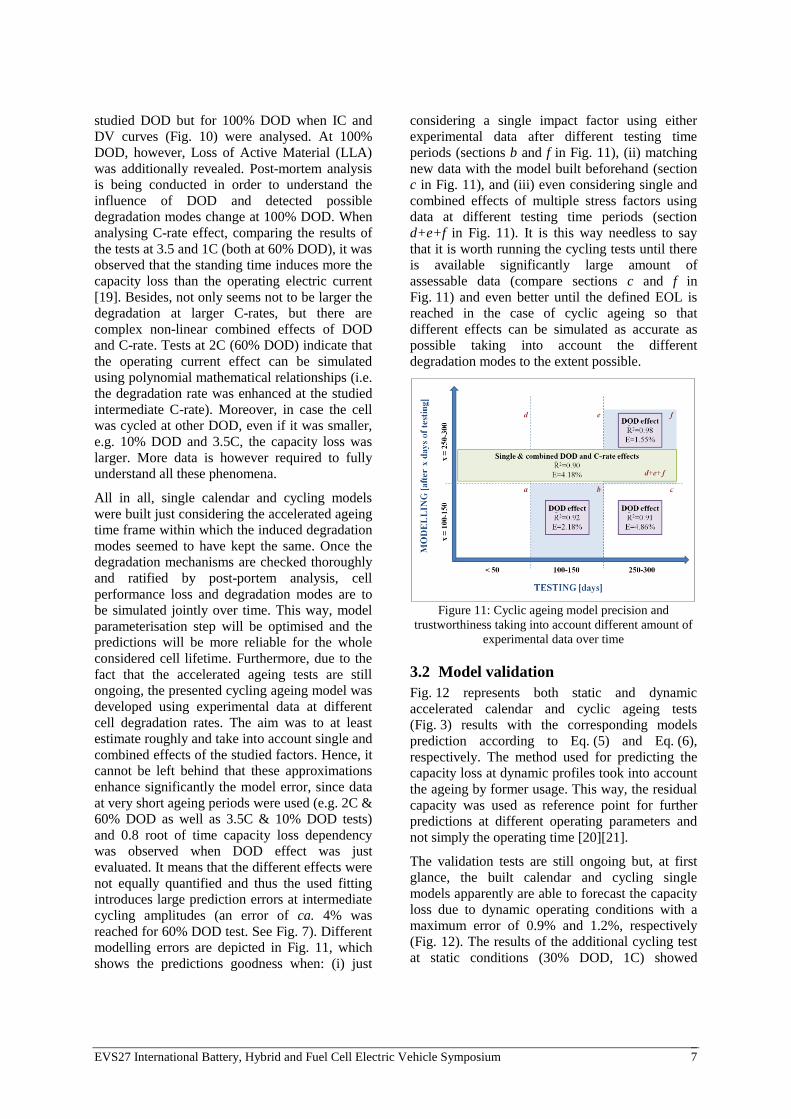
degradation modes change over time. Loss of
Lithium Inventory (LLI) was identified to be
apparently the only degradation mode at any
Figure 10: Differential Voltage (DV) signatures from the initial state (in red) to ca. 13800 Ah-throughput
EVS27 International Battery, Hybrid and Fuel Cell Electric Vehicle Symposium 7
studied DOD but for 100% DOD when IC and
DV curves (Fig. 10) were analysed. At 100%
DOD, however, Loss of Active Material (LLA)
was additionally revealed. Post-mortem analysis
is being conducted in order to understand the
influence of DOD and detected possible
degradation modes change at 100% DOD. When
analysing C-rate effect, comparing the results of
the tests at 3.5 and 1C (both at 60% DOD), it was
observed that the standing time induces more the
capacity loss than the operating electric current
[19]. Besides, not only seems not to be larger the
degradation at larger C-rates, but there are
complex non-linear combined effects of DOD
and C-rate. Tests at 2C (60% DOD) indicate that
the operating current effect can be simulated
using polynomial mathematical relationships (i.e.
the degradation rate was enhanced at the studied
intermediate C-rate). Moreover, in case the cell
was cycled at other DOD, even if it was smaller,
e.g. 10% DOD and 3.5C, the capacity loss was
larger. More data is however required to fully
understand all these phenomena.
All in all, single calendar and cycling models
were built just considering the accelerated ageing
time frame within which the induced degradation
modes seemed to have kept the same. Once the
degradation mechanisms are checked thoroughly
and ratified by post-portem analysis, cell
performance loss and degradation modes are to
be simulated jointly over time. This way, model
parameterisation step will be optimised and the
predictions will be more reliable for the whole
considered cell lifetime. Furthermore, due to the
fact that the accelerated ageing tests are still
ongoing, the presented cycling ageing model was
developed using experimental data at different
cell degradation rates. The aim was to at least
estimate roughly and take into account single and
combined effects of the studied factors. Hence, it
cannot be left behind that these approximations
enhance significantly the model error, since data
at very short ageing periods were used (e.g. 2C &
60% DOD as well as 3.5C & 10% DOD tests)
and 0.8 root of time capacity loss dependency
was observed when DOD effect was just
evaluated. It means that the different effects were
not equally quantified and thus the used fitting
introduces large prediction errors at intermediate
cycling amplitudes (an error of ca. 4% was
reached for 60% DOD test. See Fig. 7). Different
modelling errors are depicted in Fig. 11, which
shows the predictions goodness when: (i) just
considering a single impact factor using either
experimental data after different testing time
periods (sections b and f in Fig. 11), (ii) matching
new data with the model built beforehand (section
c in Fig. 11), and (iii) even considering single and
combined effects of multiple stress factors using
data at different testing time periods (section
d+e+f in Fig. 11). It is this way needless to say
that it is worth running the cycling tests until there
is available significantly large amount of
assessable data (compare sections c and f in
Fig. 11) and even better until the defined EOL is
reached in the case of cyclic ageing so that
different effects can be simulated as accurate as
possible taking into account the different
degradation modes to the extent possible.
Figure 11: Cyclic ageing model precision and
trustworthiness taking into account different amount of
experimental data over time
3.2 Model validation
Fig. 12 represents both static and dynamic
accelerated calendar and cyclic ageing tests
(Fig. 3) results with the corresponding models
prediction according to Eq. (5) and Eq. (6),
respectively. The method used for predicting the
capacity loss at dynamic profiles took into account
the ageing by former usage. This way, the residual
capacity was used as reference point for further
predictions at different operating parameters and
not simply the operating time [20][21].
The validation tests are still ongoing but, at first
glance, the built calendar and cycling single
models apparently are able to forecast the capacity
loss due to dynamic operating conditions with a
maximum error of 0.9% and 1.2%, respectively
(Fig. 12). The results of the additional cycling test
at static conditions (30% DOD, 1C) showed
EVS27 International Battery, Hybrid and Fuel Cell Electric Vehicle Symposium 8
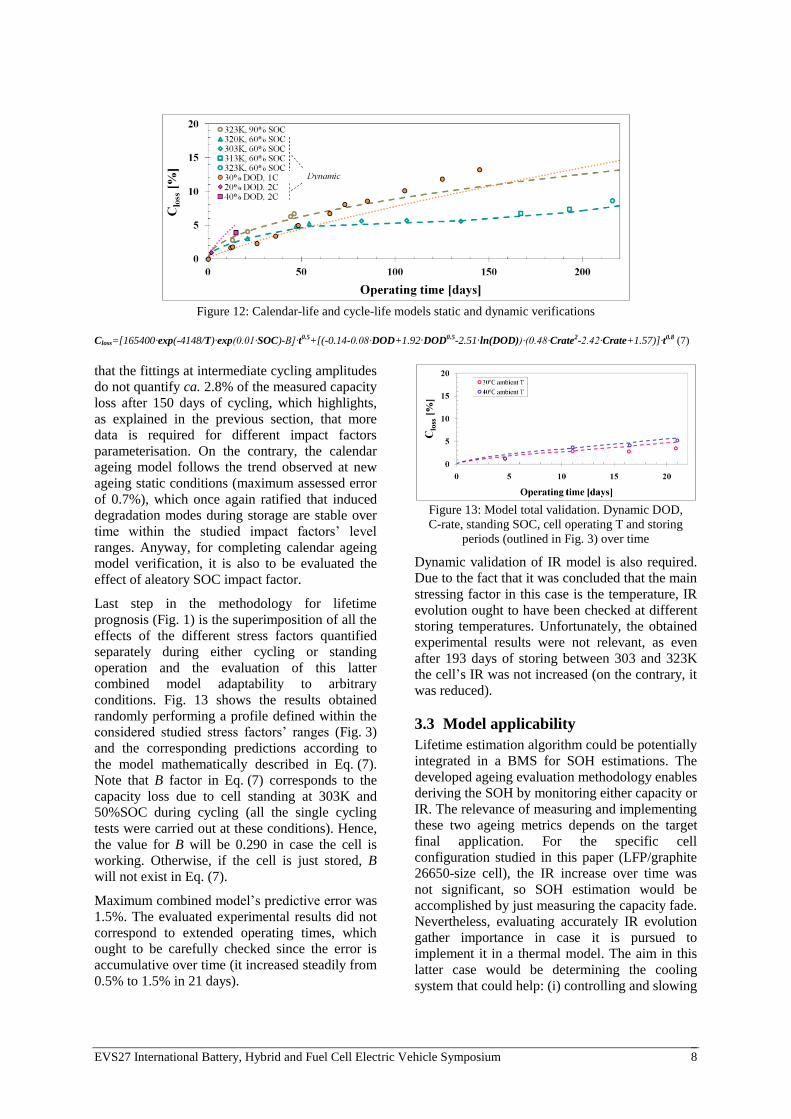
Figure 12: Calendar-life and cycle-life models static and dynamic verifications
Closs=[165400∙exp(-4148/T)∙exp(0.01∙SOC)-B]∙t0.5+[(-0.14-0.08∙DOD+1.92∙DOD0.5-2.51∙ln(DOD))∙(0.48∙Crate2-2.42∙Crate+1.57)]∙t0.8 (7)
that the fittings at intermediate cycling amplitudes
do not quantify ca. 2.8% of the measured capacity
loss after 150 days of cycling, which highlights,
as explained in the previous section, that more
data is required for different impact factors
parameterisation. On the contrary, the calendar
ageing model follows the trend observed at new
ageing static conditions (maximum assessed error
of 0.7%), which once again ratified that induced
degradation modes during storage are stable over
time within the studied impact factors’ level
ranges. Anyway, for completing calendar ageing
model verification, it is also to be evaluated the
effect of aleatory SOC impact factor.
Last step in the methodology for lifetime
prognosis (Fig. 1) is the superimposition of all the
effects of the different stress factors quantified
separately during either cycling or standing
operation and the evaluation of this latter
combined model adaptability to arbitrary
conditions. Fig. 13 shows the results obtained
randomly performing a profile defined within the
considered studied stress factors’ ranges (Fig. 3)
and the corresponding predictions according to
the model mathematically described in Eq. (7).
Note that B factor in Eq. (7) corresponds to the
capacity loss due to cell standing at 303K and
50%SOC during cycling (all the single cycling
tests were carried out at these conditions). Hence,
the value for B will be 0.290 in case the cell is
working. Otherwise, if the cell is just stored, B
will not exist in Eq. (7).
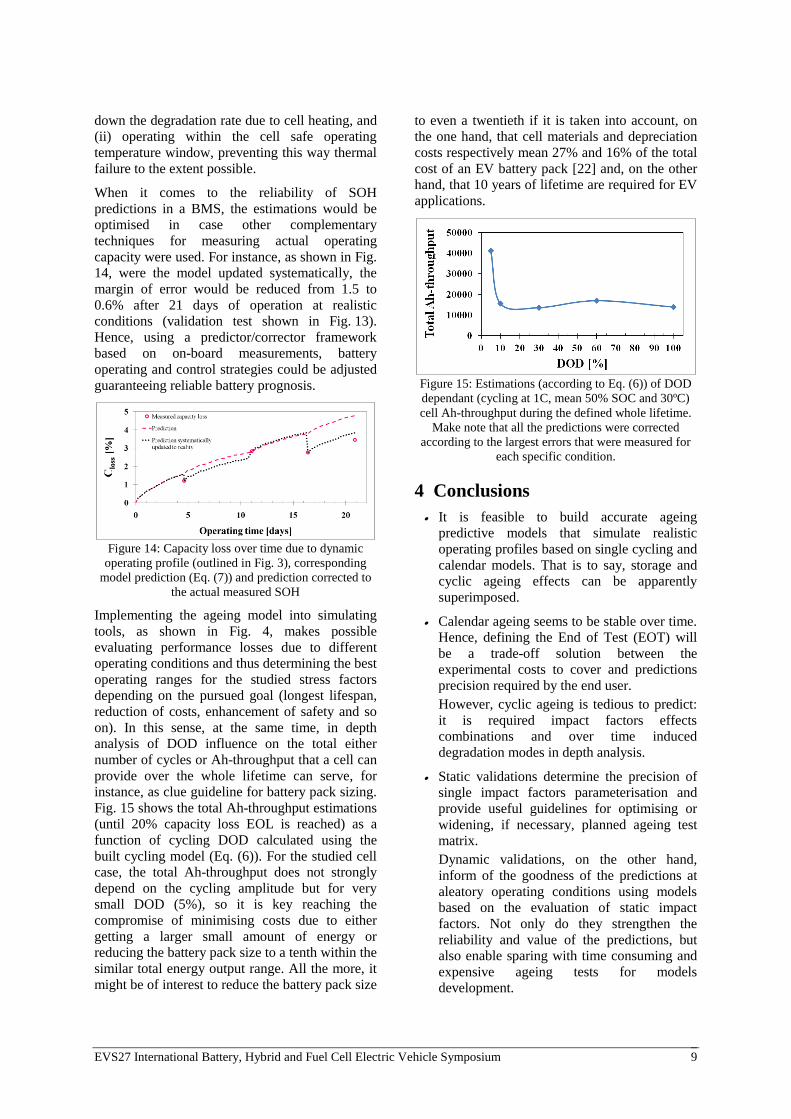
Maximum combined model’s predictive error was
1.5%. The evaluated experimental results did not
correspond to extended operating times, which
ought to be carefully checked since the error is
accumulative over time (it increased steadily from
0.5% to 1.5% in 21 days).
Figure 13: Model total validation. Dynamic DOD,
C-rate, standing SOC, cell operating T and storing
periods (outlined in Fig. 3) over time
Dynamic validation of IR model is also required.
Due to the fact that it was concluded that the main
stressing factor in this case is the temperature, IR
evolution ought to have been checked at different
storing temperatures. Unfortunately, the obtained
experimental results were not relevant, as even
after 193 days of storing between 303 and 323K
the cell’s IR was not increased (on the contrary, it
was reduced).
3.3 Model applicability
Lifetime estimation algorithm could be potentially
integrated in a BMS for SOH estimations. The
developed ageing evaluation methodology enables
deriving the SOH by monitoring either capacity or
IR. The relevance of measuring and implementing
these two ageing metrics depends on the target
final application. For the specific cell
configuration studied in this paper (LFP/graphite
26650-size cell), the IR increase over time was
not significant, so SOH estimation would be
accomplished by just measuring the capacity fade.
Nevertheless, evaluating accurately IR evolution
gather importance in case it is pursued to
implement it in a thermal model. The aim in this
latter case would be determining the cooling
system that could help: (i) controlling and slowing
EVS27 International Battery, Hybrid and Fuel Cell Electric Vehicle Symposium 9
down the degradation rate due to cell heating, and
(ii) operating within the cell safe operating
temperature window, preventing this way thermal
failure to the extent possible.
When it comes to the reliability of SOH
predictions in a BMS, the estimations would be
optimised in case other complementary
techniques for measuring actual operating
capacity were used. For instance, as shown in Fig.
14, were the model updated systematically, the
margin of error would be reduced from 1.5 to
0.6% after 21 days of operation at realistic
conditions (validation test shown in Fig. 13).
Hence, using a predictor/corrector framework
based on on-board measurements, battery
operating and control strategies could be adjusted
guaranteeing reliable battery prognosis.
Figure 14: Capacity loss over time due to dynamic
operating profile (outlined in Fig. 3), corresponding
model prediction (Eq. (7)) and prediction corrected to
the actual measured SOH
Implementing the ageing model into simulating
tools, as shown in Fig. 4, makes possible
evaluating performance losses due to different
operating conditions and thus determining the best
operating ranges for the studied stress factors
depending on the pursued goal (longest lifespan,
reduction of costs, enhancement of safety and so
on). In this sense, at the same time, in depth
analysis of DOD influence on the total either
number of cycles or Ah-throughput that a cell can
provide over the whole lifetime can serve, for
instance, as clue guideline for battery pack sizing.
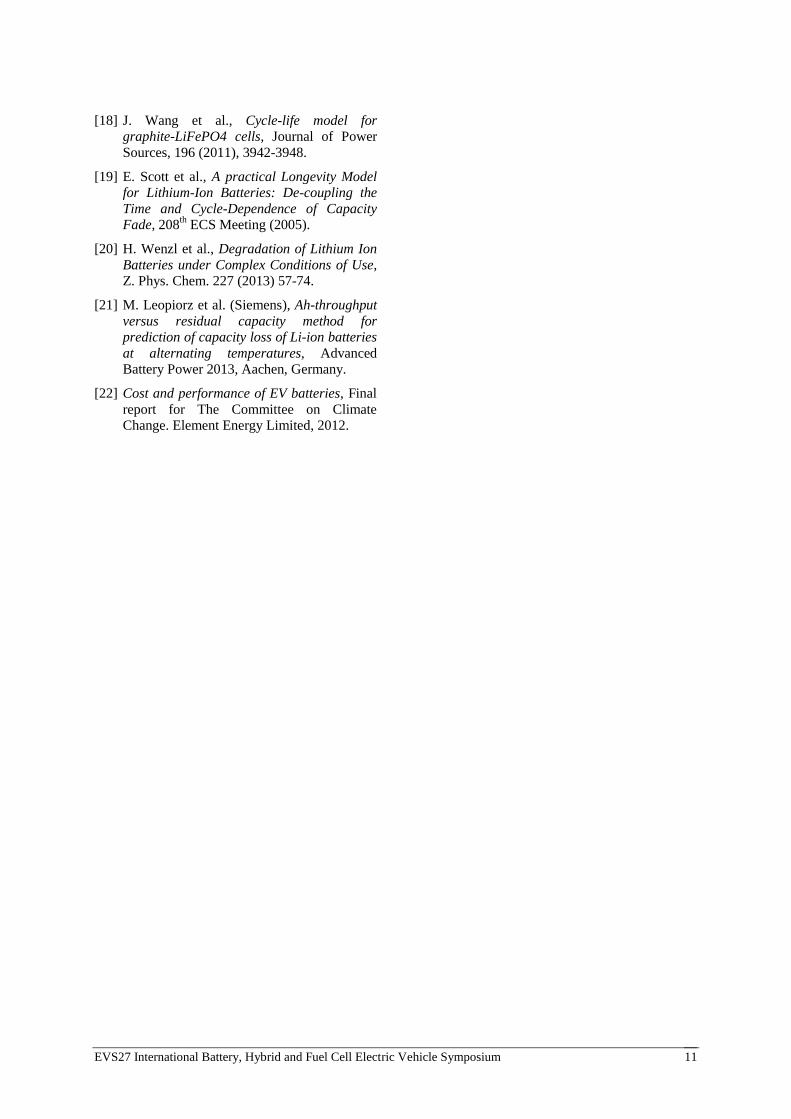
Fig. 15 shows the total Ah-throughput estimations
(until 20% capacity loss EOL is reached) as a
function of cycling DOD calculated using the
built cycling model (Eq. (6)). For the studied cell
case, the total Ah-throughput does not strongly
depend on the cycling amplitude but for very
small DOD (5%), so it is key reaching the
compromise of minimising costs due to either
getting a larger small amount of energy or
reducing the battery pack size to a tenth within the
similar total energy output range. All the more, it
might be of interest to reduce the battery pack size
to even a twentieth if it is taken into account, on
the one hand, that cell materials and depreciation
costs respectively mean 27% and 16% of the total
cost of an EV battery pack [22] and, on the other
hand, that 10 years of lifetime are required for EV
applications.
Figure 15: Estimations (according to Eq. (6)) of DOD
dependant (cycling at 1C, mean 50% SOC and 30ºC)
cell Ah-throughput during the defined whole lifetime.
Make note that all the predictions were corrected
according to the largest errors that were measured for
each specific condition.
4 Conclusions
· It is feasible to build accurate ageing
predictive models that simulate realistic
operating profiles based on single cycling and
calendar models. That is to say, storage and
cyclic ageing effects can be apparently
superimposed.
· Calendar ageing seems to be stable over time.
Hence, defining the End of Test (EOT) will
be a trade-off solution between the
experimental costs to cover and predictions
precision required by the end user.
However, cyclic ageing is tedious to predict:
it is required impact factors effects
combinations and over time induced
degradation modes in depth analysis.
· Static validations determine the precision of
single impact factors parameterisation and
provide useful guidelines for optimising or
widening, if necessary, planned ageing test
matrix.
Dynamic validations, on the other hand,
inform of the goodness of the predictions at
aleatory operating conditions using models
based on the evaluation of static impact
factors. Not only do they strengthen the
reliability and value of the predictions, but
also enable sparing with time consuming and
expensive ageing tests for models development.

EVS27 International Battery, Hybrid and Fuel Cell Electric Vehicle Symposium 10
· Diagnostics at dynamic conditions need to
have into account the actualised SOH at all
times, so monitoring the operating profile and
updating the ageing model is a must in order
that it can be implemented in a BMS.
· The developed lifetime predictive model is
useful for battery pack sizing within
beforehand evaluable (using the same model)
wide range of operating conditions.
Acknowledgments This work was supported by Emaitek and Etortek
programmes of the Basque Government.
References [1] H. Wenzl et al., Life prediction of batteries
for selecting the technically most suitable
and cost effective battery, Journal of Power
Sources, 144 (2005), 373-384.
[2] E. V. Thomas et al., Rate-based degradation
modeling of lithium-ion cells, Journal of
Power Sources, 206 (2012), 378-382.
[3] M. Ecker et al., Development of a lifetime
prediction model for lithium-ion batteries based on extended accelerated aging test
data, Journal of Power Sources, 215 (2012),
248-257.
[4] K. J. Chung, C. C. Hsiao, Accelerated
Degradation Assessment of 18650 Lithium-ion Batteries, 2012 International Symposium
on Computer, Consumer and Control.
[5] E.V. Thomas, I. Bloom, Statistical methodology for predicting the life of
lithium-ion cells via accelerated degradation
testing, Journal of Power Sources, 184
(2008), 312-317.
[6] S. Käbitz et al., Cycle and calendar life study
of a graphitelLiNi1/3Mn1/3Co1/3O2 Li-ion high energy system. Part A: Full cell
characterization, Journal of Power Sources
(2013).
[7] F. Herb, Alterungsmechanismen in Lithium-
Ionen-Batterien und PEM-Brennstoffzellen und deren Einfluss auf die Eigenschaften von
daraus bestehenden Hybrid-Systemen,
Dissertation zur Erlangung des Doktorgrades
Dr. rer. nat. der Fakultät für
Naturwissenschaften der Universität Ulm
(2010).
[8] F. Herb et al. (Daimler), Investigation of Li-battery and fuel cell aging in FC hybrid
car model, Eleventh Grove Fuel Cell
Symposium, 23.Sep.2009, London.
[9] C. Günther et al. (ZSW), Lifetime Models for
Lithium-ion Batteries, 2nd
Technical
Conference “Advanced Battery Technologies
for Automobiles and Their Electric Power
Grid Integration”, 1-2 Feb. 2010,
Rheingoldhalle, Mainz.
[10] W. Prochazka et al., Design-of-Experiment
and Statistical Modeling of a Large Scale Aging Experiment for Two Popular Lithium
Ion Cell Chemistries, ECS 160 (8) A1039-
A1051 (2013).
[11] M. Dubarry et al., Synthesize battery
degradation modes via a diagnostic and prognostic model, Journal of Power Sources
2019 (2012) 201-216.
[12] P. Liu et al., Aging Mechanisms of LiFePO4
Batteries Deduced by Electrochemical and
Structural Analyses, Journal of
Electrochemical Society, 157 (2010),
A499-A507.
[13] M. Safari and C. Delacourt, Aging of a Commercial Graphite/LiFePO4 Cell, Journal
of Electrochemical Society 158 (2011)
A1123-A1135.
[14] J. Groot, State-of-Health Estimation of Li-ion
Batteries: Cycle Life Test Methods, Thesis
for the degree of Licentiate of Engineering,
Division of Electric Power Engineering,
Department of Energy and Environment.
Göteborg, Sweden, Chalmers University of
Technology.
[15] F. Herb. et al., Optimization of fuel cell and
battery control in relation to component
aging of fuel cell power train,
At-Automatisierungstechnik, 57 (2009),
40-47.
[16] R. Arunachala, Depelopment of an Aging
Model for Lithium Ion Batteries based on Calendar Aging Tests, Master Thesis-RWTH
Aachen University (2011).
[17] H.J. Ploehn et al., Solvent Diffusion Model
for Aging of Lithium-Ion Battery Cells,
Journal of The Electrochemical Society, 151 (3)
A456-A462 (2004).
EVS27 International Battery, Hybrid and Fuel Cell Electric Vehicle Symposium 11
[18] J. Wang et al., Cycle-life model for graphite-LiFePO4 cells, Journal of Power
Sources, 196 (2011), 3942-3948.
[19] E. Scott et al., A practical Longevity Model for Lithium-Ion Batteries: De-coupling the
Time and Cycle-Dependence of Capacity Fade, 208
th ECS Meeting (2005).
[20] H. Wenzl et al., Degradation of Lithium Ion
Batteries under Complex Conditions of Use,
Z. Phys. Chem. 227 (2013) 57-74.
[21] M. Leopiorz et al. (Siemens), Ah-throughput
versus residual capacity method for prediction of capacity loss of Li-ion batteries
at alternating temperatures, Advanced
Battery Power 2013, Aachen, Germany.
[22] Cost and performance of EV batteries, Final
report for The Committee on Climate
Change. Element Energy Limited, 2012.
EVS27 International Battery, Hybrid and Fuel Cell Electric Vehicle Symposium 12
Authors
M.Eng. Elixabet Sarasketa Zabala
received her M.Eng. degree in
Chemical Engineering from the
Faculty of Engineering of Bilbao
(ETSI de Bilbao) and Master in
Energy Systems from the University
of Gävle (HIG, Sweden) in 2009, and
Master in Information and
Communication Technologies from
the Faculty of Engineering of
Mondragon University in 2012. She is
a Ph.D. student at the Energy
Business Unit of IK4-Ikerlan since
2009. She worked as visiting
researcher at the Institute for Power
Electronics and Electrical Drives
(ISEA) of RWTH Aachen in the
Electrochemical Conversion and
Storage Systems Group during
July-Dec. 2012.
M.Sc. Izaro Laresgoiti received her
Physics degree from The
Complutense University of Madrid
and Master in Nanosciences from The
University of the Basque Country in
2009. From 2010 to 2011 she worked
on Li-ion battery degradation and
modeling at the Institute for Power
Electronics and Electrical Drives
(ISEA) of RWTH Aachen in the
Electrochemical Conversion and
Storage Systems Group. She joined
IK4-Ikerlan in 2011 as researcher
within Electrical Energy Storage
Team.
Dr. Chem. Isabel Alava received her
MSc on Chemistry in 1992 and PhD
degree in 1996 from The University
of the Basque Country. She joined
IK4-Ikerlan in 1997 and has more
than 15 years experience working on
Thermal and Combustion Processes.
Since 2010, she works in the
Electrical Energy Storage Research
Team.
M.Eng. Mikel Rivas Gutiérrez
received his M.Eng. in Chemical
Engineering from The University of
the Basque Country in 2004, with
Master’s thesis project in
NTNU-Norwegian University of
Science and Technology. He joined
IK4-Ikerlan in 2004 and was involved
in SOFC projects until 2009. Since
2010 he works in the Electrical
Energy Storage Research Team.
Dr. Chem. Igor Villarreal received
the M.Sc. on Chemistry from
UNIZAR in 1996 and a PhD in
Lithium ion Batteries in 2001 from
CSIC-UCM of Madrid. He joined
IK4-Ikerlan in 2000. He was working
in LBNL between 2001 and 2003 as a
visiting researcher. Since 2010 he is
an Area Manager at IK4-Ikerlan and
joined the Electrical Energy Storage
Research Team. He is the coordinator
of European Project Batteries 2020.
Dr. Eng. Francisco Blanco received
the M.Sc. degree on Physics from
Universidad Autónoma de Madrid in
1998 and a M.Eng (2000) and PhD in
Electrical Engineering (2006) from
Technical University of Madrid. He
held several Engineering, R&D and
Management positions in companies
of the ICT and Energy Sectors
(Acciona Energy, BP, Lucent
Technologies and Philips). Currently,
he is the IK4-Ikerlan Energy Business
Director and also the head of the
Electrical Energy Storage Research
Team.