USER MANUAL - essilorinstrumentsusa.com · 2016. Le manuel utilisateur complet est disponible sur...
74
USER MANUAL Auto-phoropter UM APH550 EN V5 – APRIL 2016
-
Upload
phungtuong -
Category
Documents
-
view
214 -
download
0
Transcript of USER MANUAL - essilorinstrumentsusa.com · 2016. Le manuel utilisateur complet est disponible sur...

USER MANUAL
Auto-phoropter
UM
APH550 E
N
V5 – APR
IL 2016

Le manuel utilisateur complet est disponible sur un espace web. Pour y accéder veuillez scanner le QR code ci-dessous à l’aide d’une application dédiée.
El manual de uso completo está disponible en la web. Para acceder, escanee el código QR que se encuentra a continuación con la ayuda de una aplicación.
INTRODUCTION
This instrument is to inspect the refractive error of the eyes subjectively.
ABOUT THIS MANUAL This manual contains information on correct handling and operational procedures as well as safety consideration pertinent to AUTO PHOROPTER APH550. Connectable chart display unit: CP550, CSPOLA600, CS550 This instrument complies with IEC60601-1. Before carrying out measurement and/or adjustment, read the instructions thoroughly so that effective operation is ensured. (1) The information contained in this manual is subject to change without notice. (2) While reasonable efforts have been made in the preparation of this document to ensure its accuracy, you
should contact your local distributor immediately if any quarries arise due to editorial errors or omissions etc.
(3) If you find any imperfect collating or missing pages, contact your local distributor for replacement.
SAFETY CONSIDERATION APH550 is a Class I, Type B medical Instrument. This instrument complies with Medical Device Directive 93/42/EEC, respectively, as amended by Directive 2007/47/EC. A great deal of consideration has gone into the design and manufacturing of this instrument with regard to its operational ease, the patient’s safety and well-being as well as to the reliability of the product. For safer and more effective use, however, follow the points described in this manual. This instrument is designed for professional use. ~General Definitions of Safety Symbols in This Manual~
Caution
Personal death or serious injury could occur if disregarding this information and performing a wrong operation.
Denotes general ban or prohibition.
General mandatory action.
Recommended references to read.
Additional information which is important to the text or useful/ convenient to know.
NOTE
1
The number on the left is the lower limit and the one on the right is the upper limit of the temperature.
The number on the left is the lower limit and the one on the right is the upper limit of the humidity.
This is the type B equipment.
Symbol for “MANUFACTURER”.
Symbol for Compliant with CE marking i.e. with applicable European directives.
The number of the left indicates the lower limit and on the right indicates the upper limit of the atmospheric pressure.
This way up.
Manufacturing date (year)
Special collection for this type of electrical and electronic device
Caution
General Caution If fingerprints or dust are on the optical parts such as a measuring window, it affects on
accuracy of the measurement. Do not touch them with fingers and avoid dust.
If fingerprints or dust are on the optical parts, wipe them gently with a soft cloth.
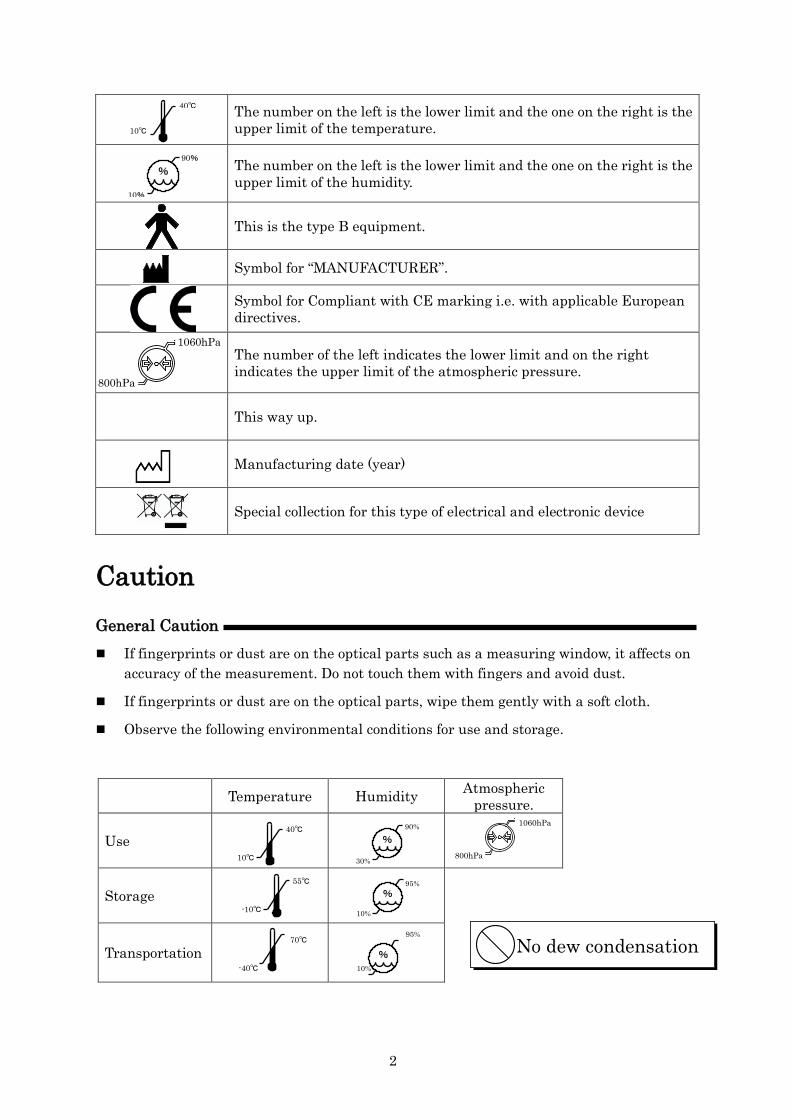
Observe the following environmental conditions for use and storage.
Temperature Humidity Atmospheric pressure.
Use
Storage
Transportation
% 90%
10%
40℃
10℃
800hPa
1060hPa
No dew condensation
40℃
10℃
55℃
-10℃
70℃
-40℃
% 95%
10%
95%
10%
% 90%
30% 800hPa
1060hPa
%
2

Do not install the instrument adjacent to the wireless applications such as TV and radio etc. The instrument may generate noise in the TV and radio.
If spilling liquid on the instrument or getting foreign substances into the instrument, remove the plug from the outlet and consult your dealer.
If the abnormalities (noise, smoke etc.) happened, remove the plug from the outlet and consult your dealer. Fire or personal injury could result if keep using it.
At no time, attempt to disassemble the instrument. Malfunction or fire could result.
If the instrument fails to work properly, do not touch inside. Remove the plug from the outlet and consult your dealer.
3

Power Source Make sure to use the earth cable of the power cord with connecting to the earth terminal.
Do not damage the power cord (folding it extremely small, pulling it or putting a heavy object on it etc.). Also do not remodel it. If the power cord is damaged (disconnection, damages of the covering), replace it with a new one. Electric shock or fire could result if keep using it.
Make sure that the power cord is all the way seated in the outlet and the instrument. If it is not all the way seated, fire or electric shock could result.
Always clean the power cord to avoid dust or oil etc. Malfunction or fire could result if the terminal unit is dirty.
If the power cord becomes hot after using the instrument, check dirt of the terminal unit. If no dirt is found, replace the power cord with a new one. Fire or malfunction could result if keep using it.
Use the instrument with the appropriate power-supply voltage. Malfunction or fire could result if keep using it with the power-supply voltage which is over the rating.
Hold the plug part when inserting the power cord in/out.
Do not touch the power plug when hands are wet. Electric shock could result.
Remove the plug from the outlet when not using the instrument for a long time.
4
Electromagnetic Compatibility This product conforms to the EMC Standard (IEC 60601-1-2 Ed. 3.0: 2007). a) This product needs special precautions regarding EMC and needs to be installed and put
into service according to the EMC information provided in this manual. b) Portable and mobile RF communications equipment can affect medical electrical
equipment. c) The use of accessories, transducers and cables other than those specified, with the
exception of transducers and cables sold by the manufacturer of the equipment or system as replacement parts for internal components, may result in increased emissions or decreased immunity of the equipment or system.
d) The equipment or system should not be used adjacent to or stacked with other equipment. If adjacent or stacked use is necessary, the equipment or system should be observed to verify normal operation in the configuration in which it will be used.
e) The use of the accessory, transducer or cable with equipment and systems other than those specified may result in increased emission or decreased immunity of the equipment or system.
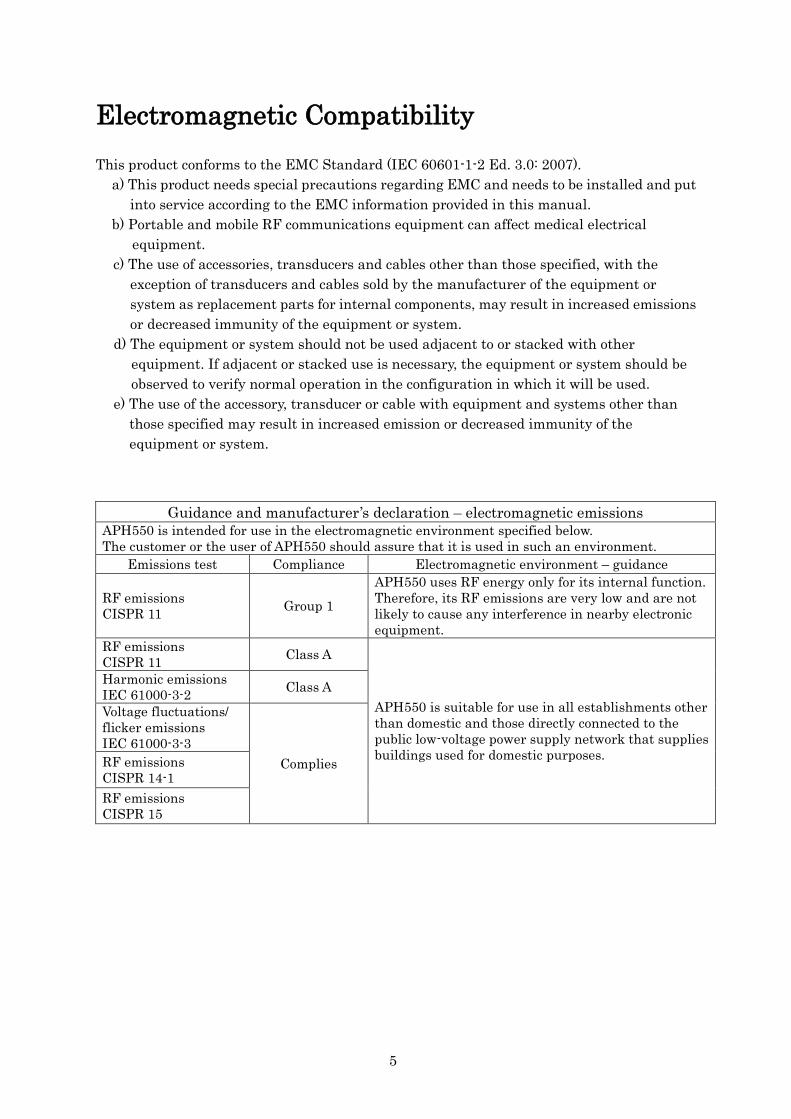
Guidance and manufacturer’s declaration – electromagnetic emissions APH550 is intended for use in the electromagnetic environment specified below. The customer or the user of APH550 should assure that it is used in such an environment.
Emissions test Compliance Electromagnetic environment – guidance
RF emissions CISPR 11 Group 1
APH550 uses RF energy only for its internal function. Therefore, its RF emissions are very low and are not likely to cause any interference in nearby electronic equipment.
RF emissions CISPR 11 Class A
APH550 is suitable for use in all establishments other than domestic and those directly connected to the public low-voltage power supply network that supplies buildings used for domestic purposes.
Harmonic emissions IEC 61000-3-2 Class A
Voltage fluctuations/ flicker emissions IEC 61000-3-3
Complies RF emissions CISPR 14-1 RF emissions CISPR 15
5

Guidance and manufacturer’s declaration – electromagnetic immunity APH550 Image Intensifier is intended for use in the electromagnetic environment specified below. The customer or the user of APH550 Image Intensifier should assure that it is used in such an environment.
Immunity test IEC 60601 test level Compliance level Electromagnetic environment –
guidance
Electrostatic discharge (ESD) IEC 61000-4-2
± 6 kV contact ± 8 kV air
± 6 kV contact ± 8 kV air
Floors should be wood, concrete or ceramic tile. If floors are covered with synthetic material, the relative humidity should be at least 30 %.
Electrical fast transient/burst IEC 61000-4-4
± 2 kV for power supply lines ± 1 kV for input/output lines
± 2 kV for power supply lines ± 1 kV for input/output lines
Mains power quality should be that of a typical commercial or hospital environment.
Surge IEC 61000-4-5
± 1 kV differential mode ± 2 kV common mode
± 1 kV differential mode ± 2 kV common mode
Mains power quality should be that of a typical commercial or hospital environment.
Voltage dips, short interruptions and voltage variations on power supply input lines IEC 61000-4-11
<5 % TU (>95 % dip in TU ) for 0.5 cycle 40 % TU (60 % dip in TU ) for 5 cycles 70 % TU (30 % dip in TU ) for 25 cycles <5 % TU (>95 % dip in TU ) for 5 s
<5 % TU (>95 % dip in TU ) for 0.5 cycle 40 % TU (60 % dip in TU ) for 5 cycles 70 % TU (30 % dip in TU ) for 25 cycles <5 % TU (>95 % dip in TU ) for 5 s
Mains power quality should be that of a typical commercial or hospital environment. If the user of APH550 Image Intensifier requires continued operation during power mains interruptions, it is recommended that APH550 Image Intensifier be powered from an uninterruptible power supply or a battery.
Power frequency (50/60 Hz) magnetic field IEC 61000-4-8
3 A/m 3 A/m
Power frequency magnetic fields should be at levels characteristic of a typical location in a typical commercial or hospital environment.
NOTE TU is the a.c. mains voltage prior to application of the test level.
6
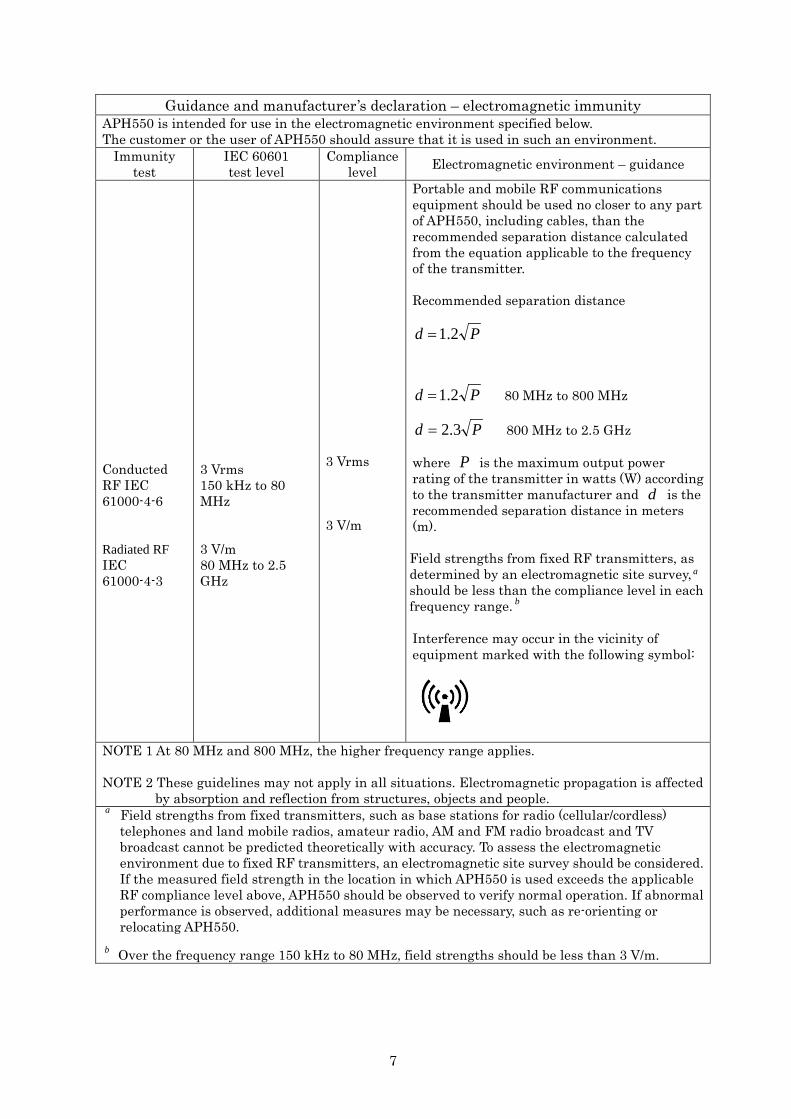
Guidance and manufacturer’s declaration – electromagnetic immunity APH550 is intended for use in the electromagnetic environment specified below. The customer or the user of APH550 should assure that it is used in such an environment.
Immunity test
IEC 60601 test level
Compliance level Electromagnetic environment – guidance
Conducted RF IEC 61000-4-6 Radiated RF IEC 61000-4-3
3 Vrms 150 kHz to 80 MHz 3 V/m 80 MHz to 2.5 GHz
3 Vrms 3 V/m
Portable and mobile RF communications equipment should be used no closer to any part of APH550, including cables, than the recommended separation distance calculated from the equation applicable to the frequency of the transmitter. Recommended separation distance
Pd 2.1=
Pd 2.1= 80 MHz to 800 MHz
Pd 3.2= 800 MHz to 2.5 GHz where P is the maximum output power rating of the transmitter in watts (W) according to the transmitter manufacturer and d is the recommended separation distance in meters (m). Field strengths from fixed RF transmitters, as determined by an electromagnetic site survey, should be less than the compliance level in each frequency range. Interference may occur in the vicinity of equipment marked with the following symbol:
NOTE 1 At 80 MHz and 800 MHz, the higher frequency range applies. NOTE 2 These guidelines may not apply in all situations. Electromagnetic propagation is affected
by absorption and reflection from structures, objects and people. a Field strengths from fixed transmitters, such as base stations for radio (cellular/cordless)
telephones and land mobile radios, amateur radio, AM and FM radio broadcast and TV broadcast cannot be predicted theoretically with accuracy. To assess the electromagnetic environment due to fixed RF transmitters, an electromagnetic site survey should be considered. If the measured field strength in the location in which APH550 is used exceeds the applicable RF compliance level above, APH550 should be observed to verify normal operation. If abnormal performance is observed, additional measures may be necessary, such as re-orienting or relocating APH550.
b Over the frequency range 150 kHz to 80 MHz, field strengths should be less than 3 V/m.
a
b
7

Recommended separation distance between portable and mobile RF communication equipment and APH550
APH550 is intended for use in an electromagnetic environment in which radiated RF disturbances are controlled. The customer or the user of APH550 can help prevent electromagnetic interference by maintaining a minimum distance between portable and mobile RF communication equipment (transmitters) and APH550 are recommended below, according to the maximum output power of the communications equipment.
Rated maximum output
power of transmitter
W
Separation distance according to frequency of transmitter m
150kHz to 80MHz
Pd 2.1=
80MHz to 800MHz
Pd 2.1=
800MHz to 2.5GHz
Pd 3.2= 0.01 0.12 0.12 0.23 0.1 0.38 0.38 0.73 1 1.2 1.2 2.3
10 3.8 3.8 7.3 100 12 12 23
For transmitters rated at a maximum output power not listed above, the recommended separation distance d in meters (m) can be estimated using the equation applicable to the frequency of the transmitter, where P is the maximum output power rating of the transmitter in watts (W) according to the transmitter manufacturer. NOTE 1 At 80 MHz and 800 MHz, the separation distance for the higher frequency range applies. NOTE 2 These guidelines may not apply in all situations. Electromagnetic propagation is affected
by absorption and reflection from structures, objects and people.
8

CONTENTS INTRODUCTION ................................................................................................................ 1 ABOUT THIS MANUAL ..................................................................................................... 1 SAFETY CONSIDERATION ............................................................................................... 1 Caution ................................................................................................................................ 2 Electromagnetic Compatibility ........................................................................................... 4 Contents ............................................................................................................................... 8 Accessories ......................................................................................................................... 10 1. Instrument .................................................................................................................... 12
1.1 General description of instrument .................................................................................... 12 1.2 Intended use defined .......................................................................................................... 12 1.3 Classification of Device....................................................................................................... 12 1.4 Mode of Operation............................................................................................................... 13 1.5 Connection of the instrument ............................................................................................ 13 1.6 Identification of each unit of the head .............................................................................. 14 1.7 Identification of each unit of the controller ...................................................................... 16 1.8 Identification of each unit of the relay box ....................................................................... 17
2. Conveyance ................................................................................................................... 18 3. Installation ................................................................................................................... 18 4. Instructions and Directions for Use ............................................................................. 19 5. Operation Procedures ................................................................................................... 20
5.1 Operation list ...................................................................................................................... 20 5.2 Measurement preparation ................................................................................................. 22 5.3 Operation screen ................................................................................................................. 23 5.4 Basic operation .................................................................................................................... 24 5.5 Setting of the chart ............................................................................................................. 28
5.5.1 Operation of the chart selection area ............................................................................... 28 5.5.2 Operation at the time of selecting the chart for vision measurement ........................... 29 5.5.3 Operation at the time of selecting the dots chart ............................................................ 32 5.5.4 Operation at the time of selecting the other charts ........................................................ 33 5.5.5 Operation at the time of selecting the near point chart .................................................. 33
5.6 Other operations ................................................................................................................. 34 5.6.1 Operation at the time of cross cylinder mode .................................................................. 34 5.6.2 Setting of the auxiliary lens .............................................................................................. 35
5.7 Input of the external data .................................................................................................. 37 5.7.1 Data input from the auto refractometer .......................................................................... 37 5.7.2 Data input from the lensmeter ......................................................................................... 38 5.7.3 Data input from PC ........................................................................................................... 38 5.7.4 Manual input to the “External data” area ....................................................................... 39
5.8 Operation of the menu area ............................................................................................... 40 5.8.1 Switch of performance at the time of selecting chart ...................................................... 40 5.8.2 Save and calling up of the measurement data................................................................. 40 5.8.3 Output of the measurement values .................................................................................. 42
9
5.8.4 Selection of the measurement program ........................................................................... 43 5.8.5 Selection of fogging ............................................................................................................ 43 5.8.6 Selection of working distance............................................................................................ 44 5.8.7 Setup ................................................................................................................................... 44
5.9 Edit of the chart and measurement program ................................................................... 54 5.9.1 Edit of the chart selection area ......................................................................................... 54 5.9.2 Edit of the measurement program ................................................................................... 57
6. Measurement Procedures ............................................................................................. 60 6.1 Astigmatism measurement ................................................................................................ 60
6.1.1 Clock dial chart .................................................................................................................. 60 6.1.2 Dots chart ........................................................................................................................... 61
6.2 Red/ green Test ................................................................................................................... 61 6.3 Binocular balance test ........................................................................................................ 62 6.4 Phoria test ........................................................................................................................... 62 6.5 Aniseikonia test .................................................................................................................. 63 6.6 Worth 4 dots test ................................................................................................................. 63 6.7 Maddox test ......................................................................................................................... 64
7. Cautions at the Time of the Measurement .................................................................. 65 8. Error Display ................................................................................................................ 66 9. Major Troubles and Provisions .................................................................................... 67 10. Maintenance and Storage ............................................................................................ 68
10.1 Replacement of the printer paper .................................................................................... 68 10.2 Replacement of the fuse ................................................................................................... 69 10.3 Storage of the instrument ................................................................................................ 69 10.4 Cleaning ............................................................................................................................. 70 10.5 Periodical inspection and maintenance .......................................................................... 71 10.6 Disposal ............................................................................................................................. 71
11. Specifications ................................................................................................................ 72
10

Accessories
Communication cable: 2 (6m)
Power cord: 1 (2.5m)
Printer paper: 3 (width 57mm)
[two packed and one installed in the instrument]
Fuse: 2 (EWM AC250V 2A)
Near point chart: 1 Near point holder: 1
Near point chart bar: 1 Dust cover: 1 Operation manual: 1
Cable to be used Name Model No. Length
Power cord KP4819YKS31A 2.5m
Use accessories specified by us to avoid any malfunction or failure.
Use of accessory (power cord) other than specified one may adversely affect other instruments and/or cause malfunction of the instrument. Always use the accessory specified by us.
Avoid direct sunlight, high humidity and temperature when storing printer paper which is a thermal paper.
11

1. Instrument 1.1 General description of instrument
This instrument (APH550) is to examine the eyes subjectively by placing the lenses in front of the examinee’s eye. For the subjective eye examination, there are two types of examinations: monocular vision and binocular visions. This instrument enables both examinations. Refer to “4. Instructions and Directions for Use” about the precautions for use about this instrument.
1.2 Intended use defined
The purpose of this instrument (APH550) is to examine the refraction subjectively. The subjective refraction examination is to perform the examination of the visual function by placing the chart and switching the corrective lenses incorporated.
1.3 Classification of Device
According to European directive on medical device, the APH550 is a class I medical device. It is marked . Date of first marking February 2016. The expected lifetime is 7 years Type of protection against electrical shock: Class I Equipment Class 1 equipment is equipment in which protection against electric shock does not rely on basic insulation only, but which includes an additional safety precaution in that means are provided for the connection of the equipment to a protective earth conductor in the fixed wiring of the installation in which a way with accessible metal parts cannot become live in the event of a failure of the basic insulation. Degree of protection against electrical shock: Type B Equipment Type B equipment provides an adequate degree of protection against electrical shock, particularly regarding allowable leakage currents and reliability of the protective earth connection. Degree of protection against harmful intrusion of water (IEC 60529): IPX0 This product does not provide protection against intrusion of water. (The degree of protection against harmful ingress of water defined in IEC 60529 is IPX0.) Classification by safety of use in air/ flammable anesthetic gas, oxygen or nitrous oxide/ flammable anesthetic gas atmosphere: ・ Equipment not suited for use in air/flammable anesthetic gas, oxygen or nitrous
oxide/flammable anesthetic gas atmosphere. ・ This product should be used in an environment free of flammable anesthetic gas
and other flammable gases. Classification by operation mode: Continuous operation with short-time loading.
12

1.4 Mode of Operation
This product is for continuous operation. It takes approx. 2 sec. for each measurement.
1.5 Connection of the instrument
Relay box
Controller
Head
INPUT to 100-240V 50/60Hz POWER 90VA
13

1.6 Identification of each unit of the head
⑫ Communication connector
⑪ Headrest
⑩ Face shields
⑨Horizontal adjustment knob
⑧Rotation stopper knob
⑦ Fixing knob
⑥ Level
④ Near point chart holder
③ Headrest adjustment knob
②VD check windows
① Measuring windows
⑤ Near point chart fixing knob
14

1.6 Identification of each unit of the head
① Measuring window The window which the examinee looks
at the chart ② VD check window It can check VD of the examinee.
Refer to “5.4 Basic operation- VD adjustment” for usage.
③ Head rest adjustment knob The knob to adjust VD. The head rest
moves back and forth by rotating this knob.
④ Near point chart holder Fix the near point chart bar at the time
of using the near point chart. ⑤ Near point chart fixing knob The knob to fix the near point chart bar
after inserting it into the near point chart holder.
⑥ Level Use this to confirm that the head is
horizontal. ⑦ Fixing knob Use this to place the head on the arm of
the measurement table etc. (When fixing it on the measurement
table, secure it with the screw underneath of the arm of the head.)
⑧ Rotation stopper knob The knob to stop rotation of the head
unit. ⑨ Horizontal adjustment knob The knob to adjust the head unit
horizontally. Adjust it with checking the level. ⑩ Face shields The parts which the cheeks of the
examinee touch to during the measurements.
Always clean the parts because they contact with skin directly. Refer to “10.4 Cleaning”.
⑪ Head rest The place which the examinee puts
his/her forehead on at the time of the measurement.
Always clean the parts because they contact with skin directly.
Refer to “10.4 Cleaning”. ⑫ Communication connector The connector to communicate with the
relay box. Plug the communication cable here.
There is the parts list separated from this manual. Also there is the another parts list related to the safety.
NOTE
15
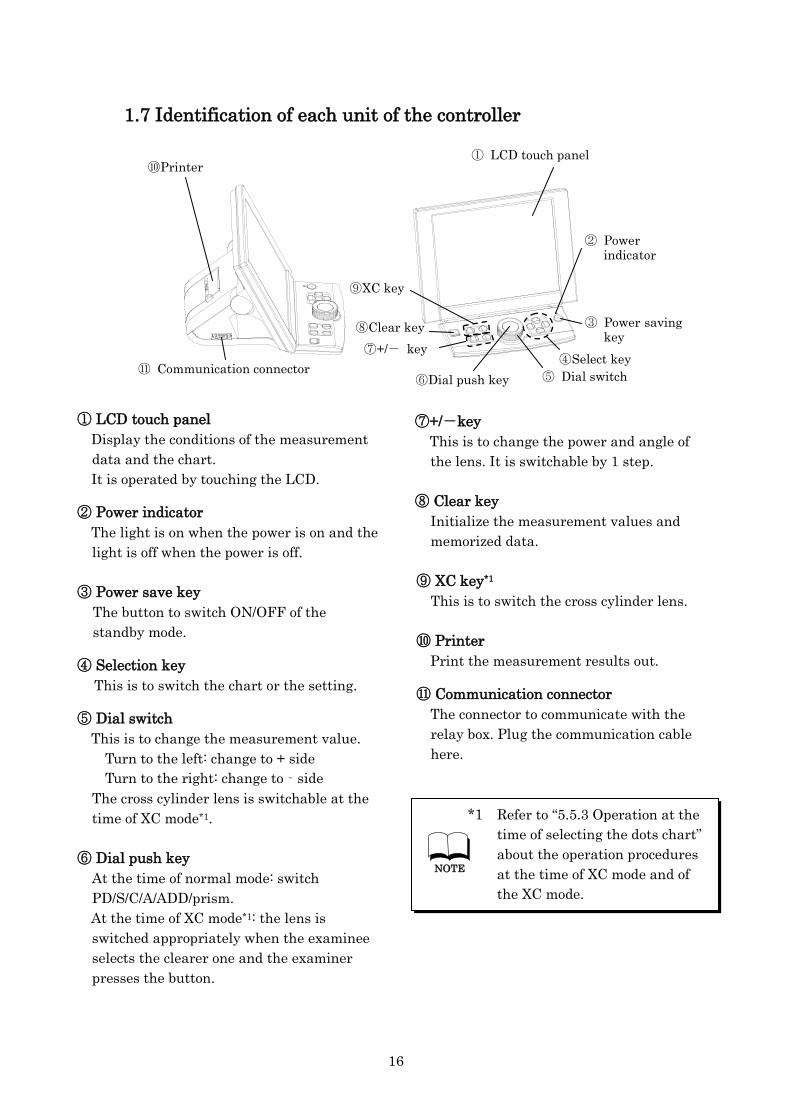
1.7 Identification of each unit of the controller
① LCD touch panel Display the conditions of the measurement
data and the chart. It is operated by touching the LCD.
② Power indicator The light is on when the power is on and the
light is off when the power is off. ③ Power save key
The button to switch ON/OFF of the standby mode.
④ Selection key
This is to switch the chart or the setting. ⑤ Dial switch This is to change the measurement value. Turn to the left: change to + side Turn to the right: change to‐side
The cross cylinder lens is switchable at the time of XC mode*1.
⑥ Dial push key
At the time of normal mode: switch PD/S/C/A/ADD/prism.
At the time of XC mode*1: the lens is switched appropriately when the examinee selects the clearer one and the examiner presses the button.
⑦+/-key This is to change the power and angle of the lens. It is switchable by 1 step.
⑧ Clear key Initialize the measurement values and memorized data.
⑨ XC key*1 This is to switch the cross cylinder lens.
⑩ Printer Print the measurement results out. ⑪ Communication connector The connector to communicate with the
relay box. Plug the communication cable here.
③ Power saving key
② Power indicator
④Select key ⑤ Dial switch ⑥Dial push key
⑦+/- key ⑧Clear key
⑨XC key
⑩Printer
⑪ Communication connector
① LCD touch panel
*1 Refer to “5.5.3 Operation at the time of selecting the dots chart” about the operation procedures at the time of XC mode and of the XC mode.
NOTE
16
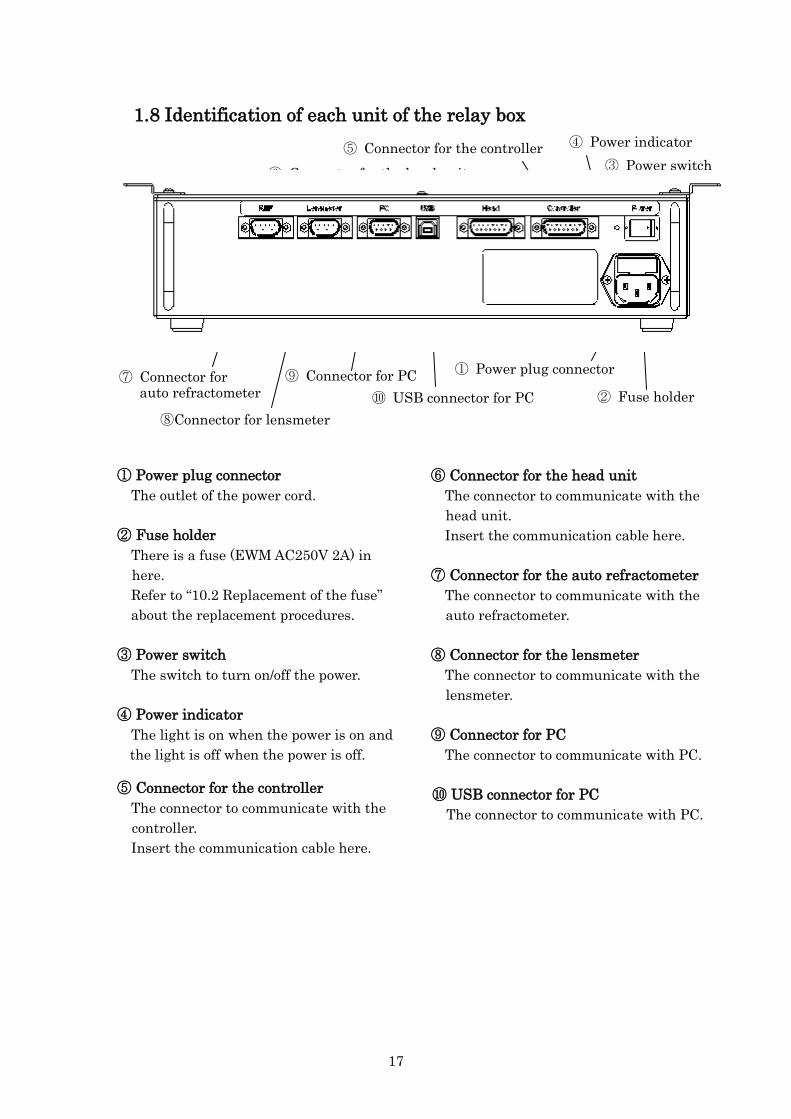
1.8 Identification of each unit of the relay box
① Power plug connector The outlet of the power cord. ② Fuse holder There is a fuse (EWM AC250V 2A) in
here. Refer to “10.2 Replacement of the fuse”
about the replacement procedures. ③ Power switch The switch to turn on/off the power. ④ Power indicator The light is on when the power is on and
the light is off when the power is off. ⑤ Connector for the controller The connector to communicate with the
controller. Insert the communication cable here.
⑥ Connector for the head unit The connector to communicate with the
head unit. Insert the communication cable here. ⑦ Connector for the auto refractometer The connector to communicate with the
auto refractometer.
⑧ Connector for the lensmeter The connector to communicate with the
lensmeter.
⑨ Connector for PC The connector to communicate with PC. ⑩ USB connector for PC The connector to communicate with PC.
③ Power switch ⑤ Connector for the controller
⑥ Connector for the head unit
⑦ Connector for auto refractometer
⑨ Connector for PC
⑩ USB connector for PC
① Power plug connector
② Fuse holder ⑧Connector for lensmeter
④ Power indicator
17
Near point holder
Near point chart
Near point chart holder
Near point chart bar
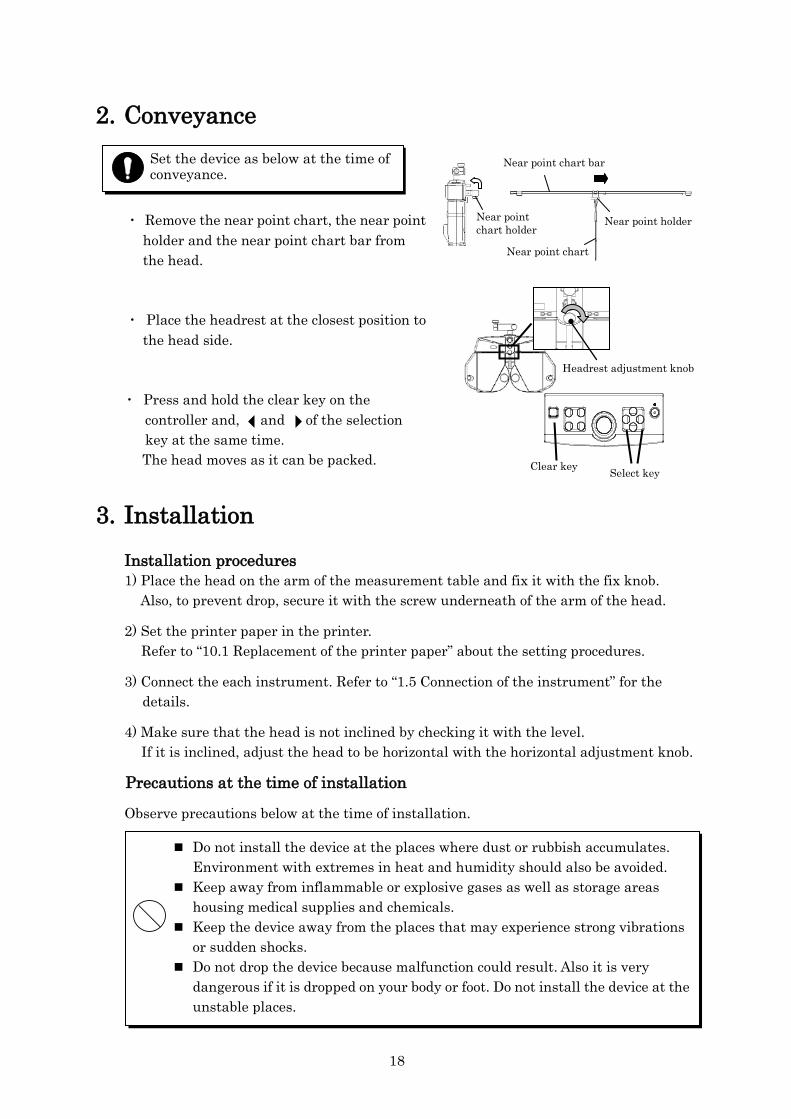
2. Conveyance
・ Remove the near point chart, the near point
holder and the near point chart bar from the head.
・ Place the headrest at the closest position to
the head side.
・ Press and hold the clear key on the
controller and, and of the selection key at the same time. The head moves as it can be packed.
3. Installation Installation procedures 1) Place the head on the arm of the measurement table and fix it with the fix knob.
Also, to prevent drop, secure it with the screw underneath of the arm of the head.
2) Set the printer paper in the printer. Refer to “10.1 Replacement of the printer paper” about the setting procedures.
3) Connect the each instrument. Refer to “1.5 Connection of the instrument” for the details.
4) Make sure that the head is not inclined by checking it with the level. If it is inclined, adjust the head to be horizontal with the horizontal adjustment knob.
Precautions at the time of installation
Observe precautions below at the time of installation.
Do not install the device at the places where dust or rubbish accumulates. Environment with extremes in heat and humidity should also be avoided.
Keep away from inflammable or explosive gases as well as storage areas housing medical supplies and chemicals.
Keep the device away from the places that may experience strong vibrations or sudden shocks.
Do not drop the device because malfunction could result. Also it is very dangerous if it is dropped on your body or foot. Do not install the device at the unstable places.
Headrest adjustment knob
Select key Clear key
Set the device as below at the time of conveyance.
18

4. Instructions and Directions for Use 1. This is a precision optical instrument. Always handle with care and avoid dropping it
accidentally.
2. Make sure to use the earth cable with connecting to the earth terminal.
3. Do not touch the optical parts such as a measuring window with fingers and be sure to avoid dust, as their measurement accuracy could be adversely affected and incorrect values may result.
4. If the cover is dirty, gently wipe it with a dry cloth. For hard to remove stains, wipe it off with a little water or using neutral detergent.
Clean the chinrest and headrest with the neutral cleaner. For disinfecting them where the examinee may contact, use the ethanol for disinfection. ※ Ethanol for disinfection contains 76.9 to 81.4vol% of ethanol (C2H6O: 46.07) at 15℃
(specific gravity).
5. When cleaning the LCD panel, use the absorbent cotton or soft cloth etc.
6. If the instrument is not used for a long time, remove the plug from the outlet.
7. When the instrument is not in use, protect it with a supplied dustproof cover.
8. Do not attempt to repair or remodel the instrument. Never attempt to perform the internal service when the instrument fails to function properly. Contact us or your dealer.
Avoid using organic solvents such as thinner because it will damage the water based paint finish of the instrument.
When dust or fingerprints are on the optical parts, use a soft cloth to wipe the buildup off. At that time, handle the instrument carefully not to scratch it.
19

5. Operation Procedures 5.1 Operation list
5.3 Operation screen (P.23)
5.4 Basic operation (P.24)
PD input (P.25) VD adjustment (P.25) Each type of input mode (P.26) “Switch of the eye to be measured, S, C and A etc.” “Input of the values” Lock of the input value (P.27)
Switch of the step (P.27)
Switch of the masking (P.27)
5.2 Measurement preparation (P.22)
5.5 Setting of the chart (P.28)
5.5.1 Operation of the chart selection area (P.28)
5.5.2 Operation at the time of selecting the chart for vision measurement (P.29)
Selection of the chart (P.28) Page switch of the chart (P.28)
Masking of the chart (P.29)
Memory of the vision (P.31)
5.5.3 Operation at the time of selecting the dots chart (P.32)
Operation of the custom area (P.32) Operation of the cross cylinder lens (P.32)
5.5.4 Operation at the time of selecting the other charts (P.33) Operation of the memory button area (P.33) Operation of the custom area (P.33)
5.5.5 Operation at the time of selecting the near point chart (P.33)
Setting of the near point chart (P.24)
Switch of chart auxiliary function (P.29)
Random function (P.30) R/G button (P.30) Contrast button (P.31) Inversion button (P.31)
20
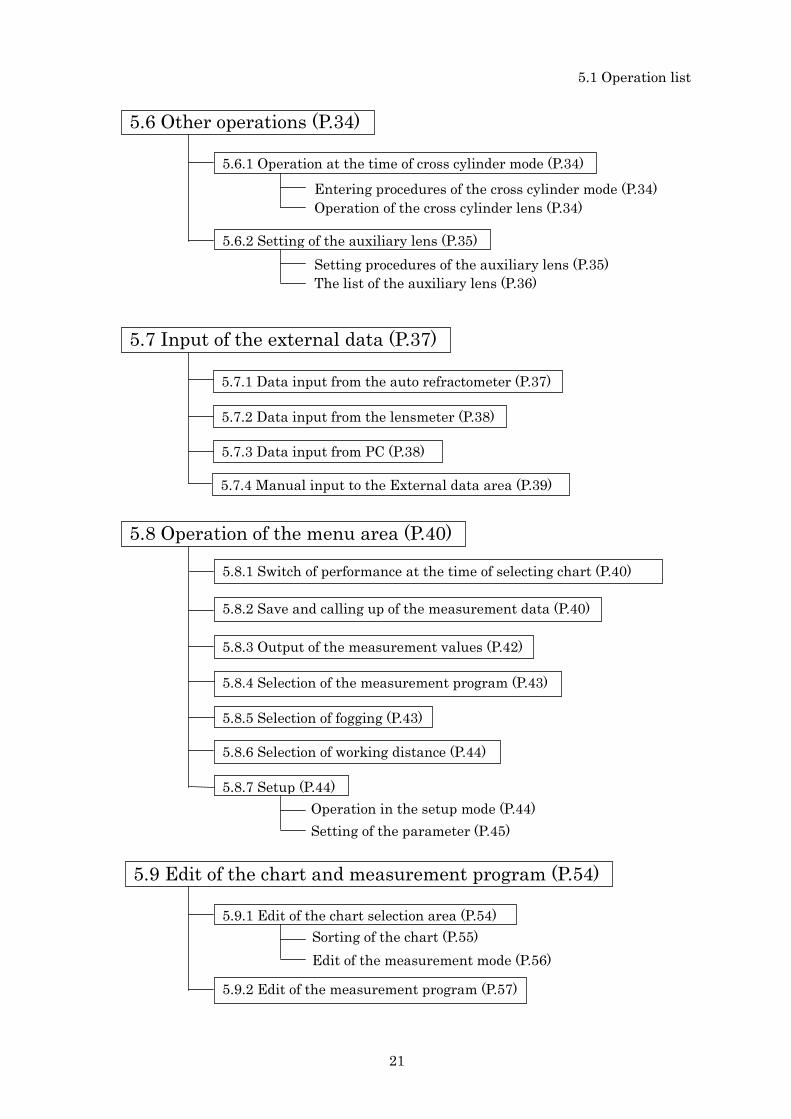
5.6 Other operations (P.34)
5.6.1 Operation at the time of cross cylinder mode (P.34)
5.6.2 Setting of the auxiliary lens (P.35)
Entering procedures of the cross cylinder mode (P.34) Operation of the cross cylinder lens (P.34)
Setting procedures of the auxiliary lens (P.35) The list of the auxiliary lens (P.36)
5.7.1 Data input from the auto refractometer (P.37)
5.7.2 Data input from the lensmeter (P.38)
5.8 Operation of the menu area (P.40)
5.8.2 Save and calling up of the measurement data (P.40)
5.8.3 Output of the measurement values (P.42)
5.8.4 Selection of the measurement program (P.43)
5.8.5 Selection of fogging (P.43)
5.8.6 Selection of working distance (P.44)
5.8.7 Setup (P.44) Operation in the setup mode (P.44) Setting of the parameter (P.45)
5.9 Edit of the chart and measurement program (P.54)
5.9.1 Edit of the chart selection area (P.54)
5.9.2 Edit of the measurement program (P.57)
Edit of the measurement mode (P.56) Sorting of the chart (P.55)
5.7 Input of the external data (P.37)
5.7.3 Data input from PC (P.38)
5.7.4 Manual input to the External data area (P.39)
5.8.1 Switch of performance at the time of selecting chart (P.40)
5.1 Operation list
21
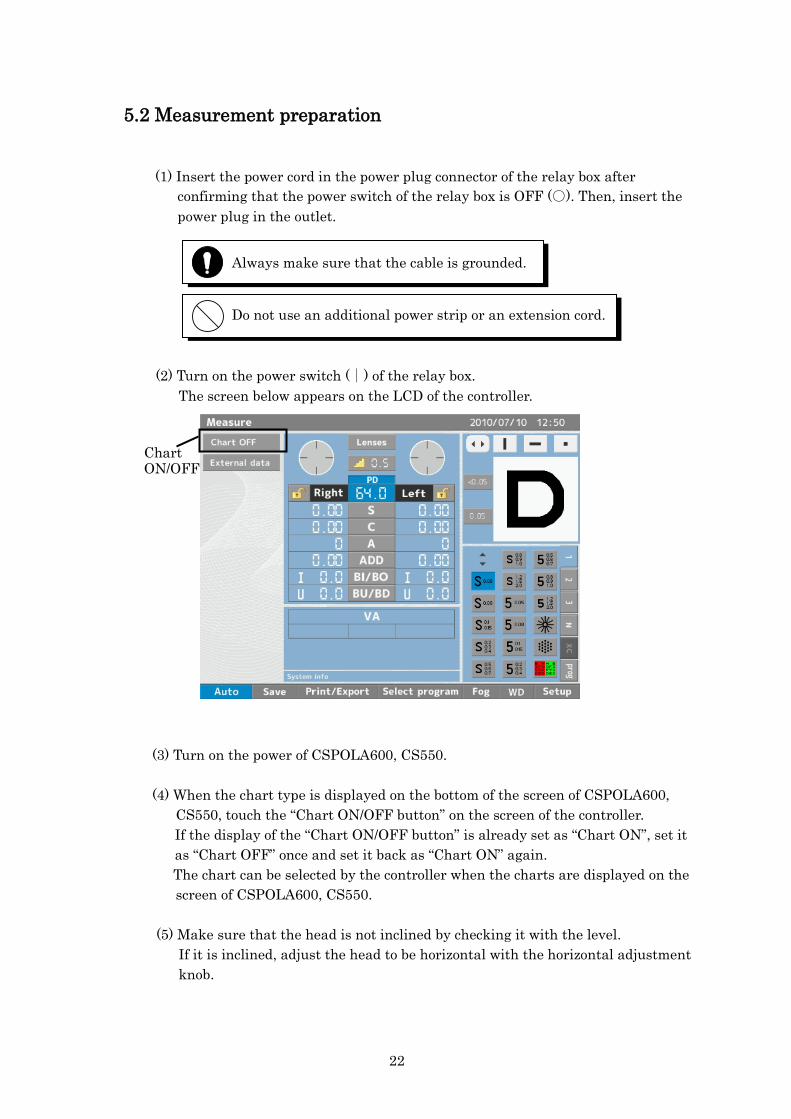
5.2 Measurement preparation
(1) Insert the power cord in the power plug connector of the relay box after confirming that the power switch of the relay box is OFF (○). Then, insert the power plug in the outlet.
(2) Turn on the power switch (|) of the relay box. The screen below appears on the LCD of the controller.
(3) Turn on the power of CSPOLA600, CS550.
(4) When the chart type is displayed on the bottom of the screen of CSPOLA600, CS550, touch the “Chart ON/OFF button” on the screen of the controller. If the display of the “Chart ON/OFF button” is already set as “Chart ON”, set it as “Chart OFF” once and set it back as “Chart ON” again.
The chart can be selected by the controller when the charts are displayed on the screen of CSPOLA600, CS550.
(5) Make sure that the head is not inclined by checking it with the level. If it is inclined, adjust the head to be horizontal with the horizontal adjustment knob.
Chart ON/OFF
Do not use an additional power strip or an extension cord.
Always make sure that the cable is grounded.
22

5.3 Operation screen
① Title display area Display the current condition.
② Step button
Switch the step of the each measurement value.
③ Lens selection button
Select the arbitrary lens. ④ Lens display area
Display the auxiliary lens which is set on the measuring window.
⑤ Measurement result display area
Display current condition of the lens. ⑥ Date and time display area
Display the current date and time.
⑦ Chart condition display area Display the condition of the displayed chart.
⑧ Data display area
Display the data input from external and memorized data.
⑨ Custom area
Display the auxiliary function such as angle switch of the astigma lens.
⑩ Menu area
Display the menu. ⑪ Message area
Display the error message. ⑫ Chart selection area
Select the chart to display from the ones in this area.
① Title display area ② Step button
④ Lens display area ③ Lens selection button ⑥ Date and time display area
⑦ Chart condition display area
⑤ Test result display area
⑧ Data display area
⑨ Custom area ⑩ Menu area ⑪ Message area ⑫ Chart selection area
23

5.4 Basic operation
・Setting of the near point chart
(1) Attach the near point chart to the near point holder.
(2) Fix (1) on the near point chart bar.
(3) Insert (2) into the near point chart holder and secure it with the near point chart fixing knob.
Near point chart holder
Near point chart fixing knob
Near point chart bar
Near point holder
Near point chart
If not using the near point chart, it can be hold as shown on the right.
24

・PD input
(1) Touch the “PD mode button” on the measurement result display area. PD input mode is started up.
(2) Turn the “Dial switch” or press “+/‐” key. PD value is increased or decreased by 1 step.
・VD adjustment
(1) Look through the VD check windows.
(2) Position the apex of cornea of the examinee at the arbitrary position. It can be adjusted with the headrest adjustment knob.
When turning on the power switch (|), it is started up with PD input mode.
12mm 13.75mm 16mm
18mm
VD check board
PD mode button
Look through the windows as matching the longest line with the ▽ part of the VD check board.
5.4 Basic operation
25

・Each type of input mode
(1) Press “S value mode button”.
(2) Turn the “Dial switch” or press the “+/‐ key”. It can increase or decrease S value by 1 step.
Input with the numerical keypad (1) If touching the currently selected “S value mode
button” again, the numerical keypad is displayed.
(2) Input the values with the numerical keypad. (3) The lens is set by touching the “Execute button”. (4) When erasing all of the values, press the “Clear
button” and erasing one value, press the “Backspace button”.
When canceling it, touch the area other than the numerical keypad.
Input with the number selection bar (1) If touching the currently selected “S value mode button” again, the
numerical keypad is displayed. (2) By touching the number selection bar, the selected value is displayed. (3) When touching the execute button, the lens is set. When canceling it, touch the area other than the numerical keypad.
S value mode button
When you wish to select S value of the right eye
When you wish to select S value of the left eye
When you wish to select S values of both eyes
5.4 Basic operation
The eye to be measured can be selected by touching the area below
Right eye: display area of S input value of the right eye
Left eye: display area of S input value of the left eye
Both eyes: “S”
The input values for “C”, “A”, “ADD”, “BI/BO” and “BU/BD” can be changed by operating in the same manner.
Clear button
Backspace button
Execute button
Number selection bar
26
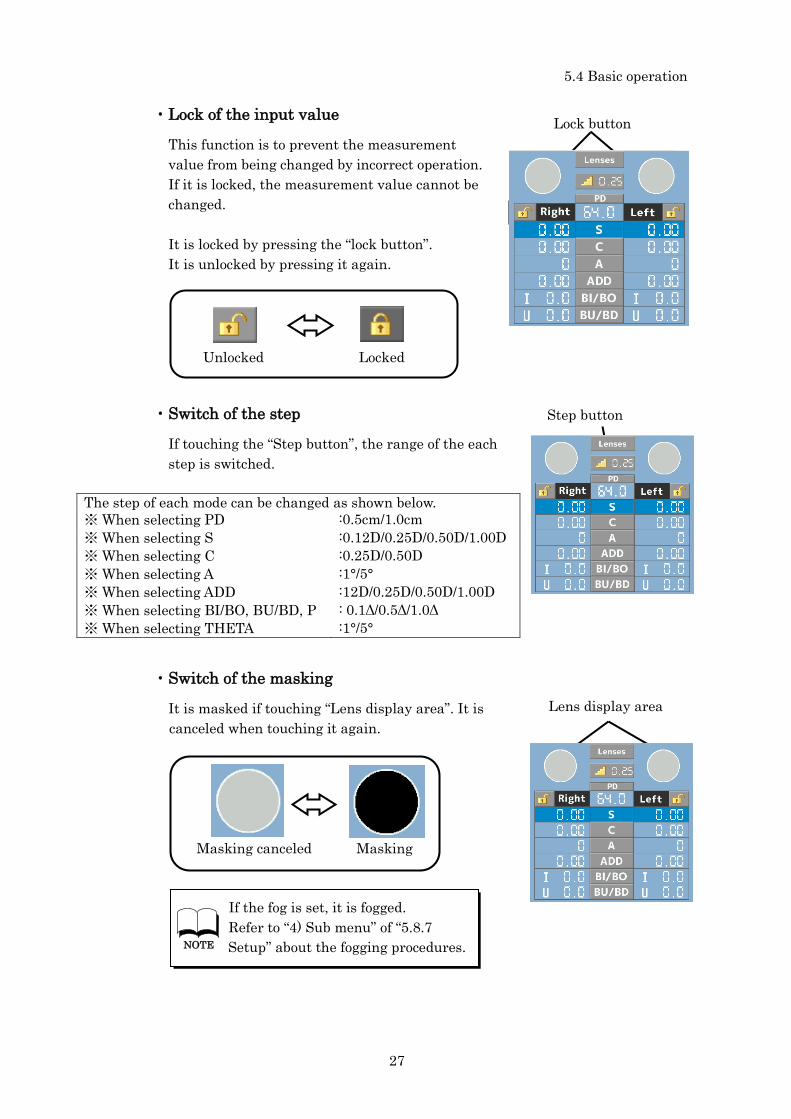
・Lock of the input value
This function is to prevent the measurement value from being changed by incorrect operation. If it is locked, the measurement value cannot be changed.
It is locked by pressing the “lock button”. It is unlocked by pressing it again.
・Switch of the step
If touching the “Step button”, the range of the each step is switched.
The step of each mode can be changed as shown below. ※ When selecting PD :0.5cm/1.0cm
※ When selecting S :0.12D/0.25D/0.50D/1.00D
※ When selecting C :0.25D/0.50D
※ When selecting A :1°/5° ※ When selecting ADD :12D/0.25D/0.50D/1.00D
※ When selecting BI/BO, BU/BD, P : 0.1Δ/0.5Δ/1.0Δ ※ When selecting THETA :1°/5°
・Switch of the masking
It is masked if touching “Lens display area”. It is canceled when touching it again.
Lock button
Unlocked Locked
Step button
Masking canceled Masking
5.4 Basic operation
Lens display area
If the fog is set, it is fogged. Refer to “4) Sub menu” of “5.8.7 Setup” about the fogging procedures.
NOTE
27
5.5 Setting of the chart
5.5.1 Operation of the chart selection area
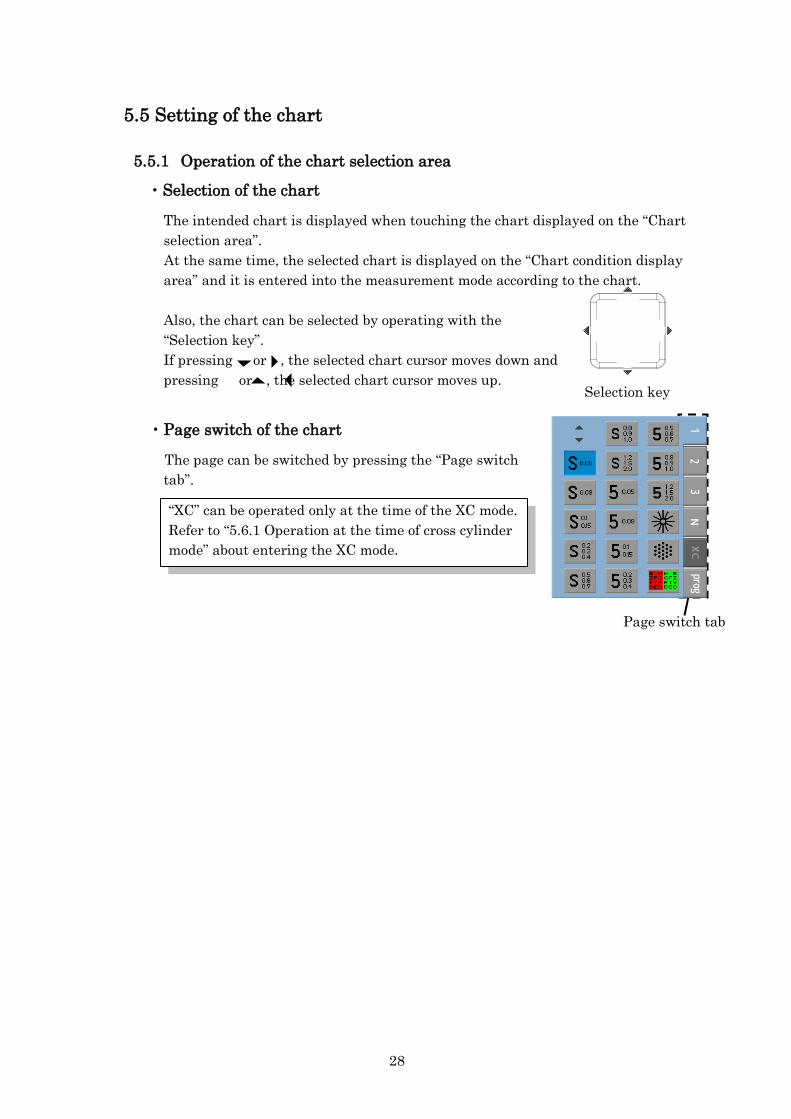
・Selection of the chart
The intended chart is displayed when touching the chart displayed on the “Chart selection area”. At the same time, the selected chart is displayed on the “Chart condition display area” and it is entered into the measurement mode according to the chart.
Also, the chart can be selected by operating with the “Selection key”. If pressing or , the selected chart cursor moves down and pressing or , the selected chart cursor moves up.
・Page switch of the chart
The page can be switched by pressing the “Page switch tab”.
“XC” can be operated only at the time of the XC mode. Refer to “5.6.1 Operation at the time of cross cylinder mode” about entering the XC mode.
Selection key
Page switch tab
28

5.5.2 Operation at the time of selecting the chart for vision measurement ・ Switch of chart auxiliary function
When pressing the “chart auxiliary function button”, the buttons are changed as shown on the right.
・Masking of the chart
In case of masking vertically It is masked vertically if touching the “Vertical mask button”. It is canceled when touching the button again.
In case of masking horizontally It is masked horizontally if touching the “Horizontal mask button”. It is canceled when touching the button again.
Horizontal mask button
“Selection key” ⇒ The horizontal mask moves to up and down.
When the mask is on the lower end: By pressing or , the mask moves to the upper end of the
chart which is one below of the currently selected chart on the “Chart selection area”.
When the mask is on the upper end: By pressing or , the mask moves to the lower end of the
chart which is one above of the currently selected chart on the “Chart selection area”.
5.5 Setting of the chart
Chart auxiliary function button
Vertical mask button
“Selection key” ⇒ The vertical mask moves to up and down, and right and left.
When the mask is on the extreme left: By pressing , the mask moves to the extreme right
of the chart which is one above of the currently selected chart on the “Chart selection area”.
When the mask is on the extreme right: By pressing , the mask moves to the extreme left of
the chart which is one below of the currently selected chart on the “Chart selection area”.
29
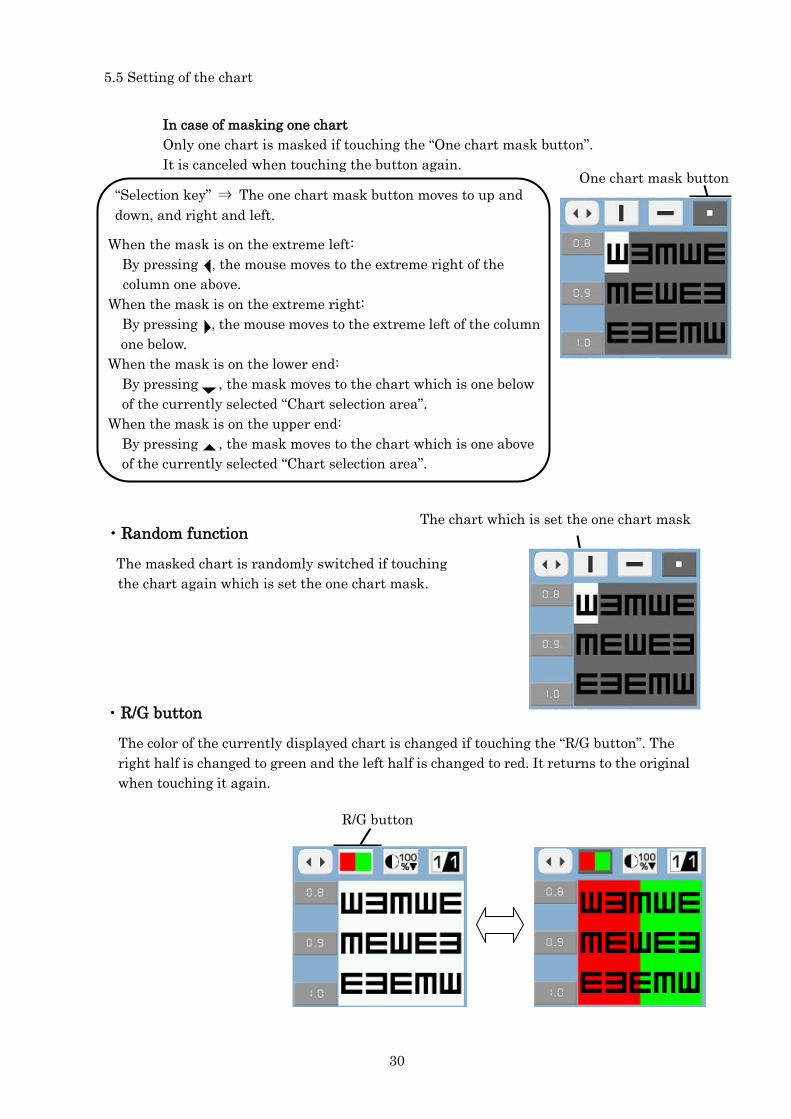
In case of masking one chart Only one chart is masked if touching the “One chart mask button”. It is canceled when touching the button again.
・Random function
The masked chart is randomly switched if touching the chart again which is set the one chart mask.
・R/G button
The color of the currently displayed chart is changed if touching the “R/G button”. The right half is changed to green and the left half is changed to red. It returns to the original when touching it again.
One chart mask button “Selection key” ⇒ The one chart mask button moves to up and down, and right and left.
When the mask is on the extreme left: By pressing , the mouse moves to the extreme right of the
column one above. When the mask is on the extreme right: By pressing , the mouse moves to the extreme left of the column
one below. When the mask is on the lower end: By pressing , the mask moves to the chart which is one below
of the currently selected “Chart selection area”. When the mask is on the upper end: By pressing , the mask moves to the chart which is one above
of the currently selected “Chart selection area”.
5.5 Setting of the chart
The chart which is set the one chart mask
R/G button
30

・Contrast button
The contrast of the currently displayed chart is changed in the following order when touching the “Contrast button”.
100%→25%→12%→6%
The number indicated in the “Contrast button” is the contrast intensity of the currently displayed chart.
・Inversion button
The colors of black and white of the currently displayed target are inverted when touching the “Inversion button”. It returns to the original if touching the button again.
・Memory of the vision
By touching the value displayed on the “Memory button area”, the value is memorized as the vision. The memorized vision is displayed on the “Vision display area”.
When measuring the right eye: memorize the vision of the right eye When measuring the left eye: memorize the vision of the left eye When measuring both eyes: memorize the vision of the both eyes
Memory button area
Vision display area
Inversion button
5.5 Setting of the chart
Contrast button
31

5.5.3 Operation at the time of selecting the dots chart The operation procedures at the time of selecting the dots chart (right figure) are described below.
・Operation of the custom area
When touching the one of the “Angle switch button”, it is changed to the selected angle. The cross cylinder lens is switched as “0.50D→AUTO→0.25D” every time touching the “XC lens switch button”.
・Operation of the cross cylinder lens
In case of the cross cylinder lens of 0.25D or 0.50D
Ask the examinee which is clearer to see, when pressing the “XC1 key” or when pressing the “XC2 key”. Press the “+ key” or “‐key” depending on the answer.
Repeat it until the both can be seen equally.
In case of the auto cross cylinder lens When the auto cross cylinder lens is set, the examinee can see two charts. Ask the examinee which is clearer to see and press either the “+ key” or the “- key” depending on the answer.
Repeat it until the both can be seen equally.
XC1 key
XC2 key
+ key ‐key
In case that it is clearer when pressing the “XC1 key” ⇒ press “+key” In case that it is clearer when pressing the “XC2 key” ⇒ press “‐key”
In case that “+” is clearer to see ⇒ press “+ key” In case that “‐“ is clearer to see ⇒ press “‐key”
Custom area
Angle switch button XC lens switch button
Dots chart
5.5 Setting of the chart
32
5.5.4 Operation at the time of selecting the other charts
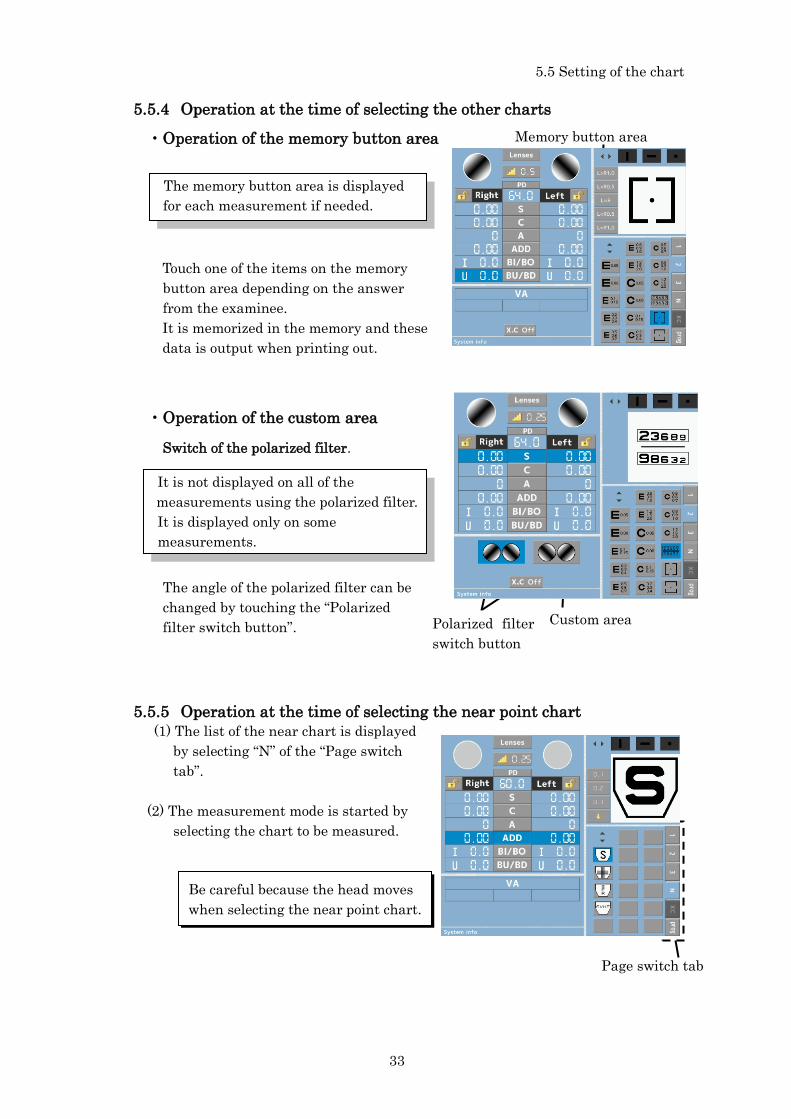
・Operation of the memory button area
Touch one of the items on the memory button area depending on the answer from the examinee. It is memorized in the memory and these data is output when printing out.
・Operation of the custom area
Switch of the polarized filter.
The angle of the polarized filter can be changed by touching the “Polarized filter switch button”.
5.5.5 Operation at the time of selecting the near point chart (1) The list of the near chart is displayed
by selecting “N” of the “Page switch tab”.
(2) The measurement mode is started by selecting the chart to be measured.
Memory button area
The memory button area is displayed for each measurement if needed.
It is not displayed on all of the measurements using the polarized filter. It is displayed only on some measurements.
5.5 Setting of the chart
Be careful because the head moves when selecting the near point chart.
Page switch tab
Custom area Polarized filter switch button
33

5.6 Other operations
5.6.1 Operation at the time of cross cylinder mode ・Entering procedures of the cross cylinder mode
It is entered into the cross cylinder mode by touching the “XC mode button”. When touching it again, it returns to the normal mode.
・Operation of the cross cylinder lens
Refer to “5.5.3 Operation at the time of selecting the dots chart”
In case of the cross cylinder lens of 0.25D or 0.50D
(1) Ask the examinee which is clearer to see, when rotating the dial switch to the right or when rotating it to the left. (Ask the examinee which target is clearer to see the horizontal direction when selecting S and ADD.)
(2) In case that it is clearer to see when rotating to the right, press the dial push key with the dial switch being turned to the right. In case that it is clearer to see when rotating to the left, press the dial push key with the dial switch being turned to the left.
(3) Repeat it until the both can be seen equally.
XC mode button
Dial switch Dial push key
Operation with XC1 key or XC2 key
Operation with the dial switch
The cross cylinder lens set is remained set even though changing the chart in the cross cylinder mode.
34

In case of auto cross cylinder lens
(1) Ask the examinee which is clearer to see between 2 charts which can be seen through the auto cross cylinder lens. (Ask the examinee which target is clearer to see the horizontal direction when selecting S and ADD.)
(2) When “+” is clearer to see, turn the dial switch to the left and press the dial
push key. When “‐” is clearer to see, turn the dial switch to the right and press the dial push key.
(3) Repeat it until the both can be seen equally.
5.6.2 Setting of the auxiliary lens ・Setting procedures of the auxiliary lens
(1) The list of the auxiliary lens is displayed by touching the “Lens selection button”.
(2) The auxiliary lenses are set on the right and left measuring windows by selecting the lens for right and left and pressing the “OK button”.
(3) Press the “Cancel button” when canceling it.
Lens selection button
OK button Cancel button
5.6 Other operations
Refer to the list of the auxiliary lens on the next page about the auxiliary lens.
NOTE
35

・The list of the auxiliary lens
The list of the auxiliary lens
Occluder
Polarized filter
Pinhole (φ1)
Red Maddox
Red filter
Green filter
Cross cylinder (±0.25D)
Cross cylinder (±0.50D)
Fixed cross cylinder
Auto cross cylinder
Lens for retinoscope (+1.5D)
Lens for retinoscope (+2.0D)
Lens for retinoscope (+0.75D)
Dispersing prism (6ΔBU)
Dispersing prism (10ΔBI)
Lens for checking PD
5.6 Other operations
36
5.7 Input of the external data
*The connection cables for the auto refractometer, the lensmeter and PC are not included.
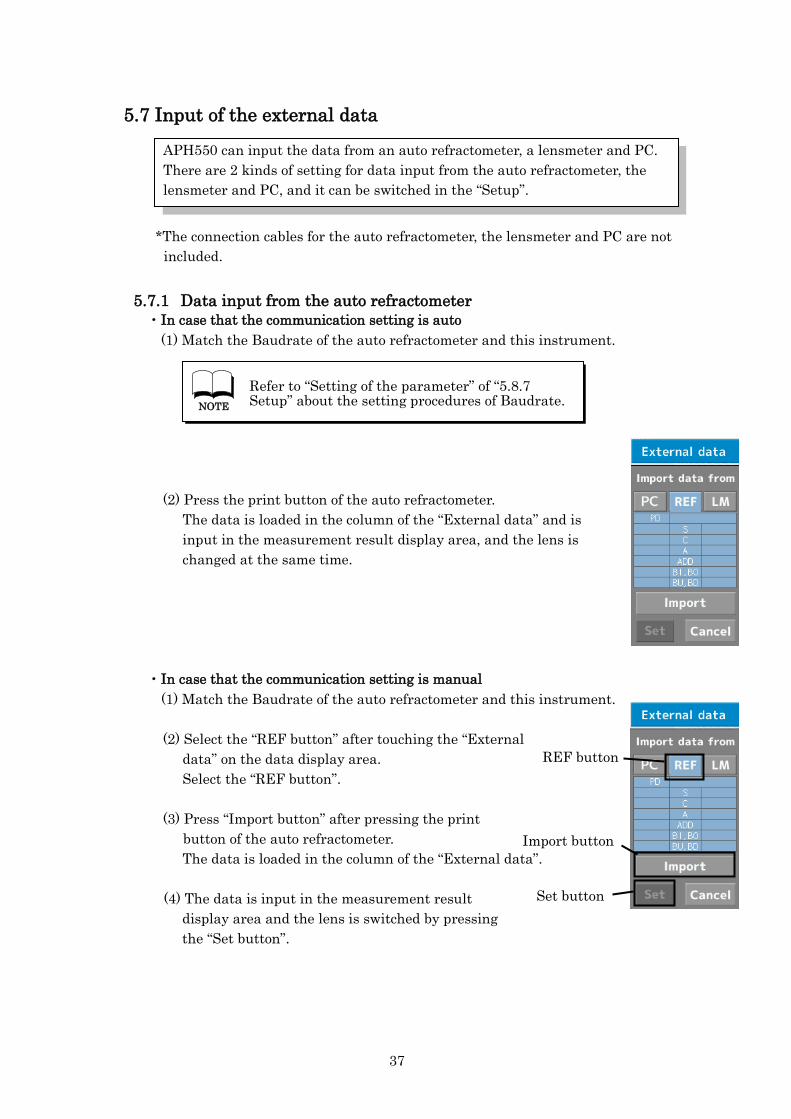
5.7.1 Data input from the auto refractometer ・In case that the communication setting is auto
(1) Match the Baudrate of the auto refractometer and this instrument.
(2) Press the print button of the auto refractometer. The data is loaded in the column of the “External data” and is input in the measurement result display area, and the lens is changed at the same time.
・In case that the communication setting is manual (1) Match the Baudrate of the auto refractometer and this instrument.
(2) Select the “REF button” after touching the “External
data” on the data display area. Select the “REF button”.
(3) Press “Import button” after pressing the print
button of the auto refractometer. The data is loaded in the column of the “External data”.
(4) The data is input in the measurement result
display area and the lens is switched by pressing the “Set button”.
Import button
Set button
REF button
APH550 can input the data from an auto refractometer, a lensmeter and PC. There are 2 kinds of setting for data input from the auto refractometer, the lensmeter and PC, and it can be switched in the “Setup”.
Refer to “Setting of the parameter” of “5.8.7 Setup” about the setting procedures of Baudrate.
NOTE
37

5.7.2 Data input from the lensmeter ・In case that the communication setting is auto
(1) Match the Baudrate of the lensmeter and this instrument.
(2) Select “LM” after touching the “External data” on the data display area.
(3) Press the print button of the lensmeter. The data is loaded in the column of the “External data”.
(4) The data is input in the measurement result display area and the lens is switched by pressing the “Set button”.
・In case that the communication setting is manual (1) Match the Baudrate of the lensmeter and this instrument.
(2) Press the “Import button” after pressing the print button of the lensmeter. The data is loaded in the column of the “External data”.
(3) Press the “OK button”. The data is input and the lens is switched.
5.7.3 Data input from PC ・In case that the communication setting is auto (1) Match the Baudrate of PC and this instrument.
(2) Select “PC” after couching the “External data” on the data display area.
(3) Press the print button of the lensmeter. The data is imported to the “External data” area.
(4) The data is input to the inspection result display area and the lens is switched by pressing the “Set button"
5.7 Input of the external data
Consult your dealer about the details of the connection procedures or the output data. Connectable auto refractometer: ARK070, AKR550, AKR750 Connectable auto lensmeter: CLE60, CLE070, ALM500, ALM700
NOTE
Import button
Set button
LM button
Import button
Set button
PC button
38
・In case that the communication setting is manual (1) Match the Baudrate of PC and this instrument.
(2) Press the “Import” button after pressing the print button of PC. The data is input to the “External data” area.
(3) Press the “Set” button. The data is input and the lens is switched.
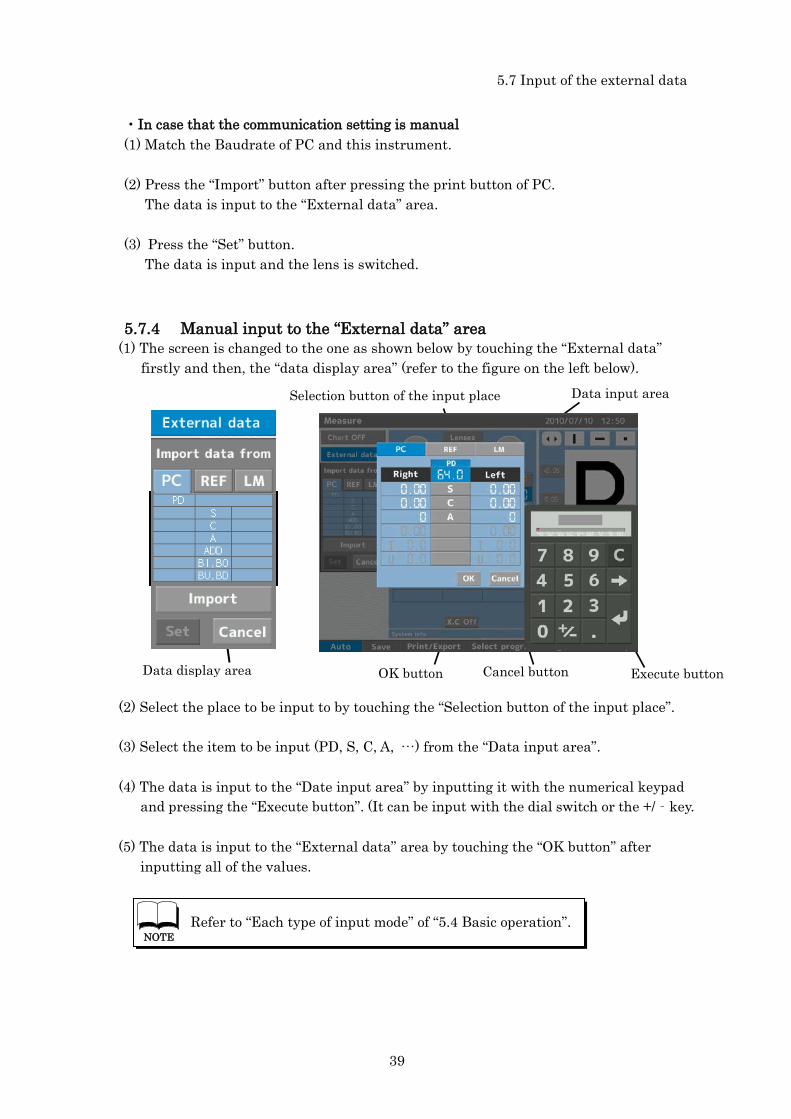
5.7.4 Manual input to the “External data” area (1) The screen is changed to the one as shown below by touching the “External data”
firstly and then, the “data display area” (refer to the figure on the left below).
(2) Select the place to be input to by touching the “Selection button of the input place”.
(3) Select the item to be input (PD, S, C, A, …) from the “Data input area”.
(4) The data is input to the “Date input area” by inputting it with the numerical keypad and pressing the “Execute button”. (It can be input with the dial switch or the +/‐key.
(5) The data is input to the “External data” area by touching the “OK button” after inputting all of the values.
5.7 Input of the external data
Data display area
Data input area
OK button Cancel button Execute button
Selection button of the input place
Refer to “Each type of input mode” of “5.4 Basic operation”.
NOTE
39

5.8 Operation of the menu area
5.8.1 Switch of performance at the time of selecting chart The performance at the time of selecting the chart is switched by touching the “Auto/Manual” switch button. Auto: operate in according to the set
contents of the mode editing the chart.
※ Refer to "5.9.1 Edit of the chart selection area”.
Manual: only chart is switched
5.8.2 Save and calling up of the measurement data
(1) Touch the “Save button”
(2) Select where to save and touch the “OK button”.
Save button
The saved data is called up at one touch of a button and the examinee can compare the data.
The destination file which has data in is indicated in orange. If saving the data in the destination file which already has another data, the data is overwritten.
“Auto/Manual” switch button
Set whether switching the auxiliary lens and the eye to be measured etc. automatically or not at the same time with switching the chart.
Refer to “5.9.1 Edit of the chart selection area” about the editing procedure of the charts.
NOTE
40

(3) Touch the “Cancel button” when canceling it.
(4) The saved data is called up and the lens is switched by touching the “Data button”.
Data button
When data is saved, the “Data button” appears on the “Data display area”.
All of the saved data are deleted if pressing the “Clear key”.
41
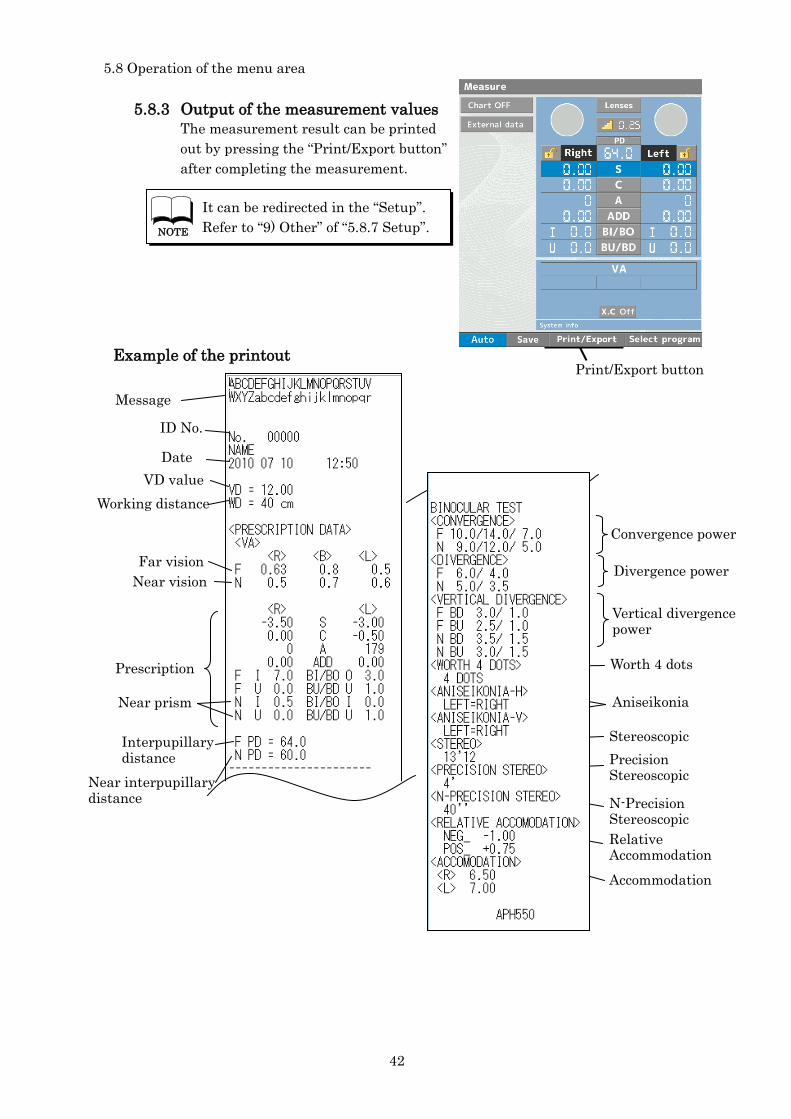
5.8.3 Output of the measurement values The measurement result can be printed out by pressing the “Print/Export button” after completing the measurement.
Print/Export button
5.8 Operation of the menu area
Convergence power
Divergence power
Vertical divergence power
Worth 4 dots
Aniseikonia
Stereoscopic
Example of the printout
ID No.
Date
Message
Working distance
Prescription
Far vision Near vision
Interpupillary distance
Near interpupillary distance
Near prism
VD value
Precision Stereoscopic
N-Precision Stereoscopic Relative Accommodation Accommodation
It can be redirected in the “Setup”. Refer to “9) Other” of “5.8.7 Setup”.
NOTE
42

5.8.4 Selection of the measurement program (1) Press the “Select program” button.
(2) Select the program and touch the “OK button”.
(3) Touch the “Cancel button” if canceling the change.
(4) It is entered into the measurement program by touching the “Prog button” and touching the chart on the upper left.
(5) The next measurement is started by pressing either or . It goes back to the prior measurement by pressing either or . The chart can be selected by the touch panel.
(6) It is switched to the next page by touching the “Page button”.
5.8.5 Selection of fogging (1) Press the “Fog button”.
(2) Select the intended fogging from “Mask/+0.75D/+1.5D/+2.0D” and press the “OK button”.
(3) Touch the “Cancel button” when canceling the change.
Select program button
Fog button
5.8 Operation of the menu area
Prog button Page button
Refer to “5.9.2 Edit of the measurement program” about the setting of the measurement program.
NOTE
43
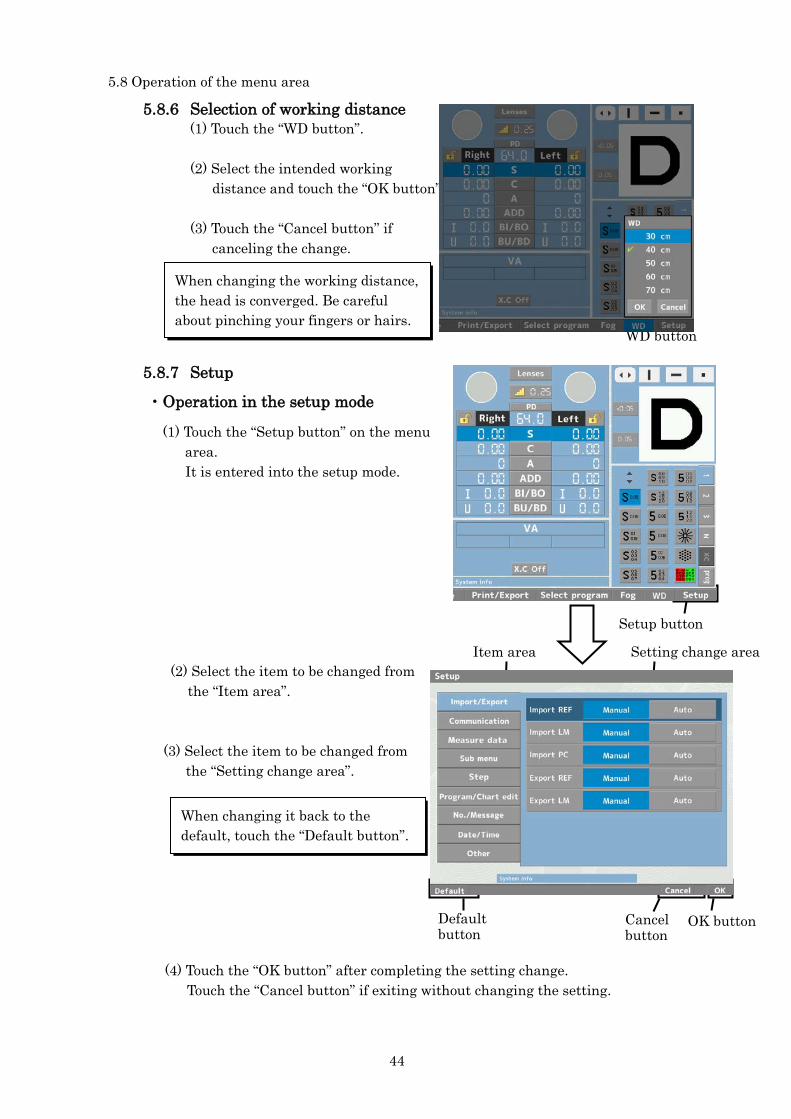
5.8.6 Selection of working distance (1) Touch the “WD button”.
(2) Select the intended working distance and touch the “OK button”.
(3) Touch the “Cancel button” if canceling the change.
5.8.7 Setup
・Operation in the setup mode
(1) Touch the “Setup button” on the menu area. It is entered into the setup mode.
(2) Select the item to be changed from the “Item area”.
(3) Select the item to be changed from the “Setting change area”.
(4) Touch the “OK button” after completing the setting change. Touch the “Cancel button” if exiting without changing the setting.
Setup button
Item area Setting change area
Default button
Cancel button
OK button
WD button
5.8 Operation of the menu area
When changing the working distance, the head is converged. Be careful about pinching your fingers or hairs.
When changing it back to the default, touch the “Default button”.
44

・Setting of the parameter
1) Import/ Export
・Import REF Set the communication with the auto refractometer.
・Import LM
Set the communication with the lensmeter.
・Import PC Set the input from PC.
・Export REF/Export LM Set the output of the input data which is output to PC from the auto refractometer or the lensmeter.
Switch auto ⇔ manual of the input data of “5.7.1 Data input from the auto refractometer”.
Switch auto ⇔ manual of the input data of “5.7.2 Data input from the lensmeter”.
5.8 Operation of the menu area
Manual : The data of the auto refractometer or the lensmeter is output together with the one of APH550 when pressing the print button.
Auto :The data is output to PC at the same time when the data of the auto refractometer or the lensmeter is output to the “External data” area.
Switch auto ⇔ manual of the input data of “5.7.3 Data input from PC”.
"Export REF"/"Export LM" may not be displayed.
NOTE
45

2) Communication
・Import ADD
Set if loading the data of the addition or not if the addition is included in the data input from the outside.
・Import P
Set if loading the data of the prism or not if the prism is included in the data input from the outside.
・Baudrate PC/ Baudrate REF/Baudrate LM
Set Baudrate at the time of communicating with the outside. It can be set for each of PC/REF/LM.
5.8 Operation of the menu area
Set the same Baudrate with the one communicating with.
In case of connecting the instrument to the other devices using RS-232C connector, it should be connected with devices complying with IEC60601-1 or IEC60950.
Disable: do not load the data of the addition Enable: load the data of the addition
Disable: do not load the data of the prism
Enable: load the data of the prism
46
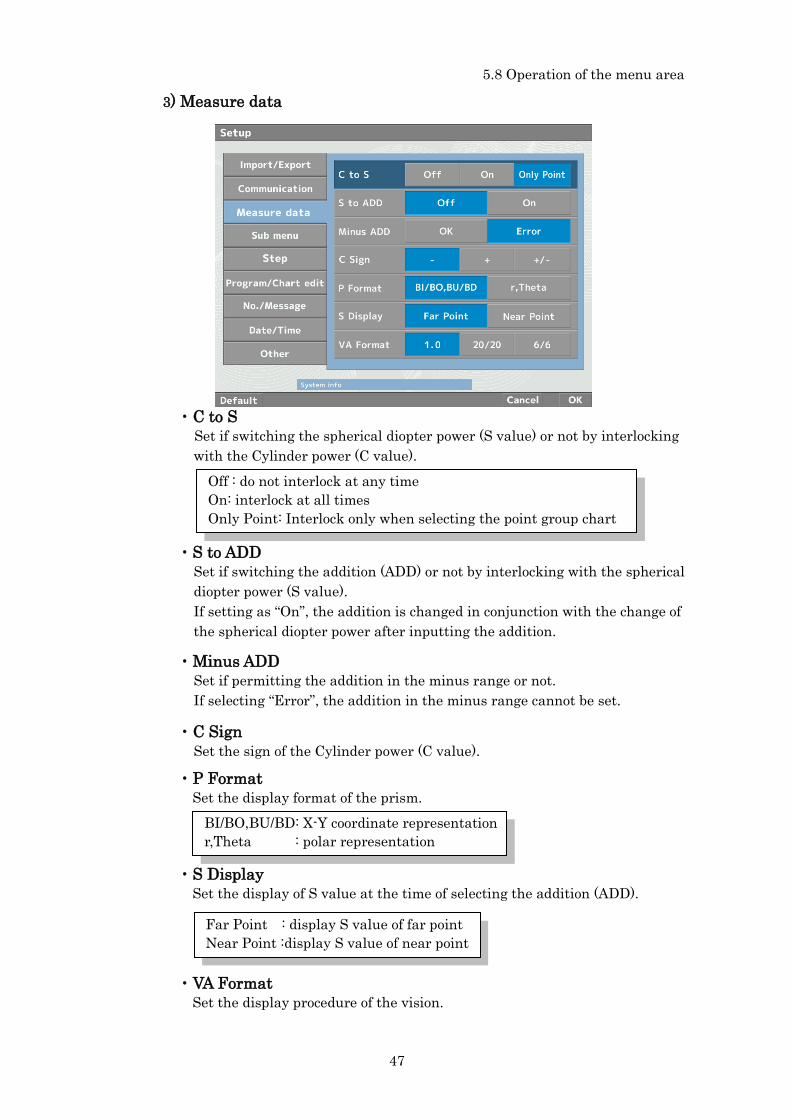
3) Measure data
・C to S Set if switching the spherical diopter power (S value) or not by interlocking with the Cylinder power (C value).
・S to ADD Set if switching the addition (ADD) or not by interlocking with the spherical diopter power (S value). If setting as “On”, the addition is changed in conjunction with the change of the spherical diopter power after inputting the addition.
・Minus ADD
Set if permitting the addition in the minus range or not. If selecting “Error”, the addition in the minus range cannot be set.
・C Sign
Set the sign of the Cylinder power (C value).
・P Format Set the display format of the prism.
・S Display Set the display of S value at the time of selecting the addition (ADD).
・VA Format Set the display procedure of the vision.
Off : do not interlock at any time On: interlock at all times Only Point: Interlock only when selecting the point group chart
BI/BO,BU/BD: X-Y coordinate representation r,Theta : polar representation
Far Point : display S value of far point Near Point :display S value of near point
5.8 Operation of the menu area
47
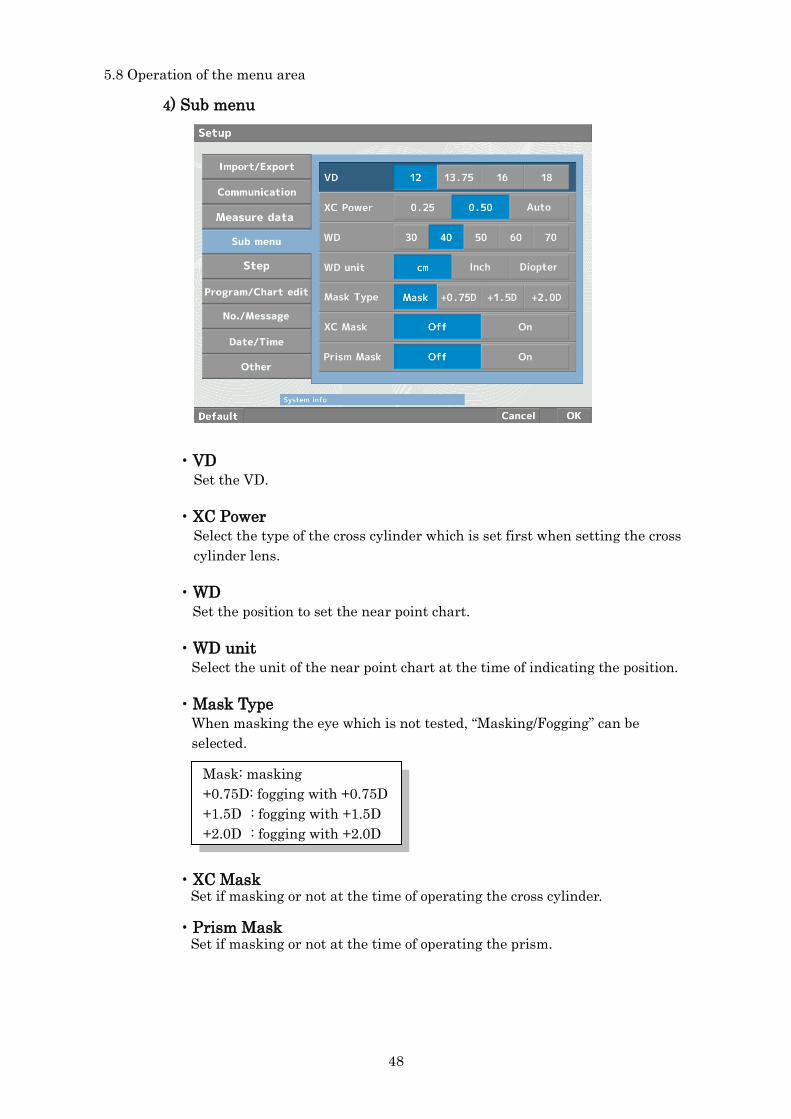
4) Sub menu
・VD Set the VD.
・XC Power Select the type of the cross cylinder which is set first when setting the cross cylinder lens.
・WD Set the position to set the near point chart.
・WD unit Select the unit of the near point chart at the time of indicating the position.
・Mask Type
When masking the eye which is not tested, “Masking/Fogging” can be selected.
・XC Mask Set if masking or not at the time of operating the cross cylinder.
・Prism Mask
Set if masking or not at the time of operating the prism.
Mask: masking +0.75D: fogging with +0.75D
+1.5D : fogging with +1.5D +2.0D : fogging with +2.0D
5.8 Operation of the menu area
48
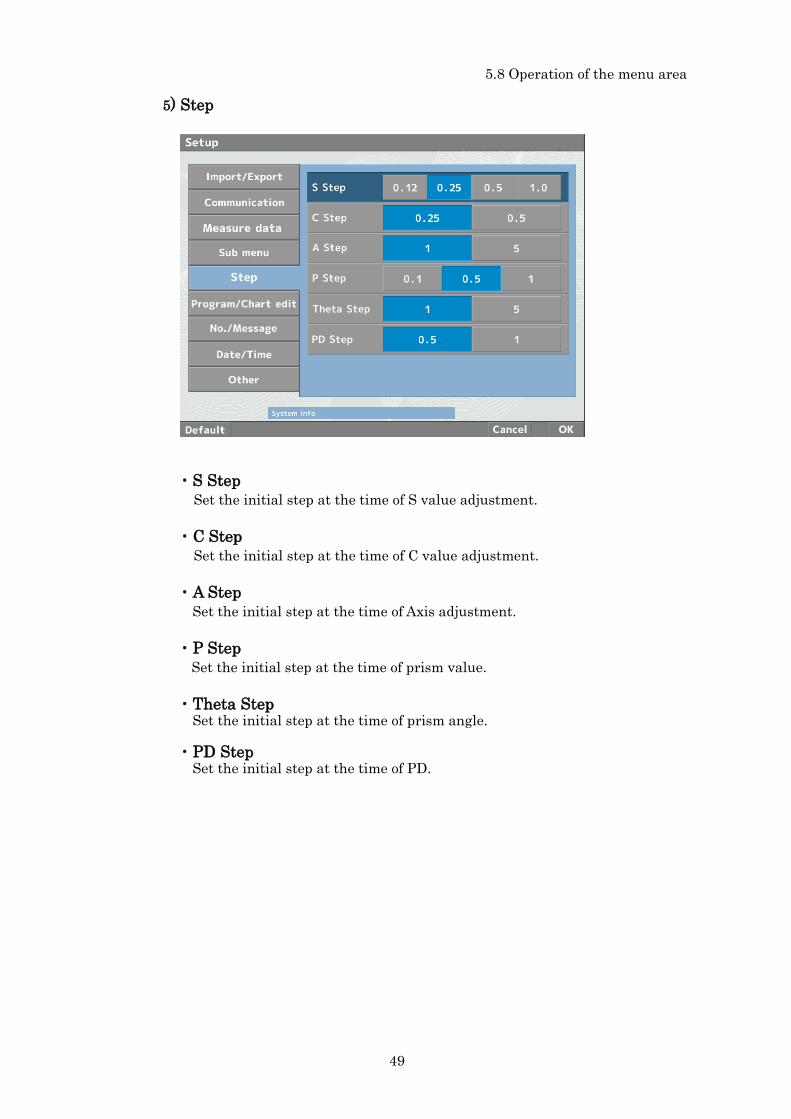
5) Step
・S Step Set the initial step at the time of S value adjustment.
・C Step Set the initial step at the time of C value adjustment.
・A Step Set the initial step at the time of Axis adjustment.
・P Step Set the initial step at the time of prism value.
・Theta Step Set the initial step at the time of prism angle.
・PD Step
Set the initial step at the time of PD.
5.8 Operation of the menu area
49

6) Program/Chart edit
・Start Mode Set the initial measurement program.
・Program1 Enter into the mode to edit the measurement program “Program 1”.
・Program2 Enter into the mode to edit the measurement program “Program 2”.
・Program3 Enter into the mode to edit the measurement program “Program 3”.
・Chart Enter into the mode to edit the chart which is displayed on the chart selection area.
5.8 Operation of the menu area
Refer to “5.9 Edit of the chart and measurement program” about edit of the measurement program and the chart selection area.
NOTE
50

7) No./Message
・No. Select the digit to be changed with the touch panel, or / key and set the ID by touching the “+/‐button” or pressing the “+/‐key”. It is displayed at the time of data output.
・Message When selecting it, the screen is changed to the Message edit screen. It is displayed at the time of data output.
(1) When selecting the characters on the message selection area, it is input on the message display area.
(2) If deleting one character, touch the “Delete button” and deleting all of the characters, touch the “All delete button”.
(3) After completing input, touch the “OK button”. Press the “Cancel button” when exiting without changes.
5.8 Operation of the menu area
Message display area Message selection area
OK button Cancel button
Delete button All delete button
51
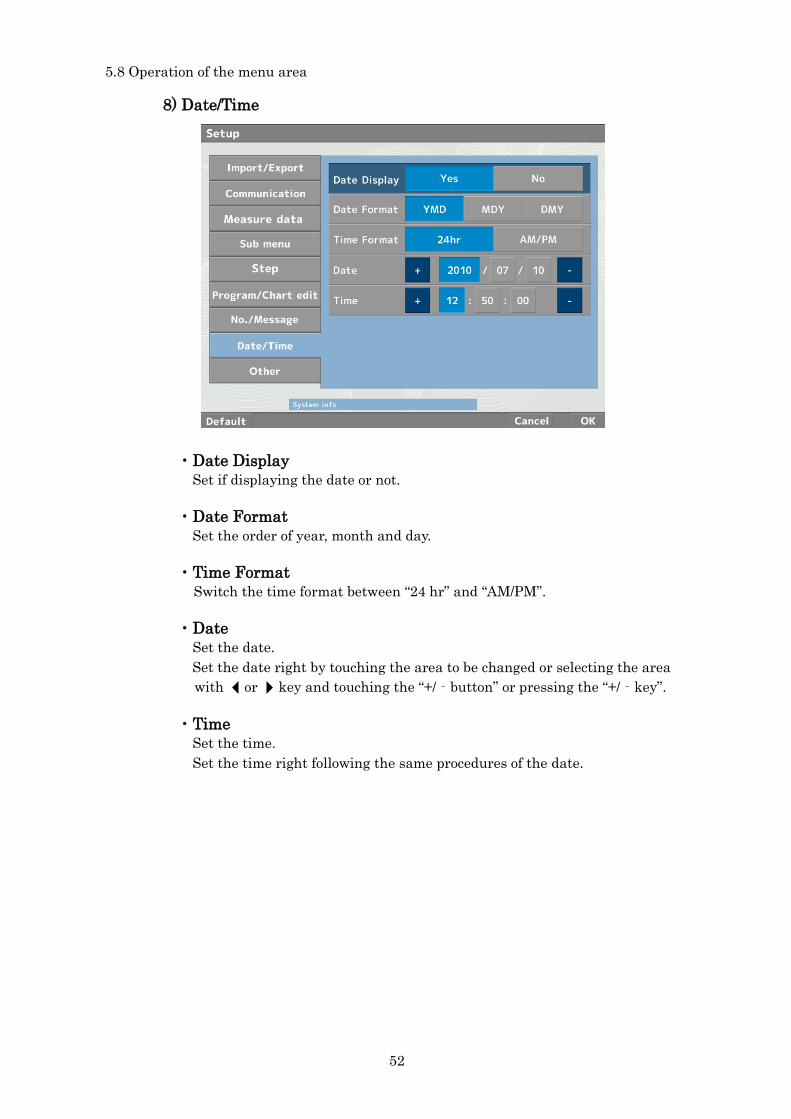
8) Date/Time
・Date Display Set if displaying the date or not.
・Date Format Set the order of year, month and day.
・Time Format Switch the time format between “24 hr” and “AM/PM”.
・Date Set the date. Set the date right by touching the area to be changed or selecting the area with or key and touching the “+/‐button” or pressing the “+/‐key”.
・Time Set the time. Set the time right following the same procedures of the date.
5.8 Operation of the menu area
52

9) Other
・Language Select the language.
・Output Set where the measurement result is output to.
・Brightness Adjust the brightness of the screen. Select the intended brightness by touching the gauge and selecting by or key.
・Auto set
Set the performance at the time of selecting the chart.
・Buzzer Set ON/OFF of the buzzer beeped at the time of operation and detecting the errors.
Printer : print out from the printer PC : output to PC Both : output to both of the printer and PC
5.8 Operation of the menu area
Refer to “5.8.1 Switch of performance at the time of selecting chart” about the details.
NOTE
53

5.9 Edit of the chart and measurement program
5.9.1 Edit of the chart selection area The screen is switched to the one below when entering into the chart edit mode.
Page switch tab
Chart list area
Chart selection area
Measurement mode display area
OK button
Cancel button
Delete button Change button
Edit button Default button
Refer to “6) Program/Chart edit” of “Parameter setting” of “5.8.7 Setup” about entering procedure of the chart edit mode.
NOTE
54

・Sorting of the chart
(1) Select the page which has the chart to be changed with “Page switch tab”.
(2) Select the area to add a new chart from the “chart selection area” with the touch panel or the “selection key”.
(3) Select the chart to add from the “Chart list area”.
(4) Touch the “Delete button” after selecting the chart when deleting the chart on the “Chart selection area”.
(5) Change it back to the default when touching the “Default button”.
Move to down with or , and move up with or key.
When switching the position of the chart (1) Select one chart to be switched. (2) Touch the “Change button”. (3) Select the other chart to be switched.
“Page switch tab” “1” “2” “3” : Far point chart “N” : Near point chart “XC” : The chart at the time of XC mode
For the procedure (2), if the area selected to add the new chart already has the chart, the new chart is added on the selected area and the chart which was already at the area is moved to the next area.
5.9 Edit of the chart and measurement program
55

・Edit of the measurement mode
The measurement mode at the time of selecting the chart can be edit by touching the “Edit button” after selecting the chart to be edit.
・Measurement mode display area Display the currently set measurement mode.
・Test name selection area Switch to the measurement mode corresponding to the test name by selecting it.
・Lens selection area Set the lens to be measured.
・Selection area of the eye to be measured Select the eye to be measured.
・Auxiliary lens selection area Select the auxiliary lens. Select the right eye or left eye with the “RIGHT” or “LEFT” tab.
Auxiliary lens selection area
Test name selection area Measurement mode display area
Selection area of the eye to be measured Lens selection area
The performance at the time of selecting the chart “the eye/eyes to be measured (right eye, left eye or both eyes)/ the lens to be measured (spherical lens (SPH), cylindrical lens (CYL) etc.)/ the auxiliary lens to use for the measurement” can be set freely by editing the measurement mode.
5.9 Edit of the chart and measurement program
If pressing “KEEP”, the conditions of the last measurement are taken over.
If pressing “KEEP”, the conditions of the last measurement are taken over.
56

5.9.2 Edit of the measurement program The screen is switched to the one below when entering into the edit mode of the measurement program.
(1) Select the charts to add from the “Chart list area” in order.
(2) Press the “Delete button” when deleting the chart set in the measurement program and press the “All delete button” when deleting all of the charts.
(3) The measurement mode can be edit by touching the “Edit button”. The chart selected with the cursor on the chart selection area can be edited. It is not switched to the edit screen if the area other than the chart is selected with the cursor.
5.9 Edit of the chart and measurement program
The cursor displayed on the “chart selection area” can be moved in the range which the chart is set. It is moved with the touch panel or the “selection key”. if the area selected to add the new chart already has the chart, the new chart is added on the selected area and all of the charts after it move over by one.
Chart list area
Chart selection area
Measurement mode display area
OK button
Cancel button
Delete button Edit button All delete button
Refer to “6) Program/ Chart edit” of “5.8.7 Setup” about the entering procedures of the measurement program edit mode.
NOTE
57

・Edit of the measurement mode
The measurement mode at the time of selecting the chart can be edit by touching the “Edit button” after selecting the chart to be edit.
・Measurement mode display area Display the currently set measurement mode.
・Test name selection area Switch to the measurement mode corresponding to the test name by selecting it.
・Lens selection area Set the lens to be measured.
・Selection area of the eye to be measured Select the eye to be measured.
・Auxiliary lens selection area Select the auxiliary lens. Select the right eye or left eye with the “RIGHT” or “LEFT” tab.
・Chart shape edit area R/G, contrast or inversion can be set on Chart1.
Auxiliary lens selection area
Test name selection area Measurement mode display area
Selection area of the eye to be measured Lens selection area
The performance at the time of selecting the chart “the eye/eyes to be measured (right eye, left eye or both eyes)/ the lens to be measured (spherical lens (SPH), cylindrical lens (CYL) etc.)/ the auxiliary lens to use for the measurement/the shape of the chart” can be set freely by editing the
If pressing “KEEP”, the conditions of the last measurement are taken over.
If pressing “KEEP”, the conditions of the last measurement are taken over.
Chart shape edit erea
5.9 Edit of the chart and measurement program
5.9 Edit of the chart and measurement program
58
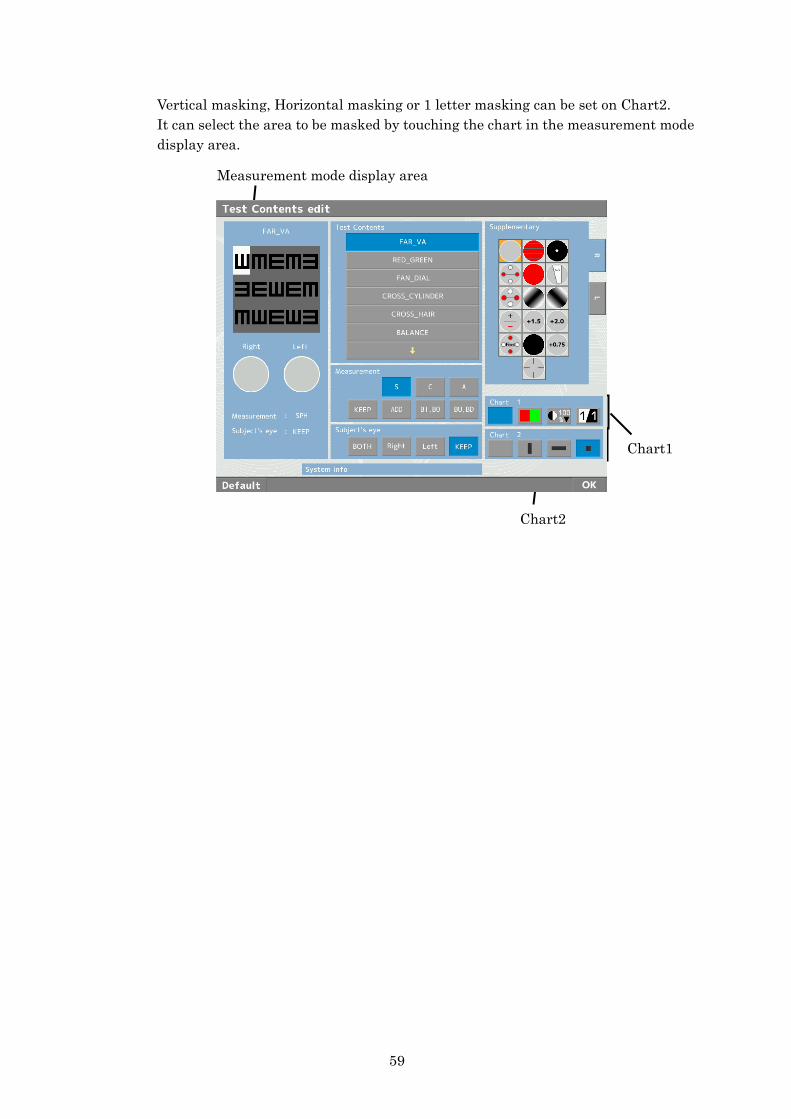
Vertical masking, Horizontal masking or 1 letter masking can be set on Chart2. It can select the area to be masked by touching the chart in the measurement mode display area.
Chart2
Chart1
Measurement mode display area
59

6. Measurement Procedures The measurement procedures below are for the case of using CSPOLA600 (LCD chart). The displayed chart and the set auxiliary lens might be different for CP550, CS550.
6.1 Astigmatism measurement
6.1.1 Clock dial chart Measurement procedures 1. Select the clock dial chart .
The chart on the right is displayed.
2. Select the eye to be measured.
3. Add the spherical diopter power up to the point which can only just see the visual acuity chart of 0.7.
4. Ask the examinee “Are there any lines of the clock dial chart which are especially darker?” ・If he/she said “No”
Show him/her the charts which are ±0.25D from the current spherical diopter power. If he/she says there are no darker lines, he/she does not have an astigmatism. Therefore finish the measurement.
・If he/she said “Yes” Ask him/her the directions of the darker lines and set the axis to the direction which multiplies the smaller number by 30.
Ex) In case that the directions of 3-9 are darker 3×30 = 90° (The direction of the Axis)
5. Add the cylindrical lens by -0.25D until all of the lines become same depth. ・In case that all of the lines become same depth:
Correction of the astigmatism is completed.
・In case that the darker lines are inverted 90°: Cylinder is added too much. Set back by +0.25D until all of the lines looks same depth.
・In case that the darker lines are inverted: The direction of the Axis is not right so correct it as follows.
① In case that it moves in a counterclockwise direction: correct it in a clockwise direction
60
② In case that it moves in a clockwise direction: correct it in a counterclockwise direction
Ex) First, set the Axis to the direction of 180° because the directions of 12-6 were darker but the directions of 1-7 become darker as adding cylinder lenses.
Correct the Axis in a counterclockwise direction (the direction of 10°) because the darker lines move in a clockwise direction.
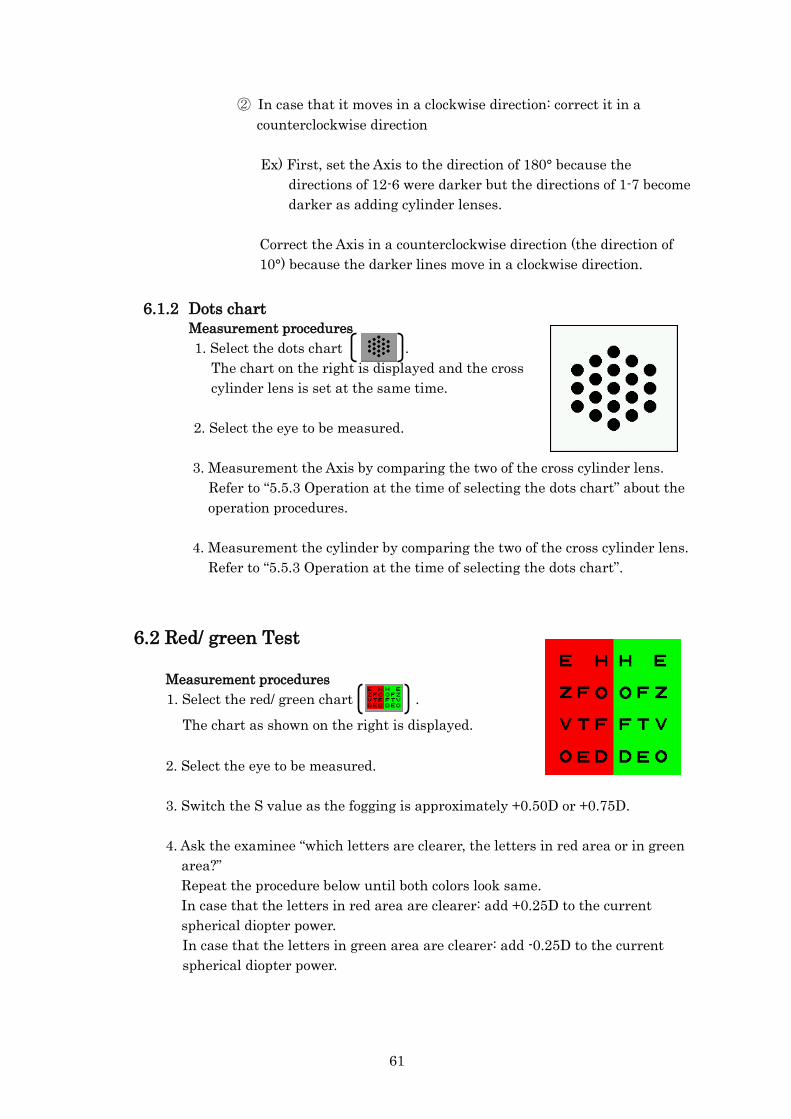
6.1.2 Dots chart Measurement procedures
1. Select the dots chart . The chart on the right is displayed and the cross cylinder lens is set at the same time.
2. Select the eye to be measured.
3. Measurement the Axis by comparing the two of the cross cylinder lens. Refer to “5.5.3 Operation at the time of selecting the dots chart” about the operation procedures.
4. Measurement the cylinder by comparing the two of the cross cylinder lens. Refer to “5.5.3 Operation at the time of selecting the dots chart”.
6.2 Red/ green Test
Measurement procedures 1. Select the red/ green chart .
The chart as shown on the right is displayed.
2. Select the eye to be measured.
3. Switch the S value as the fogging is approximately +0.50D or +0.75D.
4. Ask the examinee “which letters are clearer, the letters in red area or in green area?” Repeat the procedure below until both colors look same. In case that the letters in red area are clearer: add +0.25D to the current spherical diopter power. In case that the letters in green area are clearer: add -0.25D to the current spherical diopter power.
61

6.3 Binocular balance test Measurement procedures 1. Select the binocular balance chart .
The chart as shown on the right displayed and the polarized filter is set on. The examinee can see the chart with one eye as below.
2. Switch the S value as the fogging is approximately +0.50D or +0.75D for the both eye at the same time.
3. Ask the examinee “which is clearer, the chart on the top or on the bottom?”
Repeat the procedure below until the chart on the top and the on the bottom look same. ・In case that the chart on the top is clearer: add +0.25D on the S value of the
current left eye ・In case that the chart on the bottom is clearer: add +025D on the S value of the
current right eye
4. Cancel fogging.
6.4 Phoria test Measurement procedures 1. Select the phoria chart .
The chart as shown on the right is displayed, and the polarized filter is set on. The examinee can see the chart with one eye as below.
2. Ask the examinee how he/she can see the chart. ・In case that he/she can see the chart as a cross
It is orthophoria. It is not necessary to prescribe the prism. ・In case that the cross is deviated horizontally
He/she has horizontal phoria. Prescribe it with BI/BO to be a cross. ・In case that the cross is deviated vertically
He/she has vertical phoria. Prescribe it with BU/BD to be a cross.
Right eye Left eye
Right eye Left eye
62
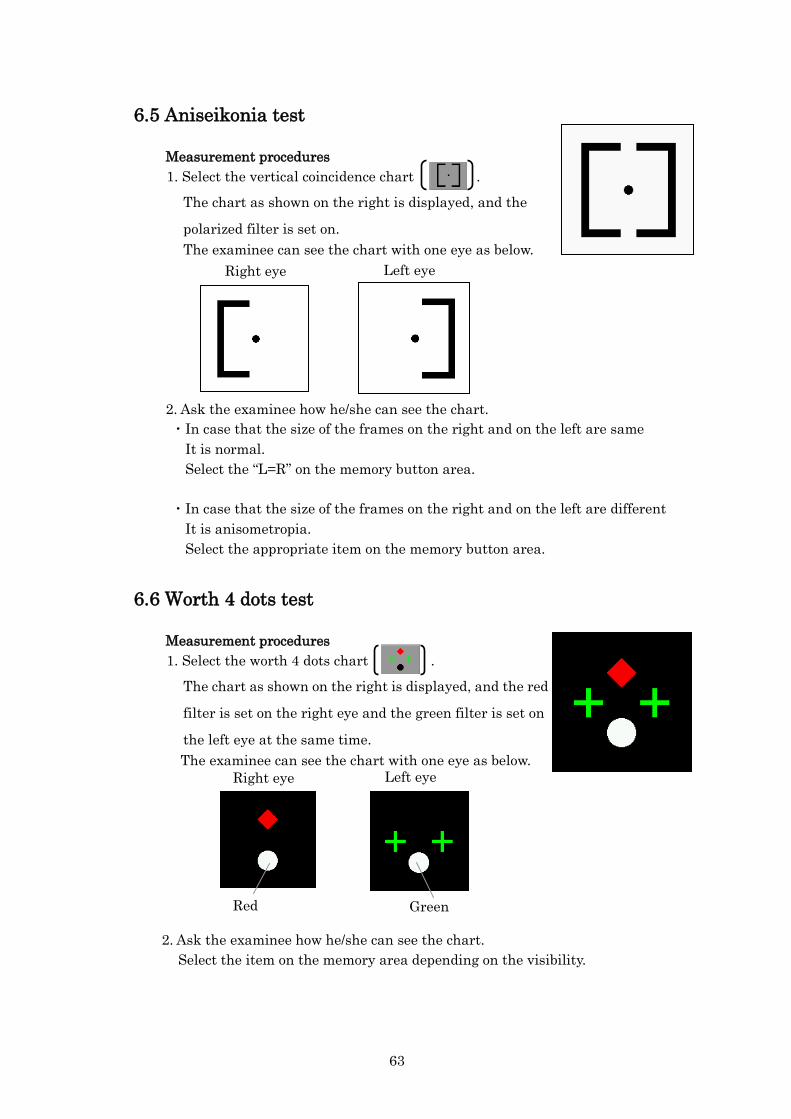
6.5 Aniseikonia test
Measurement procedures 1. Select the vertical coincidence chart .
The chart as shown on the right is displayed, and the
polarized filter is set on. The examinee can see the chart with one eye as below.
2. Ask the examinee how he/she can see the chart. ・In case that the size of the frames on the right and on the left are same It is normal. Select the “L=R” on the memory button area.
・In case that the size of the frames on the right and on the left are different It is anisometropia. Select the appropriate item on the memory button area.
6.6 Worth 4 dots test
Measurement procedures 1. Select the worth 4 dots chart .
The chart as shown on the right is displayed, and the red
filter is set on the right eye and the green filter is set on
the left eye at the same time. The examinee can see the chart with one eye as below.
2. Ask the examinee how he/she can see the chart. Select the item on the memory area depending on the visibility.
Right eye Left eye
Right eye Left eye
Red Green
63
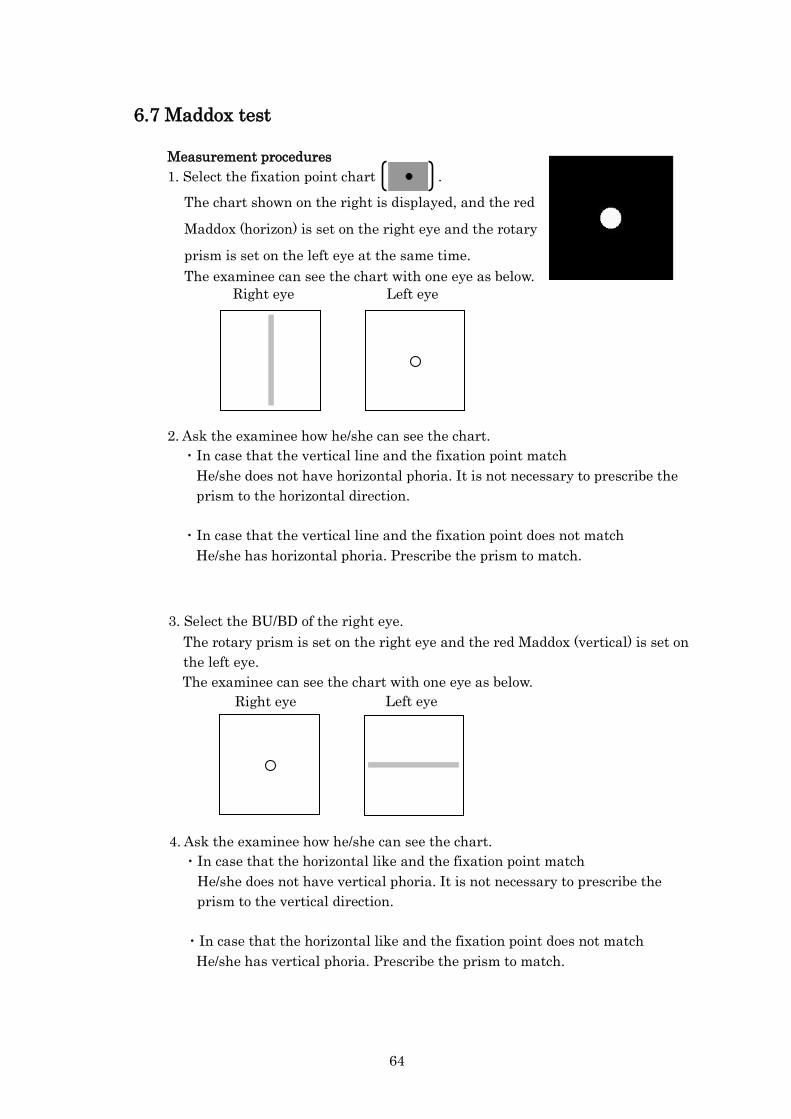
6.7 Maddox test
Measurement procedures 1. Select the fixation point chart .
The chart shown on the right is displayed, and the red
Maddox (horizon) is set on the right eye and the rotary
prism is set on the left eye at the same time. The examinee can see the chart with one eye as below.
2. Ask the examinee how he/she can see the chart. ・In case that the vertical line and the fixation point match
He/she does not have horizontal phoria. It is not necessary to prescribe the prism to the horizontal direction.
・In case that the vertical line and the fixation point does not match He/she has horizontal phoria. Prescribe the prism to match.
3. Select the BU/BD of the right eye. The rotary prism is set on the right eye and the red Maddox (vertical) is set on the left eye. The examinee can see the chart with one eye as below.
4. Ask the examinee how he/she can see the chart. ・In case that the horizontal like and the fixation point match
He/she does not have vertical phoria. It is not necessary to prescribe the prism to the vertical direction.
・In case that the horizontal like and the fixation point does not match He/she has vertical phoria. Prescribe the prism to match.
Right eye Left eye
Right eye Left eye
64

7. Cautions at the Time of the Measurement Cautions at the Time of the Measurement
(1) Start the measurement in the dark room.
(2) Talk to the examinee in a relaxed and friendly manner and prevent him/her from inspiring a feeling of nervousness.
(3) Inappropriate height of the head or the chair will cause the examinee fatigue. Adjust the height of the optical mount (option) to establish the most comfortable and convenient position for him/her.
(4) If the examinee’s head is inclined, it will affect on the values of AXIS and prism. Ask the examinee to maintain good posture during the measurement.
(5) Adjust the PD and the VD before the measurement. If they are not adjusted, it will affect on the measurement result.
65
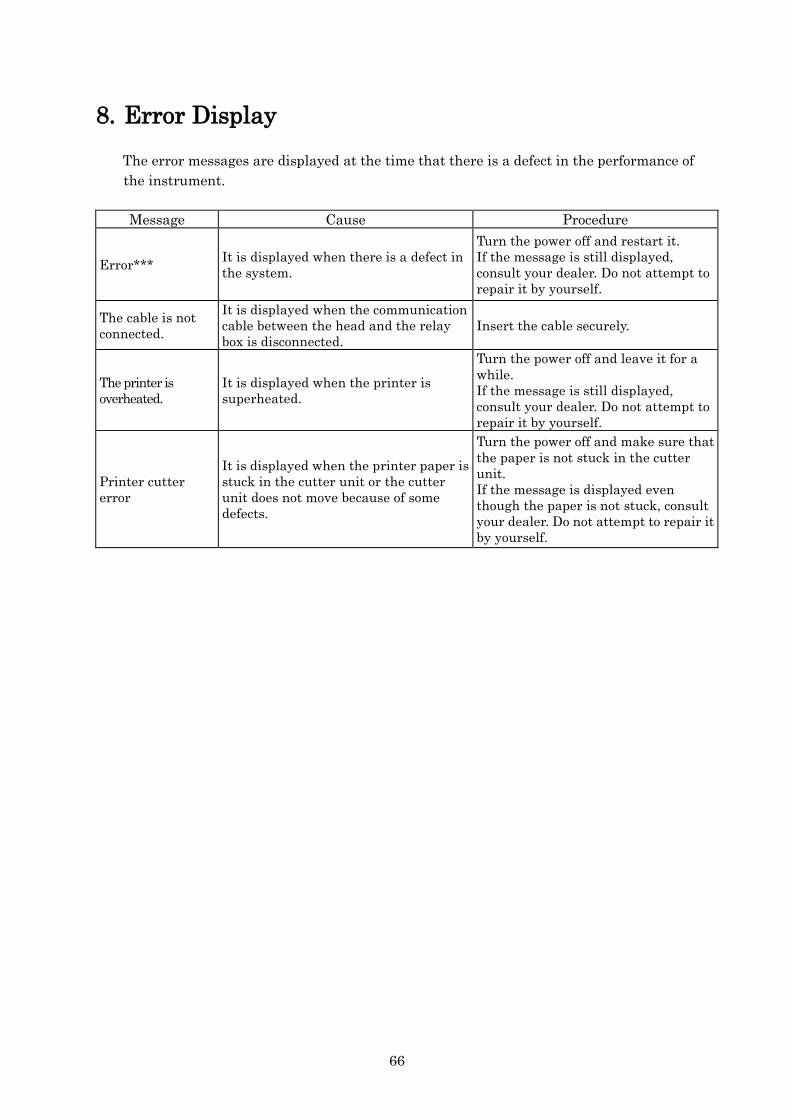
8. Error Display The error messages are displayed at the time that there is a defect in the performance of the instrument.
Message Cause Procedure
Error*** It is displayed when there is a defect in the system.
Turn the power off and restart it. If the message is still displayed, consult your dealer. Do not attempt to repair it by yourself.
The cable is not connected.
It is displayed when the communication cable between the head and the relay box is disconnected.
Insert the cable securely.
The printer is overheated.
It is displayed when the printer is superheated.
Turn the power off and leave it for a while. If the message is still displayed, consult your dealer. Do not attempt to repair it by yourself.
Printer cutter error
It is displayed when the printer paper is stuck in the cutter unit or the cutter unit does not move because of some defects.
Turn the power off and make sure that the paper is not stuck in the cutter unit. If the message is displayed even though the paper is not stuck, consult your dealer. Do not attempt to repair it by yourself.
66

9. Major Troubles and Provisions If any malfunction found, refer to the table below.
Caution
Never disassemble, modify or repair the instrument. Personal injury may result from electric shock.
Symptom Cause and Measures
The power indicator of the relay box is not turned on.
・The power cord may not be properly connected. Make sure to connect it securely.
・The fuse may be blown. If so, replace it to the new one after turning the power off.
The monitor and the power indicator of the controller are not turned on even though the power indicator of the relay box is turned on.
・The communication cable between the controller and the relay box may not be connected. Connect it securely after turning the power off.
The controller is operated but the head is not operated.
・The communication cable between the head and the relay box may not be connected. Connect it securely after turning the power off.
The fuse if blown when the power switch is turned on.
・Remove the plug from the outlet immediately and consult your dealer.
The monitor display suddenly disappears.
・The saving function may be activated. Press any switch to deactivate the saving function.
The instrument does not print out. ・The Output in the Setup may be set as PC. Change the setting.
The printer papers come out but no printing.
・The printer paper may be set in a wrong direction. Set the paper properly.
Contact your dealer immediately if the situation is not improved even after the measures mentioned above are taken.
67
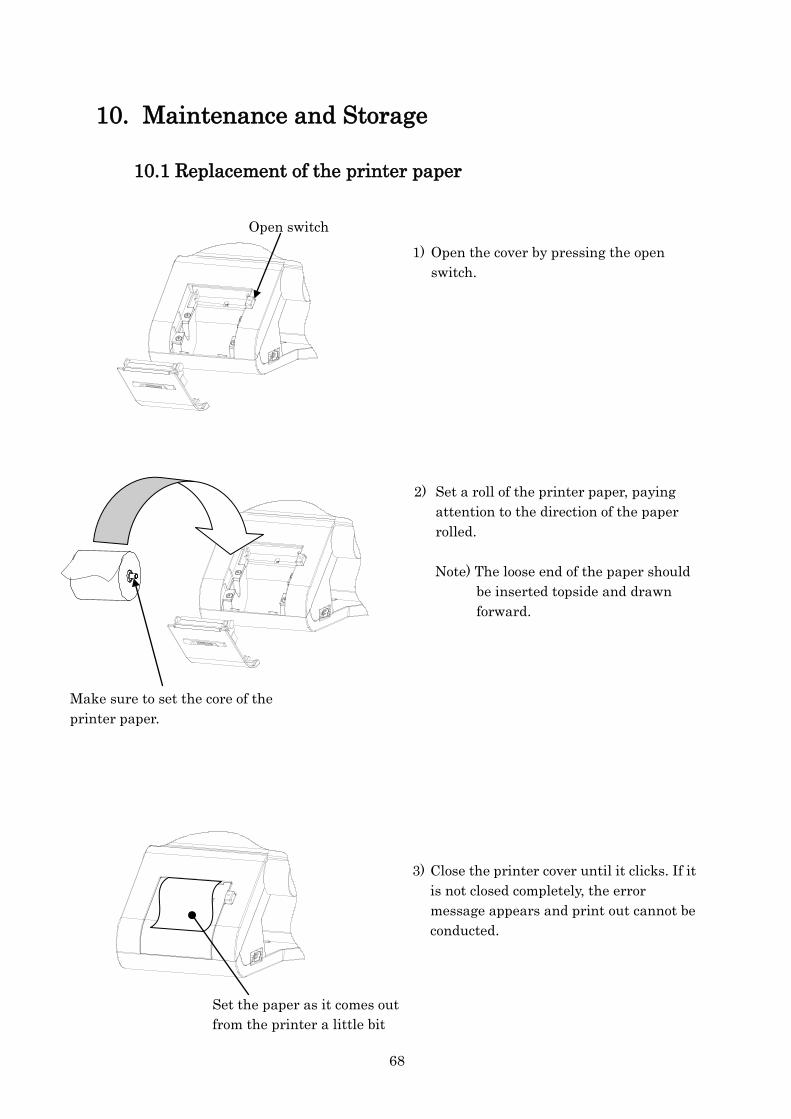
10. Maintenance and Storage
10.1 Replacement of the printer paper
1) Open the cover by pressing the open switch.
2) Set a roll of the printer paper, paying attention to the direction of the paper rolled. Note) The loose end of the paper should
be inserted topside and drawn forward.
3) Close the printer cover until it clicks. If it is not closed completely, the error message appears and print out cannot be conducted.
Make sure to set the core of the printer paper.
Set the paper as it comes out from the printer a little bit
Open switch
68
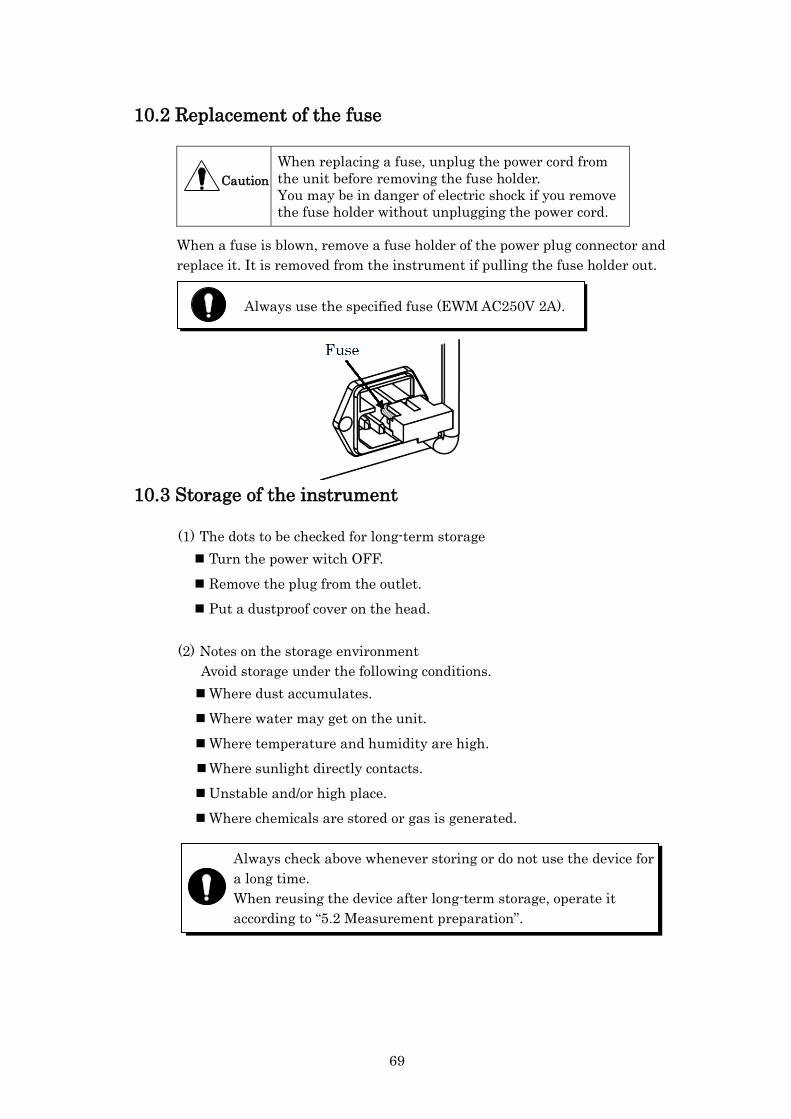
10.2 Replacement of the fuse
Caution
When replacing a fuse, unplug the power cord from the unit before removing the fuse holder. You may be in danger of electric shock if you remove the fuse holder without unplugging the power cord.
When a fuse is blown, remove a fuse holder of the power plug connector and replace it. It is removed from the instrument if pulling the fuse holder out.
10.3 Storage of the instrument
(1) The dots to be checked for long-term storage Turn the power witch OFF. Remove the plug from the outlet. Put a dustproof cover on the head.
(2) Notes on the storage environment Avoid storage under the following conditions. Where dust accumulates. Where water may get on the unit. Where temperature and humidity are high. Where sunlight directly contacts. Unstable and/or high place. Where chemicals are stored or gas is generated.
Always check above whenever storing or do not use the device for a long time. When reusing the device after long-term storage, operate it according to “5.2 Measurement preparation”.
Always use the specified fuse (EWM AC250V 2A).
69
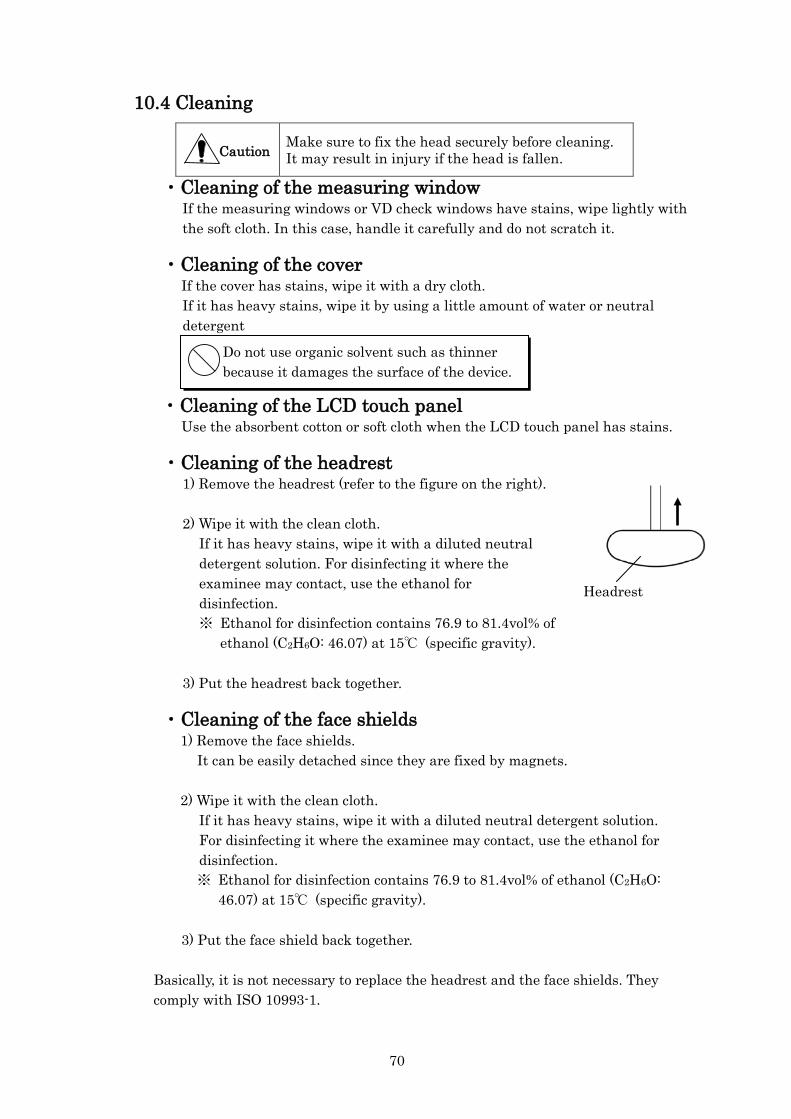
10.4 Cleaning
Caution
Make sure to fix the head securely before cleaning. It may result in injury if the head is fallen.
・Cleaning of the measuring window If the measuring windows or VD check windows have stains, wipe lightly with the soft cloth. In this case, handle it carefully and do not scratch it.
・Cleaning of the cover If the cover has stains, wipe it with a dry cloth. If it has heavy stains, wipe it by using a little amount of water or neutral detergent
・Cleaning of the LCD touch panel Use the absorbent cotton or soft cloth when the LCD touch panel has stains.
・Cleaning of the headrest 1) Remove the headrest (refer to the figure on the right).
2) Wipe it with the clean cloth. If it has heavy stains, wipe it with a diluted neutral detergent solution. For disinfecting it where the examinee may contact, use the ethanol for disinfection. ※ Ethanol for disinfection contains 76.9 to 81.4vol% of
ethanol (C2H6O: 46.07) at 15℃ (specific gravity).
3) Put the headrest back together.
・Cleaning of the face shields 1) Remove the face shields.
It can be easily detached since they are fixed by magnets.
2) Wipe it with the clean cloth. If it has heavy stains, wipe it with a diluted neutral detergent solution. For disinfecting it where the examinee may contact, use the ethanol for disinfection. ※ Ethanol for disinfection contains 76.9 to 81.4vol% of ethanol (C2H6O:
46.07) at 15℃ (specific gravity).
3) Put the face shield back together.
Basically, it is not necessary to replace the headrest and the face shields. They comply with ISO 10993-1.
Do not use organic solvent such as thinner because it damages the surface of the device.
Headrest
70

10.5 Periodical inspection and maintenance
To prevent malfunction and accidents and maintain the performance and reliability of the product, it is recommended to request your distributor for the periodical inspection and maintenance once a year. The periodical inspection and maintenance include inspection of the function and performance of the product, and cleaning, adjustment and replacement of consumable parts if necessary.
10.6 Disposal
Dispose this device according to the regulations of each local government. Follow the disposal procedures of each local government when disposing the lithium batteries used in this device. Check the procedures before disposal. The lithium battery is used for the control board to store the information about the date and time. Basically it is not necessary to replace it because it is rechargeable. Separate the packaging materials and accessories according to the instructions of each local government.
71

11. Specifications
Spherical power Measurement range -28.75D to +27.25D Measurement unit 0.12D, 0.25D, 0.50D, 1.00D
Cylindrical power Measurement range 0D to ±6.00D Measurement unit 0.25D, 1.00D
Axis Measurement range 0°to 180° Measurement unit 1°, 5°
Interpupillary distance
Measurement range 48.0mm to 80.0mm Measurement unit 0.5mm, 1mm
Prism degree Measurement range 0Δ to 20Δ Measurement unit 0.1Δ, 0.5Δ, 1Δ
Prism angle Measurement range 0°to 360° Measurement unit 1°, 5°
Vertex distance 12, 13.75, 16, 18mm
Cross cylinder Auto cross cylinder (±0.25D) ±0.25D cross cylinder ±0.50D cross cylinder
Auxiliary lens
P.D, occluder, foraminous board (φ1mm), polarization filter(45°/135°), Red Maddox (right eye: horizon, left eye: vertical), R/G filter (right eye: red filter, left eye: green filter), dispersing prism (right eye: 6ΔBU, left eye: 10ΔBI), lenses for retinoscope (+0.75D/+1.50D/+2.00D)
External dimensions
Head (Width) 385-417mm (Depth) 112mm (Height) 308mm Controller (Width) 272mm (Depth) 272mm (Height) 204mm Relay box (Width) 364mm (Depth) 119mm (Height) 121mm
Weight Head Approximately 5.3kg Controller Approximately 2.5kg Relay box Approximately 2.5kg
Rated supply AC100 to 240V 50/60Hz
Power consumption 90VA
The circuit diagram, parts lists, and description and instructions for calibration and testing are available separated from this manual.
NOTE
72

Essilor Instruments USA8600 W. Catalpa Avenue, Suite 703 Chicago, IL 60656Phone: 855.393.4647Email: [email protected] www.essilorinstrumentsusa.com