
UNIVERSITÉ DU QUÉBEC THÈSE PRÉSENTÉE À …depot-e.uqtr.ca/6975/1/030596129.pdf · du doctorat...
108
UNIVERSITÉ DU QUÉBEC THÈSE PRÉSENTÉE À L'UNIVERSITÉ DU QUÉBEC À TROIS-RIVIÈRES COMME EXIGENCE PARTIELLE DU DOCTORAT EN SCIENCES DE L'ÉNERGIE ET DES MATÉRIAUX OFFERT EN EXTENSION PAR L'INSTITUT NATIONAL DE LA RECHERCHE SCIENTIFIQUE PAR DAOUDA FOF ANA MODÉLISATION ET CONCEPTION D'ÉLECTRODE CATHODIQUE MULTICOUCHE À FAIBLE QUANTITÉ DE PLATINE ET HAUTE PERFORMANCE POUR LES PILES À COMBUSTIBLE À MEMBRANE ÉCHANGEUSE DE PROTON (PEMFC) OCTOBRE 2013
-
Upload
truongdien -
Category
Documents
-
view
220 -
download
0
Transcript of UNIVERSITÉ DU QUÉBEC THÈSE PRÉSENTÉE À …depot-e.uqtr.ca/6975/1/030596129.pdf · du doctorat...

UNIVERSITÉ DU QUÉBEC
THÈSE PRÉSENTÉE À L' UNIVERSITÉ DU QUÉBEC À TROIS-RIVIÈRES
COMME EXIGENCE PARTIELLE DU DOCTORAT EN SCIENCES DE L'ÉNERGIE ET DES MATÉRIAUX
OFFERT EN EXTENSION PAR L' INSTITUT NATIONAL DE LA RECHERCHE SCIENTIFIQUE
PAR DAOUDA FOF ANA
MODÉLISATION ET CONCEPTION D'ÉLECTRODE CATHODIQUE MULTICOUCHE À FAIBLE QUANTITÉ DE PLATINE
ET HAUTE PERFORMANCE POUR LES PILES À COMBUSTIBLE À MEMBRANE ÉCHANGEUSE DE PROTON (PEMFC)
OCTOBRE 2013
Université du Québec à Trois-Rivières
Service de la bibliothèque
Avertissement
L’auteur de ce mémoire ou de cette thèse a autorisé l’Université du Québec à Trois-Rivières à diffuser, à des fins non lucratives, une copie de son mémoire ou de sa thèse.
Cette diffusion n’entraîne pas une renonciation de la part de l’auteur à ses droits de propriété intellectuelle, incluant le droit d’auteur, sur ce mémoire ou cette thèse. Notamment, la reproduction ou la publication de la totalité ou d’une partie importante de ce mémoire ou de cette thèse requiert son autorisation.

UNIVERSITÉ DU QUÉBEC À TROIS-RIVIÈRES
INRS Énergie, Matériaux et Télécommunications
MODÉLISATION ET CONCEPTION D'ÉLECTRODE CATHODIQUE MULTICOUCHE À FAIBLE QUANTITÉ DE PLATINE ET HAUTE
PERFORMANCE POUR LES PILES À COMBUSTIBLE À MEMBRANE ÉCHANGEUSE DE PROTON (PEMFC)
Président du jury
Par
DAOUDA FOF ANA
Thèse présentée pour l'obtention du Grade de Philosophiae doctor (ph.D.) en Sciences de l'Énergie et des Matériaux
Jury d'évaluation
Professeur Jacques Goyette Université du Québec à Trois-Rivières.
Codirecteur de recherche Professeur Pierre Bénard
Examinateur externe
Examinateur externe
Thèse soutenue le 25 juillet 2013
Université du Québec à Trois-Rivières.
Professeur Dilip Sarkar Université du Québec à Chicoutimi
Professeur Oumarou Savadogo École Polytechnique de Montréal

11
Cette tlièse est dédiée à ma fami[Ce ...
111
Résumé
La problématique de cette thèse est étroitement liée au développement de nouvelles
électrodes cathodiques à faible quantité de platine pour pallier aux problèmes du coût et
de la gestion d'eau dans les piles à combustible de types PEM. En effet, la vitesse de
réduction de l'oxygène à la cathode est celle qui contribue de manière significative aux
pertes par surtension, par comparaison à celle de l ' anode, nécessitant ainsi une densité
importante de platine (.-..-Q.3 mglcm2) , métal noble et dispendieux. En outre, les
phénomènes de noyage entravent la diffusion des espèces vers les sites réactifs conduisant
à une baisse des performances de la pile. Ainsi, la mise au point d'une nouvelle électrode
cathodique multicouche formée par l'alternance de couches de Carbone-Nafion (CN) ou
de carbone-Polytétrafluoroéthylène (CPTFE) et de platine a fait l'objet de cette thèse. La
conception de l'électrode cathodique a été effectuée en se basant sur la technique de
pulvérisation sous vide. Par conséquent, nous avons réussi à réduire la quantité de platine
à 0.05 mglcm2 au niveau de la cathode tout en gardant une bonne performance de la pile
PEM.
Parallèlement à l'étude expérimentale, un modèle mathématique permettant de décrire
les phénomènes physiques ayant lieu au niveau de l'électrode cathodique a été développé
et résolu avec Comsol Multiphysics® 3.5a, un logiciel de calcul commercial à base
d'éléments finis . Nos résultats numériques ont été validés avec les mesures
expérimentales caractérisant le fonctionnement de la pile.
L'analyse de ces résultats numériques et expérimentaux nous a permis de mettre en
évidence l'importance de la réduction de l' épaisseur de la couche active et de la
distribution du platine sur l ' optimisation du fonctionnement de la pile. Une telle
conception de l'électrode cathodique a aussi permis une bonne répartition de l'eau
produite au cours de la réaction électrochimique de réduction de l'oxygène et celle induite
par le phénomène de condensation. Comparativement aux électrodes standard, de fortes
densités de courant limite ont pu être obtenues par l'utilisation de ces électrodes
cathodiques à structure multicouche.
lV
Remerciements
La thèse constitue une expérience passionnante et marquante dans la vie d 'un
chercheur débutant.
Avant tout je remercie DIEU tout puissant de m 'avoir gardé en vie et en bonne santé
jusqu'à ce jour et permis l'aboutissement de ce travail.
Ce travail a été effectué à l'Institut de Recherche sur 1 'Hydrogène (IRH) de
l'Université du Québec à Trois-Rivières (UQTR) . Je tiens à exprimer mes remerciements
au professeur Jean Hamelin de m'avoir accueilli au sein de son équipe de recherche et
au professeur Pierre Bénard d'avoir co-encadré cette thèse. Je tiens à leur exprimer ma
profonde reconnaissance pour avoir encadré mes travaux avec compétence et les moyens
qu'ils ont mis à ma disposition pour effectuer ce travail. Leurs qualités humaines, leurs
écoutes, et leurs conseils ont permis que mes années de doctorat se déroulent dans les
meilleures conditions possibles.
Je remercie également le professeur Jon G. Pharoah du Department of mechanical
and materials engineering de Queen 's University et le professeur Oumarou Savadogo du
Labordtoire d'Électrochimie et de Matériaux Énergétiques de l'École Polytechnique de
Montréal, membres du jury pour l 'honneur qu'ils mefont de juger ce travail.
Je remercie le professeur Jacques Goyette de l'Université du Québec à Trois
Rivières, président du jury pour 1 'honneur qu'il me fait de juger ce travail et dont la
bonne humeur est communicative.
Ce travail ne se serait pas déroulé dans d'aussi bonnes conditions sans le concours
de nombreuses personnes du Laboratoire. Je souhaite ainsi remercier le professeur Xiao
Jinsheng pour les discussions scientifiques que nous avons eues, ainsi que pour ses
conseils qui ont enrichi mon travail, le professeur Jacques Huot et son étudiant Manuel
Tousignant pour l'aide accordé dans l'analyse par rayons X, le docteur Sadesh Kumar
Natarajan pour avoir guidé mes pas dans la conception de la pile à combustible à
membrane échangeuse de protons (PEMFC) et aux tests de mesure de performance. Je
remercie également l'étudiant Paul-André Gaudreault pour son aide dans la préparation

v
des échantillons, l 'informaticien Benjamin Angers ainsi que ma collègue Maha Bhouri
pour son soutien et sa disponibilité tout au long de ma rédaction.
Je remercie mafamille et mes amis pour leur soutien et leur encouragement durant le
déroulement de cette thèse.
Merci également à ceux que j'ai pu oublier. Enfin je remercie ma mère pour ses
bénédictions ainsi que son encouragement.

VI
Table des matières
1. Introduction générale........... .... ...................... ............ ................ ............... ........ ......... 1 1.1. Contexte et motivation.. .... .............. ................ ............. .......... .............................. 2 1.2. Revue de littérature........................... ....... .......................................... ...... ............ 4 1.3. Synthèse et objectif de la thèse...... .................... ...... ........................ ........ ............ 7
Références du chapitre 1.................. ........ ...................................................... ... ................ 8
2. Étude théorique............... .... .......... ...................... ....... ................................ ... ....... ....... Il
2.1. Approche du modèle numérique........................................................................ . 12 2.2. Hypothèses............................ ........... ................................................ .... ... ............ 14 2.3. Couches de diffusion........... ..... .... .... ..................................... .... ..... ...... ............... 15
2.3.1. Description de la couche de diffusion ...................................................... 15 2.3 .2. Description de la MPL................... .................... .... ................................... 16 2.3.3. Description de la couche active.................... ............ .. ........ ...................... 16
2.4. Équations des modèles et conditions aux limites........................................ ....... 18 2.4.1. Propriétés des milieux poreux.............................................................. .... 18 2.4.2. Équations des modèles et conditions aux limites.................................... . 24
2.4.2.1. Densité de courant.......... ................................................................... 25 2.4.2.2. L'équation de conservation des espèces.................................... ........ 26 2.4.2.3 . Équation de Darcy ...... ... .............................. ................... ... ........ ....... 27 2.4.2.4. Équation de la saturation................................................................... 28
2.4.2.5. Équation de conservation de charge........ ...................................... .... 29
2.4.2.6.Paramètres initiaux et conditions aux limites .................................... 32
Références du chapitre 2.... .... ... ............ .. ..... ... ........ .......... .......... ...................................... 34
3. Protocole expérimental........ .. ... ..... ...... ........................................................... ... ....... 35 3.1. Préparation des électrodes et des MEA................ .............................. ................. 37
3.1.1. Électrodes standards ............................ ............ ........................................ 37 3.1.2. Électrodes obtenues par dépôt sous vide.................................................. 38
3.1.3. Membrane de la pile de type PEM............................................................ 41 3.2. Description des dispositifs de test........................................................ ............ .... 42 Références du chapitre 3............. .................................. .............. ....... ..... .... ...... .......... 43
4. Présentation des articles .......... ......... .............................. ...... ......... ............... ........ . 45 Article 1............ ... .... ............ ... ................................................ ............. ................ 46 Article 2.. ... ..... ............... ..................... ..... ...... ..... .. ...... ...................... ................... 47 Article 3... ......... ...................... .......... ...... ................................... ...... ... .... ...... .... .. 49 Article 4.. ......................... ......... ... ... ........ ....................... ..... ........ .. ....................... 51
5. Conclusion et perspective................. ... .... .... ......................................... .... ..... ..... .... .. 53
vu
Liste des figures
Figure 1.1 Figure 1.~
Figure 1.3
Figure 1.4.
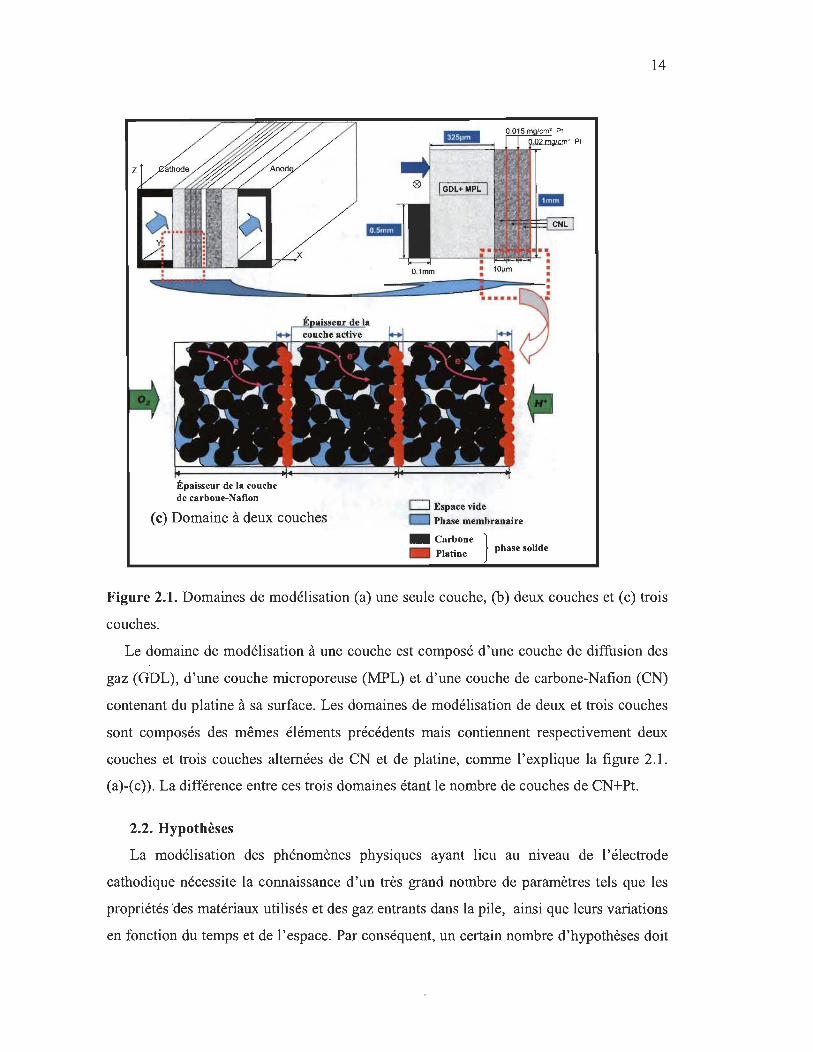
Figure 2.1
Figure 2.2
Figure 2.3
Figure 2.4
Figure 2.5
Figure 3.1
Figure 3.2
Figure 3.3
Figure 3.4
Figure 3.5
Figure 3.6
Fonctionnement d'une pile à combustible PEM [1].... ................ ......... 2 Reconstruction du modèle de la couche active à l'échelle des pores: (a) les électrons, (b) les phases conductrices de protons, (c) les pores 5 de gaz et (d) - (f) les flux correspondants [2]. .................... ................ .... . . Quantité totale du platine aux électrodes d'une PEMFC en mg/cm2
et g/k:W[17]...................... .......... ...... .... ... ............................................. 7
Résultats de fonctionnement d'une pile de type PEM à hydrogène: densité de puissance maximale (m W / cm2) en fonction de la charge 7 totale (anode+cathode) de Pt en llg/cm2 [17]. .................................... . Domaines de modélisation (a) une seule couche, (b) deux couches et (c) trois couches......... ..... ....... ....... .. .... ..... .......... .. ........ ........................ 13
Images de deux types de GDL obtenues à partir du microscope électronique à balayage (SEM) (a) Papier de carbone et (b) tissu de 15 carbone [1] .. ... ............... ..... ... ..... .. ....................................................... . Schéma de la couche catalytique d'une MEA standard et des aggloméras sphériques..... .. .... .... ..... .... ... .... ....... ...... .... ...... ...... ........ ..... 16
Structure de la couche active des modèles étudiés: (a) Modèle à une couche de Pt et de CN, (b) modèle deux à couches Pt et CN et (c) 16 modèle à trois couches de Pt et de CN ............................................... . Courbes comparatives des deux formulations Ao .................... ............. 20
Procédé de fabrication de l'électrode cathodique de la pile PEM.. ...... 33
Procédé de fabrication des encres catalytiques anodique et cathodique pour électrodes standards..... .... ..... ........... ... ..... .... .. ............ 34 Procédé de fabrication de l'encre de CN.. ... ................... ...................... 35 Le schéma de pulvérisation dans un plasma d'argon pour la fabrication d'électrodes de pile à combustible de type PEM [1]. ........ 36 Magnétron à pulvérisation automatique Coater NSC-3000 utilisé pour les couches multiples de pulvérisation [2]............... ..... .... ... ........ 36 Assemblage avant le dépôt sous presse.... .. ... ..... ... ..................... .. ..... ... 37

V111
Liste des tableaux
Tableau 2.1 Paramètres de base utilisés dans la résolution du modèle mathématique.............. .............. ..................... .......... .............. ... ... ...... .. 30
Tableau 2.2 Conditions aux limites pour les différentes espèces présentes au niveau des domaines constituant l'électrode cathodique..................... 30
Tableau 3.1 Propriétés des papiers carbones SIGRACET GDL utilisés.... ............ 34 Tableau 3.2 Différentes configurations cathodiques réalisées................................ 35

1. Introduction générale
2
1.1. Contexte et motivation
Nées du besoin énergétique croissant dû à l' augmentation de la population mondiale,
la raréfaction des énergies fossiles et le réchauffement climatique dû aux gaz à effet de
serre, les énergies renouvelables occupent aujourd'hui une place prépondérante dans la
recherche de nouvelles formes de production d' énergie abondante, peu onéreuse et moins
polluante. Le système de conversion énergétique le plus propre et efficace qui répond à
de telles exigences est la pile à combustible à membrane échangeuse de protons
(PEMFC).
Une pile à combustible à membrane échangeuse de protons est un système qUI
convertit l'énergie chimique libérée durant la réaction électrochimique des gaz qUI
l'alimentent en énergie électrique. Elle est composée généralement de deux électrodes
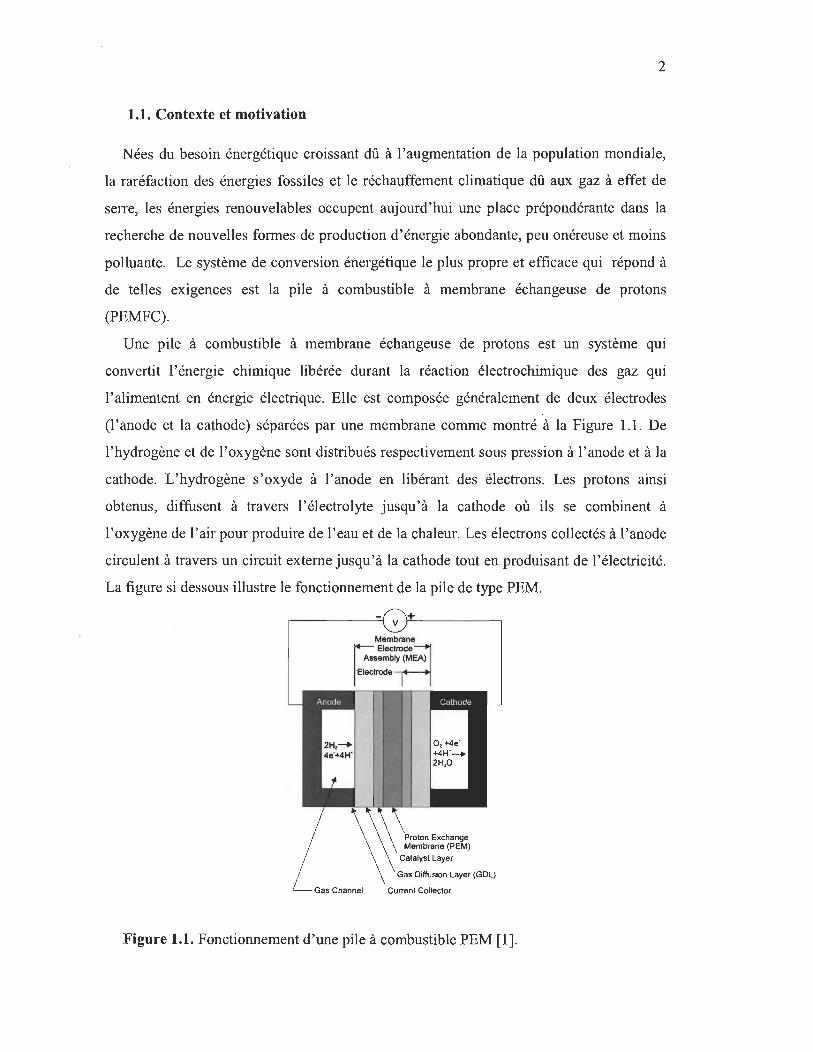
(l'anode et la cathode) séparées par une membrane comme montré à la Figure 1.1. De
l'hydrogène et de l'oxygène sont distribués respectivement sous pression à l'anode et à la
cathode. L'hydrogène s'oxyde à l'anode en libérant des électrons. Les protons ainsi
obtenus, diffusent à travers l'électrolyte jusqu'à la cathode où ils se combinent à
l'oxygène de l'air pour produire de l'eau et de la chaleur. Les électrons collectés à l'anode
circulent à travers un circuit externe jusqu'à la cathode tout en produisant de l' électricité.
La figure si dessous illustre le fonctionnement de la pile de type PEM.
Membrane
~ Electrode
Assembly (MEA)
Electrode
Figure 1.1. Fonctionnement d'une pile à combustible PEM [1].

3
La technologie de la PEMFC a connu des progrès remarquables ces dernières années et
sa fonctionnalité a été démontrée pour une large gamme d'applications automobiles,
portables et résidentielles. Toutefois, des défis subsistent toujours, ralentissant ainsi une
commercialisation réussie de cette technologie. Les premiers efforts de recherche se sont
focalisés sur l'amélioration du fonctionnement des composantes de la pile telles que les
électrodes et la membrane, la résolution des problèmes liés à la corrosion des matériaux
au niveau de ces électrodes ainsi que l'optimisation de son fonctionnement lors du
démarrage à froid et durant les phases transitoires. Au-delà de ces efforts ayant soutenu la
plupart des activités de recherche et de développement (R&D) au cours de ces dix
dernières années, des recherches poussées sont actuellement axées sur la réduction du
coût de la pile et la résolution du problème omniprésent de la gestion d'eau, dégradant
son fonctionnement.
La réalisation de ces deux objectifs est étroitement liée à la réduction de la quantité de
platine utilisée dans la pile PEM ainsi que l'optimisation de sa distribution aux niveaux
des électrodes. En effet, il est clair qu'une part significative des coûts élevés des piles
PEM découle principalement du prix onéreux du platine. D'autre part, une distribution
optimisée de ce matériau résultera en une baisse de la quantité d'eau produite lors de la
réaction de réduction de l'oxygène au niveau de la cathode. Cette gestion d'eau
contribuera à limiter certains mécanismes de dégradation lors des brusques variations de
charge, à améliorer la gestion thermique et fluidique de la pile et à optimiser le contrôle
des phases de noyage et d'assèchement de sa membrane. Les lieux d'accumulation de
l'eau produite par condensation et/ou réaction chimique demeurent la couche active (CA)
et la couche de diffusion des gaz (GDL). Or, un fonctionnement optimal de la pile PEM
dépend étroitement de la régulation du flux des gaz réactifs, de la quantité d'eau produite
et de la chaleur de concert avec la cinétique de réaction. Le transport des réactifs et des
produits, de l'eau et de la chaleur aussi bien que le transfert de charges ioniques et
électriques, ont lieu dans la couche active, ce qui fait de cette couche le lieu le plus
important à étudier pour assurer la compétitivité de la pile à combustible de type PEM. En
pratique, de nombreuses propriétés de la couche catalytique doivent être déterminées et
optimisées pour maximiser sa performance. La quantité de platine, la diffusivité des
4
réactifs, les conductivités ionique et électrique et le niveau d'hydrophobicité doivent être
soigneusement équilibrés.
La mise au point d'une nouvelle électrode cathodique à faible quantité de platine et à
haute performance constitue donc une voie prometteuse à l'amélioration de la gestion de
l'eau et à la réduction des coûts des piles de type PEM. Dans la prochaine section, nous
présentons les principaux travaux de recherche qui ont été élaborés dans ce domaine.
1.2. Revue de littérature
La conception des électrodes de la pile de type PEM est un processus complexe du fait
que le transport des gaz, des électrons et des protons doivent être optimisées pour assurer
leurs transports effectifs vers les sites réactifs. Ceci ne peut être accompli que grâce à un
examen attentif du comportement du volume du milieu conducteur nécessaire à chaque
phase (solide, liquide et gaz). Le développement d'un modèle mathématique et sa
résolution avec les outils de calcul numérique se sont avérés indispensables pour atteindre
de tels objectifs. Lors de l'étude effectuée par N. Djilali et P. C. Sui [1], les auteurs ont
réussi à représenter une composition des électrodes à l'échelle des pores (PSM) ce qui
leur a permis de distinguer les phases solides conductrices de l'électron et du proton, les
pores des gaz et les flux correspondants. Leur modèle (PSM) a permis ainsi de fournir des
paramètres de transport macroscopiques, difficiles à obtenir à partir de mesures ou des
modèles macroscopiques. En outre, l 'une des observations issues de leur étude est que le
problème de noyage des électrodes ne doit pas être négligé dans le processus de
conception des électrodes.
D 'autres études se sont basées sur l'utilisation des méthodes de calcul de la dynamique
des fluides (CFD) afin -de simuler et prédire à une échelle multidimensionnelle les
phénomènes de transport des réactifs, des produits et de chaleur ayant lieu lors du
fonctionnement de la pile. À travers leur étude numérique d 'optimisation du
fonctionnement de l'électrode cathodique, Song et al. [2] ont réussi à mettre en évidence
la dépendance du bon fonctionnement de la pile sur un certain nombre de paramètres de
conception de la couche active, tels que les teneurs en Nafion et en platine, l'épaisseur de
cette couche et sa porosité. La densité optimale du Pt obtenue est de 0.24 mg/cm2
produisant un courant maximum de 0.39 AJcm2. Leur analyse numérique a montré que la
5
performance de la couche active est beaucoup plus sensible à l'épaisseur que les trois
autres paramètres. Selon les auteurs, une attention particulière devrait donc être accordée
à une conception de type couche mince de la couche active afin d'éviter une chute
importante de la densité de courant. En outre, en modifiant l'épaisseur et la quantité de
platine, la couche active peut atteindre de meilleures performances contrairement aux
autres paires de paramètres. Cependant, l'effet de la présence d'eau n'a pas été pris en
compte dans cette étude.
Rao et Rengaswamy [3] ont développé un modèle d'agglomérat de la couche active
basé sur deux formulations différentes d'optimisation dans l'objectif de réduire au
minimum la quantité de platine et de maximiser le courant généré. Une troisième
formulation a été également présentée, dans laquelle le courant est optimisé
simultanément pour tous les points courant-tension. Cette étude a démontré la possibilité
de diminuer la quantité de platine utilisée tout en sacrifiant la performance de la pile pour
un certain intervalle de tension de fonctionnement.
Secanell et al. [4, 5] ont utilisé un modèle cathodique macro homogène bidimensionnel
et un modèle d'électrode cathodique agglomérée à travers un canal pour obtenir la densité
de platine dans la couche active ainsi que les proportions de Nafion et de platine dans le
carbone et la porosité de la couche de diffusion permettant de maximiser la densité de
courant de la pile à une tension de 0.6 V. Leurs résultats ont conduit à la conclusion
qu'une amélioration considérable des performances de la pile à combustible pourrait être à
obtenue en augmentant le rapport en masse de platine sur le support du catalyseur.
Zhang et al. [6] ont proposé des valeurs optimisées de la porosité, de la perméabilité et
de l'épaisseur des couches de diffusion des gaz au niveau de l'anode et de la cathode ainsi
que la stœchiométrie des gaz d'entrée afin de réduire au minimum la surtension
cathodique à une tension de cellule de 0.6 V. Le modèle mathématique qu'ils ont proposé
est un modèle tridimensionnel stationnaire où les phénomènes de transport de masse, de
quantité de mouvement et de chaleur sont considérés, en couplage avec les réactions
électrochimiques ayant lieu au niveau des électrodes. Ds ont minimisé la chute de tension
au niveau de la cathode, dans le but de créer une couche de catalyseur cathodique plus
active et augmenter le rendement de la pile. Leurs résultats ont montré qu'à la tension
6
nominale de 0.6 V, la distribution de la densité de courant dans la cathode est plus
uniforme.
Outre les méthodes numériques, la VOle expérimentale a penms une avancée
significative dans le développement de couches actives à faible quantité de platine [7-12].
Deux grandes approches peuvent être distinguées dans la littérature. La première consiste
à l'exploitation de catalyseurs non nobles et la deuxième consiste à la réduction de la
quantité de platine à travers l'usage de supports non précieux [13] . Les alliages de platine
ont permis une percée significative dans l'obtention de performances compétitives à coût
réduit de la pile de type PEM [13]. Cependant l'usage de ce type d'alliages reste limité
par leur durée de vie trop courte [13].
Les caractéristiques exigeantes de la pile de type PEM pour obtenir une haute
conductivité électrique et une stabilité chimique tout en assurant un faible coût de
conception a conduit alors à l'usage de carbone comme support et du platine comme
catalyseur, plus particulièrement avec le développement de nouveaux procédés de
fabrication de la couche active [14, 15]. La tendance actuelle est orientée vers les couches
actives minces car elles permettent une nette amélioration de la performance de la pile. La
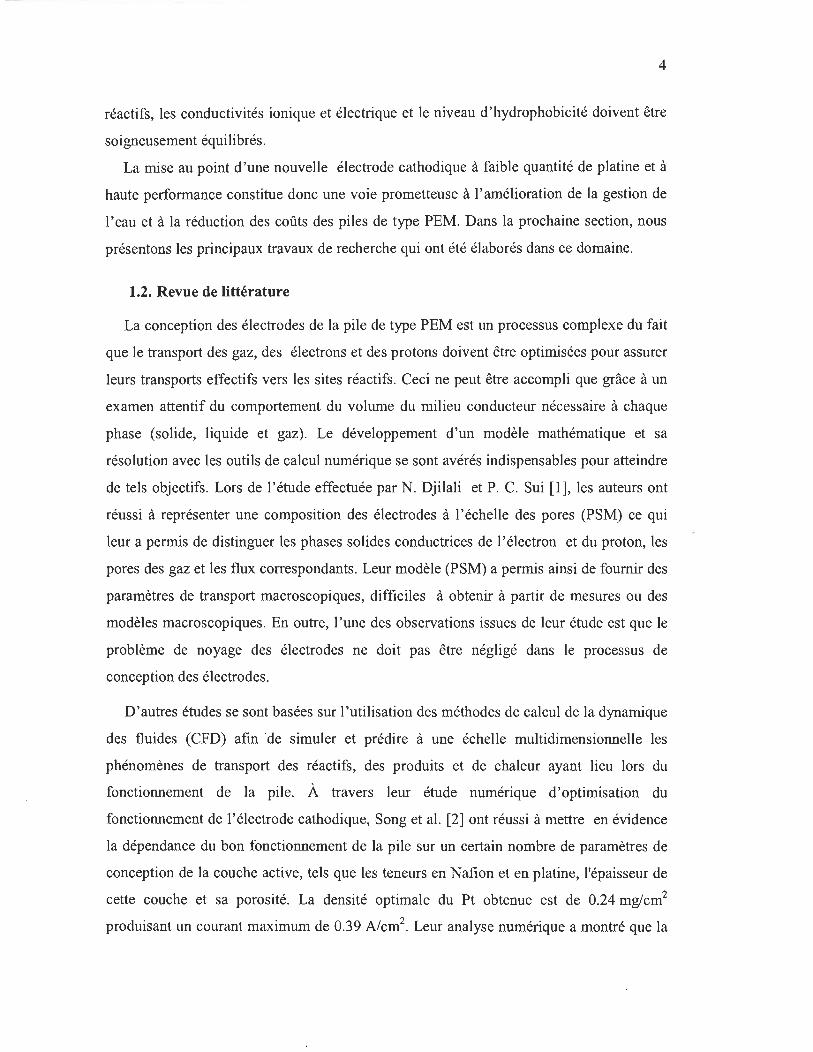
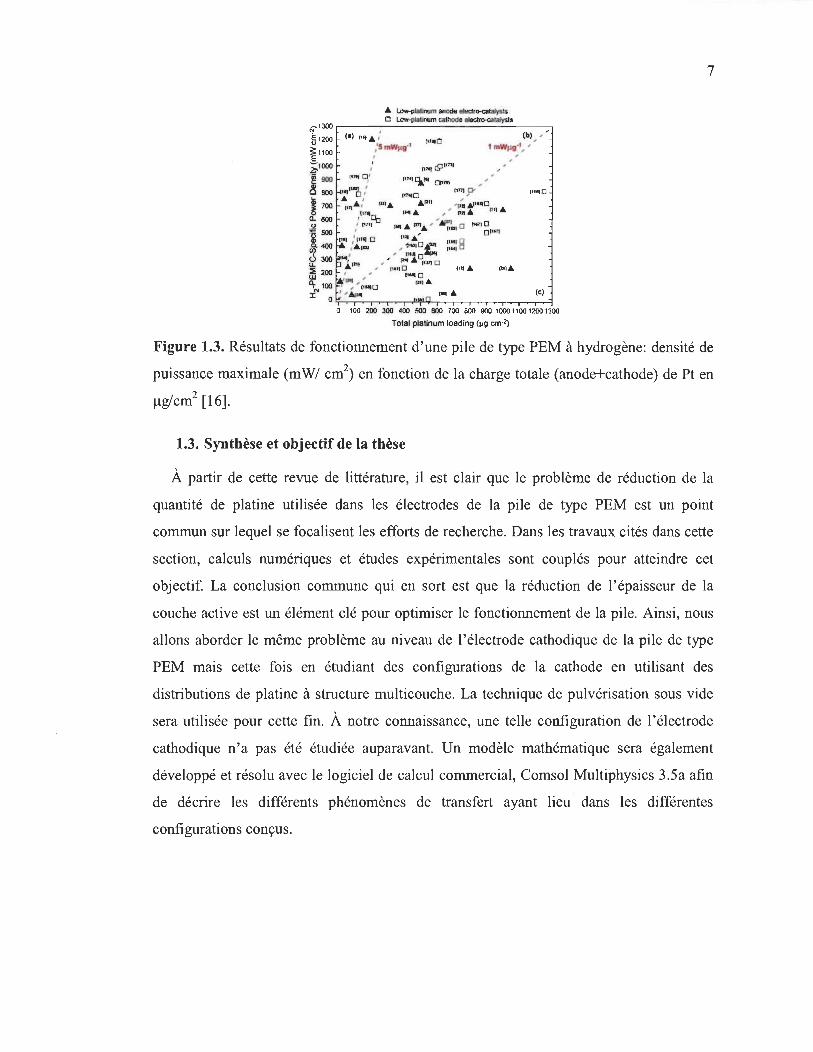
Figure 1.2 présente la quantité totale de platine utilisée dans les piles de type PEM depuis
2006 et les perspectives pour 2015 tandis que la Figure 1.3 résume les principaux efforts
consentis dans ces dernières décennies dans la littérature concernant l'utilisation de faible
quantité de platine à l'anode et à la cathode.
1,2 r----------------, lOUfOI United SlIles Depol1menl ., Ene1gy (OOel
~ 1,1
~ 1,0 Qi ~ 0.9
~ 0,8
~ 0,7
i 0,6
~ 0.5
.2 0 ,4
~ 0,3 c ~ 0,2 0.. 0,1
0.0 '-"-~---'-'
2006 2007 2008 2009 2010 2015
Figure 1.2. Quantité totale du platine aux électrodes d'une PEMFC en mg/cm2 et
g/kW[16].
o 100 200 300 400 500 600 700 600 900 100011001200 1300
Total platinum Ioading (~g cm-2)
7
Figure 1.3. Résultats de fonctionnement d'une pile de type PEM à hydrogène: densité de
puissance maximale (mWI cm2) en fonction de la charge totale (anode+cathode) de Pt en
/-lglcm2 [16].
1.3. Synthèse et objectif de la thèse
À partir de cette revue de littérature, il est clair que le problème de réduction de la
quantité de platine utilisée dans les électrodes de la pile de type PEM est un point
commun sur lequel se focalisent les efforts de recherche. Dans les travaux cités dans cette
section, calculs numériques et études expérimentales sont couplés pour atteindre cet
objectif. La conclusion commune qui en sort est que la réduction de l'épaisseur de la
couche active est un élément clé pour optimiser le fonctionnement de la pile. Ainsi, nous
allons aborder le même problème au niveau de l'électrode cathodique de la pile de type
PEM mais cette fois en étudiant des configurations de la cathode en utilisant des
distributions de platine à structure multicouche. La technique de pulvérisation sous vide
sera utilisée pour cette fin. À notre connaissance, une telle configuration de l'électrode
cathodique n'a pas été étudiée auparavant. Un modèle mathématique sera également
développé et résolu avec le logiciel de calcul commercial, Comsol Multiphysics 3.5a afin
de décrire les différents phénomènes de transfert ayant lieu · dans les différentes
configurations conçus.
8
Références du chapitre 1
1. Djilali, N. and P.C. Sui, Transport phenomena in fuel ceUs: from microscale to macroscale. International Journal of Computational Fluid Dynamics, 2008.22(1): p. 115-133.
2. Song, D., et al., Numerical optimization study of the catalyst layer of PEM fuel ceU cathode. Journal of Power Sources, 2004.126(1-2): p. 104-111.
3. Madhusudana Rao, Rand R Rengaswamy, Optimization Study of an Agglomerate Model for Platinum Reduction and Performance in PEM Fuel CeU Cathode. Chemical Engineering Research and Design, 2006.84(10): p. 952-964.
4. Secanell, M., et al., Numerical optimization of proton exchange membrane fuel ceU cathodes. Electrochimica Acta, 2007. 52(7): p. 2668-2682.
5. Secanell, M., et al., Multi-variable optimization of PEMFC cathodes using an agglomerate model. Electrochimica Acta, 2007. 52(22): p. 6318-6337.
6. Zhang, Z., et al., Optimizing the Performance of a Single PEM Fuel CeU. Journal of Fuel Cell Science and Technology, 2008. 5(3): p. 031007-9.
7. Wilson, M.S. and S. Gottesfeld, High Performance Catalyzed Membranes of Ultra-low Pt Loadings for Polymer Electrolyte Fuel CeUs. Journal of The Electrochemical Society, 1992. 139(2): p. L28-L30.
8. M.S. Wilson, lA.V.a.S.G., High Performance Catalyzed Membranes of Ultra-low Pt Loadings for Polymer Electrolyte Fuel CeUs. Electrochim. Acta, 1995(40): p. 355.
9. Kumar, G.S., M. Raja, and S. Parthasarathy, High performance electrodes with very low platinum loading for polymer electrolyte fuel ceUs. Electrochimica Acta, 1995.40(3): p. 285-290.
10. Su, H.-N., et al., High performance membrane electrode assembly with ultra-low platinum loading prepared by a novel multi catalyst layer technique. International Journal of Hydrogen Energy, 2010. 35(19): p. 10430-10436.
Il. Hirano, S., 1 Kim, and S. Srinivasan, High performance proton ' exchange membrane fuel ceUs with sputter-deposited Pt layer electrodes. Electrochimica Acta, 1997. 42(10): p. 1587-1593.
12. Wilson, M.S., lA. Valerio, and S. Gottesfeld, Low platinum loading electrodes for polymer electrolyte fuel ceUs fabricated using thermoplastic ionomers. Electrochimica Acta, 1995. 40(3): p. 355-363.
13. Yu, X. and S. Ye, Recent advances in activity and durability enhancement of PtlC catalytic cathode in PEMFC: Part J. Physico-chemical and electronic interaction between Pt and carbon support, and activity enhancement of PtlC catalyst. Journal of Power Sources, 2007.172(1): p. 133-144.
14. Ramasamy, RP., FUEL CELLS - PROTON-EXCHANGE MEMBRANE FUEL CELLS 1 Membrane-Electrode Assemblies, in Encyclopedia of Electrochemical Power Sources, xOOFc and G. rgen, Editors. 2009, Elsevier: Amsterdam. p. 787-805.
15. Litster, S. and G. McLean, PEM fuel ceU electrodes. Journal of Power Sources, 2004. 130(1-2): p. 61-76.

9
16. Brouzgou, A., S.Q. Song, and P. Tsiakaras, Law and non-platinum electrocatalysts for PEMFCs: Current status, challenges and prospects. Applied Catalysis B: Environrnental, 2012.127(0): p. 371-388.

, 2. Etude théorique
12
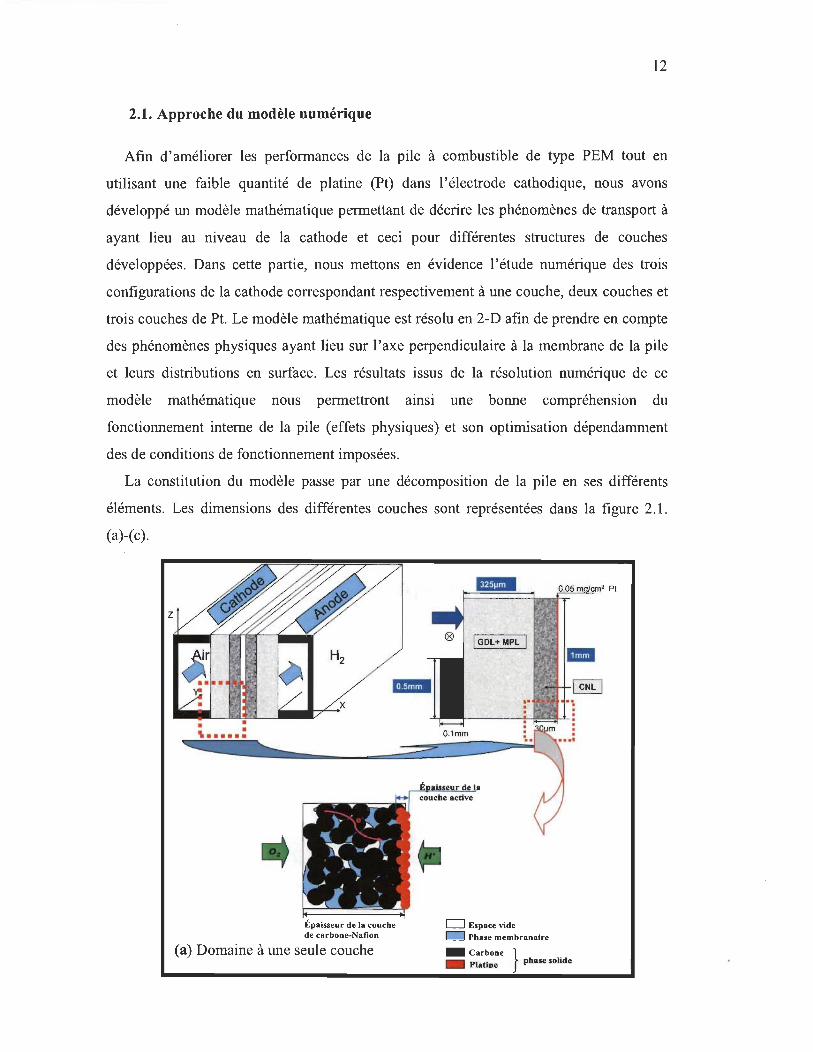
2.1. Approche du modèle numérique
Afin d'améliorer les performances de la pile à combustible de type PEM tout en
utilisant une faible quantité de platine (pt) dans l'électrode cathodique, nous avons
développé un modèle mathématique permettant de décrire les phénomènes de transport à
ayant lieu au niveau de la cathode et ceci pour différentes structures de couches
développées. Dans cette partie, nous mettons en évidence l'étude numérique des trois
configurations de la cathode correspondant respectivement à une couche, deux couches et
trois couches de Pt. Le modèle mathématique est résolu en 2-D afin de prendre en compte
des phénomènes physiques ayant lieu sur l'axe perpendiculaire à la membrane de la pile
et leurs distributions en surface. Les résultats issus de la résolution numérique de ce
modèle mathématique nous permettront ainsi une bonne compréhension du
fonctionnement interne de la pile (effets physiques) et son optimisation dépendamment
des de conditions de fonctionnement imposées.
La constitution du modèle passe par une décomposition de la pile en ses différents
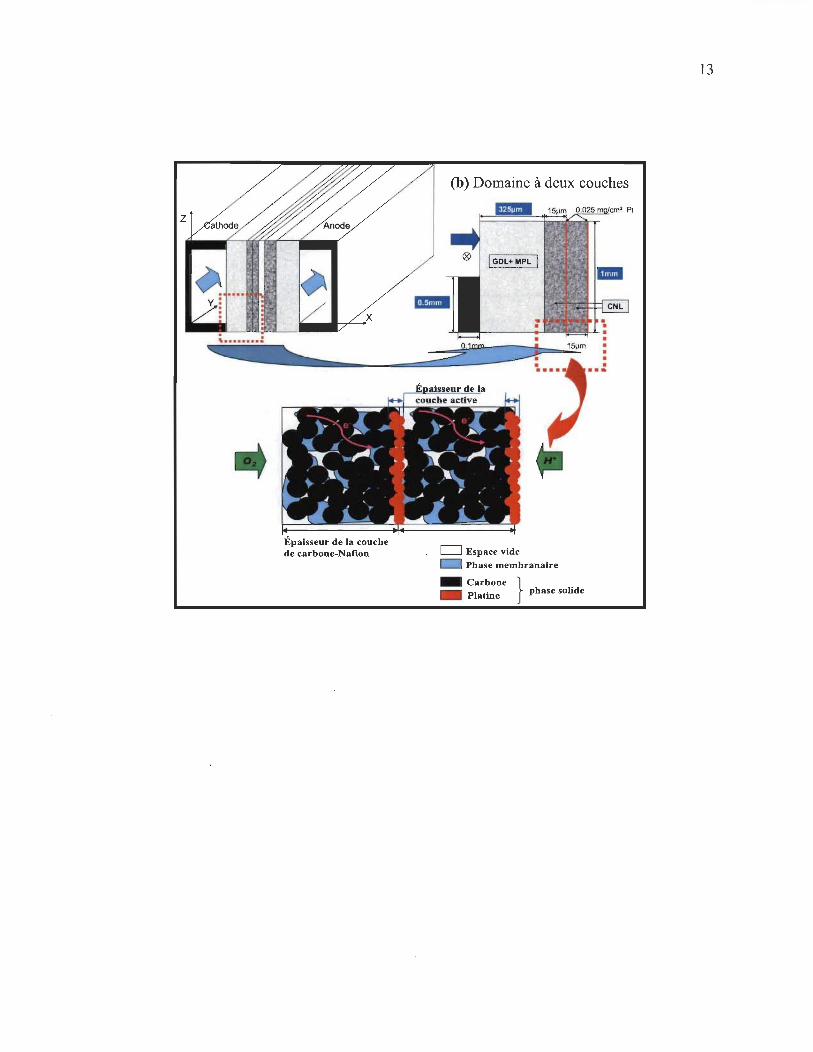
éléments. Les dimensions des différentes couches sont représentées dans la figure 2.1.
(a)-(c).
tpalsseur de la couche de carbone-Nafion
(a) Domaine à une seule couche
PI
D Espace vide D Phase membranaire
_ carbone} _ Platine phase solide
Épaisseur de la couche de carbone-Naflon
(b) Domaine à deux couches
o Espace vide o Phase membranaire
_ carbone} _ Platine phase solide
13
Épaisseur de la couche de carbone-Nafion
(c) Domaine à deux couches
--~~~~~.':. · · · · ..... ~
D Espace vide D Phase membranaire
_ Carbone _ Platine phase solide
14
Figure 2.1. Domaines de modélisation (a) une seule couche, (b) deux couches et (c) trois
couches.
Le domaine de modélisation à une couche est composé d'une couche de diffusion des
gaz (GDL), d'une couche microporeuse (MPL) et d'une couche de carbone-Nafion (CN)
contenant du platine à sa surface. Les domaines de modélisation de deux et trois couches
sont composés des mêmes éléments précédents mais contiennent respectivement deux
couches et trois couches alternées de CN et de platine, comme l'explique la figure 2.1.
(a)-(c)). La différence entre ces trois domaines étant le nombre de couches de CN+Pt.
2.2. Hypothèses
La modélisation des phénomènes physiques ayant lieu au rnveau de l'électrode
cathodique nécessite la connaissance d'un très grand nombre de paramètres tels que les
propriétés Odes matériaux utilisés et des gaz entrants dans la pile, ainsi que leurs variations
en fonction du temps et de l'espace. Par conséquent, un certain nombre d'hypothèses doit
15
être adopté pour résoudre le 'modèle mathématique dans un temps raisonnable sans trop
perdre d'information sur les phénomènes physiques ayant lieu au cours du
fonctionnement de la pile. Ainsi, le modèle mathématique sera résolu en supposant que:
a. les phénomènes de transfert ont lieu dans un régime stationnaire,
b. les fluides sont incompressibles et leurs propriétés physiques sont constantes
(viscosité, masse volumique, tension de surface, etc),
c. les phénomènes thermiques sont négligeables à cause des dimensions très petites.
d. le modèle d'interface réactionnelle peut être utilisé puisque les couches de
réaction sont extrêmement minces. Nous supposons une continuité à l'interface
entre chaque domaine,
e. Le mélange de gaz est supposé idéal.
2.3. Couches de diffusion
2.3.1. Description de la couche de diffusion
Considérée comme un milieu poreux, la couche de diffusion dans la PEMFC est la
zone intermédiaire entre le canal et la couche de réaction. D'une épaisseur comprise dans
la gamme de 100 à 500 /lm, sa structure fibreuse est généralement hydrophobe pour
faciliter l'évacuation de l'eau liquide produite [1], [2]. Elle assure la diffusion des réactifs
vers les sites de réaction, le transport de l'eau soit vers la membrane pour son hydratation,
soit des sites de réaction vers le canal pour réduire les phénomènes de noy~ge. En outre,
elle permet également l'évacuation de la chaleur, produite vers le milieu extérieur et le
déplacement des électrons vers le collecteur ou vers les sites de réaction. Sa
caractérisation physique a fait l'objet de nombreuses études afin d'optimiser ses
propriétés physiques pour une bonne circulation des gaz, de l'eau liquide, des électrons et
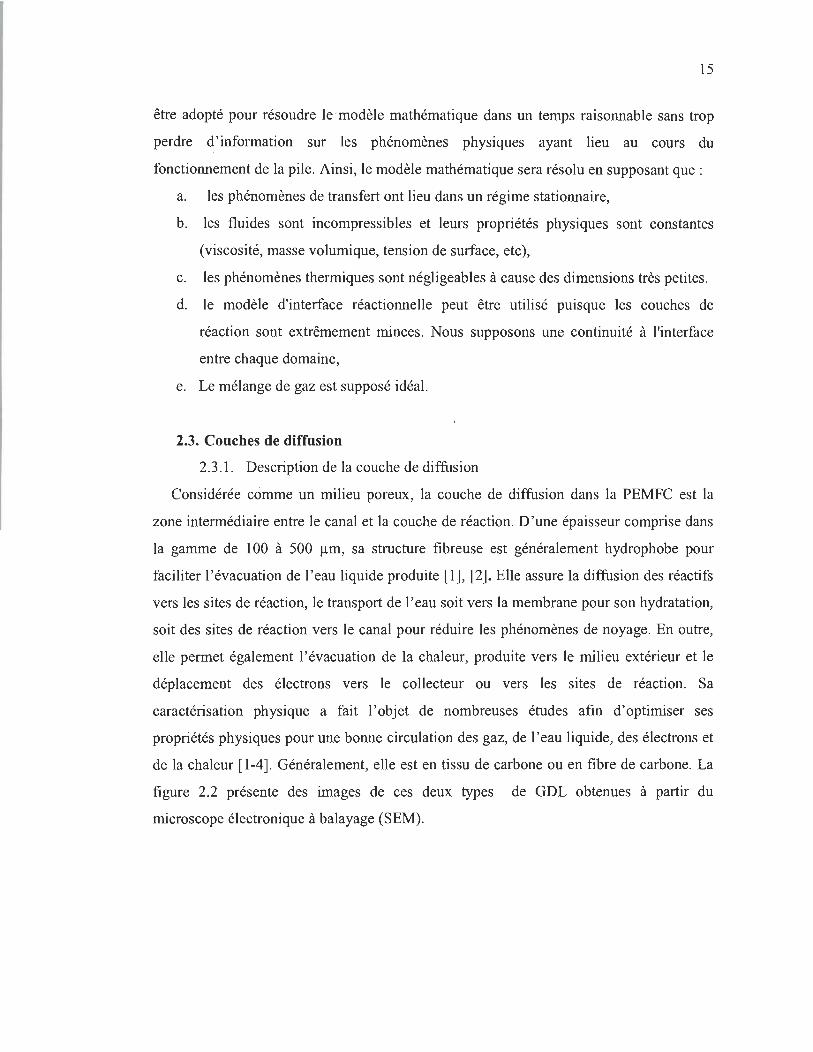
de la chaleur [1-4]. Généralement, elle est en tissu de carbone ou en fibre de carbone. La
figure 2.2 présente des images de ces deux types de GDL obtenues à partir du
microscope électronique à balayage (SEM).
16
(a) SEM ofToray Paper GDL (b) SEM of ClI!'bon Cloth GDL
Figure 2.2. Images de deux types de GDL obtenues à partir du microscope électronique
à balayage (SEM) (a) Papier de carbone et (b) tissu de carbone [1].
Dans notre étude, nous avons considéré la couche de diffusion (GDL) comme un
milieu hydrophobe. Ses caractéristiques géométriques sont représentées · dans la figure
2.1. (a)-(c).
2.3.2. Description de la MPL
La MPL est une structure poreuse composée essentiellement de poudre noire de
carbone et d'un agent hydrophobique, généralement du polytétrafluoroéthylene (PTFE).
Elle a pour rôle d'accroître l'utilisation du catalyseur en facilitant l'évacuation de l'eau
produite à la cathode et à l'anode afin d'éviter au mieux les phénomènes de noyage. En
outre, elle permet de réduire la résistance de contact entre la couche de catalyseur et le
substrat macroporeux de carbone par formation d'une couche plane et uniforme qui n'est
pas perméable aux particules du catalyseur. En somme, la MPL améliore la gestion de
l'eau dans l'assemblage membrane-électrodes (MEA) et donc la performance globale de
la PEMFC. Dans le cadre de notre étude, la MPL a une dimension de 25 /lm pour
respecter la caractéristique expérimentale (Voir figure 2.1. (a)-(c)).
2.3.3 . Description de la couche active
Lieu de réaction d'oxydoréduction, la couche active dans cette nouvelle électrode a
une structure constituée de 1'alternance de couches CN+Pt pour la configuration à une
seule couche, CN+Pt+CN+Pt pour celle à deux couches et finalement
CN+Pt+CN+Pt+CN+Pt pour celle à trois couches comme le montre la figure 2.3, afin de
lui conférer une grande surface active et une bonne diffusion des espèce. Le platine de la

17
couche active n'est pas aggloméré au carbone. La couche garde les mêmes fonctions que
celles des couches actives conventionnelles : transport des réactifs, des protons, des
électrons, de l'eau et de la chaleur. Les caractéristiques géométriques des trois couches
actives considérées dans cette étude sont données dans la figure 2.l. (a)-(c). La couche
active conventionnelle est une couche composite complexe de l'ordre de 10 !J.m
d'épaisseur, composée généralement d'ionomères et de particules de platine fixées sur du
carbone formant des structures d'agglomérats nanoporeux entourés de micropores (1-1
!J.m) [4]. Les figures 2.3 et 2.4 ci-dessous nous montre des images comparatives des deux
types de couches actives.
z
,1
Mc:mbrane L"l'er
Platinum Nanopan ic les
Hydrated lonomer
Single agglomcratc
Figure 2.3. Schéma de la couche catalytique d'une MEA standard et des aggloméras
sphériques [4].
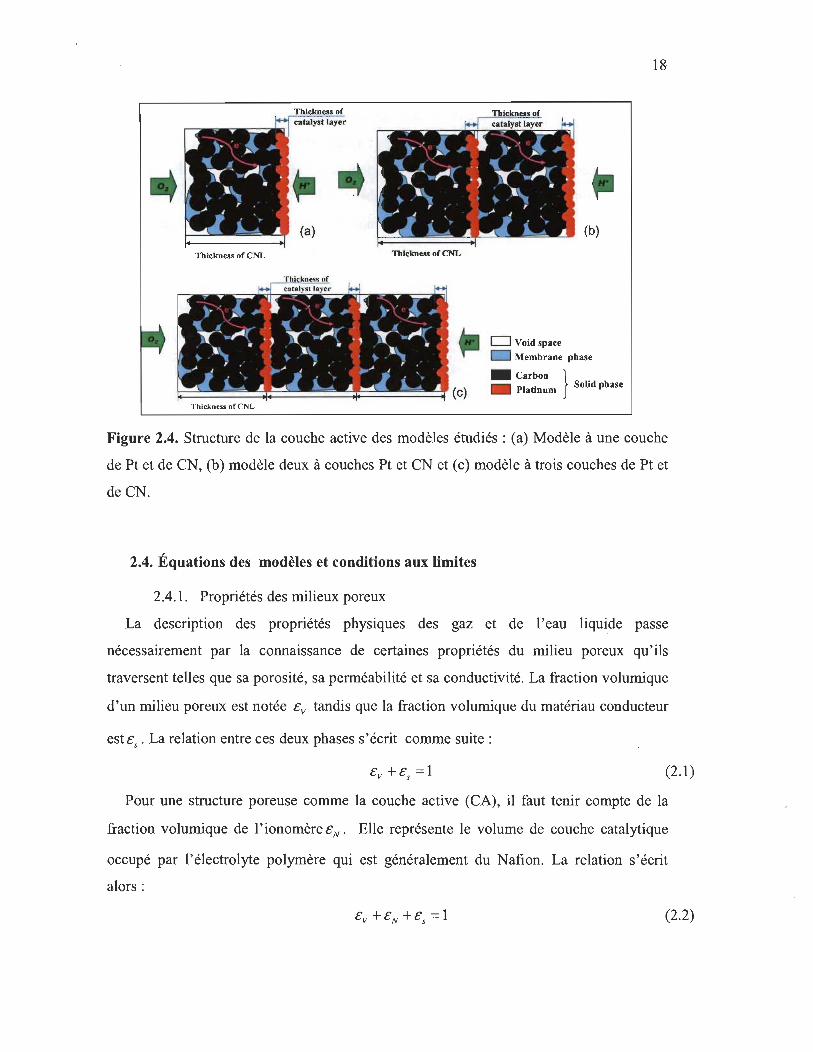
18
(b)
Tbickness of CNL Tbickness of CNL
D Voidspace
D Membrane phase
_ Carbon } _ Platinum SoUd phase
Figure 2.4. Structure de la couche active des modèles étudiés: (a) Modèle à une couche
de Pt et de CN, (b) modèle deux à couches Pt et CN et (c) modèle à trois couches de Pt et
deCN.
2.4. Équations des modèles et conditions aux limites
2.4.1. Propriétés des milieux poreux .
La description des propriétés physiques des gaz et de l'eau liquide passe
nécessairement par la connaissance de certaines propriétés du milieu poreux qu'ils
traversent telles que sa porosité, sa perméabilité et sa conductivité. La fraction volumique
d'un milieu poreux est notée Ev tandis que la fraction volumique du matériau conducteur
estes . La relation entre ces deux phases s'écrit comme suite:
(2.1)
Pour une structure poreuse comme la couche active (CA), il faut tenir compte de la
fraction volumique de l'ionomèreEN • Elle représente le volume de couche catalytique
occupé par l'électrolyte polymère qui est généralement du Nafion. La relation s'écrit
alors :
(2.2)

19
Lorsque le volume admissible au gaz est réduit à cause de la présence de l'eau dans le
milieu poreux, le volume des gaz diminue d'un facteur 1- S où S représente la
saturation et caractérise la portion d'eau présente dans les pores. Sa valeur est comprise
entre 0 et 1. La porosité dite effective du gaz noté e~ff s'écrit:
(2.3)
La perméabilité absolue Ko (m2) du milieu poreux caractérise la capacité d'un fluide à
le traverser. La relation empirique de Kozeny-Carman est utilisée pour estimer la
perméabilité absolue Ko [5];
(2.4)
où kK est la constante de Kozeny. Pour des couches fibreuses (0 .5<e<0.7), cette
constante prend la valeur de 6. En présence de l'eau, elle prend l'appellation de
perméabilité effective et devient K;~ (m2): Elle est généralement liée à la perméabilité
relative des phases liquide et gazeuse, à savoir, Krl et Krg conduisant à la formulation
suivante [6-8]:
(2.5)
Les milieux poreux ont en général une structure qui entrave la diffusion des espèces
vers les sites de réaction. D'autre part, la présence de l'eau liquide produite par la
condensation de vapeur d'eau saturante ou par la réaction chimique réduit
considérablement le volume des pores nécessaire à la diffusion des espèces et modifie le
chemin de diffusion. Pour tenir compte de ces blocages, le coefficient de diffusion est
donc modifié et prend le nom de coefficient de diffusion effective ou efficace noté Di:! . Selon la morphologie du milieu et la nature de l'espèce, elle s'écrit sous différentes
formulations dont l'expression générale est :
(2.6)
20
Plusieurs corrélations basées sur la théorie du milieu effective existent dans la
littérature. Pour des paquets de particules sphériques, le coefficient de diffusion effectif
est donné sous la forme suivante [6]:
(2.7)
La saturation liquide est généralement modélisée par la fonction normalisée g (s) :
g(s)=(1-st (2.8)
Si la structure du pore ne change pas avec la saturation en eau, m = 1.5 [6].
D 'une manière générale, le coefficient de diffusion binaire noté Dij (m2/s) dans la
théorie cinétique des gaz s'exprime de la manière suivante:
[ J
b ~ = T l3' T T ?{2 _1_ _1_ 2!
Dij a M (Pei PCj ) ( Ci Cj ) (M. + MJ C I CJ 1 J P
(2.9)
L ' indice c représente la valeur critique de la composante correspondante et les
paramètres a et b sont les constantes empiriques pour le mélange considéré. Comme
nous le constatons, le coefficient de diffusion binaire est proportionnel à la température
T (K) élevé à une puissance b et inversement proportionnel à la pression P (pas) et à la
moyenne harmonique de la masse molaire moléculaire des espèces i et j. Lorsque le
nombre des espèces est supérieur à deux, le coefficient de diffusion devient alors un
coefficient de diffusion dans un mélange. La notation appropriée pour le coefficient de
diffusion d 'une espèce i dans un mélange considéré est Dim ' Sa formulation
mathématique s'écrit alors pour N espèces:
( J- I
N X D. =(1 -x. ) "-j J,m l L..J
j=I;Il'i Di,j (2.10)
Dans cette expression la diffusivité D. (m2/s) de l'espèce i dans le mélange m est reliée I ,m
aux fractions molaires ( x. et x .) des espèces et au coefficient de diffusion binaire D .. . 1 J 1 J
L 'un des paramètres importants d'une pile est La surface active effective A;ff
(cm2/cm3). Elle représente la surface active totale disponible pour la réaction de réduction
de l'oxygène par unité de volume de couche catalytique. Ce paramètre est relié à la
21
densité du platine, mpt , à l'épaisseur de la couche active, L et à la proportion de platine
dans le carbone. Pour tenir compte de cette dépendance, sa formulation s'écrit [9]:
A;ff = Ao mt (2.11)
où Ao (cm2/g) est l'aire de la surface totale par unité de masse de particule du catalyseur.
Cette valeur dépend de la taille des particules de platine et de la teneur des particules de
platine présentes dans la couche catalytique. Son expression en terme de contenu de
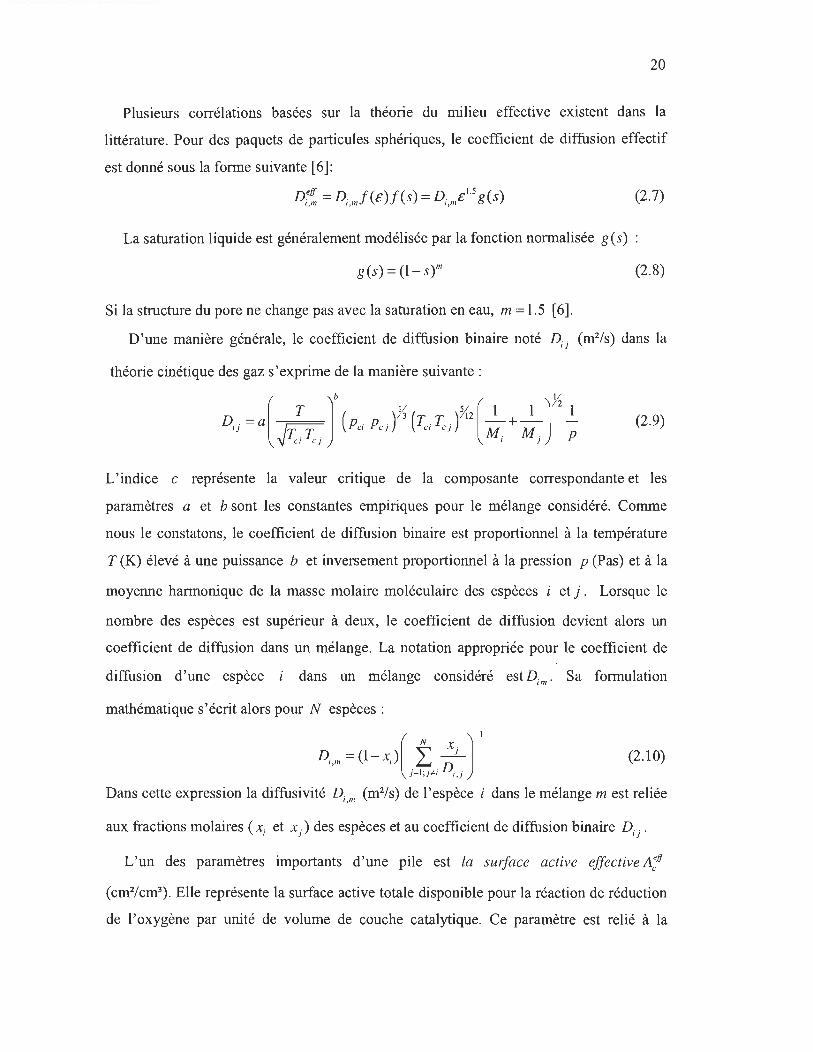
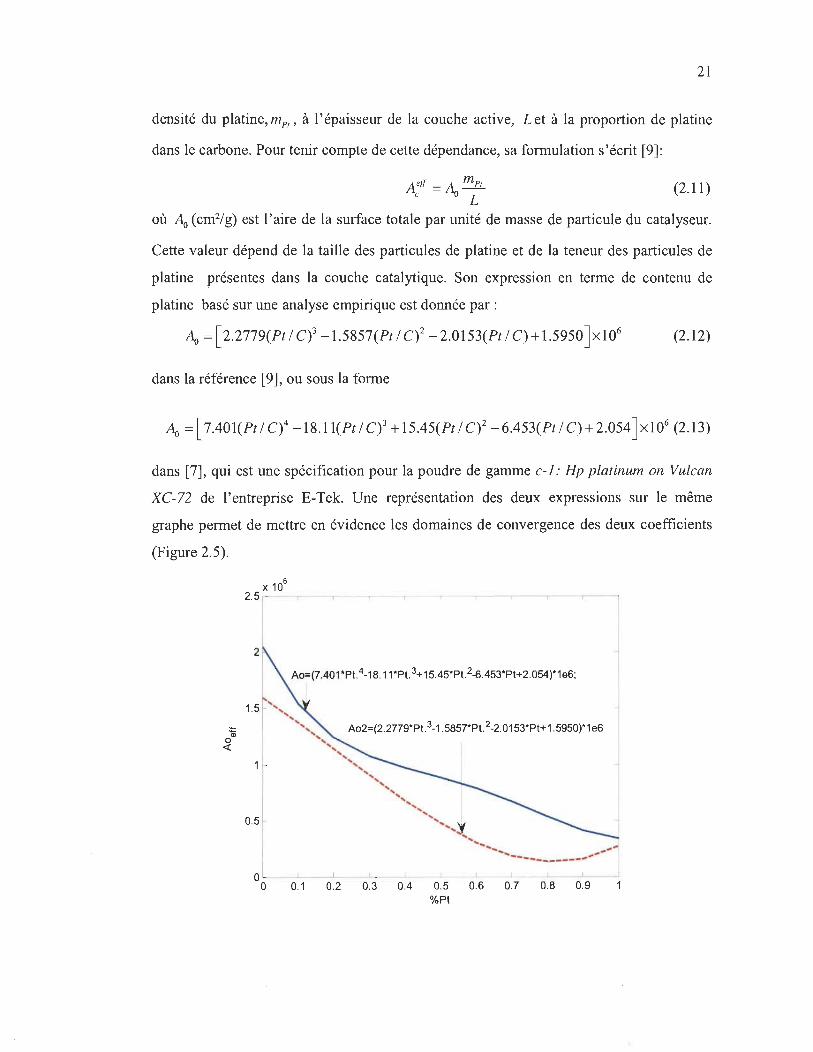
platine basé sur une analyse empirique est donnée par:
Ao = [2.2779(Pt / C)3 -1.5857(Pt / C)2 - 2.0153(Pt / C) + 1.5950 ]X106 (2.12)
dans la référence [9], ou sous la forme
Ao = [7.401(Pt / C)4 -18.11(Pt / C)3 + 15.45(Pt / C)2 - 6.453(Pt / C) + 2.054 ]X106 (2.13)
dans [7], qui est une spécification pour la poudre de gamme c-l,' Hp p/atinum on Vu/can
XC-72 de l'entreprise E-Tek. Une représentation des deux expressions sur le même
graphe permet de mettre en évidence les domaines de convergence des deux coefficients
(Figure 2.5).
Ao=(7.401*Pt.4-18.11*Pt. 3+15.45*Pt.2-{l.453*Pt+2.054)*1e6;
1
Ao2=(2.2779*Pt. 3-1.5857*Pt. 2-2.0153*Pt+1 .5950)*1e6
0.5
OL-__ L-__ L-__ ~ __ ~ __ ~ __ ~ __ ~ __ -L __ -L __ ~
o 0.1 0.2 0.3 0.4 0.5 0.6 0.7 0.8 0.9 0/0 Pt
X 107
2.5 ,---,----,---.----,---,----,---,----,---,----,
2 Ao=(7.401*Pt.4 ·18.11*Pt. 3+15.45*Pt. 2-6.453*Pt+2.054)*1 e6;
~ 1.5
Ao2= (2. 2779*Pt. 3·1.5857*Pt. 2.2.0153*Pt+1 .5950)*1e6
0.5
0.2 0.4 0.6 0.8 1.2 1.4 1.6 1.8 2 %Pt
X 1012
6 .-----~-------.------,-------.------,------_.
5
4 Ao=(7.401*Pt.4.18.11*Pt. 3+ 15.45*Pt. 2-6.453*Pt+2.054)*1e6;
~ o'f.. 3 «
2 Ao2=(2.2779*Pt.3.1.5857*Pt.2.2.0153*Pt+1 .5950)*1e6
5 10 15 %Pt
20
Figure 2.5. Courbes comparatives des deux formulations Ao .
25 30
22
La diffusion des espèces gazeuses dans le milieu poreux, la réaction électrochimique
entre l'oxygène et l'hydrogène dans la couche catalytique cathodique, la migration des
protons de l'anode à la cathode et la condensation de la vapeur d'eau dans le milieu
23
poreux sont les processus majeurs qui engendrent le mouvement d'eau liquide à l'intérieur
des pores. Lorsque celle-ci est présente dans le milieu poreux, son transport dans
l'électrode poreuse est induit par la force capillaire et la force de cisaillement de
l'écoulement des gaz. La distribution de l'eau dans la couche poreuse de diffusion
capillaire est contrôlée par la condensation (micro gouttelette) et par l'écoulement
capillaire de la phase liquide (macro gouttelette) [5]. Les processus de condensation et
d'évaporation sont approximés par un terme source dans l'équation de conservation de
l'eau liquide (Voir équation 2.42). Celle engendrée par la pression capillaire qui
caractérise l'interaction entre le gaz et le liquide est reliée à la vitesse par son gradient
comme dans les écoulements ordinaire. La· fonction de J-Leverett est généralement
utilisée pour relier la pression capillaire à la saturation.
Pour un milieu hydrophobe (Oc > 90° ), elle s'écrit:
Pour un milieu hydrophile (Oc < 90° ), nous avons:
Pc = (iCOS~~2 [1.417 (1- S) - 2.120(1- S)2 + 1.263(1- S)3 ] (K / e)
(2.14)
(2.15)
où (i (Nm- I) est la tension de surface de l'eau et Oc est l'angle de contact d'une goutte
d'eau avec la paroi du pore. L'angle de contact rend compte de l'aptitude d'un liquide à
s'étaler sur une surface par mouillabilité. Nous pouvons ainsi déduire le caractère
hydrophile (Oc >90) ou hydrophobe (Oc <90) d'une surface. Un plus grand angle de
contact est préféré pour un transport plus efficace de l'eau liquide dans la couche de
diffusion [5].
Les paramètres présentés dans ce paragraphe ne seront plus illustrés pour les autres
milieux de diffusion puisque la formulation reste la même. Une notation indicielle
permettra de les distinguer dans les différents milieux de diffusion considérés: gdL pour
la couche de diffusion des gaz, MPL pour <<Micro porous layer» et eN pour le milieu de
diffusion (Carbone + Nafion).

2.4.2. Équations des modèles et conditions aux limites
La réaction chimique qui a lieu à la cathode est:
réduction + 1 - HO hl 2H + "202 + 2e ~ 2 + c a eur
oxydation
24
(2.16)
La tension à vide traduisant la transformation de toute l'énergie libre standard i1Go en
énergie électrique est donnée par l'équation de Nernst:
EO =_ i1Go rev nF (2.17)
où n est le nombre d'électrons échangés (n=2 dans la réaction concernée) et F représente
le nombre de Faraday. Lorsqu'un courant électrique est appliqué, la réaction
d'oxydoréduction s'éloigne alors du point d'équilibre et la tension aux bornes ne
correspond plus à la tension à vide. La dépendance de la tension réversible avec la
pression à température constante est :
E = Eo + i1S(T_TO)+ RT In(PH2 (P02Y12
] rev rev 2F 2F (p0)3/2 (2.18)
Nous pouvons exprimer les pressions partielles de l'hydrogène et de l'oxygène en
fonction de la pression totale et de leurs fractions molaires tels que PH = xH . P et 2 2
P02 = X02 .p . L'équation (2.18) devient alors:
(2.19)
C'est cette forme qui a été retenue pour le modèle car elle permet d'obtenir directement la
contribution des espèces.
Pour la pile de type PEM, un rapide regard sur la courbe de polarisation montre que la
chute de tension est essentiellement due aux pertes par activation, ohmique et à la
limitation de transfert de masse. La perte par activation est une propriété cinétique et elle
dépend de la distribution du platine/carbone et son activité catalytique. Les pertes
ohmiques sont directement liées à la conductivité protonique de la membrane et la
conductivité électronique du collecteur de courant. Les limitations de transfert de masse
sont causées par l'incapacité des réactifs à suivre la demande imposée par la réaction
25
électrochimique. TI est admis que la cathode d'une PEMFC est l'élément limitant la
performance en raison de la cinétique lente de la réaction de réduction de l'oxygène et
aux limitations de transfert de masse causées par l'eau liquide générée par cette réaction
ainsi que le flux électro-osmotique et les phénomènes de condensation.
2.4.2.1. Densité de courant
Lorsque l'électrode est soumise à un courant, l'équilibre est rompu. La différence de
potentiel entre la tension hors équilibre et la tension d'équilibre d'une électrode est
appelée surtension d'activation
(2.20)
Dans cette expression, <PO est le potentiel à vide des réactions et <P le potentiel hors
d'équilibre. La surtension '1 est négative à cause de la nature de la réaction. Dans la
PEMFC, l'expression de la surtension cathodique est donnée par la formulation suivante:
(2.21)
où ct> elee et ct> ion sont respectivement les potentiels de la phase solide et de la phase
membranaire (ou respectivement les potentiels électriques dans les conducteurs
électriques et ioniques). Le courant cathodique s'écrit alors selon l'équation de Butler
Volmer comme suit:
Dans l'équations 2.22, A lo, C Hz ' c~:if, a = 1- fJ ,fJ , F et 1] représentent
respectivement la surface active, la densité de courant d'échange, la concentration
d'oxygène dissous dans le Nafion, le coefficient de transfert anodique, le coefficient de
transfert cathodique, la constante de Faraday et la surtension. Les indices eff ,a, ref et c
signifient respectivement efficace, anode, référence et cathode. La concentration
d'oxygène dissous dans le Nafion et participant à la réaction à la cathode est obtenue par
la loi d'Henry :
C N(if = xOz P Oz H
° z.N
(2.23)
où
26
Ho N =RT ·exp(14.l-666/T) 2 ,
(2.24)
La densité de courant d'échange de référence cathodique i~~~ est donnée par [6] :
·ref = 10(3.507 - 40011T) lo,c (2.25)
Pour des surtensions cathodiques élevées l11cl» RT /(f3F) et des surtensions
anodiques très faibles l1a « RT /(aF) , un développement limité au premier ordre de l'
équation 2.22 permet d'aboutir à l'approximation dite de Tafel :
J. = (1- S)Aeff ref (C0 2 J exp ( -L F·l1 )
Ci c o,c C ref RT c O2
(2.26)
Cette dernière formulation est celle que nous allons utiliser dans nos modèles. Le sous
indice i correspond à la couche considérée. li découle de cette formulation l'ensemble
des équations qui caractérisent les trois modèles : l'équation de conservation des espèces,
l'équation de Darcy, l'équation de la saturation de l'eau liquide et l'équation de
conservation de la charge.
2.4.2.2. L'équation de conservation des espèces
L' écoulement dans les couches poreuses est caractérisé par la prise en compte des
propriétés physiques du milieu poreux traversé (la porosité, la perméabilité, la
conductivité etc .. ). Le mouvement des espèces est décrit par deux écoulements de phase:
la phase liquide et la phase gazeuse. L ' étude du transport des gaz et des phases liquides
est faite séparément. À l' état stationnaire le transport d'un mélange de gaz multiples i (i
correspond à l'une des espèces 0 2, N2, ou H20) à travers un milieu poreux est
généralement décrit par les équations de Maxwell-Stefan [10-12].
27
OÙ O)i est la fraction massique des espèces i, Di:~ est le coefficient de diffusion effectif
(m2/s), p est la densité du fluide (kg/m\ p la pression (pa), Ri représente le terme source
pour l'espèce i (kg/m3·s) et Xj est la fraction molaire de l'espèce j. La masse molaire
moyenne est donnée par:
k
M=" x .M L..J J J (2.28)
j =1
où M j est la masse molaire de l'espèce j. Les termes sources des espèces gazeuses
s'écrivent:
M Ri RH20( g ) =-(1 - jJ)(2+4a) 4;0 "\\ (2.29)
RN2
=0
2.4.2.3. Équation de Darcy
Le domaine de modélisation étant considéré comme un milie!l poreux homogène et
isotrope parcouru par des écoulements à faible vitesse, l'équation de conservation de la
quantité de mouvement de la phase gazeuse et de la phase liquide se réduit à la loi de
Darcy:
u = - Kokrg Vp J-L
g g
(2.30)
(2.31)
où Ko est la perméabilité absolue, krg = (1 :- S)3 et krt = S3 sont respectivement les
perméabilités relatives de la phase gazeuse et de la phase liquide, J-Lg et J-Lw sont les
viscosités dynamiques de la phase gazeuse et de la phase liquide et p g et Pt représentent
28
les pressions partielles de la phase gazeuse et de la phase liquide. La viscosité dynamique
de la phase liquide est fonction de la température et elle est introduite par l'équation:
JiIV = O.6612(T - 229r1.562 (2.32)
2.4.2.4. Équation de la saturation
Notre surface étant hydrophobe, la vitesse d'écoulement convective VIV de l'eau se
déduit à partir de la loi de Darcy comme suit :
(2.33)
où JiIV est la viscosité de l'eau liquide dans le milieux poreux et Pc la pression capillaire.
L'équation précédente s'écrit alors en coordonnées vectorielles:
v =_ KOkrl Vp =_ KOkrl (apc as + apc as + apc as ] IV JiIV c JiIV as ax as ay as az (2.34)
Le flux massique NIV
de l'eau liquide est fonction de la pression capillaire et de la
saturation. Il s'écrit [13]:
( K J K sn N =p v =p __ 0 Vp =_PIV wO Vp
w ww w c C
JiIV Jiw (2.35)
En régime stationnaire, l'équation du flux d'eau massique local permettant d'obtenir la
distribution de la saturation du liquide s'en déduit aisément comme suit:
(2.36)
où Mw et RIV sont respectivement la masse molaire moléculaire de l'eau liquide et le
taux de transfert interfacique de l'eau (entre l'eau liquide et la vapeur d'eau). Le taux de
transfert interfacique utilisé comme terme source de l'équation 2.36 permet de prendre en
compte l'influence induite par les phénomènes de condensation ou d'évaporation.
L'écriture explicite est:

29
R = k .e(1-S) y IV - IV Ô- k Pw eS(psm _P) (l-A"I [ P PSa/ ] [ ] w C IV RT e M IV W V)
IV
(2.37)
ou sous la fonne
(2.38)
avec
p _psar r =k e(1-S) y IV w CCIV RT
r =k Pw es(psar -P) e e M W W
IV
(2.39)
Dans l'expression des équations (2.37) - (2.39), kc et ke sont respectivement les
constantes de vitesse de condensation et d'évaporation, YIV '
P et p sar sont w w
respectivement les fractions molaires des réactifs ou des produits, les pressions partielles
et les pressions de saturation de la vapeur d'eau et Ô est le paramètre de la fonction de
commutation qui détermine s'il y a condensation (P.v ~ p':ar et Ô = 1) ou évaporation dans
le milieu poreux ( Pw < p:at et Ô = 0 ).
2.4.2.5. Équation de conservation de charge
Les charges sont entrainées des régions où elles sont produites vers les régions où elles
sont consommées. L'équation de conservation de charge pennet d'établir la relation entre
le transfert de masse et le transfert de charge. Dans la pile de type PEM, nous distinguons
principalement la circulation de deux types de charges : les électrons et les protons.
Comme dans la plupart des piles à combustible, le transport des ions est de loin plus
difficile que celles des électrons à cause des résistances aux transports, entraînant ainsi
des chutes ohmiques considérables. Afin de réduire ces pertes, les recherches ont prouvé
la nécessité de réduire l'épaisseur des électrolytes et utilisation de matériaux à hautes
conductivités (ionique, électrique). Le déplacement des ions et des protons est étroitement
lié à la présence d'une force qui induit leur mouvement. Ceci s'explique dans la PEMFC
par l'accumulation des protons et des électrons à l'anode et leurs consommations à la
cathode suite aux réactions d'oxydation et de réduction qui ont lieu respectivement aux
deux électrodes. L'accumulation! l'appauvrissement des électrons aux deux électrodes
30
crée un gradient de potentiel qui entraîne le déplacement des électrons de l'anode à la
cathode. Dans l'électrolyte, l'accumulation / appauvrissement des protons crée à la fois
un gradient de potentiel et un gradient de concentration. Ces gradients couplés entraînent
le transport des protons de l'anode vers la cathode. Tous obéissent à la formulation
générale:
(2.40) ·k
où J i représente le flux de l'espècei, Fk est la force agissant sur l'espèce i et M ik est le
coefficient de couplage entre la force et le flux.
L'établissement des équations de conservation du proton et de l'électron passe par la
connaissance du flux molaire par unité de surface et par unité de temps. Ce flux molaire
que nous noterons J(mol / cm2 . s) est converti en flux de charge j(C / cm2. s) qui exprime
la quantité de charge qui s'écoule par unité de surface et par unité de temps c'est-à-dire la
densité de courant j(A / cm2) .Cette loi, appelée loi de Faraday, est une loi quantitative
reliant les nombres de moles des substances oxydantes et réductrices produites ou
consommées à une électrode à la charge électrique transférée à travers la couche active où
l'interface électrode-solution. La relation liant la densité de courant au flux molaire
s'exprime comme suit:
(2.41)
où la quantité Zi F représente le facteur de conversion du flux molaire au flux de charge.
Zi représente le nombre de charge transporté et F(C / mol) est la constante de Faraday.
Afin d'étudier la distribution du courant à travers chaque composante de la pile, nous
avons recours à l'équation de conservation de charge
V·i=O (2.42)
Les charges produites (protons et électrons) proviennent des espèces initialement
neutres (molécules d'hydrogène). De ce fait, la neutralité des charges doit être conservée.
La charge totale des ions et celle des protons est donc nulle :
31
V' n ' -O . lelee + v . lion - (2.43)
V · i =-V·i =J' elee ion (2.44)
F V . [ mi V <1> ] = - F V . [ mi V <1> ] = . Zi (J'ion ion Zi (J'elee elee J (2.45)
où <1> ion et <1> elee sont respectivement les potentiels électriques dans les conducteurs
ioniques et électriques (J' mi et (J' mi ' lOn elec sont les conductivités ionique et électrique
respectives des protons et des électrons dans le milieu ~ considéré. Le couplage des
équations (2.44) et (2.45) permet d'obtenir les équations suivantes pour différentes
couches au niveau de la cathode:
{
- zi F V -[ (J';;;e V <1> elee ] + V · ielee = 0
zi F V . [ (J':~:! V<I>ion ] + V . i ion = 0
où en tenant compte des termes effectifs de la conductivité sous la forme
{
- zi F V . [ a-:Ze V <1> elee ] + V . ielee = 0
zi F V . [ (J';!,; V <1> ion ] + V . iion = 0
(2.46)
(2.47)
Les conductivités protoniques et électroniques effectives (J':!! et (J';if sont liés à la
composition du matériau (fraction volumique de la phase solide et la fraction volumique
de l'ionomère) selon la correction de Bruggeman comme suit :
{
(J'eif = a mi (Emi ) 3/2 m ln N
(J'eif = (J'mi (E mi ) 3 / 2 s s s
(2.48)
La conductivité Nafion dans les couches de carbone-Nafion est obtenue par calcul en
se basant sur la corrélation empirique développée par Springer comme:
a eN = (5.139XI0-3 Â-3.26xlO-3 )eXP(1238 ( _I __ ~)) m 303 T
(2.49)
où la teneur en eau dans le Nafion est calculé à partir de :
{
0.043+17.81 aw -39.85(aw )2+36(aw )3
Â= 14+1.4(aw -1)
16.8
(O<aw
:::;l)
(1 <aw :::; 3)
(3<aw )
L'activité de 1'eau qui quantifie l'humidité du Nafion est donné par:
où XH20
est la fraction molaire de la vapeur d'eau à l'intérieur du Nafion.
32
(2.50)
(2.51)
Le potentiel de la pile VceU est obtenu en soustrayant la surtension d'activation et les
pertes ohmiques (ROhmic • ic ) du potentiel d'équilibre E~.p:
(2.52) mem
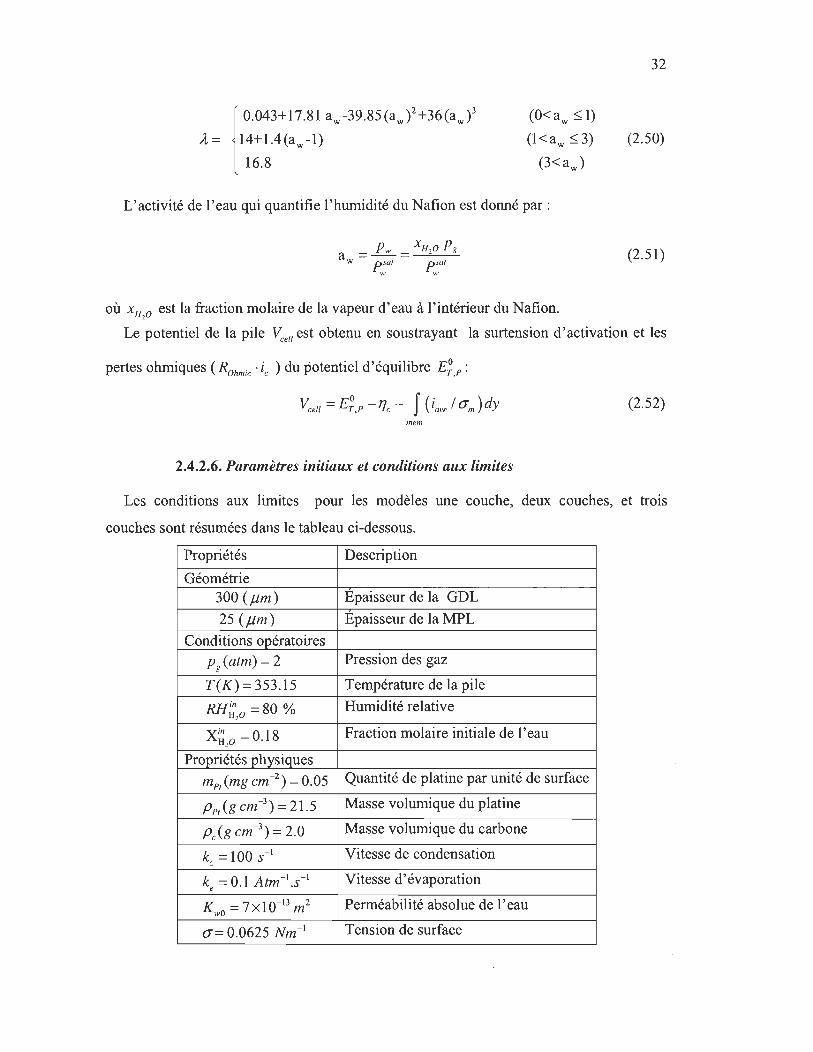
2.4.2.6. Paramètres initiaux et conditions aux limites .
Les conditions aux limites pour les modèles une couche, deux couches, et trois
couches sont résumées dans le tableau ci-dessous.
Propriétés Description
Géométrie 300 (pm) Epaisseur de la GDL
25 (pm) Epaisseur de la MPL
Conditions opératoires
Pg (atm) = 2 Pression des gaz
T(K) = 353.15 Température de la pile
RH~ o =80 % Humidité relative 2
X~20 = 0.18 Fraction molaire initiale de l'eau
Propriétés physiques
mpt(mg cm-2) = 0.05 Quantité de platine par unité de surface
PPt (g cm-3) = 21.5 Masse volumique du platine
Pc(g cm-3) = 2.0 Masse volumique du carbone
kc = 100 S - l Vitesse de condensation
ke = 0.1 Atm- l.s- l Vitesse d'évaporation
K = 7x10-13 m2 .. 0
Perméabilité absolue de l'eau
(7= 0.0625 Nm- l Tension de surface

Variables 02
H20 H2O(1)
H+
-e
33
Tableau 2.1. Paramètres de base utilisés dans la résolution du modèle
mathématique.
Canal/GDL GDLIMPL MPL/CNL CNL/CNL CNLIMEM ai" =0 21 · (l_Xin )M IMgin
0, ' H,O 0, -n. Nj{" =-n. tv:;'L -n' W;:: =-n'N:: Ra, Ra, ai" Xi" M lM in -no N:o =-n. N:7; -n. N:;; =-n' w,::o RI/,o RI/p /J,a = HP W g 1 ,
SO =0 -no N::- =-n. N::- -n'~ =-n.N:- R., R.,
- - - -no j, =-ic -n' j, =-ic
rl>sG DL = 0 (O<A<B) -n' j, =-ic -no j, =-ic -n-j, =-ic -n' j, =-ic
Tableau 2.2. Conditions aux limites pour les différentes espèces présentes au niveau des
domaines constituant l'électrode cathodique.
34
Références du chapitre 2
1. Park, S. et Popov, B.N. 2009. <<Effect of cathode GDL characteristics on mass transport in PEM fuel cells». Fuel, vol 88(11): p. 2068-2073. Nama, J.H. , Lee, K-J, Hwang, G-S, Kimb, Ch-J et Kaviany, M. 2009. «Microporous layer for water morphology control in PEMFC». International Journal of Heat and Mass Transfer, vol 52(11-12): p. 2779-2791.
3. Antolini, E. , Passos, R.R et Ticianelli, E.A. 2002. <<Effects of the carbon powder characteristics in the cathode gas diffusion layer on the performance of polymer electrolyte fuel cells». Journal of Power Sources, vol 109(2): p. 477-482.
4. Djilali, N. et P.C. Sui. 2008. «Transport phenomena in fuel cells: from microscale to macroscale». International Journal 'of Computational Fluid Dynamics, vol 22(1): p. 115-133.
5. Nam, J.H. et Kaviany, M. 2003. <<Effective diffusivity and water-saturation distribution in single- and two-Iayer PEMFC diffusion medium». International Journal of Heat and Mass Transfer, vol 46(24): p. 4595-4611.
6. SecaneIl, M., Carnes, B. , Suleman, A. et Djilali, N. 2007. «Numerical optimization of proton exchange membrane fuel cell cathodes». Electrochimica Acta, vol 52(7): p. 2668-2682.
7. Gallart, M.S. 2007. Computational Modeling and Optimization of Proton Exchange Membrane Fuel Cells. Mechanical Engineering, University of Victoria.
8. Mezedur, M.M. , Kaviany, M. et Moore, W. 2002. «Effect of pore structure, randomnesa snd size on effective mass diffusivity». AIChE Journal, vol 48(1): p. 15-24.
9. Tomadakis, .M.M. et Sotirchos, S.v. 1993. «Ordinary and transition regime diffusion in random fiber structures». AIChE Journal, vol 39(3): p. 397-412.
10. Bird RB., Stewart,W.E et Lightfoot E.N. 1960. Transport phenomena. John Wiley & Sons. .
11. Sun, W. , Peppley, B.A. et Karan, K. 2005. <<An improved two-dimensional agglomerate cathode model to study the influence of catalyst layer structural parameters». Electrochimica Acta, vol 50(16-17): p. 3359-3374.
12. Natarajan, D. et Nguyen, T. Van. 2003 . «Three-dimensional effects of liquid water flooding in the cathode of a PEM fuel ceIl». Journal of Power Sources, vol 115(1): p. 66-80.
13. Rao, R.M. , Bhattacharyya, D., Rengaswamy, R. et Choudhury, S.R 2007. «A two-dimensional steady state model including the effect of liquid water for a PEM fuel cell cathode». Journal of Power Sources, vol 173(1): p. 375-393.

3. Protocole expérimental

36
AfIn de valider le modèle numérique développé, nous avons conduit une série
d'expériences sur l'électrode cathodique d'une pile à combustible de type PEM. Une
attention spéciale a été portée à la sélection des matériaux à utiliser pour la conception de
la cathode afm que leurs propriétés s'approchent le plus possible de celles déjà énumérées
dans le chapitre précédent (Voir Tableau 2.2). Le procédé expérimental a consisté dans un
premier temps à la fabrication des confIgurations de base de l'électrode cathodique des
structures multicouche, tel que décrit dans le chapitre de l'étude théorique et dans un
second temps à la fabrication des confIgurations dérivées de cette confIguration de base.
Nous nous sommes intéressés à l'effet de l'épaisseur de la couche active, à l'alternance de
différents nombres de cette couche, à la formation des c1usters, à l' effet de la teneur en
NafIon et en PTFE, à l'utilisation de nanotubes de carbone et à la réduction de la quantité
de platine sur la performance de l'électrode. Le protocole expérimental suivi est résumé
sur le diagramme de la Figure 3.1 .
f
Utilisation de papier Ajout de la
carbone ou tissu de carbone
Membrane
J Pulvérisation de Pt 1 l J ,.
- Préparation d'encre - Application de l'encre -de CN et de CPTFE De CN ou de CPTFE
---+ Préparation du Application du catalyseur PtiC Catalyseur Pt/C
Figure 3.1. Procédé de fabrication de l'électrode cathodique de la pile PEM.

3.1. Préparation des électrodes et des MEA
3.1.1. Électrodes standards
37
Afin de préparer des électrodes standard de couches actives de 0.2 mg/cm2 de platine,
une série d'encres de catalyseurs anodique et cathodique contenant respectivement des
proportions en Nafion de 1 et 0.25 a été préparée avec de la poudre noire de carbone
(Vulcan XC-72R) comportant 10 % en masse de Pt. Ces encres obtenues après 24 hr de
mélange par agitation magnétique ont servi à déposer des densités de platine de 0.2
mg/cm2 à l'anode et à la cathode sur du papier carbone (type AB et BC de SIGRACET) et
du tissu de carbone afin d'obtenir des MEA de densité totale de 0.4 mg/cm2 de platine.
Les schémas de préparation de ces différentes encres catalytiques (anode et cathode) sont
présentés ci-dessous (Figure 3.2). Les caractéristiques des papiers carbones utilisés sont
données dans le Tableau 3.1.
Anode 1:1
SOmg de solution de Nation à 10%
EncrecaUdytiqueobœnue après24H
Cathode 1 :2.5
"----~_ ... Omg de solution
de Nafion à 10%
Encre catalytique obtenue Après 24H
Figure 3.2. Procédé de fabrication des encres catalytiques anodique et cathodique pour
électrodes standards.
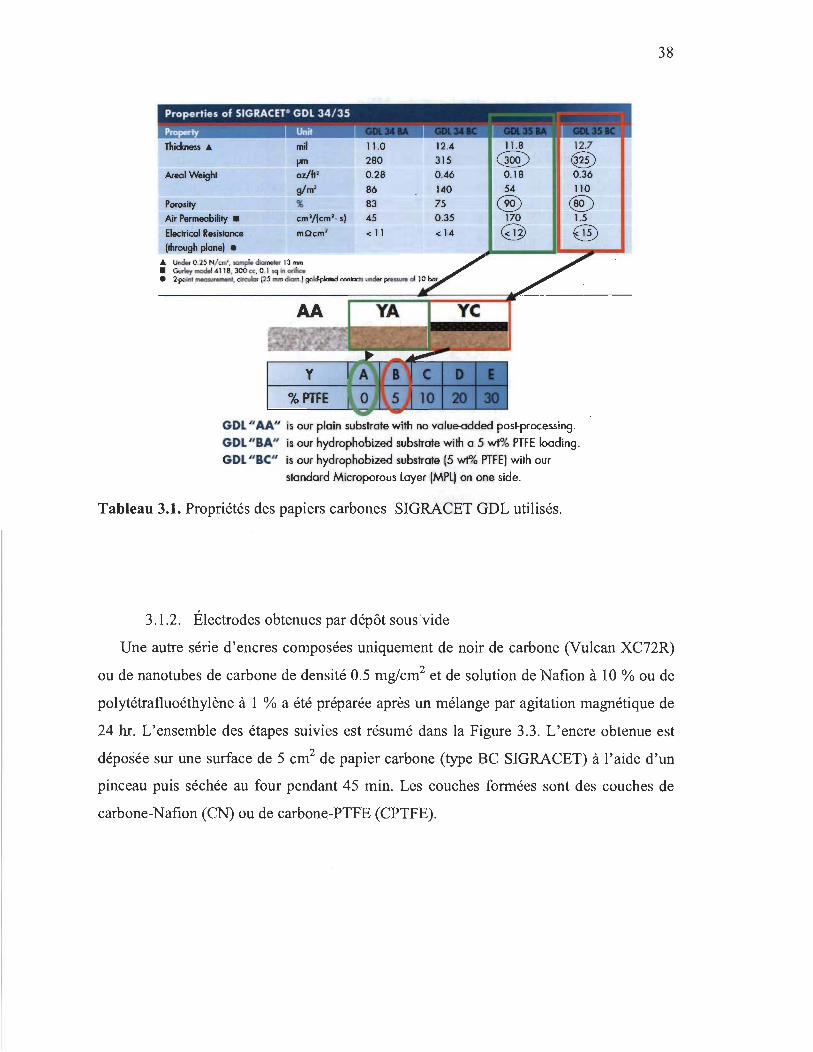
Properties of SIGRACETO GDL 34/35
Property Unit
Thickness .. mil 11.0 12.4 11 .8 12.7
fJ'" 280 315 @> @) Arecl Welght oz/ft> 0 .28 0.46 0.18 0.36
g/m' 86 140 54 110
Porosity % 83 75 ® ® Air Permeobility • cm'/(cm" s) 45 0.35 170 1.5
Electricol Resistance mOcm' < 11 <14 @ ® (through plone) •
.. lJndo, 0.2.5 Won', oompIo d_ 13 mm • G..Ioymoclol4118, 300cc, O,loq","'i/;c:. • 2-po;nt __ , circular (25 mm diam,) g~ conlacls undor pre ...... 01 10
y
%PTFE
GDL /1 AAu is our plain substrate with no valueodded post-processing.
GDL uBA" is our hydrophobized substrate with a 5 wt% PTFE Ioading.
GDL " BC" is our hydrophobized substrate (5 wt% PTFE) with our
standard Microporous Loyer (MPL) on one side.
Tableau 3.1. Propriétés des papiers carbones SIGRACET GDL utilisés.
3.1.2. Électrodes obtenues par dépôt sous 'vide
38
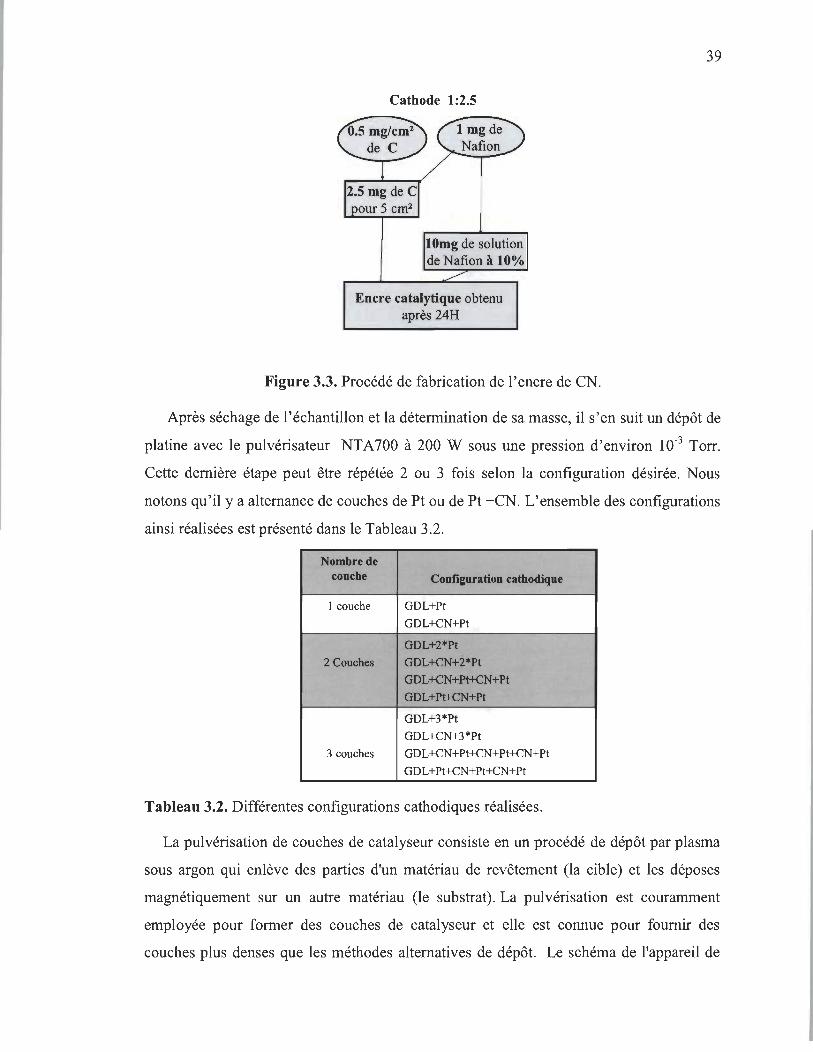
Une autre série d'encres composées uniquement de noir de carbone (Vulcan XC72R)
ou de nanotubes de carbone de densité 0.5 mg/cm2 et de solution de Nafion à 10 % ou de
polytétrafluoéthylène à 1 % a été préparée après un mélange par agitation magnétique de
24 hr. L'ensemble des étapes suivies est résumé dans la Figure 3.3. L'encre obtenue est
déposée sur une surface de 5 cm2 de papier carbone (type BC SIGRACET) à l ' aide d'un
pinceau puis séchée au four pendant 45 min. Les couches formées sont des couches de
carbone-Nafion (CN) ou de carbone-PTFE (CPTFE).
Cathode 1 :2.5
10mg de solution de Nation à 10%
Encre catalytique obtenu après 24H
Figure 3.3. Procédé de fabrication de l'encre de CN.
39
Après séchage de l'échantillon et la détermination de sa masse, il s'en suit un dépôt de
platine avec le pulvérisateur NTA700 à 200 W sous une pression d'environ 10-3 Torr.
Cette dernière étape peut être répétée 2 ou 3 fois selon la configuration désirée. Nous
notons qu'il y a alternance de couches de Pt ou de Pt +CN. L'ensemble des configurations
ainsi réalisées est présenté dans le Tableau 3.2.
Nombre de couche Configuration cathodique
1 couche GDL+Pt
GDL+CN+Pt
GDL+2*Pt
2 Couches GDL+CN+2*Pt
GDL+CN+Pt+CN+Pt
GDL+Pt+CN+Pt
GDL+3*Pt
GDL+CN+3*Pt
3 couches GDL+CN+Pt+CN+Pt+CN+Pt
GDL+Pt+CN+Pt+CN+Pt
Tableau 3.2. Différentes configurations cathodiques réalisées.
La pulvérisation de couches de catalyseur consiste en un procédé de dépôt par plasma
sous argon qui enlève des parties d'un matériau de revêtement (la cible) et les déposes
magnétiquement sur un autre matériau (le substrat). La pulvérisation est couramment
employée pour former des couches de catalyseur et elle est connue pour fournir des
couches plus denses que les méthodes alternatives de dépôt. Le schéma de l'appareil de
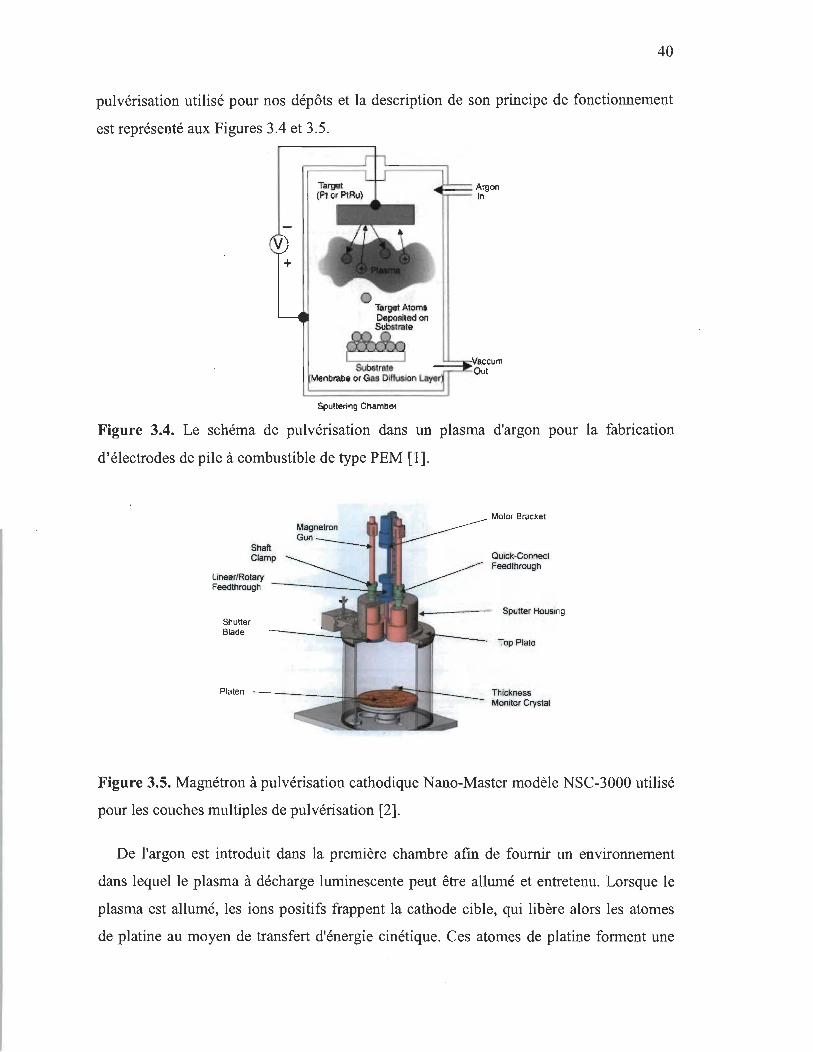
40
pulvérisation utilisé pour nos dépôts et la description de son principe de fonctionnement
est représenté aux Figures 3.4 et 3.5.
SputtGring ChambGr
Argon ln
Figure 3.4. Le schéma de pulvérisation dans un plasma d'argon pour la fabrication
d'électrodes de pile à combustible de type PEM [1].
Shaft Clamp
Linear/Rotary
Magnetron Gun
Feedthrough ----_--.:
Shutter Blade
Platen
Motor Bracket
Quick-Connect Feedthrough
Sputter Housing
Top Plate
Thickness Mon~or Crystal
Figure 3.5. Magnétron à pulvérisation cathodique Nano-Master modèle NSC-3000 utilisé
pour les couches multiples de pulvérisation [2] .
De l'argon est introduit dans la première chambre afin de fournir un environnement
dans lequel le plasma à décharge luminescente peut être allumé et entretenu. Lorsque le
plasma est allumé, les ions positifs frappent la cathode cible, qui libère alors les atomes
de platine au moyen de transfert d'énergie cinétique. Ces atomes de platine forment une
41
vapeur qui se condense en un film mince sur la surface du substrat. Cette procédure est
répétée une, deux ou trois fois pour obtenir un, deux, et trois couches respectivement
séparées ou non par une couche d'encre de carbone-PTFE ou carbone-Nafion jusqu'à ce
que la même quantité totale (0.05 mglcm2) de platine soit atteinte pour chaque électrode.
La pulvérisation assure le dépôt d'une couche mince de catalyseur qui offre des
performances élevées pour de faible quantité de platine. La couche entière de catalyseur
est en quelque sorte en contact étroit avec la membrane à telle point que la nécessité pour
que les conducteurs ioniques d'atteindre la couche de catalyseur est résolue.
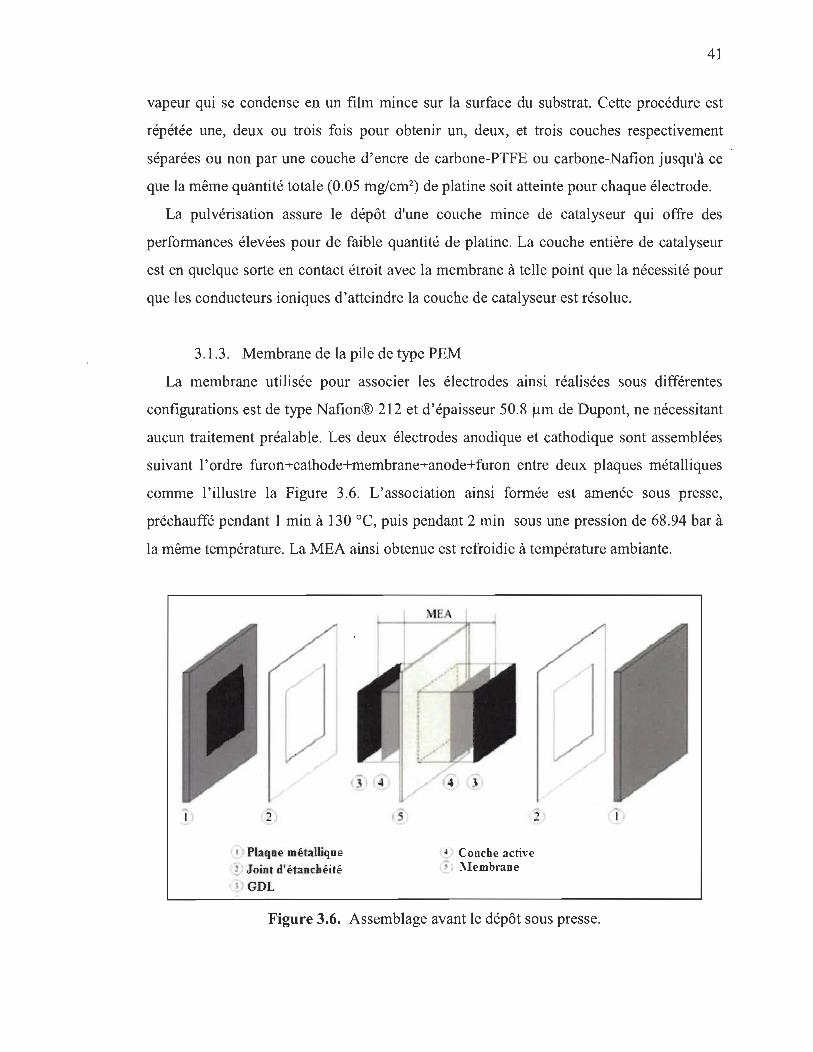
3.1.3. Membrane de la pile de type PEM
La membrane utilisée pour associer les électrodes ainsi réalisées sous différentes
configurations est de type Nafion® 212 et d'épaisseur 50.8 ~m de Dupont, ne nécessitant
aucun traitement préalable. Les deux électrodes anodique et cathodique sont assemblées
suivant l'ordre furon+cathode+membrane+anode+furon entre deux plaques métalliques
comme l'illustre la Figure 3.6. L'association ainsi formée est amenée sous presse,
préchauffé pendant 1 min à 130 oC, puis pendant 2 min sous une pression de 68.94 bar à
la même température. La MEA ainsi obtenue est refroidie à température ambiante.
1 Plaque métallique , Joint d'étancbéité
1 \ GDL
Coucbe active , ~ ~IembraDe
Figure 3.6. Assemblage avant le dépôt sous presse.
l ,

42
3.2. Description des dispositifs de test
Les bancs d'essais utilisés dans le cadre de ce travail de validation sont de deux types:
le premier est équipé d'un humidificateur et d'une carte d'acquisition de données
pennettant la représentation de la courbe de polarisation de la pile à combustible conçue
et testée en temps réel. Le deuxième banc d'essai est nommé « Électrode à disque
tournant» pennettant d'effectuer des mesures de surfaces actives par voltampérométrie
cyclique. À cela, se rajoutent le circuit d'adduction de la bouteille d'hydrogène
comprenant un détendeur, un coupe flamme, une valve solénoïdale de sûreté, un
régulateur de débit et un détecteur de fuite. Le circuit d'alimentation en au est
relativement simple et ne comprend qu'un filtre et un régulateur de débit. L'alimentation
en gaz se fait uniquement selon le mode ouvert. Les vannes de fonctionnement sont
situées sur le système d'humidification muni d'un contrôleur de pression situé après la
sortie de chaque électrode. L'ensemble des tests effectués a été réalisé à une pression de
sortie fixée à 2 bar et à une température de 80 oC sous un débit de 200 mL/min à l'anode
et 360 mL/min à la cathode.

43
Références du chapitre 3
1. Litster, S. et G. McLean. 2004. «PEM fuel cell electrodes». Journal of Power Sources,
vol 130(1-2): p. 61-76.
2. Ramasamy, R.P. 2009. (<Fuel cells - Proton ex change membrane fuel cells 1 Membrane
Electrode Assemblies». Encyclopedia of Electrochemical Power Sources, p. 787-805.

4. Présentation des articles

46
Présentation du premier article
Dans ce papier, la performance de la cathode d'une pile à combustible à membrane
échangeuse de protons a été investiguée numériquement afin de démontrer la possibilité
d'utiliser la technique de pulvérisation de platine au niveau de la cathode tout en obtenant
un fonctionnement optimal de la pile.
Pour cette fm, un modèle mathématique a été développé et résolu avec le logiciel de
calcul commercial à base d'éléments finis, Comsol Multiphysics 3.5a. Ce modèle tient
compte de la réaction électrochimique de réduction de l'oxygène ainsi que les transferts
de quantité de mouvement, de la saturation, des espèces et des charges. Il est appliqué à
trois configurations de la cathode où le platine est supposé pulvérisé une, deux et trois
fois sur le même nombre de couches de carbone-Nafion, respectivement. L'objectif est de
déterminer la configuration résultant en un fonctionnement optimal par la comparaison
des courbes de polarisation des trois cas traités.
En premier lieu, les courbes de polarisation correspondantes aux trois configurations
étudiées ont été comparées à celles mesurées dans notre laboratoire. Un bon accord a été
obtenu, permettant ainsi d'utiliser le modèle mathématique pour étudier les phénomènes
physiques affectant la performance de la pile. En effet, à partir de la comparaison des
courbes de polarisation des trois configurations, nous avons constaté que la troisième
configuration avec trois couches de platine pulvérisée conduit à l'obtention de la plus
haute densité de courant limite. Les distributions surfaciques de la fraction massique de
l'oxygène et de la saturation ont été déterminées afm d'élucider leur contribution au bon
fonctionnement de la pile. En dernier lieu, une étude paramétrique a été proposé pour
mettre en évidence les paramètres pouvant affecter le bon fonctionnement de la cathode
conçu avec du platine pulvérisé, à savoir la porosité de la couche du carbone-Nafion, le
rayon de l'agglomérat et l'épaisseur de la structure de cet agglomérat.
INTERNATIONAL JOURNAL OF HYDROGEN ENERGY 38 (2013) 10050 -1 0062
Available online at www.sciencedirect.com
sciVerse Science Direct
ELSEVIER jou rn al hom e pag e: www .el se v ie r. c om/ lo cat e/ he
Modelling and experimental validation of high performance low platinum multilayer cathode for polymer electrolyte membrane fuel cells (PEMFCs)
Daouda Fofana*, Jean Hamelin, Pierre Bénard Institut de recherche sur l'hydrogène,' Université du Québec à Trois-Rivières, 3351 bou!. Des Forges, Trois-Rivières, QC G9A SH7, Canada
ARTICLE INFO ABSTRACT
Article history: Received 13 March 2013 Received in revised form 28 May 2013 Accepted 31 May 2013 Available online 30 June 2013
Keywords: Cathode PEM fuel ceU Pt sputtered layer Numerical modeUing Carbon- Nafion layers
The aim of this paper is to demonstrate numericaUy the feasibility of using a sputtering technique for the design of Polymer Electrolyte Membrane Fuel CeU cathodes having low platinum loading and offering high performance. A two-dimensional steady state model accounting for electrochemical reactions, momentum, saturation, species and charge conservation equations have been developed. It has been applied to three different cathode configurations where the platinum is assumed to be sputtered one, two and three times on the same number of carbon- Nafion layers (CNL). The predicted polarization curves were validated with the experimental data obtained in our laboratory. Our results showed that the best performance is obtained with a three Pt sputtered layer cathode. A parametric study proved the dependence of the PEM fuel ceU cathode performance on the CNL porosity, the (Pt/e) agglomerate radius and the thickness of this agglomerate structure. Copyright © 2013, Hydrogen Energy Publications, LLC. Published by Elsevier Ltd. AU rights
1. Introduction
Proton exchange membrane fuel cell is a promising technology to provide an alternative power source for automotive and stationary applications. It can help to reduce the rising levels of greenhouse emissions, due to its lower cost-per kW, fast start-up, lower operating temperature and zero pollution emissions. Many research efforts have been do ne in the latest decades to improve its performance and reach a commercial reality. One of the main challenges that need to be overcome is to reduce the costs of PEM fuel cells by decreasing the quantity of platinum (Pt) in the reaction sites while maintaining a good performance, especially for the oxygen reduction reaction (ORR) in the cathode catalyst layer. The ORR limits the cell performance since it can cause large irreversible
• Corresponding author. Tel.: +18193765011; fax: +1 819 376 5164.
reserved.
losses that can however be reduced by increasing the Pt content in the cathode catalyst layer relative to the anode site.
Cathode catalyst layer is a complex composite layer, consisting typically of ionomer and platinum particles supported on black carbon to form nanoporous agglomerate structures [1] . AlI major transport phenomena occur simultaneously at the catalyst layer: chemical reaction, heat and water transports as weU as ionic and electric charge transfers. In order to maximise its performance, several properties must be carefully engineered and optimized such as the platinum loading, the reactant diffusivity, the ionic and electrical conductivities and the level of hydrophobicity [2,3] . The complex coupling between these transport processes combined with the structure and disparity of scales make the design of the cathode catalyst layer one of the most challenging research areas for
E-mail addresses: [email protected]. [email protected] (D. Fofana). 0360-3199/$ - see front matter Copyright © 2013, Hydrogen Energy Publications, LLC. Published by Elsevier Ltd. AU rights reserved. http:// dx.doi.org/l0.l016/j .ijhydene.2013.05.175
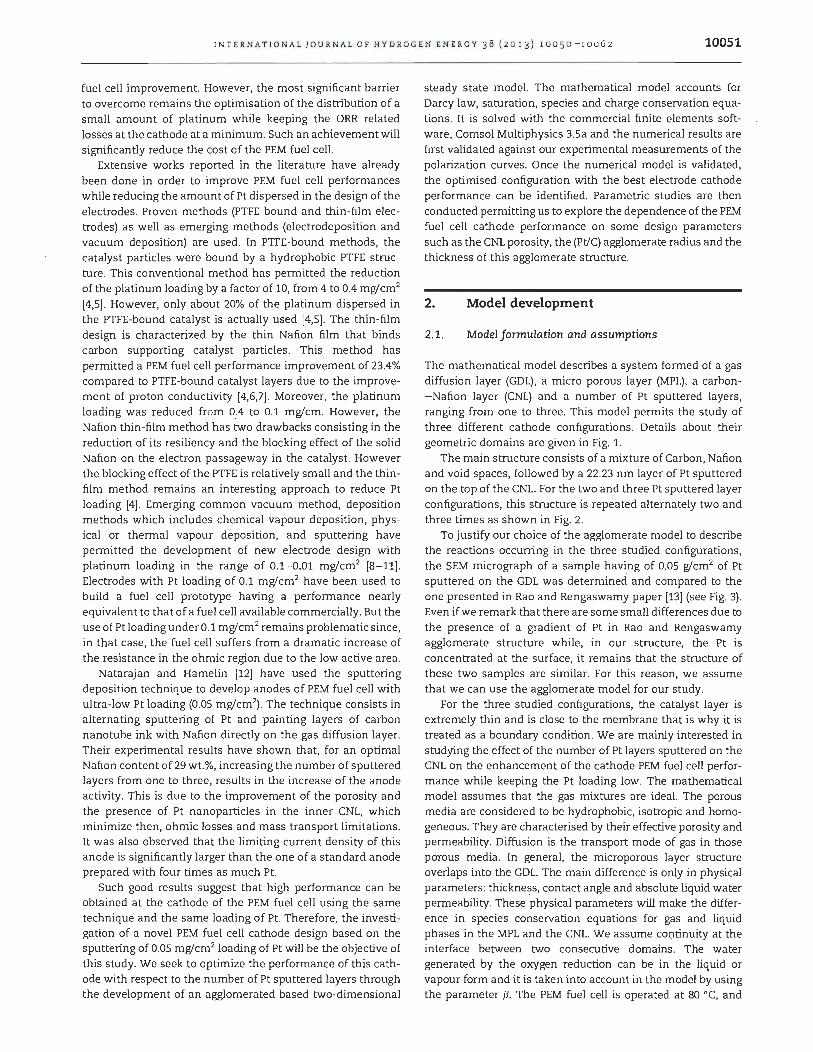
INTERNATIONAL JOURNAL OF HYDROGEN ENERGY 38 (2013) 10050-10062 10051
fuel cell improvement. However, the most significant barrier to overcome remains the optimisation of the distribution of a small amount of platinum while keeping the ORR related losses at the cathode at a minimum. Such an achievement will significantly reduce the cost of the PEM fuel cell.
Extensive works reported in the lite rature have already been do ne in order to improve PEM fuel cell performances while reducing the amount of Pt dispersed in the design of the electrodes. Proven methods (PTFE-bound and thin-film electrodes) as well as emerging methods (electrodeposition and vacuum deposition) are used. In PTFE-bound methods, the catalyst particles were bound by a hydrophobic PTFE structure. This conventional method has permitted the reduction of the platinum loading by a factor of 10, from 4 to 0.4 mg/cm2
[4,5) . However, only about 20% of the platinum dispersed in the PTFE-bound catalyst is actually used [4,5) . The thin-film design is characterized by the thin Nafion film that binds carbon supporting catalyst particles. This method has permitted a PEM fuel cell performance improvement of 23.4% compared to PTFE-bound catalyst layers due to the improvement of proton conductivity [4,6,7) . Moreover, the platinum loading was reduced from 0..4 to 0.1 mg/cm. However, the Nafion thin-film method has two drawbacks consisting in the reduction of its resiliency and the blocking effect of the solid Nafion on the electron passageway in the catalyst. However the blocking effect of the PTFE is relatively small and the thinfilm method remains an interesting approach to reduce Pt loading [4) . Emerging common vacuum method, deposition methods which includes chemical vapour deposition, physical or thermal vapour deposition, and sputtering have permitted the development of new electrode design with platinum loading in the range of 0.1-0.01 mg/cm2 [8-11) . Electrodes with Pt loading of 0.1 mg/cm2 have been used to build a fuel cell prototype having a performance nearly equivalent to that of a fuel cell available commercially. But the use of Pt loading un der 0.1 mg/cm2 remains problematic since, in that case, the fuel cell suffers from a dramatic increase of the resistance in the ohmic region due to the low active area.
Natarajan and Hamelin [12) have used the sputtering deposition technique to develop anodes of PEM fuel cell with ultra-Iow Pt loading (0.05 mg/cm2
) . The technique consists in altemating sputtering of Pt and painting layers of carbon nanotube ink with Nafion directly on the gas diffusion layer. Their experimental results have shown that, for an optimal Nafion content of 29 wt.%, increasing the number of sputtered layers from one to three, results in the increase of the anode activity. This is due to the improvement of the porosity and the presence of Pt nanoparticles in the inner CNL, which minimize then, ohmic losses and mass transport limitations. It was also observed that the limiting current density of this anode is significantly larger than the one of a standard anode prepared with four times as much Pt.
Such good results suggest that high performance can be obtained atthe cathode of the PEM fuel cell using the same technique and the same loading of Pt. Therefore, the investigation of a novel PEM fuel cell cathode design based on the sputtering of 0.05 mg/cm2 loading of Pt will be the objective of this study. We seek to optimize the performance of this cathode with respect to the number of Pt sputtered layers through the development of an agglomerated based two-dimensional
steady state mode!. The mathematical model accounts for Darcy law, saturation, species and charge conservation equations. It is solved with the commercial finite elements software, Comsol Multiphysics 3.5a and the numerical results are first validated against our experimental measurements of the polarization curves. Once the numerical model is validated, the optimised configuration with the best electrode cathode performance can be identified. Parame tric studies are then conducted permitting us to explore the dependence of the PEM fuel cell cathode performance on sorne design parameters such as the CNL porosity, the (Pt/e) agglomerate radius and the thickness of this agglomerate structure.
2. Model development
'2.1. Model formulation and assumptions
The mathematical model describes a system formed of agas diffusion layer (GDL) , a micro porous layer (MPL) , a carbon- Nafion layer (CNL) and a number of Pt sputtered layers, ranging from one to three. This model permits the study of three different cathode configurations. Details about their geometric domains are given in Fig. 1.
The main structure consists of a mixture of Carbon, Nafion and void spaces, followed by a 22.23 nm layer of Pt sputtered on the top of the CNL. For the two and three Pt sputtered layer configurations, this structure is repeated altemately two and three times as shown in Fig. 2.
To justify our choice of the agglomerate model to describe the reactions occurring in the three studied configurations, the SEM micrograph of a sample having of 0.05 g/cm2 of Pt sputtered on the GDL was determined and compared to the one presented in Rao and Rengaswamy paper [13) (see Fig. 3). Even if we remark that there are sorne sma!! differences due to the presence of a gradient of Pt in Rao and Rengaswamy agglomerate structure while, in our structure, the Pt is concentrated at the surface, it remains that the structure of these two samples are similar. For this reason, we assume that we can use the agglomerate model for our study.
For the three studied configurations, the catalyst layer is extremely thin and is close to the membrane that is why it is treated as a boundary condition. We are mainly interested in studying the effect of the number of Pt layers sputtered on the CNL on the enhancement of the cathode PEM fuel ce!! performance while keeping the Pt loading low. The mathematical model assumes that the gas mixtures are ideal. The porous media are considered to be hydrophobic, isotropic and homogeneous. They are characterised by their effective porosity and permeability. Diffusion is the transport mode of gas in those porous media. In general, the microporous layer structure overlaps into the GDL. The main difference is only in physical parameters: thickne~s, contact angle and absolu te liquid water permeability. These physical parameters will make the difference in species conservation equations for gas and liquid phases in the MPL and the CNL. We assume cOI).tinuity at the interface between two consecutive domains. The water generated by the oxygen reduction can be in the liquid or vapour form and it is taken into account in the model by using the parame ter {J. The PEM fuel cell is operated at 80 oC, and
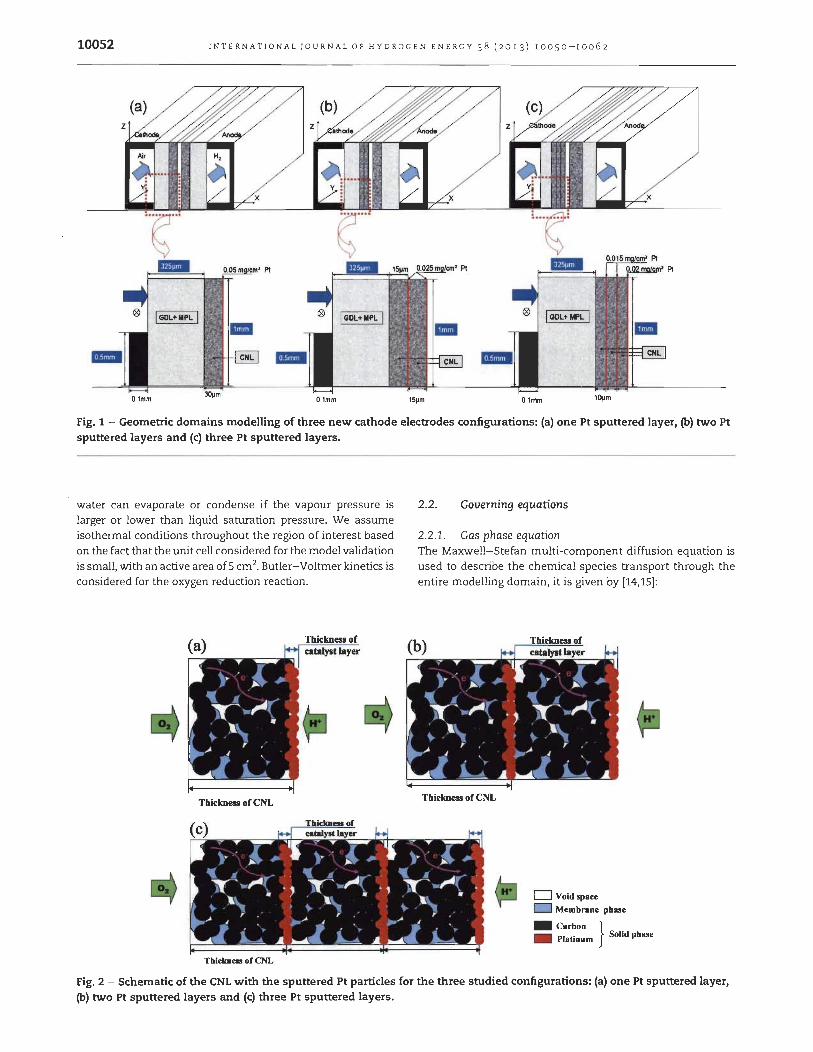
10052 IN T ERNATIONAL JOURNAL O F HYDROGEN ENERGY 38 (2013) 10050 - 10062
Fig. 1 - Geometrie domains modelling of three new cathode electrodes configurations: (a) one Pt sputtered layer, (b) two Pt sputtered layers and (c) three Pt sputtered layers.
water can evaporate or condense if the vapour pressure is larger or lower than liquid saturation pressure. We assume isothermal conditions throughout the region of interest based on the fact that the unit cell considered for the model validation is small, with an active area of 5 cm2
. Butler-Voltmer kinetics is considered for the oxygen reduction reaction.
Tbickness of CNL
Tblclm_ of CNL
2.2. Governing equations
2.2.1. Gas phase equation The Maxwell-Stefan multi-component diffusion equation is used to de scribe the chemical species transport through the entire modelling domain, it is given by [14,15]:
Thickness of CNL
w D Voidspace D Membnne pbase
_ Carbon } _ Platinum Solid pbase
Fig. 2 - Schematic of the CNL with the sputtered Pt particles for the three studied configurations: (a) one Pt sputtered layer, (b) two Pt sputtered layers and (c) three Pt sputtered layers.

INTERNATIONAL JOURNAL OF HYDROGEN ENERGY 38 (2013) 10050-10062 10053
(b)
Fig. 3 - Scanning electron microscope (SEM) images of PEM fuel cell cathode for (a) our sample and (b) Rao and Rengaswamy's sample.
V· (WiPg U - pgWi tDfJf (~ (VWj +WjV:) + (Xj -Wj) ~g) ) = Ri
(1)
where Wi is the mass fraction of species i, DfJf the effective diffusion coefficient component of the multi-component Fick diffusivity (m%), Pg the density of the fluid (kg/m3
) , Pg the pressure (Pa), Ri the reaction source term for species i (kg/m3 s) and Xj is the molar fraction of species j . The average molecular mass M is computed as:
k
M = LxjMj j~l
(2)
where Mj (kg/mol) is the molar mass of species j. The gas is assumed to be idea!. Its density is given by
(3)
The effective diffusivity DfJf relating the binary diffusivity Dij , the porosity of the regiOnER and the liquid water saturation 5, is given by [16] :
(4)
where the quantity E.( l - 5) represents the volume occupied by gas species in the porous media. The binary diffusivity Dij is a strong function of temperature T, pressure Pg and molecular weights ofspecies i andj. At low pressure, the binary diffusion constant can be estimated from the following equation based on kinetic gas theory [14] :
D .. = a (_T_)b(p 'p .)Y, (T T)51t2 (~ + ~) r, ~ 1) ~T . CI CJ CI C) M· M. P
V J. CI J. C) 1 ) g (5)
The subscript c stands for the critical values for the corresponding compone nt, and the parameters a and b are empirical constants for a given mixture.
The gas and the liquid velo city are approximated with Darcy's law, which can be written in the following manner:
• Gas phase
(6)
• Liquid phase
(7)
where Kwo is the absolute perrneability of the porous media, krg = (1 - 5 )3 and krl = 5 3 the relative perrneability of the gas and liquid phases, respectively. /Lg and /Lw are the dynamic viscosities of gas and liquid phases, respectively. Pg and Pl denote the partial pressure of gas and liquid phases, respectively.
The partial pressure of liquid phase in the porous media is the difference between the partial pressure of gas and capillary pressure pc. The gradient difference was assumed to be VPI = VPg - Vpc = - Vpc since 1 vpc 1 » l.vpg 1·
2.2.2. Liquid water transport The diffusion of gas species in the porous media, the electrochemical reaction between oxygen and hydrogen at the cathode catalyst layer, the proton migration from the anode to the cathode and the condensation of water vapour are the main processes which brings liquid water in si de the electrode. Its transport is induced by capillary forces and gas flow-driven shear force. The goveming equation for liquid water transport can be expressed as [17,18]:
(8)
where Nw, V w and Rw represent the mass flux of liquid water , the velo city and the interfacial mass-transfer rate of water between the liquid and vapour phases, respectively. The mass flux Nw of liquid water is strongly dependent of capillary pressure Pc ofliquid water and saturation.1t can be written as [17 ,18]:
N = _ Pw Kw0
5n ( _ dPc) V5
w /Lw d5 (9)
where Pw'/Lw and KwO are water density, viscosity ofliquid water and absolute perrneability ofliquid water in the porous region, respectively. The capillary pressure pc ofliquid water in hydrophobic porous media is given by the Leverett]-function as [16]:
O'cos Oc ( 2 3) pc = 1/ 2 1.4175 - 2.125 + 1.2635 (Kwo/ E.)
(10)
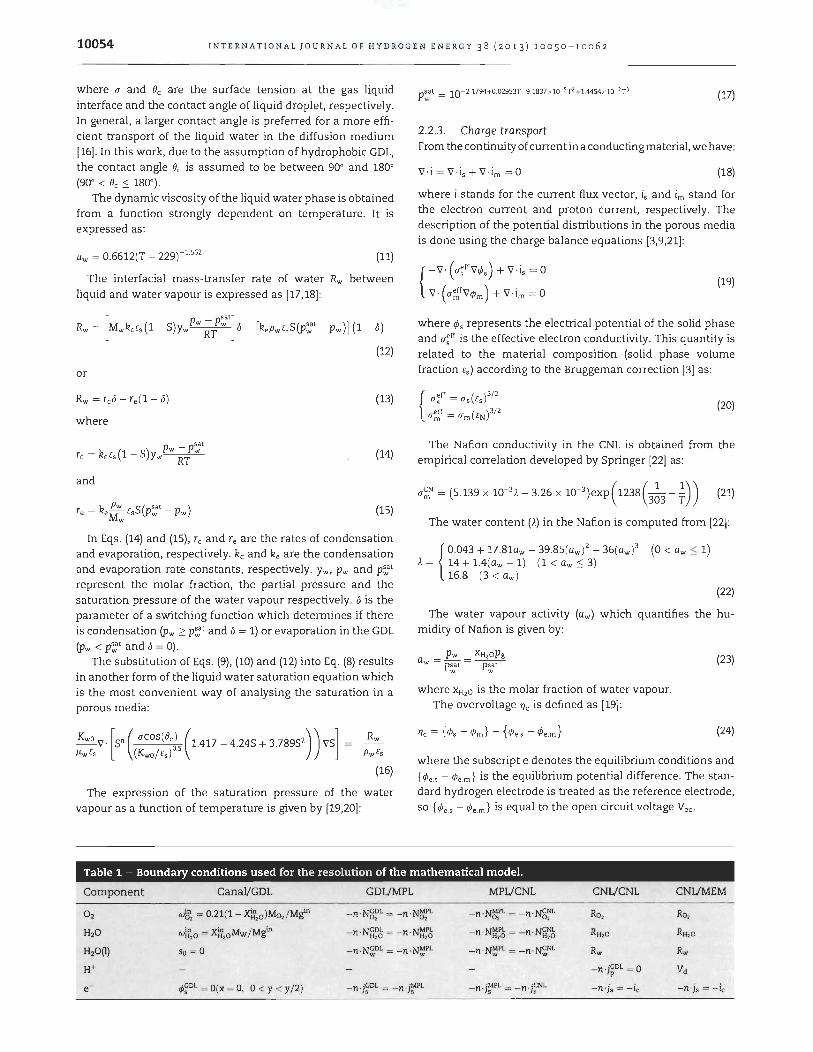
10054 INTERNATIONAL JOURNAL OF HYDROGEN ENERGY 38 (2013) 10050-10062
where u and Oc are the surface tension at the gas liquid interface and the contact angle ofliquid droplet, respectively. In general, a larger contact angle is preferred for a more efficient transport of the liquid water in the diffusion medium [16] . In this work, due to the assumption ofhydrophobic GOL, the contact angle Oc is assumed to be between 90° and 180° (90° < Oc ~ 180°).
The dynamic viscosity of the liquid water phase is obtained from a function strongly dependent on temperature. It is expressed as:
J.Iw = 0.6612(T - 229r 1562 (11)
The interfacial mass-transfer rate of water Rw between liquid and water vapour is expressed as [17,18]:
Rw = [MwkcEs (l - S)y]w ;!~} - [kePw Es S(p~t - Pw)](l - 0)
(12)
or
Rw = rco - re(l - 0)
where
pw _p~t rc = kcEs (1 - S)yw RT
and
r = k .f!:!!... E 5 (ps.t - P ) e eMw S w W
(13)
(14)
(15)
In Eqs. (14) and (15) , rc and re are the rates of condensation and evaporation, respectively. kc and ke are the condensation and evaporation rate constants, respectively. Yw, pw and p~t represent the molar fraction, the partial pressure and the saturation pressure of the water vapour respectively. 0 is the parameter of a switching function which determines if there is condensation (pw ~ p~t and 0 = 1) or evaporation in the GOL (Pw < p~t and 0 = 0) .
The substitution of Eqs. (9), (10) and (12) into Eq. (8) results in another form of the liquid water saturation equation which is the most convenient way of analysing the saturation in a porous media:
Kwo V. [sn ( ucos( OcJ 5 (1.417 _ 4.245 + 3.78952)) vs] = _ Rw J.lw Es (Kwo/Es) . PwEs
(16)
The expression of the saturation pressure of the water vapour as a function of temperature is given by [19,20]:
(17)
2.2.3. Charge transport From the continuity of current in a conductingmaterial, we have:
v·i = v ·is + v ·im = 0 (18)
where i stands for the current flux vector, is and im stand for the electron current and proton current, respectively. The description of the potential distributions in the porous media is do ne using the charge balance equations [3,9,21]:
{- v . ( u~ff V cf>s ) + V . is = 0
V· (U~fVcf>m ) + v ·im = 0 (19)
where cf>s represents the electrical potential of the solid phase and u~ff is the effective electron conductivity. This quantity is related to the material composition (solid phase volume fraction Es ) according to the Bruggeman correction [3] as:
(20)
The Nafion conductivity in the CNL is obtained from the empirical correlation developed by Springer [22] as:
U~N = (5 .139 x 10-3). - 3.26 x 1O- 3)exp ( 1238(3~3 - ~)) (21)
The water content P,) in the Nafion is computed from [22] :
{
0.043 + 17.81aw - 39.85(awf + 36(aw)3 (0 < aw ~ 1) ). = 14 + 1.4(aw - 1) (1 < aw ~ 3)
16.8 (3 < aw )
(22)
The water vapour activity (aw ) which quantifies the humidity of Nafion is given by:
a _~ _ XH,OP g w - p~t - p~t
where XH,O is the molar fraction of water vapour. The overvoltage 1Jc is defined as [19] :
(23)
(24)
where the subscript e denotes the equilibrium conditions and {cf>e,s - cf>e,m} is the equilibrium potential difference. The standard hydrogen electrode is treated as the reference electrode, so {cf>e,s - cf>e,m} is equal to the open circuit voltage Voc •
Table 1 - Boundary conditions used for the resoIution of the mathematical mode\.
Component CanaVGOL GOUMPL MPUCNL CNUCNL CNUMEM
O2 w~ = 0.21(1 - XW,o)Mo,/M!f' -n · N~L = -n·N~:L -n · N~:L = -n · N'~L Ro, Ra,
H20 wW,o = XW,oMw /Mgin _ n .NGDL - _ n .NMPL H20 - HlO
_n .NMPL - _n ·~NL H20 - H20 RH,o RH,o
H2O(l) sa = 0 _n · N~DL = -n . N~PL _n . N~PL = _n·~NL Rw Rw
H+ _n-j~DL = 0 Vd
e </J~DL = O(x = 0, 0 < y < y/ 2) _n .j~DL = _n-j~PL _n-j~PL = _n-j~NL - n-j. = - ic - n-js = - ic
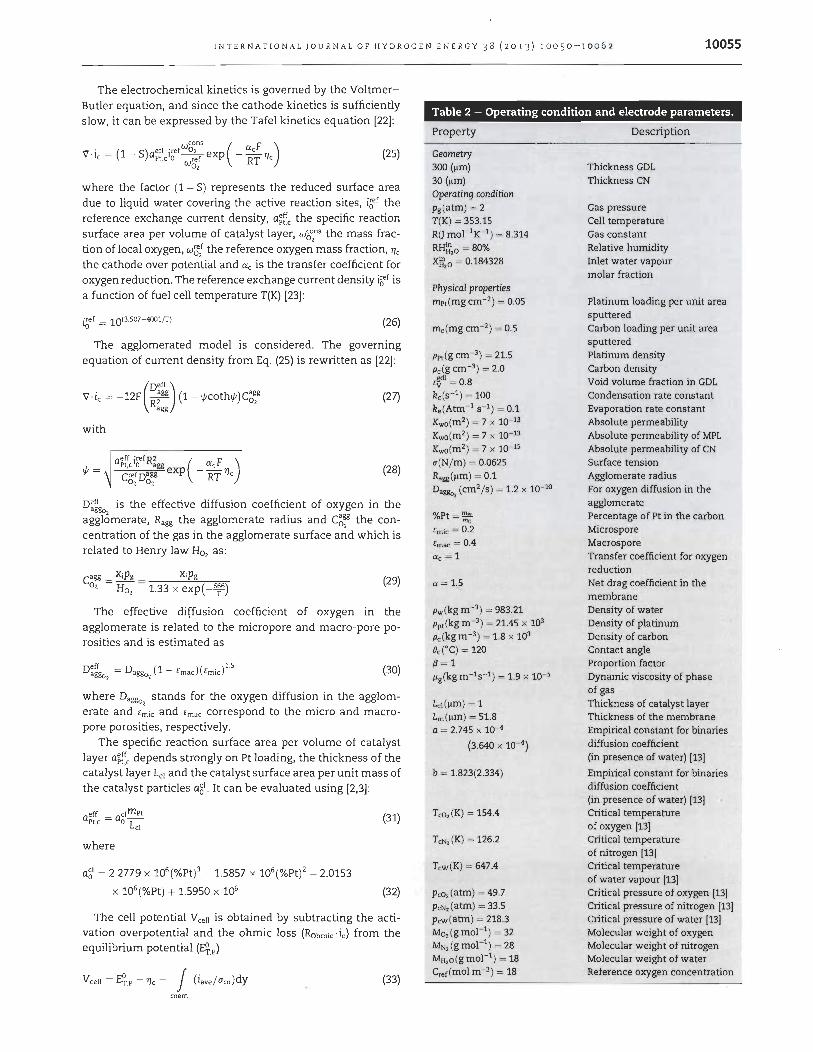
INTERNATIONAL JOURNAL OF HYDROGEN ENERGY 38 (2013) 10050-10062 10055
The electrochemical kinetics is govemed by the VoltmerButler equation, and since the cathode kinetics is sufficiently slow, it can be expressed by the Tafel kinetics equation [22] :
(25)
where the factor (1 - S) represents the reduced surface area due to liquid water covering the active reaction sites, ibef the reference exchange current density, a~~e the specific reaction surface area per volume of catalyst layer, W6~ns the mass fraction of local oxygen, wi5; the reference oxygen mass fraction, l1e the cathode over potential and €Xc is the transfer coefficient for oxygen reduction. The reference exchange current density ibef is a function of fuel cell temperature T(K) [23]:
i~ef = 10(3.507- 4001/Tl (26)
The agglomerated model is considered. The goveming equation of current density from Eq. (25) is rewritten as [22] :
v.·ie = -12F(~i:) (1 - 1fcoth1f)C~~ with
aeff l·refR2 ( F) Pt,c 0 agg ac c refDagg exp - RT l1e
0, 0 , 1f =
(27)
(28)
Di~ is the effective diffusion coefficient of oxygen in the agglomerate, Ragg the agglomerate radius and c~~ the concentration of the gas in the agglomerate surface and which is related to Henry law Ho, as:
c"gg _ ){iPg _ )(iP g
0 , - Ho, - 1.33 x exp ( _6~6) (29)
The effective diffusion coefficient of oxygen in the agglomerate is related to the micropore and macro-pore porosities and is estimated as
(30)
where Da&&<, stands for the oxygen diffusion in the agglomerate and Ernie and Emae correspond to the micro and macropore porosities, respectively.
The specific reaction surface area per volume of catalyst layer a~i~e depends strongly on Pt loading, the thickness of the catalyst layer Lei and the catalyst surface area per unit mass of the catalyst particles a81• It can be evaluated using [2,3] :
aeff _ acl m PI PI,e - 0 Lei
where
a~1 = 2.2779 x 10⁶ (%Pt)3 - 15857 X 106 (%Pt)2 - 2.0153
(31)
x 106 (%Pt) + 1.5950 x 10⁶ (32)
The cell potential Veell is obtained by subtracting the activation overpotential and the ohmic loss (Rohmic ·ie) from the equilibrium potential (E~,p )
Veell = E~,p - l1c - J (iave/ um)dy (33) mem
Table 2 - Operating condition and electrode parameters.
Property
Geometry 300 (~m) 30 (~m) Operating condition pg(atm) = 2 T(K) = 353.15 Ra mol- 1K- 1 ) = 8.314
RH:.7,o = 80% XW,o = 0.184328
Physica! properties mpt(mg cm- 2 ) = 0.05
PPI(g cm- 3) = 21.5 Pc(g cm- 3) = 2.0 ~dl = 0.8
kc(S- l) = 100 ke(Atm- 1 S- l) = 0.1
Kwo(m 2 ) = 7 x 10- 13
Kwa(m 2 ) = 7 x 10- 13
Kwa(m 2 ) = 7 x 10- 15
cr(N/ m ) = 0.0625
Ragg(~m) = 0.1 Dagg." (cm2 / s) = 1.2 X 10- 10
%Pt = ~ [ mie = 0.2 [mac = 0.4 <Xc = 1
<X = 1.5
Pw(kg m- 3) = 983.21 ppt(kg m - 3 ) = 21.45 x 10³
Pc (kg m - 3 ) = 1.8 x 10³
Oc ( C) = 120 {:1 = 1 ILg(kg m - 1 s- l) = 1.9 x 10- 5
Lcl(~m) = 1 Lm (~m) = 51.8 a = 2.745 x 10- 4
(3 .640 X 10- 4)
b = 1.823(2.334)
Tco,(K) = 154.4
TeN, (K) = 126.2
Tew(K) = 647.4
Pco, (atm) = 49.7 PeN,(atm) = 33.5 pcw(atm) = 218.3 Mo, (g mol- 1
) = 32 MN, (g mol- 1
) = 28 MH,o(g mol- 1
) = 18 Cref(mo! m- 3 ) = 18
Description
Thickness GDL Thickness CN
Gas pressure CeU temperature Gas constant Relative humidity lnlet water vapour molar fraction
Platinum loading per unit area sputtered Carbon loading per unit are a sputtered Platinum density Carbon density Void volume fraction in GDL Condensation rate constant Evaporation rate constant Absolute permeability Absolute permeability of MPL Absolute permeability of CN Surface tension Agglomerate radius For oxygen diffusion in the agglomerate Percentage of Pt in the carbon Microspore Macrospore Transfer coefficient for oxygen reduction Net drag coefficient in the membrane Density of water Density of platinum Density of carbon Contact angle Proportion factor Dynamic viscosity of phase of gas Thickness of catalyst layer Thickness of the membrane Empirical constant for binaries diffusion coefficient (in presence of water) [13]
Empirical constant for binaries diffusion coefficient (in presence of water) [13] Critical temperature of oxygen [13] Critical temperature of nitrogen [13] Critical temperature of water vapour [13] Critical pressure of oxygen [13] Critical pressure of nitrogen [13] Critical pressure of water [13] Molecular weight of oxygen Molecular weight of nitrogen Molecular weight of water Reference oxygen concentration

10056 INTERNATIONAL JOURNAL OF HYDROGEN ENERGY 38 (2013) 10050-10062
FinaIly, the equilibrium potential is a function of the temperature and the molar fraction of species and it is given by:
E~.p = 1.229 - 8.456 x 1O- 4(T - 298.15) + ~~ [ln (PH, ) + ~ln (xo, pg) ] (34)
Xo" PH, and Pg are the molar fraction of oxygen, the partial pressure of hydrogen and the total pressure of the gas, respectively.
2.3. Boundary conditions and input parameters
The sources terms for ORR and the production of water at the reaction site located at the CN/CN and the CN/membrane interface are modelled as
. {Ra, = -~V . ic R; = RH,O(I)= i1(2 + 4a)~V . ic (35)
In this equation, i1 represents the liquid fraction ofwater. In our case, its value is set equal to 1, as the water is present only in liquid form. For ex ample, a value of 0.5 would imply that the produced water is in both liquid and vapour forms .
Taking into account the geometric domains of the configurations presented in Figs. 1 and 2, it is possible to distinguish two boundary conditions: one at the canaV GDL interface and the other one at the CN/ MEM interface. The physical
(a) 1
0.9
0.8
~ 0.7
Q) 0.6 Cl .!9 0.5 ë5 > 0.4 Qi Ü 0.3
0.2
0.1
o
Polarization curves 0.6
i ----- Experimental data
--Model prediction t 0.5
"- / ' \ 1
"'" ~ / ' / ~ "-
/ ~---_._._. 1·----·_·_·
/ ' \ ... _-_ ..
V
0.4~ i!'
0.3 "iii c Q) "0
0.2 ~ 0 Cl.
-
/ 0.1
1 o 0.2 0.4 0.6 0.8 1 1.2 1.4
o 1.6
properties and their gradients are assumed to be continuous at the GDUCN interface. For the charge balance equations, insulating boundary conditions are applied at aIl external boundaries. The boundary conditions for different gas species i, liquid water, electron and proton are given in Table 1. The input parameters used for the resolution of the numerical model are given in Table 2.
The steady state model equations described above were solved numerically using Comsol Multiphysics 3.5a, a commercial software package which is capable of solving the set of coupled partial differential equations by the fmite element method. In the first step of our work, the performances of the three studied configurations of the PEM fuel cell cathode were assessed by determining their corresponding polarization curves which were then validated against experimental results. Thereafter, a parametric solver was used to determine the dependence of the cathode performances on a set of parameters, such as the CNL porosity, the agglomerate radius and the thickness of this agglomerate.
3. Experimental protocol
The CN ink is prepared by the mixture of a Nafion solution and carbon powder Vulcan XC-72R (Cabot) with ratio of V4 for the cathode and 1/1 for the anode. The CN ink is submitted to magnetic stirring for one day. A brushing procedure is used to
(b) Polarization curves
1 0.4
0.31
~ ~ Q) Cl i!' .!9 0.2 "ijj ë5 c > Q)
"0 Qi iii ü ~
01 ~
0.1
0.2 0.4 0.6 0.8 1.2 1.4
Current density (A/cm' ) Current density (A/cm' ) Polarization curves
(C) 1 r------r--,------r-~-----;:=======il0.7 i ! i 1 ----- Experimental data
0 .9 ,,·--·---r-.. ·--··--··-r------···-r --_ .. ····-r·---·_··· ,-'-'-'. Model p~ict ion 0.6
~ ::~ ~:::t~;~~~:.,~i~~~~~:t~~~t~~f:4~~~~~- 0.5 1
! :: ~~~-=t~== :: 1 ü 0.3 --·---·-1 '/-·- t----····-·+··--·---·--t--·--·--+------!-------~----_. 0.2 ~
:.: :-:4:~~~~t~~~-~~ :~~j:~~~~:t~~~j ~::~j---~ 0.1 Cl.
O L---~---L---L--~L---L---~--~--~O
o 0.2 0.4 0.6 0.8 1 1.2 1.4 1.6
Current density (A/cm' )
Fig. 4 - Comparison of simulated and measured polarization curves (a) one Pt sputtered layer, (b) two Pt sputtered layers and (c) three Pt sputtered layers configurations.
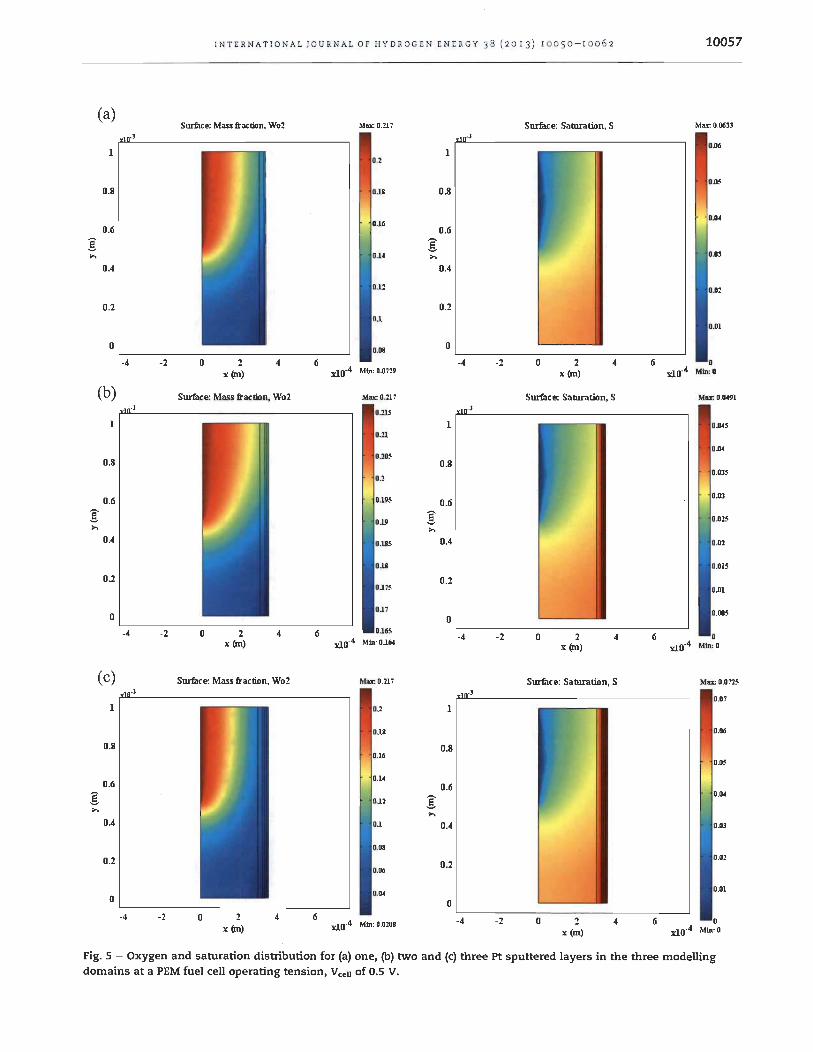
INTERNATIONAL JOU RNAL OF HYDROGEN ENERGY 38 (2013) 10050-10062 10057
(a) SW"fuee: Mau li'aClion, Wo2 Mu: 0.217 Sunaee:Sanuation,S Mu: 0.0633
.J .J 0.06
1 1 0.2
0.05 0.8 0.11 0.8
0.6 0.16
0.04
0.6
g g 0.03 ;., 0.14 ;.,
0.4 0.4
0.12 0.02
0.2 0.2 0.1
0.01
0 0.01 0
-4 -2 0 2 4 6 -4 -2 0 2 4 6 0
x~) nO·4 Min: 0.0729 x~) nO·4 Min: 0
(b) Sunace: Mass fraction, Wo2 Mu: 0.217 Sunace:Sanuation,S Mar. 0.0491
0.215
1 1 0.045 0.21
0.04
0.8 0.205
0.8 0.035
0.2
0.195 0.03 0.6 0.6
g 0.19 g 0.025
;., ;.,
0.4 0.115 0.4 0.02
0.11 0.015
0.2 0.2 0.175 0.01
0.17 o.oos 0 0
-4 -2 0 2 4 6 0.165 -4 -2 0 2 4 6 0
x~) nO·4 Min: 0.164 x~) nO·4 Min: 0
(c) Sunaee: Mass fraclion, Wo2 Max: 0.217 Sunace:Sanuation, S Mu: 0.0725 .J .)
0.07 1 0.2 1
0.11 0,06
0.8 0.8 0.16
0.05
0.14 0.6 0.6
î g 0.04 0.12
;., ;., 0.4 0.1 0.4 0,03
0.01
0.2 0,02
0.06 0 .2
0.04 0.01
0 0 -4 -2 6
nO·4 -4 -2 0 2 .. 6 0 Min: 0.0201 nO-4 Min: 0 x~)
Fig. 5 - Oxygen and saturation distribution for (a) one, (b) two and (c) three Pt sputtered layers in the three modelling domains at a PEM fuel cell operating tension, Veel! of 0.5 V.

10058 INTERN A TI O NA L JOURN A L O F H YDR O G EN ENER G Y 38 ( 2 0 1 3) 1 00 5 0 -1 00 62
paint it on a 5 cm2 teflonised carbon paper (SGL, SIGRACrr®). The composite structure (GDL+ MPL + CNL) is then dried in a stove a t 60 0 C for 1 h before the spu ttering of Pt. The procedure is repeated in order to get a two (GDL + MPL + CNL + Pt + CN + Pt) and a three-layer configuration (GDL + MPL + CNL + Pt + CN + Pt + CN + Pt). The membrane electrode assembly is obtained by hot pressing it between the two gas diffusion electrodes at 130 oC with a pressure of 1000 psi for 2 min after a preheating period of 1 min.
A fuel cell station equipped with a gas humidifier, a mass flow controller, a pressure controller and connected to a computer is used to measure the tension, Veeu versus the current, 1.
The measured polarisation curves will be compared to on es obtained from the mathematical model. Once the numerical results are validated, we can assess the performance of the modelled PEM fuel cell cathode, determine what the best configuration among the three and initiate the parametric study to identify the parameters influence on its performance.
4. Results and discussion
4.1. Madel validation
The comparison of the predicted and the measured fuel ceH polarization curves is presented in Fig. 4. A good agreement is
( ) '1 L Polarization curves a 1 '-'--'--'--'-'--Tr===~
0.9 ----- ~-----+-----J------1----J ----- + ~~.~~~ ~ ::: 0.6
0.5 0.8
Ë ~ 0.7 G Q) 0.6 Cl
0.4 i ~ 0.5
> 0.4 Qi Ü 0.3
0.2
i i ! 1
--_. -+--_·_-·--··i--·---···_~·_· __ ···_-~···_--_· .. ~_· __ ··· __ · - ~_._--_ .... ~._. __ .. __ .-Iii ; i i 1 1 ; 1 1 • i i
0.1 --' ·-·---t--·-----~----·--1--·-·--··-+- --t-----... --t----.. -1 i • i
0.3
0.2
0.1
OL-__ ~ __ _L __ ~ ____ L_ __ ~ __ ~ __ ~ __ ~O
o 0.2 0.4 0.6 0.8 1 1.2 1.4 1.6
Current density (A/cm2)
.?:-"iii c Q)
1::>
Qi J: 0 a.
obtained between experimental and modelling results. It is clear from this comparison that the configuration with three Pt sputtered layers ((see Figs. 1 and 2), Case (c)) results in the best power density. Indeed, a gain in performance is obtained if compared to the configuration with one Pt sputtered layer. However, despite the good performance, the PEM fuel cell seems to suffer from ohmic losses for all the three studied cases.
There is interdependence between the thickness of the Carbon- Nafion (CN) layer and the density of the sputtered platinum applied in each layer. This affects the performance of the studied configuration.
For the second configuration (two layers) , each CN layer has a thickness of 15 ~m and the Pt loading between each layer is 0.025 mglcm2
. For this Pt loading, the CN layer is still not thin enough to compensate the effect of reducing the amount of sputtered Pt compared to the first configuration (CN layer thickness = 30 ~m and the Pt loading = 0.05 mglcm2
) . This situation increases the reactants diffusion resistance leading to a po or performance. Sharp voltage drops were observed for many tests. during the operation of the second configuration. We have reproduced exactly what we have observed during measurements. This may be explained by the pronounced effect of the concentration loss due to the interdependence between the thickness of the Carbon-Nafion (CN) layer and the density of the sputtered platinum applied in each layer for this configuration (see Fig. 1).
2L Polarization curves (b) 1
0.9 •.•. _ •• ",,=0.2
•...•...•. ",,=0.4
0.8
0.7
~ Q) 0.6 Cl l!l 0.5 0 > 0.4 Qi Ü 0.3
0.2
0.1
\ /: ".- -- ",,=0.6 W ,·
"- / '" ~ / .... , ... _ ..
/ ~ /
~
07 /
o o Q2 Q4 Q6 Q8 1 12 1.4
Current density (A/cm2)
0.4
0.3
0.2
0.1
o 1.6
"" E
i ~ "iii c Q)
1::>
Qi J: 0 a.
(c) 3L Polarization curves
1
0.9
0.8
~ 0.7
Q) 0.6 Cl l!l 0.5 0 > 0.4 Qi Ü 0.3
0.2
0.1
o
\, .......... -......-. /'
.~
~ l"·"". ..t ~"" '" r"~
V .,,~~
/ . __ .. c·---.... -
f .. ·---....
/ ~~7 /
f .. ----· C"'--'" ... - f .. ---
---.... .----F-...•....•.. •..... '\
~ ..... ::: ~
• ••.•.• ",,=0.2
.......... ",,=0.4
-- ",,=0.6 .
1
0.7
0.6
0 .5~ 0.4;
"iii c
03~
Qi 02 ~
a.
0.1
o Q2 Q4 Q6 Q8 1.2 1.4 o
1.6
Current density (A/cm2)
Fig. 6 - Effect of the CNL porosity on the performance of the PEM fuel cell for (a) one, (b) two and (c) three Pt sputtered layers configurations.
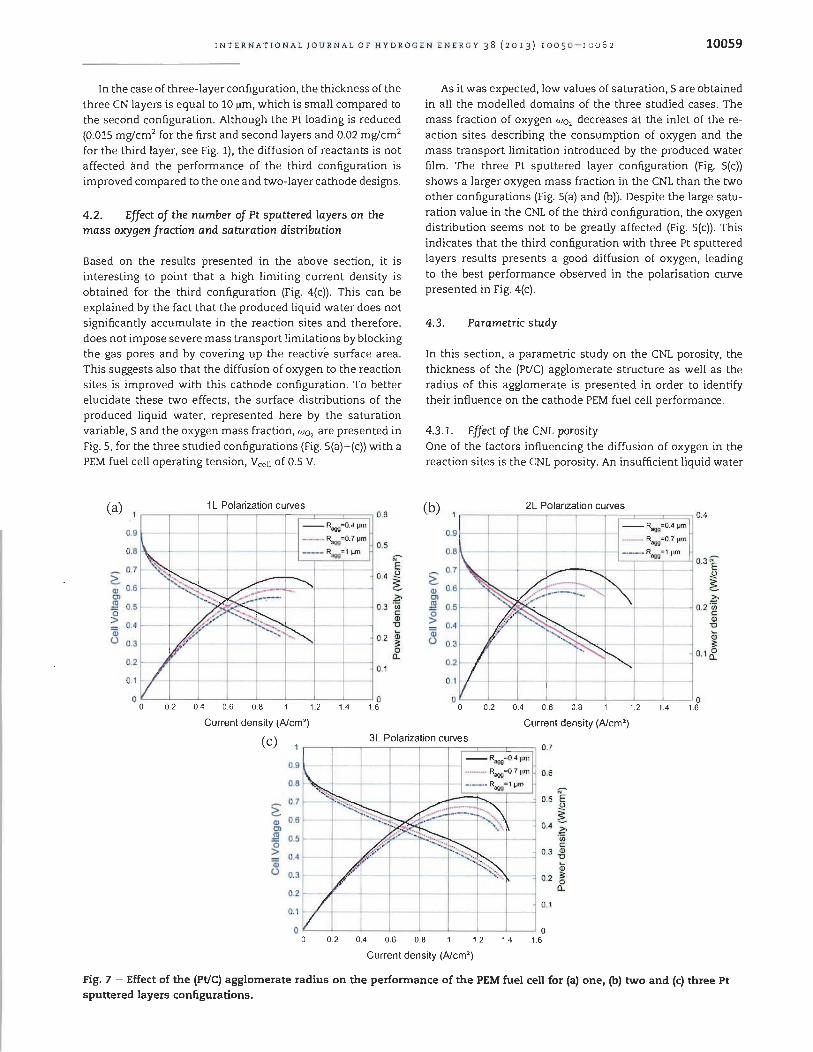
INTERNATIONAL JOURNAL OF HYDROGEN ENERGY 38 (20 1 3) 10050 - 10062 10059
In the case of three-layer configuration, the thickness of the three CN layers is equal to 10 ~m, which is sma11 compared to the second configuration. Although the Pt loading is reduced (0.015 mglcm2 for the first and second layers and 0.02 mglcm2
for the third layer, see Fig. 1), the diffusion of reactants is not affected ànd the performance of the third configuration is improved compared to the one and two-layer cathode designs.
4.2. Effect of the number of Pt sputtered layers on the mass 0XYgen fraction and saturation distribution
Based on the results presented in the above section, It IS
interesting to point that a high limiting current density is obtained for the third configuration (Fig. 4(c». This can be explained by the fact that the produced liquid water does not significantly accumula te in the reaction sites and therefore, does not impose severe mass transport limitations by blocking the gas pores and by covering up the reactive surface area. This suggests also that the diffusion of oxygen to the reaction sites is improved with this cathode configuration. To better elucidate these two effects, the surface distributions of the produced liquid water, represented here by the saturation variable, S and the oxygen mass fraction, wo, are presented in Fig. S, for the three studied configurations (Fig. 5(a)-(c» with a PEM fuel ceH operating tension, VeeU of 0.5 V.
(a) 1 L Polarization curves 1 ~-r--r--r--r--rr=====~ 0.6
0.9
0.8
~ 0.7 ;::. Q) 0.6 Cl S 0.5
~ 0.4 Qi Ü 0.3
0.2
0. 1
0.2 0.4 0.6 0.8 1.2 1.4
Current density (A/cm')
0.5
Ë <..l
0.4 ~
.?;-0.3 ,n
c: Q) "0
0.2 Qi 3: 0 a.
0.1
0 1.6
As it was expected,low values of saturation, Sare obtained in a11 the mode11ed do mains of the three studied cases. The mass fraction of oxygen Wo, decreases at the inlet of the reaction sites describing the consumption of oxygen and the mass transport limitation introduced by the produced water film. The three Pt sputtered layer configuration (Fig. 5(c» shows a larger oxygen mass fraction in the CNL than the two other configurations (Fig. 5(a) and (b» . Despite the large saturation value in the CNL of the third configuration, the oxygen distribution seems not to be greatly affected (Fig. 5(c» . This indicates that the third configuration with three Pt sputtered layers results presents a good diffusion of oxygen, leading to the best performance observed in the polarisation curve presented in Fig. 4(c).
4.3. Parametric study
In this section, a parametric study on the CNL porosity, the thickness of the (Pt/e) agglomerate structure as we11 as the radius of this agglomerate is presented in order to identify their influence on the cathode PEM fuel ceH performance.
4.3 .1. Effect of the CNL porosity One of the factors influencing the diffusion of oxygen in the reaction sites is the CNL porosity. An insufficient liquid water
(b) 2L Polarization curves 1 0.4
0.9
0.8 03'f
~ <..l
~ Q) Cl .?;-~ 0.2,n 0 c: > Q)
"0 Qi Qi Ü 3:
0.1&
0.1
0 0.2 0.4 0.6 0.8 1.2 1.4 1.6
Current density (A/cm')
(c) 3L Polarization curves
0.9
0.8
0.1
l',----'-,-,-,---;:====~ 0.7
0.6
0.5 Ë
~ 0.4 .?;-,n
c: 0.3 ~
Qi 0.2 ~
a. 0.1
L-__ ~ __ ~ __ _L __ ~ __ -J ____ L-__ ~ __ ~ O
0.2 0.4 0.6 0.8 1.2 1.4 1.6
Current density (A/cm')
Fig. 7 - Effect of the (Pt/C) agglomerate radius on the performance of the PEM fuel cell for (a) one, (b) two and (c) three Pt sputtered layers configurations.
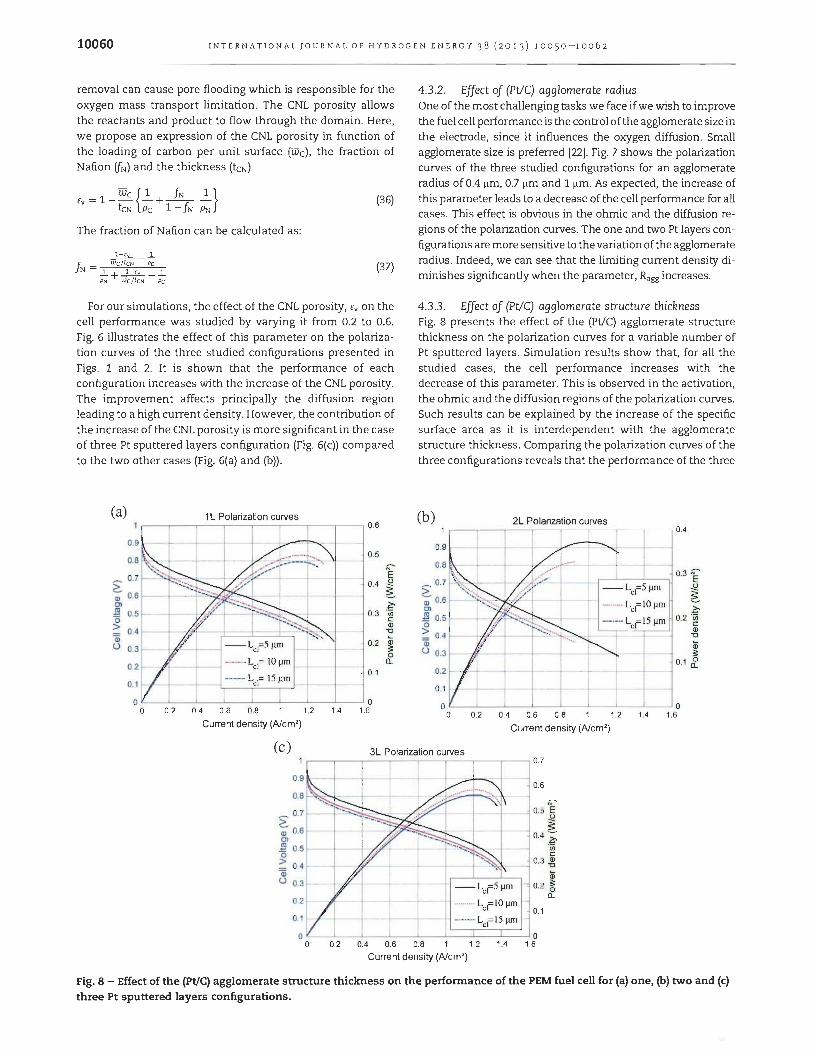
10060 INTERNATIONAL JOURNAL OF HYDROGEN ENERGY 38 (2013) 10050-10062
removal can cause pore flooding which is responsible for the oxygen mass transport limitation. The CNL porosity aUows the reactants and product to flow through the domain. Here, we propose an expression of the CNL porosity in function of the loading of carbon per unit surface (WC) , the fraction of Nafion (fN) and the thickness (teN)
(36)
The fraction of Nafion can be calculated as:
...!.=.fx...._.1. f _ WC/tcN Pc J N - .1. + _1-'. _ .1.
PN WC / tOl Pc
(37)
For our simulations, the effect of the CNL porosity, Ev on the ceU performance was studied by varying it from 0.2 to 0.6. Fig. 6 illustrates the effect of this parame ter on the polarization curves of the three studied configurations presented in Figs. 1 and 2. It is shown that the performance of each configuration increases with the increase of the CNL porosity. The improvement affects principaUy the diffusion region leading to a high current density. However, the contribution of the increase of the CNL porosity is more significant in the case of three Pt sputtered layers configuration (Fig. 6(c)) compared to the two other cases (Fig. 6(a) and (b)).
(a) 1 L Polanzation curves ,..--~-~-~-~---,--,---.,---, 0.6
0.9 ---t 1
i ~: ~tF~(~~~~ ~~ :: 1 --- ~-----1---- -.-.-.- LcF 10 ).lm --1------ _____ &.
1 _____ L = 15 jlI11 i ----~-_TC:.cl -_,_-".---i---.--.-.... --.....
0.1
0.1
o 0 o 0.2 0.4 0.6 0.8 1.2 1.4 1.6
Current density (A/cm2)
4.3.2. Effect of (Pue) agglomerate radius One of the most chaUenging tasks we face if we wish to improve the fuel ceU performance is the control of the agglomerate size in the electrode, since it influences the oxygen diffusion. SmaU agglomerate size is preferred [22). Fig. 7 shows the polarization curves of the three studied configurations for an agglomerate radius of 0.4 ~m, 0.7 ~m and 1 ~m. As expected, the increase of this parameter leads to a decrease of the ceU performance for al! cases. This effect is obvious in the ohmic and the diffusion regions of the polarization curves. The one and two Pt layers configura tions are more sen si tive to the variation of the agglomerate radius. Indeed, we can see that the limiting current density diminishes significantly when the parameter, Ragg increases.
4.3.3 . Effect of (Pue) agglomerate structure thickness Fig. 8 presents the effect of the (Pt/e) agglomerate structure thickness on the polarization curves for a variable number of Pt sputtered layers. Simulation results show that, for aU the studied cases, the ceU performance increases with the decrease of this parameter. This is observed in the activation, the ohmic and the diffusion regions of the polarization curves. Such results can be explained by the increase of the specific surface area as it is interdependent with the agglomerate structure thickness. Comparing the polarization curves of the three configurations reveals that the performance of the three
(b)
0.9
2L Polanzation curves ,----,--~-~-~--~-~-__,___-_, 0.4
,----'-_-'--_~ 0.3 'f -- L
C1=5 ).lm
.......... Lcl=lO).lm
, . i . i . .
~ .?;-
0.2 'u; c: a> "0
Qi ~
0.1 &.
0.1 - ·-t---~;_·_-~·_---t-_·_··_+--+---t • 1 1 : ! : 1
' ! ! ! O L-_i-_-L_-'--_~ __ L-_~_~ __ O o 0.2 0.4 0.6 0.8 1 1.2 1.4 1.6
Current density (A/cm2)
(c) 3L Polanzation curves ,..--,---,---,----"T--,--,--,----_, 0.7
~ 0.7 G-a> 0.6 . 0> ;
1)1 0.5 ------.J-···--·····f-·· o . . > 0.4 Qi Ü 0.3
0.2
0.1
0.6
0.5 Ë
~ 0.4.?;-
'u; c:
0.3 ~
Qi 0.2 ~
Cl. .......... Lcl=IO~ .
0.1 - .-.-.- L
cl= 15 ~
o 0 o 0.2 0.4 0.6 0.8 1 1.2 1.4 1.6
Current density (A/cm2)
Fig. 8 - Effect of the (pt/C) agglomerate structure thickness on the performance of the PEM fuel cell for (a) one, (b) two and (c) three Pt sputtered layers configurations.

INTERNATIONAL JOURNAL OF HYDROGEN ENERGY 38 (2013) 10050-10062 10061
Pt sputtered layers configuration is still better than the ones of one and two Pt sputtered layers configurations. For these two last cases, the diffusion region is affected dramatically by the increase of the agglomerate structure thickness.
5. Conclusion
The performance of a PEM fuel cell cathode using 0.05 mg/cm2
platinum loading was studied numerically. The mathematical model including electrochemical reactions and species and charges transport equations was applied to three cathode configurations where the platinum is assumed to be sputtered in one, two and three layers on the top of the CNL. A validation study showed that our model is able to reproduce accurately the experimental results . The configuration with three Pt sputtered layers has better performance than the two other studied configurations, suggesting that the catalyst is being optimally used. Thus, low loading of platinum with the three catalyst layer design is feasible without adverse effect on the cell performance. A parametric study proved also that the performance of the cathode is function of the CNL porosity, the agglomerate radius and the thickness of this agglomerate structure. The present results will be useful for the design of practical PEM fuel cell cathodes.
Acknowledgement
This work was financially supported by National Resources and Engineering Research Council of Canada (NSERC).
Nomenclature
Deff IJ
water activity
specifie reaction surface area per volume of catalyst layer, cm- 1
catalyst surface area per unit mass of the catalyst particles, cm2fg effective diffusion coefficient of species j in phase i, cm2 S- l
bulk diffusion coefficient of species j in phase i, m2 S- l
equilibrium thermodynamic potential, V Faraday constant, 96,493, C molt Nafion volume fraction in the carbon-Nafion layer exchange CUITent density, A cm- 2
cathode local CUITent density, A cm- 2
cathode reference exchange CUITent density, A cm- 2
absolute permeability, m2
relative permeability of gas diffuser, m2
relative permeability of liquid water, m2
condensation rate constant, S- l
evaporation rate constant, Pa- 1 ç1
length of the catalyst layer, cm molecuiar weight, kg mol- 1
catalyst platinum mass loading per unit area on the catalyst, g cm- 2
N
n
P Ri
R
Rw
rc re RH,o(I) Rohmic
S T
w
Wc
xo, Xj
Yw %Pt
flux, kg m - 3 S- l
electrons produced in the cathodic reaction pressure, Pa the reaction source term for species i, kg m- 3 ç1
gas constant, J mol- 1 K- 1
interfacial mass-transfer rate of water between liquid and water vapour, kg m- 3 ç 1
rate of condensation, kg m- 3 ç 1
rate of evaporation, kg m- 3 S- l
source term ofliquid water at reaction site, kg m- 3 ç1
oh mie resistance, n cm- 2
saturation temperature, K
gas velocity, m ç1
thickness of CN, m cell voltage, V
water velo city, m S- l
weight fraction density of carbon per unit area oxygen molar fraction molar fraction of species j mole fraction of liquid water mass percentage of platinum catalyst on the support carbon black
Greek letters Cl
(J
p
Wi
net drag coefficient in the membrane transfer coefficient for oxygen reduction liquid fraction of water density, kg m- 3
weight fraction of species i surface tension, N m- 1
effective electrolyte conductivity, S cm- 1
O'~ff effective solid phase conductivity, S cm- 1
EN volume fraction of ion omer Es solid phase volume fraction O'm Nafion membrane or ionomer conductivity, S cm- 1
À water content in ionomer l1c overvoltage, V
1/> potential, V
W mass fraction J-Lg dynamic viscosity of phase of gas, kg m- 1
ç1
}.Lw dynamic viscosity of phase liquid water, kg m- 1 ç1
Pw density, kg m- 3
Ev void species Oc contact or wetting angle
Superscripts eff effective value of a parameter mem membrane sat saturation s solid CN carbon-Nafion ref reference cons condensation cell cell Pt platinum
Subscripts 0 2 oxygen H20 (g) water vapour

10062 INTERNATIONAL JOURNAL OF HYDROGEN ENERGY 38 (2013) 10050-10062
H20 (1) liquid water N2 nitrogen N Nafion i,j phase index, species index w water act activation T, P ternperature, pressure rg gas region rI liquid region c carbon, capillary e equilibriurn condition, electron cl catalyst layer
g gas phase H2 hydrogen
REFERENCES
[1] Djilali N, Sui PC. Transport phenomena in fuel ceUs: from microscale to macroscale. International Journal of Computational Fluid Dynamics 2008;22:115- 33.
[2] SecaneU M, Carnes B, Suleman A, Djilali N. Numerical optimization of proton exchange membrane fuel ceU cathodes. Electrochimica Acta 2007;52:2668- 82.
[3] SecaneU M, Karan K, Suleman A, Djilali N. Multi-variable optimization of PEMFC cathodes using an agglomerate model. Electrochimica Acta 2007;52:6318- 37.
[4] Litster S, McLean G. PEM fuel ceU electrodes. Journal of Power Sources 2004;130:61- 76.
[5] TicianeUi EA, Derouin CR, Redondo A, Srinivasan S. Methods to advance technology of proton exchange membrane fuel ceUs. Journal of Electrochemical Society 1988;135:2209- 14.
[6] Cheng X, Yi B, Han M, Zhang J, Qiao Y, Yu J. Investigation of platinum utilization and morphology in catalyst layer of polymer electrolyte fuel ceUs. Journal of Power Sources 1999;79:75- 81.
[7] Paganin VA, Ticianelli EA, Gonzalez ER. Development and electrochemical studies of gas diffusion electrodes for polymer electrolyte fuel ceUs. Journal of Applied Electrochemistry 1996;26:297- 304.
[8] Hirano S, Kim J, Srinivasan S. High performance proton exchange membrane fuel ceUs with sputter-deposited Pt layer electrodes. Electrochimica Acta 1997;42:1587- 93.
[9] O'Hayre R, Lee S-J, Cha S-W, Prinz FB. A sharp peak in the performance of sputtered platinum fuel ceUs at ultra-Iow
platinum loading. Journal of Power Sources 2002;109:483- 93.
[10] Ticianelli RA, Derouin CR, Srinivasan S. Localization of platinum in low catalyst loading electrodes to to attain high power densities in SPE fuel ceUs. Journal of Electroanalytical Chemistry 1988;251:275- 95.
[11] Cha SY, Lee WM. Performance of proton exchange membrane fuel ceU electrodes prepared by direct deposition of ultrathin platinum on the membrane surface. Journal of Electrochemical Society 1999;146:4055- 60.
[12] Natarajan SK, Hamelin J. High performance anode for polymer electrolyte membrane fuel ceUs by multiple-layer Pt sputter deposition. Journal of Power Sources 2010;195:7574- 7.
[13] Rao RM, Rengaswamy R. Dynamic characteristics of spherical agglomerate for study of cathode catalyst layers in proton exchange membrane fuel ceUs (PEMFC). Journal of Power Sources 2006;158:110- 23.
[14] Bird RB, Stewart WE, Lightfoot EN. Transport phenomena. New York, NY: John Wiley & Sons; 1960.
[15] Sun W, Peppley BA, Karan K. An improved two-dimensional agglomerate cathode model to study the influence of catalyst layer structural parameters. Electrochimica Acta 2005;50:3359- 74.
[16] Nam JH, Kaviany M. Effective diffusivity and watersaturation distribution in single- and two-Iayer PEMFC diffusion medium. International Journal of Heat Mass Transfer 2003;46:4595- 611.
[17] Natarajan D, Van Nguyen T. Three-dimensional effects of liquid water flooding in the cathode of a PEM fuel ceU. Journal of Power Sources 2003;115:66- 80.
[18] Rao RM, Bhattacharyya D, Rengaswamy R, Choudhury SR. A two-dimensional steady state model including the effect of liquid water for a PEM fuel ceU cathode. Journal of Power Sources 2007;173:375- 93.
[19] O'Hayre R, Cha S-W, ColeUa W, Prinz FB. Fuel ceU fundamentals. New York, NY: John Wiley & Sons; 2006.
[20] Wang G, Mukherjee PP, Wang C- Y. Optimization of polymer electrolyte fuel ceU cathode catalyst layers via direct numerical simulation modeling. Electrochimica Acta 2007 ;52:6367- 77.
[21] Harvey D, Pharoah JG, Karan K. A comparison of different approaches to modelling the PEMFC catalyst layer. Journal of Power Sources 2008;179:209-19.
[22] Sammes N. Fuel ceU technology: reaching towards commercialization. London: Springer-Verlag; 2006.
[23] Song D, Wang Q, Liu Z, Navessin T, Eikerling M, Holdcroft S. Numerical optimization study of the catalyst layer of PEM fuel ceU cathode. Journal of Power Sources 2004;126:104- 11.

47
Présentation du deuxième article
Au cours de ce deuxième article, nous nous sommes intéressés à la conception de trois
différentes configurations de l'électrode cathodique d'une pile PEM, à structure
multicouche, et aux tests de leurs performances. Ces configurations contiennent
respectivement une, deux et trois couches de platine (pt) d'une densité de 0.05 mg/cm2,
pulvérisées sur la couche microporeuse de diffusion des gaz, en présence ou non de
couches inter-faciales de carbone-Nafion (CN) et de carbone-polytetrafluoroethylene
(CPTFE). La comparaison des courbes de polarisation de ces trois configurations à révélé
que le fonctionnement de l'électrode cathodique est optimal en présence de trois couches
de platine. Par la suite, cette configuration est sélectionnée pour évaluer l'effet de la
présence du CN et du CPTFE entre les couches de Pt sur la performance de l'électrode
cathodique. Les mesures des courbes de polarisation ont montré que de hautes densités de
courant limite peuvent être obtenues avec des pourcentages massiques de Nafion et de
PTFE de, respectivement, de 34.8 %pds et 16.9% pds. Afin de comprendre les
mécanismes derrière cette amélioration de performance à faible quantité de Pt, les
différentes configurations des électrodes conçues ont été caractérisées par la méthode de
balayage à microscopie électronique et des mesures de voltamétrie cyclique ont été
réalisées. Nos résultats ont montré que la formation d'agglomérats de platine favorise la
réaction de réduction de l'oxygène au niveau de la cathode, ce qui se traduit par son bon
fonctionnement.
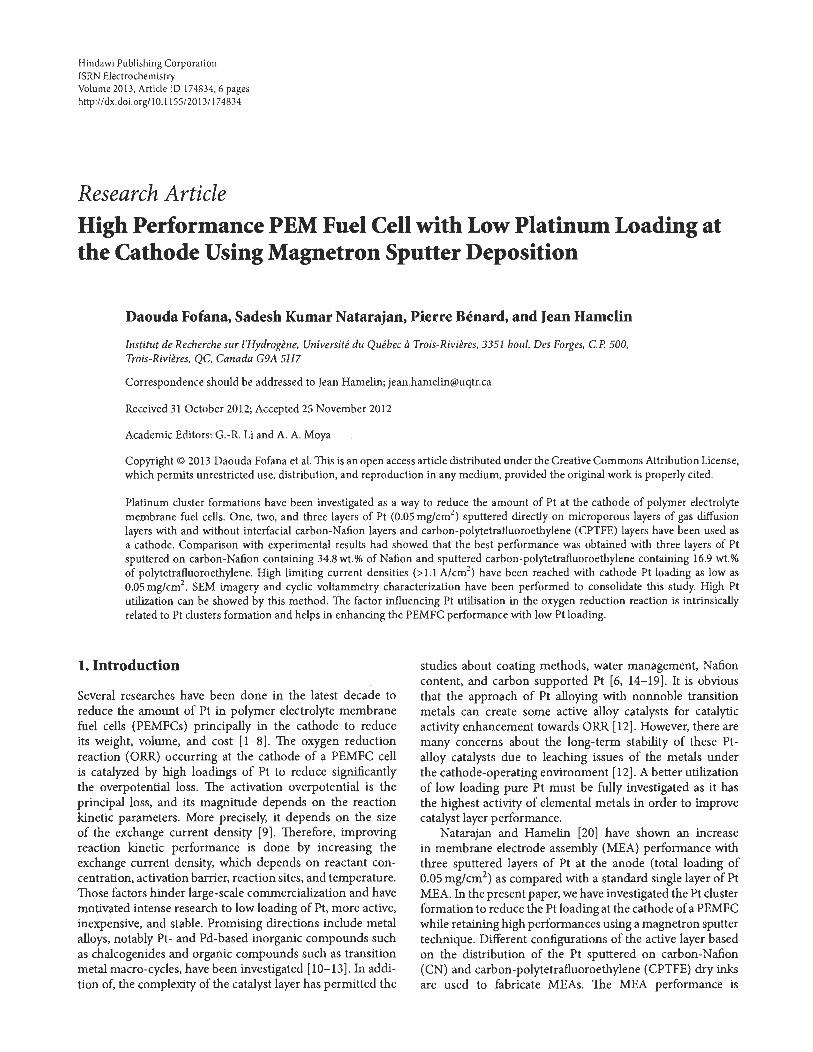
Hindawi Publishing Corporation ISRN Electrochemistry Volume 2013, Article ID 174834, 6 pages http://dx.doLorg/I0.1155/20 13/174834
Research Article High Performance PEM Fuel Cell with Low Platinum Loading at the Cathode Using Magnetron Sputter Deposition
Daouda Fofana, Sadesh Kumar Natarajan, Pierre Bénard, and Jean Hamelin
Institut de Recherche sur l'Hydrogène, Université du Québec à Trois-Rivières, 3351 boul. Des Forges, c.P. 500, Trois-Rivières, QC, Canada G9A 5H7
Correspondence should be addressed to Jean Hamelin; [email protected]
Received 31 October 2012; Accepted 25 November 2012
Academic Editors: G.-R. Li and A. A. Moya
Copyright © 2013 Daouda Fofana et al. This is an open access article distributed under the Creative Commons Attribution License, which permits unrestricted use, distribution, and reproduction in any medium, provided the original work is properly cited.
Platinum cluster formations have been investigated as a way to reduce the amount of Pt at the cathode of polymer electrolyte membrane fuel ceUs. One, two, and three layers of Pt (0.05 mg/cm2
) sputtered directly on microporous layers of gas diffusion layers with and without interfacial carbon-Nation layers and carbon-polytetrafluoroethylene (CPTFE) layers have been used as a cathode. Comparison with experimental results had showed that the best performance was obtained with three layers of Pt sputtered on carbon-Nation containing 34.8 wt.% of Nation and sputtered carbon-polytetrafluoroethylene containing 16.9 wt.% of polytetrafluoroethylene. High limiting current densities (>1.1 Ncm2
) have been reached with cathode Pt loading as low as 0.05 mg/cm2
• SEM imagery and cyelic voltammetry characterization have been performed to consolidate this study. High Pt utilization can be showed by this method. The factor influencing Pt utilisation in the oxygen reduction reaction is intrinsical1y related to Pt clusters formation and helps in enhancing the PEMFC performance with low Pt loading.
1. Introduction
Several researches have been done in the latest decade to reduce the amount of Pt in polymer electrolyte membrane fuel cells (PEMFCs) principally in the cathode to reduce its weight, volume, and cost [1-8]. The oxygen reduction reaction (ORR) occurring at the cathode of a PEMFC cell is catalyzed by high loadings of Pt to reduce significantly the overpotential loss. The activation overpotential is the principal loss, and its magnitude depends on the reaction kinetic parameters. More precisely, it depends on the size of the exchange current density [9]. Therefore, improving reaction kinetic performance is done by increasing the exchange current density, which depends on reactant concentration' activation barrier, reaction sites, and temperature. Those factors hinder large-scale commercialization and have motivated intense research to low loading of Pt, more active, inexpensive, and stable. Promising directions include metal alloys, notably Pt- and Pd-based inorganic compounds such as chalcogenides and organic compounds such as transition metal macro-cycles, have been investigated [10-13]. In addition of, the complexity of the catalyst layer has permitted the
studies about coating methods, water management, Nafion content, and carbon supported Pt [6, 14-19]. It is obvious that the approach of Pt alloying with nonnoble transition metals can create sorne active alloy catalysts for catalytic activity enhancement towards ORR [12] . However, there are many concerns about the long-term stability of these Ptalloy catalysts due to leaching issues of the metals under the cathode-operating environment [12]. A better utilization of low loading pure Pt must be fully investigated as it has the highest activity of elemental metals in order to improve catalyst layer performance.
Natarajan and Hamelin [20] have shown an increase in membrane electrode assembly (MEA) performance with three sputtered layers of Pt at the anode (total loading of 0.OSmg/cm2
) as compared with a standard single layer of Pt MEA. In the present paper, we have investigated the Pt cluster formation to reduce the Pt loading at the cathode of a PEMFC while retaining high performances using a magnetron sputter technique. Different configurations of the active layer based on the distribution of the Pt sputtered on carbon-Nafion (CN) and carbon-polytetrafluoroethylene (CPTFE) dry inks are used to fabricate MEAs. The MEA performance is
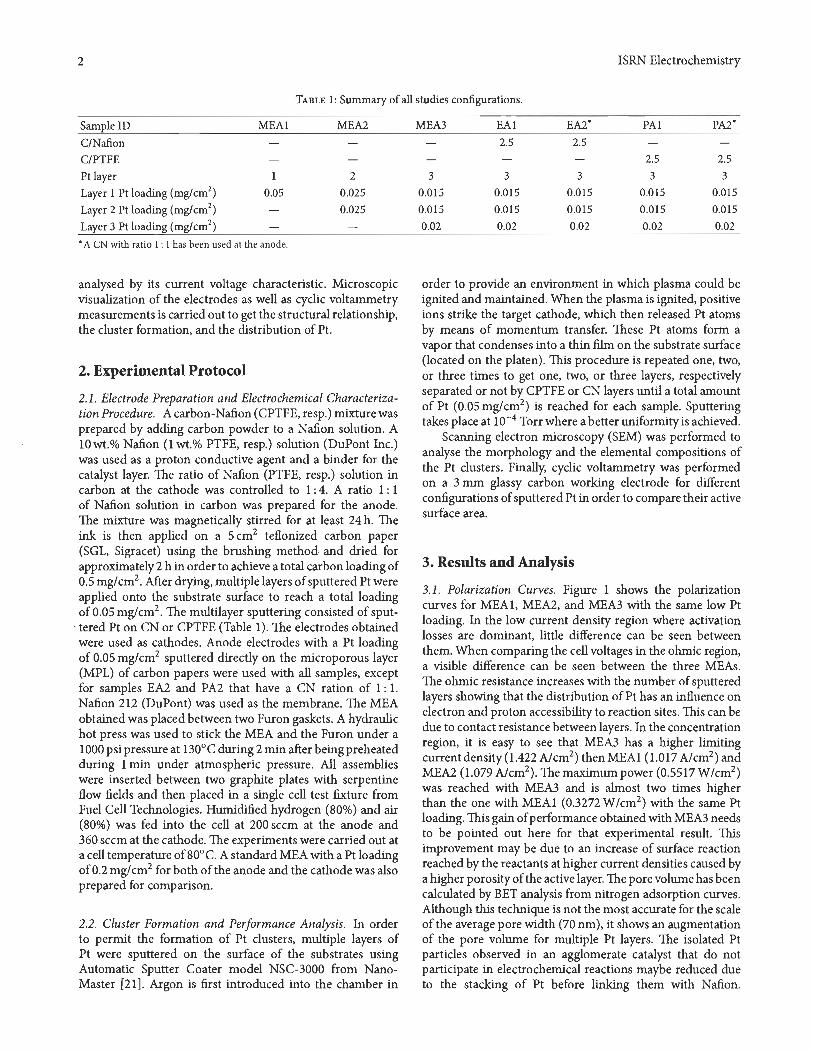
2 ISRN Electrochemistry
TABLE 1: Summary of all studies configurations.
Sample ID
C/NafÏon
C/PTFE
Pt layer
Layer 1 Pt loading (mg/cm2)
Layer 2 Pt loading (mg/cm2)
Layer 3 Pt loading (mg/cm2)
MEAl
1
0.05
, A eN with ratio 1 : 1 has been used at the anode.
MEA2
2
0.025
0.025
analysed by its current voltage characteristie. Mieroscopie visualization of the electrodes as weIl as cyelie voltammetry measurements is carried out to get the structural relationship, the eluster formation, and the distribution of Pt.
2. Experimental Protocol
2.1. Electrode Preparation and Electrochemical Characterization Procedure. A carbon-Nafion (CPTFE, resp.) mixture was prepared by adding carbon powder to a Nafion solution. A lOwt.% Nafion (1 wt.% PTFE, resp.) solution (DuPont Inc.) was used as a proton conductive agent and a binder for the catalyst layer. The ratio of Nafion (PTFE, resp.) solution in carbon at the cathode was controIled to 1: 4. A ratio 1: 1 of Nafion solution in carbon was prepared for the anode. The mixture was magnetieally stirred for at least 24 h . The ink is then applied on a 5 cm2 teflonized carbon paper (SGL, Sigracet) using the brushing method and dried for approximately 2 h in order to achieve a total carbon loading of 0.5 mglcm2
. After drying, multiple layers of sputtered Pt were applied onto the substrate surface to reach a total loading of 0.05 mglcm2. The multilayer sputtering consisted of sput-
. tered Pt on CN or CPTFE (Table 1). The electrodes obtained were used as cathodes. Anode electrodes with a Pt loading of 0.05 mglcm2 sputtered directIy on the microporous layer (MPL) of carbon papers were used with all samples, except for samples EA2 and PA2 that have a CN ration of 1: l. Nafion 212 (DuPont) was used as the membrane. The MEA obtained was placed between two Furon gaskets. A hydraulie hot press was used to stiek the MEA and the Furon under a 1000 psi pressure at 1300 C during 2 min after being preheated during 1 min under atmospherie pressure. AlI assemblies were inserted between two graphite plates with serpentine flow fields and then placed in a single ceIl test fixture from Fuel Cell Technologies. Humidified hydrogen (80%) and air (80%) was fed into the ceIl at 200 sccm at the anode and 360 sccm at the cathode. The experiments were carried out at a cell temperature of 800 C. A standard MEA with a Pt loading of 0.2 mgl cm2 for both of the anode and the cathode was also prepared for comparison.
2.2. Cluster Formation and Performance Analysis. In order to permit the formation of Pt elusters, multiple layers of Pt were sputtered on the surface of the substrates using Automatie Sputter Coater model NSC-3000 from NanoMaster [21] . Argon is first introduced into the chamber in
MEA3
3
O.DlS O.DlS .
0.02
EAI
2.5
3
O.DlS O.DlS 0.02
EA2'
2.5
3
O.DlS O.DlS 0.02
PAl PA2'
2.5 2.5
3 3
O.DlS O.DlS O.DlS O.DlS 0.02 0.02
order to provide an environment in which plasma could be ignited and maintained. When the plasma is ignited, positive ions strike the target cathode, whieh then released Pt atoms by means of momentum transfer. These Pt atoms form a vapor that condenses into a thin film on the substrate surface (located on the platen). This procedure is repeated one, two, or three times to get one, two, or three layers, respectively separated or not by CPTFE or CN layers until a total amount of Pt (0.05 mglcm2) is reached for each sample. Sputtering takes place at 10- 4 Torr where a better uniformity is achieved.
Scanning electron microscopy (SEM) was performed to analyse the morphology and the elemental compositions of the Pt elusters. Finally, cyelie voltammetry was performed on a 3 mm glassy carbon working electrode for different configurations of sputtered Pt in order to compare their active surface area.
3. Results and Analysis
3.1. Polarization Curves. Figure 1 shows the polarization curves for MEAl, MEA2, and MEA3 with the same low Pt loading. In the low current density region where activation los ses are dominant, little difference can be seen between them. When comparing the cell voltages in the ohmie region, a visible difference can be seen between the three MEAs. The ohmie resistance increases with the number of sputtered layers showing that the distribution of Pt has an influence on electron and proton accessibility to reaction sites. This can be due to contact resistance between layers. In the concentration region, it is easy to see that MEA3 has a higher limiting current density(1.422 A/cm2 ) thenMEAl (1.017 A/cm2 ) and MEA2 (1.079 A/cm2
). The maximum power (0.5517 W/cm2 )
was reached with MEA3 and is almost two times higher than the one with MEAl (0.3272 W/cm2 ) with the same Pt loading. This gain of performance obtained with MEA3 needs to be pointed out here for that experimental result. This improvement may be due to an increase of surface reaction reached by the reactants at higher current densities caused by a higher porosity of the active layer. The pore volume has been calculated by BET analysis from nitrogen adsorption curves. Although this technique is not the most accurate for the sc ale of the average pore width (70 nm), it shows an augmentation of the pore volume for multiple Pt layers. The isolated Pt partieles observed in an agglomerate catalyst that do not participate in electrochemieal reactions maybe reduced due to the stacking of Pt before linking them with Nafion.
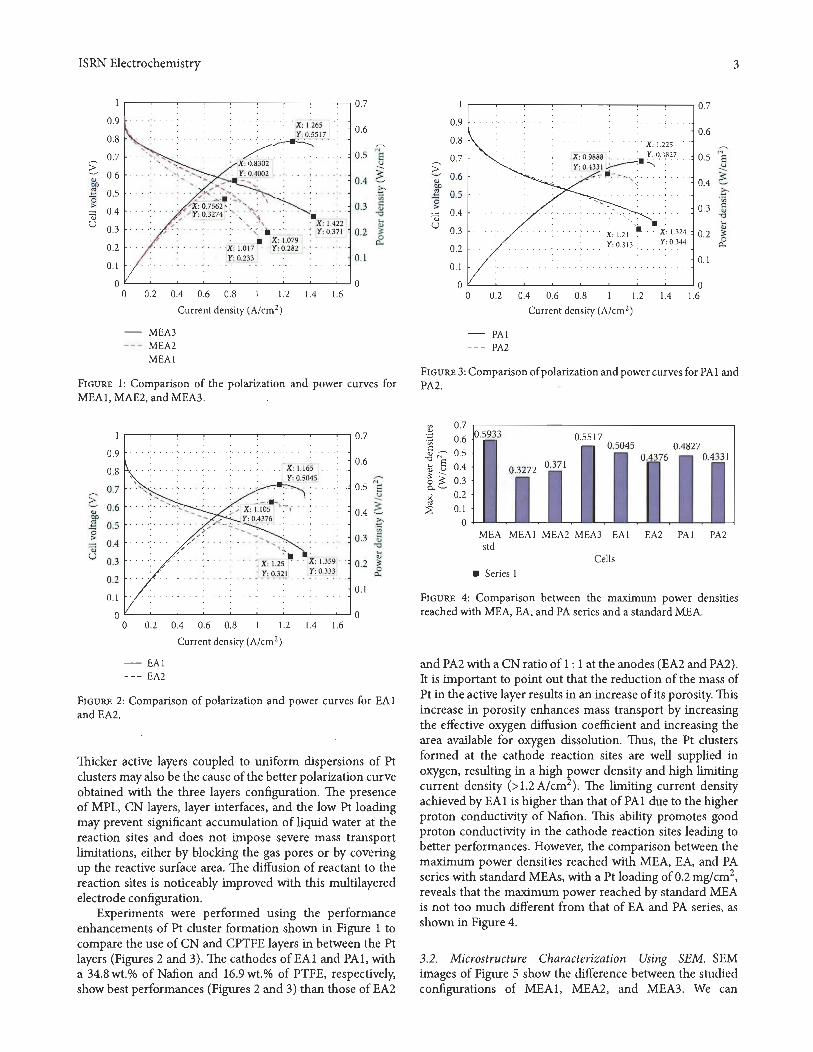
ISRN Electrochemistry
0.9
0.8
0.7 ~ 0.6 .. "" 5 0.5
"0 >
::::l 0.4 .. U 0.3
0.2
0.1
0 0
... ." .... ' . . X : 1 ~265
. . Y: 0.55 17
.. ' ~ ' :', ' .~.~ .. . · .. '.' ><~>:-~<' .~~~~~~ ..• . .. : .. . · . .. ... : . ' ~~ :,.::..;.,:~~ ..... : ..
.. > ;XY: 00 ·37256742 :<'>",,:. ' . ~. ' / .. " , '\ . .
. " , " , . X : 1.422 . /' ............ -- ~ . Il ' . : Y : 0.371
il X: 1.079 ... 'X : 1.017 .. Y : 0.282
Y : 0.233
0.2 0.4 0.6 0.8 1.2 1.4 1.6
MEA3 MEA2 MEA l
Current density (A/cm2)
0.7
0.6
0.5 NE u
0.4 ~ .q
0.3 ë! .. "" ... ..
0.2 ;:: ~
0.1
FIGURE l : Comparison of the polarization and power curves for MEAl, MAE2, and MEA3.
0.9
0.8
0.7
~ 0.6 .. "" '" 0.5 ;g >
0.4 ::::l .. U 0.3
0.2
0.1
0
, , · ., . ,
' ..... ' ... : x: 1.1 65 Y: 0.5045 .. ~ :.
'. ..:.- .• ,-1.:... . . ~~ X: 1.l05 . \
- ~ y . 04376 ' . .
...... ,,>" <>~:~§< ,m Y : 0.333
0 0.2 0.4 0.6 0.8 1.2 1.4 1.6
Current density (A/cm 2)
- EAI --- EA2
0.6
0.5 ë u
0.4 ~ .q
0.3 5 "'" ~ 0.2 ~
0.1
FIGURE 2: Comparison of polarization and power curves for EAI andEA2.
Thicker active layers coupled to uniform dispersions of Pt clusters may also be the cause of the better polarization curve obtained with the three layers configuration. The presence of MPL, CN layers, layer interfaces, and the low Pt loading may prevent significant accumulation of liquid water at the reaction sites and do es not impose severe mass transport limitations, either by blocking the gas pores or by covering up the reactive surface area. The diffusion of reactant to the reaction sites is noticeably improved with this multilayered electrode configuration.
Experiments were performed using the performance enhancements of Pt cluster formation shown in Figure 1 to compare the use of CN and CPTFE layers in between the Pt layers (Figures 2 and 3). The cathodes ofEA1 and PAl, with a 34.8 wt. % of Nafion and 16.9 wt. % of PTFE, respectively, show best performances (Figures 2 and 3) than those of EA2
3
I---:----:-~-~-~-~-~- 0.7
0.9 0.6
0.8 .'. x: 1.225
0.7
~ 0.6 .. "" 5 0.5 ~
0.4 ::::l .. U 0.3
0.2
... X: 0.9888 :. . • Y : 0.4827 Y:0.433 1~~ ·:···
- -:" Il:-:-- .... ,~ .
0.5 NE
~ 0.4 .~
0.3 ~ "'"
• x: 1.324 · 0.2 ~ Y : 0.344 ~
0.1 0.1
0 "----'---'--~'-----'---'-----'-~---.J o 0 0.2 0.4 0.6 0.8 1.2 1.4 1.6
Current density (A/cm2)
- PAl --- PA2
FIGURE 3: Comparison of polarization and power curves for PAl and PA2.
'" 0.7 :~ 0.6
~ ;:;- 0.5 t § 0.4 5 ~ 0.3 p,.~
0.2 0. 1
o
~.5933 0.5517 0.5045
0.3272 0.371
>-MEA MEAl MEA2 MEA3 EAI std
Cells
Series 1
0.4827 0.4376 or
~ EA2 PAl PA2
FIGURE 4: Comparison between the maximum power densities reached with MEA, EA, and PA series and a standard MEA.
and PA2 with a CN ratio of 1 : 1 at the anodes (EA2 and PA2). It is important to point out that the reduction of the mass of Pt in the active layer results in an increase of its porosity. This increase in porosity enhances mass transport by increasing the effective oxygen diffusion coefficient and increasing the area available for oxygen dissolution. Thus, the Pt clusters formed at the cathode reaction sites are well supplied in oxygen, resulting in a high power density and high limiting current density (>1.2A/cm2) . The limiting CUITent density achieved by EA 1 is higher than that of PA 1 due to the higher proton conductivity of Nafion. This ability promotes good proton conductivity in the cathode reaction sites leading to better performances. However, the comparison between the maximum power densities reached with MEA, EA, and PA series with standard MEAs, with a Pt loading of 0.2 mg! cm2,
reveals that the maximum power reached by standard MEA is not too much different from that of EA and PA series, as shown in Figure 4.
3.2. Microstructure Characterization Using SEM. SEM images of Figure 5 show the difference between the studied configurations of MEAl, MEA2, and MEA3. We can
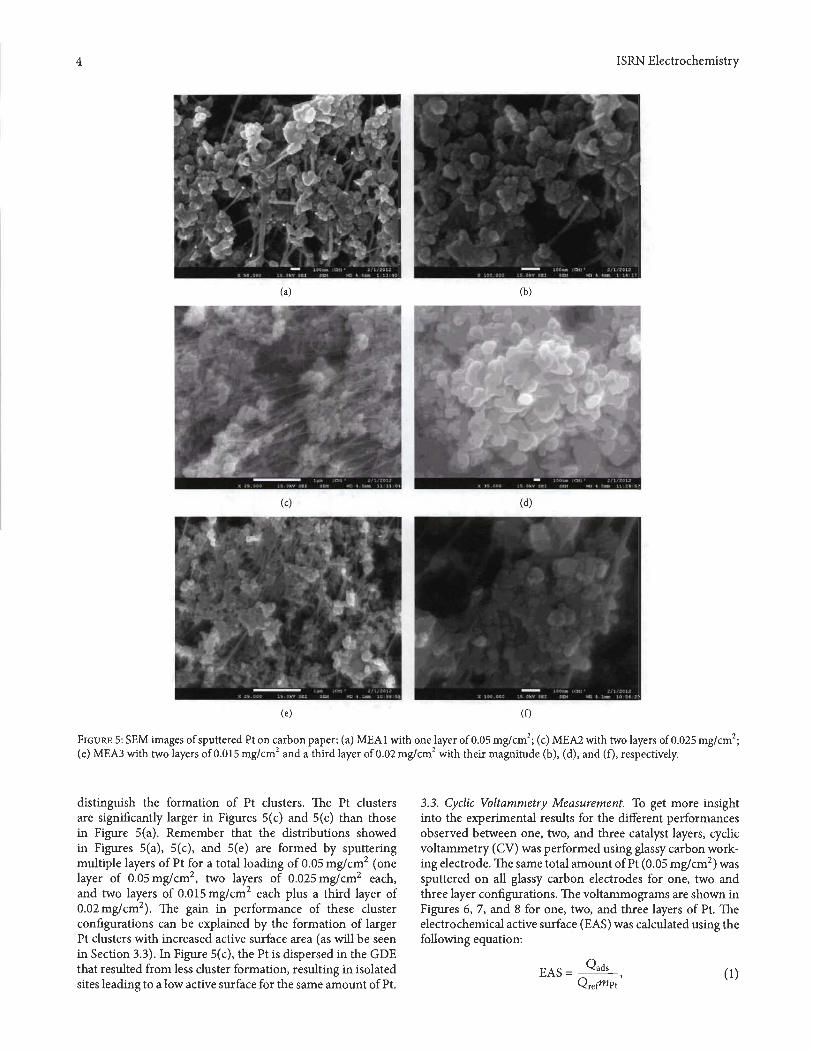
4 ISRN Electrochemistry
(a) (b)
(c) (d)
(e) (f)
FIGURE 5: SEM images of sputtered Pt on carbon paper: (a) MEAl with one layer of 0.05 mg/cm2; (c) MEA2 with two layers of 0.025 mg/cm2
;
(e) MEA3 with two layers of 0.015 mg/cm2 and a third layer of 0.02 mg/cm2 with their magnitude (b), (d), and (f), respectively.
distinguish the formation of Pt elusters. The Pt elusters are significantly larger in Figures 5(c) and 5(e) than those in Figure 5(a). Remember that the distributions showed in Figures 5(a), 5(c), and 5(e) are formed by sputtering multiple layers of Pt for a totalloading of 0.05 mg! cm2 (one layer of 0.05 mg! cm2
, two layers of 0.025 mg! cm2 each, and two layers of 0.015 mg!cm2 each plus a third layer of 0.02mg!cm2 ) . The gain in performance of these eluster configurations can be explained by the formation of larger Pt elusters with increased active surface area (as will be seen in Section 3.3). In Figure 5(c), the Pt is dispersed in the GDE that resulted from less eluster formation, resulting in isolated sites leading to a low active surface for the sarne arnount of Pt.
3.3. Cyclic Voltammetry Measurement. To get more insight into the experimental results for the different performances observed between one, two, and three catalyst layers, cyelie voltammetry (CV) was performed using glassy carbon working electrode. The sarne total arnount of Pt (0.05 mg!cm2 ) was sputtered on all glassy carbon electrodes for one, two and three layer configurations. The voltammograrns are shown in Figures 6, 7, and 8 for one, two, and three layers of Pt. The electrochemieal active surface (EAS) was calculated using the following equation: .
EAS = Q ads ,
QrefmPt (1)

ISRN Electrochemistry 5
TABLE 2: EAS and hydrogen adsorption charge results for different configurations of sputtered Pt.
Height of Pt sputtered (A) Electrochemical active surface (EAS) Hydrogen adsorption charge Glass carbon area
EAS (cm2/g)
223.2 A (0.05 mgtcm2) 52.3176
2*111.6 A (0.05 mgtcm2) 82.7137
2*67 A + 89.2A (0.05 mg/cm2) 142.8164
0.1
0.05 C2hsup = 0.016513 mC
0
-0.05 <' 5 -0.1 ...... 'i: -0.15 ~
C2hinf = 0.061107 mC
... :> U -0.2
-0.25 · IEAS=52.3 176cm2/g 1
-0.3
-0.35 - 0.4 -0.2 o 0.2 0.4 0.6 0.8 1.2
Potential (V)
FIGURE 6: Cyclic voltammograms of one layer of sputtered Pt (0.05 mg/cm2
) on a glassy carbon working electrode of 3 mm in diameter in a solution of 1 M H2S04 under nitrogen atmosphere.
0.15
0.1 = 0.056463 mC
0.05
1 0 ...... 'i: <U -0.05 ... ... :> U
-0.1 C2hinf = 0.066255 mC
-0.15
- 0.2 L-_-'-_---'-__ '--_--'-_--'-__ -'--_--'--_---.J
-0.4 -0.2 0 0.2 0.4 0.6 0.8 1.2
Potential (V)
FIGURE 7: Cyclic voltammograms of two layers of sputtered Pt (2 x 0.025 mgtcm2
) on a glassy carbon working electrode of 3 mm in diameter in a solution of 1 M H2S04 under nitrogen atmosphere.
where Q ads (mClcm2 ) is the mean of charges exchanged during hydrogen adsorption and desorption, Qref takes the numerical value 0.21 mC/cm2 and represents the charge required to oxidize a monolayer of hydrogen, and mpt is the Pt loading (mglcm2) .
Qhm (mClcm2) Qhm1 (mC) S (cm2
)
0.5493 0.0388 0.0707
0.8685 0.0614 0.0707
1.4996 0.1059 0.0707
0.1
0.05
0
<' 5 -0.05 ...... 'i: <U -0.1 ... ... :>
U
-0.15 ...... IEAS = 142.816cm2/gl
-0.2
- 0.25 L-_-'--_--'--_--'-__ '--_-'--_--'--_--'-_--..J
-0.4 -0.2 0 0.2 0.4 0.6 0.8 1.2
Potential (V)
FIGURE 8: Cyclic voltammograms of three layers of sputtered Pt (2 x 0.015 mgtcm2 + 0.02 mgtcm2
) on a glassy carbon working electrode of 3 mm in diameter in a solution of 1 M H2S04 under nitrogen atmosphere.
The analysis of the results shows that the three layers of Pt have a greater electrochemical active surface (EAS) that of one and two layers as presented in Table 2. Those results reflect very well the difference in performance observed between MEAl, MEA2, and MEA3 (Figure 1). Thus, the effective areas for the ORR and HOR are influenced by the manner in which the Pt is distributed on the electrode .
4. Conclusion
The electrochemical characterization of MEA with one, two, and three layers of Pt (totalloading of 0.05 mglcm2) at the cathode showed that the best polarization curve performance was achieved with three layers. High limiting current density could be achieved using Pt cluster formation (>1.1 A/cm2
)
on CN and CPTFE layers between the Pt layers. Higher Pt utilization is responsible for this gaip in performance due to the reduction of isolated sites. The mass transport has been enhanced due to the increase oflimiting current density. The results also show that that the use of carbon-Nafion is better than the use of carbon-PTFE due to the decrease of ohmic loss, suggesting a better proton conductivity of Nafion than that of the PTFE solution. The maximum power reached by the use of CN or PTFE is similar to that obtained from the standard MEA.
6
Acknowledgment
The authors would like to thank the NaturaI Sciences and Engineering Research Council of Canada (NSERC) for their financiaI aid.
References
[1] S. Litster and G. McLean, "PEM fuel ceIl electrodes;' Journal of Power Sources, vol. l30, no. 1-2, pp. 61-76, 2004.
[2] S. Mukerjee, S. Srinivasan, and A. J. Appleby, "Eifect of sputtered film of platinum on low platinum loading electrodes on electrode kinetics of oxygen reduction in proton exchange membrane fuel cells," Electrochimica Acta, vol. 38, no. 12, pp. 1661-1669,1993.
[3] M. S. Wilson and S. Goifesfeld, "High performance catalyzed membranes of ultra-Iow Pt loadings for polymer electrolyte fuel ceIls;' Journal of the Electrochemical Society, vol. l39, no. 2, pp. L28-L30, 1992.
[4] M. S. Wilson, J. A. Valerio, and S. Gottesfeld, "Low platinum loading electrodes for polymer electrolyte fuel ceIls fabricated using thermoplastic ionomers," Electrochimica Acta, vol. 40, no. 3,pp. 355-363,1995.
[5] G. S. Kumar, M. Raja, and S. Parthasarathy, "High performance electrodes with very low platinum loading for polymer electrolyte fuel ceIls," Electrochimica Acta, vol. 40, no. 3, pp. 285-290,1995.
[6] S. Hirano, J. Kim, and S. Srinivasan, "High performance proton exchange membrane fuel ceIls with sputter-deposited Pt layer electrodes;' Electrochimica Acta, vol. 42, no. 10, pp. 1587-1593, 1997.
[7] M. S. Wilson, J. A. Valerio, and S. Gottesfeld, "Low platinum loading electrodes for polymer electrolyte fuel ceIls fabricated using thermoplastic ionomers," Electrochimica Acta, vol. 40, no. 3,pp.355-363,1995.
[8] Z. Qi and A. Kaufman, "Low Pt loading high performance cathodes for PEM fuel ceIls," Journal of Power Sources, vol. ll3, no. l,pp. 37-43,2003.
[9] R. O'Hayre, S. W. Cha, W. ColeIla, and F. B. Prinz, Eds., "Fuel CeIl Fundamentals," John WIley & Sons, New York, NY, USA, 2006.
[10] C. W. B. Bezerra, L. Zhang, K. Lee et al., '~ review of FeNIC and Co-NIC catalysts for the oxygen reduction reaction," Electrochimica Acta, vol. 53, no. 15, pp. 4937-4951, 2008.
[Il] K. Jayasayee, J. A. R. Van Veen, T. G. Manivasagam, S. Celebi, E. J. M. Hensen, and F. A. de Bruijn, "Oxygen reduction reaction (ORR) activity and durability of carbon supported PtM (Co, Ni, Cu) alloys: influence of particle size and non-noble metals," Applied Catalysis B, vol. 1ll-1l2, pp. 515-526, 2012.
[12] Yu, X. Yee, and S. Ye, "Recent advances in activity and durability enhancement of Pt/C catalytic cathode in PEMFC: part 1. Physico-chemical and electronic interaction between Pt and carbon support, and activity enhancement of Pt/C catalyst," Journal of Power Sources, vol. 172, no. l, pp. l33-144, 2007.
[l3] Yu, X. Yee, and S. Ye, "Recent advances in activity and durability enhancement of Pt/C catalytic cathode in PEMFC: part II: degradation mechanism and durability enhancement of carbon supported platinum catalyst;' Journal of Power Sources, vol. 172, no. l,pp. 145-154,2007.
[14] M. Kim, J. N . Park, H. Kim, S. Song, and W. H . Lee, "The preparation of PtlC catalysts using various carbon materials for
ISRN Electrochemistry
the cathode of PEMFC;' Journal of Power Sources, vol. 163, no. l,pp. 93-97,2006.
[15] 1. Futma, S. GÜller, and A. Albostan, "Research article preparation and characterization of membrane electrode assembly (MEA) for PEMFC;' International Journal of Energy Research, vol. 35, no. 2, pp. 146-152,2011.
[16] L. Giorgi, E. Antolini, A. Pozio, and E. Passalacqua, "Influence of the PTFE content in the diffusion layer of low-Pt loading electrodes for polymer electrolyte fuel cells;' Electrochimica Acta, vol. 43, no. 24, pp. 3675-3680, 1998.
[17] E. Slavcheva, G. Topalov, G. Ganske, 1. Radev, E. Lefterova, and U. Schnakenberg, "Influence of sputtering pressure on surface structure and oxygen reduction reaction catalytic activity of thin platinum films," Electrochimica Acta, vol. 55, no. 28, pp. 8992-8997,2010.
[18] K. L. Huang, Y. C. Lai, and C. H. Tsai, "Eifects of sputtering parameters on the performance of electrodes fabricated for proton exchange membrane fuel ceIls," Journal of Power Sources, vol. 156, no. 2, pp. 224-231, 2006.
[19] R. P. Ramasamy, "Fuel ceIls-proton-exchange membrane fuel ceIls 1 membrane-electrode assemblies;' Encyclopedia ofElectrochemical Power Sources, pp. 787-805, 2009.
[20] S. K. Natarajan and J. Hamelin, "High-performance anode for polymer electrolyte membrane fuel ceIls by multiple-layer Pt sputter deposition; Journal of Power Sources, vol. 195, no. 22, pp. 7574-7577,2010.
[21] Nano Master, http://www.nanomaster.com/.
49
Présentation du troisième article
Le troisième article présente une étude expérimentale du fonctionnement de l'électrode
cathodique de la pile à combustible de type PEM. Pareillement au deux autres premiers
articles, nous cherchons à réduire la quantité de platine utilisée au niveau de la cathode
tout en optimisant son fonctionnement, et ceci en se basant sur la technique de
pulvérisation sous vide.
Pour une même charge de platine, les configurations des électrodes cathodiques à une,
deux et trois couches de platine sont réétudiées mais cette fois en variant le nombre et la
distribution de couches de carbone-Nafion (CN) qui les séparent. Les courbes de
polarisation des différentes configurations ont été mesurées et comparées, mettant en
évidence l'effet bénéfique de la présence du CN sur le fonctionnement de la cathode. Les
densités de courant et les puissances correspondantes à toutes ces configurations ont été
déterminées, permettant d'identifier les configurations résultant en un fonctionnement
optimal de la cathode. La technique de balayage à microscopie électronique et la
voltamétrie cyclique ont été également utilisées pour comparer les différentes structures
des électrodes conçues et de comprendre les mécanismes responsables de l'amélioration
de leurs performances.
Low platinum high performance PEM fuel ceU m~ltilayer cathode catalyst using sputtering deposition technique
Daouda Fofana, Sadesh Kumar Natarajan, Jean Hamelin, Pierre Benard
Institut de recherche sur l'hydrogène, Université du Québec à Trois-Rivières, 3351 boul. Des Forges, c.P. 500, Trois-Rivières (QC), Canada, G9A 5H7
Abstract
PEMFC multilayer cathode electrodes were prepared using sputter deposition technique to provide more efficient oxygen reduction with low loading Pt of 0.05 mglcm2
and their performanc~s were compared based on their measured polarisation curves. Different configurations of cathode were made by alteming Pt and Carbon-Nafion (CN) ink carefully prepared on gaz diffusion layer containing micro porous layer (MPL). The comparison of the experimental results showed remarkable improvement by doing multilayer electrode by sputtering technique. High limiting current densities over 1.1 Ncm2
, 1.2 Ncm2 and 1.4 Ncm2 were reached whereas maximum powers were in the range of 500 mW/cm2 at 600 mW/cm2
• A CN loading inferior to 0.24 mg /cm2 between each layer is preferred for multilayer electrode. Comparison studies have proved that best performance close to standard membrane electrode assembly (MEA) with platinum loading of 0.2 mglcm2 both at the cathode and the anode sides can be achieved using multilayer cathode electrode.
Keywords: PEMFC; Multilayer; Carbone-Nafion; MPL; Sputtering; Performance;
1. Introduction
According to the state-of-the-art technology, a great progress has been made in the PEMFC research area from the modeling to the experiments [1-12]. The developed models have permitted to understand many phenomena occurring during the PEMFC operation such as diffusion, chemical reaction and flooding process. Experimental studies have permitted to validate the numerical results and to overcome many difficulties related to the PEMFC design. The cost of Pt and the water management in the PEM fuel cell are . two of the dominating factors that prevent its commercialization [13, 14]. Let us mention for example, the excessive amount of Pt use in the cathode to reduce the overpotential loss. The oxygen reduction reaction (ORR) occurring at the cathode is central to this promising technology. The kinetic of the cathode ORR is relatively slow compared to that of the anode, releasing to a large overpotential which contributes more in the total cell voltage. The challenge is to carefully balance the platinum loading, reactant diffusivity, ionic and electrical conductivity, and the level of hydrophobicity to ensure good performance using low loading Pt in the cathode.
Extensive works on PEM fuel cell research have widely studied the ORR [15-17] and the low loading Pt [18-21] has been the main focus. The importance and the effect of the Nafion, PTFE, and carbon loadings on cathode performance have been examined [22-25]. An optimal carbon, Nafion and PTFE loadings are required to not affect the ORR
1

processes and influence the activity of the catalyst. An extensive research for more active, inexpensive, and stable replacement of Pt has also been carried out. Promising direction inc1uding metal Pt alloys and Pd-based has been investigated [17, 26, 27]. It is obvious that the approach of Pt alloying with non-noble transition metals can create sorne active alloy catalysts for catalytic activity enhancement towards the ORR [17]. However, there are many concems about the long-term stability of these Pt-alloy catalysts due to the leaching issue of the non-noble metals under the cathode-operating environment [17]. Amount of that, the complexity of the catalyst layer has permitted the studies about the coating methods to enhance the ORR [11, 21, 28, 29]. A variety of techniques and procedures have been developed for the preparation of catalyst layers (CLs) and they can broadly be c1assified into four categories: bound electrode methods, thins-film methods, vapour deposition methods and electrochemical methods [29]. Each of these has its own specificity in the way they can improve performance.
However, among these progresses, sputtering technique is one of the promising methods to fulfi1 the requirement for successful large-scale commercialization of PEM fuel cells. The aim of the present work is to investigate how a series of Pt and CN layers can improve the behaviour of the cathode catalyst of PEM fuel cells. These structures are built by sputtering technique using low Pt loading (0.05mg/cm2
). Great effort has been put on Pt distribution and utilisation in the presence of CN layers to achieve high catalyst performance. Different configurations of active layer based on the distribution of the Pt sputtered on the CN ink are used to fabricate the membrane-electrode-assembly (MEA). The MEAs performance have been analysed and compared based on the current voltage characteristics. While hydrogen reaction is very quick compared to the cathode, the Pt loading was fixed to 0.05 mg/cm2 by sputtering technique for the entire sample. A fuel cell test system is used to measure the performance of the prepared MEA.
2. Electrodes preparations and sputtering technique
Electrodes preparations Carbon-Nafion mixture was prepared by adding Nafion™ solution (Dupont Inc.) and
carbon powder (Vulcan XC72R) in a tube. A 10 wt% Nafion™ solution was used as the proton conductive agent and binder for the catalyst layer. The ratio of Nafion solution in carbon powder was controlled to 1 :2.5 at the cathode. The mixture was magnetically stirred with a magnetic stir bar for at least 24hr. The ink was coated on 5 cm2 of a teflonised carbon paper (SGL, Sigracet) using broaching method and dried for about 2hr to achieve a total carbon loading of 0.5 mg/cm2
• After drying, a multiple layer sputtering was applied on the substrate surface to reach a Pt loading of 0.05 mg/cm2 . The multilayer sputtering consisted of multi short sputtered Pt on carbon-Nafion (Table 1). The loading of CN between each layer of a multilayer electrode is 0.7 mg/cm2 divided by the number of CN layers. The obtained electrode was used as a cathode. Other electrodes with a Pt loading of 0.05 mg/cm2 sputtered on carbon paper were used as the anode for the entire sample. Nafion 212 (DuPont) was used as the membrane. The membrane electrodes assemblies (MEA) obtained are placed between two Furon gaskets. A hydraulic hot press was used to stick the MEA and the Furon under 1000 psi pressure at 130 oC during 2rnn after pre-heated during 1rnn at atmospheric pressure. Each assembly was inserted between two graphite plates with serpentine grooves, and then placed in a single cell test
2
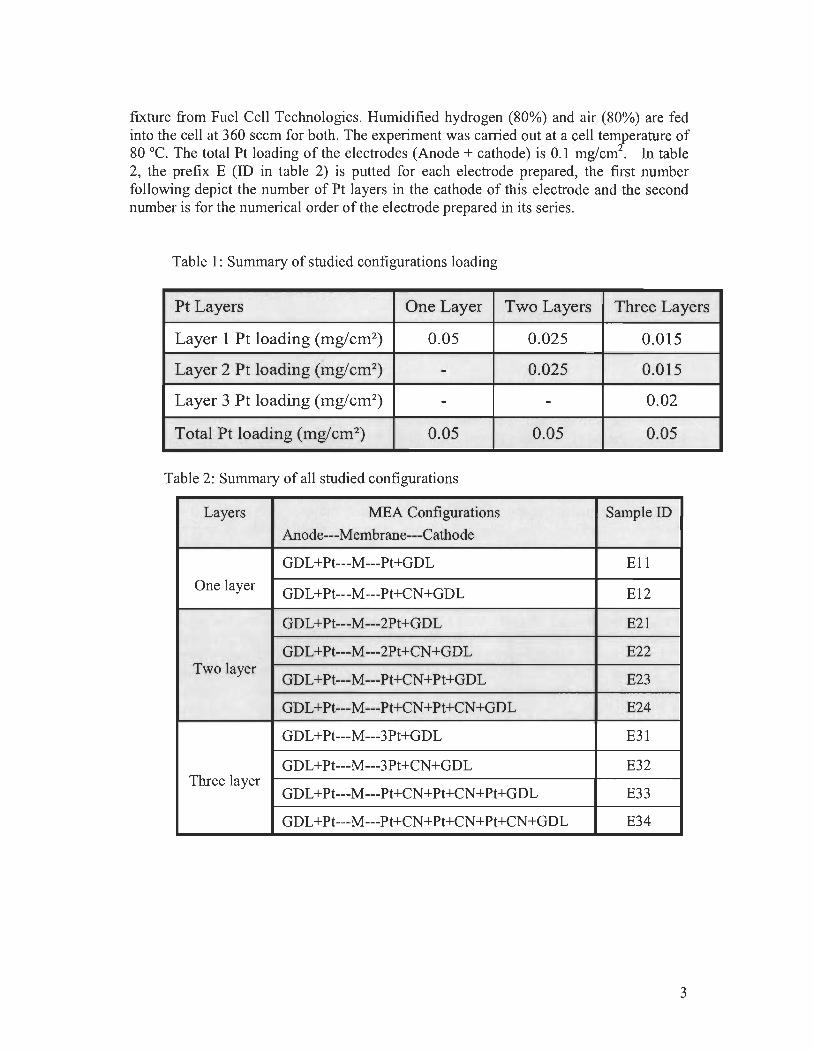
fixture from Fuel Cell Technologies. Humidified hydrogen (80%) and air (80%) are fed into the cell at 360 sccm for both. The experiment was carried out at a cell temperature of 80 oc. The total Pt loading of the electrodes (Anode + cathode) is 0.1 mg/cm. In table 2, the prefix E (ID in table 2) is putted for each electrode prepared, the first number following depict the number of Pt layers in the cathode of this electrode and the second number is for the numerical order of the electrode prepared in its series.
Table 1: Summary of studied configurations loading
Pt Layers One Layer Two Layers Three Layers
Layer 1 Pt loading (mglcm2) 0.05 0.025 0.015
Layer 2 Pt loading (mglcm2) - 0.025 0.015
Layer 3 Pt loading (mglcm2) - - 0.02
Total Pt loading (mglcm2) 0.05 0.05 0.05
Table 2: Summary of aIl studied configurations
Layers MEA Configurations Sample ID
Anode---Membrane---Cathode
GDL+Pt---M---Pt+GDL EII
One layer GDL+Pt---M---Pt+CN+GDL El2
GDL+Pt---M---2Pt+GDL E21
GDL+Pt---M---2Pt+CN+GDL E22 Two layer
GDL+Pt---M---Pt+CN+Pt+GDL E23
GDL+Pt---M---Pt+CN+Pt+CN+GDL E24
GDL+Pt---M---3Pt+GDL E31
GDL+Pt---M---3Pt+CN+GDL E32 Three layer
GDL+Pt---M---Pt+CN+Pt+CN+Pt+GDL E33
GDL+Pt---M---Pt+CN+Pt+CN+Pt+CN+GDL E34
3
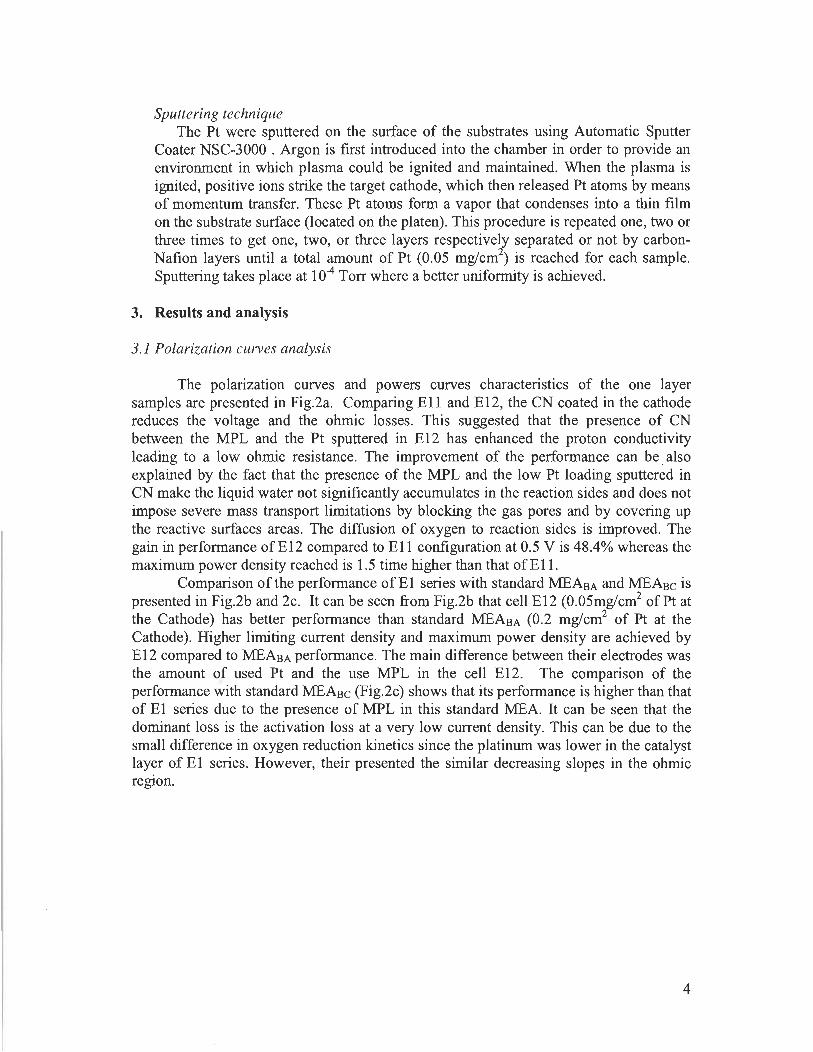
Sputtering technique The Pt were sputtered on the surface of the substrates using Automatic Sputter
Coater NSC-3000 . Argon is first introduced into the chamber in order to provide an environment in which plasma could be ignited and maintained. When the plasma is ignited, positive ions strike the target cathode, which then released Pt atoms by me ans of momentum transfer. These Pt atoms form a vapor that condenses into a thin film on the substrate surface (located on the platen). This procedure is repeated one, two or three times to get one, two, or three layers respectively separated or not by carbonNafion layers until a total amount of Pt (0.05 mg/cm2
) is reached for each sample. Sputtering takes place at 10-4 Torr where a better uniforrnity is achieved.
3. ResuUs and analysis
3.1 Polarization curves analysis
The polarization curves and powers curves characteristics of the one layer samples are presented in Fig.2a. Comparing EII and E12, the CN coated in the cathode reduces the voltage and the ohmic losses. This suggested that the presence of CN between the MPL and the Pt sputtered in E 12 has enhanced the proton conductivity leading to a 10w ohmic resistance. The improvement of the performance can be _ also explained by the fact that the presence of the MPL and the low Pt 10ading sputtered in CN make the liquid water not significantly accumulates in the reaction sides and does not impose severe mass transport limitations by blocking the gas pores and by covering up the reactive surfaces areas. The diffusion of oxygen to reaction sides is improved. The -gain in performance ofE12 compared to Ell configuration at 0.5 Vis 48.4% whereas the maximum power density reached is 1.5 time higher than that ofEll .
Comparison of the performance of El series with standard MEABA and MEABC is presented in Fig.2b and 2c. It can be seen from. Fig.2b that cell E12 (0.05mg/cm2 of Pt at the Cathode) has better performance than standard MEABA (0.2 mg/cm2 of Pt at the Cathode). Higher limiting CUITent density and maximum power density are achieved by E12 compared to MEABA performance. The main difference between their electrodes was the amount of used Pt and the use MPL in the cell E12. The comparison of the performance with standard MEABC (Fig.2c) shows that its performance is higher than that of El series due to the presence of MPL in this standard MEA. It can be seen that the dominant loss is the activation loss at a very low current density. This can be due to the small difference in oxygen reduction kinetics since the platinum was lower in the catalyst layer of El series. However, their presented the similar decreasing slopes in the ohmic reglOn.
4
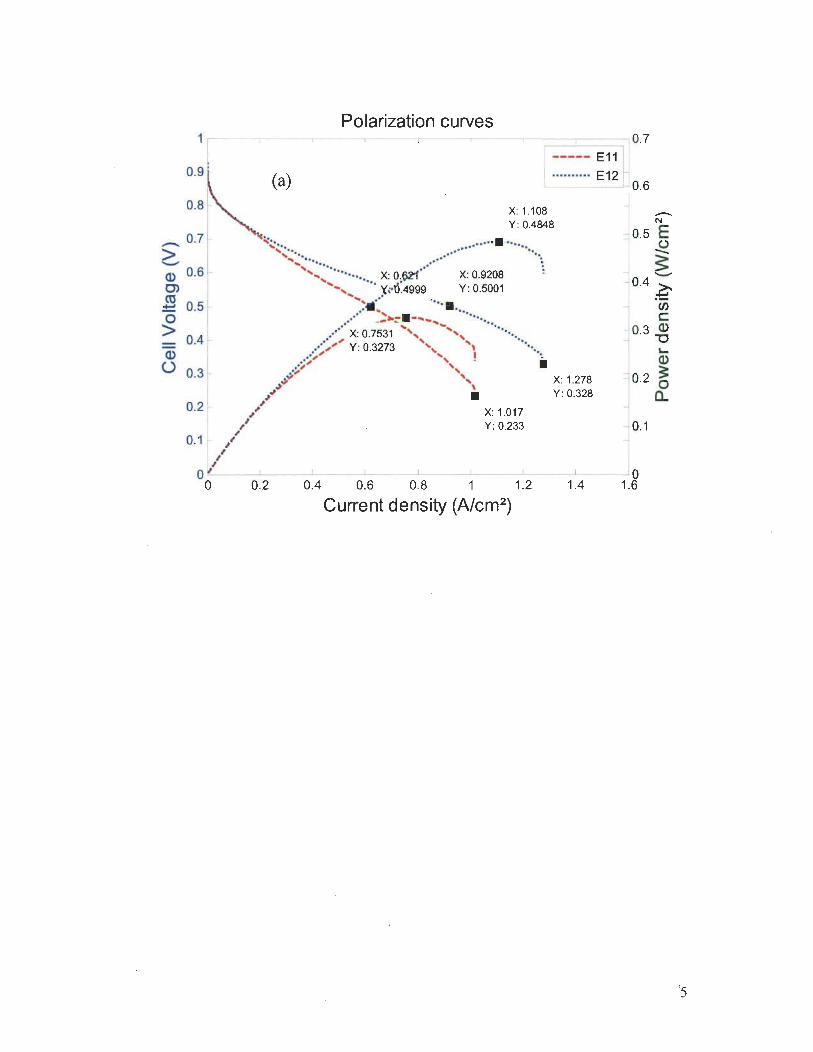
Polarization curves
0.9\
10.7 i
1----- El1 l 1 , .......... E12 "0.6 (a)
0.8
_ 0.7
G ID 0.6 C> rn :!: 05 g.
0.4 ID () 0.3
X: 1.108 Y: 0.4848
:':;:.. . .....• .... ,~...... ........ . .... .
, ••• .* ..
... ,<~........... X: 0.{)21'····· x: 0.9208 :
..... , ", " .·tf4999 Y: 0.5001 ' ........ .. - 'e. ...... ..... ,.-. -.. . •........ .. - ... - .... , .... ,.. . ....
•••• X: 0.7531 ', "", ••••• / ' " ~ •• -,,' Y: 0.3273 ...... \ ••••
.e; ',1 .. •• 0;' " . •
$; , ~~ , X: 1.278
i ' ~ Y: 0.328
0.2 ~ " X: 1.017 Y: 0.233 ,/'
0.1 ~ "
"
-~ 0 . 5 ~ ~
0.4 ~ Cf) c
0.3 ID '"0
~ 02 J -i 0.1 j
ok" 10 o 0.2 0.4 0.6 0.8 1 1.2 1.4 1.6
Current density (A/cm2)
'5
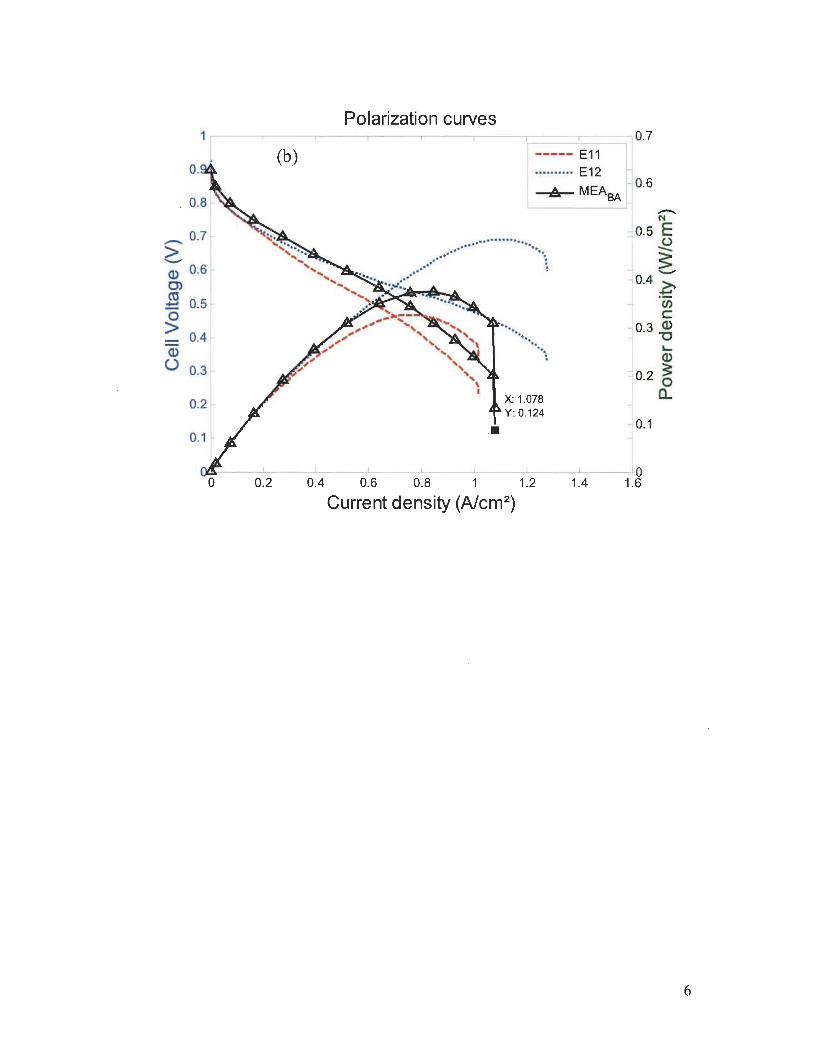
_ 0.7
G Q) 0.6 0> ni ~ 0.5 o > ID Ü
0.4
0.3
0.2
(b)
Polarization curves
... ..:::.
r 1 10.7 1 ----- E11
.... ~ .... ~~2A ~ 0.6 ---z:z-- BA
...................... ....... ..~
....... ;
"
...
" '. '" ' . ... ~
X: 1.078 Y : 0.124
-N
=1 0.5 E ~
, ~ -" 0.4 ~
""1 CI) c:
jO.3 ~ ID
1 0.2 ~ CL
--" 0.1
~ ____ -L ____ -L ____ ~ ____ ~ ____ ~ ____ ~ ____ ~L-__ ~O
° 0.2 0.4 0.6 0.8 1 1.2 1.4 1.6
Current density (A1cm2)
6

Polarization curves 1 I,----------r--~--___._--___._--___,_--_.__--_____,_--~I 0.7
_ 0.7
G-a> 0.6 0> m :: 0.5 o > -a> Ü
0.4
0.3
0.2
(c) ----- E11 .. ; ....... E12 "1
--&- MEABC
l O.6
• X: 1.268 Y : 0.204
-N
~ 0.5 ~ --1 ~ --1 0.4 ~
~03~ L-
a> :1 0.2 ~
a.. 1 ~ 0. 1
~--~---~--~--~--~--~--~--~to o 0.2 0.4 0.6 0.8 1 1.2 1.4 1.6
Current density (A/cm2)
Fig.2. Comparison of polarization and power curves of El series: a) (EII and EI2), b) with standard MEABA and c) with standard MEABC
Fig. 3a shows the cUITent-voltage and cUITent-power characteristics measured for all E2 series. In theses E2 series electrodes, reasonable performances are obtained. However, the performances of E21, E22 and E23 are better than the performance of E24. This difference may be explained by different mechanisms such as the proton conductivity and the electron and oxygen accessibilities. Comparing the polarization curves of electrode E24 relative to those of the electrodes E21, E22 and E23, its activation loss seems to be the main contribution in this case. Since the activation loss is a strong function of reactant concentrations and exchange CUITent density, the catalyst design does not seem to provide a sufficient accessibility of oxygen to sorne reaction sites. This is due to the two layers of CN coated in the cathode in this configuration. In this case (E24), the configuration seems to provide the worst performance for E2 series with 0.35mg/cm2 of CN loading between each layer of Pt sputtered. An increase in the number of CN layers increases the activation loss. The electrodes E21, E22 and E23 configurations give different limiting current densities. Comparing the limiting CUITent density of those three electrodes, that of E22 (1.36 Ncm2
) is larger than those of E23 (1.267 Ncm2) and E21 (1.079 Ncm2
) . The electrode E22 configuration ensures low barrier for oxygen diffusivity leading to high limiting CUITent density. The coating of one CN layer loading of 0.7 mg/cm2 on top of MPL before the sputtering of two layers of Pt (E22) is preferred to that of CN between the two layers of Pt (E23). The CUITent density at a cell voltage of 0.5V was found to increase significantly throughout the E2 configuration series (Fig.5.). The gain in CUITent density at a cell voltage of 0.5 V from the worst electrode performance of this E2 series
7
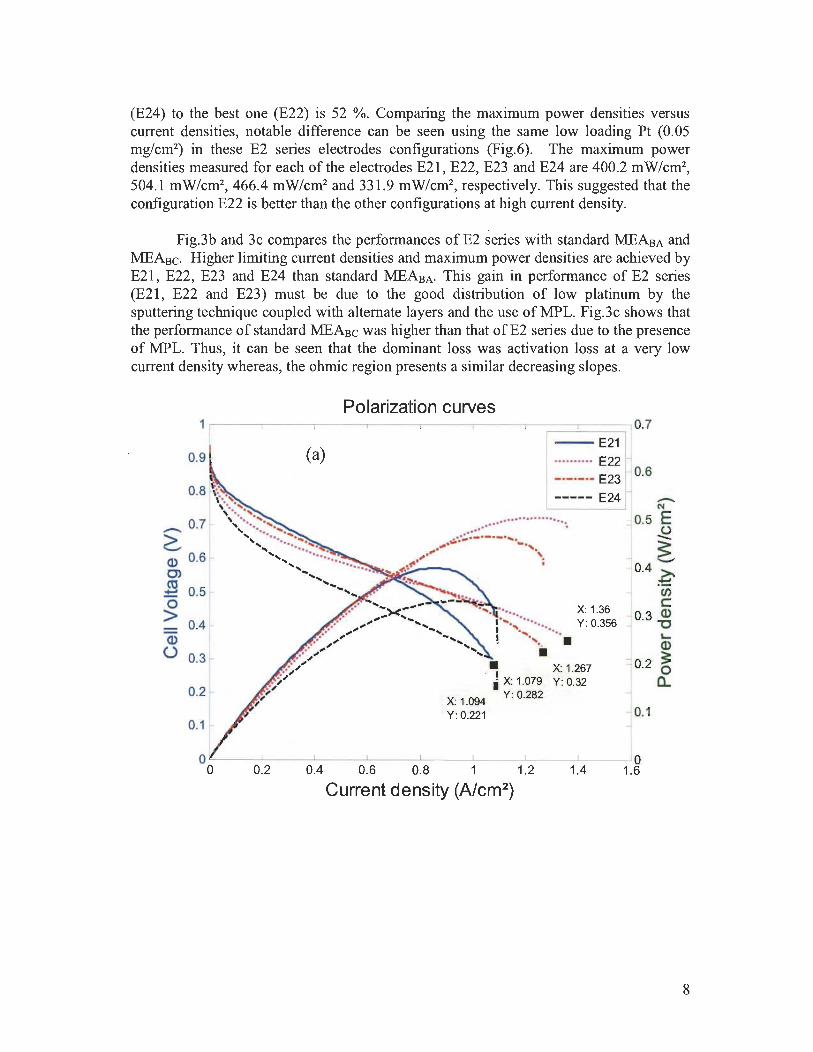
(E24) to the best one (E22) is 52 %. Comparing the maximum power densities versus CUITent densities, notable difference can be seen using the same low loading Pt (0.05 ~g/cm2) in these E2 series electrodes configurations (Fig.6). The maximum power densities measured for each of the electrodes E21, E22, E23 and E24 are 400.2 mW/cm2, 504.1 mW/cm2, 466.4 mW/cm2 and 331.9 mW/cm2, respectively. This suggested that the configuration E22 is better than the other configurations at high CUITent density.
Fig.3b and 3c compares the performances of E2 series with standard MEAsA and MEAsc. Higher limiting CUITent densities and maximum power densities are achieved by E21, E22, E23 and E24 than standard MEAsA. This gain in performance of E2 series (E21 , E22 and E23) must be due to the good distribution of low platinum by the sputtering technique coupled with altemate layers and the use of MPL. Fig.3c shows that the performance of standard MEAsc was higher than that of E2 series due to the presence of MPL. Thus, it can be seen that the dominant loss was activation loss at a very low CUITent density whereas, the ohmic region presents a similar decreasing slopes.
0.9 -
_ 0.7
G (]) 0.6 C> m ~ 0.5 o > (])
Ü
0.4
0.3
0.2
0.1
(a)
Polarization curves
- E21 .......... E22 _._._ .• E23 0.6
----- E24
.
.... ••••• X: 1.36 1'" •••••• Y 0356 1 ...... ••••••• : . ! .... •
ÎI , ~ X: 1.267 i X: 1.079 Y: 0.32
X: 1.094 Y: 0.282
Y: 0.221
-N
0.5 E
~ 0.4 ~
en c
0.3 ~ L-(])
0.2 ~ a..
0.1
O L-----L-----L-----L-----~----~----~----~----~ O o 0.2 0.4 0.6 0.8 1 1.2 1.4 1.6
Current density (A1cm2)
8
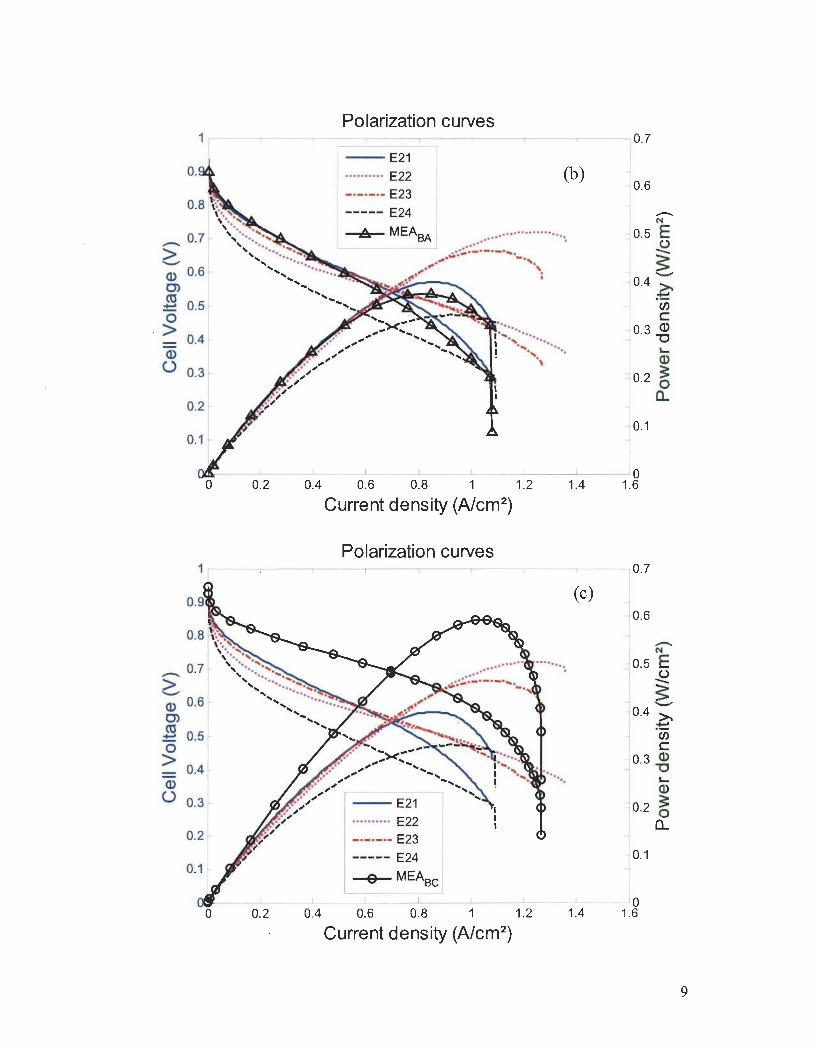
Polarization curves 1 0.7
-- E21 O. .......... E22 (h) -j
-.-.-.- E23 -' 0.6
----- E24 ---Â- MEABA J O.5 Ë
~
~O4~ 0 > 103
Q) 0.4 ' -0
Q) L-
Ü 0.3
t~ 0.2
0.1
10 0 0.2 0.4 0.6 0.8 1 1.2 1.4 1.6
Current density (A/cm2)
Polarization curves 1
1
10.7
(c) ~ O6 l -N
_ 0.7 10.5 ~
> ~ -Q) 0.6 -0> 0.4 >.
S 0:5 ~ Cf)
0 c > 03 Q)
0.4 ' -0 - L-Q) Q)
Ü 0.3 -- E21 ~ 0.2 0 .......... E22 Cl.
0.2 -.-.-.- E23
----- E24 0.1
~MEABC
0 0 0.2 0.4 0.6 0.8 1 1.2 1.4 1.6
Current density (A/cm2)
9

Fig.3. Comparison ofpolarization and power curves ofE2 series: a) (E21, E22, E23 and E24), b) with standard MEABA and c) with standard MEABC
Fig.4a compares cell voltage and power density versus current density for the E3 series configurations. AIl of the three layers configurations have better performance than the two layers ones, regarding their polarization curves. The notable difference which can be singled out from these results is the activation loss contribution. This activation is more pronounced for E32 and E33 configurations. However, no more difference can be seen in their ohmic losses and limiting CUITent densities. It is important to mention that the limiting CUITent density reached for electrodes E31 and E34 configurations is around 1.4 A/cm2 which is a notable improvement using low loading of 0.05mglcm2 Pt comparing to the results presented in literature. The good performance reached by configuration E34 seems to be done by the reduction of CN loading (0.23mglcm2
) in each layer of Pt which tends to approach an agglomerate configuration. Each layer of CN has around 0.23 mg loading separated by low loading Pt layer of 0.15mglcm2
, 0.15mglcm2
and 0.2 mglcm2 from the MPL toward the membrane (Tables 1 and 2). Comparing the polarization curves of E24 and E34 configurations which have 0.35 mglcm2 and 0.23 mglcm2 ofCN loading on each layer, it is c1ear that the CN loading and the quantity of Pt sputtered has to be balanced to achieve a good performance. This fact highlights the importance of carefully balancing the catalyst layer properties such as reactant diffusivity , ionic and electrical conductivity, and the level of hydrophobicity as it is explained very well in the work of Djilali and Sui [31]. The gain in performance for E34 configuration at 0.5V is 116 % relative to the E24 configuration. A totalloading of around 0.23 mglcm2
should be preferred in order to achieve optimal performance in the cathode multilayer electrode. The current densities at cell voltage of 0.5 V for E3 series are 1.057 A/cm2
,
0.8856 A/cm2, 0.8913 A/cm2 and 1.137 A/cm2 for E31 , E32, E33 and E34 respectively.
Regarding the maximum power produced by E3 series, it is interesting to note that E34 configuration has the maximum power density for the E3 series and also for all the E prepared series (Fig.6.).
The comparison of the performances of E3 series with standard MEABA and MEABc is presented in Fig.4b and 4c. It can be seen from Fig.4b that cell E3 series have better performance than standard MEABA. Higher limiting current density and maximum power density are achieved by E3 series compared to standard MEABA. Furthermore, there is a subsequent difference between the standard MEABC performance and E3 series due to the presence of MPL (Fig.4c). It can be seen that the dominant loss is the activation loss at a very low current density. Since the platinum is lower in the catalyst layer of E3 series, the limiting CUITent densities achieved are higher than that of the standard MEABC.
10

11
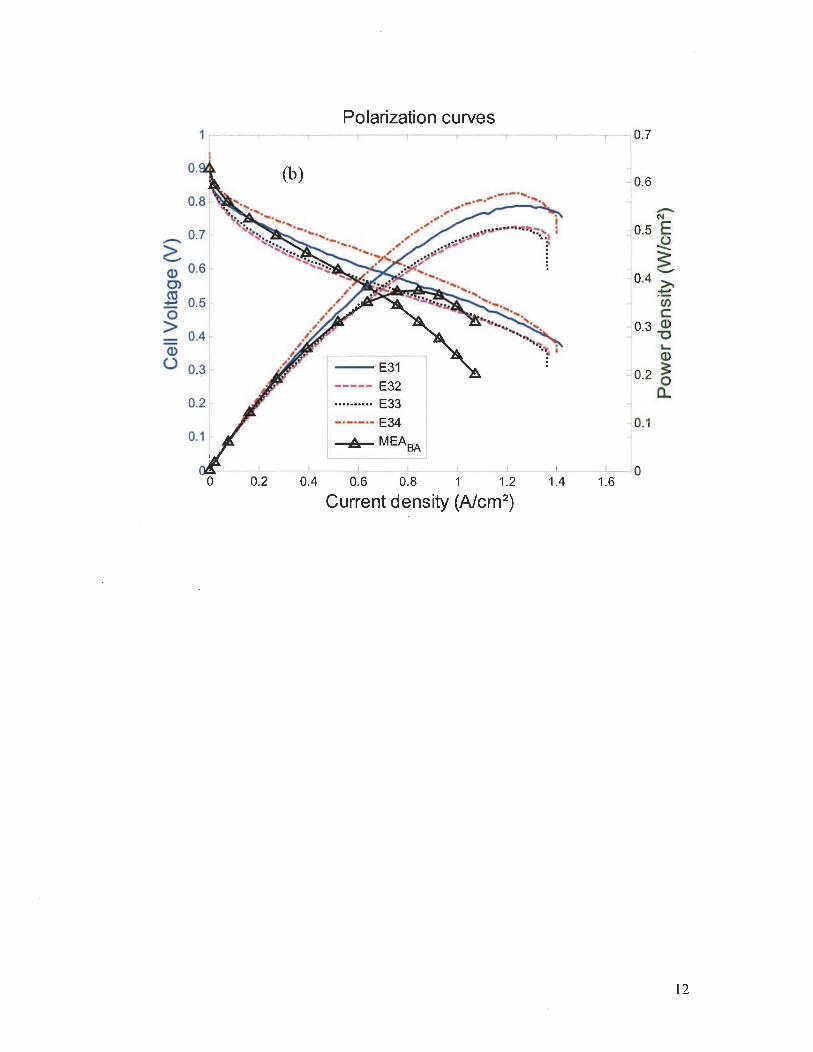
Polarization curves 1 1 r 1
o. (b) 0.6
os t Î .-N
~ 0.5 E .- 0.7 .Q
~ 0.6 l j ~ -Cl --1 0.4 ~ ca :: 0.5
j03 ~ 0 > 0.4 Q) Q) () 0.3 -- E31 ~ 0. 2 ~
----- E32 a. 0.2 .......... E33
-.-.-.• E34 10.1 --A- MEABA
0 0 0.2 0.4 0.6 0.8 1 1.2 1.4 1.6
Current density (A1cm 2)
12

Q) ()
Polarization curves 1 1-,.--------,-------,------.---------,,---------,----.---,------,' 0.7
(c)
0.3
0.2
1-- E31 ----- E32 .......... E33
-.-.-.- E34
jO.6
-i 0.1 1 ~MEABC I
~---~--~--~--~--~--~--~--~Io o 0.2 0.4 0.6 0.8 1 1.2 1.4 1.6
Current density (A1cm2)
Fig.4. Comparison ofpolarization and power curves ofE3 series: a) (E31, E32, E33 and E34), b) with standard MEABA and c) with standard MEABc
E11 E12 E21 E22 E23 E24 E31 E32 E33 E34 MEABA MEABe
Fig.S. Histogram comparing CUITent density versus E series configuration , standard MEA BA and BC at the same voltage of O.SV.
13
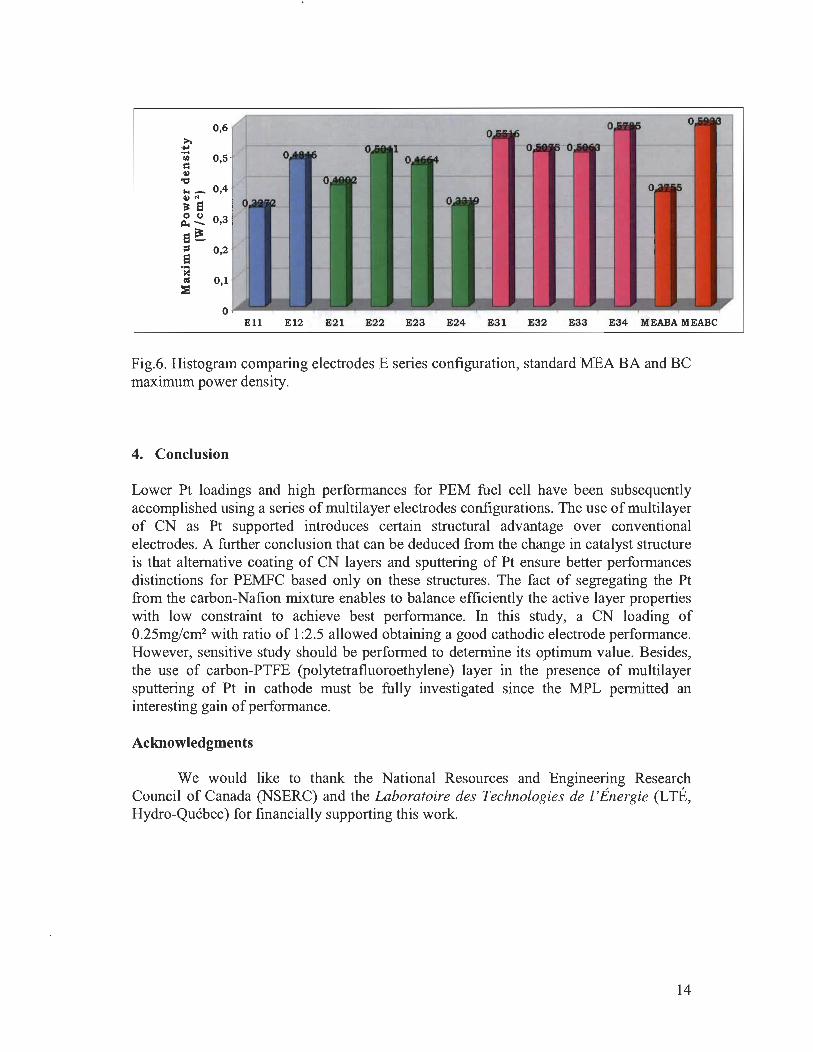
:>. .... .... 0,6
~ 0,5 Q)
't:I .. _ 0,4 Q) "
~ Ei ~~ 0,3
Ei~ a 0,2
.j;l tU 0,1
== o
EU E12 E21 E22 E23 E24 E31 E32 E33 E34 MEABA MEABC
Fig.6. Histogram comparing electrodes E series configuration, standard MEA BA and BC maximum power density.
4. Conclusion
Lower Pt loadings and high performances for PEM fuel cell have been subsequently accomplished using a series of multilayer electrodes configurations. The use of multilayer of CN as Pt supported introduces certain structural advantage over conventional electrodes. A further conclusion that can be deduced from the change in catalyst structure is that alternative coating of CN layers and sputtering of Pt ensure better performances distinctions for PEMFC based only on these structures. The fact of segregating the Pt from the carbon-Nafion mixture enables to balance efficiently the active layer properties with low constraint to achieve best performance. In this study, a CN loading of O.25mg/cm2 with ratio of 1 :2.5 allowed obtaining a good cathodic electrode performance. However, sensitive study should be performed to determine its optimum value. Besides, the use of carbon-PTFE (polytetrafluoroethylene) layer in the presence of multilayer sputtering of Pt in cathode must be fully investigated since the MPL permitted an interesting gain of performance.
Acknowledgments
We would like to thank the National Resources and Engineering Research Council of Canada (NSERC) and the Laboratoire des Technologies de l'Énergie (LTÉ, Hydro-Québec) for fmancially supporting this work.
14

References
[1] Chueh C.C, Secanell M, Bangerth W, Djilali N. Multi-Ievel adaptive simulation of transient two-phase flow in heterogeneous porous media. Computers & Fluids 2010; 39:1585-1596.
[2] Jiao K, Li X. Water transport in polymer electrolyte membrane fuel cells. Progress in Energy and Combustion Science 2011; 37:221-291.
[3] Secanell M, Wishart J, Dobson P. Computational design and optimization of fuel cells and fuel cell systems: A review. J Power Sources 20 Il; 196:3690-3704.
[4] Bird RB, Stewart WB, Lightfoot EN. Transport phenomena. New York, NY: John Wiley & Sons; 1960.
[5] Berning T, Lu DM, Djilali N. Three-dimensional computational analysis of transport phenomena in a PEM fuel cell. J Power Sources 2002; 106: 284-294.
[6] Mezedui- MM, Kaviany M, Moore W. Effect of pore structure, randomness and size on effective mass diffusivity. AIChE J 2002; 48:15-24.
[7] Beming T, Djilali N. A 3D, multiphase, multicomponent model of the cathode and anode of a PEM fuel cell. J The Electrochemical Society 2003 ; 150: A1589-A1598.
[8] Biyikoglu A. Review of proton exchange membrane fuel cell models. Int J Hydrogen Energy 2005; 30:1181-1212.
[9] Yan W-M, Hsueh Ch-Y, Soong Ch-Y, Chen F, Cheng Ch-H, Mei S-Ch. Effects of fabrication processes and material parameters of GDL on cell performance of PEM fuel cell. Int J Hydrogen Energy 2007; 32:4452-4458.
[10] Rajalakshmi N, Dhathathreyan KS. Catalyst layer in PEMFC electrodesFabrication, characterisation and analysis. Chemical Engineering J 2007; 129:31-40.
[11] Prasanna M, Cho EA, Lirn TH, Oh IH. Effects of MEA fabrication method on durability of polymer electrolyte membrane fuel cells. Electrochimica Acta 2008; 53:5434-5441.
[12] Bayrakçeken A, Erkan S, Turker L, Eroglu I. Effects of membrane electrode assembly components on proton exchange membrane fuel cell performance. Int J Hydrogen Energy 2008; 33: 165-170.
[13] Mehta V, Cooper JS. Review and analysis of PEM fuel cell design and manufacturing. J Power Sources 2003 ; 114:32-53.
[14] Abaoud HA, Ghouse M, Lovell KV, Al-Motairy GN. A hybrid technique for fabricating PEMFC's low platinum loading electrodes. Int J Hydrogen Energy 2005; 30:385-391.
[15] Song D, Wang Q, Liu Z, Navessin T, Eikerling M, Holdcroft S. Numerical optimization study of the catalyst layer of PEM fuel cell cathode. J Power Sources 2004; 126:104-111.
[16] Secanell M, Cames B, Suleman A, Djilali N . Numerical optimization of proton exchange membrane fuel cell cathodes. Electrochimica Acta 2007; 52:2668-2682.
[17] Yu X, Ye S. Recent advances in activity and durability enhancement of Pt/C catalytic cathode in PEMFC: Part I. Physico-chemical and electronic interaction between Pt and carbon support, and activity enhancement of PtlC catalyst. J Power Sources 2007; 172:133-144.
15
[18] Z Qi, Kaufman A. Low Pt loading high performance cathodes for PEM fuel cells. J Power Sources 2003; 113:37-43.
[19] Mukerjee S, Srinivasan S, Appleby Al Effect of sputtered film of platinum on low platinum loading e1ectrodes on electrode kinetics of oxygen reduction in proton exchange membrane fuel cells. Electrochimica Acta 1993; 38: 1661-1669.
20] Hirano S, Kim J, Srinivasan S. High performance proton exchange membrane fuel cells with sputter-deposited Pt layer electrodes. Electrochimica Acta 1997; 42:1587-1593.
[21] Huang K-L, Lai Y-Ch, Tsai Ch-Ho Effects of sputtering parameters on the performance of electrodes fabricated for proton exchange membrane fuel cells. J Power Sources 2006; 156:224-231.
[22] Antolini E, Passos RR, Ticianelli EA. Effects of the carbon powder characteristics in the cathode gas diffusion layer on the performance of polymer electrolyte fuel cells. J Power Sources 2002; 109:477-482.
[23] Park S. Lee JW, Popov BN. Effect of carbon loading in microporous layer on PEM fuel cell performance. J Power Sources 2006; 163:357-363.
[24] Lee SJ, Mukerjee S, McBreen J, Rho YW, Kho YT, Lee TH. Èffects of Nafion impregnation on performances of PEMFC electrodes. Electrochimica Acta 1998; 43:3693-3701.
[25] Giorgi L, Antolini E, Pozio A, Passalacqua E. Influence of the PTFE content in the diffusion layer of low-Pt loading electrodes for polymer electrolyte fuel cens. Electrochimica Acta 1998; 43:3675-3680.
[26] Jayasayee K, Rob Van Veen JA, Manivasagam TG, Celebi S, Hensen EJM, de Brujin FA. Oxygen reduction reaction (ORR) activity and durability of carbon supported PtM (Co, Ni, Cu) anoys: Influence of partic1e size and non-noble metals. Applied Catalysis B: Environmental2012; 111-112:515-526.
[27] Bezerra CWB, Zhang L, Lee K, Liu H, Marques ALB, Marques EP, Wang H, Zhang 1 A review of Fe-N/C and Co-N/C catalysts for the oxygen reduction reaction. Electrochimica Acta 2008; 53:4937-4951.
[28] Shin Sl Lee JK, Ha YH, Hong SA, Chun HS, Oh IH. Effect of the catalytic ink preparation method on the performance of polymer electrolyte membrane fuel cells. J Power Sources 2002; 106:146-152.
[29] Ramasamy RP. FUEL CELLS - PROTON-EXCHANGE MEMBRANE FUEL CELLS 1 Membrane-Electrode Assemblies. Encyc10pedia of Electrochemical Power Sources 2009; 787-805.
[30] Djilali N, Sui Pc. Transport phenomena in fuel cens: from microscale to macroscale. Int J Computational Fluid Dynamics 2008; 22:115-133 .
16

51
Présentation du quatrième article
Au cours de cet article, nous nous sommes intéressés à étudier l ' effet de variation des
teneurs de PTFE et de Nafion sur la performance de la cathode de la pile PEM.
En premier lieu, la teneur de PTFE a été variée dans un intervalle de 5 % à 30 % pds.
Les courbes de polarisation et les densités de courant limite correspondant à chacune des
teneurs de PTFE ont été déterminées. Leur comparaison a prouvé que la valeur optimale
de PTFE pour une meilleure performance de la cathode est égale à 5 % pds.
Le même travail a été répété mais dans ce cas, en variant la teneur de Nafion dans un
intervalle de 17 % à 51 % pds. La comparaison des courbes de polarisation résultantes de
ces différentes configurations a révélé que la teneur en Nafion a peu d'influence sur les
distributions de tension et de puissance à faible densité de courant alors que de faible
teneur en Nafion sont nécessaires à haute densité de courant afin d' éviter la perte de
performance de la cathode.
Dans une dernière partie, les courbes de polarisations de différentes configurations
étudiées en variant les teneurs de PTFE et de Nafion au niveau de la cathode ont été
comparées à celles de MEAs standard de type AB, BC et CC et les raisons de la
différence au niveau de leurs performances de fonctionnement ont été discutées.
Effect of Nation and PTFE contents at the cathode on the performance of PEM fuel cell using low Pt based on èluster formation on carbon-Nation (CN) and carbon
PT FE (CPTFE) layers
Daouda Fofana, Sadesh Kumar Natarajan, Pierre Bénard, Jean Hamelin
Institut de recherche sur l'hydrogène, Université du Québec à Trois-Rivières, 3351 boul. Des Forges, c.P. 500, Trois-Rivières (QC), Canada, G9A 5H7
Abstract:
In this study, the performance of the PEM fuel cell cathode is optimised through the design of three different electrode configurations based on the platinum sputtering technique. The comparison of their measured polarisation curves has shown that good performance can be obtained by sputtering three layers of a totalloading of 0.05 mg/cm2
of Pt at the cathode. High limiting current density (up to 1.1 Ncm2) can be achieved
compared to a standard membrane-electrode-assembly (MEA) containing 0.2 mg/cm2 of Pt at the cathode. Based on the cyclic voltammetry measurements, the electrochemical surface area (ESA) of the different studied configurations are deterrnined, proving that this gain of performance is due to the formation of Pt clusters. From these results, the configuration with three layers ofplatinum was selected to study the effect ofNafion and PTFE contents on the performance of the PEM fuel cell cathode. A thin layers of carbonpolytetrafluoroethylene (CPTFE) and carbon-Nafion (CN) with different contents was painted carefully on the gas diffusion layer (GDL, SEGRACET BC). The comparison of the measured polarization curves has showed that the combination effect of PTFE or Nafion content and the Pt clusters formation IS responsible of the improvement on the fuel cell cathode performance. A 5wt% of PTFE content is found to be optimal in the cathode. The performance of the cathode is more sensitive to the PTFE content than the Nafion one.
Keyword: PTFE, Nafion, CPTFE, CN, PEM, ESA
1. Introduction
The importance of reducing the amount of Pt and the amount of water at the cathodic side of the proton exchange membrane fuel cell (PEMFC) have received a lot of attention in the latest decade[1-6]. The purpose is to achieve high power density so that PEM fuel cell system can compete cost-effectively with traditionally used energy conversion devices to insure its commercialization. The oxygen reduction reaction (ORR) occurring at the cathode of the PEM fuel cell is catalyzed by high loadings of Pt to reduce significantly the overpotential loss. The ORR is central to this promising technology. The kinetic of the cathode ORR is relatively slow compared to that of the anode, leading to a large overpotential which contributes more in the total cell voltage reduction. The accumulation of the liquid water produced at the cathode is the major cause of the oxygen mass transport limitation in PEM fuel cells. The challenge is to reduce the cathode platinum loading, carefully balance reactant diffusivity, ionic and electrical
1
conductivities, as weIl as the level of hydrophobicity to ensure good perfonnance using low loading Pt in the cathode. Extensive works reported in the literature have been done to improve PEM fuel cell perfonnance by reducing the amount of Pt. The importance and the effect of the Nafion, PTFE, and carbon loadings on the cathode perfonnance have been also examined [7-11]. Advantages and disadvantages related to the amounts and the technics of applying Pt, Nafion and PTFE in the cathode cafalyst layer have been determined. Results have shown that optimum contents of these materials are required to reach high perfonnance.
The sputtering is one of technics used to distribute platinum on the cathode. For such Pt structure, the polytetrafluoroethylene (PTFE) and the Nafion contained respectively on carbon-polytetrafluoroethylene (CPTFE) and carbon-Nafion (CN) layers are used as Pt supports.
As a first step, we seek to determine the effect of the number of sputtered platinum layers on the operating perfonnance of the cathode. Three membrane-electrodeassemblies (MEAs) with different Pt sputtered layers at cathode side are fabricated. The MEA perfonnance is analysed by determining the CUITent voltage characteristics. Microscopic examinations of the electrodes as weIl as cyc1ic voltammetry on glass carbon are carried out to get the structural relationship, the c1usters fonnation and the distribution of Pt.
Once the optimised configuration is identified, it will be used to study the effect of the presence ofNafion and CPTFE with different contents on the operating perfonnance of the PEM fuel cell cathode. Two types of cathode electrodes are then designed. lu the first configuration, one layer of CPTFE is painted on the top of the gas diffusion layer of Sigracet (GDL BC carbon paper). Thereafter, the total Pt loading of 0.05 mg/cm2 is sputtered on the CPTFE layer short by short until achieving the optimised number of the Pt layers, determined fonn the first study. The second designed cathode is similar to the first one. However, the CPTFE layer is replaced by a CN layer.
2. MEAs Preparation and characterization
Table 1 summarises the three different configurations of the PEM fuel cell cathode designed in order to compare their operating perfonnances, without considering the effects of carbon-CPTFE and carbon-Nafion contents on the MPL. Once the optimum configuration is identified, we focus on the study of the effects of the carbon-PTFE and carbon-Nafion contents on the perfonnance of this electrode. To this end, carbon-PTFE and carbon-Nafion mixtures are prepared by adding carbon powder Vulcan XC72R loading of 0.5 mg/cm2 to a PTFE and Nafion solution. Different contents ofPTFE (5, 10, 15,20 and 30 wt %) and Nafion (17, 30,40 and 50 wt %) solution (Dupont luc.) are used as proton conductive agent and binder for the catalyst layer. Each mixture is magnetically stirred for at least 24 hr. The ink is then applied on a 5 cm2 teflonised carbon paper (SGL BC, Sigracet) using the brushing method and dried for approximately 2 hr. After drying, the optimised number of Pt sputtered layers is applied onto the substrate surface to reach a totalloading of 0.05 mg/cm2
• The obtained electrodes are used as cathodes.
2
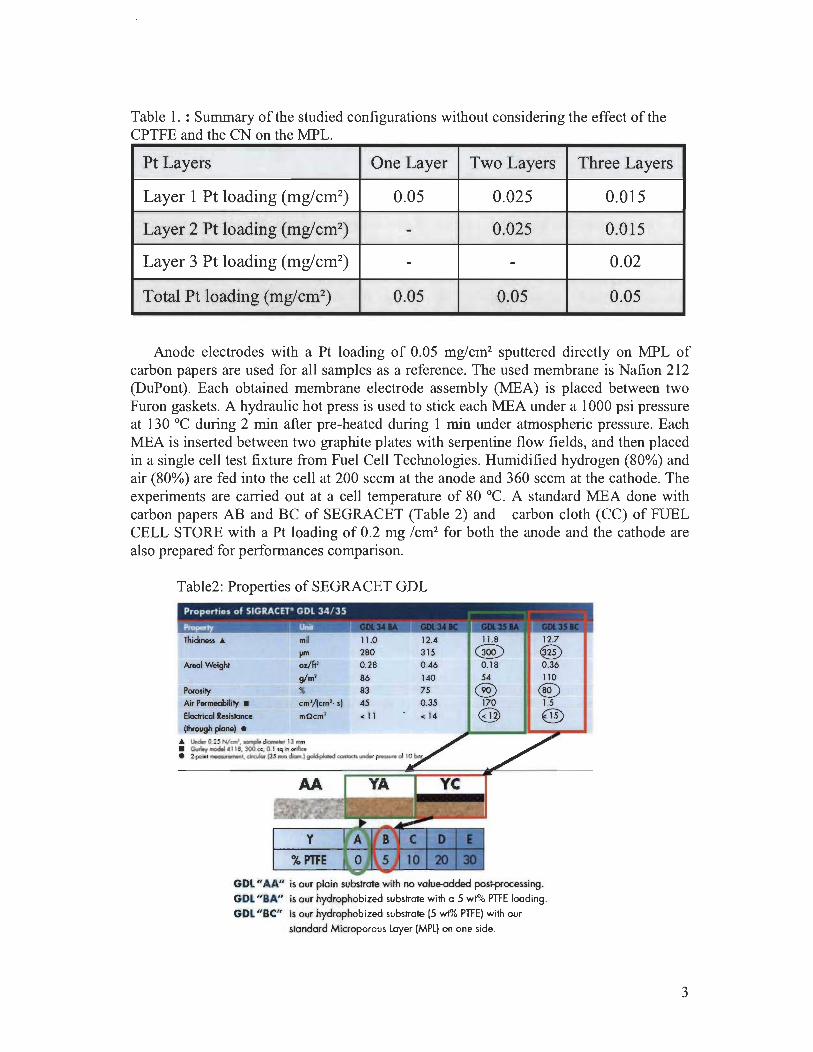
Table 1. : Summary of the studied configurations without considering the effect of the CPTFE and the CN on the MPL.
Pt Layers One Layer Two Layers Three Layers
Layer 1 Pt loading (mglcm2) 0.05 0.025 0.015
Layer 2 Pt loading (mglcm2) - 0.025 0.015
Layer 3 Pt loading (mglcm2) - - 0.02
Total Pt loading (mglcm2) 0.05 0.05 0.05
Anode electrodes with a Pt loading of 0.05 mg/cm2 sputtered directly on MPL of carbon papers are used for aH samples as a reference. The used membrane is Nafion 212 (DuPont). Each obtained membrane electrode assembly (MEA) is placed between two Furon gaskets. A hydraulic hot press is used to stick each MEA under a 1000 psi pressure at 130 oC during 2 min after pre-heated during 1 min under atmospheric pressure. Each MEA is inserted between two graphite plates with serpentine flow fields, and then placed in a single cell test fixture from Fuel CeH Technologies. Humidified hydrogen (80%) and air (80%) are fed into the cell at 200 sccm at the anode and 360 sccm at the cathode. The experiments are carried out at a cell temperature of 80 oC. A standard MEA done with carbon papers AB and BC of SEGRACET (Table 2) and carbon c10th (CC) of FUEL CELL STORE with a Pt loading of 0.2 mg Icm2 for both the anode and the cathode are also prepared' for performances comparison.
Table2: Properties of SEGRACET GDL
Properties of SIGRACET' GDL 34/ 35
Pro 1 Und 1 1 Thidtness .. mil 11.0 12.4 11 .8 12.7
1'"' 280 315 @ @) Areol Weighl oz/ft> 0.28 0.46 0.18 0.36
g/m' 86 140 54 110
Porosily % 83 75 ® ® Air Permeabilily • em'ltem" s) 45 0.35 170 1.5
Eleclrieal Reslslance mOcm' <11 <14 03> ® (Ihrough plane) •
.. Uodo<O.2'N/cm', ,,,,,,,,,,d_ 13 ~ • Gudoy ooodoI'1l8, 300 cc, 0. \ ",,, oriIko • 2-pc*11~, dtcub 125 mM dan 1 ~ CCl\k:ldsund.r pre __ 0110
GOl "M " is our ploin subslrote with no volue-odded post-processing.
GOl " BA" is our hydrophobized substrote with 0 5 wt% PTFE looding.
GOl " BC" is our hydrophobized subslrole (5 wt% PTFE) with our
sklOdord Microporous loyer (MPl) on one side.
3
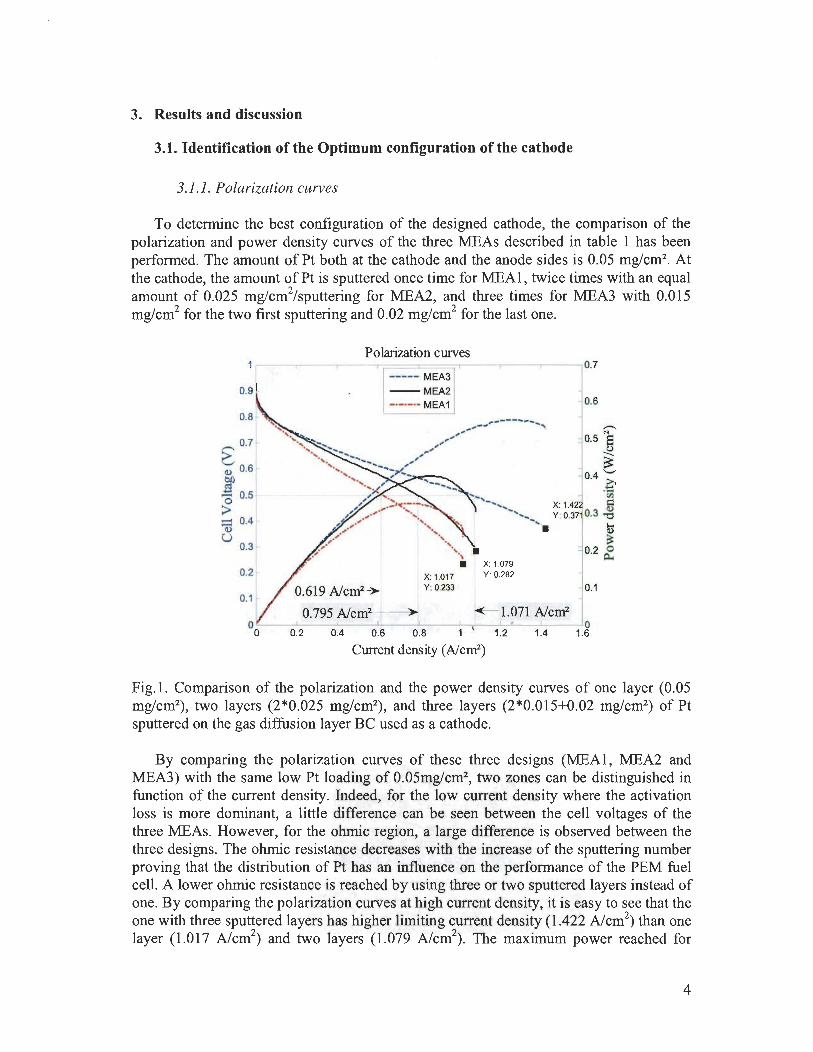
3. Results and discussion
3.1. Identification of the Optimum configuration of the cathode
3.1.1. PoLarization curves
To determine the best configuration of the designed cathode, the comparison of the polarization and power density curves of the three MEAs described in table 1 has been performed. The amount of Pt both at the cathode and the anode sides is 0.05 mg/cm2
• At the cathode, the amount of Pt is sputtered once time for MEAl, twice times with an equal amount of 0.025 mg/cm2/sputtering for MEA2, and three times for MEA3 with 0.015 mg/cm2 for the two first sputtering and 0.02 mg/cm2 for the last one.
Po1arization curves ,-----,-----r--r;=====;-r---,--------,-------,0.7
----- MEA3 0.9 - --MEA2
~ 0.7
a.> 0.6
~ "0 0.5
:> ;:::::l 0.4
a.> U
0.3
0.2
0.1
-.-.-.• MEA 1
0.619 Ncrrr~
0.795 Ncm2-->
X: 1.017 Y: 0.233
0.6
,--. '" 0.5 S
Q g 0.4 è .....
.... ,_.. en .... X: 1.42 ~
.. ,.... Y : 0.37 0.3 '"Cl ...... ~
X: 1.079 Y: 0.282
-00<::- 1.071 Ncm2
~ 0.2 ~
0.1
~_~_~ __ L-_ _L_~_.-~~-L-~O
0.2 0.4 0.6 0.8 1 1.2 1.4 1.6
CUITent density (Ncrrr)
Fig.1. Comparison of the polarization and the power density curves of one layer (0.05 mg/cm2
) , two layers (2*0.025 mg/cm2) , and three layers (2*0.015+0.02 mg/cm2
) of Pt sputtered on the gas diffusion layer BC used as a cathode.
By comparing the polarization curves of these three designs (MEAl , MEA2 and MEA3) with the same low Pt loading of 0.05mg/cm2
, two zones can be distinguished in function of the CUITent density. Indeed, for the low current density where the activation loss is more dominant, a little difference can be seen between the cell voltages of the three MEAs. However, for the ohmic region, a large difference is observed between the three designs. The ohmic resistance decreases with the increase of the sputtering number proving that the distribution of Pt has an influence on the performance of the PEM fuel cell. A lower ohmic resistance is reached by using three or two sputtered layers instead of one. By comparing the polarization curves at high CUITent density, it is easy to see that the one with three sputtered layers has higher limiting CUITent density (1.422 A/cm2
) than one layer (1.017 A/cm2
) and two layers (1.079 A/cm2) . The maximum power reached for
4

MEA3 (0.5517 W/cm2) is around twice times higher than that of the MEAl (0.3272
W/cm2). This improvement must be due to the high surface reaction rates introduced by
the formation of c1usters as proved by the high limiting current density observed for MEA3. The number of isolated Pt partic1es is reduced due to the stacking of Pt before linking. The thicker active layer related to the uniform dispersion of Pt inside justifies also the better distribution of the polarization curve obtained with the three layers configuration. The presence of micro porous layer (MPL) on the GDL BC and the low Pt loading prevents significant accumulation of liquid water on the reaction side and do es not impose severe mass transport limitations, either by blocking the gas pores or by covering up the reactive surface area. The diffusion of reactant to the reaction sides is noticeably improved with this electrode.
3.1.2. Cyclic voltammetry
To c1arify the improvement of the cathode performance through these three configurations design, cyclic voltammetry measurements were performed on glass carbon. The CV results reveal that three layers configuration has higher ESA than two layers and one layers configurations (Table 3). These results reflect very weIl the difference of performance observed between the different configurations presented in figure 1. The high limiting current density given by the polarization curve of three layers configuration is due to its high ESA comparing to the other studied cases. Thus, the effective areas for the ORR are influenced by the manner the Pt is distributed in the electrode.
Table 3. ESA and hydrogen adsorption charge results for the three studied configurations.
Electrochemical surface area Hydrogen adsorption charge Glass carbon area
S(ca2)
3.1.3. SEM characterization
A SEM characterization has been also performed for the different configurations. A Pt c1uster is observed in the entire SEM figures (2a, 2b, 2c, 2d, 2d, 2e, and 2i), but the largest one is observed on figures 2e and 2f which correspond to the three Pt layers sputtered on the cathode of MEA3 configuration. The gain in performance seems to be to the result of the large Pt c1uster formation.
5

Fig.2. SEM images of the Pt sputtered on gas diffusion electrode (GDE): a) with 0.05 mg/cm2
, c) with twice 0.025 Ncm2 , e) with twice 0.015 and 0.02 mg/cm2 and their
cOITesponding magnitude b), d) and f).
From these results, we can conclude that the third configuration with three sputtered Pt layers is the optimal design resulting in the best performance of the cathode. This is attributed to the formation of clusters of platinum which promotes the reaction of oxygen reduction at the cathode. Thus, it is this configuration that is selected for the study of the effects ofCPTFE and Nafion contents on the performance of the cathode.
3.2. Effect of PTFE content in CPTFE layer on MEA performance
Fig.3. shows the polarization and power density behaviours of MEAs with various concentration of PTFE content at the cathode. In the active region of polarization curves cOITesponding to the low CUITent density zone, significant variation in cell voltage
6
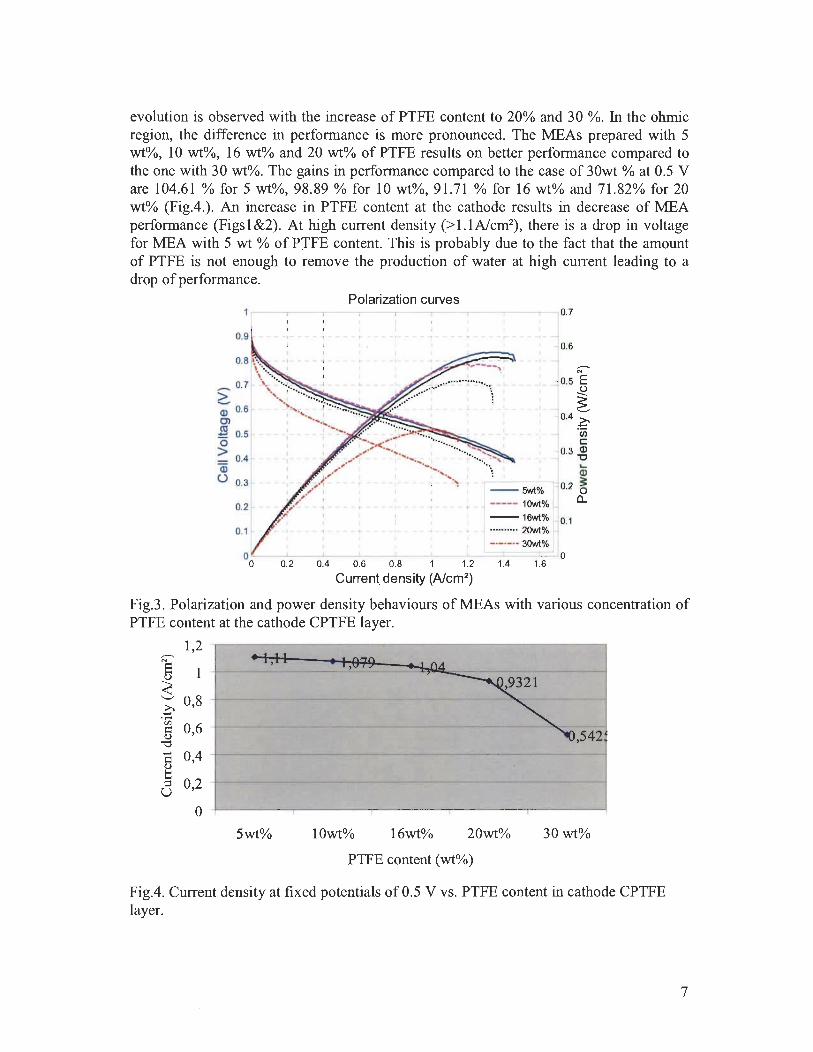
evolution is observed with the increase of PTFE content to 20% and 30 %. In the ohmic region, the difference in performance is more pronounced. The MEAs prepared with 5 wt%, 10 wt%, 16 wt% and 20 wt% of PTFE results on better performance compared to the one with 30 wt%. The gains in performance compared to the case of 30wt % at 0.5 V are 104.61 % for 5 wt%, 98.89 % for 10 wt%, 91.71 % for 16 wt% and 71.82% for 20 wt% (Fig.4.). An increase in PTFE content at the cathode results in decrease of MEA performance (Figs1&2). At high CUITent density (>1. 1 Ncm2
) , there is a drop in voltage for MEA with 5 wt % of PTFE content. This is probably due to the fact that the amount of PTFE is not enough to remove the production of water at high CUITent leading to a drop of performance.
0.9 -
_ 0.7
è. Q) 0.6 Cl
~ 0.5 o ::: 0.4 Q5 Ü 0.3
0.2
0.1
1
- 4
Polarization curves
, . 1
1
~
0.6
-N
10.5 E ~
-i ~ 0.4 ~
..j ëii c
.. ~ ~0 . 3 ~
., 1 1 Q)
-- 5wt% 0.2 ~ ----- 1Owt% j a.. --16wt% 0.1 .......... 2Owt% .,
-.-.-.• 3Owt% ~~--~--~--~--~--~-==r===c~0
0.2 0.4 0.6 0.8 1 1.2 1.4 1.6
Current. density (A/cm2)
Fig.3. Polarization and power density behaviours ofMEAs with various concentration of PTFE content at the cathode CPTFE layer.
1,2 ~------------------------------------------~
~ 1 3, è 0,8 ..... ~ 0,6 ,542
'"0
5 0,4
8 0,2
o +-------~--------r-------;_------~------~ 5wt% 10wt% 16wt% 20wt% 30wt%
PTFE content (wt%)
Fig.4. CUITent density at fixed potentials of 0.5 V vs. PTFE content in cathode CPTFE layer.
7

3.3. Effect of Nafion content in eN layer on MEA performance
Fig.5. shows the polarization and power density curves of MEAs with various concentration of Nafion content in CN layer at the cathode. The performance of PEM fuel ceU electrodes are not much affected by the variation ofNafion content. AU the ceUs give approximately the same performance. The variation in performance is only 10-40 mV up to 1 A/cm2
• The most common catalyst in PEM fuel ceUs for oxygen reductions needs optimal Nafion content for best performance [12]. In our MEA with CN layer, there is no need of optimal results since aU content in the range of 17 and 50 wt % give the same performance from active region to ohmic region. This is an advantage facilitating the conception of the MEA using Pt c1uster formation on CN structure. The main difference is at high current density where low content of Nafion is preferred regarding the polarization and power curves (Fig.5 & 6).
Polarization curves I-r--r;::::==r:::===r:;--,----,-----,----~O. 7
1
0.9 - - - -; - - -
_ 0.7
è-Q) 0.6 C>
Jl! 0.5 o > = 0.4 Q)
() 0.3
0.2 -
--17wt%
----- 30wt% -·-·- ·· 41wt% ·········· 51wt%
- +
- - 1 -+ -1
1
1 1 - - • 1- ., - - - r - -
1
1 1 - r - -, -
1 - -, -1
- r --- i 1 1 1 1 1- - --t -
....... .. 1 1 1 1 . .... .. ~ ... .,J 1 1
-:- .~ . .;:~~:--t:'~.... ~ - --1
1 1' -, ••• I l
- 1 - -4 - --~----I -
1
1
1- - -'" - - - - II
-- -4 - 1--- - -I I
1 1 1
0.1 - l- _ _ 1 _ -+ - _ _ 1. __ -1 ____ 1- __ --l _
I 1 1 1
0.6
-N
0.5 E
~ 0.4 ~
III C
0.3 ~ .... Q)
0.2 ~ a..
0.1
L-__ ~ __ ~ __ _L __ ~ ____ L_ __ ~ __ ~ __ _L~O
0.2 0.4 0.6 0.8 1 1.2 1.4 1.6
Current density (Alcm2)
Fig.5 . Polarization and power density behaviours ofMEAs with various concentration of Nafion content at the cathode CN layer.
1,2
$0 8 .~ , § 0,6 ~
~ 0,4 .... .... ~ 0,2
o
~,i)(i~S
-- -
1:---
17wf>1o
. 6,886 . 6,885' . 0,886 ---
-
30wr>1o 41wf>1o Slwf>1o
Nafion content (wf>Io)
Fig.6. CUITent density at fixed potentials of 0.5 V vs. Nafion content in cathode CN layer.
8
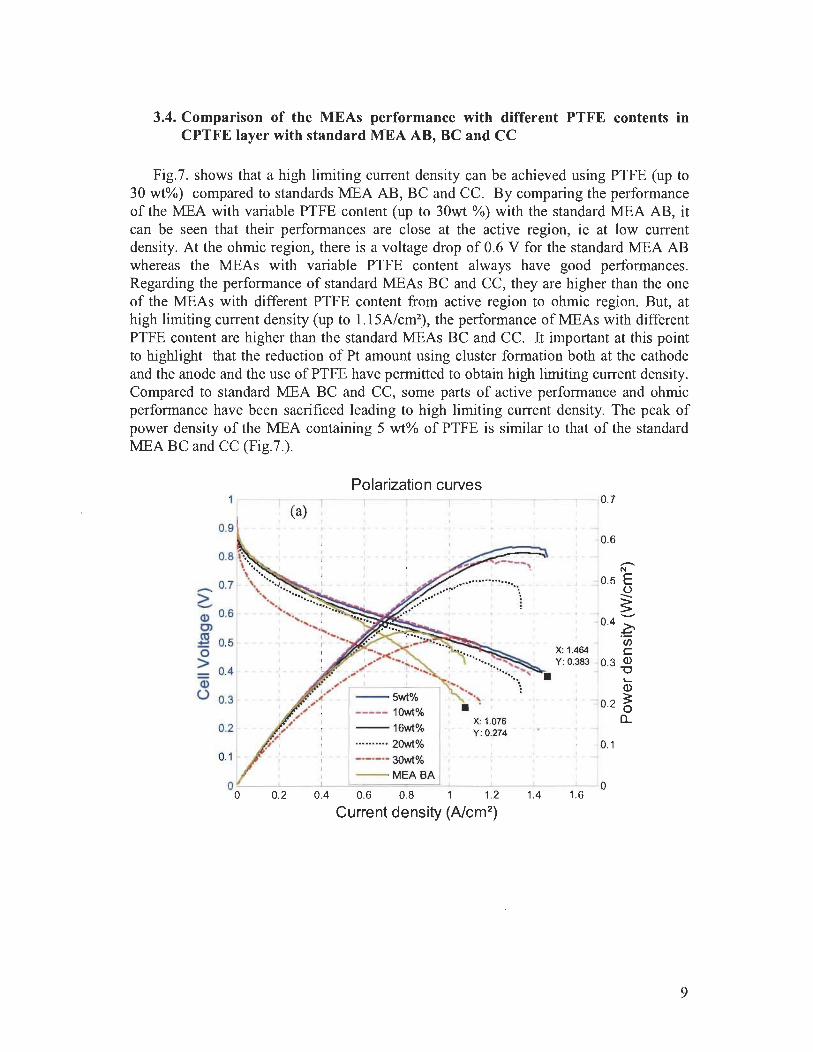
3.4. Comparison of the MEAs performance with different PTFE contents in CPTFE layer with standard MEA AB, BC and CC
Fig.7. shows that a high limiting CUITent density can be achieved using PTFE (up to 30 wt%) compared to standards MEA AB, BC and CC. By comparing the performance of the MEA with variable PTFE content (up to 30wt %) with the standard MEA AB, it can be seen that their performances are close at the active region, ie at low current density. At the ohmic region, there is a voltage drop of 0.6 V for the standard MEA AB whereas the MEAs with variable PTFE content always have good performances. Regarding the performance of standard MEAs BC and CC, they are higher than the one of the MEAs with different PTFE content from active region to ohmic region. But, at high limiting CUITent density (up to 1.15Ncm2
), the performance of MEAs with different PTFE content are higher than the standard MEAs BC and CC. It important at this point to highlight that the reduction of Pt amount using cluster formation both at the cathode and the anode and the use of PTFE have permitted to obtain high limiting current density. Compared to standard MEA BC and CC, sorne parts of active performance and ohmic performance have been sacrificed leading to high limiting CUITent density. The peak of power density of the MEA containing 5 wt% of PTFE is similar to that of the standard MEA BC and CC (Fig.7.).
Polarization curves ,.----,-----,,-----,-----,----,------r--,-----r-, 0.7
(a) 0.9
0.8 [',\ \ ' . . \ ........ ,
Q) 0.6 - ~'" ~ .~~~~
~ 0.7 tl .... ,.<: ................ .
0) ..........
~ 0.5 1 ....... ><:-r::t1~~_ o > _ 0.4 Q)
Ü
r 1 1 1 1
--5wt%
----- 10wt% --16wt%
··········20wt% -._._ .• 30wt%
--MEABA
X: 1.076 Y: 0.274
r·6
10.5 ~
-' ~ -< 0.4 ~
X: 1.464 1 ~ Y: 0.383 0.3 Q) . ~
Q)
" ~ 0. 2 ~
:. - 1 jo.1 a.. ~
O~--L-~~-k========~~-~--i--~--O
o 0.2 0.4 0.6 0.8 1.2 1.4 1.6
Current density (A/cm2)
9
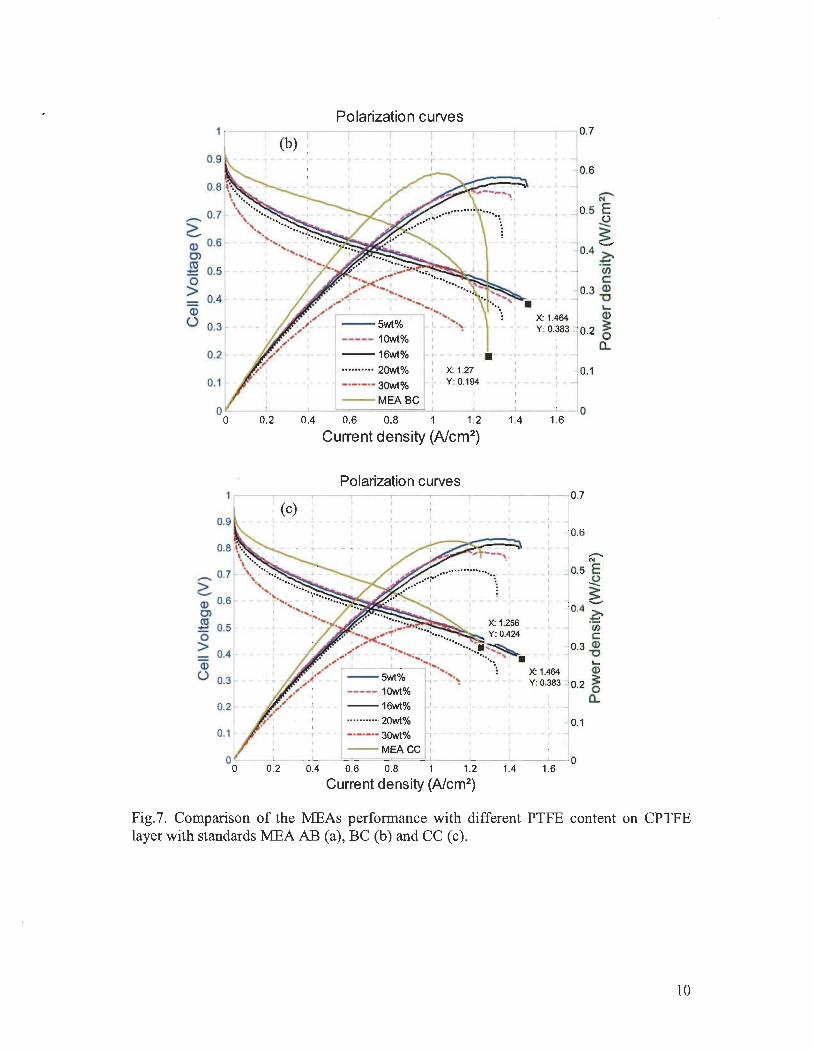
0.9
0.8
~ 0.7
a.> 0.6 0> ;g 0.5 o > _ 0.4 a.>
Ü 0.3
0.2
0.1
Polarization curves ,----,-----,----,,----,-----.----,-----,-----,-, 0.7
(b)
- l -
, 1- --
, T -
--- 5wt%
----- 1Owt% ---16wt%
··········2Owt%
, - -, r-
, L _
, t -
, - T
, X: 1.464 - - :- - Y: 0.383
, , , )- - - - -t - . - - -:- 1- - - - +-,
X: 1.27 ,
-'-'-'. 3Owt% ,- Y: 0.194
--MEABC
0.6
........ N
0.5 E
~ 0.4 ~
ci) c
0 .3~ L-
a.> 0.2 ~
a..
0.1
~ __ ~ ____ -L __ ~==========LL ____ ~ ____ L-__ ~ __ O 0.2 0.4 0.6 0.8 1 1.2 1.4 1.6
Current density (A1cm2)
Polarization curves
Fig.7. Comparison of the MEAs performance with different PTFE content on CPTFE layer with standards MEA AB (a), BC (b) and CC (c).
10
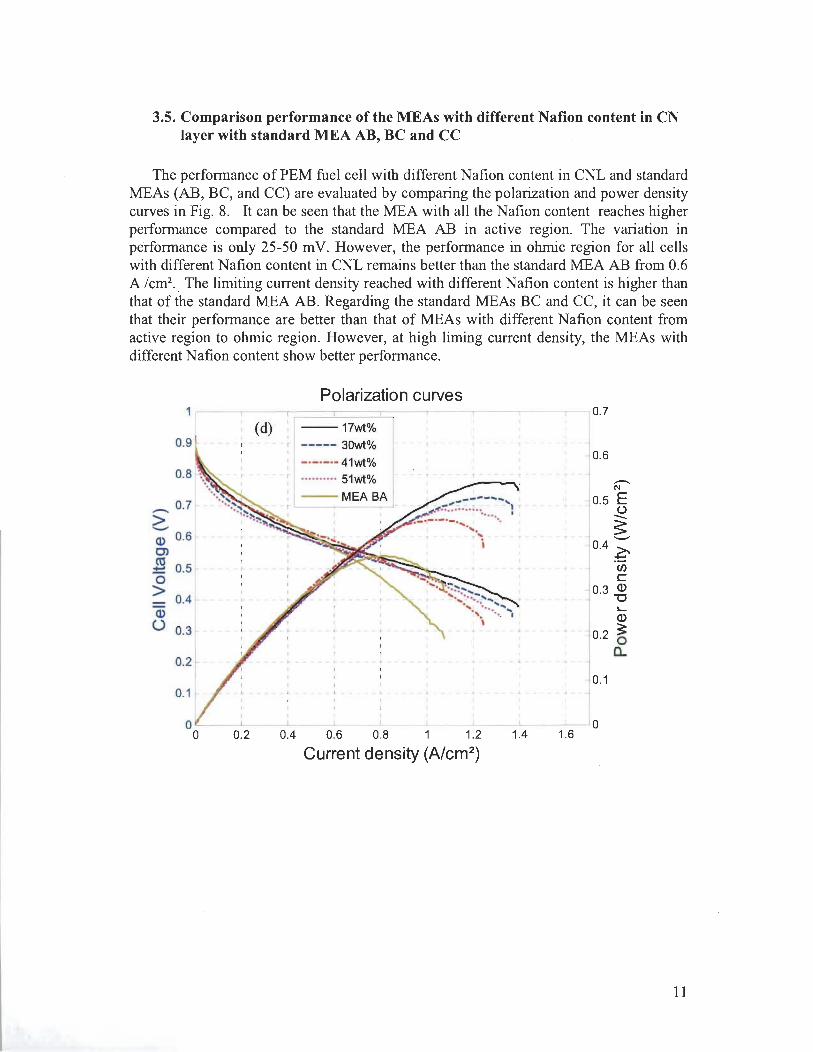
3.5. Comparison performance of the MEAs with different Nation content in CN layer with standard MEA AB, BC and CC
The performance of PEM fuel cell with different Nation content in CNL and standard MEAs (AB, BC, and CC) are evaluated by comparing the polarization and power density curves in Fig. 8. It can be seen that the MEA with all the Nation content reaches higher performance compared to the standard MEA AB in active region. The variation in performance is on1y 25-50 mV. However, the performance in ohmic region for all cells with different Nation content in CNL remains better than the standard MEA AB from 0.6 A /cm2
• The limiting CUITent density reached with different Nation content is higher than that of the standard MEA AB. Regarding the standard MEAs BC and CC, it can be seen that their performance are better than that of MEAs with different Nation content from active region to ohmic region. However, at high liming CUITent density, the MEAs with different Nation content show better performance.
Polarization curves
1 1
0.7
(d) --17wt% 1
0.9 r ----- 30wt% -.-.-.- 41wt% 0.6
0.8 ·········· 51wt% -N --MEABA 0.5 E _ 0.7
()
è, -104 ~ Q) 0.6
C> co ::: 0.5 Cf)
0 c > 03 Q)
0.4 '-0 - '-Q) Q) Ü 0.3 . 0.2 ~
Cl.. 0.2
0.1 0.1
0 0 0 0.2 0.4 0.6 0.8 1 1.2 1.4 1.6
Current density (A/cm2)
11

Polarization curves ~--~-----.-----.-----.-----r-----r----'-----'--'I O. 7
0.9
0.8
_ 0.7
> -Q) 0.6 0> ro ~ 05 o . > = 0.4 Q)
Ü 0.3
0.2
0.1
0.9
0.8
- 0.7
~ 0.6 0>
$ 0.5 o > 0.4 Q)
Ü 0.3
0.2
0.1
1 r
r
~
(e)
1
r - r T
1- -
Il ---17wt%
----- 3Owt% Il -.-.-.- 41wt%
·········· 51wt% --MEABC
1 - T
T
+
1
-+ -+
-+ 4 -+
'- - -+ 1
-+
0.6
-N
0.5 E Ü
~ -0.4 ~ Cf)
C 0.3 ~
-- 0.2
0.1
~
Q)
3: o a..
~ 10 0.2
1 (f)
0.4 0.6 0.8 1 1.2
Current density (A1cm2)
Polarization curves
1 -
1
--17wt%
-----, 30wt% -.-.-.- 41wt% ·········· 51wt% --MEACC
1.4 1.6
0.7
0.6
r;---1 0.5 E
~ 0.4 -~ Cf)
c 0.3 Q)
"0 ~
Q)
0.2 ~ a..
-'
-1 0.1
or '1 o 1 10 0.2 0.4 0.6 0.8 1 1.2 1.4 1.6
Current density (A1cm2)
Fig.8. Comparison perfonnance of MEA with different Nafion content on CN layer with standards MEA AB (d), BC (e) and CC (f).
12
4. Conclusion
From the present investigation, it can be concluded that the effect of PTFE and Nafion on Pt 0.05mglcm2 cluster formation at the cathode have permitted to improve the cell performance. High liming current density have been achieved using on CPTFE and CN layer as a carbon Pt support compared to the standard MEAs (AB,BC,CC) containing 0.2 mglcm2
• The amount of Pt was reduced by a factor of four at the cathode while keeping best performance. Optimal amount ofNafion is not required for good PEM fuel cell performance using CNL at the cathode side. The cathode was sensitive to PTFE content. Low amount of PTFE was required to reach best performance.
Acknowledgements
We would like to thank the National Resources and Engineering Research Council of Canada (NSERC) for financially support.
Reference
1. BiyIkoglu, A, Review of proton exchange membrane fuel ceU models. International Journal of Hydrogen Energy, 2005. 30(11): p. 1181-1212.
2. Mehta, V. and lS. Cooper, Review and analysis of PEM fuel ceU design and manufacturing. Journal of Power Sources, 2003.114(1): p. 32-53.
3. Qi, Z. and A Kaufman, Low Pt loading high performance cathodes for PEM fuel ceUs. Journal of Power Sources, 2003 . 113(1): p. 37-43.
4. Wilson, M.S., lA Valerio, and S. Gottesfeld, Low platinum loading electrodes for polymer electrolyte fuel ceUs fabricated using thermoplastic ionomers. Electrochimica Acta, 1995.40(3): p. 355-363.
5. Park, S. and B.N. Popov, Effect of cathode GDL characteristics on mass transport in PEM fuel ceUs, in Fuel2009. p. 2068-2073.
6. Cho, Y.-H., et al., Effect of platinum amount in carbon supported platinum catalyst on performance of polymer electrolyte membrane fuel ceU. Journal of Power Sources, 2007.172(1): p. 89-93.
7. Antolini, E., R.R. Passos, and E.A Ti cianelli , Effects of the carbon powder characteristics in the cathode gas diffusion layer on the performance of polymer electrolytefuel ceUs. Journal of Power Sources, 2002.109(2): p. 477-482.
8. Koper, M.T.M., ed. FUEL CELL CATALYSIS. Wiley ed. A Surface Science Approach2009.
9. Kim, M., et al., The preparation of PtlC catalysts using various carbon materials for the cathode of PEMFC. Journal of Power Sources, 2006. 163(1): p. 93-97.
10. Lee, S.l, et al., Effects of Nafion impregnation on performances of PEMFC electrodes. Electrochimica Acta, 1998.43(24): p. 3693-3701.
Il. Giorgi, L., et al., Influence of the PTFE content in the diffusion layer of low-Pt loading electrodes for polymer electrolyte fuel ceUs. Electrochimica Acta, 1998. 43(24): p. 3675-3680.
12. Song, D., et al., Numerical optimization study of the catalyst layer of PEM fuel ceU cathode. Journal of Power Sources, 2004.126(1-2): p. 104-11 L
13

53
5. Conclusion et perspectives
54
Ce travail a consisté à l'optimisation du fonctionnement de l' électrode cathodique
d'une pile à combustible de type PEM par voies numérique et expérimentale. Il s'agissait
tout d' abord de décrire les différents mécanismes ayant lieu au niveau de la cathode pour
passer en second lieu à leur optimisation par la conception de nouveaux types
d' électrodes cathodiques à structure multicouche en se basant sur la technique de
pulvérisation cathodique d'une faible quantité de platine.
Au cours de ce travail, les phénomènes de transport et les réactions électrochimiques
ayant lieu au niveau de l' électrode cathodique ont été décrits par un modèle
mathématique diphasique et bidirectionnel, incluant les équations caractéristiques de
transport des espèces réactives, de l' eau liquide et des charges. Ce modèle mathématique
a été appliqué pour trois configurations de l'électrode cathodique à structure multicouche
et résolue avec le logiciel de calcul commercial, Comsol Multiphysics 3.5a. Les trois
configurations sont différentes par le nombre et l' alternance de leurs couches de carbone
Nafion et de platine. À partir de la comparaison des résultats de simulation de ces trois
configurations à une, deux et trois couches actives, nous avons observé que la dernière
configuration résulte en une densité de couram limite (~ I.4 Alcm2) plus élevée que celle
des électrodes à une (~ 1.2 Alcm2) et deux couches (~l.l Alcm2
). En effet, l' épaisseur de
la couche active et leur porosité sont les deux paramètres les plus importants à tenir en
compte lors de la conception d'une telle structure. En outre, la détermination de la
distribution surfacique de l ' eau au niveau de la cathode a montré que sa quantité
condensée pour la structure à trois couches est nettement inférieure à celles des deux
autres configurations, réduisant ainsi le problème du phénomène de noyage généralement
rencontré dans les cathodes des piles standards. Cette même configuration résulte aussi en
une fraction massique d' oxygène dans la couche active beaucoup plus importantes que
celles des deux autres configurations.
Face à ces résultats numériques encourageants, nous avons procédé à la partie
d 'expérimentation afin de valider notre modèle mathématique et mettre en œuvre le
procédé de fabrication de ces configurations d' électrode cathodique en se basant sur la
technique de pulvérisation sous vide. Une bonne corrélation a été obtenue entre les
courbes de polarisation et les courbes de puissances de chacune des trois configurations
55
mesurées et calculées ' numériquement. D'autre part, la comparaison de ces courbes
caractéristiques mesurées a confirmé que c'est bien la structure à trois couches qui résulte
en une performance supérieure aux deux autres configurations. Les densités de courant
limite mesurées sont mêmes supérieures aux densités de courant limite des MEA
standard, traduisant ainsi une augmentation de performance de nos électrodes.
Cette amélioration de performance peut s'expliquer par l' augmentation de la surface
active en utilisant la technique de pulvérisation de platine sur du carbone
polytétrafluoroéthylène (C-PTFE) et ceci pour une faible quantité de Pt de 0.05 mg/cm2.
L'effet des quantités du PTFE et de Nafion sur la performance du fonctionnement de la
cathode a été également testé. Alors qu'une cathode à structure multicouche nécessite
l'utilisation de faibles quantités de PTFE pour aboutir à des densités de courant limite
optimisées, il existe une plage tolérable du pourcentage de Nafion à introduire dans la
cathode sans pour autant perdre en fonctionnement optimal. Ceci présente un avantage
considérable par comparaison à la quantité de Nafion à introduire dans la couche active
de la cathode d'une pile standard où nous notons la présence d'un maximum optimal de
quantité de Nafion à respecter lors de la conception.
En perspective, cette étude pourrait être complétée par une étude du vieillissement de
nos électrodes cathodiques à structure multicouche et à faible quantité de platine.
L'utilisation de faibles quantités d' alliages de platine pourrait s'avérer une voie
intéressante à aborder pour ces structures multicouches. Enfin, un test de fonctionnement
de la pile PEM avec des électrodes à structure multicouche telles que nous les avons
conçues, dans des mic~osystèmes embarqués pourrait permettre l ' élaboration d'un test de
fonctionnement à échelle réelle.