Université de Toulouse III – Paul Sabatierthesesups.ups-tlse.fr/2211/1/2013TOU30253.pdf ·...
94
Transcript of Université de Toulouse III – Paul Sabatierthesesups.ups-tlse.fr/2211/1/2013TOU30253.pdf ·...
Université de Toulouse III – Paul Sabatier École doctorale GEET
THÈSE en vue de l’obtention du
DOCTORAT DE L’UNIVERSITÉ DE TOULOUSE Délivré par l’Université Toulouse III – Paul Sabatier
En cotutelle à l’Université Aalto, FINLANDE Discipline : Génie Électrique
Présentée et soutenue par
Leena TÄHKÄMÖ Le Vendredi 13 Octobre 2013
Title :
Life cycle assessment of light sources – Case studies and review of the analyses
Titre :
Analyse du cycle de vie de sources lumineuses – Etudes de cas et examen des analyses
Jury
Marc FONTOYNONT Professeur à l’Université Aalborg (Examinateur) Christian GLAIZE Professeur à l’Université Montpellier 2 (Rapporteur) Liisa HALONEN Professeur à l’Université Aalto (Codirectrice de thèse) Ilkka SAVOLAINEN Professeur à VTT Centre de Recherche Technique de
Finlande (Rapporteur) Georges ZISSIS Professeur à l’Université Paul Sabatier (Directeur de
thèse)

Abstract
Author
Leena Tähkämö
Name of the doctoral dissertation
Life cycle assessment of light sources – Case studies and review of the analyses
Field of research Illuminating Engineering
Manuscript submitted 18 April 2013 Date of the defence 13 September 2013
Permission to publish granted (date) 14 June 2013 Language English
Monograph Article dissertation (summary + original articles
Abstract
Lighting is a major global consumer of electricity and undergoing drastic changes due to legislative and voluntary measures. Widely-used conventional light sources, such as incandescent lamps and high pressure mercury lamps, are banned from the European Union market. The number of light sources on the market is expanding especially regarding the LED lamps and luminaires. These major changes in the lighting sector create a need for evaluating the environmental performance of light sources, especially as the changes are justified by the environmental aspects, such as energy consumption.
The life cycle assessment method is standardized on a general level, but no established rules exist for conducting a life cycle assessment of light sources in detail. In most cases, it is impossible to directly compare the results of different assessments. Because of the major changes in the lighting market, it is useful to assess the environmental impacts of various light sources in similar methods.
The work addresses this problem by presenting two models, a simple and an extensive one, for conducting the life cycle assessment of light sources rapidly and in a transparent, comparative way. The models are developed on the basis of four case studies presented in the work and a review to the life cycle assessment found in the literature. Both models are simplified, and they recommend the key parameters of the life cycle assessment: functional unit, stages of the life cycle, environmental impacts, and energy source in use stage.
Four case studies were conducted in the work: two life cycle assessments of a fluorescent lamp luminaire and an LED downlight luminaire, one life cycle cost analysis of street lighting luminaires, and one analysis combining both life cycle assessment and life cycle cost analysis of non-directional lamps.
The case studies and the review of the previous life cycle assessments concluded similar findings despite the differences in the methods, scopes and evaluated light sources. The main conclusion of the life cycle assessments was the clear dominance of the use stage energy consumption. The environmental impacts of the use were found to be sensitive to the life of the light source and the used energy source. The dominance of the use stage was the clearest in light sources of low luminous efficacy and low manufacturing efforts and when using high- emission energy sources. The manufacturing was usually the second significant cause for average environmental impacts. The importance of the manufacturing is estimated to increase by a more detailed assessment of the manufacturing processes. The average environmental impacts of other life cycle stages, such as transport and end-of-life, were found practically negligible, but possibly notable in a certain environmental impact category.
Key words life cycle assessment, life cycle cost, environmental impacts, lighting

Résumé
Auteur
Leena Tähkämö
Nom de la thèse
Analyse du cycle de vie de sources lumineuses – Etudes de cas et examen des analyses
Domaine de recherche Eclairagisme
Manuscrit soumis le 18 avril 2013 Date de la soutenance le 13 septembre 2013
Manuscrit révisé (date) le 14 juin 2013 Langue Anglais
Monographie Article dissertation (sommaire + articles originaux)
Résumé
Le domaine de l’éclairage, gros consommateur mondial d'électricité, connaît actuellement des changements de part des mesures législatives et volontaires. Les sources lumineuses conventionnelles, comme les lampes à incandescence et à mercure haute pression, sont interdites à la vente dans l'Union européenne. Ces changements dans le domaine de l'éclairage ont ainsi créé un besoin d’évaluation de performance environnementale des sources de lumière, d'autant plus que les changements sont souvent justifiés par les aspects environnementaux.
La méthode d'analyse du cycle de vie est normalisée à un niveau général. Pourtant, il n’existe pas de règles établies pour réaliser une analyse de cycle de vie en détail pour les sources de lumière. Par conséquent, il est impossible de comparer directement les résultats qui proviennent généralement d’analyses différentes. En outre, le nombre de sources lumineuses, en particulier des lampes et luminaires à LED, augmente sur le marché. Ainsi, il serait utile d’évaluer des sources de lumière de façon similaire.
Ce travail aborde le problème en présentant deux modèles, l’un simple et l’autre étendu, afin d’effectuer une analyse du cycle de vie des sources lumineuses rapidement et en toute transparence. Les modèles sont développés sur la base de quatre études de cas présentées dans la thèse et l’examen des analyses du cycle de vie trouvées dans la littérature. Les deux modèles simplifiés recommandent les paramètres clés de l'analyse du cycle de vie: une unité fonctionnelle, les étapes du cycle de vie, et la source d'énergie en phase d’utilisation.
Quatre études de cas ont ici été réalisées: deux analyses du cycle de vie d'un luminaire à lampe à fluorescence et d'un luminaire encastré à LED, une analyse des coûts du cycle de vie des luminaires d'éclairage public , et une analyse combinant à la fois l'analyse du cycle de vie et l'analyse du coût du cycle de vie des lampes non-dirigées.
Des résultats similaires ont été trouvés dans les études de cas et l'examen des analyses de cycle de vie antérieures malgré les différences dans les méthodes, et les champs de l’étude. De tous
les impacts environnementaux du cycle de vie, c’est la consommation d'énergie durant la phase
d’utilisation qui prédomine. Il a été constaté que les impacts environnementaux sont corrélés à la durée de vie de la source lumineuse ainsi que la source d'énergie utilisée. La phase d'utilisation prédomine le plus clairement sur les impacts en cas de faible efficacité lumineuse et fabrication simple. Généralement, la fabrication est la deuxième cause la plus importante des impacts environnementaux moyens. L'importance de la fabrication devrait augmenter par l’analyse plus détaillée des procédés et matériaux de fabrication. Les impacts moyens des autres étapes du cycle de vie, tels que les transports et la fin de vie, sont pratiquement négligeables. Cependant, ils pourraient peut être s’avérer notables dans une certaine catégorie d'impacts.
Mots-clés analyse du cycle de vie, coût du cycle de vie, impacts environnementaux, éclairage
6
Preface
The research work in this jointly-supervised thesis was conducted at the
Lighting Unit of Aalto University School of Electrical Engineering and at
the LAPLACE (Laboratoire Plasma et Conversion d'Energie) Laboratory of
Université Paul Sabatier. Part of the work was carried out in the project
“SolarLED” funded by the Finnish Funding Agency for Technology and
Innovation; the Finnish Transport Agency; the city of Helsinki, Espoo,
Vantaa, Tampere and Porvoo; Helsingin Energia; Oy Turku Energia; SITO
Oy; Philips Oy; Oy Osram Ab; Naps Systems Oy; iGuzzini Finland & Baltic
Oy; Easy Led Oy; Lumi Group Oy; Valopaa Oy; Oy Modines Ltd; Tepcomp
Oy; Laukamo Plastcomp Oy; Insinööritoimisto Lausamo Oy; and
Sähkötekniikka Oy. Part of the work was carried out in the project
“CITADEL” funded by the French Agency for the Environment and Energy
Management (ADEME). I acknowledge the collaboration with Helvar Oy Ab
and Toni Anttila from Alppilux Oy in one of the case studies.
It would have been impossible to finish the thesis without the support of
several people. I start by thanking my supervisors Professors Liisa Halonen
and Georges Zissis for their support throughout the thesis project and
enabling the jointly-supervised doctoral thesis in the first place. It has been
a real challenge and an unforgettable journey. I am grateful to my thesis
advisor Dr Marjukka Puolakka for her advice and support in the process.
I would like to thank the pre-examiners Professor Sermin Onaygil from
Istanbul Technical University and Research Professor Ilkka Savolainen
from VTT Technical Research Centre of Finland. I thank Professor
Christian Glaize from Montpellier II University for being the pre-examiner
in the thesis acceptance process in Université Paul Sabatier. Your valuable
comments have helped me to improve the thesis. I wish to thank Professor
Marc Fontoynont from Aalborg University and again Research Professor
Ilkka Savolainen from VTT for agreeing to be my opponents in the defence.
I acknowledge the Doctoral Program in Electrical Energy Engineering
(DPEEE), Walter Ahlström Foundation, French Institute of Finland,
Research Foundation of Helsinki University of Technology, and Finnish
Society of Electronics Engineers for financially supporting the work. I want
7
to thank Pia Lindh for taking care of the administrative work regarding the
research exchange in spring 2011.
I am grateful to all of the personnel in the Lighting Unit of Aalto
University for the discussions on- and off-duty. I am especially thankful for
the help, guidance and exchange of thoughts to Anne Ylinen, Eino Tetri,
Jorma Lehtovaara, Esa Kurhinen and Jaana Jahkonen. Especially I want to
express my gratitude to Leena Väisänen for taking care of all the extra
bureaucratic work that this jointly-supervised doctoral thesis has caused.
I wish to warmly thank my colleagues in Université Paul Sabatier and the
staff at LAPLACE Laboratory for their time and patience. Especially I want
to thank Lydie Arexis-Boisson and David Buso for helping me with the
challenges on and off work. Merci beaucoup! J’aimerais aussi remercier
Laure Barreyre-Pandele pour l’aide à la traduction française.
I have had the possibility to do part of the work in collaboration with
CSTB (Centre Scientifique et Technique du Bâtiment) research center. I
wish to thank the CSTB staff in Grenoble for the collaboration. I am very
grateful for being able to work with Manuel Bazzana, Pierre Ravel, Francis
Grannec, Sébastien Lasvaux and Christophe Martinsons. Thank you for
your time, effort and the inspiring working atmosphere. I would like to
thank also the team lead by PNNL (Pacific Northwest National Laboratory)
who let me cooperate with the experts of lighting and environmental
assessment. I greatly thank Heather Dillon, Michael Scholand, Brad
Hollomon, Mary Ashe and Lesley Snowden-Swan for the collaboration,
exchange of thoughts and assistance.
I cannot thank enough my friends in Finland and abroad, who ensured
that I have life outside the thesis working process. Special thanks goes to
the friends abroad that have made me feel at home during my journeys.
Thank you Hanna, Miika, Arwa, Natalia and Silvia.
I am deeply grateful to my family. I want to express my deepest gratitude
to my parents who have given me a feeling that I am able to do whatever in
life if I just put my mind to it. I express my warm gratitude to my
grandmother Linda for her great example of perseverance and hard work. I
am grateful to my sister for all the support she has given me and her
proofreading services. Last I thank Petri for being my rock. Thank you for
your love, care and incredible patience.
Espoo, June 2013
Leena Tähkämö
8
Contents
Abstract
Tiivistelmä
Résumé
Preface................................................................................................... 6
List of abbreviations and symbols ...................................................... 10
1 Introduction ................................................................................ 12
1.1 Background ........................................................................... 13
1.2 Research problem ................................................................. 16
1.3 Aim of the work ..................................................................... 16
2 Life cycle assessment................................................................... 18
2.1 Total sustainability assessment ............................................ 21
2.2 Life cycle costing ................................................................... 22
2.2.1 Present value .................................................................. 24
2.2.2 Payback times ................................................................. 24
3 Analysis of previous life cycle assessments ................................ 26
3.1 Functional unit ...................................................................... 31
3.2 Life cycle assessment of electronics ...................................... 32
3.3 Summary ............................................................................... 33
4 Methodology study of life cycle assessment of light sources ...... 35
4.1 Study of non-directional lamps used in households ............ 36
4.1.1 Methods .......................................................................... 36
4.1.2 Results ............................................................................ 39
4.2 Study of LED downlight luminaire .......................................40
4.2.1 Methods ..........................................................................40
4.2.2 Results ............................................................................ 43
4.3 Study of fluorescent lamp luminaire .................................... 47
4.3.1 Methods .......................................................................... 47
4.3.2 Results ............................................................................ 49
4.4 Study of street lighting luminaires ....................................... 51
4.4.1 Methods .......................................................................... 51
4.4.2 Results ............................................................................ 59
9
4.5 Summary ............................................................................... 63
5 Discussion ................................................................................... 67
6 Conclusions and recommendations ........................................... 70
References ........................................................................................ 705
Appendix I: Résumé en français ........................................................ 83
10
List of abbreviations and symbols
Abbreviations
ADP abiotic depletion potential
AP acidification potential
CCT correlated colour temperature
CFL compact fluorescent lamp
CIE Commission Internationale de l’Eclairage
International Commission on Illumination
CMH ceramic metal halide
CMOS complementary metal oxide semiconductor
CRI colour rendering index
CO2-eq. carbon dioxide equivalent
CSTB Centre Scientifique et Technique du Bâtiment
French Scientific and Technical Centre for Building
DEFRA Department for environment, food and rural affairs
DIALux lighting design software
DOE Department of Energy
DRAM dynamic random access memory
EIO economic input-output
ELCD European Reference Life Cycle Database
EoL end-of-life
EP eutrophication potential
ETSI European Telecommunications Standards Institute
EU European Union
GDP gross domestic product
GWP global warming potential
HID high intensity discharge
HPM high pressure mercury
HPS high pressure sodium
HTP human toxicity potential
ICT information and communication technology
ISO International Organization for Standardization
LCA life cycle assessment
LCC life cycle cost
11
LCIA life cycle impact assessment
LCI life cycle inventory
LCSA life cycle sustainability assessment
LED light-emitting diode
MH metal halide
NF norme française; French norm
ODP ozone depletion potential
PB payback time
PCB printed circuit board
PCR product category rule
POCP photochemical ozone creation potential
REACH registration, evaluation, authorisation and restriction
of chemical substances
RoHS restriction of the use of certain hazardous substances
RV residual value
SLCA social life cycle assessment
SPB simple payback time
SR surround ratio
THT through-hole technology
TI threshold increment
UNEP United Nations Environment Programme
US United States (of America)
WEEE waste electrical and electronic equipment
Symbols
Ci investment cost
Co operating cost
i rate of interest
Lave average road surface luminance
n year
Ul longitudinal luminance uniformity
Uo overall luminance uniformity
12
1 Introduction
Environmental impacts in general have become a concern increasingly from
the 1960’s. The scope of the concern was first local but has grown to global
questions with the globalization and internationalization. Traditionally, the
environmental concerns have lain in heavy process industry, intensive
agriculture and use of chemicals. Numerous methods have been introduced
to tackle the environmental hazards, such as changing the legislation,
creation of voluntary programs, informing the consumers, market
surveillance, and commercial sanctions. The energy consumption became
an environmental concern in the 1970’s. Since then, energy efficiency has
been an increasingly important issue not only from pollution perspective or
as a marketing argument but also from the point of view of the sufficiency
of energy sources.
The energy efficiency is related to the discussion of the enhancement of
global warming. It has been stated that unless fast, drastic measures are
taken to reduce the global greenhouse gas emissions, the overall costs of the
climate change will be equivalent to losing at least 5 % of global gross
domestic product (GDP) annually [1]. In addition, Stern [1] estimates that
the costs of the actions to avoid the worst impacts of climate change would
remain below 1 % of global GDP annually. It is debatable whether the
impacts of the enhanced climate change are noticeable already today [2] or
after decades [1].
The environmentalism has evolved from the energy concerns to a wider
scope: life cycle. The life cycle environmental impacts have become an issue
in the 2000’s when the holistic approach has been emphasized. The
environmental impacts of energy-related products, including electrical and
electronic equipment, have become an issue over the last decade. In the
European Union (EU), the energy-related products, to which light sources
belong, are noted as a significant cause for environmental impacts due to
the consumption of energy and raw materials. The increasing concern of
climate change and other environmental impacts has made the life cycle
approach increasingly used, since, by addressing the total life cycle, the
overall picture of the environmental aspects can be seen. The study of the
environmental aspects is becoming mainstream in many industry sectors,
Introduction
13
and consumers and organizations acknowledge increasingly the
environmental aspects of their actions.
Lighting sector consumes approximately 19 % of the global electrical
energy [3]. Thus, lighting is undisputedly an important part of the
reduction of energy consumption. As the lighting sector is undergoing
major changes due to the targets to increase energy efficiency and improve
the quality of lighting, it is appropriate to study the environmental aspects
of light sources.
This thesis is a monograph that presents four case studies of light sources
from the life cycle perspective: two cases of life cycle assessments (LCAs),
one case of LCA and life cycle cost (LCC) analysis combined, and one case
of LCC analysis. Three of the cases are based on published scientific papers
[4, 5, 6] and one based on a conference paper [7]. Studies based on
publications [6] and [7] are significantly developed from the original
publications in this work.
1.1 Background
The background for environmental thinking can be considered to date from
the 1960’s and the publication of the book “Silent spring” by Rachel Carson
in 1962 [8]. At the time, the interest of the environmental movement was in
the excessive, careless use of chemicals, such as pesticides.
The environmental movement has evolved from the emphasis of chemical
spills and energy shortage to a more overall sustainability. The
sustainability, or sustainable development, refers to a holistic view. The
sustainability is defined in the Brundtland report as the “development that
meets the needs of the present without compromising the ability of future
generations to meet their own needs” [9]. Total sustainability assessment is
a recent step in the assessment of life cycle impacts. Sustainability
assessment contains three pillars: environmental, economic and social
sustainability. The environmental LCA and economic LCC analysis are the
most established ones, while there is no established procedure for the
assessment of the social aspects. It is more challenging to assess the social
impacts due to the regional resolution [10, 11]. In addition, it has been
argued that it may be impossible or even unnecessary to assess the social
impacts in detail but in a larger scale [12].
The environmental aspects of electrical and electronic equipment have
originally concentrated on the substance restrictions, e.g., the directive on
the restriction of the use of certain hazardous substances in electrical and
electronic equipment (RoHS) in the EU and similar legislation in China,
and in defining the responsibilities in the end-of-life (EoL), e.g., the
directive on waste electrical and electronic equipment (WEEE) in the EU.
Introduction
14
Depending on the type of the electrical and electronic equipment, the
equipment may be in the scope of other legislation, such as low voltage
directive (2006/95/EC) [13]. In addition, the material restrictions, such as
the regulation on the registration, evaluation, authorisation and restriction
of chemical substances (REACH) [14], apply to electrical and electronic
equipment.
The EU acknowledges the importance of environmental thinking. They
have introduced a so called 20-20-20 policy [15] in which three targets shall
be met by 2020: reduction of greenhouse gas emissions by at least 20 %
compared to year 1990 level, 20 % of the energy to be renewable, and an
increase of 20 % in energy efficiency. The 20-20-20 policy is parallel to the
ecodesign legislation that aims at taking the whole life cycle of the energy-
related products into account.
Lighting consumes a notable share (19 %) of global electrical energy [3].
The fluorescent lamp and high intensity discharge (HID) lamp technologies
have traditionally accounted for the major shares of the global lighting
electricity consumption: 62 % and 27 % respectively in 2005 [3]. The share
of light-emitting diode (LED) technology has risen from practically
inexistent to a notable share: The share of LED technology is estimated at
6.2 % in 2010 and 9 % in 2011 in the EU, but it is strongly on the increase
[16, 17]. It is estimated that 45 % of general lighting will be provided by
LED technology in 2016 and 70 % in 2020 [17].
The background for environmental thinking regarding light sources lies
strongly in the legislation. There have been energy-saving campaigns and
programs from the early days of compact fluorescent lamps (CFLs), but it
was only after the Ecodesign directive and its implementing measures when
the energy efficiency of the light sources actually started to affect the buying
decisions. The higher purchase price of the CFLs compared to incandescent
lamp has hampered the more frequent use of CFLs despite the savings in
life cycle costs.
As the energy consumption is one of the undisputed key environmental
parameters of energy-related (formerly energy-using) products, it is natural
that the ecodegisn legislation in the EU [18] concentrates on improving the
energy efficiency of the products. Lighting products are listed in the
Ecodesign directive as one of the product group having a significant
environmental impact and a great potential for reducing environmental
impacts without causing excessive costs [18]. In addition, lighting, more
precisely the switch from incandescent lamps to LED lamps in residential
application, is acknowledged as a measure in which the global greenhouse
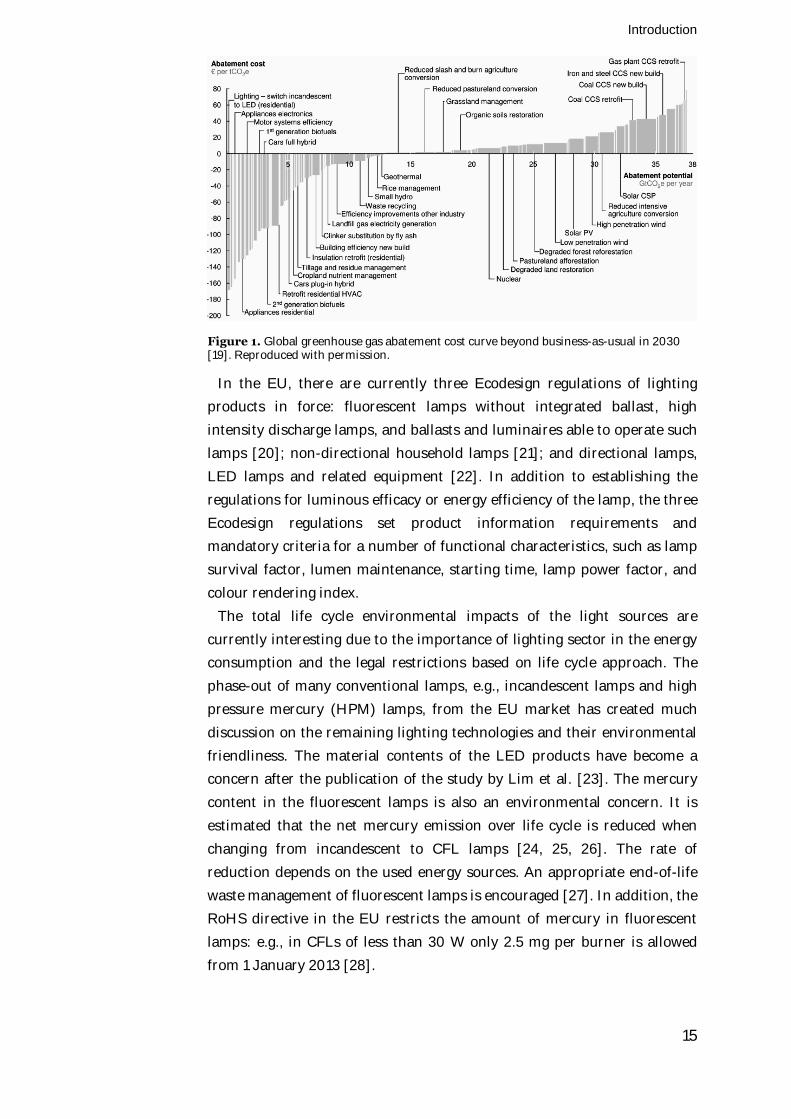
gas abatement is cost efficient (Figure 1) [19].
Introduction
15
Figure 1. Global greenhouse gas abatement cost curve beyond business-as-usual in 2030 [19]. Reproduced with permission.
In the EU, there are currently three Ecodesign regulations of lighting
products in force: fluorescent lamps without integrated ballast, high
intensity discharge lamps, and ballasts and luminaires able to operate such
lamps [20]; non-directional household lamps [21]; and directional lamps,
LED lamps and related equipment [22]. In addition to establishing the
regulations for luminous efficacy or energy efficiency of the lamp, the three
Ecodesign regulations set product information requirements and
mandatory criteria for a number of functional characteristics, such as lamp
survival factor, lumen maintenance, starting time, lamp power factor, and
colour rendering index.
The total life cycle environmental impacts of the light sources are
currently interesting due to the importance of lighting sector in the energy
consumption and the legal restrictions based on life cycle approach. The
phase-out of many conventional lamps, e.g., incandescent lamps and high
pressure mercury (HPM) lamps, from the EU market has created much
discussion on the remaining lighting technologies and their environmental
friendliness. The material contents of the LED products have become a
concern after the publication of the study by Lim et al. [23]. The mercury
content in the fluorescent lamps is also an environmental concern. It is
estimated that the net mercury emission over life cycle is reduced when
changing from incandescent to CFL lamps [24, 25, 26]. The rate of
reduction depends on the used energy sources. An appropriate end-of-life
waste management of fluorescent lamps is encouraged [27]. In addition, the
RoHS directive in the EU restricts the amount of mercury in fluorescent
lamps: e.g., in CFLs of less than 30 W only 2.5 mg per burner is allowed
from 1 January 2013 [28].
Introduction
16
1.2 Research problem
It is necessary to act immediately and effectively in order to reduce the
energy consumption and the greenhouse gas emissions. Lighting in general
is a notable global energy consumer, and as such, the measures for reducing
the energy consumption of lighting are effective and appropriate. However,
there is debate on the environmental aspects of light sources other than the
energy consumption during operation, such as the material contents and
end-of-life treatment. In addition, the characteristics and function of the
light sources are generally excluded from the environmental discussion but,
depending on the application, it is very important to determine where,
when and what kind of light is needed.
The research problem of the thesis is the lack of established rules for the
LCA of light sources. The lack of such rules and common methods creates
distortion and makes it difficult to numerically compare the results of the
LCAs. Yet, the comparison is possible on a qualitative level, e.g., in
Tähkämö et al. [29]. A qualitative comparison is possible if the results are
translated into a common unit, e.g., primary energy [30].
The lighting sector is filled with different light sources of different shapes
and sizes, which makes it difficult to compare their environmental and
economic performance. In addition, the LED technology provides new
possibilities for manufacturers to design luminaires, lamps, components
and packages containing LED chips. It is challenging to compare these
various-shaped LED light sources to conventional lamps and luminaires. It
is a major question in the LCA of light sources that on which basis the light
sources should be compared. The basis for the comparison in the LCA is the
functional unit that can be luminous flux, lumen-hours, hour, illuminance,
or something else.
1.3 Aim of the work
The primary aim of the work is to create a model for a method for
conducting the LCA of light sources. The model is needed for the
simplification of the LCA method in such a way that all major
environmental aspects are taken into account. The standards for the LCA
are broad and no detailed guidelines exist regarding LCAs of light sources.
In addition, the lighting sector is undergoing a major change from
conventional light sources, such as incandescent lamp in households and
high pressure mercury lamps in outdoor lighting, to modern, energy-
efficient alternatives, such as LED lamps and luminaires, due to legislative
and voluntary measures.
The model is developed on the basis of four environmental and/or
economic analyses of light sources conducted in this work. The four cases
Introduction
17
represent various lighting applications and light source technologies. The
idea is to study the characteristics of each case and to discuss the
methodology, conclude the findings and suggest the model.
The work addresses four lighting applications: non-directional lamps
typically used in households, a downlight luminaire used in commercial
buildings, a luminaire for industry premises, and street lighting luminaires.
The four cases were conducted in different methods of LCA and/or LCC
analysis due to the limited data and resource availability but also to study
different methods in order to analyse the differences of the methods. On the
basis of the case studies, the thesis concludes the findings and suggests an
appropriate method for conducting the LCA of light sources in general. The
LCC analyses within the work are intended for extending the sustainability
point of view and not to concentrate only on the environmental aspects.
A secondary aim of the work is to analyse the previous LCAs of light
sources and the LCAs conducted in this work to increase the knowledge on
the environmental aspects of light sources. The main findings of the LCAs
are identified in the work.
18
2 Life cycle assessment
Life cycle assessment (LCA) is a tool for systematically evaluate the
potential environmental impacts of a product or a service over its life cycle.
It compiles the inputs, outputs and the potential environmental impacts of
the analysed system. Numerous LCAs have been conducted and published
on various products and services during the last decade, and the LCA has
been established as an environmental tool for decision-making. The LCA
provides information on the environmental performance of the products for
many purposes, such as for the public procurement, enactment of the
legislation, and in purchase decision of the ecologically aware consumers.
The LCA is conducted including a whole life cycle from raw material
acquisition to end-of-life, i.e., from cradle to grave, or for a part of the life
cycle. The partial life cycle enables the analysis of certain stages of the life
cycle in detail, while the LCA of a whole life cycle gives an overview of the
total environmental impacts and is thus a holistic approach. Nevertheless,
the total LCA requires a large amount of data.
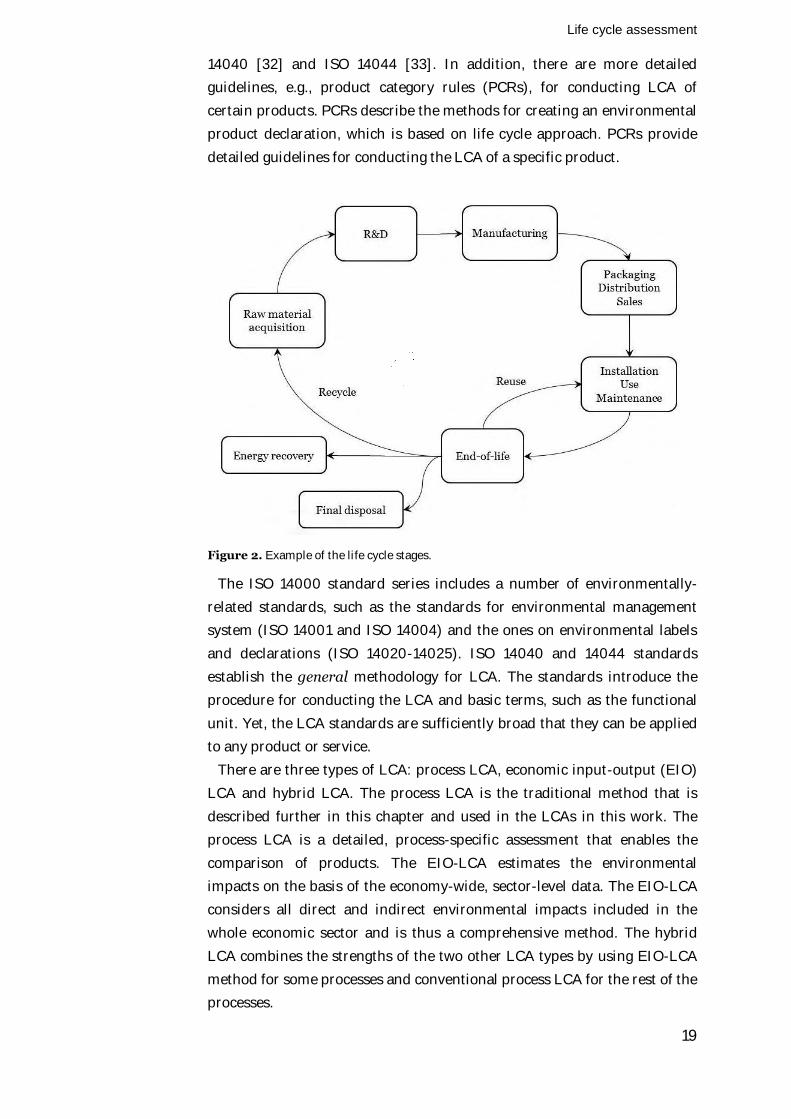
There are several ways to divide the life cycle into stages. An example of a
life cycle is presented in Figure 2. In the example, the life cycle starts with
the raw material acquisition and ends in the end-of-life containing multiple
alternatives from reuse to final disposal. Similarly, it is possible to divide
the stages differently, e.g., including the transport (distribution) separately
or in each stage, or combining packaging, transport and installation into
one stage: implementation.
There are no absolute rules on which stages to consider in an LCA, but it
depends on the product system to be analysed. A proxy may be used, such
as the European Telecommunications Standards Institute (ETSI) 103 199
technical specification for LCA of information and communication
technology (ICT) [31]. In the LCA of light sources, use is typically the life
cycle stage causing the greatest environmental impacts due to the energy
consumption [29]. Generally, the LCAs of light sources analyse the raw
material acquisition together with manufacturing, use, and end-of-life.
The LCA refers to an environmental LCA as a distinction among the
economic and social analyses. The LCA method is defined in standards ISO
Life cycle assessment
19
14040 [32] and ISO 14044 [33]. In addition, there are more detailed
guidelines, e.g., product category rules (PCRs), for conducting LCA of
certain products. PCRs describe the methods for creating an environmental
product declaration, which is based on life cycle approach. PCRs provide
detailed guidelines for conducting the LCA of a specific product.
Figure 2. Example of the life cycle stages.
The ISO 14000 standard series includes a number of environmentally-
related standards, such as the standards for environmental management
system (ISO 14001 and ISO 14004) and the ones on environmental labels
and declarations (ISO 14020-14025). ISO 14040 and 14044 standards
establish the general methodology for LCA. The standards introduce the
procedure for conducting the LCA and basic terms, such as the functional
unit. Yet, the LCA standards are sufficiently broad that they can be applied
to any product or service.
There are three types of LCA: process LCA, economic input-output (EIO)
LCA and hybrid LCA. The process LCA is the traditional method that is
described further in this chapter and used in the LCAs in this work. The
process LCA is a detailed, process-specific assessment that enables the
comparison of products. The EIO-LCA estimates the environmental
impacts on the basis of the economy-wide, sector-level data. The EIO-LCA
considers all direct and indirect environmental impacts included in the
whole economic sector and is thus a comprehensive method. The hybrid
LCA combines the strengths of the two other LCA types by using EIO-LCA
method for some processes and conventional process LCA for the rest of the
processes.
Life cycle assessment
20
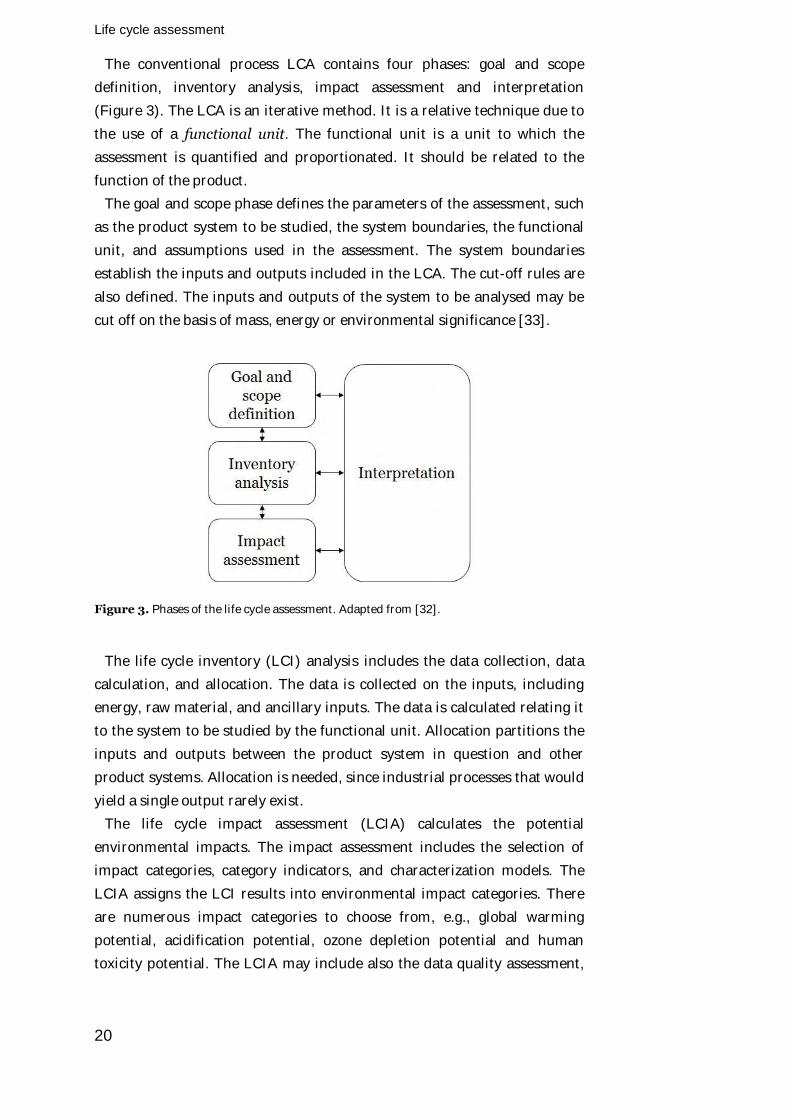
The conventional process LCA contains four phases: goal and scope
definition, inventory analysis, impact assessment and interpretation
(Figure 3). The LCA is an iterative method. It is a relative technique due to
the use of a functional unit. The functional unit is a unit to which the
assessment is quantified and proportionated. It should be related to the
function of the product.
The goal and scope phase defines the parameters of the assessment, such
as the product system to be studied, the system boundaries, the functional
unit, and assumptions used in the assessment. The system boundaries
establish the inputs and outputs included in the LCA. The cut-off rules are
also defined. The inputs and outputs of the system to be analysed may be
cut off on the basis of mass, energy or environmental significance [33].
Figure 3. Phases of the life cycle assessment. Adapted from [32].
The life cycle inventory (LCI) analysis includes the data collection, data
calculation, and allocation. The data is collected on the inputs, including
energy, raw material, and ancillary inputs. The data is calculated relating it
to the system to be studied by the functional unit. Allocation partitions the
inputs and outputs between the product system in question and other
product systems. Allocation is needed, since industrial processes that would
yield a single output rarely exist.
The life cycle impact assessment (LCIA) calculates the potential
environmental impacts. The impact assessment includes the selection of
impact categories, category indicators, and characterization models. The
LCIA assigns the LCI results into environmental impact categories. There
are numerous impact categories to choose from, e.g., global warming
potential, acidification potential, ozone depletion potential and human
toxicity potential. The LCIA may include also the data quality assessment,
Life cycle assessment
21
e.g., uncertainty and sensitivity analyses, and optional grouping and
weighting of the results.
The interpretation phase combines the findings of the LCI analysis and
LCIA. It concludes the main findings in accordance with the goal and scope
definition. The interpretation identifies the findings and presents them
clearly and consistently.
The functional unit is a key parameter in the LCA, especially in
comparative LCAs, in which two or more products are compared to each
other. The functional unit should be “consistent with the goal and scope of
the study”, “clearly defined” and “measurable” [33]. In case of electricity
production, the functional unit may be the production of 1 kWh of electrical
energy. When it comes to light sources, the appropriate functional unit may
be a specific amount of lumen-hours. The functional unit may be one piece
of a lamp if the lamps possess comparable qualities, such as luminous flux,
colour characteristics and luminous intensity distribution curve. To be
more precise, the functional unit may also consider the illumination on a
surface, e.g., the illuminance on a 1 m2 square surface at 1 m distance.
However, in this case, the LCA should compare light sources of the same
application.
Despite the LCA standards ISO 14040 and ISO 14044 and a number of
more detailed guides (e.g., PCRs), there are unlimited possibilities for
conducting an LCA. There are no established rules for the parameters of the
methodology, e.g., the choice of functional unit and used energy sources for
the LCA of light sources. Thus, there is room for different assessments, but
the results are not necessarily comparable.
2.1 Total sustainability assessment
Sustainability assessment refers to the life cycle sustainability assessment
(LCSA) that contains three pillars: environmental, economic and social
aspects. LCSA is defined as:
(1)
in which LCA stands for the environmental LCA, LCC life cycle costs, and
SLCA social LCA [11, 34, 35]. The SLCA is the newest of the pillars and is
currently being developed. The SLCA suffers from difficulties in
establishing the methodology and the lack of data, but the general interest
is increasing in acknowledging also the social aspect in the sustainability
discussion [35].
The total sustainability assessment is a large and challenging entity to
calculate over one product. LCA and LCC analyses are relatively easy to
Life cycle assessment
22
conduct on a single product: yet, there are many perspectives to consider,
e.g., from the manufacturer’s, consumer’s or municipality’s point of view
[11]. The social aspects include organization-specific aspects and they may
be classified according to the stakeholders; such as the workers, the society,
and the customers; or to the impact categories; such as human rights,
health and safety, and the cultural heritage [36].
The total sustainability assessment gives a very profound view to the
sustainability of a product system. However, it is difficult to conduct due to
the three pillars and their differences in methodologies. In addition, there
are no international standards for LCC or SLCA. Currently, the
methodological difficulties lie mainly in the consistency of system
boundaries in the three assessments [34, 35].
The social LCA is an assessment technique of social impacts that analyses
products and services, and considers the entire life cycle. It evaluates the
potential social and socio-economic impacts and gives a comprehensive
view to the sustainability. In contrast to LCA that is based on physical
quantities, the SLCA uses semi-quantitative and qualitative data. Thus, it is
not always possible to express the impacts in relation to a functional unit in
an SLCA [36]. The function of the product system needs to be defined as in
the LCA. The SLCA may use subjective, organization-specific and
geographic data but also generic data. The LCA uses frequently generic data
for processes used worldwide, but the significance of geographical location
is increasing in the LCA [36].
The SLCA provides information on the social aspects for the decision-
making. It attempts to improve the performance of an organization and the
well-being of the stakeholders [36]. The SLCA has the same structure as the
environmental LCA and it is likewise an iterative process.
2.2 Life cycle costing
In contrast to conventional cost accounting, life cycle costing takes into
account the costs occurring over the life cycle, i.e., the life cycle costs
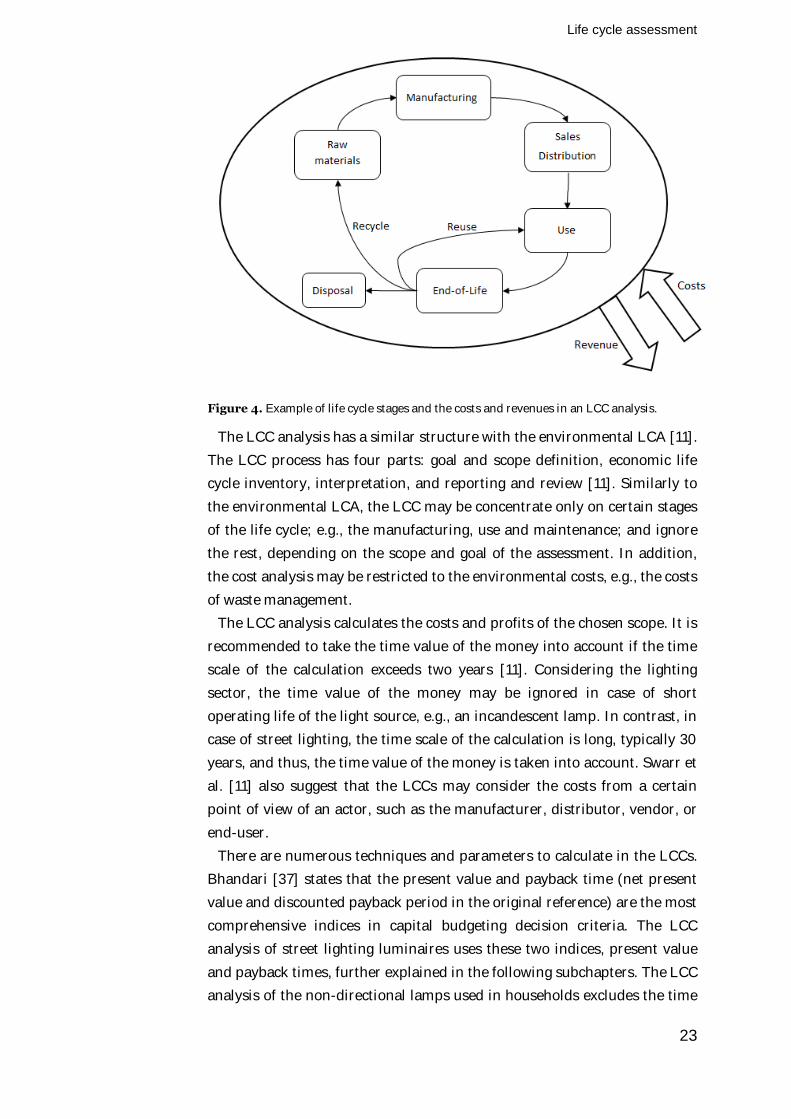
(LCCs). An example of the life cycle stages in an LCC analysis is presented
in Figure 4. While the environmental life cycle in Figure 2 described the
material and energy flows, Figure 4 expresses the monetary flows. Actually,
each individual life cycle stage should include costs as input and revenue as
output. The LCC analysis may consider the conventional costs of
manufacturing, use and EoL but also environmental costs, such as recycling
costs and emission fees, and social costs.
Life cycle assessment
23
Figure 4. Example of life cycle stages and the costs and revenues in an LCC analysis.
The LCC analysis has a similar structure with the environmental LCA [11].
The LCC process has four parts: goal and scope definition, economic life
cycle inventory, interpretation, and reporting and review [11]. Similarly to
the environmental LCA, the LCC may be concentrate only on certain stages
of the life cycle; e.g., the manufacturing, use and maintenance; and ignore
the rest, depending on the scope and goal of the assessment. In addition,
the cost analysis may be restricted to the environmental costs, e.g., the costs
of waste management.
The LCC analysis calculates the costs and profits of the chosen scope. It is
recommended to take the time value of the money into account if the time
scale of the calculation exceeds two years [11]. Considering the lighting
sector, the time value of the money may be ignored in case of short
operating life of the light source, e.g., an incandescent lamp. In contrast, in
case of street lighting, the time scale of the calculation is long, typically 30
years, and thus, the time value of the money is taken into account. Swarr et
al. [11] also suggest that the LCCs may consider the costs from a certain
point of view of an actor, such as the manufacturer, distributor, vendor, or
end-user.
There are numerous techniques and parameters to calculate in the LCCs.
Bhandari [37] states that the present value and payback time (net present
value and discounted payback period in the original reference) are the most
comprehensive indices in capital budgeting decision criteria. The LCC
analysis of street lighting luminaires uses these two indices, present value
and payback times, further explained in the following subchapters. The LCC
analysis of the non-directional lamps used in households excludes the time
Life cycle assessment
24
value of the money and calculates only the purchase and operating costs
with an emphasis to study the LCC methodology (mainly functional unit).
2.2.1 Present value
Present value method is a method for calculating the life cycle costs. It
measures the profitability and considers all cash flows and the time value of
the money [37]. It discounts all the returns and costs to present time by
using the rate of interest. For instance, the present value of LCCs comprises
of three parts:
(
)
(2)
which are the investment cost (Ci), discounted operating costs (Co) and the
discounted residual value (RV) [38, 39]. The operating costs and the
residual value are discounted on the basis of the rate of interest i during the
number of years n. The operating costs recur annually in uniform amounts,
but the residual value is assumed to occur only once at the end of the
operating life. Therefore, their discounted equations are as above (e.g., in
[39]).
2.2.2 Payback times
There are two methods to calculate payback times in LCC analysis: a simple
payback time (SPB) and the payback time (PB). The SPB is easy to
calculate, but it does not consider all the cash flows or the time value of the
money, and it does not ensure profitability [37]. However, the SPB is used
due to its easy calculation method: it is calculated by dividing the
investment costs by the savings from the investment. If either type of a
payback time is calculated in a renovation case, the savings are resulted
from the renovation, e.g., reduction in the energy consumption or in the
maintenance costs.
The PB, also known as discounted payback time, takes the time value of
the money into account. That causes the equation to be a more complex
one. In case of equal cash flows and discrete discounting, the PB is
calculated as follows:
(
)
(3)
where i is the rate of interest, Ci the sum of investment costs, and Co,old and
Co,new are the operating costs of the old and new installation, respectively
[37]. Due to the nature of the equation, however, it is not possible to
Life cycle assessment
25
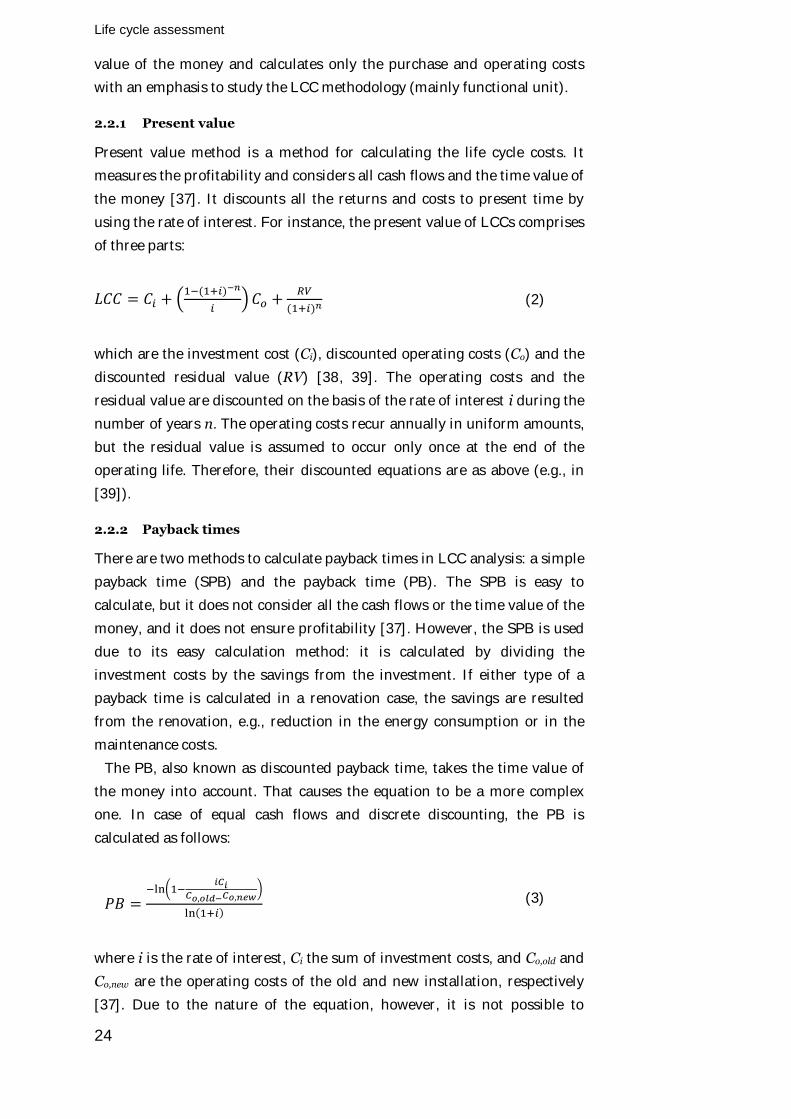
calculate PB in every case. PB can be calculated and results in a positive
number only if the operating costs of the new installation are smaller than
the ones of the old installation, and the annual savings from operating costs
divided by the rate of interest exceed the investment cost.
26
Ana
lysis
of p
revio
us life
cycle
assessm
ents
3 Analysis of previous life cycle assessments
Several LCAs of light sources have been published during the last two
decades. The early studies have compared mainly the incandescent lamp
and the CFL (e.g., [40, 41, 42, 43]), while the more recent assessments
include also LED light sources [30, 44, 45, 46] or even a wide range of
lighting products [47, 48].
Two review works have recently been published analysing the previous
LCAs of light sources: United States (US) Department of Energy (DOE)
report part 1 [30], and Tähkämö et al. [29]. The former analysed ten
published LCA studies from which it collected the primary energy data for
incandescent lamp, CFL, LED lamp and a future LED lamp. The future
estimate of LED lamp considered the technology development in luminous
efficacy and operating life by year 2015. The analysis covered the energy
embodied in the materials of the lamps, the energy used in the
transportation, and the energy used during the operation of the lamp, all of
which were calculated for a functional unit of 20 megalumen-hours. The
review concluded that the CFL and LED lamps had similar primary energy
consumption of approximately 3 900 MJ per functional unit, while the
incandescent lamp required three times more primary energy,
approximately 15 100 MJ per functional unit.
The latter analysis by Tähkämö et al. [29] collected the data of 13 previous
LCAs. It used also other sources of information, such as the Ecodesign
report [49] and lighting industry (European Lamp Companies) [50]. This
review article did not compare quantitatively the results but collected the
key parameters of the LCAs, such as the functional units and the
environmental impact categories. In addition, it identified the challenges in
the comparison of the assessments, including the differences in the
methodology, light sources, and impact categories.
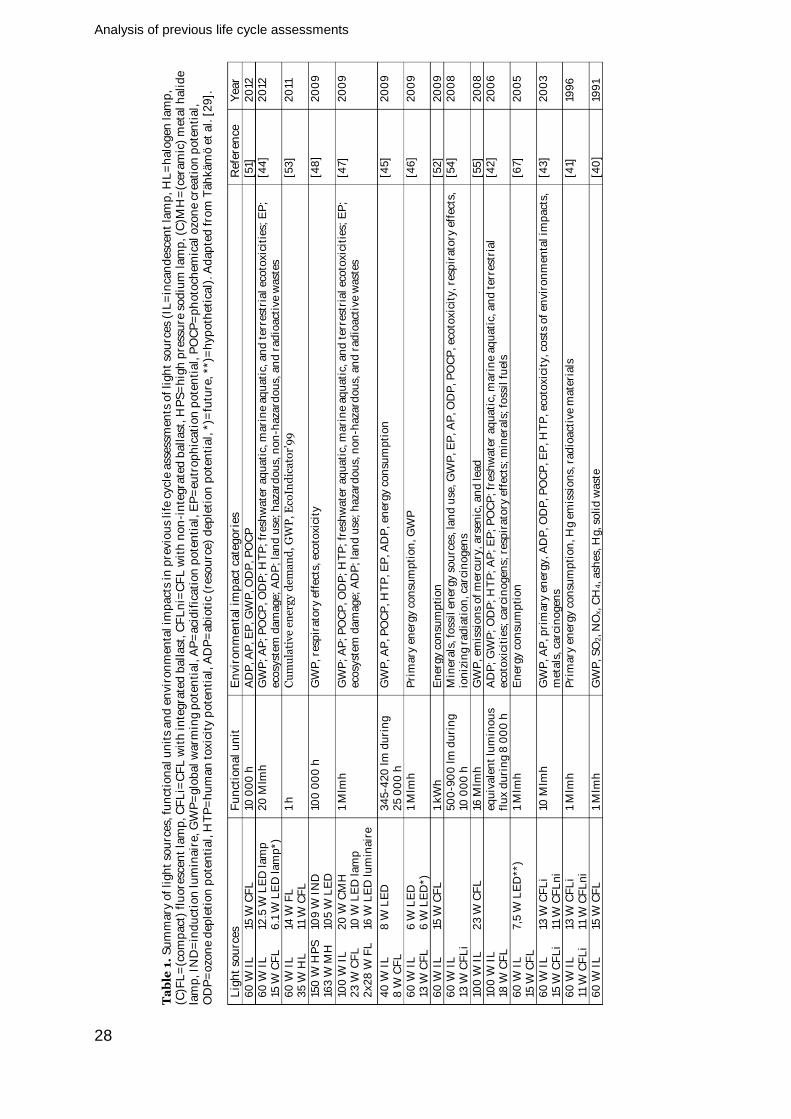
A summary of the previous LCAs is presented in Table 1. It is based on
Tähkämö et al. [29] but updated by adding two recent publications [51, 44].
Table 1 shows the main differences in the LCAs. The assessed light sources
included typically an incandescent lamp and a CFL but also an LED lamp
Analysis of previous life cycle assessments
27
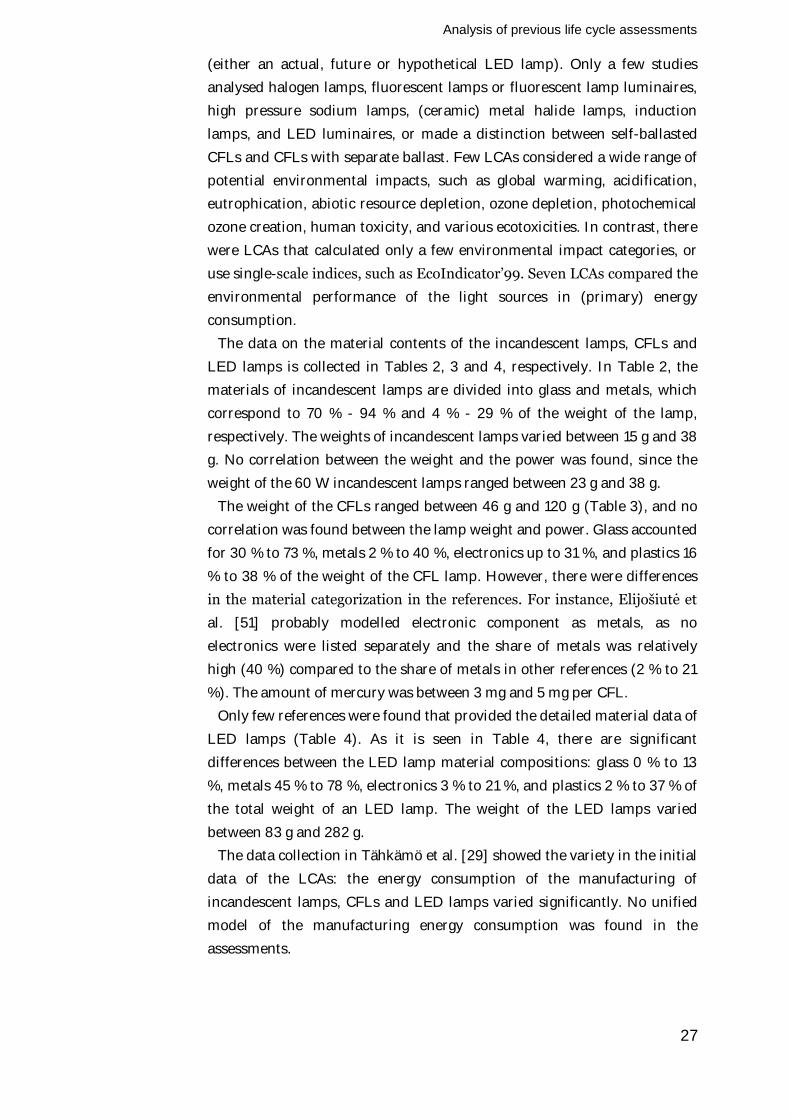
(either an actual, future or hypothetical LED lamp). Only a few studies
analysed halogen lamps, fluorescent lamps or fluorescent lamp luminaires,
high pressure sodium lamps, (ceramic) metal halide lamps, induction
lamps, and LED luminaires, or made a distinction between self-ballasted
CFLs and CFLs with separate ballast. Few LCAs considered a wide range of
potential environmental impacts, such as global warming, acidification,
eutrophication, abiotic resource depletion, ozone depletion, photochemical
ozone creation, human toxicity, and various ecotoxicities. In contrast, there
were LCAs that calculated only a few environmental impact categories, or
use single-scale indices, such as EcoIndicator’99. Seven LCAs compared the
environmental performance of the light sources in (primary) energy
consumption.
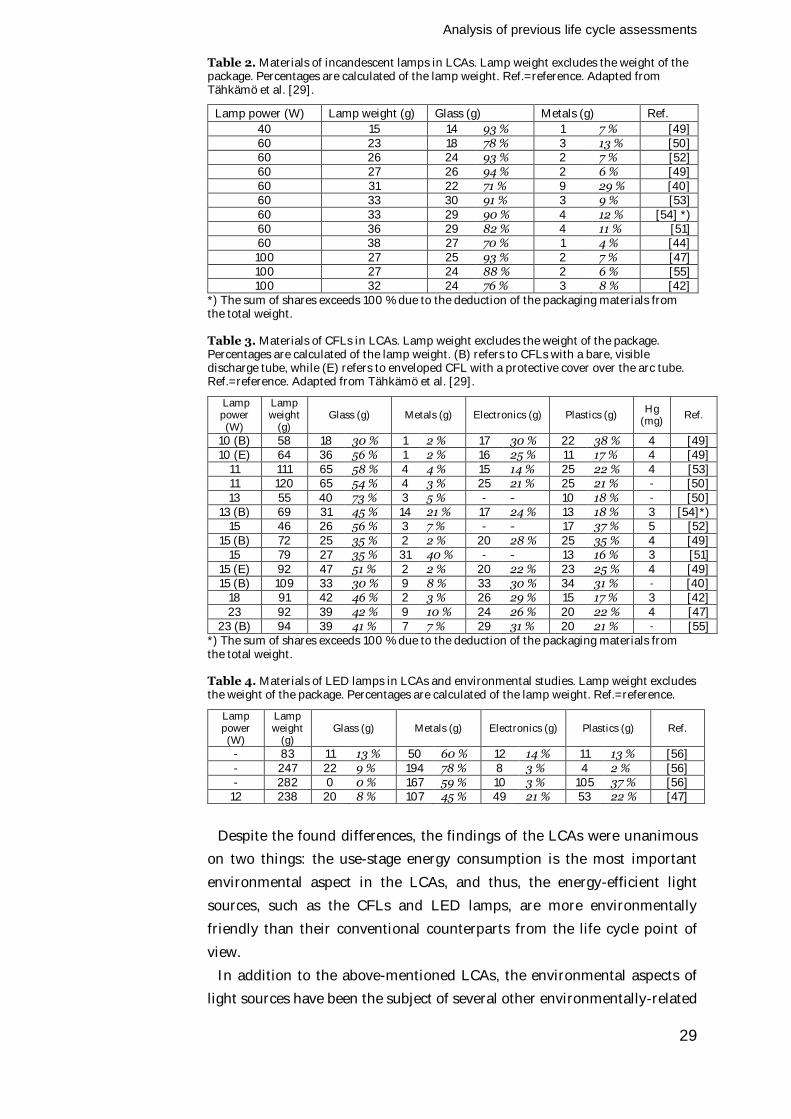
The data on the material contents of the incandescent lamps, CFLs and
LED lamps is collected in Tables 2, 3 and 4, respectively. In Table 2, the
materials of incandescent lamps are divided into glass and metals, which
correspond to 70 % - 94 % and 4 % - 29 % of the weight of the lamp,
respectively. The weights of incandescent lamps varied between 15 g and 38
g. No correlation between the weight and the power was found, since the
weight of the 60 W incandescent lamps ranged between 23 g and 38 g.
The weight of the CFLs ranged between 46 g and 120 g (Table 3), and no
correlation was found between the lamp weight and power. Glass accounted
for 30 % to 73 %, metals 2 % to 40 %, electronics up to 31 %, and plastics 16
% to 38 % of the weight of the CFL lamp. However, there were differences
in the material categorization in the references. For instance, Elijošiutė et
al. [51] probably modelled electronic component as metals, as no
electronics were listed separately and the share of metals was relatively
high (40 %) compared to the share of metals in other references (2 % to 21
%). The amount of mercury was between 3 mg and 5 mg per CFL.
Only few references were found that provided the detailed material data of
LED lamps (Table 4). As it is seen in Table 4, there are significant
differences between the LED lamp material compositions: glass 0 % to 13
%, metals 45 % to 78 %, electronics 3 % to 21 %, and plastics 2 % to 37 % of
the total weight of an LED lamp. The weight of the LED lamps varied
between 83 g and 282 g.
The data collection in Tähkämö et al. [29] showed the variety in the initial
data of the LCAs: the energy consumption of the manufacturing of
incandescent lamps, CFLs and LED lamps varied significantly. No unified
model of the manufacturing energy consumption was found in the
assessments.
Analysis of previous life cycle assessments
28
Ta
ble
1.
Su
mm
ary
of
lig
ht
sou
rces
, fu
nct
ion
al
un
its
an
d e
nv
iro
nm
enta
l im
pa
cts
in p
rev
iou
s li
fe c
ycl
e a
sses
smen
ts o
f li
gh
t so
urc
es (
IL=
inca
nd
esc
ent
lam
p,
HL
=h
alo
gen
la
mp
, (C
)FL
=(c
om
pa
ct)
flu
ore
scen
t la
mp
, C
FL
i=C
FL
wit
h i
nte
gra
ted
ba
lla
st,
CF
Ln
i=C
FL
wit
h n
on
-in
teg
rate
d b
all
ast
, H
PS
=h
igh
pre
ssu
re s
od
ium
la
mp
, (C
)MH
=(c
era
mic
) m
eta
l h
ali
de
lam
p,
IND
=in
du
ctio
n l
um
ina
ire,
GW
P=
glo
ba
l w
arm
ing
po
ten
tia
l, A
P=
aci
dif
ica
tio
n p
ote
nti
al,
EP
=eu
tro
ph
ica
tio
n p
ote
nti
al,
PO
CP
=p
ho
toch
emic
al
ozo
ne
crea
tio
n p
ote
nti
al,
O
DP
=o
zon
e d
eple
tio
n p
ote
nti
al,
HT
P=
hu
ma
n t
ox
icit
y p
ote
nti
al,
AD
P=
ab
ioti
c (r
eso
urc
e) d
eple
tio
n p
ote
nti
al,
*)=
futu
re,
**)=
hy
po
thet
ica
l).
Ad
ap
ted
fro
m T
äh
kä
mö
et
al.
[2
9].
Lig
ht
sou
rce
s F
un
ctio
na
l u
nit
E
nv
iro
nm
en
tal
imp
act
ca
teg
ori
es
Ref
eren
ce
Yea
r 6
0 W
IL
15
W C
FL
10
00
0 h
A
DP
, A
P,
EP
, G
WP
, O
DP
, P
OC
P
[51]
2
012
6
0 W
IL
15
W C
FL
12
.5 W
LE
D l
am
p
6.1
W L
ED
la
mp
*)
20
Mlm
h
GW
P;
AP
; P
OC
P,
OD
P;
HT
P;
fre
shw
ate
r a
qu
ati
c, m
ari
ne
aq
ua
tic,
an
d t
erre
stri
al
eco
tox
icit
ies;
EP
; ec
osy
stem
da
ma
ge;
AD
P;
lan
d u
se;
ha
zard
ou
s, n
on
-ha
zard
ou
s, a
nd
ra
dio
act
ive
wa
stes
[4
4]
20
12
60
W I
L
35
W H
L
14 W
FL
11
W C
FL
1
h
Cu
mu
lati
ve
ener
gy
dem
an
d,
GW
P,
Eco
Ind
ica
tor’
99
[5
3]
20
11
150
W H
PS
16
3 W
MH
10
9 W
IN
D
105
W L
ED
10
0 0
00
h
GW
P,
resp
ira
tory
eff
ects
, ec
oto
xic
ity
[48
] 2
00
9
100
W I
L
23
W C
FL
2
x2
8 W
FL
20
W C
MH
10
W L
ED
la
mp
16
W L
ED
lu
min
air
e
1 M
lmh
G
WP
; A
P;
PO
CP
, O
DP
; H
TP
; fr
esh
wa
ter
aq
ua
tic,
ma
rin
e a
qu
ati
c, a
nd
ter
rest
ria
l ec
oto
xic
itie
s; E
P;
eco
syst
em d
am
ag
e; A
DP
; la
nd
use
; h
aza
rdo
us,
no
n-h
aza
rdo
us,
an
d r
ad
ioa
ctiv
e w
ast
es
[47
] 2
00
9
40
W I
L
8 W
CF
L
8 W
LE
D
34
5-4
20
lm
du
rin
g
25
00
0 h
G
WP
, A
P,
PO
CP
, H
TP
, E
P,
AD
P,
ener
gy
co
nsu
mp
tio
n
[45
] 2
00
9
60
W I
L
13 W
CF
L
6 W
LE
D
6 W
LE
D*)
1
Mlm
h
Pri
ma
ry e
ner
gy
co
nsu
mp
tio
n,
GW
P
[46
] 2
00
9
60
W I
L
15 W
CF
L
1 k
Wh
E
ner
gy
co
nsu
mp
tio
n
[52
] 2
00
9
60
W I
L
13 W
CF
Li
50
0-9
00
lm
du
rin
g
10 0
00
h
Min
era
ls,
foss
il e
ner
gy
so
urc
es,
lan
d u
se,
GW
P,
EP
, A
P,
OD
P,
PO
CP
, ec
oto
xic
ity
, re
spir
ato
ry e
ffec
ts,
ion
izin
g r
ad
iati
on
, ca
rcin
og
ens
[54
] 2
00
8
100
W I
L
23
W C
FL
16
Mlm
h
GW
P,
emis
sio
ns
of
mer
cury
, a
rsen
ic,
an
d l
ead
[5
5]
20
08
10
0 W
IL
18
W C
FL
equ
iva
len
t lu
min
ou
s fl
ux
du
rin
g 8
00
0 h
A
DP
; G
WP
; O
DP
; H
TP
; A
P;
EP
; P
OC
P;
fres
hw
ate
r a
qu
ati
c, m
ari
ne
aq
ua
tic,
an
d t
erre
stri
al
eco
tox
icit
ies;
ca
rcin
og
ens;
res
pir
ato
ry e
ffec
ts;
min
era
ls;
foss
il f
uel
s [4
2]
20
06
60
W I
L
15 W
CF
L
7,5
W L
ED
**)
1 M
lmh
E
ner
gy
co
nsu
mp
tio
n
[67
] 2
00
5
60
W I
L
15 W
CF
Li
13 W
CF
Li
11 W
CF
Ln
i 10
Mlm
h
GW
P,
AP
, p
rim
ary
en
erg
y,
AD
P,
OD
P,
PO
CP
, E
P,
HT
P,
eco
tox
icit
y,
cost
s o
f en
vir
on
men
tal
imp
act
s,
met
als
, ca
rcin
og
ens
[43
] 2
00
3
60
W I
L
11 W
CF
Li
13 W
CF
Li
11 W
CF
Ln
i 1
Mlm
h
Pri
ma
ry e
ner
gy
co
nsu
mp
tio
n,
Hg
em
issi
on
s, r
ad
ioa
ctiv
e m
ate
ria
ls
[41]
19
96
60
W I
L
15 W
CF
L
1 M
lmh
G
WP
, S
O2,
NO
x,
CH
4,
ash
es,
Hg
, so
lid
wa
ste
[40
] 19
91
Analysis of previous life cycle assessments
29
Table 2. Materials of incandescent lamps in LCAs. Lamp weight excludes the weight of the package. Percentages are calculated of the lamp weight. Ref.=reference. Adapted from Tähkämö et al. [29].
Lamp power (W) Lamp weight (g) Glass (g) Metals (g) Ref.
40 15 14 93 % 1 7 % [49] 60 23 18 78 % 3 13 % [50] 60 26 24 93 % 2 7 % [52] 60 27 26 94 % 2 6 % [49] 60 31 22 71 % 9 29 % [40] 60 33 30 91 % 3 9 % [53] 60 33 29 90 % 4 12 % [54] *) 60 36 29 82 % 4 11 % [51] 60 38 27 70 % 1 4 % [44] 100 27 25 93 % 2 7 % [47] 100 27 24 88 % 2 6 % [55] 100 32 24 76 % 3 8 % [42]
*) The sum of shares exceeds 100 % due to the deduction of the packaging materials from the total weight.
Table 3. Materials of CFLs in LCAs. Lamp weight excludes the weight of the package. Percentages are calculated of the lamp weight. (B) refers to CFLs with a bare, visible discharge tube, while (E) refers to enveloped CFL with a protective cover over the arc tube. Ref.=reference. Adapted from Tähkämö et al. [29].
Lamp power
(W)
Lamp weight
(g) Glass (g) Metals (g) Electronics (g) Plastics (g)
Hg (mg)
Ref.
10 (B) 58 18 30 % 1 2 % 17 30 % 22 38 % 4 [49] 10 (E) 64 36 56 % 1 2 % 16 25 % 11 17 % 4 [49]
11 111 65 58 % 4 4 % 15 14 % 25 22 % 4 [53] 11 120 65 54 % 4 3 % 25 21 % 25 21 % - [50] 13 55 40 73 % 3 5 % - - 10 18 % - [50]
13 (B) 69 31 45 % 14 21 % 17 24 % 13 18 % 3 [54]*) 15 46 26 56 % 3 7 % - - 17 37 % 5 [52]
15 (B) 72 25 35 % 2 2 % 20 28 % 25 35 % 4 [49] 15 79 27 35 % 31 40 % - - 13 16 % 3 [51]
15 (E) 92 47 51 % 2 2 % 20 22 % 23 25 % 4 [49] 15 (B) 109 33 30 % 9 8 % 33 30 % 34 31 % - [40]
18 91 42 46 % 2 3 % 26 29 % 15 17 % 3 [42] 23 92 39 42 % 9 10 % 24 26 % 20 22 % 4 [47]
23 (B) 94 39 41 % 7 7 % 29 31 % 20 21 % - [55] *) The sum of shares exceeds 100 % due to the deduction of the packaging materials from the total weight.
Table 4. Materials of LED lamps in LCAs and environmental studies. Lamp weight excludes the weight of the package. Percentages are calculated of the lamp weight. Ref.=reference.
Lamp power
(W)
Lamp weight
(g) Glass (g) Metals (g) Electronics (g) Plastics (g) Ref.
- 83 11 13 % 50 60 % 12 14 % 11 13 % [56] - 247 22 9 % 194 78 % 8 3 % 4 2 % [56] - 282 0 0 % 167 59 % 10 3 % 105 37 % [56]
12 238 20 8 % 107 45 % 49 21 % 53 22 % [47]
Despite the found differences, the findings of the LCAs were unanimous
on two things: the use-stage energy consumption is the most important
environmental aspect in the LCAs, and thus, the energy-efficient light
sources, such as the CFLs and LED lamps, are more environmentally
friendly than their conventional counterparts from the life cycle point of
view.
In addition to the above-mentioned LCAs, the environmental aspects of
light sources have been the subject of several other environmentally-related
Analysis of previous life cycle assessments
30
studies. The end-of-life of LED lamps and luminaires was studied by
Hendrickson et al. [56]. They stated that it is possible to reduce the
environmental impacts of a solid-state lighting product by implementing
design for end-of-life in the product development, e.g., by facilitating the
disassembly and enabling the recovery of components, parts and materials
to be reused or remanufactured. The material contents of indicator-type
LED components of various colours have been studied by Lim et al. [23].
Their leachability tests proposed that the LED components – varying by the
colour of the LED – may contain copper, lead, nickel and silver so much
that some of the indicator LEDs are classified as hazardous according to the
Californian regulations [57]. A new study by Lim et al. [58] continued by
including the whole LED lamps and comparing their metal contents by the
leachability tests. They found out that the studied CFLs and LED lamps
were classified as hazardous waste under existing Californian regulations
[57] and US federal regulations [59]. CFLs contained copper, lead and zinc,
and LED lamp copper and lead above the limits of the regulations. In
contrast, a US DOE report [60] indicated that the US federal regulations
are generally complied by the tested CFLs and LED lamps, while the stricter
Californian thresholds were typically exceeded by all lamps (incandescent
lamps, CFLs, LED lamps) regarding copper and by CFLs and LED lamps
regarding antimony and zinc.
It shall be noted that the study by Lim et al. [58] and US DOE report [60]
are conducted for lamps available in the US market, where no federal
legislation on the restriction of hazardous substances in electrical and
electronic equipment exist, except for a state-wide regulation in California
[61] similar to EU RoHS. The studies indicate that CFL and LED lamps may
be classified as hazardous substances in the US. However, a study
concerning the lamps in the European market should be established, and
the material contents of LED lamps to be compared to other electronic
products.
In addition to the comparative LCAs of lamps and luminaires, there are
separate LCAs of single lighting products. Dubberley et al. [62] analysed the
environmental impacts of an intelligent lighting system for commercial
buildings in the US. The lighting system consisted of a sensor, wireless
network, ballast and batteries. Their main finding was that the potential
environmental impacts of an intelligent system are significantly lower (18 to
344 times smaller) compared to a conventional lighting system. The LCA of
an emergency light was conducted by Neri et al. [63]. They concluded that
the most environmentally-relevant components are the battery, lamp and
the circuit board. A fluorescent lamp was the subject of a non-comparative
LCA by Techato et al. [64]. They calculated the amount of waste from
Analysis of previous life cycle assessments
31
fluorescent lamps and an air-conditioner. The analysis of the fluorescent
lamp resulted in a significant amount of hazardous waste compared to bulk
waste, but the amount of any type of waste was very low compared to the
total weight of the lamp. However, the amount of hazardous waste became
relevant when the scope is widened to national. The ballasts for fluorescent
lamps have been analysed by Valkama and Keskinen [65] and Bakri [66].
Both of the LCAs concluded that the use-stage energy consumption was the
major environmental aspect. Valkama and Keskinen stated also that the use
of simplified LCA (EcoReport -tool) may cause significant changes in the
LCA results of the electronic products.
3.1 Functional unit
A variety of functional units were used in the LCAs of light sources. The
functional unit was typically an amount of lumen-hours, e.g., 1 Mlmh, or an
amount of luminous flux over a certain operating time, e.g., 500 to 900 lm
over 10 000 h (Table 1). In the latter case, the functional unit was not
equivalent (500 lm compared to 900 lm). However, the functional unit
shall be clearly defined according to ISO 14044 standard [33]. This was not
complied in three LCAs [45, 54, 42], in which the functional units were 345-
420 lm over 25 000 h, 500-900 lm over 10 000 h, or equivalent light
output over 8 000 h (assumed to signify equivalent luminous flux),
respectively.
The lumen-hour seems to be an appropriate functional unit for light
sources, as it considers both the operating hours and luminous flux.
However, it excludes all other characteristics, such as luminous intensity
distribution curve or colour, and ignores the application of the light source.
The luminous flux of an incandescent lamp remains constant during its
life. In contrast, the luminous flux of a fluorescent lamp, high intensity
discharge lamp, or LED light source is not constant but depreciates over the
operating time. None of the LCAs in Table 1 take lumen depreciation into
account in the calculations, yet three assessments acknowledge it [47, 45,
67]. The lumen depreciation is stated to be too small to impact the results
[45].
There were also other functional units used in the LCAs as seen in Table 1,
such as an amount of hours or a kilowatt-hour. Using an hour of lighting as
the functional unit, as in [53], is not clear, since it does not define the
luminous flux, or whether the hour refers to an hour of the operating time
or to a period of time. Kilowatt-hour is not a representative functional unit
in case of light sources, since it does not reflect the function of the product.
In addition, a lighting engineering approach for functional unit was
presented by Yabumoto et al. by using two functional units: total luminous
Analysis of previous life cycle assessments
32
flux of 800 lm during 40000 h, and 100 lx floor illuminance at a distance of
1 m directly under the light source during 40000 h [68]. This functional
unit took the actual illumination into account, even though it is restricted to
only one example of illuminance at a certain distance.
3.2 Life cycle assessment of electronics
The market of electrical and electronic products is expanding
phenomenally. It is challenging to find an appropriate method for the LCA
of electronic products to assess their environmental impacts.
Despite of the similarities of the electrical and electronic equipment, the
assessments of their environmental impacts differ from each other [69].
The electronic products have generally short innovation time, their use
patterns change, and they use highly special materials, while electrical
products are innovated more slowly, their use patterns are more stable and
well known, and they use common materials [69]. The difference in the
LCA of electrical and electronic products is also visible in the comparison of
an incandescent lamp and an LED lamp due to their differences in
composition, rate of development and potential applications. Fluorescent
and CFL lamps fall into between of the two product types with a mediocre
innovation time, somewhat established use patterns and relatively special
materials. In fluorescent lamp luminaires, there is always some electronics,
since a ballast, either integrated or non-integrated, is needed.
The challenges in the LED product LCAs are mainly the same as in
electronic products in general. Moreover, it has been disputed whether the
LCA is an appropriate method for analysing the environmental impacts of
electronic equipment in detail at all [69, 70]. The LCA of the electronic
products are challenging to conduct thoroughly and in detail due to the
complexity of the products, lack of specific data, data gaps in the LCIA,
short innovation time and changing use patterns [71, 69]. However, the
LCA is acknowledged to be used in screening the life cycle of electrical and
electronic equipment in order to identify the environmental hot spots of the
life cycle [69]. Some level of simplification is needed in the LCA of electrical
and especially electronic products due to their complexity and lack of
specific data.
The LED component is a semiconductor. The life cycle environmental
impacts of semiconductors have recently been a topic of a book by Boyd
[72]. The book does not consider the diode technology particularly, but the
semiconductor technology was represented by complementary metal oxide
semiconductor (CMOS) logic, flash memory, and dynamic random access
memory (DRAM). They are the three most common semiconductors
globally. Boyd concluded that the environmental impacts of
Analysis of previous life cycle assessments
33
semiconductors are dominated by the electricity consumption in the use
stage. The second greatest environmental concern of the semiconductors is
the energy use in the manufacturing stage, and the third greatest are the
process emissions in wafer fabrication, such as perfluorinated compounds.
When comparing the inventory and the results by Boyd [72] and US DOE
[44], it is found that the manufacturing process of the LED chip and
transforming it to an LED package has inputs and outputs that are
somewhat different from the ones of the CMOS, flash memory or DRAM
devices. The use of chemicals differs greatly (e.g., different chemicals and
amount). The wafer fabrication for an LED chip consumed 42.57 kWh per
3-inch wafer, i.e., approximately 0.93 kWh/cm2 according to US DOE [44],
while Boyd estimated the energy consumption of wafer fabrication range
between 0.5 and 0.7 kWh/cm2 of wafer area in 1999-2005. Another study
estimated that the wafer production consumes approximately 1.5 kWh/cm2
[73]. No further comparison is made between the LED chip manufacturing
and the manufacturing of CMOS, flash memory and DRAM devices due to
the apparent differences in the manufacturing processes to a final product
and the applications.
3.3 Summary
A number of LCAs of lamps and luminaires have been conducted over the
last two decades, most of which compared incandescent lamps to CFLs.
Currently, there are increasingly LCAs of various light sources, especially
LED lamps and luminaires. Several differences were found in the previous
LCAs of light sources. First, it was impossible to create a unified model for
the energy consumption in manufacturing, as the data varied so much in
incandescent lamps, CFLs and LED lamps. In addition, the material
contents of incandescent lamps, CFLs and LED lamps varied in the LCAs
and other references. Due to this and the scarcity of material data for LED
lamps, it was impossible to create a consistent model of the material
contents. Second, the LCAs use a variety of functional units from
megalumen-hours to one piece of a lamp or one hour. Third, the studied
environmental impacts vary, as there is a number of potential
environmental impact categories to choose from, such as global warming,
acidification, eutrophication, ozone depletion, abiotic resource depletion
and human toxicity.
Despite the apparent differences in the LCA methodologies, the LCAs of
light sources generally conclude similar findings: The use stage accounts for
the majority of the environmental impacts due to the energy consumption,
while other stages, such as raw material acquisition, manufacturing and
Analysis of previous life cycle assessments
34
EoL, cause only fairly marginal total life cycle impacts. Thus, the luminous
efficacy of the light source determines the environmental performance of
the light source for the most part. Lamps and luminaires having high
luminous efficacies, such as CFLs, fluorescent lamps, LED lamps and
luminaires, and induction luminaire, were found to be the most
environmentally friendly compared to the lamps and luminaires of lower
luminous efficacies, such as incandescent lamp, halogen lamp, high
pressure sodium (HPS) luminaire and metal halide (MH) luminaire.
Many light sources, such as LED lamps and luminaires, fluorescent lamp
luminaires and HID luminaires, contain electronic components. It is
challenging to assess the environmental impacts of electronic products in
detail, since there are no LCIA data available for every type of electronic
component in a certain geographic location. Hence, it is necessary to use
some level of simplification and approximations in the LCAs of electronics.
It is stated that the use stage is a major cause for environmental impacts in
semiconductors [72]. In addition, the LCA is accepted as a tool to identify
the environmental hot spots of electrical and electronic products.
Nevertheless, it must be noted that the LCA of such products always
contains uncertainty due to the lack of product- or geographically specific
data.
35
Meth
odo
logy s
tudy o
f life c
ycle
assessm
ent
of lig
ht s
ourc
es
4 Methodology study of life cycle assessment of light sources
This chapter describes a methodology study of the LCA of light sources.
Four lighting cases are introduced in the study: non-directional lamps used
in households, LED downlight luminaire, fluorescent lamp luminaire, and
street lighting luminaires. The cases differ from each other in the lighting
application and the lighting criteria. In addition, they are common
applications and thus were considered as appropriate cases for the analysis.
Each of the case is analysed separately due to the apparent difference in the
applications, but, as a result, the findings are summarized.
The cases introduce either environmental or economic perspective or
both. The case on the non-directional lamps typically used in households
considers both environmental and economic perspectives, while the LED
and fluorescent lamp luminaire cases concentrate on the environmental
impacts in the LCAs of the products. The street lighting case includes only
the economic analysis and is the only case of only LCC analysis and not an
LCA. Social aspects are excluded from the scope of the analyses.
The requirements for lighting differ by the application, and thus, different
products are used in different applications. Incandescent lamps are
typically used in general lighting in households, but, as they are being
phased out in the EU, a comparison of incandescent lamp to its
replacement options (CFL and LED lamp) is in order. The LCCs of the
household lighting are calculated from the customer’s point of view. The
lighting criteria in households include generally only the luminous flux and
the colour temperature. The LED downlight luminaire in question is usually
installed in commercial applications and the fluorescent lamp luminaire in
industry premises. The street lighting case compares the LCCs of luminaires
used in street lighting. The LCCs of the street lighting are covered from the
point of view of the municipality.
Methodology study of life cycle assessment of light sources
36
4.1 Study of non-directional lamps used in households
Regular incandescent lamps that have traditionally been widely used in
general lighting are being phased out in several countries worldwide. In the
EU, the Ecodesign regulations [21, 22] set the energy efficiency
requirements, and as a result, the incandescent lamps are phased out. In
addition, the Ecodesign regulations establish a set of functionality
requirements, such as lamp survival factor, lumen maintenance, starting
time and colour rendering index, for the remaining lamps.
4.1.1 Methods
The environmental impacts and LCCs of non-directional lamps used
typically in households are studied in the following. The environmental
impacts and costs are calculated regarding manufacturing and use. The
manufacturing costs were modelled on the basis of purchase prices, even
though it was acknowledged that the purchase price does not totally
correspond to the manufacturing costs, but it is an estimation. The costs
from the use were calculated on the basis of electricity price and
consumption. The LCCs were calculated from the point of view of the
consumer, who purchases, replaces and uses the lamp.
The environmental impacts of light sources are generally clearly
dominated by the energy consumption in the use [29]. Thus, the potential
environmental impacts of the light source are strongly dependent on the
choice of the energy source. That is the reason for considering primary
energy consumption as the parameter for the calculations of the
environmental impacts. The primary energy analysis excluded the impact of
a specific energy production, e.g., wind power or nuclear power, but
included the amount of primary energy consumed the manufacturing
process and in use. In addition, the lamp comparison included the primary
energy embodied in the materials, as it has been recently estimated by US
DOE [30]. However, the US DOE study reported a high uncertainty in the
primary energy consumption of the manufacturing process of LED lamps:
0.1 to 27 % of total life cycle energy consumption.
The idea of the study is to vary the luminous intensity distribution curves
and luminous fluxes of CFLs and LED lamps to see their effect on the
environmental and economic aspects of the lamps. The study compared
three lamp types: 60 W incandescent lamp (750 lm), 13 W CFL of three
shapes (spiral, tubular, enveloped) (750 lm), and 13 W LED lamp (800 lm).
Figure 5 illustrates the schemas of the lamp types. The study is based on a
previous environmental and cost analysis of non-directional household by
Tähkämö et al. [7] which is updated herein. The original analysis compared
a 60 W incandescent lamp, three shapes of CFLs of equivalent luminous
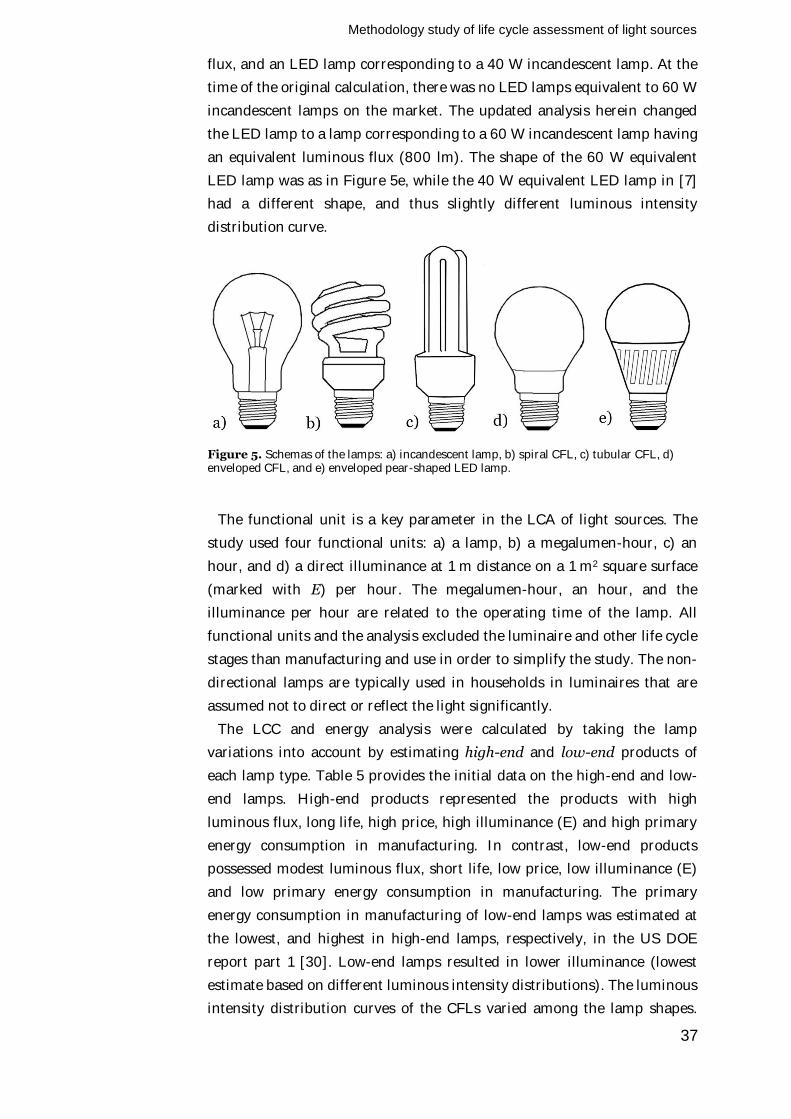
Methodology study of life cycle assessment of light sources
37
flux, and an LED lamp corresponding to a 40 W incandescent lamp. At the
time of the original calculation, there was no LED lamps equivalent to 60 W
incandescent lamps on the market. The updated analysis herein changed
the LED lamp to a lamp corresponding to a 60 W incandescent lamp having
an equivalent luminous flux (800 lm). The shape of the 60 W equivalent
LED lamp was as in Figure 5e, while the 40 W equivalent LED lamp in [7]
had a different shape, and thus slightly different luminous intensity
distribution curve.
Figure 5. Schemas of the lamps: a) incandescent lamp, b) spiral CFL, c) tubular CFL, d) enveloped CFL, and e) enveloped pear-shaped LED lamp.
The functional unit is a key parameter in the LCA of light sources. The
study used four functional units: a) a lamp, b) a megalumen-hour, c) an
hour, and d) a direct illuminance at 1 m distance on a 1 m2 square surface
(marked with E) per hour. The megalumen-hour, an hour, and the
illuminance per hour are related to the operating time of the lamp. All
functional units and the analysis excluded the luminaire and other life cycle
stages than manufacturing and use in order to simplify the study. The non-
directional lamps are typically used in households in luminaires that are
assumed not to direct or reflect the light significantly.
The LCC and energy analysis were calculated by taking the lamp
variations into account by estimating high-end and low-end products of
each lamp type. Table 5 provides the initial data on the high-end and low-
end lamps. High-end products represented the products with high
luminous flux, long life, high price, high illuminance (E) and high primary
energy consumption in manufacturing. In contrast, low-end products
possessed modest luminous flux, short life, low price, low illuminance (E)
and low primary energy consumption in manufacturing. The primary
energy consumption in manufacturing of low-end lamps was estimated at
the lowest, and highest in high-end lamps, respectively, in the US DOE
report part 1 [30]. Low-end lamps resulted in lower illuminance (lowest
estimate based on different luminous intensity distributions). The luminous
intensity distribution curves of the CFLs varied among the lamp shapes.
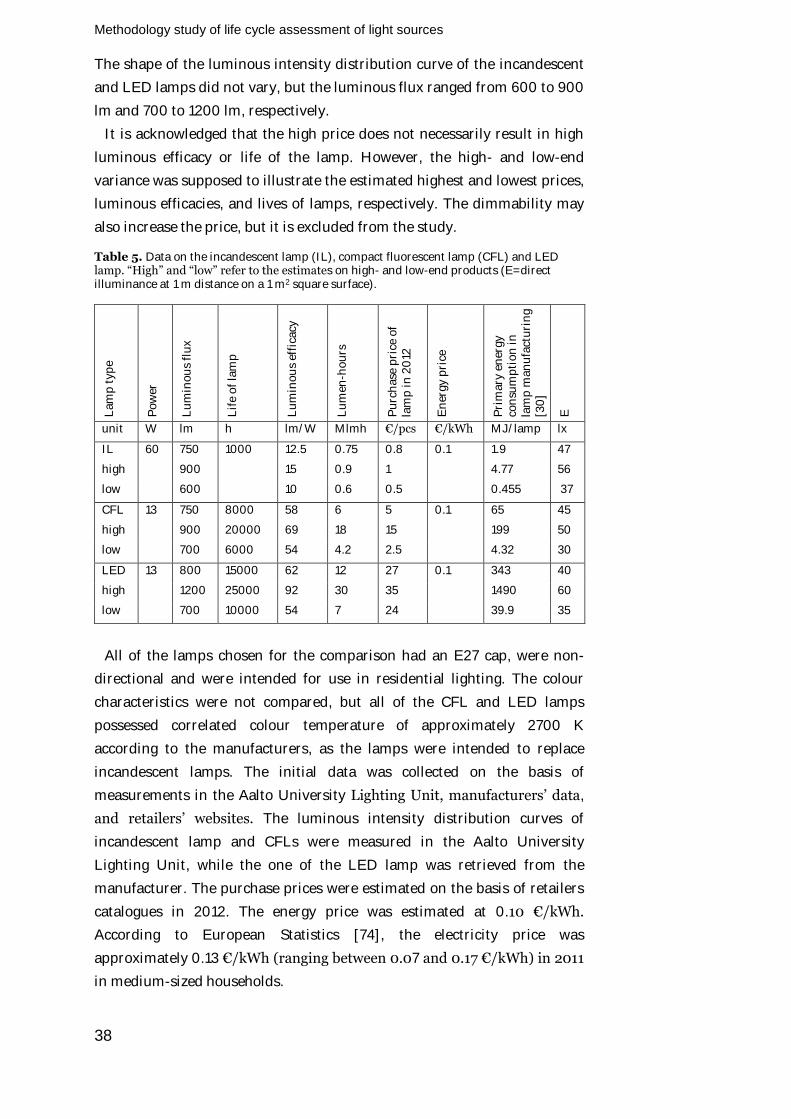
Methodology study of life cycle assessment of light sources
38
The shape of the luminous intensity distribution curve of the incandescent
and LED lamps did not vary, but the luminous flux ranged from 600 to 900
lm and 700 to 1200 lm, respectively.
It is acknowledged that the high price does not necessarily result in high
luminous efficacy or life of the lamp. However, the high- and low-end
variance was supposed to illustrate the estimated highest and lowest prices,
luminous efficacies, and lives of lamps, respectively. The dimmability may
also increase the price, but it is excluded from the study.
Table 5. Data on the incandescent lamp (IL), compact fluorescent lamp (CFL) and LED lamp. “High” and “low” refer to the estimates on high- and low-end products (E=direct illuminance at 1 m distance on a 1 m2 square surface).
La
mp
ty
pe
Po
wer
Lu
min
ou
s fl
ux
Lif
e o
f la
mp
Lu
min
ou
s ef
fica
cy
Lu
men
-ho
urs
Pu
rch
ase
pri
ce o
f la
mp
in
20
12
En
erg
y p
rice
Pri
ma
ry e
ner
gy
co
nsu
mp
tio
n i
n
lam
p m
an
ufa
ctu
rin
g
[30
]
E
unit W lm h lm/W Mlmh €/pcs €/kWh MJ/lamp lx
IL 60 750 1000 12.5 0.75 0.8 0.1 1.9 47
high 900 15 0.9 1 4.77 56
low 600 10 0.6 0.5 0.455 37
CFL 13 750 8000 58 6 5 0.1 65 45
high 900 20000 69 18 15 199 50
low 700 6000 54 4.2 2.5 4.32 30
LED 13 800 15000 62 12 27 0.1 343 40
high 1200 25000 92 30 35 1490 60
low 700 10000 54 7 24 39.9 35
All of the lamps chosen for the comparison had an E27 cap, were non-
directional and were intended for use in residential lighting. The colour
characteristics were not compared, but all of the CFL and LED lamps
possessed correlated colour temperature of approximately 2700 K
according to the manufacturers, as the lamps were intended to replace
incandescent lamps. The initial data was collected on the basis of
measurements in the Aalto University Lighting Unit, manufacturers’ data,
and retailers’ websites. The luminous intensity distribution curves of
incandescent lamp and CFLs were measured in the Aalto University
Lighting Unit, while the one of the LED lamp was retrieved from the
manufacturer. The purchase prices were estimated on the basis of retailers
catalogues in 2012. The energy price was estimated at 0.10 €/kWh.
According to European Statistics [74], the electricity price was
approximately 0.13 €/kWh (ranging between 0.07 and 0.17 €/kWh) in 2011
in medium-sized households.
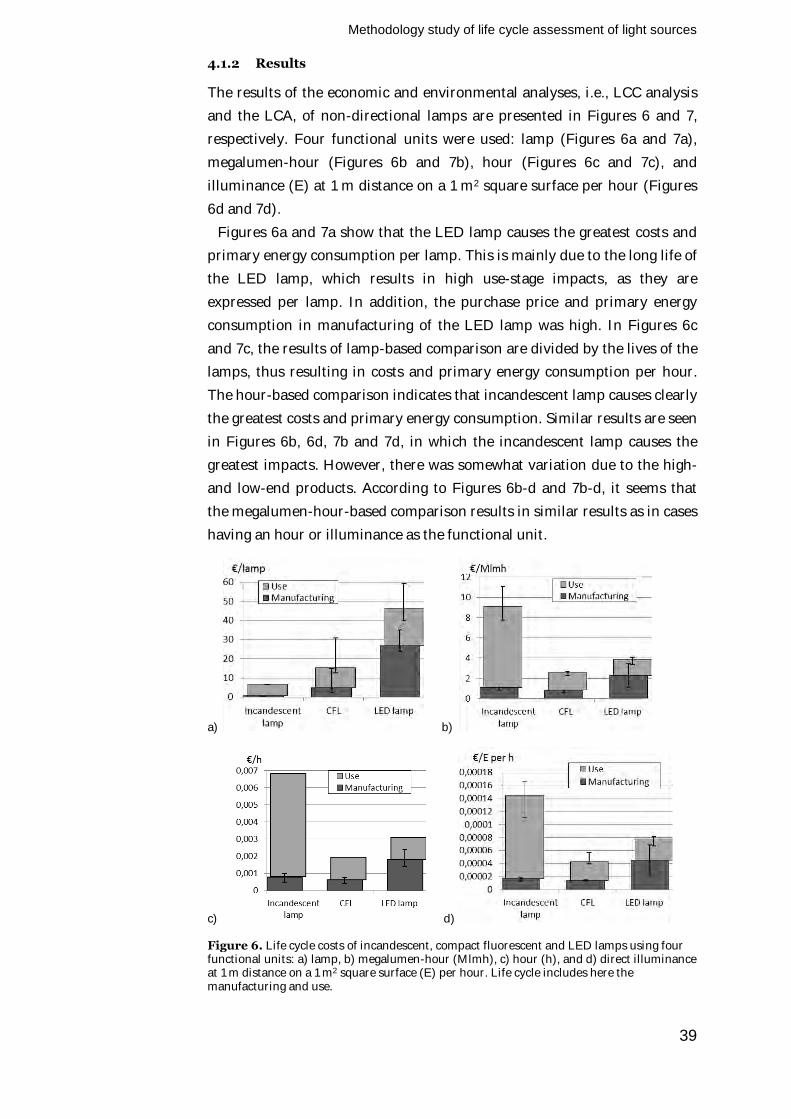
Methodology study of life cycle assessment of light sources
39
4.1.2 Results
The results of the economic and environmental analyses, i.e., LCC analysis
and the LCA, of non-directional lamps are presented in Figures 6 and 7,
respectively. Four functional units were used: lamp (Figures 6a and 7a),
megalumen-hour (Figures 6b and 7b), hour (Figures 6c and 7c), and
illuminance (E) at 1 m distance on a 1 m2 square surface per hour (Figures
6d and 7d).
Figures 6a and 7a show that the LED lamp causes the greatest costs and
primary energy consumption per lamp. This is mainly due to the long life of
the LED lamp, which results in high use-stage impacts, as they are
expressed per lamp. In addition, the purchase price and primary energy
consumption in manufacturing of the LED lamp was high. In Figures 6c
and 7c, the results of lamp-based comparison are divided by the lives of the
lamps, thus resulting in costs and primary energy consumption per hour.
The hour-based comparison indicates that incandescent lamp causes clearly
the greatest costs and primary energy consumption. Similar results are seen
in Figures 6b, 6d, 7b and 7d, in which the incandescent lamp causes the
greatest impacts. However, there was somewhat variation due to the high-
and low-end products. According to Figures 6b-d and 7b-d, it seems that
the megalumen-hour-based comparison results in similar results as in cases
having an hour or illuminance as the functional unit.
a) b)
c) d)
Figure 6. Life cycle costs of incandescent, compact fluorescent and LED lamps using four functional units: a) lamp, b) megalumen-hour (Mlmh), c) hour (h), and d) direct illuminance at 1 m distance on a 1 m2 square surface (E) per hour. Life cycle includes here the manufacturing and use.
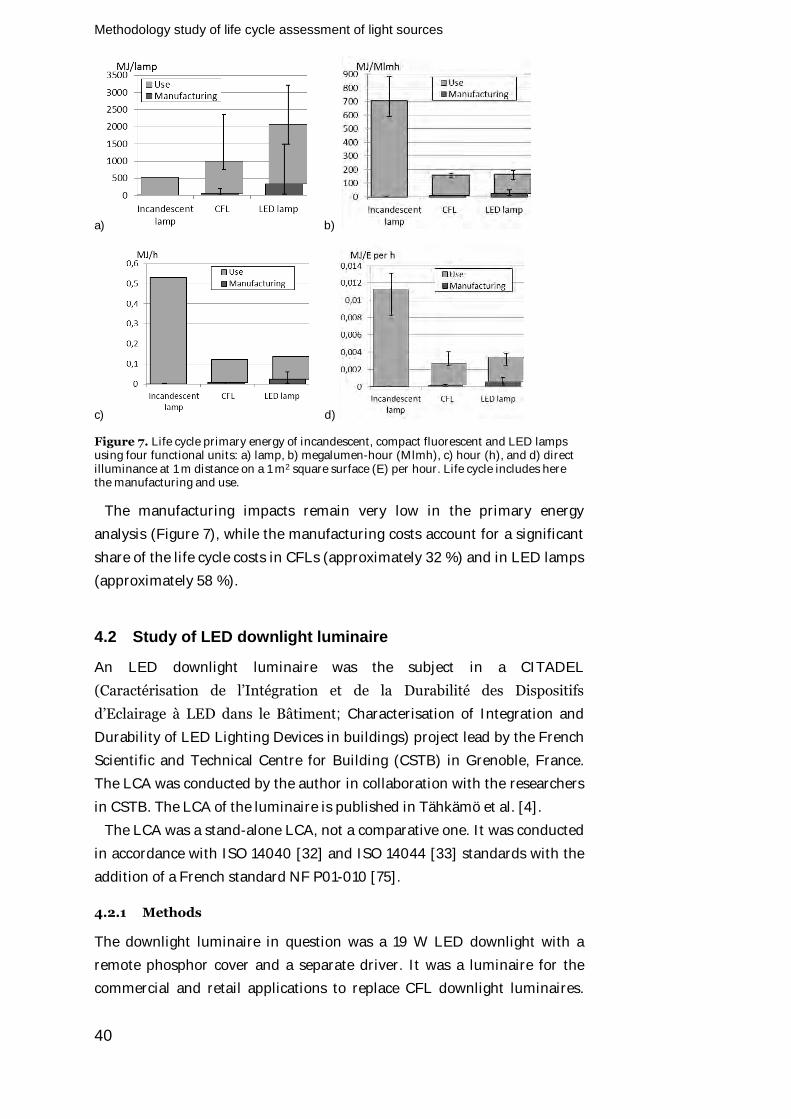
Methodology study of life cycle assessment of light sources
40
a) b)
c) d)
Figure 7. Life cycle primary energy of incandescent, compact fluorescent and LED lamps using four functional units: a) lamp, b) megalumen-hour (Mlmh), c) hour (h), and d) direct illuminance at 1 m distance on a 1 m2 square surface (E) per hour. Life cycle includes here the manufacturing and use.
The manufacturing impacts remain very low in the primary energy
analysis (Figure 7), while the manufacturing costs account for a significant
share of the life cycle costs in CFLs (approximately 32 %) and in LED lamps
(approximately 58 %).
4.2 Study of LED downlight luminaire
An LED downlight luminaire was the subject in a CITADEL
(Caractérisation de l’Intégration et de la Durabilité des Dispositifs
d’Eclairage à LED dans le Bâtiment; Characterisation of Integration and
Durability of LED Lighting Devices in buildings) project lead by the French
Scientific and Technical Centre for Building (CSTB) in Grenoble, France.
The LCA was conducted by the author in collaboration with the researchers
in CSTB. The LCA of the luminaire is published in Tähkämö et al. [4].
The LCA was a stand-alone LCA, not a comparative one. It was conducted
in accordance with ISO 14040 [32] and ISO 14044 [33] standards with the
addition of a French standard NF P01-010 [75].
4.2.1 Methods
The downlight luminaire in question was a 19 W LED downlight with a
remote phosphor cover and a separate driver. It was a luminaire for the
commercial and retail applications to replace CFL downlight luminaires.
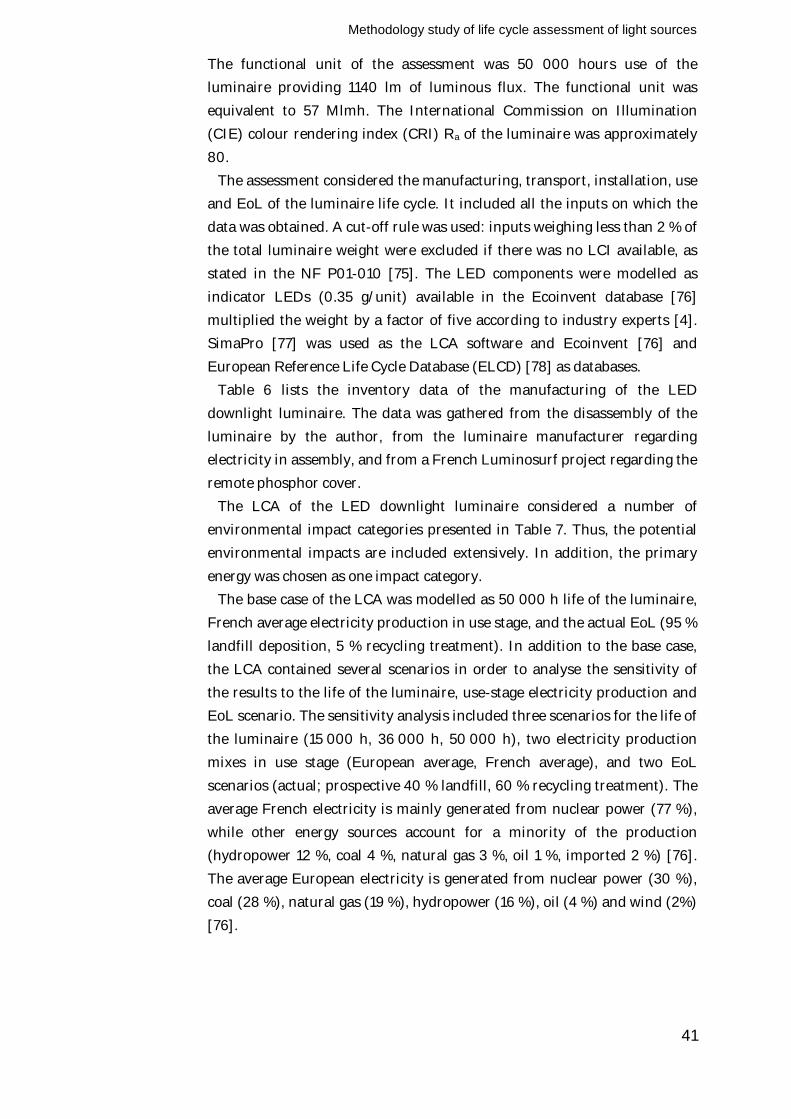
Methodology study of life cycle assessment of light sources
41
The functional unit of the assessment was 50 000 hours use of the
luminaire providing 1140 lm of luminous flux. The functional unit was
equivalent to 57 Mlmh. The International Commission on Illumination
(CIE) colour rendering index (CRI) Ra of the luminaire was approximately
80.
The assessment considered the manufacturing, transport, installation, use
and EoL of the luminaire life cycle. It included all the inputs on which the
data was obtained. A cut-off rule was used: inputs weighing less than 2 % of
the total luminaire weight were excluded if there was no LCI available, as
stated in the NF P01-010 [75]. The LED components were modelled as
indicator LEDs (0.35 g/unit) available in the Ecoinvent database [76]
multiplied the weight by a factor of five according to industry experts [4].
SimaPro [77] was used as the LCA software and Ecoinvent [76] and
European Reference Life Cycle Database (ELCD) [78] as databases.
Table 6 lists the inventory data of the manufacturing of the LED
downlight luminaire. The data was gathered from the disassembly of the
luminaire by the author, from the luminaire manufacturer regarding
electricity in assembly, and from a French Luminosurf project regarding the
remote phosphor cover.
The LCA of the LED downlight luminaire considered a number of
environmental impact categories presented in Table 7. Thus, the potential
environmental impacts are included extensively. In addition, the primary
energy was chosen as one impact category.
The base case of the LCA was modelled as 50 000 h life of the luminaire,
French average electricity production in use stage, and the actual EoL (95 %
landfill deposition, 5 % recycling treatment). In addition to the base case,
the LCA contained several scenarios in order to analyse the sensitivity of
the results to the life of the luminaire, use-stage electricity production and
EoL scenario. The sensitivity analysis included three scenarios for the life of
the luminaire (15 000 h, 36 000 h, 50 000 h), two electricity production
mixes in use stage (European average, French average), and two EoL
scenarios (actual; prospective 40 % landfill, 60 % recycling treatment). The
average French electricity is mainly generated from nuclear power (77 %),
while other energy sources account for a minority of the production
(hydropower 12 %, coal 4 %, natural gas 3 %, oil 1 %, imported 2 %) [76].
The average European electricity is generated from nuclear power (30 %),
coal (28 %), natural gas (19 %), hydropower (16 %), oil (4 %) and wind (2%)
[76].
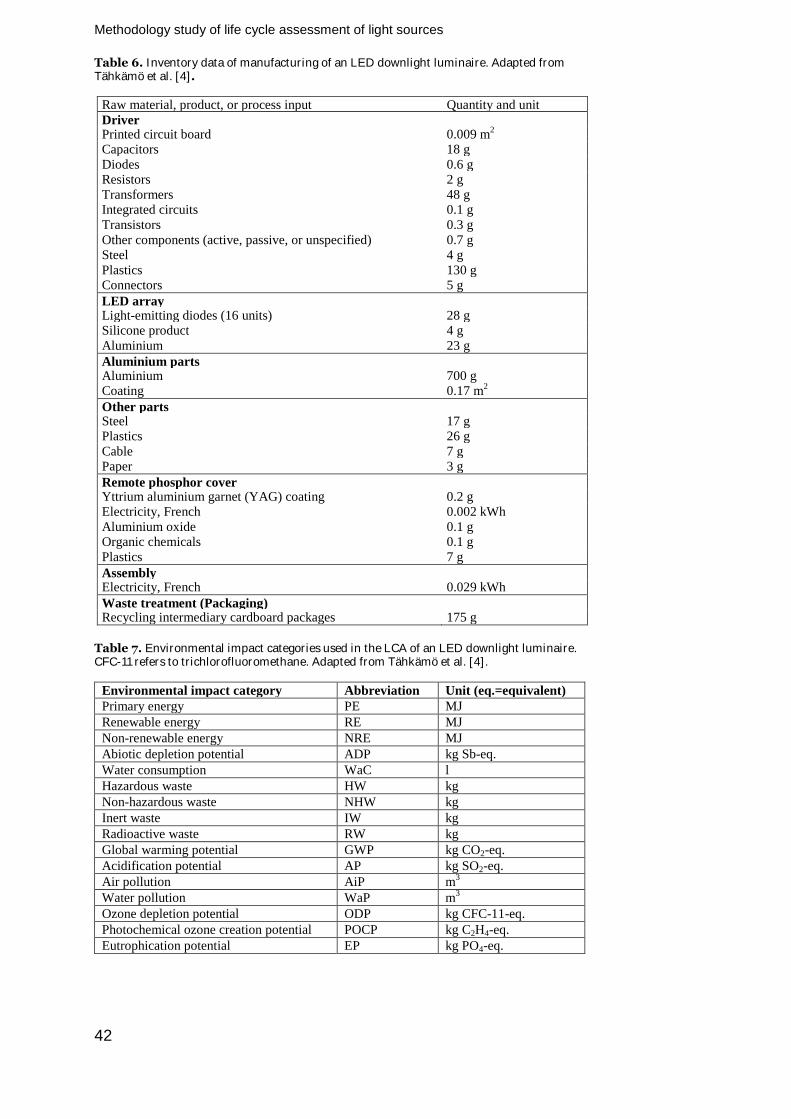
Methodology study of life cycle assessment of light sources
42
Table 6. Inventory data of manufacturing of an LED downlight luminaire. Adapted from Tähkämö et al. [4].
Raw material, product, or process input Quantity and unit
Driver Printed circuit board 0.009 m
2
Capacitors 18 g
Diodes 0.6 g Resistors 2 g
Transformers 48 g Integrated circuits 0.1 g
Transistors 0.3 g
Other components (active, passive, or unspecified) 0.7 g Steel 4 g
Plastics 130 g Connectors 5 g
LED array Light-emitting diodes (16 units) 28 g Silicone product 4 g
Aluminium 23 g
Aluminium parts Aluminium 700 g Coating 0.17 m
2
Other parts Steel 17 g Plastics 26 g
Cable 7 g Paper 3 g
Remote phosphor cover Yttrium aluminium garnet (YAG) coating 0.2 g Electricity, French 0.002 kWh
Aluminium oxide 0.1 g Organic chemicals 0.1 g
Plastics 7 g
Assembly Electricity, French 0.029 kWh
Waste treatment (Packaging) Recycling intermediary cardboard packages 175 g
Table 7. Environmental impact categories used in the LCA of an LED downlight luminaire. CFC-11 refers to trichlorofluoromethane. Adapted from Tähkämö et al. [4].
Environmental impact category Abbreviation Unit (eq.=equivalent)
Primary energy PE MJ
Renewable energy RE MJ
Non-renewable energy NRE MJ
Abiotic depletion potential ADP kg Sb-eq.
Water consumption WaC l
Hazardous waste HW kg
Non-hazardous waste NHW kg
Inert waste IW kg
Radioactive waste RW kg
Global warming potential GWP kg CO2-eq.
Acidification potential AP kg SO2-eq.
Air pollution AiP m3
Water pollution WaP m3
Ozone depletion potential ODP kg CFC-11-eq.
Photochemical ozone creation potential POCP kg C2H4-eq.
Eutrophication potential EP kg PO4-eq.
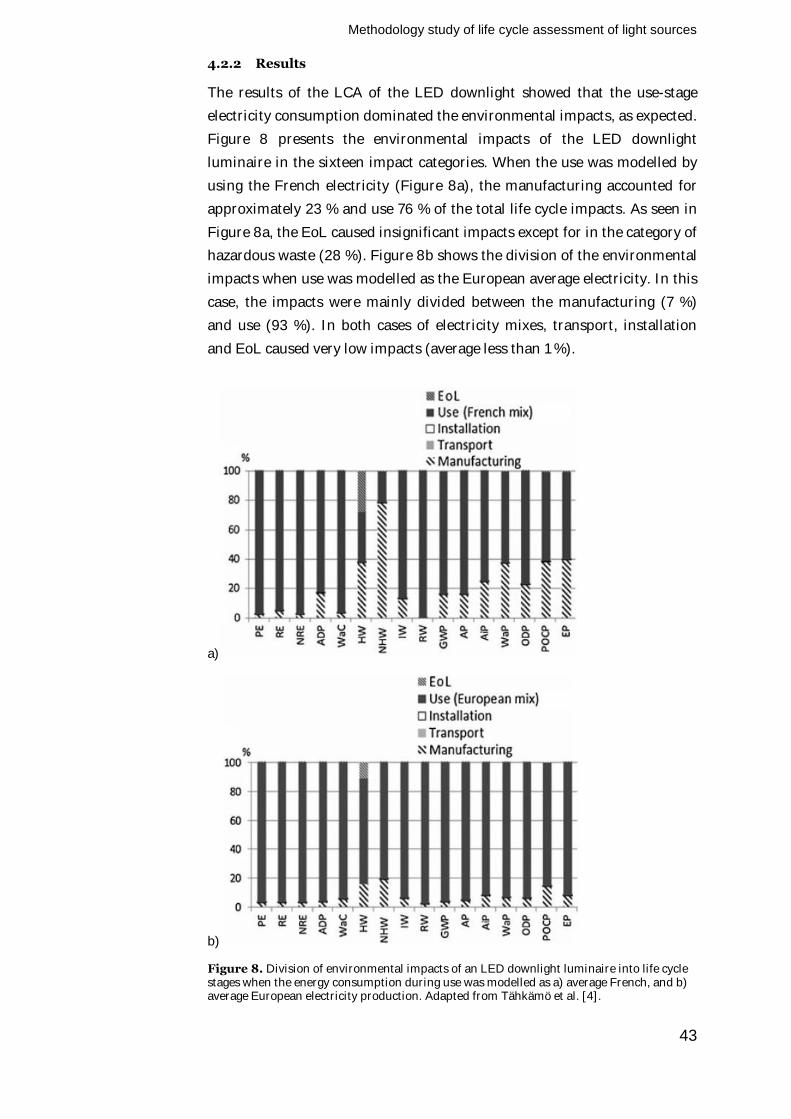
Methodology study of life cycle assessment of light sources
43
4.2.2 Results
The results of the LCA of the LED downlight showed that the use-stage
electricity consumption dominated the environmental impacts, as expected.
Figure 8 presents the environmental impacts of the LED downlight
luminaire in the sixteen impact categories. When the use was modelled by
using the French electricity (Figure 8a), the manufacturing accounted for
approximately 23 % and use 76 % of the total life cycle impacts. As seen in
Figure 8a, the EoL caused insignificant impacts except for in the category of
hazardous waste (28 %). Figure 8b shows the division of the environmental
impacts when use was modelled as the European average electricity. In this
case, the impacts were mainly divided between the manufacturing (7 %)
and use (93 %). In both cases of electricity mixes, transport, installation
and EoL caused very low impacts (average less than 1 %).
a)
b)
Figure 8. Division of environmental impacts of an LED downlight luminaire into life cycle stages when the energy consumption during use was modelled as a) average French, and b) average European electricity production. Adapted from Tähkämö et al. [4].
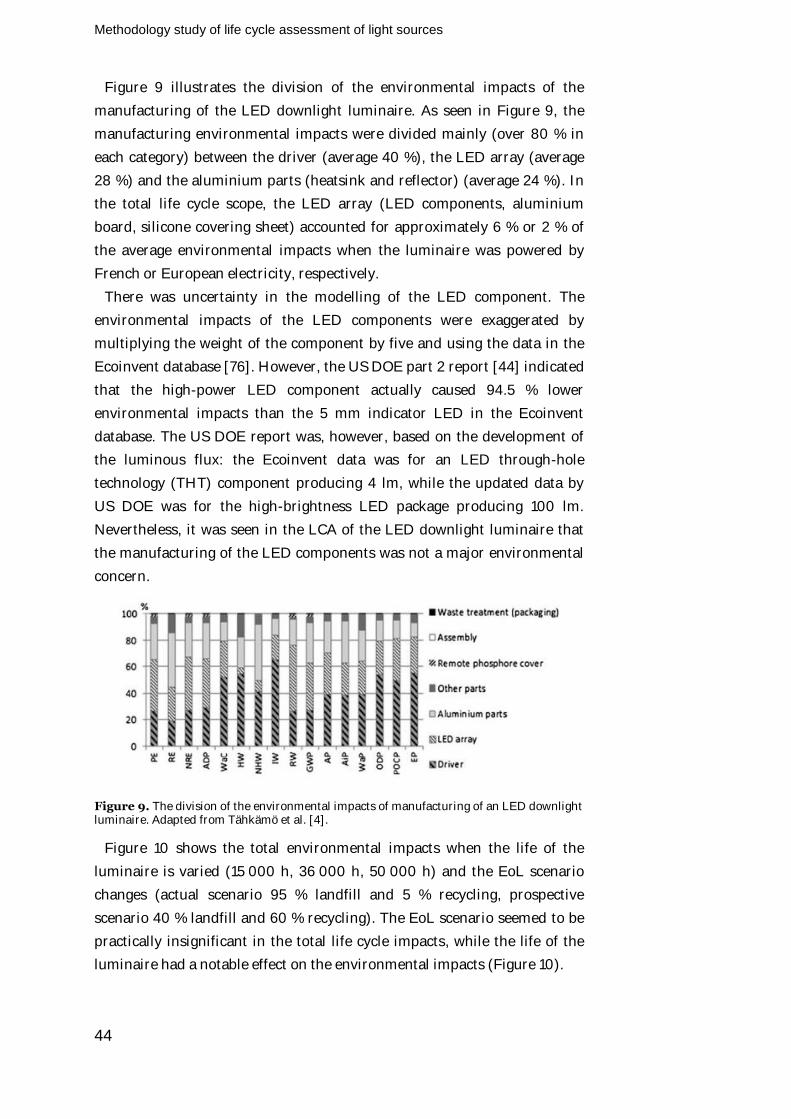
Methodology study of life cycle assessment of light sources
44
Figure 9 illustrates the division of the environmental impacts of the
manufacturing of the LED downlight luminaire. As seen in Figure 9, the
manufacturing environmental impacts were divided mainly (over 80 % in
each category) between the driver (average 40 %), the LED array (average
28 %) and the aluminium parts (heatsink and reflector) (average 24 %). In
the total life cycle scope, the LED array (LED components, aluminium
board, silicone covering sheet) accounted for approximately 6 % or 2 % of
the average environmental impacts when the luminaire was powered by
French or European electricity, respectively.
There was uncertainty in the modelling of the LED component. The
environmental impacts of the LED components were exaggerated by
multiplying the weight of the component by five and using the data in the
Ecoinvent database [76]. However, the US DOE part 2 report [44] indicated
that the high-power LED component actually caused 94.5 % lower
environmental impacts than the 5 mm indicator LED in the Ecoinvent
database. The US DOE report was, however, based on the development of
the luminous flux: the Ecoinvent data was for an LED through-hole
technology (THT) component producing 4 lm, while the updated data by
US DOE was for the high-brightness LED package producing 100 lm.
Nevertheless, it was seen in the LCA of the LED downlight luminaire that
the manufacturing of the LED components was not a major environmental
concern.
Figure 9. The division of the environmental impacts of manufacturing of an LED downlight luminaire. Adapted from Tähkämö et al. [4].
Figure 10 shows the total environmental impacts when the life of the
luminaire is varied (15 000 h, 36 000 h, 50 000 h) and the EoL scenario
changes (actual scenario 95 % landfill and 5 % recycling, prospective
scenario 40 % landfill and 60 % recycling). The EoL scenario seemed to be
practically insignificant in the total life cycle impacts, while the life of the
luminaire had a notable effect on the environmental impacts (Figure 10).
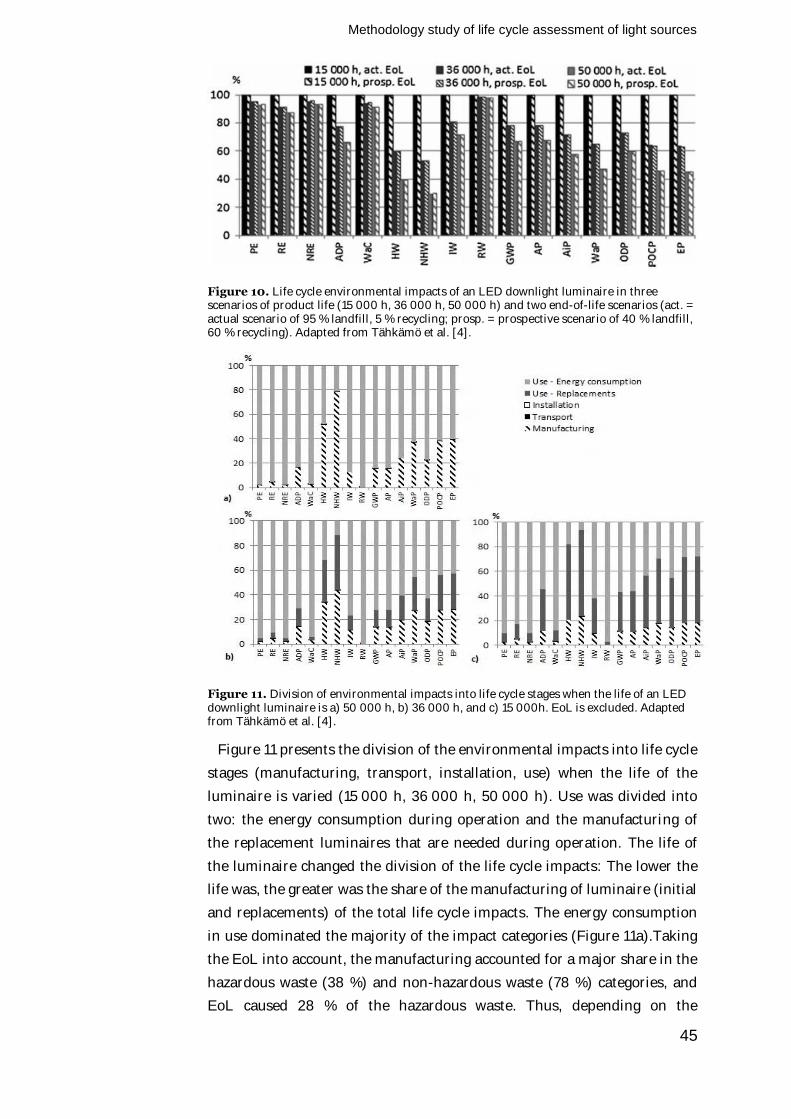
Methodology study of life cycle assessment of light sources
45
Figure 10. Life cycle environmental impacts of an LED downlight luminaire in three scenarios of product life (15 000 h, 36 000 h, 50 000 h) and two end-of-life scenarios (act. = actual scenario of 95 % landfill, 5 % recycling; prosp. = prospective scenario of 40 % landfill, 60 % recycling). Adapted from Tähkämö et al. [4].
Figure 11. Division of environmental impacts into life cycle stages when the life of an LED downlight luminaire is a) 50 000 h, b) 36 000 h, and c) 15 000h. EoL is excluded. Adapted from Tähkämö et al. [4].
Figure 11 presents the division of the environmental impacts into life cycle
stages (manufacturing, transport, installation, use) when the life of the
luminaire is varied (15 000 h, 36 000 h, 50 000 h). Use was divided into
two: the energy consumption during operation and the manufacturing of
the replacement luminaires that are needed during operation. The life of
the luminaire changed the division of the life cycle impacts: The lower the
life was, the greater was the share of the manufacturing of luminaire (initial
and replacements) of the total life cycle impacts. The energy consumption
in use dominated the majority of the impact categories (Figure 11a).Taking
the EoL into account, the manufacturing accounted for a major share in the
hazardous waste (38 %) and non-hazardous waste (78 %) categories, and
EoL caused 28 % of the hazardous waste. Thus, depending on the
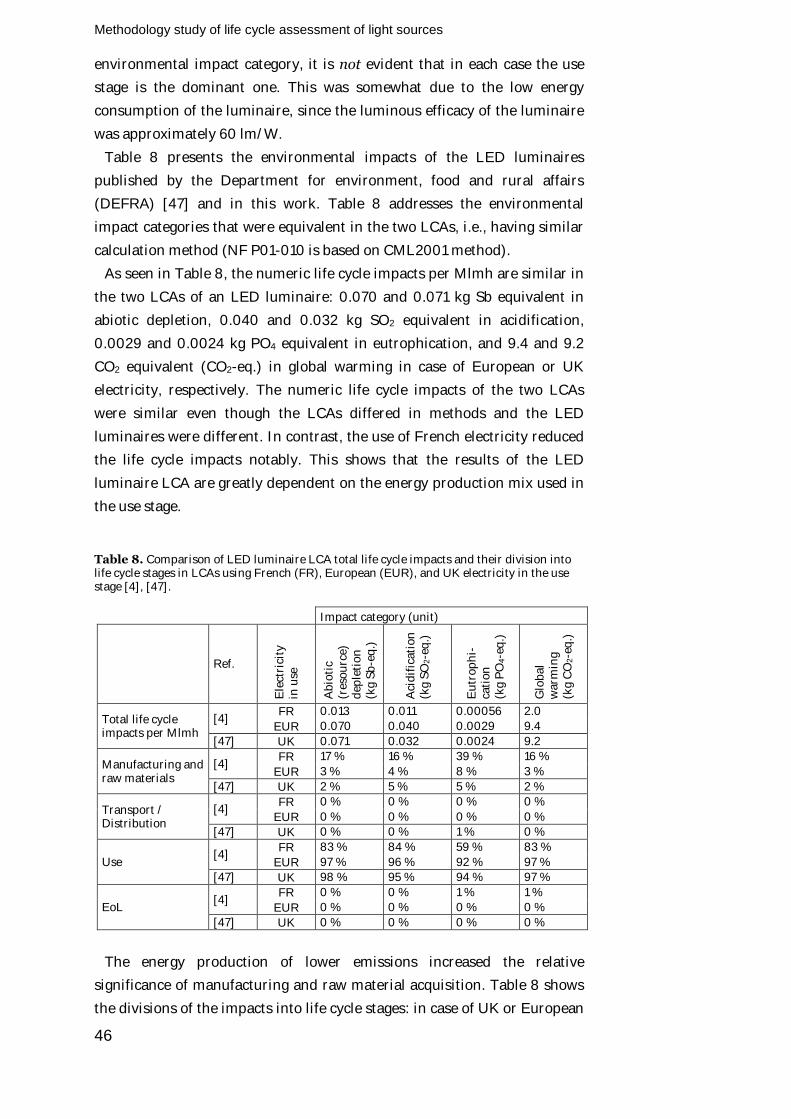
Methodology study of life cycle assessment of light sources
46
environmental impact category, it is not evident that in each case the use
stage is the dominant one. This was somewhat due to the low energy
consumption of the luminaire, since the luminous efficacy of the luminaire
was approximately 60 lm/W.
Table 8 presents the environmental impacts of the LED luminaires
published by the Department for environment, food and rural affairs
(DEFRA) [47] and in this work. Table 8 addresses the environmental
impact categories that were equivalent in the two LCAs, i.e., having similar
calculation method (NF P01-010 is based on CML2001 method).
As seen in Table 8, the numeric life cycle impacts per Mlmh are similar in
the two LCAs of an LED luminaire: 0.070 and 0.071 kg Sb equivalent in
abiotic depletion, 0.040 and 0.032 kg SO2 equivalent in acidification,
0.0029 and 0.0024 kg PO4 equivalent in eutrophication, and 9.4 and 9.2
CO2 equivalent (CO2-eq.) in global warming in case of European or UK
electricity, respectively. The numeric life cycle impacts of the two LCAs
were similar even though the LCAs differed in methods and the LED
luminaires were different. In contrast, the use of French electricity reduced
the life cycle impacts notably. This shows that the results of the LED
luminaire LCA are greatly dependent on the energy production mix used in
the use stage.
Table 8. Comparison of LED luminaire LCA total life cycle impacts and their division into life cycle stages in LCAs using French (FR), European (EUR), and UK electricity in the use stage [4], [47].
Impact category (unit)
Ref.
Ele
ctri
city
in
use
Ab
ioti
c (r
eso
urc
e)
dep
leti
on
(k
g S
b-e
q.)
Aci
dif
ica
tio
n
(kg
SO
2-e
q.)
Eu
tro
ph
i-ca
tio
n
(kg
PO
4-e
q.)
Glo
ba
l w
arm
ing
(k
g C
O2-e
q.)
Total life cycle impacts per Mlmh
[4] FR 0.013 0.011 0.00056 2.0
EUR 0.070 0.040 0.0029 9.4
[47] UK 0.071 0.032 0.0024 9.2
Manufacturing and raw materials
[4] FR 17 % 16 % 39 % 16 %
EUR 3 % 4 % 8 % 3 %
[47] UK 2 % 5 % 5 % 2 %
Transport / Distribution
[4] FR 0 % 0 % 0 % 0 %
EUR 0 % 0 % 0 % 0 %
[47] UK 0 % 0 % 1 % 0 %
Use [4]
FR 83 % 84 % 59 % 83 %
EUR 97 % 96 % 92 % 97 %
[47] UK 98 % 95 % 94 % 97 %
EoL [4]
FR 0 % 0 % 1 % 1 %
EUR 0 % 0 % 0 % 0 %
[47] UK 0 % 0 % 0 % 0 %
The energy production of lower emissions increased the relative
significance of manufacturing and raw material acquisition. Table 8 shows
the divisions of the impacts into life cycle stages: in case of UK or European
Methodology study of life cycle assessment of light sources
47
electricity in use, manufacturing accounted for 2-8 % and use 92-98 %, and
the rest of the life cycle stages (transport, EoL) caused 1 % or less of the
environmental impacts in the four categories.
The LCA of the LED downlight luminaire in this work estimated that the
luminaire would consume 230 MJ of primary energy and cause 2.0 kg CO2-
eq. per Mlmh over the total life cycle when using French average electricity
in use. The total life cycle GWP impacts were approximately 9.4 kg CO2-
eq./Mlmh when using European average electricity in use. In comparison,
the DEFRA LED luminaire LCA resulted in the total GWP impacts of 9.2 kg
CO2-eq./Mlmh by using UK electricity in use. The GWP100a factors for the
electricity production are 0.087 kg CO2-eq. for the French, 0.488 kg CO2-
eq. for the European, and 0.598 kg CO2-eq. for the UK electricity
production according to Ecoinvent database [76]. This indicates that the
GWP factor of the electricity production in use partially explains the GWP
impacts of the total life cycle.
4.3 Study of fluorescent lamp luminaire
4.3.1 Methods
A study on the LCA of a fluorescent lamp luminaire was conducted in 2011-
2012 by the author [5]. It analysed a fluorescent lamp luminaire equipped
with two linear double-capped fluorescent lamps of 16 mm diameter, an
electronic ballast, and a metallic reflector and cover. The geographic
location of the LCA was Finland, as the luminaire and the ballast were
manufactured by Finnish companies. The LCA was a stand-alone
assessment, but the results are compared to the previous LCA by DEFRA
[47].
The luminaire accommodated two 49 W fluorescent lamps and provided
8600 lm according to the luminaire manufacturer. The functional unit was
the use of the luminaire for 20 years, 4000 hours per year. This is equal to
688 Mlmh per functional unit. The luminaire consumed a total of 104 W
electrical power. The life of a fluorescent lamp was estimated 20 000 h and
the one of the ballast 50 000 h.
The luminaire is intended for industrial applications, such as
manufacturing premises and warehouses. It is a very basic structure
containing an aluminium body, an anodized aluminium reflector, plastic
end caps, and the ballast and the lamps.
The LCA included the manufacturing, transport, use and end-of-life of the
luminaire. The LCA was conducted according to the standards ISO 14040
[32] and ISO 14044 [33]. In addition, the ETSI specification for ICT
products was used [31]. All the life cycle stages identified as mandatory in
ETSI specification were included in the LCA.
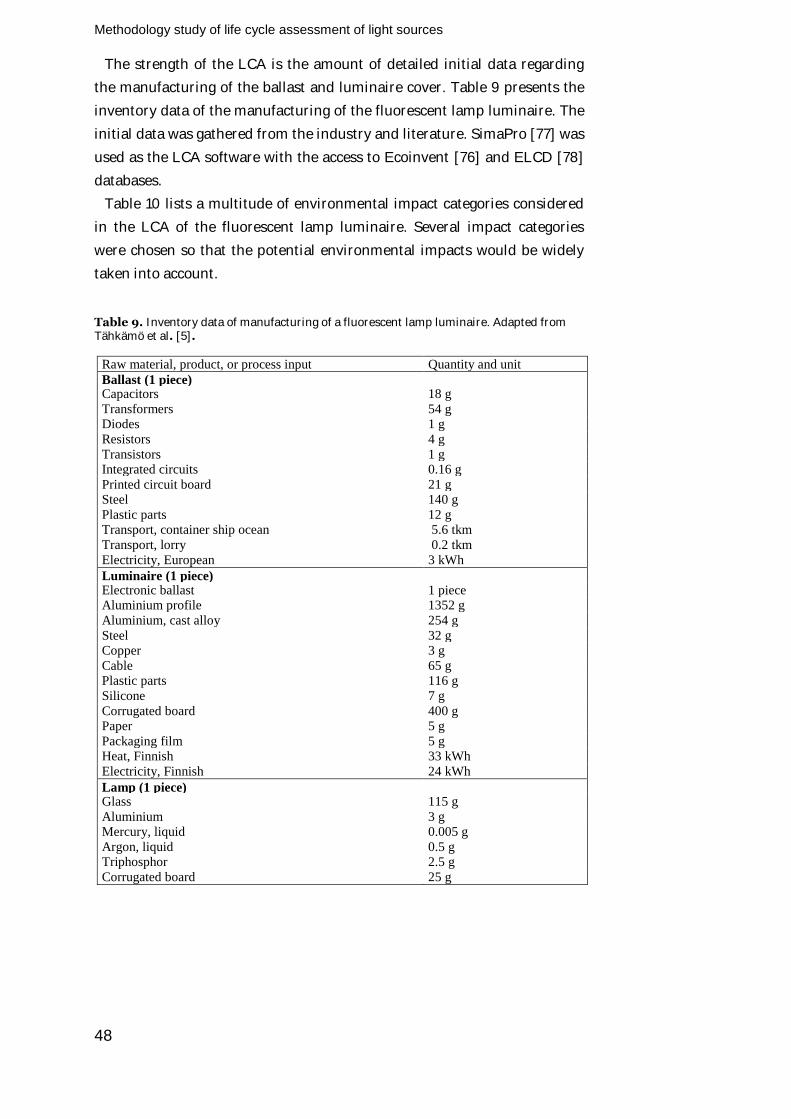
Methodology study of life cycle assessment of light sources
48
The strength of the LCA is the amount of detailed initial data regarding
the manufacturing of the ballast and luminaire cover. Table 9 presents the
inventory data of the manufacturing of the fluorescent lamp luminaire. The
initial data was gathered from the industry and literature. SimaPro [77] was
used as the LCA software with the access to Ecoinvent [76] and ELCD [78]
databases.
Table 10 lists a multitude of environmental impact categories considered
in the LCA of the fluorescent lamp luminaire. Several impact categories
were chosen so that the potential environmental impacts would be widely
taken into account.
Table 9. Inventory data of manufacturing of a fluorescent lamp luminaire. Adapted from Tähkämö et al. [5].
Raw material, product, or process input Quantity and unit
Ballast (1 piece) Capacitors 18 g
Transformers 54 g Diodes 1 g
Resistors 4 g
Transistors 1 g Integrated circuits 0.16 g
Printed circuit board 21 g Steel 140 g
Plastic parts 12 g Transport, container ship ocean 5.6 tkm
Transport, lorry 0.2 tkm
Electricity, European 3 kWh
Luminaire (1 piece) Electronic ballast 1 piece Aluminium profile 1352 g
Aluminium, cast alloy 254 g
Steel 32 g Copper 3 g
Cable 65 g Plastic parts 116 g
Silicone 7 g
Corrugated board 400 g Paper 5 g
Packaging film 5 g Heat, Finnish 33 kWh
Electricity, Finnish 24 kWh
Lamp (1 piece) Glass 115 g
Aluminium 3 g Mercury, liquid 0.005 g
Argon, liquid 0.5 g Triphosphor 2.5 g
Corrugated board 25 g
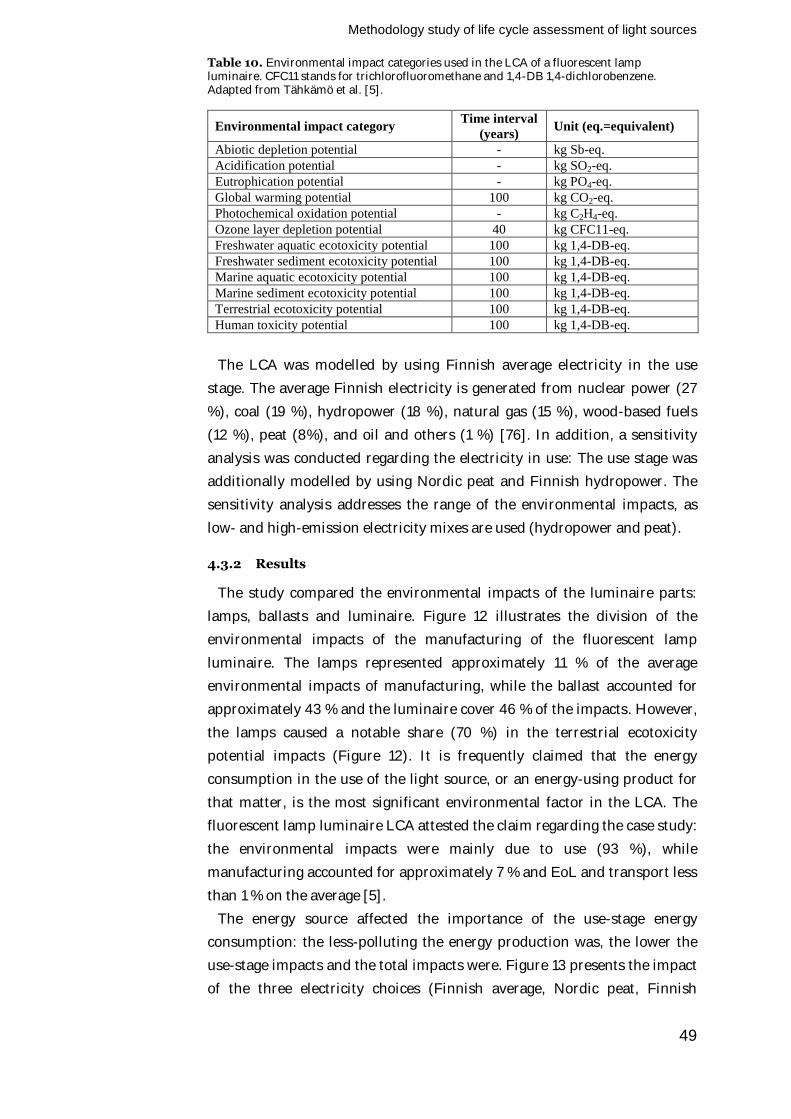
Methodology study of life cycle assessment of light sources
49
Table 10. Environmental impact categories used in the LCA of a fluorescent lamp luminaire. CFC11 stands for trichlorofluoromethane and 1,4-DB 1,4-dichlorobenzene. Adapted from Tähkämö et al. [5].
Environmental impact category Time interval
(years) Unit (eq.=equivalent)
Abiotic depletion potential - kg Sb-eq.
Acidification potential - kg SO2-eq.
Eutrophication potential - kg PO4-eq.
Global warming potential 100 kg CO2-eq.
Photochemical oxidation potential - kg C2H4-eq.
Ozone layer depletion potential 40 kg CFC11-eq.
Freshwater aquatic ecotoxicity potential 100 kg 1,4-DB-eq.
Freshwater sediment ecotoxicity potential 100 kg 1,4-DB-eq.
Marine aquatic ecotoxicity potential 100 kg 1,4-DB-eq.
Marine sediment ecotoxicity potential 100 kg 1,4-DB-eq.
Terrestrial ecotoxicity potential 100 kg 1,4-DB-eq.
Human toxicity potential 100 kg 1,4-DB-eq.
The LCA was modelled by using Finnish average electricity in the use
stage. The average Finnish electricity is generated from nuclear power (27
%), coal (19 %), hydropower (18 %), natural gas (15 %), wood-based fuels
(12 %), peat (8%), and oil and others (1 %) [76]. In addition, a sensitivity
analysis was conducted regarding the electricity in use: The use stage was
additionally modelled by using Nordic peat and Finnish hydropower. The
sensitivity analysis addresses the range of the environmental impacts, as
low- and high-emission electricity mixes are used (hydropower and peat).
4.3.2 Results
The study compared the environmental impacts of the luminaire parts:
lamps, ballasts and luminaire. Figure 12 illustrates the division of the
environmental impacts of the manufacturing of the fluorescent lamp
luminaire. The lamps represented approximately 11 % of the average
environmental impacts of manufacturing, while the ballast accounted for
approximately 43 % and the luminaire cover 46 % of the impacts. However,
the lamps caused a notable share (70 %) in the terrestrial ecotoxicity
potential impacts (Figure 12). It is frequently claimed that the energy
consumption in the use of the light source, or an energy-using product for
that matter, is the most significant environmental factor in the LCA. The
fluorescent lamp luminaire LCA attested the claim regarding the case study:
the environmental impacts were mainly due to use (93 %), while
manufacturing accounted for approximately 7 % and EoL and transport less
than 1 % on the average [5].
The energy source affected the importance of the use-stage energy
consumption: the less-polluting the energy production was, the lower the
use-stage impacts and the total impacts were. Figure 13 presents the impact
of the three electricity choices (Finnish average, Nordic peat, Finnish
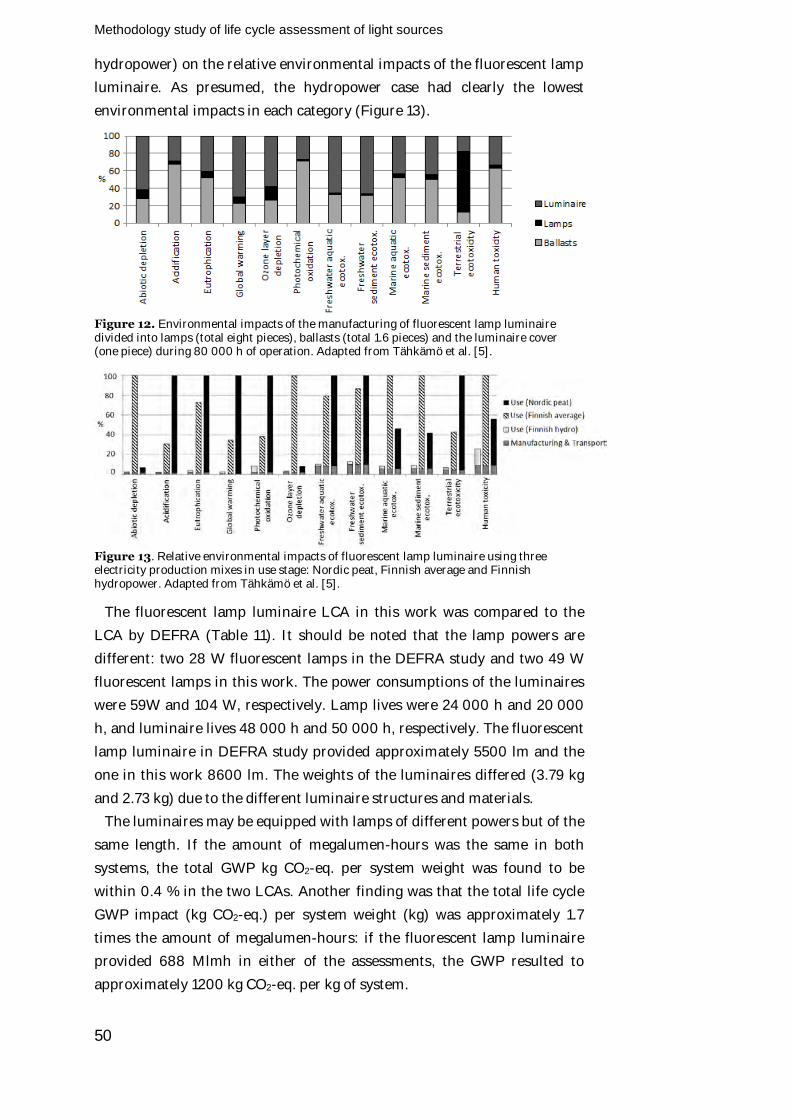
Methodology study of life cycle assessment of light sources
50
hydropower) on the relative environmental impacts of the fluorescent lamp
luminaire. As presumed, the hydropower case had clearly the lowest
environmental impacts in each category (Figure 13).
Figure 12. Environmental impacts of the manufacturing of fluorescent lamp luminaire divided into lamps (total eight pieces), ballasts (total 1.6 pieces) and the luminaire cover (one piece) during 80 000 h of operation. Adapted from Tähkämö et al. [5].
Figure 13. Relative environmental impacts of fluorescent lamp luminaire using three electricity production mixes in use stage: Nordic peat, Finnish average and Finnish hydropower. Adapted from Tähkämö et al. [5].
The fluorescent lamp luminaire LCA in this work was compared to the
LCA by DEFRA (Table 11). It should be noted that the lamp powers are
different: two 28 W fluorescent lamps in the DEFRA study and two 49 W
fluorescent lamps in this work. The power consumptions of the luminaires
were 59W and 104 W, respectively. Lamp lives were 24 000 h and 20 000
h, and luminaire lives 48 000 h and 50 000 h, respectively. The fluorescent
lamp luminaire in DEFRA study provided approximately 5500 lm and the
one in this work 8600 lm. The weights of the luminaires differed (3.79 kg
and 2.73 kg) due to the different luminaire structures and materials.
The luminaires may be equipped with lamps of different powers but of the
same length. If the amount of megalumen-hours was the same in both
systems, the total GWP kg CO2-eq. per system weight was found to be
within 0.4 % in the two LCAs. Another finding was that the total life cycle
GWP impact (kg CO2-eq.) per system weight (kg) was approximately 1.7
times the amount of megalumen-hours: if the fluorescent lamp luminaire
provided 688 Mlmh in either of the assessments, the GWP resulted to
approximately 1200 kg CO2-eq. per kg of system.

Methodology study of life cycle assessment of light sources
51
Table 11. Comparison of parameters and GWP impacts of fluorescent lamp luminaire LCA in this and the DEFRA study. GWP of electricity production retrieved from Ecoinvent [76].
Mlm
h p
er
syst
em
Wei
gh
t o
f sy
stem
Sy
stem
wei
gh
t p
er M
lmh
To
tal
GW
P
To
tal
GW
P
Ma
nu
fact
uri
ng
a
nd
dis
trib
uti
on
G
WP
Ma
nu
fact
uri
ng
a
nd
dis
trib
uti
on
G
WP
GW
P f
act
or
of
elec
tric
ity
p
rod
uct
ion
Ref. Mlmh/ system
kg kg/
Mlmh
kgCO2-eq./
Mlmh
kgCO2-eq./kg system
kgCO2-eq./
Mlmh
kgCO2-eq./kg system
kgCO2-eq./kWh
[5] 688 2.73 0.004 4.60 1200 0.066 17 0.384 (Finnish)
[47] 263 3.79 0.014 6.41 440 0.137 10 0.598 (UK)
4.4 Study of street lighting luminaires
The outdoor lighting sector in the EU is facing a major challenge in 2015
after which the HPM lamps cannot be sold, since they do not fulfil the
luminous efficacy requirements for the lamps set in the Ecodesign
regulation [20]. In 2010, there were approximately 660 000 HPM
luminaires in use in Finland [79]. Due to the Ecodesign legislation, a
notable effort is needed in the replacement work from HPM lamps to other
outdoor lighting technologies.
The LCC study presented in the following was part of SolarLED research
project [80] in the Lighting Unit of Aalto University School of Electrical
Engineering. The life cycle approach and LCC analysis were the
responsibilities of the author in the SolarLED project.
4.4.1 Methods
An LCC analysis of street lighting luminaires compared ten renewed street
lighting cases in Finland. The environmental assessment of the street
lighting technologies was excluded. The cases were located in Southern
Finland in the municipality of Kotka (cases A and B), Kerava (case C) and
Espoo (cases D to J). The LCCs were calculated from the point of view of the
users, which were the respective municipalities in this case. The functional
unit of the LCC analysis was a kilometre of illuminated street.
Street and road lighting are designed in Finland according to national
guidelines [38] based on the European standards EN 13201:2-4 [81, 82, 83]
and the technical report EN 13201:1 [84]. The design criteria for roads with
motorised traffic are based on six lighting classes: AL1, AL2, AL3, AL4a,
AL4b, and AL5. Photometric criteria are set for each lighting class in order
for the road lighting to fulfil the visual needs of road users. The
recommendations for road lighting apply to average road surface luminance
(Lave), overall and longitudinal uniformities of road surface luminance (Uo,
Ul), surround ratio (SR), and threshold increment (TI). The road lighting
Methodology study of life cycle assessment of light sources
52
shall be designed so that the recommendations and design criteria are
fulfilled according to the lighting class. Table 12 presents the design criteria
for the six lighting classes.
Table 12. Design criteria for luminance, disability glare and lighting of surroundings in Finnish road lighting classes AL1-AL5 for motorized vehicles on traffic roads [38].
Class
Luminance of road surface of carriageway for dry and wet road surface condition
Disability glare
Lighting of surroundings
Dry condition Wet condition
Lm Uo Ul Uo TI SR [cd/m2], minimum minimum minimum minimum
[%], maximum minimum
AL1 2 0.4 0.6 0.15 10 0.5
AL2 1.5 0.4 0.6 0.15 10 0.5
AL3 1 0.4 0.6 0.15 15 0.5
AL4a 1 0.4 0.4 0.15 15 0.5
AL4b 0.75 0.4 0.4 0.15 15 0.5
AL5 0.5 0.4 0.4 0.15 15 0.5
The goal of the LCC analysis was to compare the costs occurring during
the life cycle of the renovated street lighting cases, including purchase costs,
operating costs and residual value. Purchase costs included the price of the
luminaire, including the lamp and freight, and the costs of installation. The
luminaire price excluded value added tax in the street lighting cases.
Operating costs included the energy and maintenance costs, i.e., the
electricity costs and replacement costs of the lamps and luminaires.
Replacement costs contained group replacement costs, as spot replacement
costs were excluded. The residual value represents the return or cost of the
investment after the service time. In Equation 2, the residual value is
negative if there is a profit in the end-of-life of the product, and positive if
the end-of-life creates costs, such as recycling costs. As the service period of
street lighting is long, approximately 30 years, the present value of the
residual value remains low.
Base cases
Table 13 introduces the ten renewed street lighting cases in the LCC
analysis in Finland. These ten cases were considered as the base cases in
contrast to variant cases introduced in the next subchapter. Cases A to C
have been presented in Tähkämö et al. [6], and cases D to J represent the
additional cases conducted in this work.
The luminaire replacements took place in 2009-2010. In cases A to C, the
old luminaires were equipped with HPM lamps. In cases D to J, the
previous lamps were retrofit HPS lamps (110 W) that were installed to
replace the original HPM lamps in the same luminaires in 1996-2000. The
luminaires were replaced by HPS luminaires (cases A, B, I), LED luminaires
(cases C to H), or induction luminaires (case J). It should be noted that, in
Methodology study of life cycle assessment of light sources
53
the new installation of the case I, the HPS lamp had an especially long life
(48 000 h) due to the special type of the lamp. HPS lamps normally have a
life of 16 000-24 000 h. The new luminaires were installed in the existing
poles except for case C. The case C was modelled here only by considering
the purchase price and installing costs of the LED luminaires. In reality,
there was additional costs of approximately 1 000 €/pole from the purchase
and installing of the poles, cables and bases in the case C.
The LCC analysis was modelled to represent the actual cases in Finland.
The electricity prices, including the electricity and the transmission, were
the actual ones of the municipalities. In Espoo (cases D to J), the electricity
price was calculated combining the day- and nighttime tariffs of both the
electricity and the transmission. The purchase costs and the group
replacement costs included the installing costs and the purchase prices of
the luminaires. In cases D to J, it was possible to obtain data as detailed as
separated into lamp price, luminaire price, cost of the worker, cost of the
assembly truck and driving to and from the place of installation.
The nominal discount rate was estimated to be 6 % and inflation 3 % [38].
Thus, the real discount rate is approximately 2.91 %. The time scale of the
calculation was 30 years. No fixed costs were included. The residual value is
calculated to represent 25 % of the investment cost according to the Finnish
Road Administration [38]. The costs of cleaning of the luminaires and other
maintenance were excluded from the LCC analysis due to the high
uncertainty in the need of such operations and in estimating their duration
and costs.
The development of the LED technology was taken into account in the
LCC analysis. The group replacement cost and luminaire power were
changed in the cases C to H on the basis of an estimate of the technology
development in terms of luminous efficacy and purchase price. The
development of LED luminaires was cautiously estimated. Figure 14
illustrates the predictions of the price development and luminous efficacy of
LED package and luminous efficacy of LED luminaire. The references used
in Figure 14 are from year 2010 [85] and 2012 [86]. As seen in Figure 14,
the 2012 estimates are somewhat more cautious compared to the 2010
estimates of LED package luminous efficacies. In contrast, the price
reduction of the LED packages is estimated to be even more rapid than in
2010.
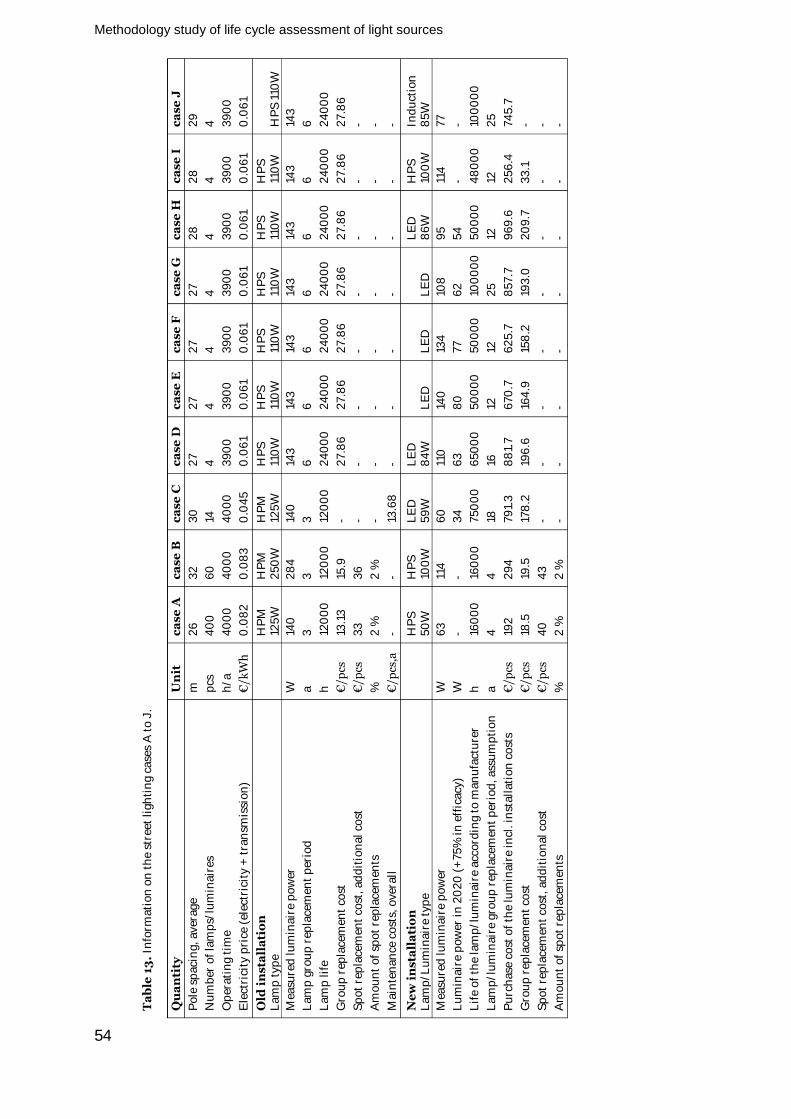
Methodology study of life cycle assessment of light sources
54
Ta
ble
13
. In
form
ati
on
on
th
e st
reet
lig
hti
ng
ca
ses
A t
o J
.
Qu
an
tity
U
nit
c
ase
A
ca
se
B
ca
se
C
ca
se
D
ca
se
E
ca
se
F
ca
se
G
ca
se
H
ca
se
I
ca
se
J
Po
le s
pa
cin
g,
av
era
ge
m
2
6
32
3
0
27
2
7
27
2
7
28
2
8
29
Nu
mb
er o
f la
mp
s/lu
min
air
es
pcs
4
00
6
0
14
4
4
4
4
4
4
4
Op
era
tin
g t
ime
h/a
4
00
0
40
00
4
00
0
39
00
3
90
0
39
00
3
90
0
39
00
3
90
0
39
00
Ele
ctri
city
pri
ce (
elec
tric
ity
+ t
ran
smis
sio
n)
€/k
Wh
0
.08
2
0.0
83
0
.04
5
0.0
61
0.0
61
0.0
61
0.0
61
0.0
61
0.0
61
0.0
61
Old
in
sta
lla
tio
n
La
mp
ty
pe
H
PM
12
5W
H
PM
2
50
W
HP
M
125
W
HP
S
110
W
HP
S
110
W
HP
S
110
W
HP
S
110
W
HP
S
110
W
HP
S
110
W
HP
S 1
10W
Mea
sure
d l
um
ina
ire
po
wer
W
14
0
28
4
140
14
3
143
14
3
143
14
3
143
14
3
La
mp
gro
up
rep
lace
me
nt
per
iod
a
3
3
3
6
6
6
6
6
6
6
La
mp
lif
e
h
120
00
12
00
0
120
00
2
40
00
2
40
00
2
40
00
2
40
00
2
40
00
2
40
00
2
40
00
Gro
up
rep
lace
me
nt
cost
€
/pcs
13
.13
15
.9
- 2
7.8
6
27
.86
2
7.8
6
27
.86
2
7.8
6
27
.86
2
7.8
6
Sp
ot
rep
lace
men
t co
st,
ad
dit
ion
al
cost
€
/pcs
3
3
36
-
- -
-
-
-
-
-
Am
ou
nt
of
spo
t re
pla
cem
ents
%
2
%
2 %
-
- -
- -
- -
-
Ma
inte
na
nce
co
sts,
ov
era
ll
€/p
cs,a
-
- 13
.68
-
- -
- -
- -
Ne
w i
nsta
lla
tio
n
La
mp
/Lu
min
air
e ty
pe
H
PS
5
0W
H
PS
10
0W
L
ED
5
9W
L
ED
8
4W
L
ED
L
ED
L
ED
L
ED
8
6W
H
PS
10
0W
In
du
ctio
n
85
W
Mea
sure
d l
um
ina
ire
po
wer
W
6
3
114
6
0
110
14
0
134
10
8
95
11
4
77
Lu
min
air
e p
ow
er i
n 2
02
0 (
+7
5%
in
eff
ica
cy)
W
- -
34
6
3
80
7
7
62
5
4
- -
Lif
e o
f th
e la
mp
/lu
min
air
e a
cco
rdin
g t
o m
an
ufa
ctu
rer
h
160
00
16
00
0
75
00
0
65
00
0
50
00
0
50
00
0
100
00
0
50
00
0
48
00
0
100
00
0
La
mp
/lu
min
air
e g
rou
p r
epla
cem
ent
per
iod
, a
ssu
mp
tio
n
a
4
4
18
16
12
12
25
12
12
2
5
Pu
rch
ase
co
st o
f th
e lu
min
air
e in
cl.
inst
all
ati
on
co
sts
€/p
cs
192
2
94
7
91.
3
88
1.7
6
70
.7
62
5.7
8
57
.7
96
9.6
2
56
.4
74
5.7
Gro
up
rep
lace
me
nt
cost
€
/pcs
18
.5
19.5
17
8.2
19
6.6
16
4.9
15
8.2
19
3.0
2
09
.7
33
.1
-
Sp
ot
rep
lace
men
t co
st,
ad
dit
ion
al
cost
€
/pcs
4
0
43
-
- -
- -
- -
-
Am
ou
nt
of
spo
t re
pla
cem
ents
%
2
%
2 %
-
- -
- -
- -
-
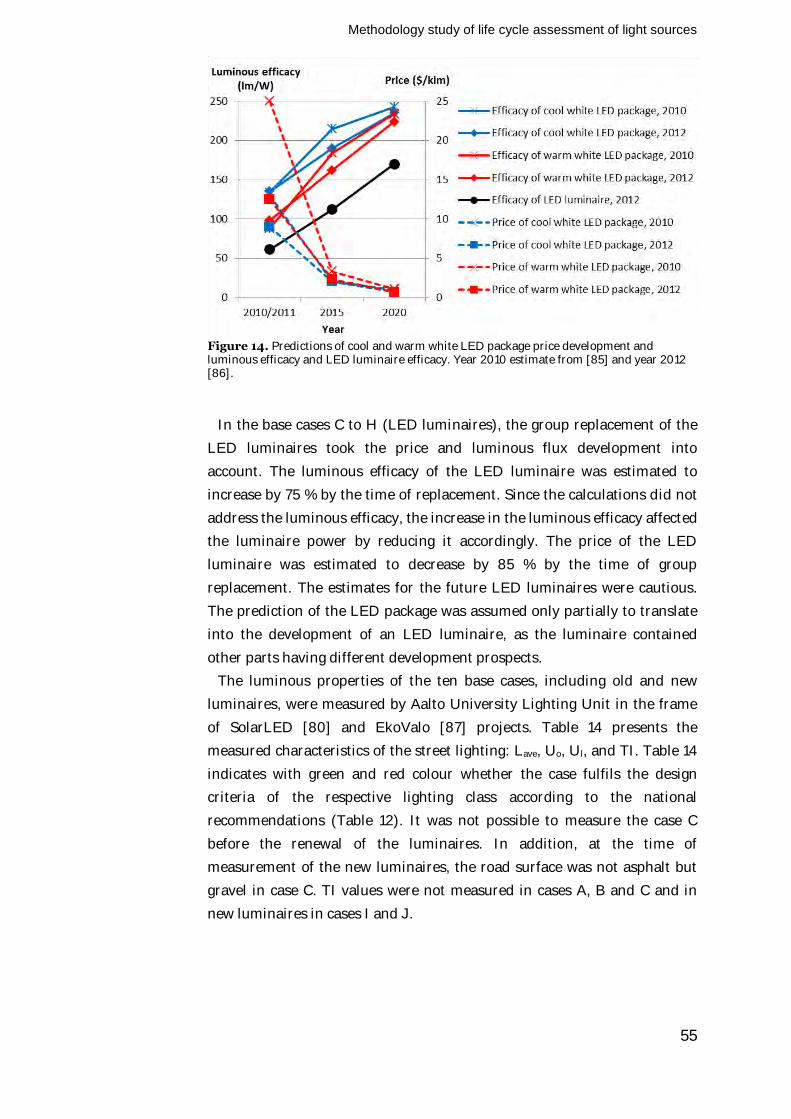
Methodology study of life cycle assessment of light sources
55
Figure 14. Predictions of cool and warm white LED package price development and luminous efficacy and LED luminaire efficacy. Year 2010 estimate from [85] and year 2012 [86].
In the base cases C to H (LED luminaires), the group replacement of the
LED luminaires took the price and luminous flux development into
account. The luminous efficacy of the LED luminaire was estimated to
increase by 75 % by the time of replacement. Since the calculations did not
address the luminous efficacy, the increase in the luminous efficacy affected
the luminaire power by reducing it accordingly. The price of the LED
luminaire was estimated to decrease by 85 % by the time of group
replacement. The estimates for the future LED luminaires were cautious.
The prediction of the LED package was assumed only partially to translate
into the development of an LED luminaire, as the luminaire contained
other parts having different development prospects.
The luminous properties of the ten base cases, including old and new
luminaires, were measured by Aalto University Lighting Unit in the frame
of SolarLED [80] and EkoValo [87] projects. Table 14 presents the
measured characteristics of the street lighting: Lave, Uo, Ul, and TI. Table 14
indicates with green and red colour whether the case fulfils the design
criteria of the respective lighting class according to the national
recommendations (Table 12). It was not possible to measure the case C
before the renewal of the luminaires. In addition, at the time of
measurement of the new luminaires, the road surface was not asphalt but
gravel in case C. TI values were not measured in cases A, B and C and in
new luminaires in cases I and J.
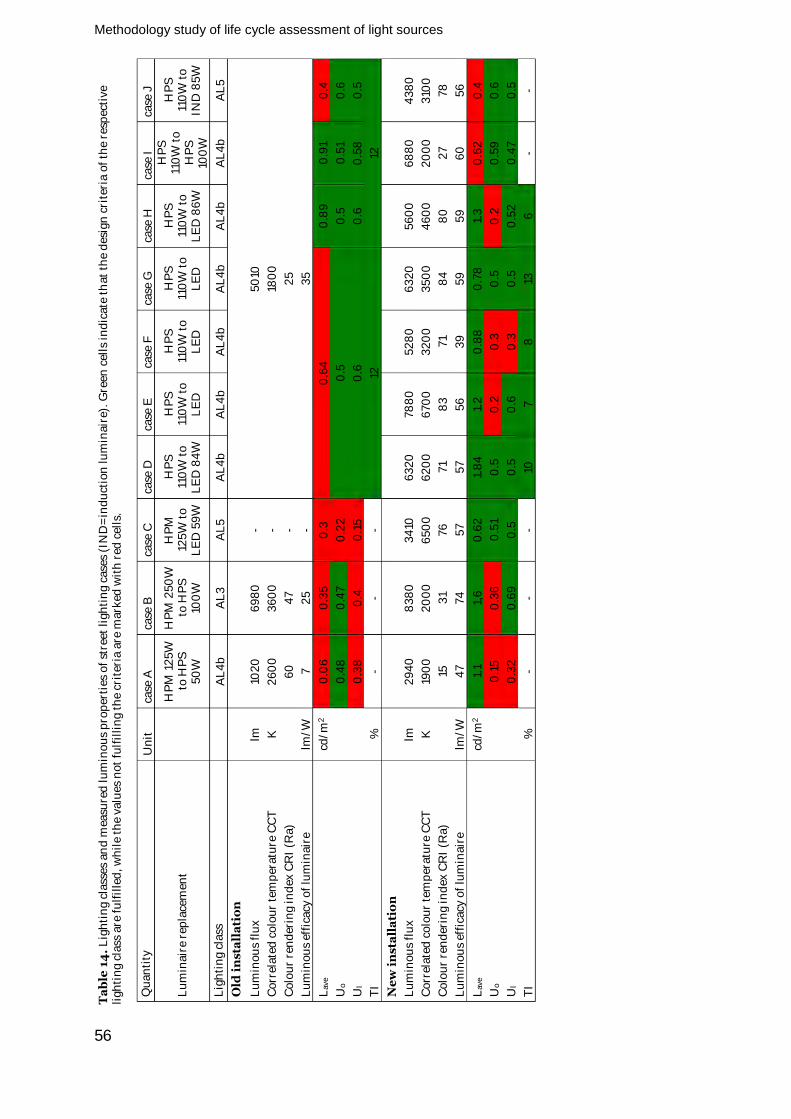
Methodology study of life cycle assessment of light sources
56
Ta
ble
14
. L
igh
tin
g c
lass
es
an
d m
easu
red
lu
min
ou
s p
rop
erti
es o
f st
reet
lig
hti
ng
ca
ses
(IN
D=
ind
uct
ion
lu
min
air
e).
Gre
en
cel
ls i
nd
ica
te t
ha
t th
e d
esig
n c
rite
ria
of
the
resp
ecti
ve
li
gh
tin
g c
lass
are
fu
lfil
led
, w
hil
e th
e v
alu
es
no
t fu
lfil
lin
g t
he
crit
eria
are
ma
rked
wit
h r
ed c
ells
.
Qu
an
tity
U
nit
ca
se A
ca
se B
ca
se C
ca
se D
ca
se E
ca
se F
ca
se G
ca
se H
ca
se I
ca
se J
Lu
min
air
e re
pla
cem
en
t
HP
M 1
25
W
to H
PS
5
0W
HP
M 2
50
W
to H
PS
10
0W
HP
M
125
W t
o
LE
D 5
9W
HP
S
110
W t
o
LE
D 8
4W
HP
S
110
W t
o
LE
D
HP
S
110
W t
o
LE
D
HP
S
110
W t
o
LE
D
HP
S
110
W t
o
LE
D 8
6W
HP
S
110
W t
o
HP
S
100
W
HP
S
110
W t
o
IND
85
W
Lig
hti
ng
cla
ss
A
L4
b
AL
3
AL
5
AL
4b
A
L4
b
AL
4b
A
L4
b
AL
4b
A
L4
b
AL
5
Old
in
sta
lla
tio
n
L
um
ino
us
flu
x
lm
102
0
69
80
-
50
10
Co
rrel
ate
d c
olo
ur
tem
per
atu
re C
CT
K
2
60
0
36
00
-
180
0
Co
lou
r re
nd
erin
g i
nd
ex C
RI
(Ra
)
60
4
7
- 2
5
Lu
min
ou
s ef
fica
cy o
f lu
min
air
e
lm/W
7
2
5
- 3
5
La
ve
cd/m
2
0.0
6
0.3
5
0.3
0
.64
0
.89
0
.91
0.4
Uo
0
.48
0
.47
0
.22
0
.5
0.5
0
.51
0.6
Ul
0
.38
0
.4
0.1
5
0.6
0
.6
0.5
8
0.5
TI
%
- -
- 12
12
Ne
w i
nsta
lla
tio
n
L
um
ino
us
flu
x
lm
29
40
8
38
0
34
10
63
20
7
88
0
52
80
6
32
0
56
00
6
88
0
43
80
Co
rrel
ate
d c
olo
ur
tem
per
atu
re C
CT
K
19
00
2
00
0
65
00
6
20
0
67
00
3
20
0
35
00
4
60
0
20
00
3
100
Co
lou
r re
nd
erin
g i
nd
ex C
RI
(Ra
)
15
31
76
7
1 8
3
71
84
8
0
27
7
8
Lu
min
ou
s ef
fica
cy o
f lu
min
air
e lm
/W
47
7
4
57
5
7
56
3
9
59
5
9
60
5
6
La
ve
cd/m
2
1.1
1,6
0
.62
1.
84
1.
2
0.8
8
0.7
8
1.3
0
.62
0
.4
Uo
0
.15
0
.36
0
.51
0.5
0
.2
0.3
0
.5
0.2
0
.59
0
.6
Ul
0
.32
0
.69
0
.5
0.5
0
.6
0.3
0
.5
0.5
2
0.4
7
0.5
TI
%
- -
- 10
7
8
13
6
-
-
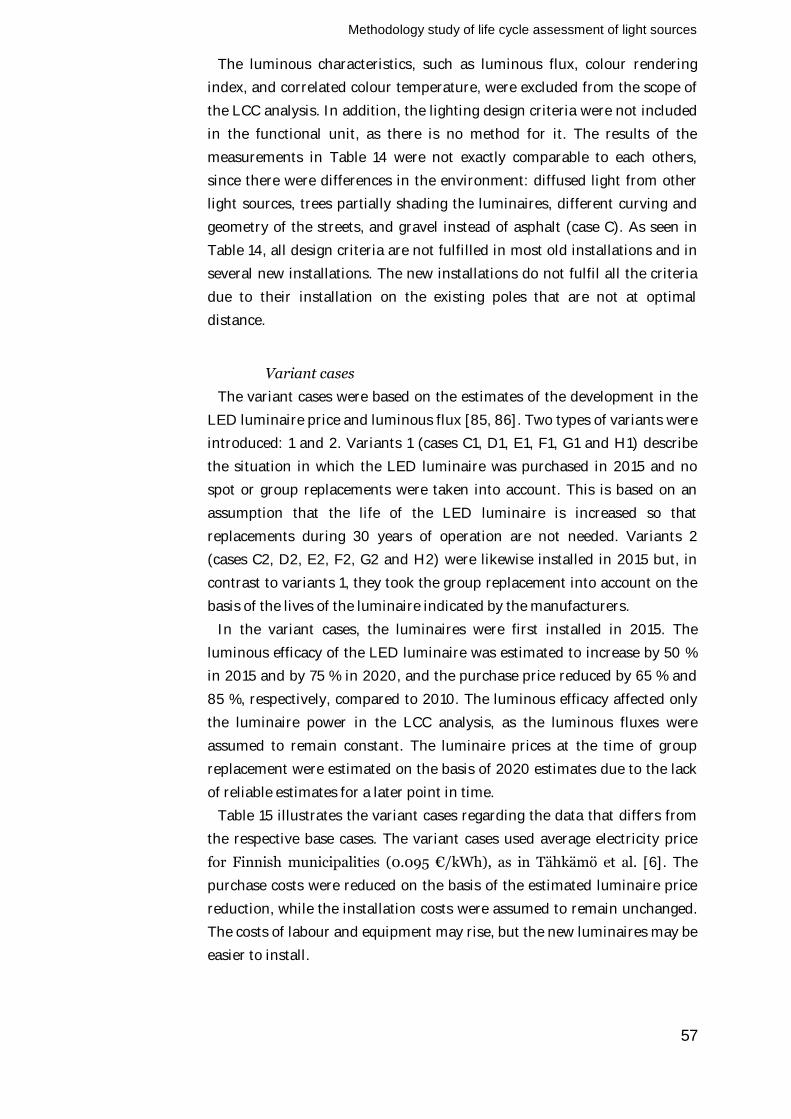
Methodology study of life cycle assessment of light sources
57
The luminous characteristics, such as luminous flux, colour rendering
index, and correlated colour temperature, were excluded from the scope of
the LCC analysis. In addition, the lighting design criteria were not included
in the functional unit, as there is no method for it. The results of the
measurements in Table 14 were not exactly comparable to each others,
since there were differences in the environment: diffused light from other
light sources, trees partially shading the luminaires, different curving and
geometry of the streets, and gravel instead of asphalt (case C). As seen in
Table 14, all design criteria are not fulfilled in most old installations and in
several new installations. The new installations do not fulfil all the criteria
due to their installation on the existing poles that are not at optimal
distance.
Variant cases
The variant cases were based on the estimates of the development in the
LED luminaire price and luminous flux [85, 86]. Two types of variants were
introduced: 1 and 2. Variants 1 (cases C1, D1, E1, F1, G1 and H1) describe
the situation in which the LED luminaire was purchased in 2015 and no
spot or group replacements were taken into account. This is based on an
assumption that the life of the LED luminaire is increased so that
replacements during 30 years of operation are not needed. Variants 2
(cases C2, D2, E2, F2, G2 and H2) were likewise installed in 2015 but, in
contrast to variants 1, they took the group replacement into account on the
basis of the lives of the luminaire indicated by the manufacturers.
In the variant cases, the luminaires were first installed in 2015. The
luminous efficacy of the LED luminaire was estimated to increase by 50 %
in 2015 and by 75 % in 2020, and the purchase price reduced by 65 % and
85 %, respectively, compared to 2010. The luminous efficacy affected only
the luminaire power in the LCC analysis, as the luminous fluxes were
assumed to remain constant. The luminaire prices at the time of group
replacement were estimated on the basis of 2020 estimates due to the lack
of reliable estimates for a later point in time.
Table 15 illustrates the variant cases regarding the data that differs from
the respective base cases. The variant cases used average electricity price
for Finnish municipalities (0.095 €/kWh), as in Tähkämö et al. [6]. The
purchase costs were reduced on the basis of the estimated luminaire price
reduction, while the installation costs were assumed to remain unchanged.
The costs of labour and equipment may rise, but the new luminaires may be
easier to install.
Methodology study of life cycle assessment of light sources
58
Ta
ble
15
. In
form
ati
on
on
th
e v
ari
an
t ca
ses
of
LE
D c
ase
s C
1 to
H2
reg
ard
ing
th
e d
ata
th
at
dif
fers
fro
m t
he
on
e o
f th
e b
ase
ca
ses.
Ea
ch v
ari
an
t ca
se (
1 a
nd
2)
corr
esp
on
ds
to
resp
ecti
ve
ba
se c
ase
, e.
g.,
C1
an
d C
2 a
re b
ase
d o
n c
ase
C i
n T
ab
le 1
3.
Va
ria
nt
case
s 1
(C1
to H
1) a
re i
nst
all
ed i
n 2
015
an
d n
o g
rou
p r
epla
cem
ents
are
ta
ke
n i
nto
acc
ou
nt,
wh
ile
va
ria
nt
case
s 2
(C
2 t
o H
2)
are
lik
ewis
e in
sta
lled
in
20
15 b
ut
con
sid
er a
lso
th
e g
rou
p r
epla
cem
ents
acc
ord
ing
to
th
e li
fe o
f th
e lu
min
air
e.
Qu
an
tity
U
nit
C
1 C
2
D1
D2
E
1
E2
F
1
F2
G
1 G
2
H1
H2
Lu
min
air
e re
pla
cem
en
t
HP
M 1
25
W t
o L
ED
H
PS
110
W t
o L
ED
H
PS
110
W t
o L
ED
H
PS
110
W t
o L
ED
H
PS
110
W t
o L
ED
H
PS
110
W t
o L
ED
Ele
ctri
city
pri
ce (
elec
tric
ity
+ t
ran
smis
sio
n)
€/k
Wh
0
.09
5
0.0
95
0
.09
5
0.0
95
0
.09
5
0.0
95
Ne
w i
nsta
lla
tio
n
Lu
min
air
e p
ow
er i
n 2
015
(+
50
% i
n e
ffic
acy
) W
4
0
73
9
3
89
7
2
63
Lu
min
air
e p
ow
er i
n 2
02
0 (
+7
5%
in
eff
ica
cy)
W
34
6
3
80
7
7
62
5
4
Lif
e o
f th
e la
mp
/lu
min
air
e a
cco
rdin
g t
o
ma
nu
fact
ure
r k
h
>7
5
75
>
65
6
5
>5
0
50
>
50
5
0
>10
0
100
>
50
5
0
La
mp
/lu
min
air
e g
rou
p r
epla
cem
ent
per
iod
, a
ssu
mp
tio
n
a
30
18
3
0
16
30
12
3
0
12
30
2
5
30
12
Pu
rch
ase
co
st o
f th
e lu
min
air
e in
cl.
inst
all
ati
on
co
sts
€/p
cs
32
2.5
3
57
.8
28
3.9
2
68
.2
34
9.4
3
88
.5
Gro
up
rep
lace
me
nt
cost
€
/pcs
17
8.2
19
6.6
16
4.9
15
8.2
19
3.0
2
09
.7
Methodology study of life cycle assessment of light sources
59
4.4.2 Results
The LCC analysis results of the cases A to J are collected in Table 16. The
investment costs of the cases C to H, in which LED luminaires were
installed, were clearly greater (23 170 – 34 630 €/km) than the ones with
HPS (7 380 – 9 160 €/km) and similar with induction (25 710 €/km)
luminaires. The savings from the operating costs were low (7 – 260 €/km)
in cases D to H due to the modest reduction in luminaire power from the
old luminaire to the LED luminaires (reduction in power 3 – 48 W). The
savings in operating costs in cases D to H were low also because of the
installation of the luminaires in existing poles and not optimizing the pole
distance.
The payback times of cases A and B were viable (5 – 9 a), while the rest of
the cases had payback times approximately 30 years or more, which
exceeds the 30 year time scale of the calculation. The payback times should
remain as low as possible in order for the renewal to be profitable in
monetary terms.
The LCCs of the cases A, B and I (new installation of HPS luminaire) were
divided into discounted energy costs (56 %, 62 %, 62 %), investment costs
(26 %, 25 %, 29 %), discounted maintenance costs (15 %, 10 %, 6 %) and
discounted residual value (3 %). The LCCs of the cases C to H with LED
luminaires were mainly caused by the investment costs, approximately 44
% to 63 % of the LCCs (average 53 %). Discounted energy costs accounted
for approximately 14-33 % (average 26 %), maintenance costs 10-20 %
(average 16 %) and residual value 5-7 % (average 6 %) of the LCCs of LED
luminaires. The case J (induction luminaire) divided the LCCs between
investment costs (63 %), energy costs (30 %) and residual value (7 %). Case
J excluded the group replacement during 30 years of operation. The
operating time of an induction lamp was estimated at 100 000 h. No lamp
price data was available, since the induction luminaire was sold as one
entity (670 €/piece).
The savings in operating costs from the renewal varied significantly in the
studied cases (Table 16). The savings from operating costs depended on the
differences in the luminaire power of the old and new installation and in
the maintenance costs. The greatest savings in operating costs (1750 €/km,
a) were achieved in case B due to the significant reduction in the luminaire
power (from 284 W to 114 W measured luminaire power). Case A saved
approximately 950 €/km per year and case C 670 €/km per year. Cases D
to H created savings ranging from only 7 to 260 €/km per year in operating
costs. In addition, the group replacement cost of the LED luminaires was
higher compared to the conventional luminaires having only a lamp to
replace, not the whole luminaire as in case of LED luminaires.
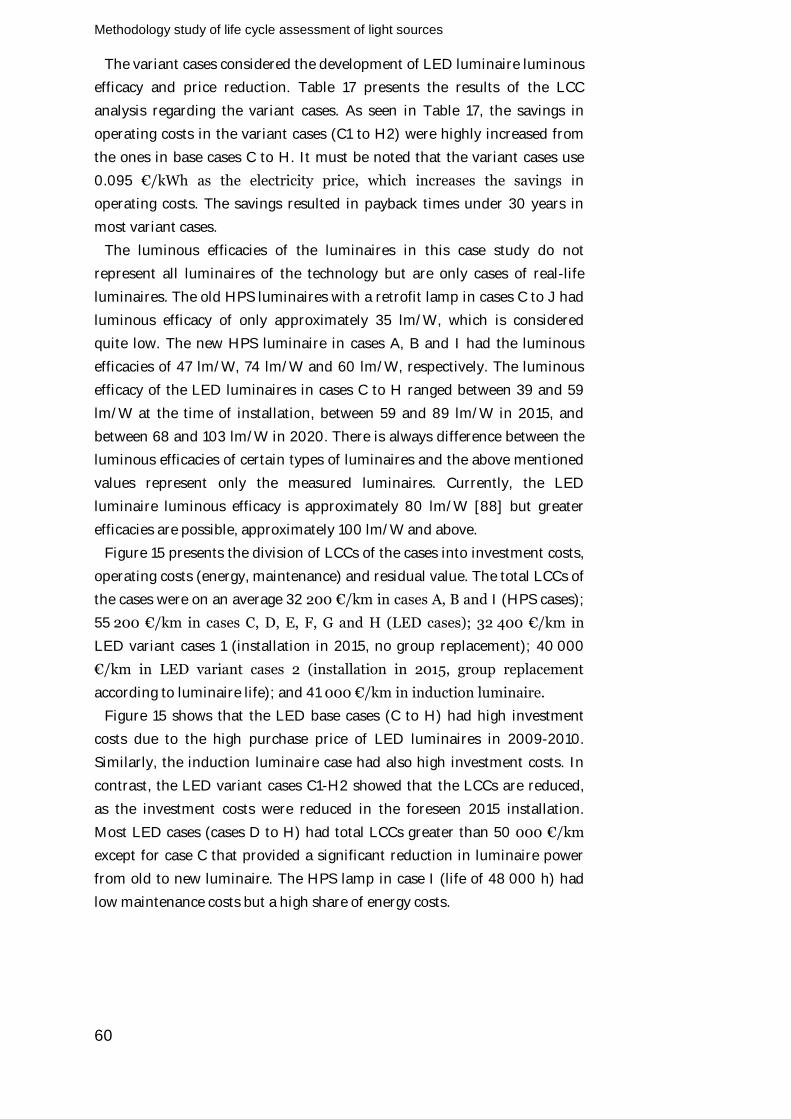
Methodology study of life cycle assessment of light sources
60
The variant cases considered the development of LED luminaire luminous
efficacy and price reduction. Table 17 presents the results of the LCC
analysis regarding the variant cases. As seen in Table 17, the savings in
operating costs in the variant cases (C1 to H2) were highly increased from
the ones in base cases C to H. It must be noted that the variant cases use
0.095 €/kWh as the electricity price, which increases the savings in
operating costs. The savings resulted in payback times under 30 years in
most variant cases.
The luminous efficacies of the luminaires in this case study do not
represent all luminaires of the technology but are only cases of real-life
luminaires. The old HPS luminaires with a retrofit lamp in cases C to J had
luminous efficacy of only approximately 35 lm/W, which is considered
quite low. The new HPS luminaire in cases A, B and I had the luminous
efficacies of 47 lm/W, 74 lm/W and 60 lm/W, respectively. The luminous
efficacy of the LED luminaires in cases C to H ranged between 39 and 59
lm/W at the time of installation, between 59 and 89 lm/W in 2015, and
between 68 and 103 lm/W in 2020. There is always difference between the
luminous efficacies of certain types of luminaires and the above mentioned
values represent only the measured luminaires. Currently, the LED
luminaire luminous efficacy is approximately 80 lm/W [88] but greater
efficacies are possible, approximately 100 lm/W and above.
Figure 15 presents the division of LCCs of the cases into investment costs,
operating costs (energy, maintenance) and residual value. The total LCCs of
the cases were on an average 32 200 €/km in cases A, B and I (HPS cases);
55 200 €/km in cases C, D, E, F, G and H (LED cases); 32 400 €/km in
LED variant cases 1 (installation in 2015, no group replacement); 40 000
€/km in LED variant cases 2 (installation in 2015, group replacement
according to luminaire life); and 41 000 €/km in induction luminaire.
Figure 15 shows that the LED base cases (C to H) had high investment
costs due to the high purchase price of LED luminaires in 2009-2010.
Similarly, the induction luminaire case had also high investment costs. In
contrast, the LED variant cases C1-H2 showed that the LCCs are reduced,
as the investment costs were reduced in the foreseen 2015 installation.
Most LED cases (cases D to H) had total LCCs greater than 50 000 €/km
except for case C that provided a significant reduction in luminaire power
from old to new luminaire. The HPS lamp in case I (life of 48 000 h) had
low maintenance costs but a high share of energy costs.
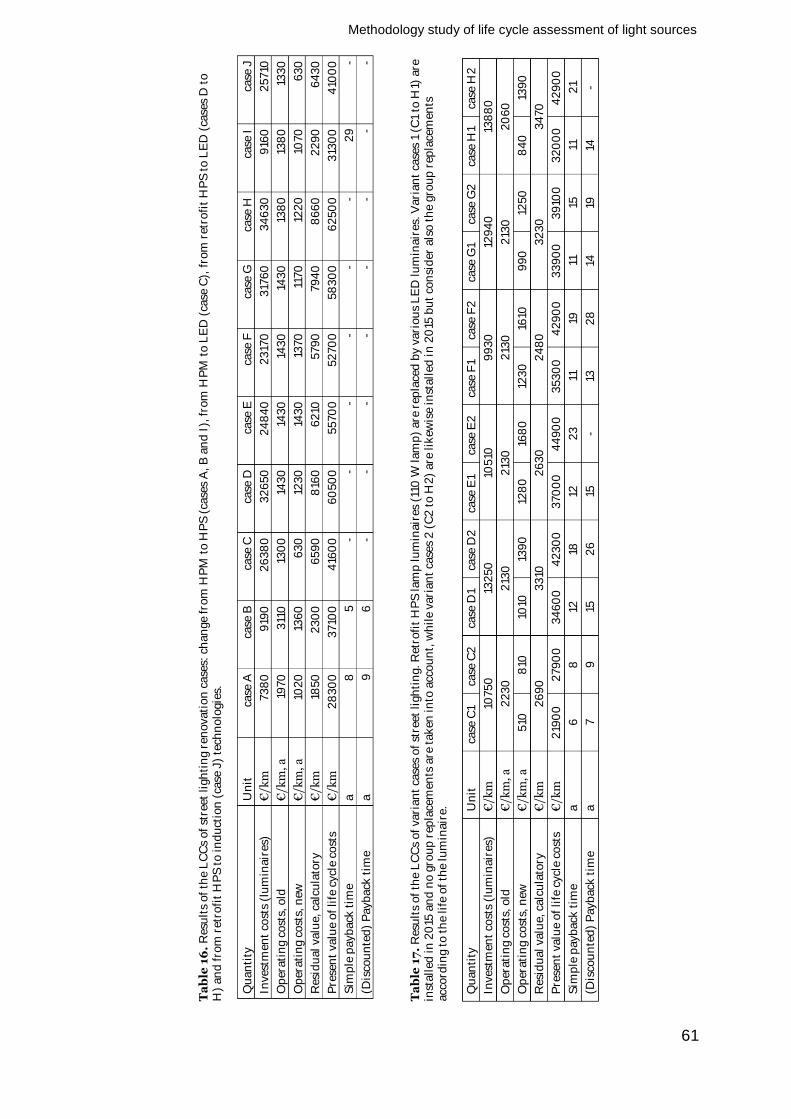
Methodology study of life cycle assessment of light sources
61
Ta
ble
16
. R
esu
lts
of
the
LC
Cs
of
stre
et l
igh
tin
g r
en
ov
ati
on
ca
ses:
ch
an
ge
fro
m H
PM
to
HP
S (
case
s A
, B
an
d I
), f
rom
HP
M t
o L
ED
(ca
se C
), f
rom
ret
rofi
t H
PS
to
LE
D (
case
s D
to
H
) a
nd
fro
m r
etro
fit
HP
S t
o i
nd
uct
ion
(ca
se J
) te
chn
olo
gie
s.
Qu
an
tity
U
nit
ca
se A
ca
se B
ca
se C
ca
se D
ca
se E
ca
se F
ca
se G
ca
se H
ca
se I
ca
se J
Inv
estm
ent
cost
s (l
um
ina
ire
s)
€/k
m
73
80
9
190
2
63
80
3
26
50
2
48
40
2
317
0
317
60
3
46
30
9
160
2
57
10
Op
era
tin
g c
ost
s, o
ld
€/k
m,
a
197
0
311
0
130
0
143
0
143
0
143
0
143
0
138
0
138
0
133
0
Op
era
tin
g c
ost
s, n
ew
€/k
m,
a
102
0
136
0
63
0
123
0
143
0
137
0
117
0
122
0
107
0
63
0
Res
idu
al
va
lue,
ca
lcu
lato
ry
€/k
m
185
0
23
00
6
59
0
816
0
62
10
57
90
7
94
0
86
60
2
29
0
64
30
Pre
sen
t v
alu
e o
f li
fe c
ycl
e co
sts
€/k
m
28
30
0
37
100
4
160
0
60
50
0
55
70
0
52
70
0
58
30
0
62
50
0
313
00
4
100
0
Sim
ple
pa
yb
ack
tim
e
a
8
5
- -
- -
- -
29
-
(Dis
cou
nte
d)
Pa
yb
ack
tim
e
a
9
6
- -
- -
- -
- -
Ta
ble
17
. R
esu
lts
of
the
LC
Cs
of
va
ria
nt
case
s o
f st
reet
lig
hti
ng
. R
etro
fit
HP
S l
am
p l
um
ina
ires
(11
0 W
la
mp
) a
re r
epla
ced
by
va
rio
us
LE
D l
um
ina
ire
s. V
ari
an
t ca
ses
1 (C
1 to
H1)
are
in
sta
lled
in
20
15 a
nd
no
gro
up
rep
lace
men
ts a
re t
ak
en i
nto
acc
ou
nt,
wh
ile
va
ria
nt
case
s 2
(C
2 t
o H
2)
are
lik
ewis
e in
sta
lle
d i
n 2
015
bu
t co
nsi
der
als
o t
he
gro
up
rep
lace
me
nts
a
cco
rdin
g t
o t
he
life
of
the
lum
ina
ire.
Qu
an
tity
U
nit
ca
se C
1 ca
se C
2
case
D1
case
D2
ca
se E
1 ca
se E
2
case
F1
case
F2
ca
se G
1 ca
se G
2
case
H1
case
H2
Inv
estm
ent
cost
s (l
um
ina
ire
s)
€/k
m
107
50
13
25
0
105
10
99
30
12
94
0
138
80
Op
era
tin
g c
ost
s, o
ld
€/k
m,
a
22
30
2
130
2
130
2
130
2
130
2
06
0
Op
era
tin
g c
ost
s, n
ew
€/k
m,
a
510
8
10
1010
13
90
12
80
16
80
12
30
16
10
99
0
125
0
84
0
139
0
Res
idu
al
va
lue,
ca
lcu
lato
ry
€/k
m
26
90
3
310
2
63
0
24
80
3
23
0
34
70
Pre
sen
t v
alu
e o
f li
fe c
ycl
e co
sts
€/k
m
219
00
2
79
00
3
46
00
4
23
00
3
70
00
4
49
00
3
53
00
4
29
00
3
39
00
3
910
0
32
00
0
42
90
0
Sim
ple
pa
yb
ack
tim
e
a
6
8
12
18
12
23
11
19
11
15
11
2
1
(Dis
cou
nte
d)
Pa
yb
ack
tim
e
a
7
9
15
26
15
-
13
28
14
19
14
-
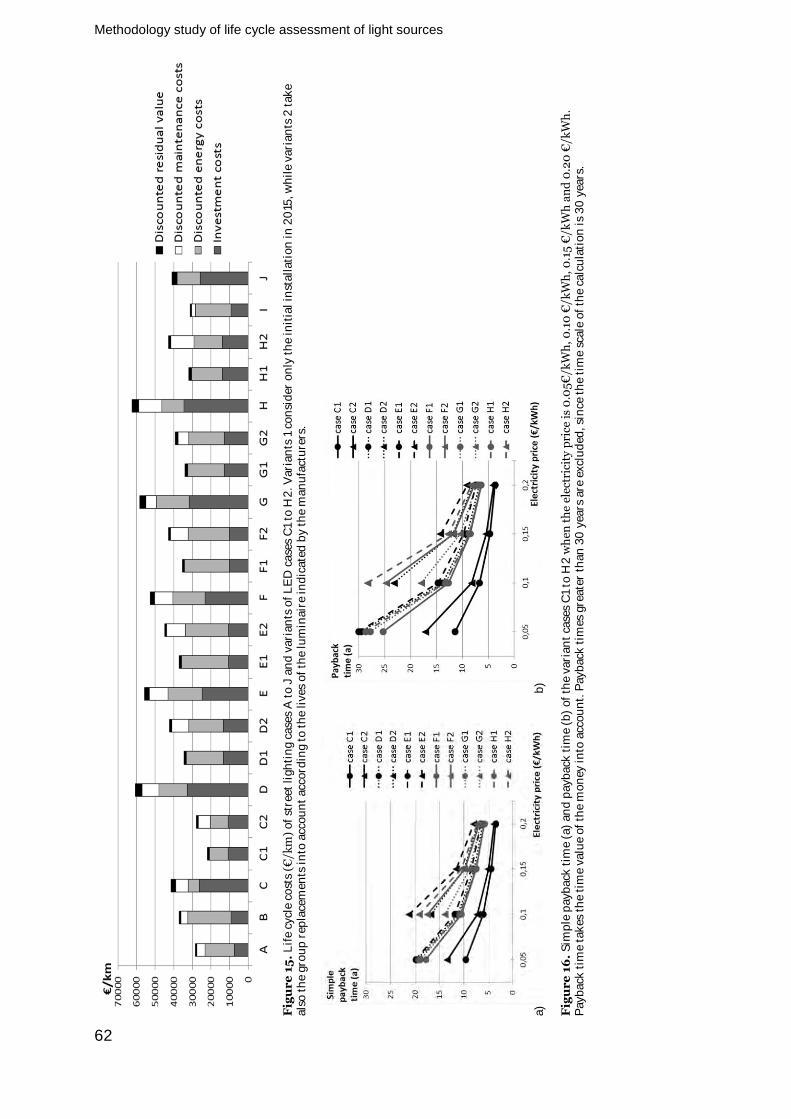
Methodology study of life cycle assessment of light sources
62
Fig
ur
e 1
5.
Lif
e cy
cle
cost
s (€
/km
) o
f st
reet
lig
hti
ng
ca
ses
A t
o J
an
d v
ari
an
ts o
f L
ED
ca
ses
C1
to H
2.
Va
ria
nts
1 c
on
sid
er o
nly
th
e in
itia
l in
sta
lla
tio
n i
n 2
015
, w
hil
e v
ari
an
ts 2
ta
ke
als
o t
he
gro
up
rep
lace
me
nts
in
to a
cco
un
t a
cco
rdin
g t
o t
he
liv
es o
f th
e lu
min
air
e in
dic
ate
d b
y t
he
ma
nu
fact
ure
rs.
a)
b
)
Fig
ur
e 1
6.
Sim
ple
pa
yb
ack
tim
e (a
) a
nd
pa
yb
ack
tim
e (b
) o
f th
e v
ari
an
t ca
ses
C1
to H
2 w
hen
th
e el
ectr
icit
y p
rice
is
0.0
5€
/kW
h,
0.1
0 €
/kW
h,
0.1
5 €
/kW
h a
nd
0.2
0 €
/kW
h.
Pa
yb
ack
tim
e ta
kes
th
e ti
me
va
lue
of
the
mo
ney
in
to a
cco
un
t. P
ay
ba
ck t
imes
gre
ate
r th
an
30
yea
rs a
re e
xcl
ud
ed,
sin
ce t
he
tim
e s
cale
of
the
calc
ula
tio
n i
s 3
0 y
ears
.
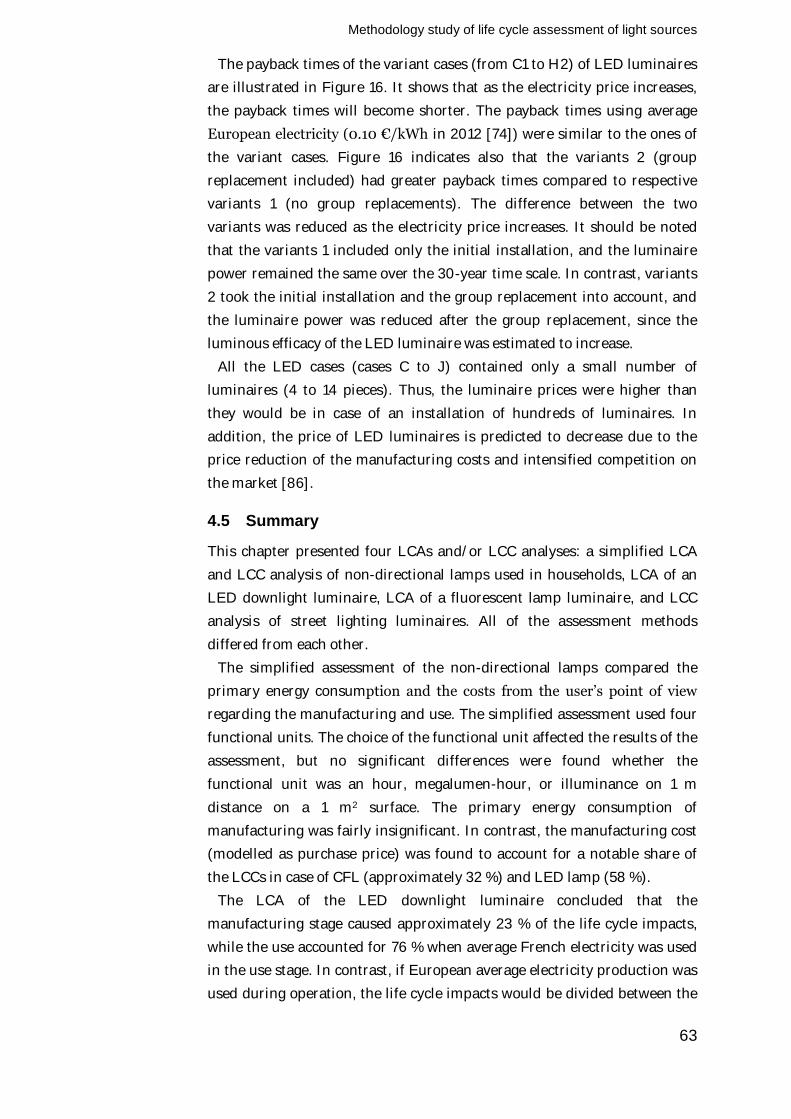
Methodology study of life cycle assessment of light sources
63
The payback times of the variant cases (from C1 to H2) of LED luminaires
are illustrated in Figure 16. It shows that as the electricity price increases,
the payback times will become shorter. The payback times using average
European electricity (0.10 €/kWh in 2012 [74]) were similar to the ones of
the variant cases. Figure 16 indicates also that the variants 2 (group
replacement included) had greater payback times compared to respective
variants 1 (no group replacements). The difference between the two
variants was reduced as the electricity price increases. It should be noted
that the variants 1 included only the initial installation, and the luminaire
power remained the same over the 30-year time scale. In contrast, variants
2 took the initial installation and the group replacement into account, and
the luminaire power was reduced after the group replacement, since the
luminous efficacy of the LED luminaire was estimated to increase.
All the LED cases (cases C to J) contained only a small number of
luminaires (4 to 14 pieces). Thus, the luminaire prices were higher than
they would be in case of an installation of hundreds of luminaires. In
addition, the price of LED luminaires is predicted to decrease due to the
price reduction of the manufacturing costs and intensified competition on
the market [86].
4.5 Summary
This chapter presented four LCAs and/or LCC analyses: a simplified LCA
and LCC analysis of non-directional lamps used in households, LCA of an
LED downlight luminaire, LCA of a fluorescent lamp luminaire, and LCC
analysis of street lighting luminaires. All of the assessment methods
differed from each other.
The simplified assessment of the non-directional lamps compared the
primary energy consumption and the costs from the user’s point of view
regarding the manufacturing and use. The simplified assessment used four
functional units. The choice of the functional unit affected the results of the
assessment, but no significant differences were found whether the
functional unit was an hour, megalumen-hour, or illuminance on 1 m
distance on a 1 m2 surface. The primary energy consumption of
manufacturing was fairly insignificant. In contrast, the manufacturing cost
(modelled as purchase price) was found to account for a notable share of
the LCCs in case of CFL (approximately 32 %) and LED lamp (58 %).
The LCA of the LED downlight luminaire concluded that the
manufacturing stage caused approximately 23 % of the life cycle impacts,
while the use accounted for 76 % when average French electricity was used
in the use stage. In contrast, if European average electricity production was
used during operation, the life cycle impacts would be divided between the
Methodology study of life cycle assessment of light sources
64
manufacturing (7 %) and use (93 %). Manufacturing impacts were mainly
(over 80 %) due to the driver, LED array and aluminium parts (reflector,
heatsink). Other life cycle stages, such as transport, installation and EoL,
were found to be insignificant in the total life cycle scope. The choice of the
EoL scenario did not affect the total life cycle results. The study indicated
that the life cycle results are sensitive to the life of the product and the
electricity mix in use.
The environmental impacts of the fluorescent lamp luminaire were
divided into manufacturing (7 %) and use (93 %) when use was modelled as
Finnish average electricity production. Other life cycle stages (transport,
EoL) accounted for less than 1 %. Manufacturing impacts were divided
between the luminaire cover (46 %), ballast (43 %) and lamps (11 %) on the
average. The study showed that the life cycle results are sensitive to the
electricity mix in use, and the relative impact of other life cycle stages,
notably manufacturing, is increased when the energy production is shifted
towards low-emission energy sources, such as hydropower.
As a conclusion in the LCC analysis of street lighting cases, the LED
luminaires were not economically profitable solution in small-scale
installations in 2009-2010. However, the profitability of LED luminaires is
significantly improved in large-scale installations lowering the purchase
price, by using optimised pole spacing to utilise the LED luminaire optics,
and by the increase in electricity price. The LED luminaire prices are
reduced also due to the mass-production and reduction in component
prices.
The LCC analysis showed that in case of HPS luminaires, the energy costs
account for approximately 60 %, investment costs 27 %, maintenance costs
11 % and residual value 3 % of the LCCs. In contrast, the LCCs of the LED
luminaire are divided into energy costs (average 26 %), investment costs
(53 %), maintenance costs (16 %) and residual value (6 %). In the induction
luminaire case, the energy costs covered 31 %, investment costs 63 % and
residual value 7 % of the LCCs. It is seen in the LCC analysis of the street
lighting luminaires that the energy and investment costs cause the majority
of the LCCs.
On the basis of the four cases carried out in this work in Chapter 4 and the
analysis of previous LCAs from 1991 to 2012 in Chapter 3, two models are
created for conducting the LCA of light sources: a simple model and an
extensive model. Table 18 describes the two models. The simple model is
intended to be used when the resources are very limited and the results are
needed rapidly. The simple model is created so that the presumed major
environmental aspects are taken into account. The extensive model is
intended for a more detailed assessment, but it also simplifies the method
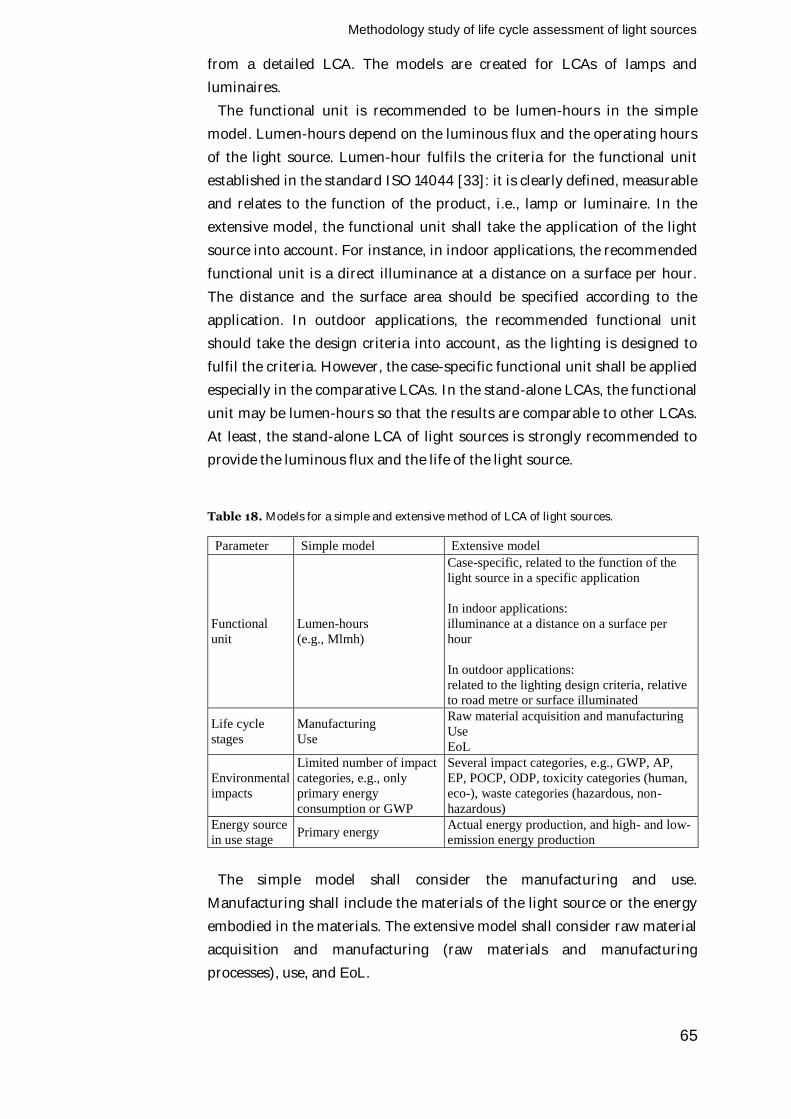
Methodology study of life cycle assessment of light sources
65
from a detailed LCA. The models are created for LCAs of lamps and
luminaires.
The functional unit is recommended to be lumen-hours in the simple
model. Lumen-hours depend on the luminous flux and the operating hours
of the light source. Lumen-hour fulfils the criteria for the functional unit
established in the standard ISO 14044 [33]: it is clearly defined, measurable
and relates to the function of the product, i.e., lamp or luminaire. In the
extensive model, the functional unit shall take the application of the light
source into account. For instance, in indoor applications, the recommended
functional unit is a direct illuminance at a distance on a surface per hour.
The distance and the surface area should be specified according to the
application. In outdoor applications, the recommended functional unit
should take the design criteria into account, as the lighting is designed to
fulfil the criteria. However, the case-specific functional unit shall be applied
especially in the comparative LCAs. In the stand-alone LCAs, the functional
unit may be lumen-hours so that the results are comparable to other LCAs.
At least, the stand-alone LCA of light sources is strongly recommended to
provide the luminous flux and the life of the light source.
Table 18. Models for a simple and extensive method of LCA of light sources.
Parameter Simple model Extensive model
Functional
unit
Lumen-hours
(e.g., Mlmh)
Case-specific, related to the function of the
light source in a specific application
In indoor applications:
illuminance at a distance on a surface per
hour
In outdoor applications:
related to the lighting design criteria, relative
to road metre or surface illuminated
Life cycle
stages
Manufacturing
Use
Raw material acquisition and manufacturing
Use
EoL
Environmental
impacts
Limited number of impact
categories, e.g., only
primary energy
consumption or GWP
Several impact categories, e.g., GWP, AP,
EP, POCP, ODP, toxicity categories (human,
eco-), waste categories (hazardous, non-
hazardous)
Energy source
in use stage Primary energy
Actual energy production, and high- and low-
emission energy production
The simple model shall consider the manufacturing and use.
Manufacturing shall include the materials of the light source or the energy
embodied in the materials. The extensive model shall consider raw material
acquisition and manufacturing (raw materials and manufacturing
processes), use, and EoL.
Methodology study of life cycle assessment of light sources
66
The LCA of light sources may be a stand-alone or a comparative
assessment. In case of a comparative LCA, the comparison should be lamp
to lamp, or luminaire to luminaire, and any identical parts or processes of
the compared products may be excluded. In contrast, in a stand-alone LCA,
the exclusion of parts or processes is not recommended. Cut-off rules may
be applied according to a specification or a PCR applied.
67
Dis
cussio
n
5 Discussion
Four LCA and/or LCC analyses of lamps and luminaires are conducted in
this work. In addition, the author analysed the previous LCAs of lamps and
luminaires found in the literature. The work showed that there is a variety
of LCA methodologies (e.g., functional unit and life cycle stages) and initial
data. Despite these differences, it was found out that the LCAs of light
sources typically conclude the use stage to cause the majority of the life
cycle environmental impacts. Consequently, the energy-efficient light
sources, such as the CFL and LED lamp or luminaire, cause lower total life
cycle environmental impacts compared to the conventional light sources,
such as the incandescent lamp.
The dominance of the use stage in the life cycle impacts generally applies
to the LCAs of light sources. However, the impact of other life cycle stages is
likely to increase, especially the manufacturing. This is partially due to the
shift towards more energy-efficient light sources but also due to the more
detailed analyses of the manufacturing stage.
The LCA and LCC studies of light sources in this work were used as the
basis for creating two models for the LCA method. The two models were
created in order to simplify the LCA method without ignoring major
environmental aspects of light sources. The models enable simplified and
rapid conduction of the LCA, which is needed in the constantly evolving
market of light sources. Especially the renewal rate of LED lamps and
luminaires is very rapid, and there are countless LED products on the
market. In order to analyse the environmental impacts of the constantly
changing products, rapid methods are needed.
There is an analogy between the comparison of the LCA of electrical and
electronic products and the LCA of an incandescent lamp and LED lamp.
The electrical product (incandescent lamp) has typically stable
manufacturing processes, uses common materials, has established use
patterns, develops slowly and has a simple structure, while the electronic
product (LED lamp) is developed fast with a short innovation time, has
unestablished use patterns, contains special materials and has a complex
structure. Therefore, it is challenging to compare the light sources of very
Discussion
68
different structures and to analyse the environmental impacts of LED light
sources in detail.
The LED downlight LCA in Chapter 4.2 and its comparison to the LED
luminaire LCA [47] showed that the use stage of the LED luminaire
accounts for over 92 % of the four environmental impact categories (ADP,
AP, EP, GWP). The energy production of the use stage determines the
results: if the average French energy was used, the environmental impacts
differed greatly from the ones of the average European energy, when the
LCA method was otherwise the same.
The LED component in the downlight luminaire was modelled in the LCA
as an indicator LED from the Ecoinvent database by multiplying its weight
by a factor of five. Even with the somewhat exaggerated estimate, it was
found out that the LED component caused only a marginal share of the
total life cycle impacts of the LED luminaire in this work. In addition, the
US DOE part 2 report [44] indicated that a high-power LED component
actually caused 94.5 % lower environmental impacts than the indicator
LED in the Ecoinvent database. The US DOE report was, however, based on
the increase in the luminous flux.
It is difficult to establish an appropriate basis for the assessment of the
environmental impacts of an LED, since the application of the LED differs
from the one of the electronic components in general, such as a resistor or a
capacitor. An update in the LCIA database is needed in order to evaluate
the environmental impacts of the LED component more precisely. It is
recommended that an LCIA database would provide data for a high-power
LED component and would state both the luminous flux and the weight of
the LED component. This would enable the future LCAs to analyse and
compare LED light sources in an in-depth manner.
The objectives of the research work have been achieved, as the work
introduces two models for the simplified conduction of the LCA of light
sources and analyses the previous LCAs of light sources. However, the
models are on a very gerenal level, so that they can be applied on any type
of a light source. Despite this work, a need for detailed guidelines remains
regarding different lighting applications, since the work suggests no
detailed rules, i.e., PCRs, for the light sources of certain applications. The
models created in the work may assist in the creation of the PCRs of light
sources. A set of PCRs would complete the LCA method for light sources.
The work concentrates on the environmental point of view but analyses
additionally the economic aspects in a simplified analysis of non-directional
household lamps and conducts an LCC analysis of street lighting
luminaires. The methods for LCAs and LCC analyses are similar, and both
are part of the total sustainability assessment. Thus, a method for
Discussion
69
combining the environmental and economic analyses is needed in the
future in order to make the combined assessment reliable and easy to use.
Currently, the environmental LCA and the economic LCC analysis are
mainly conducted either separately or considering the costs as one impact
category in the LCA.
The LCA enables the identification of the environmental hot spots and, if
used as a tool in the product development, the reduction of the
environmental impacts. The LCC analysis evaluates the economic
performance over the life cycle and provides the estimate of future costs.
However, both types of analyses are in this work used from the point of
view of a product and product comparison. The amount of luminaires or the
effect to the whole lighting market is not considered. In order to analyse the
total impact, the changes in the market need to be analysed. The current
lighting market needs to be mapped in addition to the estimated market in
the future. The lighting market is suspected to experience a rebound effect
in which the energy efficiency of the light sources is increased but the
energy saving potential is not fully achieved because of the simultaneous
increase of the amount of light sources in use [89, 90]. The reduction in the
purchase price of the light sources is one driver for the rebound effect and
the increased wealth enables it. The work can be completed with a study of
the whole lighting market and the estimated environmental and economic
impacts of the market changes in the future. The lighting design has a role
in the prevention of the rebound effect.
The LCAs of light sources do not consider the environmental impacts of
light. The artificial light affects the living organisms directly and indirectly
in many ways; e.g., birds may suffer from disorientation, birds and reptiles
may start extending their hunting and eating period to the night time, birds
and insects are attracted by the artificial light making it easier for the
predators to detect them, and plant growth and flowering are affected by
the colour, amount, timing and duration of the light [91]. It is evident that
there is no method for combining the conventional LCA results, e.g., in unit
of kg CO2-eq., with the environmental impacts of light. Lighting design has
a notable role also in the reduction of negative environmental impacts of
artificial light.
70
Conclu
sio
ns a
nd re
co
mm
endatio
ns
6 Conclusions and recommendations
The primary aim of the work was to create a model for a method for
conducting the LCA of light sources. The work established two models for
the method for conducting an LCA of light sources on the basis of the LCAs
conducted in Chapters 4.1-4.3 and the analysis of the previous LCAs in
Chapter 3. The two models, the simple and the extensive one, act as
guidelines for the LCAs of lamps and luminaires. The simple model offers
guidelines for a rapid, highly simplified LCA to be conducted with limited
resources. The extensive model provides a method for a more detailed LCA,
yet it also simplifies the LCA. Despite the simplifications, the models are
designed to consider the major environmental aspects of light sources. The
models enable rapid LCAs which are needed in the constantly evolving
market of light sources, especially LED lamps and luminaires.
The functional unit is a key parameter in the LCA. In case of light sources,
the functional unit is recommended to be lumen-hours in the simple LCA
model. Lumen-hour is clearly defined, measurable and relates to the
function of the light source: luminous flux and operating time. The
extensive LCA model recommends the use of a case-specific functional unit,
e.g., illuminance at a distance on a surface per hour. This applies especially
to the comparative LCAs, while the stand-alone LCAs should indicate the
luminous flux and the life of the light source so that further comparison is
possible.
It is noted that the case-specific functional unit is difficult to define in
outdoor lighting. For instance in street lighting, there are five parameters in
the lighting design criteria: average road surface luminance (Lave), overall
and longitudinal uniformities of road surface luminance (Uo, Ul), surround
ratio (SR), and threshold increment (TI). The purpose is to fulfil all five
parameters. However, actual street lighting cases do not always fulfil all the
parameters mainly due to cost reasons in a number of limitations, such as
in the pole spacing, pole height, and luminaire placing. The fulfilment of the
criteria is recommended to be addressed in the choice of the functional
unit. In the LCC analysis in Chapter 4.4, the functional unit was a kilometre
of street, but no lighting design criteria were included.
Conclusions and recommendations
71
The secondary aim was to analyse the previous LCAs of light sources
found in the literature and the three LCAs conducted in this work in order
to increase the knowledge on the environmental aspects of light sources.
Several findings were concluded on the basis of the LCAs. First, the use
stage dominates the life cycle impacts of light sources. This was found in all
LCAs, even though the LCAs varied in the method and in the products they
evaluated. Second, the manufacturing is typically the second most
significant stage of the life cycle. In case of a fluorescent lamp luminaire,
the average environmental impacts of manufacturing were caused by the
luminaire cover and ballast, while in an LED downlight luminaire, the
manufacturing impacts were mainly caused by the driver, LED array and
aluminium reflector and heatsink. This indicates that the driver or ballast
cannot be excluded in an LCA of a luminaire. Third, other life cycle stages,
such as transport or EoL, are practically insignificant in the total life cycle
scope. However, the EoL may cause significant share of certain
environmental impact categories, e.g., hazardous waste, even if the average
environmental impacts remained low.
In the LCAs of light sources, the dominance of the use stage depends on
the used energy source and the life of the light source. The importance of
the life cycle stages other than the use, especially the manufacturing, is
increased in case of low-emission energy production. The importance of the
manufacturing is also increased in case of a life of a lamp or luminaire
shorter than the expected life, when more light sources are needed to
provide light over the same period of time. This is especially acknowledged
in the assessment of LED light sources. The life of the LED lamps and
luminaires is based on extrapolations of measurements of part of the life, as
their life is so long that it is not practical to measure it in full. This causes
uncertainty in the life of LED light sources and further in the LCAs of LED
light sources.
The LCC point of view of the light sources was addressed in Chapter 4.1
(non-directional lamps) and 4.4 (street lighting luminaires). The reason for
the LCC aspect is the inclusion of the economic aspects in a total
sustainability assessment. A product cannot be fully sustainable if it is not
an economic solution in the scope of the total life cycle. The two LCC
analyses in this work concluded that the investment costs are notable in the
LCCs (32 % in CFL, 58 % LED lamp; 53 % LED luminaire, 27 % HPS
luminaire, 63 % induction luminaire). The LCCs of the LED lamps and
luminaires will be reduced in the future, as the luminous efficacy and life of
the luminaire are improved and the luminaire price is reduced. At the time
of installation in 2009-2010, the LED street lighting luminaires were not an
economically viable solution due to the high purchase prices of the
Conclusions and recommendations
72
luminaires, low electricity price in the municipalities, and the modest
reduction in the luminaire power compared to the preceding HPS
luminaire. The LED street lighting cases contained only 4-14 luminaires. In
case of hundreds of LED luminaires, the purchase price per luminaire will
be reduced.
Future LCA and LCC studies of light sources should aim at detailed
definition of the functional unit in lighting applications, e.g., in road and
area lighting. The functional unit shall be applicable also in LCC analysis, so
that a combined environmental and economic analysis would be possible.
More LCA of various light sources are needed to better establish the
environmental hot spots of light sources. In case of LED lamps and
luminaires, especially the electronics (driver, LED array) needs to be
analysed in various products. In addition, the heatsink is an interesting
topic for the LCA research: it affects the environmental impacts of
manufacturing and the life of the LED light source.
73
Refe
rences
References
[1] N. Stern, The economics of climate change: The Stern review, Cambridge University Press, 2006.
[2] DARA;The Climate Vulnerable Forum, “Climate vulnerability monitor 2010,” DARA, 2010.
[3] IEA & OECD, Light's Labour's Lost - Policies for Energy-efficient Lighting, Paris: IEA Publications, 2006.
[4] L. Tähkämö, M. Bazzana, P. Ravel, F. Grannec, C. Martinsons and G. Zissis, “Life cycle assessment of light-emitting diode downlight luminaire - a case study,” International Journal of Life Cycle Assessment, vol. 18, no. 5, pp. 1009-1018, 2013.
[5] L. Tähkämö, M. Bazzana, G. Zissis, M. Puolakka and L. Halonen, “Life cycle assessment of fluorescent lamp luminaire used in industry premises - a case study,” Lighting Research & Technology, 2013. DOI 10.1177/1477153513480518.
[6] L. Tähkämö, A. Ylinen, M. Puolakka and L. Halonen, “Life cycle cost analysis of three renewed street lighting installations in Finland,” International Journal of Life Cycle Assessment, vol. 17, no. 2, pp. 154-164, 2012.
[7] L. Tähkämö, G. Zissis and C. Martinsons, “Methodology study of life cycle assessment of light sources,” in 13th International Symposium on the Science and Technology of Lighting, Troy, NY, 2012.
[8] R. Carson, Silent spring, Houghton Mifflin, 1962.
[9] G. H. Brundtland, Our common future, Report of the world Commission on Environment and Development, Oxford: Oxford University Press, 1987.
[10] D. Hunkeler, “Societal life cycle assessment,” International Journal of Life Cycle Assessment, vol. 11, no. 6, pp. 371-382, 2006.
References
74
[11] T. E. Swarr, D. Hunkeler, W. Klöpffer, H.-L. Pesonen, A. Ciroth, A. C. Brent and R. Pagan, Environmental life cycle costing: a code of practice, Pensacola, FL: Society of Environmental Toxicology and Chemistry (SETAC), 2011, p. 98.
[12] T. E. Swarr, “Societal life cycle assessment - could you repeat the question?,” The International Journal of Life Cycle Assessment, vol. 14, no. 4, pp. 285-289, 2009.
[13] European Commission, “Directive 2006/95/EC,” Official Journal of the European Union, vol. L374, pp. 10-19, 2006.
[14] European Commission, “Regulation (EC) No 1907/2006,” Official Journal of the European Union, vol. L396, pp. 1-849, 2006.
[15] European Commission, “Communication from the Commission, Europe 2020, A strategy for smart, sustainable and inclusive growth,” 2010.
[16] European Commission, “Green paper, Lighting the future,” Brussels, 2011.
[17] McKinsey&Company, “Lighting the way: Perspectives on the global lighting market, second edition,” 2012.
[18] European Commission, “Directive 2009/125/EC of the European Parliament and of the Council,” Official Journal of the European Union, vol. L 285, pp. 10-35, 2009.
[19] McKinsey&Company, “Impact of the financial crisis on carbon economics - Version 2.1 of the Global Greenhouse Gas Abatement Cost Curve,” 2010.
[20] European Commission, “Commission regulation (EC) No 245/2009,” Official Journal of the European Union, vol. L 76, pp. 17-44, 2009.
[21] European Commission, “Commission regulation (EC) No 244/2009,” Official Journal of the European Union, vol. L76, pp. 3-16, 2009.
[22] European Commission, “Commission regulation (EU) No 1194/2012,” Official Journal of the European Union, vol. L342, pp. 1-22, 2012.
[23] S.-R. Lim, D. Kang, O. A. Ogunseitan and J. M. Schoenung, “Potential environmental impacts of light-emitting diodes (LEDs): Metallic resources, toxicity, and hazardous waste classification,” Environmental Science & Technology, vol. 45, no. 1, pp. 320-327, 2011.
References
75
[24] United Nations Environment Programme, “Achieving the global transition to energy efficient lighting toolkit,” UNEP, 2012.
[25] E. Tetri, J. Raunio and L. Halonen, “Lamppuopas - Opas hehkulamppujen korvaamiseksi,” (only in Finnish), 2011.
[26] Scientific Committee on Health and Environmental Risks (SCHER), “Opinion on Mercury in Certain Energy-saving Light Bulbs,” European Commission, 2010.
[27] M. J. Eckelman, P. T. Anastas and J. B. Zimmermann, “Spatial assessment of net mercury emissions from the use of fluorescent bulbs,” Environmental Science & Technology, vol. 42, no. 22, pp. 8564-8570, 2008.
[28] European Commission, “Directive 2011/65/EU,” Official Journal of the European Union, vol. L174, pp. 88-110, 2011.
[29] L. Tähkämö, M. Puolakka, L. Halonen and G. Zissis, “Comparison of Life Cycle Assessments of LED Light Sources,” Journal of Light & Visual Environment, no. 36, pp. 44-53, 2012.
[30] United States Department of Energy, “Life-Cycle Assessment of Energy and Environmental Impacts of LED Lighting Products. Part 1: Review of the Life-Cycle Energy Consumption of Incandescent, Compact Fluorescent, and LED Lamps (Updated August 2012),” 2012.
[31] European Telecommunications Standards Institute, “Environmental Engineering (EE); Life Cycle Assessment (LCA) of ICT equipment, networks and services; General methodology and common requirements,” ETSI, Sophia Antipolis, France, 2011.
[32] ISO 14040: Environmental management - Life cycle assessment - Principles and framework, 2006.
[33] ISO 14044: Environmental management - Life cycle assessment - Requirements and guidelines, 2006.
[34] W. Klöpffer, “Life-cycle based methods for sustainable product development,” International Journal of Life Cycle Assessment, vol. 8, no. 2, pp. 157-159, 2003.
[35] W. Klöpffer, “Life cycle sustainability assessment of products,” International Journal of Life Cycle Assessment, vol. 13, no. 2, pp. 89-95, 2008.
[36] United Nations Environment Programme, “Guidelines for Social Life Cycle Assessment of Products,” UNEP, 2009.
References
76
[37] S. B. Bhandari, “Discounted payback period - some extensions,” Journal of Business Behavioral Sciences, vol. 21, no. 1, pp. 28-38, 2009.
[38] Finnish Road Administration, “Tievalaistuksen suunnittelu - Suunnitteluvaiheen ohjaus,” (only in Finnish), Edita Prima Oy, Helsinki, 2006.
[39] S. K. Fuller and S. R. Petersen, Life-Cycle Costing Manual fo the Federal Energy Management Program, Washington, DC: National Institute of Standards and Technology, 1995.
[40] A. Gydesen and D. Maimann, “Life cycle analyses of integral compact fluorescent lamps versus incandescent lamps,” in Proceedings of the 1st European Conference on Enegy-Efficient Lighting, Stockholm, Sweden, 1991.
[41] R. P. Pfeifer, “Comparison between filament lamps and compact fluorescent lamps,” International Journal of Life Cycle Assessment, vol. 1, pp. 8-16, 1996.
[42] D. Parsons, “The environmental impact of compact fluorescent lamps and incandescent lamps for Australian conditions,” The Environmental Engineer, vol. 7, no. 2, pp. 8-14, 2006.
[43] Bio Intelligence Service (BIOIS), “Study on environmental effects related to the life cycle of products and services,” European Commission, 2003.
[44] United States Department of Energy, “Life-Cycle Assessment of Energy and Environmental Impacts of LED Lighting Products. Part 2: LED Manufacturing and Performance,” 2012.
[45] Osram Opto Semiconductors GmbH, “Life cycle assessment of illuminants - A comparison of light bulbs, compact fluorescent lamps and LED lamps,” 2009.
[46] I. Quirk, “Life-Cycle Assessment and Policy Implications of Energy Efficient Lighting Technologies,” 2009.
[47] Department for Environment, Food and Rural Affairs, “Life cycle assessment of ultra-efficient lamps,” DEFRA, 2009.
[48] A. T. Dale, M. M. Bilec, J. Marriott, D. Hartley, C. Jurgens and E. Zatcoff, “Preliminary Comparative Life-Cycle Impacts of Streelight Technology,” Journal of Infrastructure Systems, pp. 193-199, 2011.
[49] VITO, Bio Intelligence Service, Energy Piano, Kreios, “Lot 19: Domestic lighting, Final report,” 2009.
References
77
[50] European Lamp Companies (ELC), “Material composition,” 2010. [Online]. Available: http://www.elcfed.org/2_lighting_composition.html. [Accessed: 20 Feb 2012].
[51] E. Elijošiutė, J. Balciukevičiūtė and G. Denafas, “Life cycle assessment of compact fluorescent and incandescent lamps: comparative analysis,” Environmental Research, Engineering and Management, vol. 61, no. 3, pp. 65-72, 2012.
[52] A. E. Landis, M. M. Bilec and N. Rajagopalan, “Life cycle assessment for evaluating green products and materials,” in Proceedings of US-Japan Workshop on LCA of Sustainable Intrastructure Materials, Sapporo, Japan, 2009.
[53] T. Welz, R. Hischier and L. M. Hilty, “Environmental impacts of lighting technologies - Life cycle assessment and sensitivity analysis,” Environmental Impact Assessment Review, no. 31, pp. 334-343, 2011.
[54] R. Michaud and C. Belley, “Analyse du cycle de vie comparative d'ampoules électriques: incandescentes et fluorescentes compactes,” Centre interuniversitaire de recherche sur le cycle de vie des produits, procédés et services (CIRAIG), Montréal, 2008.
[55] L. Ramroth, “Comparison of Life-cycle analyses of compact fluorescent and incandescent lamps based on rated life of compact fluorescent lamp,” Rocky Mountain Institute, 2008.
[56] C. T. Hendrickson, D. H. Matthews, M. Ashe, P. Jaramillo and F. C. McMichael, “Reducing environmental burdens of sold-state lighting through end-of-life design,” Environmental Research Letters, no. 5, 2010. DOI: 10.1088/1748-9326/5/1/014016.
[57] California Department of Toxic Substances Control, “SB20 Report: Determination of regulated elements in discarded laptop computers, LCD monitors, Plasma TVs and LDC TVs,” 2004.
[58] S.-R. Lim, D. Kang, O. A. Ogunseitan and J. M. Schoenung, “Potential environmental impacts from the metals in incandescent, compact fluorescent lamp (CFL), and light-emitting diode (LED) bulbs,” Environmental Science & Technology, vol. 47, pp. 1040-1047, 2013.
[59] United States Environmental Protection Agency, “Method 1311: Toxicity characteristics leaching procedure,” 1992.
[60] United States Department of Energy, “Life-cycle assessment of energy and environmental impacts of LED lighting products. Part 3: LED environmental testing,” 2013.
References
78
[61] California State Regulations, §66260.202 Restrictions on the Use of Heavy Metals in Covered Electronic Devices, 2006.
[62] M. Dubberley, A. M. Agogino and A. Horvath, “Life-cycle assessment of an intelligent lighting system using a distributed wireless mote network,” in IEEE Int Symp Electron and Environ, Scottsdale, Arizona, 2004.
[63] P. Neri, P. Buttol, G. Danielli, R. Pareschi and G. Tani, “Life cycle assessment of an emergency lamp manufactured by the firm Beghelli,” College of Engineering, Northeastern University, 2000.
[64] K.-a. Techato, D. J. Watts and S. Chaiprapat, “Life cycle analysis of retrofitting with high energy efficiency air-conditioner and fluorescent lamp in existing buildings,” Energy Policy, vol. 37, pp. 318-325, 2009.
[65] J. Valkama and M. Keskinen, “Comparison of simplified LCA variations for three LCA cases of electronic products from the ecodesign point of view,” in IEEE Int Symp Electron and Environ, San Francisco, 2008.
[66] S. N. S. Bakri, R. K. Ramasamy and S. Surif, “Life cycle assessment of magnetic and electronic ballast for 36-W fluorescent lamp,” International Journal of Life Cycle Assessment, no. 15, pp. 837-841, 2010.
[67] A. Slocum, “A Technology Assessment of Light Emitting Diode (LED) Solid State Lighting for General Illumination,” National Center for Environmental Economics (NCEE), Washington, DC, 2005.
[68] N. Yabumoto, A. Hatta, M. Jinno and H. Hattori, “Life cycle assessment of LED lamps and CFLs as the ideal light source for "sustainable development",” in Proceedings of the 12th International Symposium on the Science and Technology of Light Sources and the 3rd White LED Conference, 2010.
[69] N. Unger, F. Schneider and S. Salhofer, “A review of ecodesign and environmental assessment tools and their appropriateness for electrical and electronic equipment,” Progress in Industrial Ecology, An International Journal, vol. 5, no. 1-2, pp. 13-29, 2008.
[70] N. Unger, “Environmental assessment of electrical and electronic equipment - The use of appropriate tools and aspects of the life cycle approach,” Doctoral dissertation, Universität für Bodenkultur, Wien, 2008.
References
79
[71] K. Schischke and H. Griese, “Is small green? Life cycle aspects of technology trends in microelectronics and microsystems,” in LCA/LCM Conference, 2004.
[72] S. B. Boyd, Life-Cycle Assessment of Semiconductors, Springer, 2012, p. 226.
[73] E. D. Williams, R. U. Ayres and M. Heller, “The 1.7 kilogram microchip: Energy and material use in the production of semiconductor devices,” Environmental Science & Technology, vol. 36, no. 24, pp. 5504-5510, 2002.
[74] Eurostat, “Electricity prices by type of user,” European Commission, 2013.
[75] NF P01-010 Environmental quality of construction products - environmental and health declaration of construction products, 2004.
[76] Ecoinvent, database version 2.2, 2010.
[77] SimaPro LCA Software, Pré Consultants, 2012.
[78] European Commission (EC), Joint Research Center (JRC), European Reference Life Cycle Database (ELCD), version 2.0., 2008.
[79] V. Sippola, “Eco-design -direktiivin täytäntöönpanotoimenpiteiden vuoksi poistuvien lamppujen korvaaminen ulkovalaistuksessa” (“Replacement of lamps in outdoor lighting due to the implementing measures of the ecodesign -directive”), (only in Finnish), M.S. Thesis, Dept. Electr., Aalto Univ., Espoo, Finland, 2010, p. 85.
[80] M. Puolakka, A. Rantakallio, L. Tähkämö, J. Viitanen, A. Ylinen and L. Halonen, “LEDit ja aurinkosähkö - Energiatehokas ja kestävä valaistus,” (only in Finnish), Aalto University, Helsinki, 2012.
[81] EN 13201-2. Road lighting. Part 2: Performance requirements, European Committee for Standardization, 2003.
[82] EN 13201-3. Road lighting. Part 3: Calculation of performance, European Committee for Standardization, 2003.
[83] EN 13201-4. Road lighting. Part 4: Methods of measuring lighting performance, European Committee for Standardization, 2003.
[84] Technical report No 13201-1. Road lighting. Part 1: Selection of lighting classes, European committee for Standardization, 2004.
References
80
[85] United States Department of Energy, “Solid-state lighting research and development: Multi-year program plan, March 2010,” United States Department of Energy, 2010.
[86] United States Department of Energy, “Solid-state lighting research and development: Multi-year program plan, April 2012,” United States Department of Energy, 2012.
[87] M. Puolakka, A. Rantakallio, L. Tähkämö, A. Ylinen and L. Halonen, “Toimintamalli - Elohopealampuista energiatehokkaampaan ulkovalaistukseen,” (only in Finnish), Aalto University, 2011.
[88] United States Department of Energy, “Solid-state lighting research and development: Multi-year program plan, April 2013,” United States Department of Energy, 2013.
[89] J. Y. Tsao, H. D. Saunders, J. R. Creighton, M. E. Coltrin and J. A. Simmons, “Solid-state lighting: an energy-economics perspective,” Journal of Physics D: Applied Physics, vol. 43, no. 35, p. 354001, 2010.
[90] H. D. Saunders and J. Y. Tsao, “Rebound effects for lighting,” Energy Policy, vol. 49, pp. 477-478, 2012.
[91] Association Française de l'Eclairage (AFE), “Les nuisances dues à la lumière,” 2006.
81
App
end
ix I: R
ésum
é e
n fra
nçais
Appendix I: Résumé en français
1 Introduction
Il est nécessaire d’agir immédiatement et efficacement pour réduire la
consommation d’énergie et les émissions de gaz à effet de serre. Le domaine
de l’éclairage est un gros consommateur mondial d’électricité (19 %
d’énergie électrique [3]*). Les mesures pour réduire la consommation
d’énergie de l’éclairage sont efficaces et appropriées [18, 19]. Cependant,
certains aspects environnementaux des sources lumineuses sont disputés,
tels que le contenu matériel et la fin de vie.
Les impacts environnementaux d’un produit ou d’un service sont évalués
par une analyse du cycle de vie (ACV). L’analyse du cycle de vie est
normalisée à un niveau général dans les normes ISO 14040 [32] et ISO
14044 [33]. Le problème de recherche de la thèse est l’absence de règles
établies pour la conduite de l’ACV des sources lumineuses. L’absence de ces
règles rend difficile d’évaluer systématiquement la performance
environnementale des sources lumineuses.
L’objectif principal de la thèse est d’établir un modèle pour effectuer une
ACV des sources lumineuses. Le modèle est nécessaire pour
systématiquement et simplement évaluer les impacts environnementaux
des sources lumineuses, surtout parce que ces dernières connaissent
actuellement des changements en raison des mesures législatives et
volontaires qui ont été prises. Les sources lumineuses sont en train de
changer. Les sources lumineuses conventionnelles, telles que les lampes à
incandescence ou les lampes à mercure haute pression sont remplacées par
des sources lumineuses modernes à haute efficacité énergétique, telles que
les lampes et luminaires à LED. La méthode d’ACV devrait par conséquent
être simplifiée en considérant tous les aspects environnementaux.
Le modèle est développé sur la base de quatre études de cas d’analyses
environnementales et/ou économiques des sources lumineuses réalisées
dans le cadre de la thèse: deux ACVs d’un luminaire encastré à LED et d’un
luminaire à lampe à fluorescence, une analyse combinant à la fois l’ACV et
l’analyse de coût du cycle de vie (CCV) des lampes non-dirigées, et une
analyse de CCV des luminaires d’éclairage public. Trois des études de cas
*) Numéros de référence se réfèrent à références respectives originales dans la thèse en anglais.
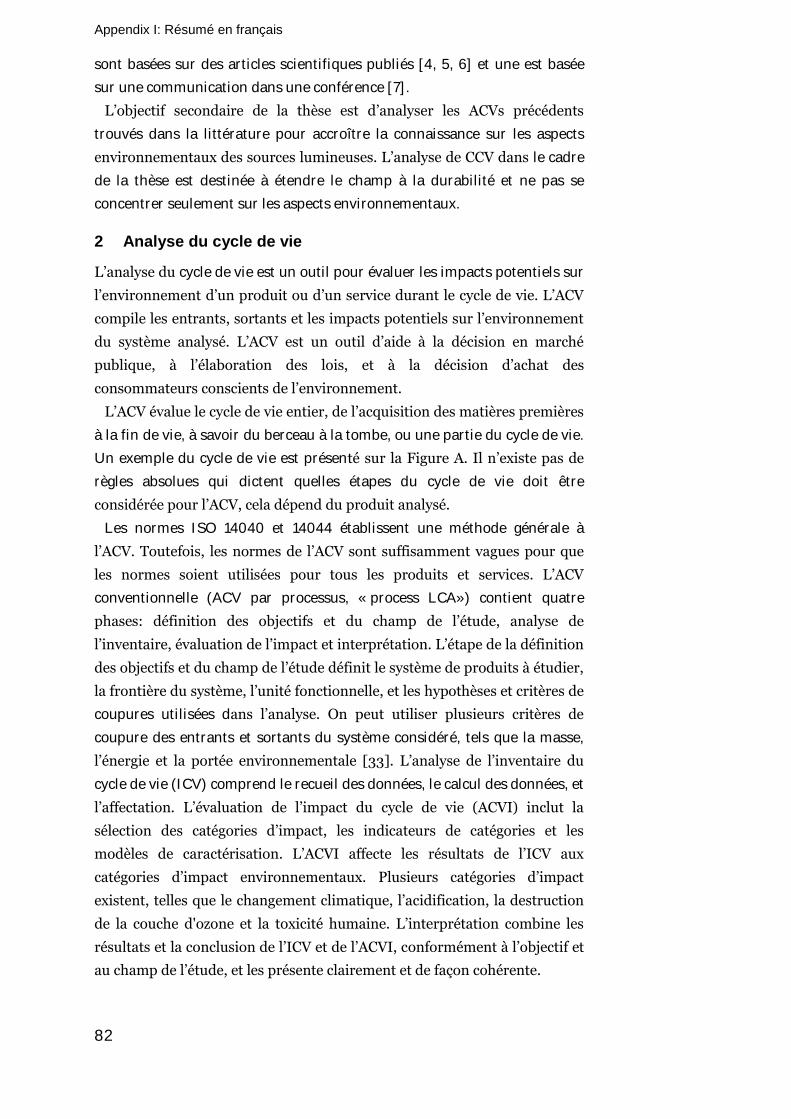
Appendix I: Résumé en français
82
sont basées sur des articles scientifiques publiés [4, 5, 6] et une est basée
sur une communication dans une conférence [7].
L’objectif secondaire de la thèse est d’analyser les ACVs précédents
trouvés dans la littérature pour accroître la connaissance sur les aspects
environnementaux des sources lumineuses. L’analyse de CCV dans le cadre
de la thèse est destinée à étendre le champ à la durabilité et ne pas se
concentrer seulement sur les aspects environnementaux.
2 Analyse du cycle de vie
L’analyse du cycle de vie est un outil pour évaluer les impacts potentiels sur
l’environnement d’un produit ou d’un service durant le cycle de vie. L’ACV
compile les entrants, sortants et les impacts potentiels sur l’environnement
du système analysé. L’ACV est un outil d’aide à la décision en marché
publique, à l’élaboration des lois, et à la décision d’achat des
consommateurs conscients de l’environnement.
L’ACV évalue le cycle de vie entier, de l’acquisition des matières premières
à la fin de vie, à savoir du berceau à la tombe, ou une partie du cycle de vie.
Un exemple du cycle de vie est présenté sur la Figure A. Il n’existe pas de
règles absolues qui dictent quelles étapes du cycle de vie doit être
considérée pour l’ACV, cela dépend du produit analysé.
Les normes ISO 14040 et 14044 établissent une méthode générale à
l’ACV. Toutefois, les normes de l’ACV sont suffisamment vagues pour que
les normes soient utilisées pour tous les produits et services. L’ACV
conventionnelle (ACV par processus, « process LCA») contient quatre
phases: définition des objectifs et du champ de l’étude, analyse de
l’inventaire, évaluation de l’impact et interprétation. L’étape de la définition
des objectifs et du champ de l’étude définit le système de produits à étudier,
la frontière du système, l’unité fonctionnelle, et les hypothèses et critères de
coupures utilisées dans l’analyse. On peut utiliser plusieurs critères de
coupure des entrants et sortants du système considéré, tels que la masse,
l’énergie et la portée environnementale [33]. L’analyse de l’inventaire du
cycle de vie (ICV) comprend le recueil des données, le calcul des données, et
l’affectation. L’évaluation de l’impact du cycle de vie (ACVI) inclut la
sélection des catégories d’impact, les indicateurs de catégories et les
modèles de caractérisation. L’ACVI affecte les résultats de l’ICV aux
catégories d’impact environnementaux. Plusieurs catégories d’impact
existent, telles que le changement climatique, l’acidification, la destruction
de la couche d'ozone et la toxicité humaine. L’interprétation combine les
résultats et la conclusion de l’ICV et de l’ACVI, conformément à l’objectif et
au champ de l’étude, et les présente clairement et de façon cohérente.
Appendix I: Résumé en français
83
L’ACV est une approche relative en raison de l’unité fonctionnelle. L’unité
fonctionnelle fournit une référence par rapport à laquelle l’ACV est
quantifiée et normalisée. L’unité fonctionnelle est un paramètre clé à l’ACV,
surtout à l’ACV comparative où on compare plusieurs produits. Il est
important que l’unité fonctionnelle soit cohérente avec les objectifs et le
champ de l’étude, clairement définie et mesurable [33].
Figure A. Exemple des étapes du cycle de vie.
2.1 Coût de cycle de vie
Il y a plusieurs méthodes pour calculer les CCVs cela dépend du champ
d’étude choisi. La valeur actuelle et la période de récupération sont les
indices les plus complets de critères financiers du budget de décision [37].
L’analyse du CCV de l’éclairage public inclut ces deux indices.
Il est recommandé d’inclure la valeur temps de l’argent si la période de
calcul dépasse deux ans [11]. Dans le domaine de l’éclairage, la valeur temps
de l’argent peut être ignorée en cas de vie courte de la source lumineuse,
comme la lampe à incandescence. Au contraire, en cas d’éclairage public, la
période de calcul est longue, typiquement 30 ans, et il est donc nécessaire
de considérer la valeur temps de l’argent.
3 Examen des analyses de cycle de vie précédentes
Plusieurs ACVs de lampes et luminaires ont été réalisées au cours de deux
dernières décennies. Typiquement elles sont réalisées en comparant les
lampes à incandescence avec les fluocompactes, mais également avec les
autres sources lumineuses, en particulier les sources lumineuses à LED [30,
Appendix I: Résumé en français
84
40-48, 51-55]. De nombreuses différences ont été identifiées dans les ACVs
précédentes. Il s’est avéré impossible, dans un premier temps, de créer un
modèle uniforme de consommation de l’énergie pour la fabrication, de part
des données variées, notamment pour les lampes à incandescence, lampes
fluocompactes et lampes à LED. De plus, le contenu matériel des lampes à
incandescence, fluocompactes et à LED était différent entre les ACVs et les
autres références. En second temps, un modèle uniforme pour le contenu
matériel n’a pas été trouvé. Troisième point, les ACVs utilisaient les unités
fonctionnelles différentes: megalumen heures, une heure, une lampe. En
outre, les impacts environnementaux variaient, alors qu’il y a un nombre
des catégories d’impacts environnementaux potentiels à choisir.
Malgré les différences dans les méthodes de l’ACV, les ACVs des sources
lumineuses ont généralement abouti à des résultats similaires: l’utilisation
est majoritairement responsable des impacts environnementaux en raison
de la consommation d’énergie. Les autres étapes du cycle de vie, telles que
l’acquisition des matières premières, la fabrication et la fin de vie, ne
causent que des impacts mineurs. L’efficacité lumineuse de la source de
lumière détermine donc, pour la plupart, la performance
environnementale. Il a été constaté que les lampes et luminaires à haute
efficacités lumineuses, tels que lampes à fluorescence, lampes et luminaires
à LED, et luminaire à lampe à induction, sont les sources lumineuses les
plus favorables à l’environnement.
Les ACVs des sources lumineuses utilisent de nombreuses unités
fonctionnelles, typiquement le lumen heure, ou le flux lumineux pendant
quelques heures, par exemple 500 ou 900 lm pendant 10 000 h. Dans ce
dernier cas l’unité fonctionnelle n’est pas équivalente (500 lm comparés à
900 lm). L’unité fonctionnelle devrait être clairement définie [33]. Ceci
n’est pas respecté dans trois des ACVs [42, 45, 54], où les unités
fonctionnelles sont respectivement 345-420 lm pendant 25 000 h, 500-900
lm pendant 10 000 h, et une quantité de lumière équivalente pendant
8 000 h (supposé comme flux lumineux équivalent).
Les sources lumineuses comportent souvent des pièces électroniques. Il y
a eu beaucoup de discussions concernant l’ACV pour déterminer s’il s’agit
d’une méthode appropriée pour l’évaluation des impacts environnementaux
du détail des équipements électroniques [69, 70]. Il est difficile de réaliser
l’ACV des produits électroniques à cause de la complexité des produits, de
l’absence de données spécifiques, des écarts de données dans l’ACVI, et des
changements dans le mode d’utilisation [69, 71]. Pourtant, il est possible
d’utiliser l’ACV pour identifier les points environnementaux majeurs du
cycle de vie [69].
Appendix I: Résumé en français
85
4 Etude de méthodologie de l’analyse du cycle de vie des sources lumineuses
Quatre études de cas sont présentées: une analyse simplifiée de l’ACV et
CCV des sources lumineuses utilisées par les ménages, une ACV d’un
luminaire encastré à LED, une ACV d’un luminaire à lampe à fluorescence,
et une analyse de CCV des luminaires d’éclairage public. Les cas
représentent les applications communes et ils varient sur les méthodes
d’évaluation, l’application de l’éclairage et le critère d’éclairage.
4.1 Etude de cas des lampes non-dirigées utilisées par le ménages
Les impacts environnementaux et les CCVs des lampes non-dirigées sont
étudiés en considérant la fabrication et l’utilisation. Les coûts de la
fabrication sont modélisés sur la base du prix d’achat qui est estimé pour
correspondre aux coûts de la fabrication. Les coûts d’exploitation sont
calculés sur la base de prix d’électricité (0.10 €/kWh). Les coûts sont
calculés du point de vue du consommateur qui achète, remplace et utilise la
lampe. L’impact de la source d’énergie est éliminé en utilisant l’énergie
primaire de fabrication des lampes [30] et d’utilisation.
L’idée de cette étude de cas est de modifier les courbes de répartition de
l’intensité lumineuse et le flux lumineux des lampes. L’étude compare trois
types de lampes: lampe à incandescence de 60 W (750 lm), lampe
fluocompacte de 13 W et de trois formes (spirale, tubulaire, enveloppée)
(750 lm), et lampe à LED de 13 W (800 lm). Les courbes de la répartition de
l’intensité lumineuse de la lampe à incandescence et des lampes
fluocompactes ont été mesurées à Aalto University Lighting Unit, alors que
les courbes pour la lampe à LED sont obtenues par le fabricant.
Quatre unités fonctionnelles sont utilisées: a) une lampe, b) un
megalumen-heure, c) une heure, et d) l’éclairement lumineux direct à une
distance d’une mètre sur une surface de 1 m2 par heure. Toutes les unités
fonctionnelles excluent le luminaire afin de simplifier l’étude.
Résultats
Les résultats montrent que, dans la comparaison de lampes, c’est la lampe à
LED qui cause les coûts et la consommation d’énergie les plus hautes
principalement à cause de sa longue durée de vie. De plus, le prix d’achat et
la consommation d’énergie de fabrication de lampe à LED sont élevés. Dans
la comparaison sur une heure, la lampe à incandescence cause clairement
les coûts et la consommation d’énergie les plus hautes. Il semble que les
résultats de la comparaison basée sur le lumen heure soient similaires aux
résultats obtenus pour des comparaisons basées sur une heure ou
l’éclairement lumineux.
Appendix I: Résumé en français
86
Le choix de l’unité fonctionnelle affecte les résultats de l’analyse.
Pourtant, il n’existe pas de différences significatives dans les résultats si
l’unité fonctionnelle est une heure, le lumen heure ou l’éclairement à une
distance d’une mètre sur une surface de 1 m2. Il a été constaté que l’énergie
primaire de la fabrication était plutôt insignifiante. Au contraire, le coût de
la fabrication (modelé comme prix d’achat) représente une part notable de
CCVs dans le cas de la lampe fluocompacte (approximativement 32 %) et de
la lampe à LED (58 %).
4.2 Etude de cas du luminaire encastré à LED
Le luminaire en question est un luminaire encastré à LED de 19 W avec un
driver et un diffuseur au phosphore déporté. C’est un luminaire appliqué
dans des bâtiments de commerce et peut servir pour remplacer un
luminaire encastré à lampe fluocompacte. L’unité fonctionnelle est la
production de flux lumineux de 1140 lm pendant une durée de 50 000
heures, équivalent avec 57 Mlmh. L’ACV a été réalisée selon des normes
ISO 14040 [32], ISO 14044 [33] et norme française NF P01-010 [75].
L’analyse couvre la fabrication, le transport, l’installation, l’utilisation et la
fin de vie. L’ACV inclue tous les entrants sur lesquels il était possible
d’obtenir des données. Une règle de coupure a été utilisée et permet
d’ignorer les entrants dont la somme totale était inférieure à 2 % de la
masse du total de tous les entrants s’il n’y avait pas l’ICV disponible [75].
SimaPro [77] a été utilisé comme logiciel et Ecoinvent [76] et European
Reference Life Cycle Database (ELCD) [78] comme bases de données.
Pour étudier largement les impacts environnementaux potentiels, seize
catégories d’impact ont été choisis dans l’ACV du luminaire à LED: l’énergie
(primaire, renouvelable, non-renouvelable), l’épuisement de ressources, la
consommation d'eau, les déchets (dangereux, non-dangereux, inertes,
radioactifs), le changement climatique, l’acidification atmosphérique, la
pollution de l'air et de l'eau, la destruction de la couche d'ozone, la
formation d'ozone photochimique, et l’eutrophisation.
Le scénario de base de l’ACV incluait la durée de vie du luminaire de
50 000 h, le moyen de production d’électricité française, et le scénario
actuel de fin de vie (95 % de mise en décharge, 5 % de retraitement pour
recyclage). En plus du scénario de base, l’ACV contenait plusieurs scénarii
pour effectuer l’analyse de sensibilité de la durée de vie du luminaire
(15 000 h, 36 000 h, 50 000 h), les moyens de production d’électricité à
l’étape de l’utilisation (moyen européen, moyen français), et le scénario de
fin de vie (actuel; prospectif 40 % de mise en décharge, 60 % de
retraitement pour recyclage).
Appendix I: Résumé en français
87
Résultats
C’est la consommation d’énergie durant la phase d’utilisation qui
prédomine sur les impacts environnementaux du luminaire à LED comme
prévu. Cependant, les impacts étaient affectés par la durée de vie du
luminaire et les moyens de production électrique pendant l’utilisation.
Quand on modélise les moyens de production électrique française, la
fabrication représente environ 23 % et l’utilisation 76 % des impacts
environnementaux totaux moyens. Quand on modélise les moyens de
production électrique européenne, les impacts sont divisés entre la
fabrication (7 %) et l’utilisation (93%). Dans les deux cas de moyens de
production électriques, les autres étapes du cycle de vie, telles que les
transports, l’installation et la fin de vie, sont insignifiants (moins de 1 %
moyen) dans le cadre du cycle de vie entier. Pourtant, la fin de vie causait
28 % des impacts en catégorie de déchets dangereux quand l’utilisation a
été modélisée pour l’électricité française.
Les impacts environnementaux de la fabrication du luminaire encastré à
LED sont principalement causés (plus de 80 % dans chaque catégorie) par
le driver (40 % moyen), le porte LED (28 % en moyenne) et les pièces en
aluminium (échangeur thermique et réflecteur) (24 % en moyenne). Le
porte LED (les LEDs, l’aluminium, le joint thermique en silicone) est
responsable d’environ 6 % ou 2 % des impacts environnementaux moyens
du cycle de vie entier en utilisant respectivement les différents moyen de
production électrique français ou européen.
La consommation d’énergie pendant l’utilisation prédomine sur les
impacts environnementaux en cas de durée de vie du luminaire de 50 000
h. La fin de vie était pratiquement insignifiante dans le cadre du cycle de vie
entier, alors que la durée de vie du luminaire affectait notablement les
impacts environnementaux. La fabrication prend en compte d’une part
notable de deux catégories: les déchets dangereux (38 %) et les déchets
non-dangereux (78 %). La fin de vie représentait 28 % de déchets
dangereux. Ainsi, si l’utilisation est l’étape dominante du cycle de vie, alors
elle dépend de la catégorie d’impact en question.
4.3 Etude de cas du luminaire à lampe à fluorescence
L’ACV d’un luminaire à lampe à fluorescence pour les applications
industrielles a été réalisée en 2011-2012 [5]. Cette analyse évalue un
luminaire à lampe à fluorescence équipé avec deux lampes à fluorescence
linéaire de diamètre de 16 mm, un ballast électronique, et un réflecteur
métallique. Le luminaire accommodait deux lampes de puissance de 49 W
qui produisent ensemble un flux lumineux de 8600 lm selon le fabricant du
luminaire. L’unité fonctionnelle est l’utilisation du luminaire pendant 20
Appendix I: Résumé en français
88
ans 4000 heures par ans, ce qui correspondait à 688 Mlmh. Le luminaire
consommait 104 W au total. La durée de vie de la lampe à fluorescence était
estimé à 20 000 h et pour le ballast à 50 000 h.
L’ACV incluait la fabrication, le transport, l’utilisation et la fin de vie du
luminaire. L’ACV a été conduit en accordance avec les normes ISO 14040
[32] et ISO 14044 [33] et la spécification pour les produits de technologies
de l’information et de la communication [31]. Toutes les étapes du cycle de
vie identifiées comme obligatoires selon la spécification [31] sont inclues
dans l’ACV. Cette ACV utilisait Ecoinvent [76] et ELCD [78] comme bases
de données et SimaPro [77] comme logiciel. Les impacts environnementaux
sont largement pris en considération dans douze catégories d’impact:
l’épuisement de ressources, l’acidification, l’eutrophisation, le changement
climatique, la formation d'ozone photochimique, la destruction de la couche
d'ozone, l’écotoxicités (terrestre; aquatique d’eau douce, marine ; des
sédiments d’eau douce, marine), et la toxicité humaine.
L’ACV a été modélisée utilisant le moyen de production électrique
finlandaise. De plus, l’impact du moyen de production électrique a été
analysé par l’utilisation d’électricité de tourbe nordique et hydro-électricité
finlandaise.
Résultats
Les impacts environnementaux du luminaire à lampe à fluorescence sont
divisés entre fabrication (7 %) et utilisation (93 %) en cas du moyen de
production d’électricité finlandaise. Les autres étapes du cycle de vie,
(transport, fin de vie) tenait compte moins de 1 % en moyenne. Les impacts
de la fabrication sont divisés entre le luminaire (46 %), ballast (43 %) et
lampes (11 %) en moyenne. Pourtant, il doit être noté que les lampes à
fluorescences causent une part notable de la catégorie d’écotoxicité
terrestre (70 %).
L’étude de cas a indiqué que les résultats de l’ACV du luminaire à lampe à
fluorescence sont affectés par le moyen de production électrique utilisée
pendant le fonctionnement. Les impacts relatifs des autres étapes du cycle
de vie, notablement la fabrication, seraient augmentés quand la production
d’énergie changerait vers la production d’électricité à faible taux d’émission.
Comme prévu dans la comparaison de trois productions d’électricité
(finlandaise moyenne, tourbe nordique, hydro-électricité finlandaise), le cas
de l’hydro-électricité causait les impacts environnementaux les plus bas
dans tous les catégories d’impact.
4.4 Etude de cas des luminaires à l’éclairage public
L’analyse de CCV des luminaires d’éclairage public contenait dix cas où les
luminaires sont rénovés en Finlande. Les cas A, B et C sont présentés dans
Appendix I: Résumé en français
89
l’article par Tähkämö et al. [6]. Les cas supplémentaires de D à J sont
réalisés dans la thèse. Les cas sont situées dans la sud de la Finlande dans la
municipalité de Kotka (cas A et B), Kerava (cas C) et Espoo (cas de D à J).
Les CCVs sont calculées du point de vue de l’utilisateur, des municipalités.
L’unité fonctionnelle est un kilomètre d’une route illuminée.
L’analyse de CCV compare les coûts: coûts d’investissement, coûts
d’exploitation et la valeur résiduelle. Les coûts d’investissement
contiennent le prix du luminaire et l’installation. Les coûts d’exploitation
incluent les coûts d’électricité et les remplacements des lampes et
luminaires. La valeur résiduelle exprime le coût ou le profit
d’investissement après le temps de fonctionnement. Alors que le temps de
fonctionnement est long dans le cas de l’éclairage public, typiquement 30
ans, la valeur résiduelle reste basse.
Dans les dix cas, les luminaires installés sont de trois technologies:
luminaire à lampe à sodium haute pression, luminaire à LED, et luminaire
à lampe à induction. Les luminaires précédents étaient équipés soit de
lampes à mercure haute pression soit d’anciennes lampes à sodium haute
pression.
Le développement de la technologie LED est pris en compte dans l’analyse
de CCV. On estime une amélioration de 75 % par le développement de
l’efficacité lumineuse, et une réduction de 85 % sur le prix d’achat du
luminaire au moment du remplacement.
Résultats
Les coûts d’investissement des cas LED (C à H) étaient nettement plus
hauts (23 170 – 34 630 €/km) que ceux des cas de lampes à sodium haute
pression (7 380 – 9 160 €/km) et similaires à ceux des lampes à induction
(25 710 €/km).
Les périodes de récupération n’étaient pas viables dans la plupart de cas
(plus de 30 ans). Les luminaires à LED n’étaient pas des solutions
profitables dans les installations à faible quantité de luminaires (4 à 14
luminaires dans une installation). La rentabilité des luminaires à LED sera
accrue quand les installations deviendront plus larges en réduisant le prix
d’achat d’un luminaire. La rentabilité sera augmentée également en
utilisant l’espacement optimisé entre les pôles et en exploitant les
possibilités des optiques du luminaire à LED.
L’analyse de CCV montait que les coûts d’énergie et d’investissement
causent la majorité des CCVs. Dans les cas de l’installation de luminaire à
lampe à sodium haute pression, les coûts sont divisés entre les coûts
d’investissement (27 %), les coûts d’énergie (60 %), les coûts de maintien
(11 %) et la valeur résiduelle (3 %). Dans les cas de l’installation de
luminaire à LED, les coûts sont divisés entre les coûts d’investissement (53
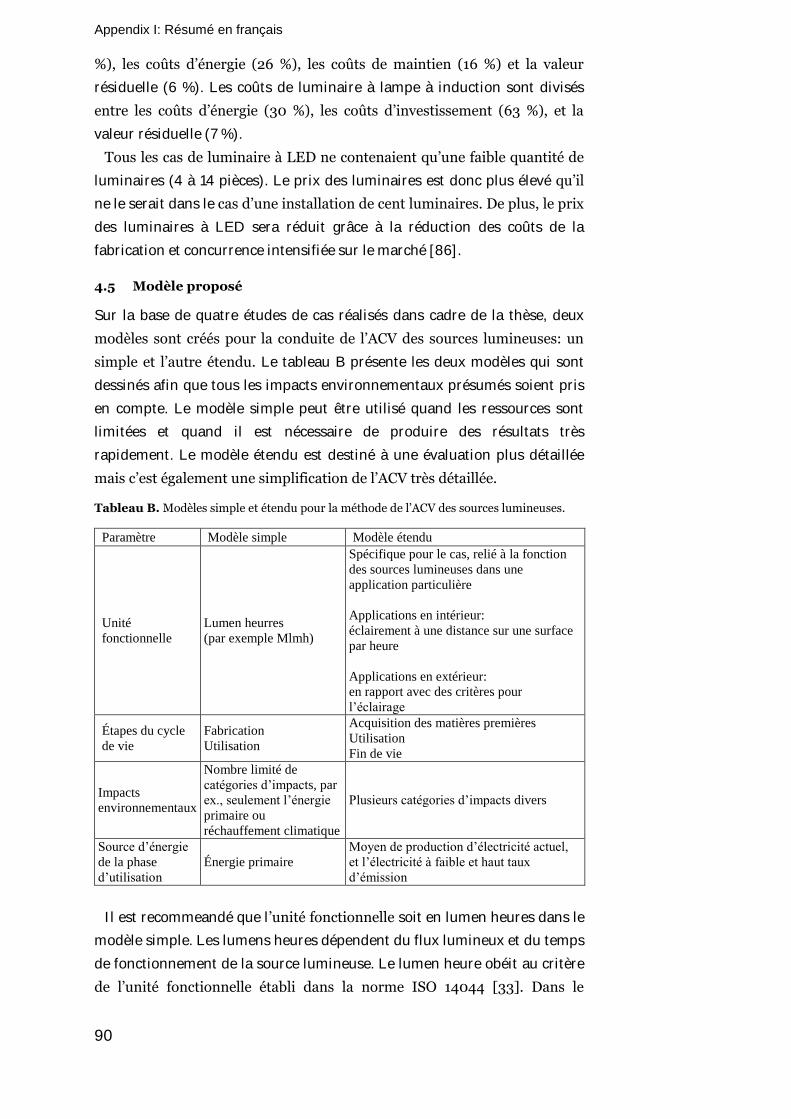
Appendix I: Résumé en français
90
%), les coûts d’énergie (26 %), les coûts de maintien (16 %) et la valeur
résiduelle (6 %). Les coûts de luminaire à lampe à induction sont divisés
entre les coûts d’énergie (30 %), les coûts d’investissement (63 %), et la
valeur résiduelle (7 %).
Tous les cas de luminaire à LED ne contenaient qu’une faible quantité de
luminaires (4 à 14 pièces). Le prix des luminaires est donc plus élevé qu’il
ne le serait dans le cas d’une installation de cent luminaires. De plus, le prix
des luminaires à LED sera réduit grâce à la réduction des coûts de la
fabrication et concurrence intensifiée sur le marché [86].
4.5 Modèle proposé
Sur la base de quatre études de cas réalisés dans cadre de la thèse, deux
modèles sont créés pour la conduite de l’ACV des sources lumineuses: un
simple et l’autre étendu. Le tableau B présente les deux modèles qui sont
dessinés afin que tous les impacts environnementaux présumés soient pris
en compte. Le modèle simple peut être utilisé quand les ressources sont
limitées et quand il est nécessaire de produire des résultats très
rapidement. Le modèle étendu est destiné à une évaluation plus détaillée
mais c’est également une simplification de l’ACV très détaillée.
Tableau B. Modèles simple et étendu pour la méthode de l’ACV des sources lumineuses.
Paramètre Modèle simple Modèle étendu
Unité
fonctionnelle
Lumen heurres
(par exemple Mlmh)
Spécifique pour le cas, relié à la fonction
des sources lumineuses dans une
application particulière
Applications en intérieur:
éclairement à une distance sur une surface
par heure
Applications en extérieur:
en rapport avec des critères pour
l’éclairage
Étapes du cycle
de vie
Fabrication
Utilisation
Acquisition des matières premières
Utilisation
Fin de vie
Impacts
environnementaux
Nombre limité de
catégories d’impacts, par
ex., seulement l’énergie
primaire ou
réchauffement climatique
Plusieurs catégories d’impacts divers
Source d’énergie
de la phase
d’utilisation
Énergie primaire
Moyen de production d’électricité actuel,
et l’électricité à faible et haut taux
d’émission
Il est recommeandé que l’unité fonctionnelle soit en lumen heures dans le
modèle simple. Les lumens heures dépendent du flux lumineux et du temps
de fonctionnement de la source lumineuse. Le lumen heure obéit au critère
de l’unité fonctionnelle établi dans la norme ISO 14044 [33]. Dans le
Appendix I: Résumé en français
91
modèle étendu, l’unité fonctionnelle devra prendre l’application de
l’éclairage en compte. Par exemple, les applications en intérieur peuvent
utiliser l’unité fonctionnelle de l’éclairement direct à une distance sur une
surface par heure. La distance et la largeur de la surface devront être
spécifiées en accord avec l’application particulière. Dans les applications
extérieures, il est recommandé d’utiliser l’unité fonctionnelle qui prend le
critère pour l’éclairage en compte, alors que l’éclairage est dessiné à obéir à
des critères. Il est pourtant recommandé d’utiliser l’unité fonctionnelle
spécifique dans les ACVs comparatives. Les ACVs non-comparatives
peuvent utiliser les lumens heures comme unité fonctionnelle pour que les
résultats soient comparables aux autres ACVs des sources lumineuses. Au
moins, il est fortement recommandé d’indiquer le flux lumineux et la durée
de vie de la source lumineuse dans l’ACV de tous types (comparative ou
non-comparative).
5 Discussion
Quatre analyses d’ACV et/ou CCV des lampes et luminaires sont réalisées
dans le cadre de la thèse. De plus, les ACVs précédentes des lampes et
luminaires trouvées dans la littérature ont été analysées. L’étude montrait
qu’il y a des différences dans les méthodes de l’ACV (par exemple l’unité
fonctionnelle, les étapes du cycle de vie) et données initiales. Malgré des
différences, il a été constaté que toutes les ACVs des sources lumineuses
concluent que l’étape de l’utilisation cause la plupart des impacts
environnementaux. Par conséquent, les sources lumineuses de haute
efficacité énergétique, telles que la lampe fluocompacte et la lampe et
luminaire à LED, causent les impacts environnementaux les plus bas pour
le cycle de vie entier, comparé avec les sources lumineuses conventionnelles
telles que la lampe à incandescence. Il est probable que l’impact des autres
étapes de cycle de vie accroisse, notamment par la fabrication, étant donné
que le domaine de l’éclairage évolue vers des sources lumineuses plus
efficaces énergétiquement. En même temps, la fabrication sera analysée
plus en détail.
L’ACV du luminaire encastré à LED démontrait que l’étape de l’utilisation
représente la majorité des impacts environnementaux. La source d’énergie
détermine les résultats: si le moyen de production d’électricité française est
utilisée, les impacts environnementaux sont notablement différents
comparé aux moyens de production d’électricité européenne, quand la
méthode ACV étaient autrement le même.
Les LEDs dans l’ACV du luminaire encastré à LED étaient modélisées
comme LED de signalisation dans les données de l’ACVI trouvées dans la
base de données Ecoinvent. Le poids des LED était multiplié par cinq selon
Appendix I: Résumé en français
92
les experts pour que les impacts des LED ne soient pas sous-estimés. Même
si l’impact des LED était exagéré, il a constaté que les LEDs n’ont causé
qu’une part insignifiante des impacts environnementaux du cycle de vie
total.
Les ACVs des sources lumineuses ne prennent en compte que les impacts
de la lumière sur l’environnement. L’éclairage artificiel affecte les
organismes vivants directement et indirectement de façons multiples: par
exemple, les oiseaux souffrent de désorientation, les oiseaux et les insectes
sont attirées par la lumière ce qui rend facile leur détection par les
prédateurs, et la croissance et la floraison des plantes est affectée par la
couleur, la quantité, l’instant et la durée de la lumière [91]. Il n’y a pas une
méthode pour combiner les résultats d’une ACV conventionnelle (par
exemple la quantité de dioxyde de carbone) avec les impacts
environnementaux de la lumière.
6 Conclusions et recommandations
L’objectif primaire de la thèse était de créer un modèle d’une méthode pour
la réalisation d’ACV des sources lumineuses. La thèse a établi deux modèles
pour l’ACV des sources lumineuses sur la base des ACVs réalisées dans la
thèse et l’examen des ACVs précédentes. Les deux modèles rendent possible
la conduite rapide de l’ACV des sources lumineuses ce qui est nécessaire en
considérant le marché des sources lumineuses en perpétuelle évolution,
surtout les lampes et luminaires à LED.
L’objectif secondaire de la thèse était d’analyser les ACVs trouvées dans la
littérature et les trois ACVs présentées dans la thèse pour accroître la
connaissance sur les aspects environnementaux des sources lumineuses. De
nombreuses conclusions ont été trouvées dans les ACVs. Premièrement,
l’étape d’utilisation prédomine sur les impacts du cycle de vie des sources
lumineuses. Cela a été trouvé dans toutes les analyses même si les
méthodes variaient. Deuxièmement, la fabrication était typiquement la
deuxième étape du cycle de vie la plus impactant. Dans le cas d’un
luminaire à lampe à fluorescence, les impacts environnementaux moyens
sont causés par le luminaire (réflecteur) et le ballast. Quant au luminaire
encastré à LED, les impacts de la fabrication sont générés majoritairement
par le driver, le porte LED, le réflecteur en aluminium et l’échangeur
thermique. Cela indique que le driver ou le ballast ne peut pas été ignoré
dans une ACV du luminaire. Troisièmement, les autres étapes du cycle de
vie, telles que le transport et la fin de vie, sont pratiquement insignifiants
dans le cadre du cycle de vie entier. Pourtant, la fin de vie peut causer un
impact notable dans une certaine catégorie d’impact, par exemple les
déchets dangereux, même si les impacts moyens restent bas.
Appendix I: Résumé en français
93
Dans les ACVs des sources lumineuses, la dominance de la phase de
l’utilisation dépend de la source d’énergie utilisée et la durée de vie de la
source lumineuse. L’importance des étapes du cycle de vie autres que
l’utilisation, en particulier la fabrication, est augmentée dans le cas de la
source d’énergie ou moyen de production d’électricité à faible taux
d’émission. L’importance de la fabrication est accrue aussi dans le cas d’une
durée de vie de la lampe ou du luminaire plus courte que prévue, quand il
faut fabriquer plusieurs sources pour le même période de temps. En
particulier dans l’ACV de luminaire à LED, la durée de vie des lampes et
luminaires à LED est basée sur les extrapolations des mesures d’une partie
de la vie, comme leur durée de vie est tellement longue, il n’est pas pratique
de la mesurer en entier. Cela entraîne des incertitudes dans la durée de vie
des sources lumineuses à LED et en outre dans les ACVs des sources
lumineuses à LED.
L’analyse de CCV incluait les lampes non-dirigées et des luminaires de
l’éclairage public. L’analyse de CCV était inclue dans la thèse parce que les
aspects économiques font partie de l’évaluation de la durabilité totale. Il
n’est pas possible pour un produit d’être durable s’il ne constitue pas une
solution économique pendant le cycle de vie. Les deux analyses de CCV ont
conclu que les coûts d’investissement sont notables (32 % lampe
fluocompacte, 58 % lampe à LED; 53 % luminaire à LED, 27 % luminaire à
lampe à sodium haute pression, 63 % luminaire à lampe à induction). Les
coûts du cycle de vie des lampes et luminaires à LED sera réduits à l’avenir,
comme l’efficacité lumineuse et la durée de vie sont améliorées et le prix du
luminaire sera réduit.
Les études de l’ACV et CCV à l’avenir devraient viser à la définition en
détail de l’unité fonctionnelle aux applications d’éclairage public. L’unité
fonctionnelle sera applicable également dans les analyses CCV, afin qu’il
soit possible de combiner les analyses environnementales et économiques.
Plusieurs ACVs des sources lumineuses sont nécessaires pour mieux établir
les points environnementaux majeurs des sources lumineuses. Quant aux
lampes et luminaires à LED, surtout les pièces électroniques (driver, porte
LED) devraient été analysées dans les produits divers. De plus, l’échangeur
thermique serait un sujet très intéressant dans l’étude de l’ACV: il affecte
les impacts environnementaux de la fabrication et la durée de vie des
sources lumineuses à LED.