UNIVERSITÉ DE MONTRÉAL DEVELOPMENT AND … · M. HENRY Olivier, Ph. D., membre M. VAKKILAINEN Esa...
184
UNIVERSITÉ DE MONTRÉAL DEVELOPMENT AND INTEGRATION OF ACID PRECIPITATION BASED LIGNIN BIOREFINERIES IN KRAFT PULPING MILLS MIYURU SARANGA KANNANGARA DÉPARTEMENT DE GÉNIE CHIMIQUE ÉCOLE POLYTECHNIQUE DE MONTRÉAL THÉSE PRÉSENTÉE EN VUE DE L’OBTENTION DU DIPLÔME DE PHILOSOPHIAE DOCTOR (GÉNIE CHIMIQUE) AOÛT 2015 © Miyuru Saranga Kannangara, 2015.
Transcript of UNIVERSITÉ DE MONTRÉAL DEVELOPMENT AND … · M. HENRY Olivier, Ph. D., membre M. VAKKILAINEN Esa...
UNIVERSITÉ DE MONTRÉAL
DEVELOPMENT AND INTEGRATION OF ACID PRECIPITATION BASED LIGNIN
BIOREFINERIES IN KRAFT PULPING MILLS
MIYURU SARANGA KANNANGARA
DÉPARTEMENT DE GÉNIE CHIMIQUE
ÉCOLE POLYTECHNIQUE DE MONTRÉAL
THÉSE PRÉSENTÉE EN VUE DE L’OBTENTION
DU DIPLÔME DE PHILOSOPHIAE DOCTOR
(GÉNIE CHIMIQUE)
AOÛT 2015
© Miyuru Saranga Kannangara, 2015.
UNIVERSITÉ DE MONTRÉAL
ÉCOLE POLYTECHNIQUE DE MONTRÉAL
Cette thèse intitulée:
DEVELOPMENT AND INTEGRATION OF ACID PRECIPITATION BASED LIGNIN
BIOREFINERIES IN KRAFT PULPING MILLS
présentée par : KANNANGARA Miyuru Saranga
en vue de l’obtention du diplôme de : Philosophiae Doctor
a été dûment acceptée par le jury d’examen constitué de :
M. PERRIER Michel, Ph. D., président
M. PARIS Jean, Ph. D., membre et directeur de recherche
M. FRADETTE Louis, Ph. D., membre et codirecteur de recherche
M. HENRY Olivier, Ph. D., membre
M. VAKKILAINEN Esa Kari, Ph. D., membre

iii
DEDICATION
To my family

iv
ACKNOWLEDGEMENTS
I would like to express my acknowledgements to my supervisors, Prof. Jean Paris, who gave me
this opportunity. Your advice and guidance has always helped me to learn and grow as a person
and excel in what I do. Your dedication and hard work is always an inspiration for me. Special
thanks to Prof. Louis Fradette, who always provided valuable insights to the project. Your
suggestions, support and constructive critic made me a better researcher. It was a privilege to learn
from such competent and sincere supervisors.
I would like to thank Dr. Mariya Marinova for her support, advice and encouragement during my
stay. My thanks also go to Dr. Lamfeddal Kouisni and Dr. Naceur Jemma for their assistance,
advice and comments on my laboratory work and the industrial aspects of the project. Thanks to
Dr. Zoe Perin-Levasseur for providing a great start to the project. I would also like to thank Mr.
Jean-Noel Cloutier, Mr. Raynald Labreque and Dr. Tolnai Balazs for their inputs, advice and
comments.
I would like to thank the staff and in particular the technicians of Chemical Engineering
Department of Ecole Polytechnique.
I thank the interns, Jalil, Carmen and Ines, who participated in this project and made this thesis a
reality. Jalil, thank you for making my life easier during the experimental program.
I would not have made this without constant support and encouragement of my dear friends and
colleages Moye, Anna, Sanjeewa, Maryam, Salomeh, Hilda, Ju, Hana, Radia, Sourour, Emir, Inci,
Selim, Walid, Mohammad and all other that I might have forgotten to mention here. Thanks for
Francois and Meriyem for translating the abstract and support.
I would like to thank my Uncle, Aunty and cousin for their support and encouragement since the
day I left home to study abroad.
I would like to thank my parents and brother for their love, support and guidance. You are the
constant driving force behind my success.
Finally to my dear wife Indeewari, last 6 years, we have been together were the happiest of my life
and thanks for all the love and being patient all this time.
v
RÉSUMÉ
L'utilisation des ressources fossiles pour la production de biens et de services a des conséquences
désastreuses sur l'environnement. Pour réduire leur impact, l'utilisation de matières premières ainsi
que d’énergie renouvelables a été proposée en vue du développement d’une bioéconomie durable.
L'industrie des pâtes et papiers en Amérique du Nord est actuellement confrontée à de rudes
conditions économiques en raison de la diminution de la demande en produits papetiers
traditionnels, la concurrence internationale et l’augmentation des prix de l'énergie. Les
technologies de bioraffinage, qui transforment les constituants du bois en produits chimiques
d’origine biologique à haute valeur ajoutée, représente, pour l'industrie des pâtes et papier, un
moyen d’augmenter ses revenus, de diversifier son portefeuille de produits et de devenir plus
durable sur le long terme. Elle est particulièrement bien placée pour répondre à cette tâche en raison
de l'accès à la biomasse, de la manutention du bois et de l'infrastructure de transport, et de
l'expertise existante dans les produits traditionnels obtenus à partir du bois.
L'extraction et la transformation de la lignine aux produits à haute valeur ajoutée a été identifiée
comme l'une des voies de bioraffinage les plus rentables dans les usines de fabrication de pâte
Kraft. L’extraction de la lignine, qui est une étape cruciale de la bioraffinerie intégrée, interagit à
un degré élevé avec l’usine de pâte Kraft. L'importance de cette interaction est renforcée par la
possibilité d’augmenter la production de pâte à papier grâce l'extraction de la lignine. Afin de
réussir l’intégration de l’unité de bioraffinerie de la lignine dans les usines de fabrication de pâte
Kraft, il est nécessaire de comprendre et de traiter les interactions entre les processus d'extraction
de la lignine et l’usine de pâte Kraft réceptrice. De plus, il est nécessaire d'améliorer la rentabilité
et la performance environnementale des procédés d'extraction de la lignine par l'amélioration de
ses opérations unitaires et de répondre aux demandes énergétiques et chimiques internes au
procédé. Dans cette thèse, le développement et l'intégration des processus de précipitations acides
dans les usines de fabrication de pâte Kraft en vue d’améliorer leur performance économique et
environnementale ont été étudiés.
Dans la première partie de cette recherche, les effets de l'énergie de la mise en œuvre du processus
de précipitations acides sur la fabrication de la pâte kraft ont été évalués. Une usine de pâte Kraft
canadienne représentative a été utilisée comme référence. Bien que le processus de précipitations
acides n’ait pas une demande en énergie considérable, l'élimination de la lignine réduit la
vi
production d'énergie de la chaudière de récupération et augmente la demande en vapeur de
l’évaporateur. La production d'électricité a également diminué en raison de la diminution de la
production d’énergie de la part de la chaudière. Un taux d’extraction de la lignine de 15% a permis
une réduction de la récupération de la production d'énergie de la chaudière de 13,5% et une
augmentation de 15% de la production de pâte à papier en raison du desembouteillage de la
chaudière de récupération. Les déficits en énergie dans le processus Kraft ont été résolus par des
mesures combinant des projets d'économie d'énergie identifiés à l'aide de l'analyse Pinch, d’une
augmentation de la production d'énergie de la chaudière et de gazéification de la biomasse à cycle
combiné. Il a été montré que la lutte contre les déficits d'énergie interne était possible, mais
nécessite un haut degré d'intégration d’énergie.
Dans la deuxième partie de l'ouvrage, les effets sur l'équilibre chimique ont été étudiés. Une
approche de modélisation basée sur l'équilibre électrolytique, qui a été proposée pour estimer les
variations du pH et de la composition chimique de la liqueur noire, ont été utilisés pour simuler le
processus de précipitations acides. Un algorithme basé sur le ratio Na / S a été utilisé pour calculer
les équilibres chimiques du cycle de liqueur de l’usine de pâte Kraft. L’équilibrage entre Na et S
a été réalisé suivant plusieurs stratégies basées sur les contraintes de l'usine et sur le recyclage du
filtrat nettoyé. L’élimination complète ou le recyclage excessif de filtrats de lavage ont été trouvés
pour augmenter l'exigence de récupération caustique. La demande caustique pourrait être
minimisée en recyclant une partie des filtrats de lavage les plus concentrés, de sorte que la
perturbation de l'équilibre Na / S soit minimale. L'efficacité de l'installation de lavage a également
été trouvée pour affecter la demande de récupération caustique. La stratégie d’équilibrage entre Na
et S a également affecté les charges de récupération des cycles opératoires, notamment ceux du
train de l'évaporateur, de la caustification et du four à chaux. Par conséquent, les goulets
d'étranglement dans les autres opérations de valorisation doivent être pris en compte lors du choix
d'une stratégie de sorte que les demandes en produits chimiques soient réduits au minimum et
qu’une augmentation maximale de la production de pâte à papier soit obtenue.
Dans les troisième et quatrième parties de cette recherche, les possibilités de réduction des coûts
des processus de précipitations acides ont été étudiées. Comme la filtration et l’équipement de
lavage représentent une partie importante des coûts en capital dans une usine de précipitation de
la lignine, la possibilité d'améliorer la filtration de la lignine par optimisation hydrodynamique a
été évaluée. Les conditions hydrodynamiques au cours de coagulation et de la floculation de la
vii
lignine ont été variées et les particules de lignine précipitées ont été caractérisées en termes de
propriétés de particules et de filtration. Il a été trouvé que le taux de cisaillement turbulent est le
paramètre hydrodynamique déterminant qui contrôle la taille et la forme des particules de la lignine
précipitée. Les particules les plus compactes et les plus grandes, qui peuvent être obtenus par
contrôle hydrodynamique, ont présenté des propriétés de filtration et de lavage supérieures.
L'optimisation systématique des paramètres a été utilisée comme moyen d'améliorer le rendement
et la performance de filtration du procédé de précipitation acide. Les expériences ont été effectuées
en utilisant l'approche Taguchi et les résultats ont été analysés en utilisant le rapport S / N et les
méthodes statistiques d'analyse de variance. La teneur de la liqueur noire en contenu solide a été
identifiée comme le paramètre le plus critique, ce qui a eu la plus grande influence à la fois sur le
rendement de la lignine et sur la résistance à la filtration. Les paramètres optimaux définis pour la
performance de filtration, qui ont produit une lignine avec la plus basse teneur en cendres de 0,09%,
n'a pas fourni le rendement le plus élevé en lignine. Par conséquent, il est prendre en compte qu’un
compromis entre la pureté de la lignine et de processus économiques lors de l'élaboration des
procédés de précipitation de la lignine pour des applications spécifiques serait nécessaire.
Enfin, la faisabilité technico-économique de l'utilisation de four à chaux gaz de combustion pour
l’acidifaction de la liqueur noire a été étudiée. Les résultats expérimentaux ont montré qu'il est
possible d'obtenir de la lignine filtrable, bien que la cinétique de l'acidification soit beaucoup plus
lente. Une simulation et une analyse économique ont révélé que malgré la réduction du coût en
CO2, le four à chaux approvisionné en gaz de combustion était économiquement moins attrayant
que l'achat de CO2 externe en raison des exigences de nettoyage des gaz et de la taille accrue des
réservoirs d'acidification. L'analyse de sensibilité a montré que les prix et la demande de CO2 du
procédé doivent être considérablement plus élevés pour qu’il soit économiquement attrayant.
viii
ABSTRACT
The use of fossil fuel resources for manufacture of goods and services has dire consequences on
the environment. To reduce the impact, the use of renewable raw materials and energy has been
suggested, leading to a sustainable bioeconomy. The pulp and paper industry in North America is
currently facing stiff economic conditions due to declining demand for traditional paper
commodities, international competition and rising energy prices. The biorefinery technologies,
which convert wood components to value added bio-based chemicals and products, can be a means
for the pulp and paper industry to increase its revenue, diversify the product portfolio and become
more sustainable in the long run. The industry is uniquely positioned to accommodate this task due
to access to biomass, existing wood handling and transportation infrastructures and expertise in
traditional wood products.
The extraction and conversion of lignin to value added products has been identified as one of the
most profitable biorefining pathways in Kraft pulping mills. Extraction of lignin, a crucial step of
the integrated lignin biorefinery, has a high degree of interaction with the receptor Kraft pulping
mill. The importance of the interaction is further enhanced by the possibility of incremental pulp
production with lignin extraction. For successful implementation of the lignin biorefinery in Kraft
pulping mills, we should understand and address the interactions between lignin extraction process
and receptor Kraft pulping mill. Furthermore, it is necessary to enhance the profitability and
environmental performance of the lignin extraction processes by improving its operations and
meeting the internal energy and chemical demands. In this thesis, the development and integration
of acid precipitation process in Kraft pulping mills to improve its economic and environmental
performance have been investigated.
In the first part of this research, the energy impacts of implementing the acid precipitation process
on the Kraft pulping mill was evaluated. A representative Canadian softwood Kraft pulping mill
have been used as the reference. Although, the acid precipitation process did not have considerable
energy demands, the lignin removal reduced the recovery boiler energy production and increased
the evaporator steam demand. The electricity production was also decreased due to reduced
recovery boiler steam production. A total of 15% lignin extraction reduced the recovery boiler
energy production by 13.5% and allowed an increase of pulp production capacity by 15% through
recovery boiler debottlenecking. The energy deficits in the Kraft process was addressed by
ix
measures combining energy savings projects identified using Pinch analysis, biomass boiler energy
production increase and biomass gasification combined cycle. It was shown that addressing the
energy deficits internally was feasible, but requires high degree of energy integration.
In the second part of the work, the impact of integrating a lignin biorefinery on the chemical balance
of Kraft pulping mill have been investigated. A modeling approach based on electrolyte
equilibrium, which was proposed to estimate pH and chemical composition variations of the black
liquor, have been used to simulate the acid precipitation process. A calculation sequence based on
Na/S balances was utilized to calculate the chemical balances of the liquor cycle of the Kraft
pulping mill. Balancing Na and S have been performed according to several strategies based on
mill constraints and wash filtrate recycle. Complete disposal or excessive recycle of wash filtrates
have been found to increase the make-up caustic requirement. The caustic demand could be
minimized by recycling a part of most concentrated wash filtrates so that disruption of the Na/S
balance was minimum. The efficiency of the washing setup was also found to affect the make-up
caustic demand. The Na and S balancing strategy also affected the loads to the recovery cycle
operations including evaporator train, recausticizing and lime kiln. Therefore, the bottlenecks in
the other recovery operations have to be taken into account in selecting a strategy so that chemical
demands are minimized and maximum pulp production increase is obtained.
In the third and fourth parts of this research, possibilities of reducing the costs of acid precipitation
process have been investigated. As filtration and washing equipment represent a significant portion
of capital costs in a lignin precipitation plant, the feasibility of improving lignin filtration by
hydrodynamic optimization has been evaluated. The hydrodynamic conditions during lignin
coagulation and flocculation were varied and the precipitated lignin particles were characterized in
terms of particle and filtration properties. The turbulent shear rate was found to be the determining
hydrodynamic parameter that controlled the size and shape of the precipitated lignin particles. More
compact and larger particles, which could be obtained by hydrodynamic control, provided superior
filtration and washing properties.
The systematic parameter optimization was used as means of improving the yield and filtration
performance of the acid precipitation process. The experiments were performed using the Taguchi
statistical design of experiments approach and the results were analyzed using signal-to-noise ratio
and analysis of variance statistical methods. The black liquor solid content have been identified as
x
the most critical parameter, which had the largest influence on both lignin yield and filtration
resistance. The optimal parameters set for filtration performance, which produced lignin with
lowest ash content of 0.09%, did not provide the highest lignin yield. Therefore, considering trade-
offs between lignin purity and process economics would be required, when developing lignin
precipitation processes for specific applications.
Lastly, the economic and technical feasibility of using lime kiln flue gases for black liquor
acidification was investigated. The experimental results showed that it is feasible to obtain
filterable lignin, however, the kinetics of the acidification was considerably slower. A simulation
and economic analysis revealed that despite the elimination of CO2 cost, the lime kiln flue gas
supply was less attractive economically than external CO2 purchase due to the gas cleaning
requirements and increased size of acidification vessels. The sensitivity analysis showed that CO2
price and CO2 demand of the process has to be considerably higher that current values for the use
of flue gases to be economically attractive.
xi
TABLE OF CONTENTS
DEDICATION .............................................................................................................................. III
ACKNOWLEDGEMENTS .......................................................................................................... IV
RÉSUMÉ ........................................................................................................................................ V
ABSTRACT ............................................................................................................................... VIII
TABLE OF CONTENTS .............................................................................................................. XI
LIST OF TABLES .................................................................................................................. XVIII
NO TABLE OF FIGURES ENTRIES FOUND.LIST OF FIGURES ........................................ XX
LIST OF SYMBOLS AND ABBREVIATIONS.................................................................... XXIII
INTRODUCTION ........................................................................................................................... 1
LITERATURE REVIEW .................................................................................... 1
1.1 Context and motivation .................................................................................................... 4
1.2 Canadian Forestry Sector ................................................................................................. 5
1.3 Kraft pulping .................................................................................................................... 5
1.4 Kraft Pulping Mill as an Integrated Biorefinery .............................................................. 8
1.4.1 Hemicellulose Extraction and Utilization .................................................................... 8
1.4.2 Cellulose and Fiber based Products ............................................................................. 8
1.4.3 Energy and Water for Kraft mill Forest Biorefineries ................................................. 9
1.4.4 Lignin Extraction from Black Liquor ......................................................................... 10
1.4.5 Recovery Boiler Debottlenecking and Pulp Production Increase .............................. 11
1.4.6 Lignin Applications .................................................................................................... 11
1.4.7 The Properties of Lignin ............................................................................................ 13
1.5 Aggregation of Lignin in Aqueous Solutions ................................................................ 13
1.5.1 Aggregate Kinetics and Structure .............................................................................. 14
xii
1.5.2 Effect of pH, Ionic Strength and Temperature ........................................................... 15
1.6 Acid Precipitation Process ............................................................................................. 16
1.6.1 Effects of Operating Parameters ................................................................................ 17
1.6.2 Filtration and Washing ............................................................................................... 19
1.6.3 Commercially Available Versions of the Process ...................................................... 21
1.7 Implementation of Acid Precipitation Process in Kraft Pulping Mills .......................... 21
1.7.1 Impact on the Recovery boiler and Production Increase ............................................ 22
1.7.2 Impacts on the Evaporator Train ................................................................................ 23
1.7.3 Impacts on Mill Total Energy Balance ...................................................................... 23
1.7.4 Impacts on Chemical Balance .................................................................................... 23
1.8 Process integration opportunities within Kraft process .................................................. 24
1.8.1 Energy Integration ...................................................................................................... 24
1.8.2 Water and Chemical Integration ................................................................................ 25
1.9 Critical Review ............................................................................................................... 27
OBJECTIVES, METHODOLOGY AND THESIS ORGANISATION ........... 29
2.1 Specific objectives .......................................................................................................... 29
2.2 Methodology .................................................................................................................. 29
2.3 Organisation of the Thesis .............................................................................................. 31
ARTICLE 1: LIGNIN RECOVERY BY ACID PRECIPITATION IN A KRAFT
MILL: AN ENERGY PERSPECTIVE ......................................................................................... 33
3.1 Introduction .................................................................................................................... 33
3.2 Lignin extraction process integrated into a Kraft mill ................................................... 34
3.3 Extraction and recycle of black liquor ........................................................................... 36
3.4 Impacts on mill energy balance ...................................................................................... 37
3.4.1 Impacts on the Evaporator Train ................................................................................ 37
xiii
3.4.2 Impacts on the Recovery boiler .................................................................................. 38
3.5 Addressing the energy deficits ....................................................................................... 39
3.5.1 Strategy 1: Steam Saving Projects and Condensing Power ....................................... 41
3.5.2 Strategy 2: Additional Biomass Use .......................................................................... 41
3.5.3 Strategy 3: IGCC Cycle and Steam Saving Projects .................................................. 42
3.6 Conclusion ...................................................................................................................... 43
3.7 Acknowledgements ........................................................................................................ 43
3.8 References ...................................................................................................................... 43
ARTICLE 2: PROCESS MODELLING AND NA/S BALANCES OF LIGNIN
BIOREFINERIES IMPLEMENTED IN KRAFT PULPING MILLS: APPLICATION TO A
CANADIAN SOFTWOOD MILL................................................................................................ 45
4.1 Introduction .................................................................................................................... 46
4.2 Process description ......................................................................................................... 47
4.2.1 Kraft process liquor cycle .......................................................................................... 47
4.2.2 Acid precipitation process .......................................................................................... 48
4.3 Simulation approach ....................................................................................................... 49
4.3.1 Liquor cycle balances ................................................................................................. 50
4.3.2 Recovery boiler energy production and lignin extraction ratio.................................. 54
4.3.3 Modeling the BL acidification ................................................................................... 56
4.3.4 Acid precipitation and liquor cycle mass and energy balances .................................. 58
4.4 Results and discussion .................................................................................................... 60
4.4.1 Implementation strategies .......................................................................................... 60
4.4.2 Impact on Na/S balances ............................................................................................ 61
4.4.3 Increase in steam and water demand and effluent production ................................... 66
4.4.4 Pulp production increase and implementation constraints ......................................... 67
xiv
4.5 Conclusions .................................................................................................................... 68
4.6 Acknowledgements ........................................................................................................ 69
4.7 References ...................................................................................................................... 69
ARTICLE 3: EFFECT OF MIXING HYDRODYNAMICS ON THE PARTICLE
AND FILTRATION PROPERTIES OF PRECIPITATED LIGNIN ........................................... 72
5.1 Introduction .................................................................................................................... 73
5.2 Materials and methods ................................................................................................... 76
5.2.1 Experimental setup ..................................................................................................... 76
5.2.2 Black liquor samples .................................................................................................. 77
5.2.3 Characterization of the black liquors, filtrates, and lignin samples ........................... 78
5.2.4 Experimental Procedure ............................................................................................. 78
5.2.5 Characterization of the hydrodynamic conditions in the stirred tank ........................ 79
5.2.6 Characterization of specific filtration resistance and lignin yield .............................. 80
5.2.7 Characterization of particle size distributions and structures ..................................... 81
5.3 Results and Discussion ................................................................................................... 82
5.3.1 Effect of hydrodynamic conditions on particle properties ......................................... 82
5.3.2 Size distribution .......................................................................................................... 85
5.3.3 Aggregate structure .................................................................................................... 86
5.4 Effect hydrodynamic conditions on filtration, washing and yield ................................. 90
5.4.1 Filtration resistance .................................................................................................... 90
5.4.2 Lignin yield ................................................................................................................ 91
5.4.3 Washing time and ash content .................................................................................... 91
5.4.4 Lignin filtration rate ................................................................................................... 92
5.5 Verification of the reproducibility of the results using black liquors from other Kraft
pulping mills ............................................................................................................................... 93
xv
5.6 Conclusions .................................................................................................................... 96
5.7 Acknowledgements ........................................................................................................ 97
5.8 References ...................................................................................................................... 97
ACID PRECIPITATION OF LIGNIN FROM BLACK LIQUOR:
OPTIMIZATION OF FILTRATION PERFORMANCE AND YIELD USING TAGUCHI
METHOD……………………………………………………………………………………….100
6.1 Introduction .................................................................................................................. 100
6.2 Methodology ................................................................................................................ 102
6.2.1 Experimental work ................................................................................................... 102
6.2.2 Black liquor, filtrate and lignin characterization ...................................................... 104
6.2.3 Calculation of lignin yield and filtration resistance ................................................. 105
6.2.4 Mixing tank characterization .................................................................................... 106
6.3 Statistical analysis ........................................................................................................ 107
6.3.1 𝑺/𝑵 ratio computation ............................................................................................. 107
6.3.2 Analysis of variance (ANOVA) computation .......................................................... 107
6.3.3 Prediction of optimum performance ........................................................................ 108
6.4 Results and discussion .................................................................................................. 109
6.4.1 Preliminary selection of operating parameters ......................................................... 109
6.4.2 Design of experiments .............................................................................................. 112
6.4.3 Lignin Yield Optimization ....................................................................................... 113
6.4.4 Filtration Performance Optimization ....................................................................... 115
6.4.5 ANOVA Results ....................................................................................................... 117
6.4.6 Selection of Overall Optimum Operating Conditions .............................................. 120
6.4.7 Result Validation ...................................................................................................... 121
6.4.8 The Acid Precipitation Process and Pulp Mill Interaction ....................................... 122
xvi
6.5 Conclusion .................................................................................................................... 122
6.6 Acknowledgements ...................................................................................................... 124
FEASIBILITY AND ECONOMICS OF USING LIME KILN FLUE GASES
FOR PRECIPITATION OF LIGNIN FROM BLACK LIQUOR .............................................. 125
7.1 Introduction .................................................................................................................. 125
7.2 Experimental Section ................................................................................................... 126
7.2.1 Experimental setup ................................................................................................... 126
7.2.2 Analytical Procedures .............................................................................................. 127
7.2.3 Black Liquor Properties ........................................................................................... 127
7.2.4 Experimental Results ................................................................................................ 128
7.3 Economic Evaluation ................................................................................................... 129
7.3.1 Process Flowsheets and Simulation ......................................................................... 129
7.3.2 Economic Analysis ................................................................................................... 131
7.4 Conclusion .................................................................................................................... 133
GENERAL DISCUSSION .............................................................................. 134
8.1 Process Implementation and Integration ...................................................................... 134
8.1.1 Energy Impacts and Mitigation ................................................................................ 134
8.1.2 Lignin Extraction Ratio and Pulp Production Increase ............................................ 135
8.1.3 Process Modelling and Liquor Cycle Chemical Balance ......................................... 136
8.1.4 Internal Supply of Chemicals ................................................................................... 138
8.2 Process Development ................................................................................................... 139
8.2.1 Effects of Mixing Hydrodynamics ........................................................................... 139
8.2.2 Systematic Parameter Optimization ......................................................................... 141
CONCLUSION AND RECOMMENDATIONS ............................................ 143
9.1 Conclusion .................................................................................................................... 143
xvii
9.2 Original Contributions .................................................................................................. 144
9.3 Recommendations ........................................................................................................ 145
9.3.1 Integrated Forest Biorefineries (IFBR) .................................................................... 145
9.3.2 Process Modelling of the Lignin Biorefinery ........................................................... 146
9.3.3 Lignin Floc Strength Measurement and Improvement ............................................ 146
9.3.4 Novel Precipitation Reactor Proposals ..................................................................... 147
9.3.5 Control and Stabilization of the Acid Precipitation Process .................................... 147
9.3.6 Control of Lignin Properties .................................................................................... 148
BIBLIOGRAPHY ....................................................................................................................... 149
xviii
LIST OF TABLES
Table 1-1: Typical softwood and hardwood composition (Biermann, 1996) .................................. 6
Table 1-2: A summary of lignin extraction methods from black liquor. ....................................... 10
Table 1-3: The specifications of lignin feedstock for carbon fiber production as defined by Oak
Ridge National Laboratory (ORNL) (Baker, 2011; Luo, Genco, Cole, & Fort, 2011) .......... 13
Table 1-4 : The ranges of pH, temperature and solid content reported in the literature. ............... 19
Table 3-1: Main parameters of the Kraft mill ................................................................................ 35
Table 3-2: Key parameters of the lignin biorefinery ...................................................................... 36
Table 3-3: Increase of evaporator steam demand with rate of filtrate recycle for given
configurations ......................................................................................................................... 37
Table 3-4: List of proposed steam saving projects ......................................................................... 40
Table 3-5: Comparison of strategies proposed to address mill power and steam deficits. ............ 42
Table 4-1: The components included in the liquor cycle balance .................................................. 52
Table 4-2: The BL composition of the studied mill ....................................................................... 53
Table 4-3: Specifications of the lignin extraction process ............................................................. 59
Table 4-4: Pulp mill parameters for mill balances ......................................................................... 60
Table 4-5: Implementation strategies of lignin biorefinery in Kraft pulping mill ......................... 61
Table 4-6: Chemical additions, purges and Na2CO3 flow for each strategy .................................. 64
Table 4-7: Steam, water demand and effluent production increase based on the implementation
strategy of the biorefinery process ......................................................................................... 66
Table 4-8: Feasible pulp production increase, lignin extraction and capacities utilized in the liquor
cycle for the studied mill. ....................................................................................................... 67
Table 5-1: Properties of the black liquor samples. ......................................................................... 77
Table 5-2: The power levels and corresponding to the Reynolds numbers and RPMs for the PBT
and MB impeller assemblies. ................................................................................................. 80
xix
Table 5-3: Average rates of lignin filtration for the power levels used. ........................................ 93
Table 5-4: Particle sizes at the end of the ageing operation for black liquors A, B, C, and D for
three acidification and ageing power level combinations. ..................................................... 94
Table 5-5: Process performance parameters for selected specific power levels for liquors A, B, C,
and D. ..................................................................................................................................... 95
Table 6-1: Properties of oxidized black liquor used in this work. ............................................... 105
Table 6-2: The specific power levels, RPMs and Re numbers of operation. ............................... 106
Table 6-3: The parameters (factors) and their levels .................................................................... 113
Table 6-4: Experimental results for lignin yield .......................................................................... 114
Table 6-5: Experimental results for filtration resistance and ash content of lignin cake ............. 116
Table 6-6: Results of ANOVA for lignin yield ............................................................................ 118
Table 6-7: Results of ANOVA for filtration resistance of lignin cake ........................................ 119
Table 6-8: Results of ANOVA for ash content of washed lignin cake ........................................ 120
Table 7-1: The properties of the investigated black liquor. ......................................................... 127
Table 7-2: The results of the experiments using different black liquors. ..................................... 128
Table 7-3 : Parameters of lignin precipitation process. ................................................................ 130
Table 7-4 : Economic analysis for two processes. ....................................................................... 131
xx
LIST OF FIGURES
Figure 1-1: Number of people directly employed by the forest sector in the provinces of Quebec,
British Columbia and Ontario (Statistics-Canada, 2013). ........................................................ 4
Figure 1-2: Overview of Kraft process ............................................................................................ 6
Figure 1-3: Chemical recovery cycle of the Kraft process (Smook, 1992a) .................................... 7
Figure 1-4 Cryo-TEM image of a DLCA fractal lignin aggregate (Norgren & Edlund, 2014).
Reprinted with permission from Norgren, M., Edlund, H., Lignin: Recent advances and
emerging applications. Current Opinion in Colloid & Interface Science 2014; 19 (5); 409-416.
Copyright 2015 by Elsevier. ................................................................................................... 15
Figure 1-5: The main operations in the acid precipitation process ................................................ 17
Figure 2-1 : Overall methodological approach .............................................................................. 30
Figure 3-1: Implementation of lignin extraction in the evaporator train of the Kraft mill according
to configuration 1 and 2. ........................................................................................................ 36
Figure 3-2: Reduction of HHV of black liquor with the extraction of lignin ................................ 38
Figure 3-3: Impacts of lignin extraction on the energy balance of the mill ................................... 39
Figure 3-4: Composite curves generated by pinch analysis for the reference mill. ....................... 40
Figure 4-1: A basic flow diagram of the liquor cycle in a Kraft pulp mill .................................... 48
Figure 4-2: A flowsheet of the lignin extraction process ............................................................... 49
Figure 4-3: Simulation framework used for the analysis ............................................................... 50
Figure 4-4: The calculation sequence utilized for estimating the Na/S balances of the liquor cycle
................................................................................................................................................ 51
Figure 4-5: Comparison of the results for Model 1 where phenol hydroxyl groups of lignin is
included and Model 2 where only inorganic compounds of BL is used for equilibrium and
compared with experimental data by Wallmo et al. (2007). .................................................. 58
Figure 4-6: Overall Na/S balances of the liquor cycle of studied mill (without lignin biorefinery
integration) (Units: t/d) ........................................................................................................... 62
xxi
Figure 4-7: Na/S balances of the liquor cycle with integrated lignin biorefinery plant for proposed
strategies (units: t/d) ............................................................................................................... 63
Figure 4-8: Sensitivity of the caustic demand on the chemical recovery efficiency and wash liquor
consumption of first washing step (Wash liquor strength 0.4 M H2SO4) .............................. 65
Figure 5-1: Flow diagram of the acid precipitation process. .......................................................... 73
Figure 5-2: Two-stage pitched-blade turbine (PBT) and Maxblend (MB) impeller assemblies and
their dimensions. .................................................................................................................... 76
Figure 5-3: Changes in particle size during the ageing operation using the 0.003, 0.011, and 0.107
kW/m3 ageing power levels for flocs acidified at 1.029 kW/m3 acidification power level with
the MB and PBT impeller assemblies. (a) Median diameter (DV50) (b) Sauter mean diameter
(D3,2). ...................................................................................................................................... 83
Figure 5-4: Changes in particle size during the ageing operation using the 0.011, and 0.107 kW/m3
ageing power levels for flocs acidified at 0.107 kW/m3 acidification power level with the MB
and PBT impeller assemblies. (a) Median diameter (DV50) (b) Sauter mean diameter (D3,2).
................................................................................................................................................ 84
Figure 5-5 : Volume weighted and number weighted distributions for PBT and MB mixing
assemblies at the start (t = 0) and end (t = 60 min) of the ageing operation for the 1.029 kW/m3
and 0.107 kW/m3 acidification power levels and the 0.011 kW/m3 ageing power level. (a)
Volume weighted distribution (t = 0). (b) Volume weighted distribution (t = 60 min). (c)
Number weighted distribution (t = 0). (d) Number weighted distribution (t = 60 min). ....... 85
Figure 5-6: Fractal dimension (Df) of the lignin flocs at the start and end of the acidification step.
................................................................................................................................................ 87
Figure 5-7: SEM images showing the size, distribution, and structure of precipitated lignin at 6000x
magnification at the start of the ageing operation (t = 0). (a) 1.029 kW/m3 acidification power
level, (b) 0.107 kW/m3 acidification power level. ................................................................. 87
Figure 5-8: SEM images showing the size, distribution, and structure of precipitated lignin at 3000x
magnification. (a) 1.029 kW/m3 acidification power level (at the start of the ageing operation),
(b) 0.107 kW/m3 acidification power level (at the start of the ageing operation), (c) 1.029
xxii
kW/m3 acidification power level (at the end of the ageing operation), (d) 0.107 kW/m3
acidification power (at the end of the ageing operation). ....................................................... 89
Figure 5-9: Filtration resistances of precipitated lignin cakes for the two impeller assemblies at
different acidification and ageing power levels. .................................................................... 90
Figure 5-10: Lignin yields (%) for the two impeller systems and five different acidification and
ageing power level combinations. .......................................................................................... 91
Figure 5-11: Washing times (min/100 g of lignin (dry basis)) for the MB and PBT assemblies for
different acidification and ageing power level combinations. ............................................... 92
Figure 6-1: The stirred tank setup used for the experiments. ....................................................... 103
Figure 6-2: Variation of filtration resistance and lignin yield with precipitation pH .................. 110
Figure 6-3: Variation of the filtration resistance and lignin yield with precipitation temperature
.............................................................................................................................................. 110
Figure 6-4: Variation of filtration resistance and yield with black liquor solids content (%) ...... 112
Figure 6-5: Main effect plots for S/N ratios of lignin yield: (a) Black liquor solids content (%), (b)
Precipitation pH, (c) Ageing residence time (min), (d) Agitation rate (RPM) .................... 115
Figure 6-6: Main effect plots for S/N ratios of (A) lignin cake filtration resistance and (B) ash
content of washed cake for (a) Black liquor solids content (%), (b) Precipitation pH, (c)
Ageing residence time (min), (d) Agitation rate (RPM) ...................................................... 117
Figure 7-1 : Acid precipitation process flowsheet with lime kiln flue gas CO2 supply ............... 130
Figure 7-2 : The sensitivity of the payback period of the process 1 to the (a) CO2 price (b) CO2
demand ................................................................................................................................. 132
xxiii
LIST OF SYMBOLS AND ABBREVIATIONS
𝐴 Filtration Area
ADt Air Dried Ton
𝐴𝑖 Mean Effect of Factor A
ANOVA Analysis of Variance
BL Black Liquor
𝑐 Concentration
CPPA Canadian Pulp and Paper Association
Cryo-TEM Cryogenic Transmission Electron Microscopy
𝐷 Impeller Diameter
D3,2 Sauter mean diameter
𝐷𝑓 Mass Fractal Dimension
DLCA Diffusion Limited Cluster-Cluster Aggregation
DLVO Derjaguin-Landau-Verwey-Overbeek theory
DOE Design of Experiments
DOF Degrees of Freedom
DV50 Median diameter
E Energy Flow Rate
EDL Electrical Double Layer
ESP Electrostatic Precipitator
F Wood Feed Rate
GL Green Liquor
GWA Generator Waste Acid
HHRR Hearth Heat Release Rate
xxiv
HHV Higher Heating Value
𝐼 Scattered Light Intensity
IFBR Integrated forest Biorefinery
IGCC The Integrated Gasification Combined Cycle
LP Low Pressure
�� Component Mass Flow Rate
�� Total Mass Flow Rate
MB MaxblendTM
MEA Monoethanolamine
MP Medium Pressure
𝑀𝑆 Mean Sum of Squares
𝑛 Refractive Index of the Dispersant
N Agitation Rate
NCC Nanocrystalline Cellulose
𝑁𝑃 Power Number
NRTL Non Random Two Liquid Model
O.D. Oven Dried
OA Orthogonal arrays
ODt Oven Dried Ton
𝑃 Total Power Input
P (%) Percentage Contribution
PAN Polyacrylonitrile
PBT Pitched blade turbine
pKa Acid Dissociation Contant
xxv
𝑄 Scattering Vector
Re Reynolds Number
RB Recovery Boiler
ref Reference Value
RLCA Reaction Limited Cluster-Cluster Aggregation
𝑅𝑀 Filter Medium Resistance
RPM Revolutions Per Minute
S/N Signal-to-Noise Ratio
SEM Scanning Electron Microscopy
SLRP Sequential Liquid-Lignin Recovery and Purification
𝑆𝑆 Sum of Squares
𝑇 Sum of Total Observations
Tad Adiabatic Temperature
UV Ultraviolet
𝑉 Volume
WL White Liquor
𝑌𝑖 Response Value
𝜶 Specific Filtration Resistance
∆𝑝 Pressure Differential
𝜀 Turbulent Kinetic Energy Dissipation
𝜂𝐶𝑎𝑢𝑠𝑡𝑖𝑐𝑖𝑧𝑖𝑛𝑔 Causticizing Efficiency
𝜂𝑅𝐵 Recovery Boiler Energy Efficiency
𝜂𝑅𝑒𝑑𝑢𝑐𝑡𝑖𝑜𝑛 Reduction Efficiency

xxvi
𝜃 Scattering Angle
𝜆 Wave Length of Radiation in Vacuum
𝜇 Dynamic Viscosity
𝜌 Density
1
INTRODUCTION
The North American pulp and paper industry has been facing difficult economic conditions since
last decade due to declining demand for traditional paper commodities, higher production costs and
competition from low cost overseas producers. The integrated forest biorefinery (IFBR), which
convert lignocellulosic biomass into novel bioproducts and chemicals, has been proposed as a
means of improving the product portfolio and profitability of pulping mills, making them
competitive and sustainable in the long run. This has led widespread research and development in
the area of biorefining.
An IFBR located in a pulping mill usually convert a wood component such as hemicellulose or
lignin, which is currently utilized for low value combustion, into a value added product. The idea
of IFBR is promising as it allows the use of existing infrastructure, wood supply network, and
utilities in the pulping mill. Numerous biorefining technologies that valorize wood components
into value added products are currently being evaluated for the implementation in the pulping mill.
Lignin extraction and conversion is amongst the most promising of such applications.
Among the available pulping methods, Kraft pulping is the dominant method in the world. In Kraft
pulping, the lignin and hemicellulose components of wood are selectively removed using
chemicals. Removed lignin, hemicellulose and spent chemicals are entrained in the spent liquor,
called black liquor, which is concentrated and combusted in the recovery boiler to regenerate the
spent chemicals and to generate steam and power for the mill. The produced pulp has higher quality
than the pulp produced from the other methods due to higher strength and low lignin content.
Lignin can be extracted from the black liquor stream by the acid precipitation process and then
converted into wide array of bioproducts and biochemicals, in the context of IFBR. In the acid
precipitation process, lignin is precipitated with CO2 treatment; precipitated lignin is filtered and
then washed. Lignin extraction reduces the thermal load to the recovery boiler of Kraft pulping
mill. This is advantageous as many North American Kraft pulping mills have gradually increased
their pulp production over the years, thus reaching the thermal limits of the recovery boiler. In such
cases, removing lignin from black liquor permits the increase of the pulp production capacity
(Loutfi, Blackwell, & Uloth, 1991).
2
Kraft lignin is currently being investigated as a feedstock for manufacture of novel bioproducts
such as carbon fibers, phenol formaldehyde resins, carbon blacks and polyurethanes. Most of the
technologies that convert lignin into value added products still require significant scientific and
technical breakthroughs. Many lignin products can be alternatively produced using petroleum
feedstock. The volatile petroleum prices demand the lignin extraction and conversion processes to
be highly cost efficient for lignin products to be economically competitive. The current cost of
lignin extraction and conditioning has been reported to be higher than the desired cost (Chien-Wei
Chen, 2014; Farag & Chaouki, 2015).
The IFBR should also facilitate the sustainable production of energy and products, thus reducing
environmental impacts. The successful implementation lignin biorefineries to achieve cost
efficiency and sustainability depends on the development of cost effective biorefinery designs,
implementation with minimum disruptions in the pulping mill, maximizing lignin extraction and
pulp production increase and, minimization of energy and chemical demands through process
integration. This thesis deals with acid precipitation based lignin biorefinery development and its
integration in Kraft pulping mills. To achieve cost effective design, process optimization potentials
were investigated. The process economics and environmental performance has been improved with
optimal implementation and integration of the lignin biorefinery in a Kraft pulping mill. The scope
of the biorefinery was limited to extraction and primary treatment of lignin.
Optimization of lignin filtration and yield is necessary to reduce the capital and operating costs of
the acid precipitation process. It was shown that lignin particle size and structure can be controlled
by the manipulation of hydrodynamic conditions during lignin aggregation and growth. The lignin
filtration and washing operations could be optimized by precipitating lignin particles with desirable
particle properties. The yield and lignin filtration were optimized using Taguchi experimental
approach. Potentials for process improvement have been identified.
Feasibility of supplying energy and chemicals for lignin biorefinery from the Kraft pulping mill
has been determined. The steam savings identified with Pinch analysis could be used to compensate
the energy demands. The feasibility of using CO2 from lime kiln flue gases in the precipitation
process was validated and the profitability of the proposals were evaluated. The chemical balances
of the Kraft mill liquor cycle was analyzed for the optimal implementation of lignin biorefinery

3
with minimum disruptions. Guidelines and strategies for the optimal implementation in terms of
caustic demand and pulp production increase have been proposed.
4
LITERATURE REVIEW
1.1 Context and motivation
Canada has vast sustainably managed forest resources, mainly located in the lands unsuitable for
food crops. The forest resources has been traditionally used by a wide array of industries ranging
from pulp, paper and wood products to heat and power. The forest industry is an important sector
of the Canadian economy, contributing significantly to the Gross Domestic Product (GDP) with a
revenue of $53 billion and employing 321,000 Canadians. However, the industry has faced a period
of decline. The demand for products such as newsprint is gradually decreasing and the wood pulp
products are facing severe competition from low cost overseas producers. The wood products such
as lumber were hard hit by the recent recession in United States. This has resulted in capacity
reductions and closure of several pulp and paper mills. The local communities, which were
dependent on the industry, have been affected. (Brown, Gilsenan, Singbeil, & Paleologou, 2011;
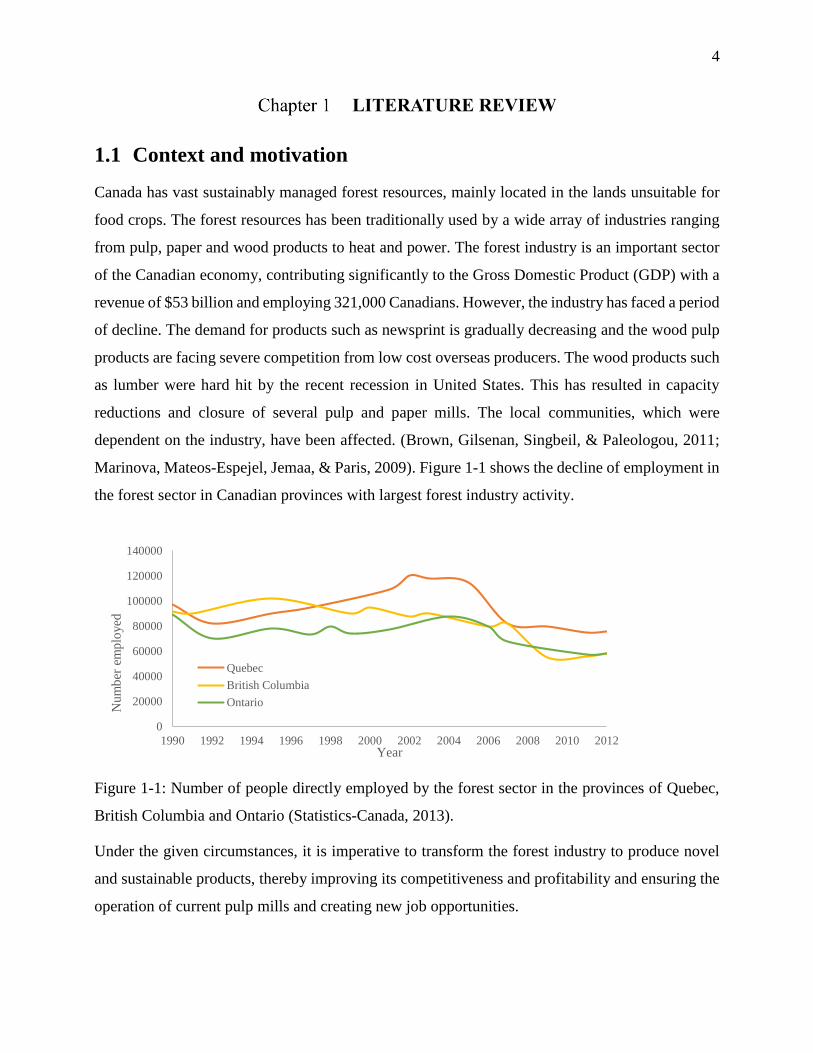
Marinova, Mateos-Espejel, Jemaa, & Paris, 2009). Figure 1-1 shows the decline of employment in
the forest sector in Canadian provinces with largest forest industry activity.
Figure 1-1: Number of people directly employed by the forest sector in the provinces of Quebec,
British Columbia and Ontario (Statistics-Canada, 2013).
Under the given circumstances, it is imperative to transform the forest industry to produce novel
and sustainable products, thereby improving its competitiveness and profitability and ensuring the
operation of current pulp mills and creating new job opportunities.
0
20000
40000
60000
80000
100000
120000
140000
1990 1992 1994 1996 1998 2000 2002 2004 2006 2008 2010 2012
Num
ber
em
plo
yed
Year
Quebec
British Columbia
Ontario
5
1.2 Canadian Forestry Sector
Canada has 347 million hectares of sustainably managed forest land, which has been traditionally
used for the manufacture of solid wood and pulp and paper products. Solid wood products include
lumber, structured panels and wood composites while the pulp and paper products include
newsprint, market pulp, tissue and towel grade pulp, and packaging materials. The wood residue is
combusted to generate on site heat and power and in some cases excess power is sold to the grid.
The industry is highly integrated with saw mills, which manufacture lumber and wood chips to the
mills. The local communities are concentrated around the industrial sites and are heavily dependent
on it. The demand for newsprint has been gradually declining and market pulp products also face
fierce competition from overseas low cost manufactures. This has resulted in large declines in pulp
and paper production, costing large number of job losses (Brown et al., 2011; Natural-Resources-
Canada, 2015)
1.3 Kraft pulping
Around 50% of export revenue generated from the Canadian forestry sector comes from pulp and
paper products (Natural-Resources-Canada, 2015). The available pulping methods can be
categorized into mechanical pulping and chemical pulping. In mechanical pulping, the wood fibers
are mechanically disintegrated to create pulp, while they are chemical liberated during chemical
pulping processes. Chemical pulping can be subdivided into sulfite pulping and Kraft pulping.
Kraft pulping is the dominant pulping method for manufacturing pulp and paper in the world today.
Chemical pulping accounts for 70% of north American pulp production, 95% of which is Kraft
pulping (Smook, 1992d).
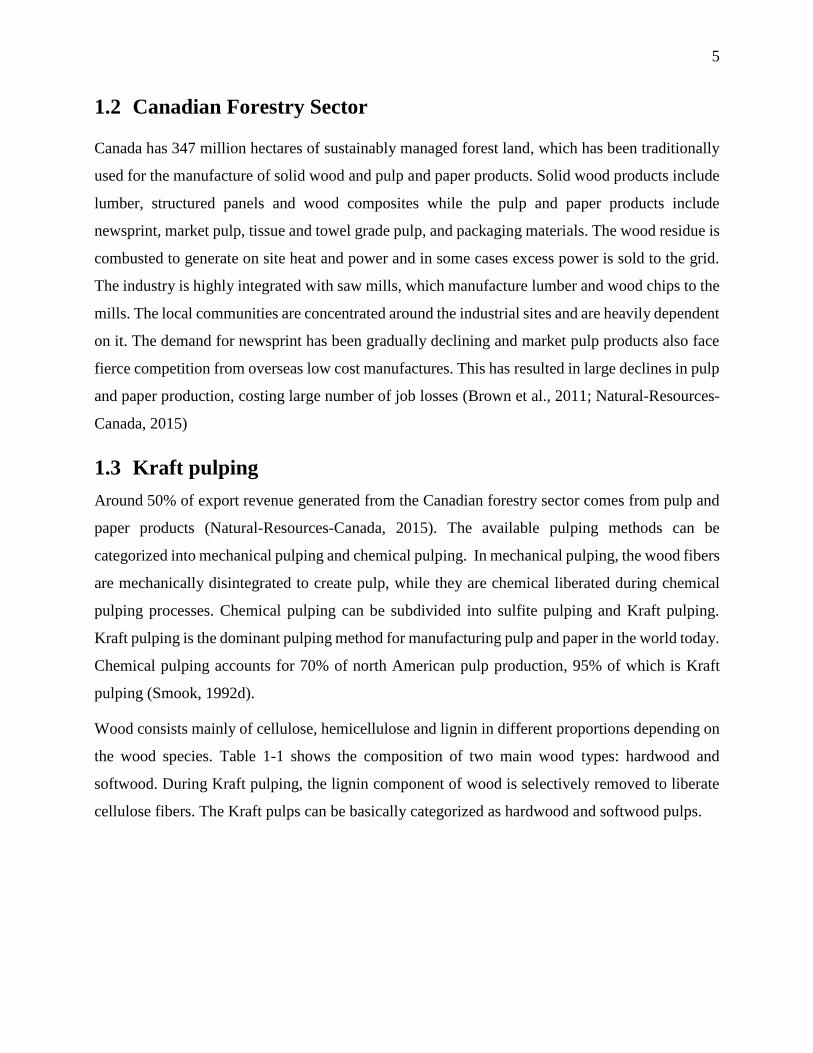
Wood consists mainly of cellulose, hemicellulose and lignin in different proportions depending on
the wood species. Table 1-1 shows the composition of two main wood types: hardwood and
softwood. During Kraft pulping, the lignin component of wood is selectively removed to liberate
cellulose fibers. The Kraft pulps can be basically categorized as hardwood and softwood pulps.
6
Table 1-1: Typical softwood and hardwood composition (Biermann, 1996)
Component Percentage
Hardwood Softwood
Cellulose 40-50 45-50
Hemicellulose 15-35 10-25
Lignin 18-25 25-35
Extractives 1-5 3-8
Ash 0.4-0.8 0.2-0.5
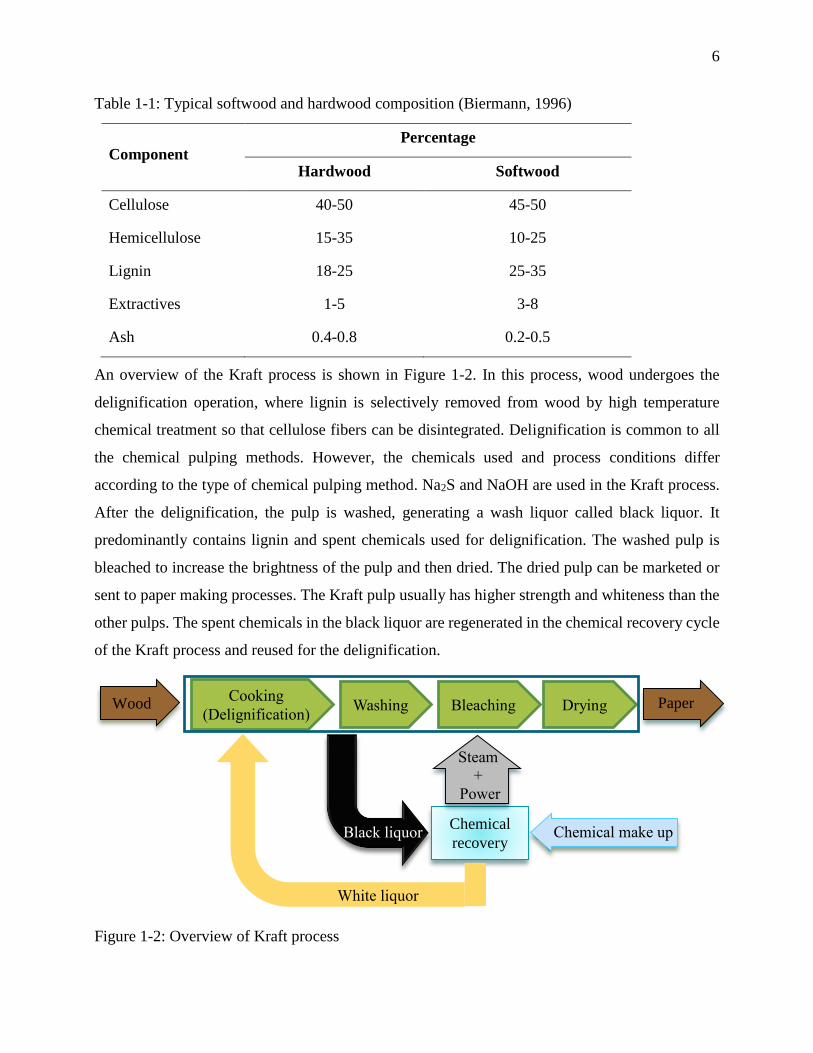
An overview of the Kraft process is shown in Figure 1-2. In this process, wood undergoes the
delignification operation, where lignin is selectively removed from wood by high temperature
chemical treatment so that cellulose fibers can be disintegrated. Delignification is common to all
the chemical pulping methods. However, the chemicals used and process conditions differ
according to the type of chemical pulping method. Na2S and NaOH are used in the Kraft process.
After the delignification, the pulp is washed, generating a wash liquor called black liquor. It
predominantly contains lignin and spent chemicals used for delignification. The washed pulp is
bleached to increase the brightness of the pulp and then dried. The dried pulp can be marketed or
sent to paper making processes. The Kraft pulp usually has higher strength and whiteness than the
other pulps. The spent chemicals in the black liquor are regenerated in the chemical recovery cycle
of the Kraft process and reused for the delignification.
Figure 1-2: Overview of Kraft process
Chemical
recovery
Wood Paper
pulp
Steam
+
Power
Black liquor
White liquor
Cooking
(Delignification) Washing Bleaching Drying
Chemical make up
7
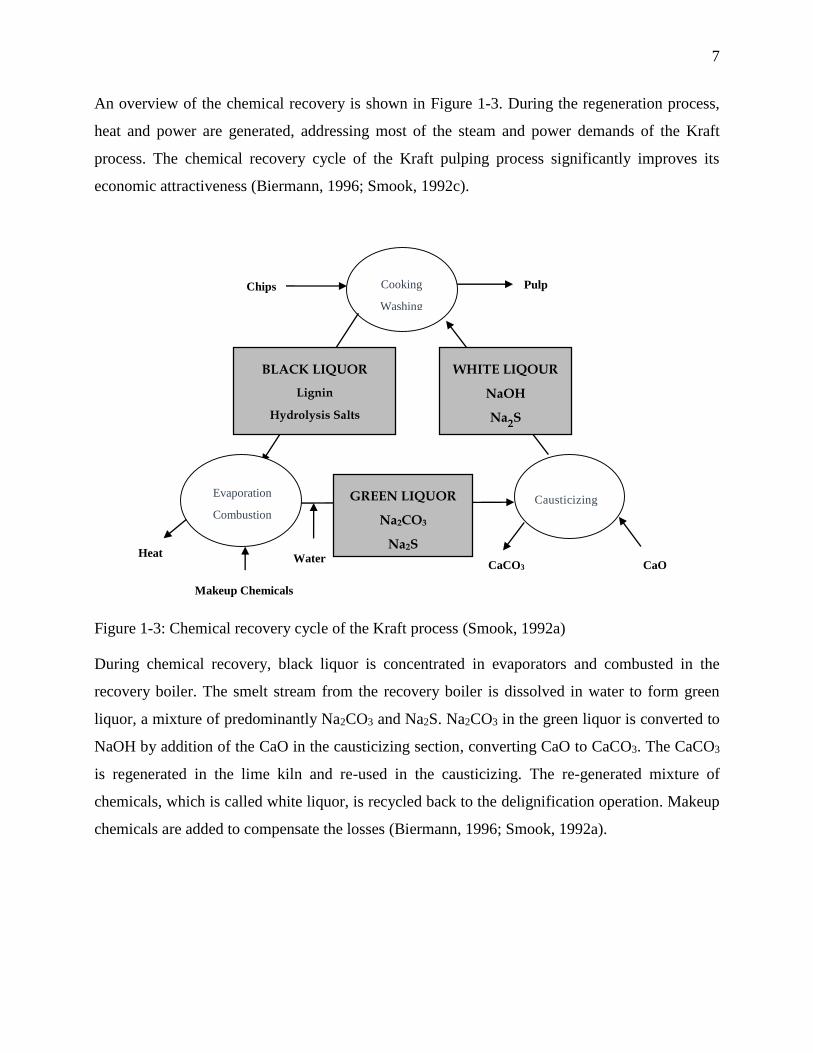
An overview of the chemical recovery is shown in Figure 1-3. During the regeneration process,
heat and power are generated, addressing most of the steam and power demands of the Kraft
process. The chemical recovery cycle of the Kraft pulping process significantly improves its
economic attractiveness (Biermann, 1996; Smook, 1992c).
Figure 1-3: Chemical recovery cycle of the Kraft process (Smook, 1992a)
During chemical recovery, black liquor is concentrated in evaporators and combusted in the
recovery boiler. The smelt stream from the recovery boiler is dissolved in water to form green
liquor, a mixture of predominantly Na2CO3 and Na2S. Na2CO3 in the green liquor is converted to
NaOH by addition of the CaO in the causticizing section, converting CaO to CaCO3. The CaCO3
is regenerated in the lime kiln and re-used in the causticizing. The re-generated mixture of
chemicals, which is called white liquor, is recycled back to the delignification operation. Makeup
chemicals are added to compensate the losses (Biermann, 1996; Smook, 1992a).
Pulp Cooking
Washing
Chips
BLACK LIQUOR
Lignin
Hydrolysis Salts
Sulfonation Products
WHITE LIQOUR
NaOH
Na2S
Makeup Chemicals
Heat
Evaporation
Combustion
Water
GREEN LIQUOR
Na2CO3
Na2S
CaO
Causticizing
CaCO3
8
1.4 Kraft Pulping Mill as an Integrated Biorefinery
Van Heiningen (2006) proposed the conversion of Kraft pulping mills to integrated forest
biorefineries (IFBR), which produce novel biomaterials and chemicals in addition to traditional
pulp and paper products. Kraft pulping mills have yields of about 50% or slightly lower, because
more than half of the wood input is dissolved in spent liquor. The dissolved fraction is mainly
hemicellulose and lignin and they are utilized for low value combustion in the recovery boiler. The
conversion of hemicellulose and lignin to higher value components can improve the competiveness
and profitability of Kraft pulping mills operating with traditional pulp and paper commodities as
the key products.
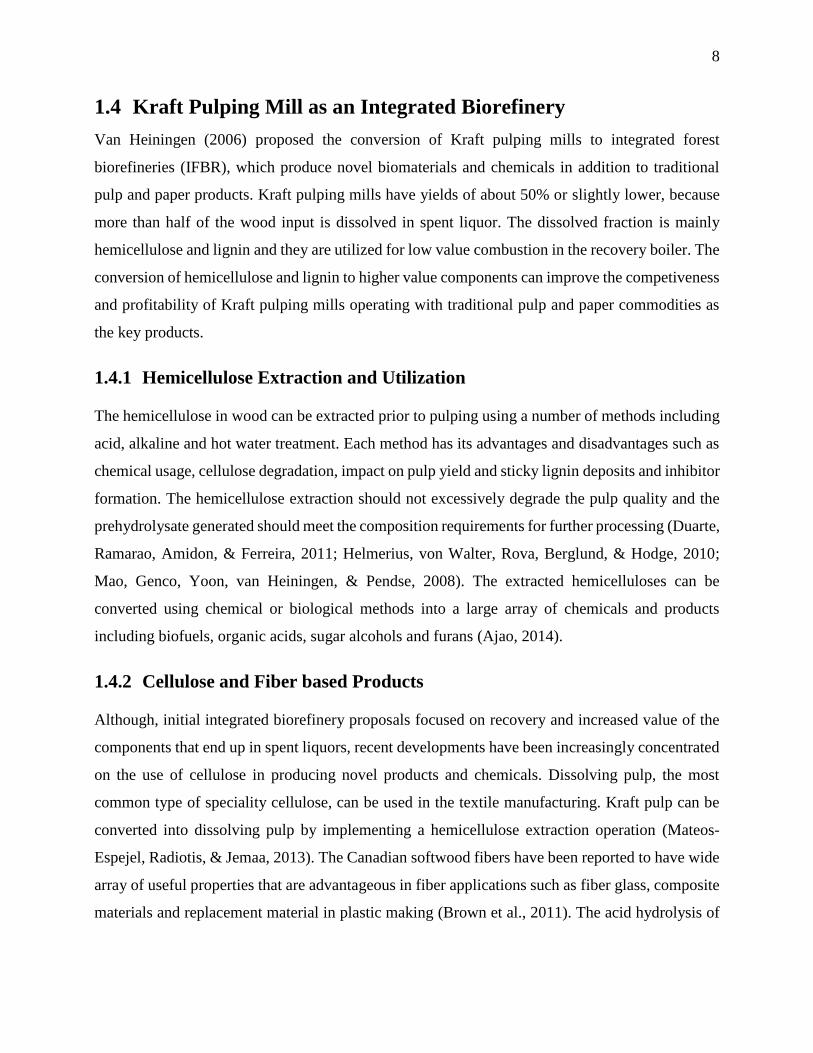
1.4.1 Hemicellulose Extraction and Utilization
The hemicellulose in wood can be extracted prior to pulping using a number of methods including
acid, alkaline and hot water treatment. Each method has its advantages and disadvantages such as
chemical usage, cellulose degradation, impact on pulp yield and sticky lignin deposits and inhibitor
formation. The hemicellulose extraction should not excessively degrade the pulp quality and the
prehydrolysate generated should meet the composition requirements for further processing (Duarte,
Ramarao, Amidon, & Ferreira, 2011; Helmerius, von Walter, Rova, Berglund, & Hodge, 2010;
Mao, Genco, Yoon, van Heiningen, & Pendse, 2008). The extracted hemicelluloses can be
converted using chemical or biological methods into a large array of chemicals and products
including biofuels, organic acids, sugar alcohols and furans (Ajao, 2014).
1.4.2 Cellulose and Fiber based Products
Although, initial integrated biorefinery proposals focused on recovery and increased value of the
components that end up in spent liquors, recent developments have been increasingly concentrated
on the use of cellulose in producing novel products and chemicals. Dissolving pulp, the most
common type of speciality cellulose, can be used in the textile manufacturing. Kraft pulp can be
converted into dissolving pulp by implementing a hemicellulose extraction operation (Mateos-
Espejel, Radiotis, & Jemaa, 2013). The Canadian softwood fibers have been reported to have wide
array of useful properties that are advantageous in fiber applications such as fiber glass, composite
materials and replacement material in plastic making (Brown et al., 2011). The acid hydrolysis of
9
Kraft pulp can liberate nanocrystalline cellulose (NCC), which can be used in enhancing the
properties of mixtures and composite materials (Xu, Q. et al., 2013).
1.4.3 Energy and Water for Kraft mill Forest Biorefineries
Most of the Canadian pulp mills are old and therefore have higher water and energy consumption
than modern mills. The median energy consumption of Canadian bleached Kraft pulp mill is 16.27
GJ/ODt while it is 8.6 GJ/ODt for a modern mill (Natural-Resources-Canada, 2006). Therefore,
most of the Canadian mills have considerable energy savings potential facilitated by internal energy
and water recovery and, upgrading older equipment. The water consumption is related to the energy
consumption of the plant. Reducing steam consumption will eventually reduce the water
consumption. Therefore, apart from the standard steam and water saving methods such as internal
heat recovery, water systems closure, equipment performance analysis and energy upgrading,
studies also focused on combined methods of water and energy saving, which led to significant
steam and water savings (Keshthkar, 2013; Savulescu, Kim, & Smith, 2005).
Due to high potential energy and water savings in Kraft pulping mills, there have been many efforts
to internally supply the energy and water requirements of biorefinery plants. Marinova et al. (2009)
suggested combined energy efficiency improvement strategies to provide the energy requirement
for a biorefinery based on hemicellulose extraction. They used internal heat recovery, water
systems closure, condensate recovery and absorption heat pump integration as energy saving
strategies and managed to save 5.04 GJ/ADT energy. It has been shown that net steam demand
increase can be reduced from 48 to 3 MW using process integration when near-neutral
hemicellulose extraction is implemented in Scandinavian Kraft pulping mill (Lundberg, Axelsson,
Mahmoudkhani, & Berntsson, 2012).
Similarly, energy optimization techniques have been suggested to save energy when lignin
extracted from black liquor (Olsson, Axelsson, & Berntsson, 2006). Process integrated
evaporation, which is to use available heat in the Kraft process to heat up the evaporated, have been
used to create steam surplus in the process. There have been studies based on the improvements in
condensers and in evaporator section to create an energy surplus (Wising, Algehed, Berntsson, &
Delin, 2006). More efficient condensing turbines were used for electricity production. All these
studies have a common element (resolving pinch violations) to optimize the heat exchanger
network and to save energy.
10
1.4.4 Lignin Extraction from Black Liquor
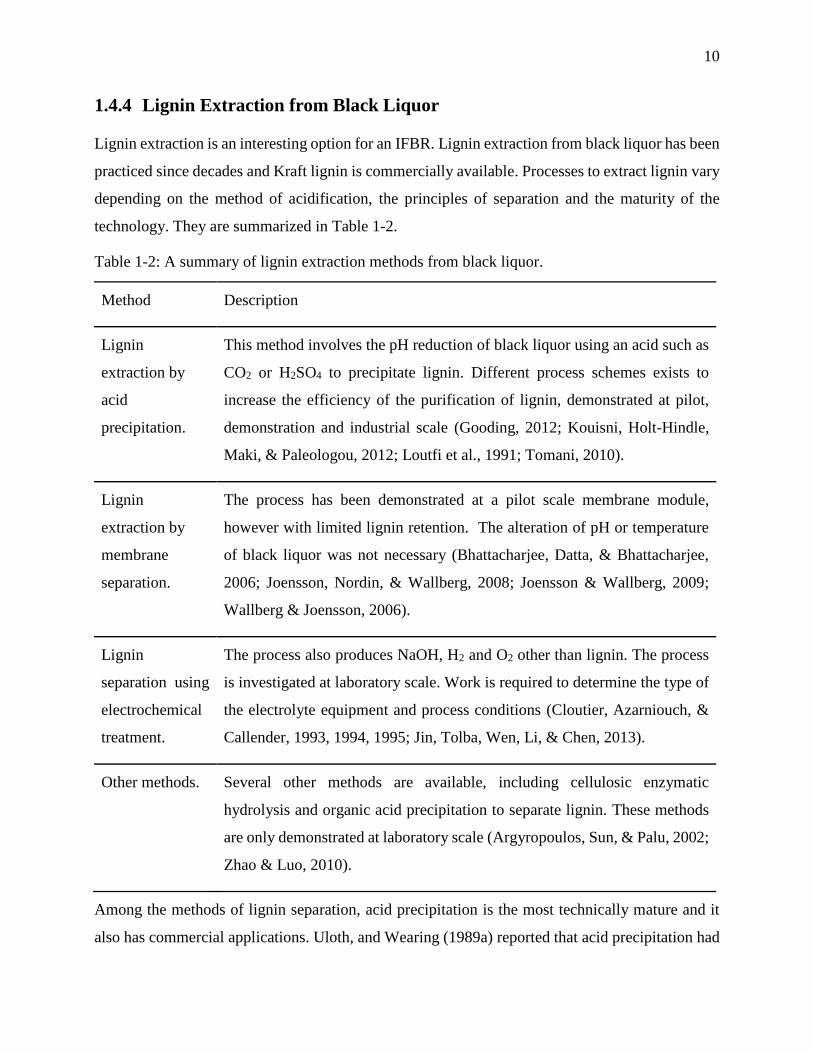
Lignin extraction is an interesting option for an IFBR. Lignin extraction from black liquor has been
practiced since decades and Kraft lignin is commercially available. Processes to extract lignin vary
depending on the method of acidification, the principles of separation and the maturity of the
technology. They are summarized in Table 1-2.
Table 1-2: A summary of lignin extraction methods from black liquor.
Method Description
Lignin
extraction by
acid
precipitation.
This method involves the pH reduction of black liquor using an acid such as
CO2 or H2SO4 to precipitate lignin. Different process schemes exists to
increase the efficiency of the purification of lignin, demonstrated at pilot,
demonstration and industrial scale (Gooding, 2012; Kouisni, Holt-Hindle,
Maki, & Paleologou, 2012; Loutfi et al., 1991; Tomani, 2010).
Lignin
extraction by
membrane
separation.
The process has been demonstrated at a pilot scale membrane module,
however with limited lignin retention. The alteration of pH or temperature
of black liquor was not necessary (Bhattacharjee, Datta, & Bhattacharjee,
2006; Joensson, Nordin, & Wallberg, 2008; Joensson & Wallberg, 2009;
Wallberg & Joensson, 2006).
Lignin
separation using
electrochemical
treatment.
The process also produces NaOH, H2 and O2 other than lignin. The process
is investigated at laboratory scale. Work is required to determine the type of
the electrolyte equipment and process conditions (Cloutier, Azarniouch, &
Callender, 1993, 1994, 1995; Jin, Tolba, Wen, Li, & Chen, 2013).
Other methods. Several other methods are available, including cellulosic enzymatic
hydrolysis and organic acid precipitation to separate lignin. These methods
are only demonstrated at laboratory scale (Argyropoulos, Sun, & Palu, 2002;
Zhao & Luo, 2010).
Among the methods of lignin separation, acid precipitation is the most technically mature and it
also has commercial applications. Uloth, and Wearing (1989a) reported that acid precipitation had
11
higher lignin yield and lower capital and operating costs in comparison to ultrafiltration. The
impurities were also lower in the lignin extracted by acid precipitation. Lignin extraction by
electrolysis is also an attractive process which has several benefits such as production of NaOH,
H2 and O2 (Cloutier et al., 1993). Apart from direct lignin extraction, black liquor upgrading into
different components such as gasification to syngas and pyrolysis to aromatics have also been
reported in the literature (Maciel, Job, Mussel, & Pasa, 2012; Preto, Zhang, & Wang, 2008; St.
Pierre, Duran, & van Heiningen, 2015).
1.4.5 Recovery Boiler Debottlenecking and Pulp Production Increase
Many relatively old Kraft pulping mills have been increasing their pulp production, but this is
limited because they reach the maximum thermal capacity of the recovery boiler. By removing a
fraction of organic load to the recovery boiler, the heat load can be reduced thereby debottlenecking
the recovery boiler for additional pulp production capacity. Removal of heat load is more effective
with lignin extraction due to its high calorific value, however, debottlenecking with hemicellulose
extraction is also a possibility (Mao, Genco, Heiningen, et al., 2008). The early lignin extraction
projects, therefore, were focused on incremental pulp production by recovery debottlenecking and
combusting the recovered lignin in biomass boiler or lime kiln (Uloth & Wearing, 1989b)
1.4.6 Lignin Applications
Lignin has been used in industrial applications since decades. The first commercial lignins were
the lignosulfonates from sulfite pulping industry. It was mainly used as additive to animal feed and
road dust suppressant. After sulfite pulps were mostly replaced by Kraft mills, the use of Kraft
lignin increased. Kraft lignin is the dominant portion of commercial lignin today, making up 89%
of the total production. The current applications of Kraft lignin are as rubber reinforcers, activated
carbon, carbon black substitute and phenolic resin component. The main producer of Kraft lignin
in world market is the MeadWestvaco Corporation. Lignin is also obtained as a byproduct of
organosolv pulping, called organosolv lignin (Kamm, Gruber, & Kamm, 2006).
Lignin has the potential to be used as carbon black substitute in rubber products, particularly in tire
manufacturing. Lignin, after carbonization, has similar properties to carbon black in terms of
structure and thermal conductance (Gindl-Altmutter et al., 2015; Snowdon, Mohanty, & Misra,
2014). The industrial carbon black prices vary between 1200 and 2200 US$/t, depending on the
12
application. Assuming lignin can be provided at 750 – 1000 US$/t price range, the north American
tire manufacturing industry has the capacity to absorb 1 million tons of lignin per year (Brown et
al., 2011).
Lignin can be used to partly replace the phenol in phenol-formaldehyde resins, which is used as an
adhesive in wood composite applications. For plywood, lignin can replace up to 50% of phenol
component. Kraft lignin can be converted to phenol-formaldehyde resins by copolymerization with
phenol and formaldehyde in the presence of sodium hydroxide (Abdelwahab & Nassar, 2011;
Danielson & Simonson, 1998). The use of lignin for phenol also reduces the formaldehyde
consumption, providing added cost benefit. The phenol prices are in the range of 1,000-2,000
US$/t, with a North American demand of about 350,000 t/a for resin applications, this corresponds
to lignin phenol-formaldehyde resin demand of 105,000 t/a at 30% substitution (Brown et al.,
2011).
The use of lignin as a pre-curser for carbon fiber is, perhaps, the most investigated topic of the
lignin applications in recent years. The carbon fibers are currently manufactured using petroleum
derived polyacrylonitrile (PAN). The high cost of PAN has prohibited the wide spread use of
carbon fibers, limiting their applications to most specialized uses that include aerospace, wind
turbines, high end vehicles and sporting goods. Lignin can be used to produce carbon fibers by
utilizing the melt spinning process and it has advantages over PAN in terms of structure,
stabilization, carbon content and yield (Chien-Wei Chen, 2014; Norgren & Edlund, 2014).
Moreover, supplying lignin as low cost PAN substitute will increase the demand, promoting the
use of carbon fibers in low cost applications such as automobiles. Use of carbon fiber in automotive
parts is highly desirable as it significantly increases the fuel economy due to light weight (Brown
et al., 2011; Frank, Steudle, Ingildeev, Sporl, & Buchmeiser, 2014). The industry goal for
producing lignin as carbon fiber precursor have been estimated at 1100 US$/t for PAN substitution,
although current costs of lignin production is higher (Chien-Wei Chen, 2014).
The applications described above are considered as most promising, however, lignin has a wider
variety of applications, for which the development is currently at preliminary level. Several
researchers (Saito et al., 2013; Yang & Ragauskas, 2012) showed the feasibility of producing
polyurethane thermoplastics and foams using lignin. Further applications from lignin include
carbon nanotubes, waste water purification, bioplastics, nanocomposites, absorbents,
13
emulsification agents (He, He, Yang, & Lu, 2013; Norgren & Edlund, 2014; Stewart, 2008; Zhou,
Qiu, Yang, Lou, & Ouyang, 2007).
1.4.7 The Properties of Lignin
The properties of lignin have been reported in terms of composition, structure including functional
groups, thermal properties such as glass transition temperature, molecular weight, polydispersity
and surface properties (Norgren & Edlund, 2014; Saake & Lehnen, 2000; Stewart, 2008). The
required properties greatly depend on the application. Extensive research on the production of
lignin carbon fibers have resulted in a preliminary set of required specifications for lignin feedstock
and it is considered the most stringent conditions among the lignin applications. These
specifications are shown in Table 1-3.
Table 1-3: The specifications of lignin feedstock for carbon fiber production as defined by Oak
Ridge National Laboratory (ORNL) (Baker, 2011; Luo, Genco, Cole, & Fort, 2011)
Specification Value
Ash content < 0.1%
Lignin content > 99%
Volatile material < 5 wt% measured at 250°C
Particulate matter (none melting) < 500 ppm (greater than 1 µm diameter)
Apart from these specifications, higher molecular weight with lower polydispersity is preferable
for carbon fiber manufacture. The commercial Kraft lignin manufacturing processes have focused
on reducing the lignin ash content, which mainly depends on the efficiency of the lignin washing
step. They were able to reduce ash contents to below 0.1% by using improved washing techniques
(Kouisni et al., 2012; Tomani, 2013).
1.5 Aggregation of Lignin in Aqueous Solutions
During the delignification step of the Kraft process, the aryl ether bond cleavages between lignin
structures are attacked by hydrogen sulfide ions at high alkalinities, releasing Kraft lignin
fragments. These lignin structures are soluble at high pH values due to dissociation of the phenolic
14
groups. The molecular weight of Kraft lignin can be in the range of ~150 - 200,000 (Gellerstedt &
Henriksson, 2008; Norgren, Edlund, & Wågberg, 2002). The pKa values of lignin phenol groups
are in the range of 6.2 – 11.3, depending on the type and pattern of the phenolic structures (Ragnar,
Lindgren, & Nilvebrant, 2000). Moreover, the apparent pKa value of Kraft lignin molecules have
been reported to be dependent on their molecular weight.(Norgren & Lindstrom, 2000b)
The colloidal stability of lignin in black liquor is maintained by the surface charges of lignin
molecules, which exist due to dissociated phenolic and carboxyl groups at highly alkaline
conditions. As the pH decreases, some of the phenolic groups get protonated, reducing the surface
charge, destabilizing the colloidal system, leading to lignin aggregation. This phenomena is
governed by the Derjaguin-Landau-Verwey-Overbeek (DLVO) theory, which describe the
colloidal stability as a balance between electrical double layer (EDL) force and van der Waals
attraction force.(Norgren et al., 2002; Norgren, Edlund, Wågberg, Lindström, & Annergren, 2001)
1.5.1 Aggregate Kinetics and Structure
High molecular Kraft lignin fragments, which form lignin macromolecules, are reported to be
compact and spherical due to their cross linked structures. When the solution conditions worsen
(increase of ionic strength or reduction of pH), they aggregate to form colloids particles or nuclei.
The nuclei grow in size and number with time, forming final fractal lignin structures (Norgren et
al., 2002). The aggregate structure of numerous materials have been found to be dependent on
kinetics of aggregation based on two well defined regimes, diffusion limited cluster-cluster
aggregation (DLCA) and reaction limited cluster-cluster aggregation (RLCA) (Lin et al., 1989).
During DLCA, the repulsion forces between colloids are negligible, leading to rapid aggregation
upon contact, forming loose and highly disordered structures. In RLCA regime, substantial
repulsions between colloidal particles are present, making particles to collide several times before
aggregating. More denser and compact aggregates are formed in RLCA regime. However, it should
be noted that these regimes are defined for perikinetic aggregation, in which the particle collisions
occur due to Brownian motion, and they are not strictly valid for orthokinetic aggregation, where
particle collisions occur due to turbulence.
Norgren et al observed that lignin aggregation occur in both RLCA and DLCA regimes, depending
on the solution conditions (Norgren et al., 2002). Figure 1-4 shows a Cryo-TEM image of a DLCA
lignin aggregate with fractal dimension (df) of ~1.9 (Norgren & Edlund, 2014). These aggregates
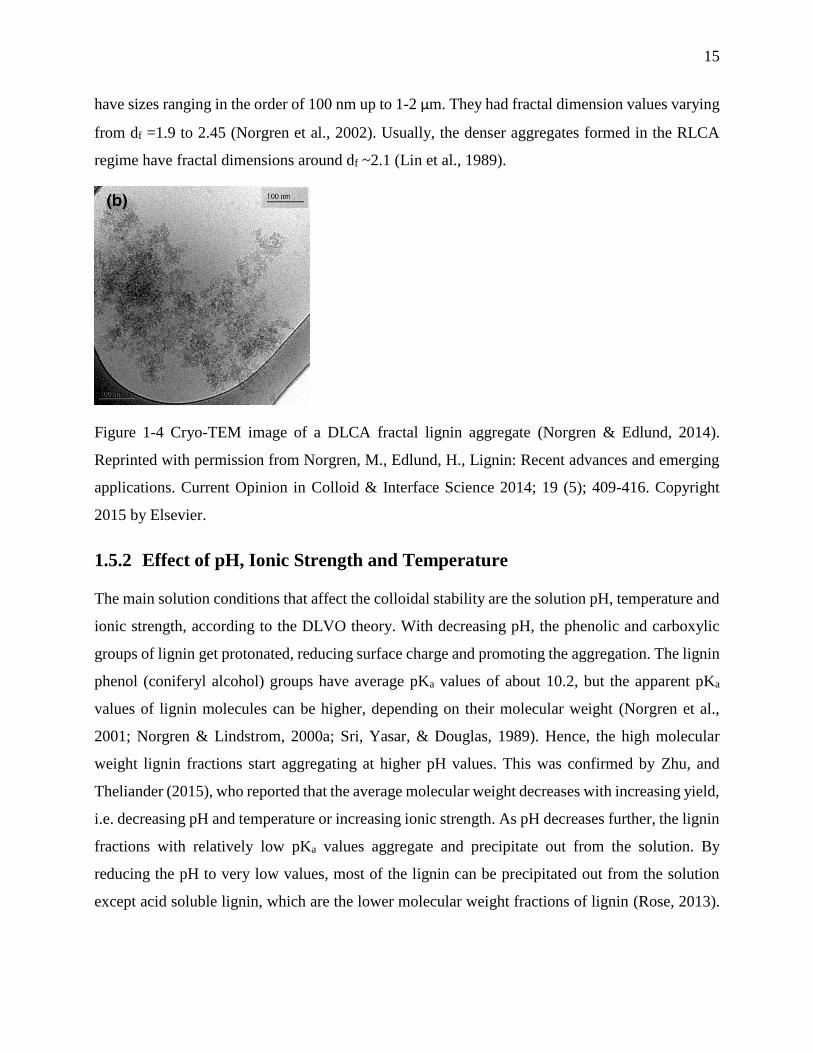
15
have sizes ranging in the order of 100 nm up to 1-2 µm. They had fractal dimension values varying
from df =1.9 to 2.45 (Norgren et al., 2002). Usually, the denser aggregates formed in the RLCA
regime have fractal dimensions around df ~2.1 (Lin et al., 1989).
Figure 1-4 Cryo-TEM image of a DLCA fractal lignin aggregate (Norgren & Edlund, 2014).
Reprinted with permission from Norgren, M., Edlund, H., Lignin: Recent advances and emerging
applications. Current Opinion in Colloid & Interface Science 2014; 19 (5); 409-416. Copyright
2015 by Elsevier.
1.5.2 Effect of pH, Ionic Strength and Temperature
The main solution conditions that affect the colloidal stability are the solution pH, temperature and
ionic strength, according to the DLVO theory. With decreasing pH, the phenolic and carboxylic
groups of lignin get protonated, reducing surface charge and promoting the aggregation. The lignin
phenol (coniferyl alcohol) groups have average pKa values of about 10.2, but the apparent pKa
values of lignin molecules can be higher, depending on their molecular weight (Norgren et al.,
2001; Norgren & Lindstrom, 2000a; Sri, Yasar, & Douglas, 1989). Hence, the high molecular
weight lignin fractions start aggregating at higher pH values. This was confirmed by Zhu, and
Theliander (2015), who reported that the average molecular weight decreases with increasing yield,
i.e. decreasing pH and temperature or increasing ionic strength. As pH decreases further, the lignin
fractions with relatively low pKa values aggregate and precipitate out from the solution. By
reducing the pH to very low values, most of the lignin can be precipitated out from the solution
except acid soluble lignin, which are the lower molecular weight fractions of lignin (Rose, 2013).
16
The isoelectric point of Kraft lignin have been reported to be around pH 1.0 (Dong, Fricke,
Moudgil, & Johnson, 1996).
Norgren et al. (2002) observed that Kraft lignin (Indulin AT) solutions reached the critical
coagulation concentration at 1.3 M ionic strength (in terms of NaCl) for a pH of 10.5 and
temperature of 70°C. The solubility of lignin decreases with increasing ionic strength and this
promotes aggregation by increasing the quantity of precipitated lignin (Evstigneev, 2011;
Theliander, 2010). Better aggregation of colloids in higher ionic strength solutions is due to the
compression of the electrical double layer (EDL), which results in reduced electrostatic repulsion
force. The thickness of the EDL is defined by the Debye length, which is inversely proportional to
ion concentration and the valence of the electrolytes (Norgren et al., 2001).
The dissociation of a solute usually increases with increasing temperature. However, temperature
also increases the dissociation of water increasing hydrogen ion concentration. This enhances the
protonation of weakly dissociating lignin phenol groups, thus reducing the net dissociation and the
surface charges. As a result, the pKa values of lignin molecules increases with increasing
temperature (Norgren et al., 2001) Although, higher pKa values promotes aggregation, higher
thermal energy content in EDL can increase the electrostatic repulsion forces, improving colloidal
stability and lignin solubility (Lee, Stack, Richardson, Lewis, & Garnier, 2012). Increase in lignin
solubility with increasing temperature has been reported (Evstigneev, 2011; Theliander, 2010; Zhu,
Westman, & Theliander, 2014).
1.6 Acid Precipitation Process
Lignin recovery using acid precipitation has been practised for a long time. First patents for a
process for acidification of black liquor and separation of lignin were proposed in 1940s
(Tomlinson & Tomlinson, 1948). Numerous aspects of the process have since been investigated
including, the yield, filtration and purification (Alen, Patja, & Sjöström, 1979; Kim, Hill, & Fricke,
1987; Uloth & Wearing, 1989b). The first detailed preliminary process designs, that can be found
in the literature, were proposed by Loutfi et al. (1991). Their design included black liquor oxidation
to minimize H2S emissions, acidification with CO2 to pH 8.5 to precipitate lignin particles, slurry
ageing, slurry cooling and filtration and washing of the filter cake with H2SO4 and water. The lignin
yield was 70% and the produced lignin had 1.5 % by wt. Na content. The motives of early lignin
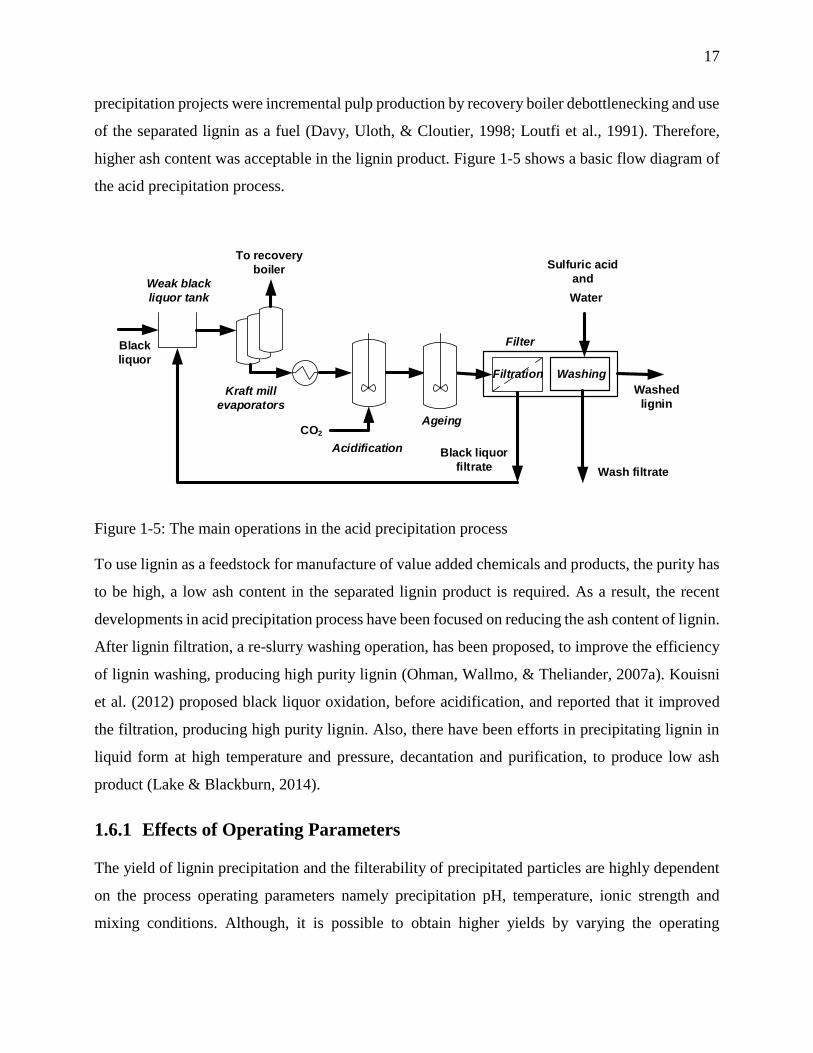
17
precipitation projects were incremental pulp production by recovery boiler debottlenecking and use
of the separated lignin as a fuel (Davy, Uloth, & Cloutier, 1998; Loutfi et al., 1991). Therefore,
higher ash content was acceptable in the lignin product. Figure 1-5 shows a basic flow diagram of
the acid precipitation process.
Black
liquor
Weak black
liquor tank
Kraft mill
evaporators
Acidification
To recovery
boiler
CO2
Sulfuric acid
and
Water
Washed
lignin
Ageing
Filtration Washing
Filter
Wash filtrate
Black liquor
filtrate
Figure 1-5: The main operations in the acid precipitation process
To use lignin as a feedstock for manufacture of value added chemicals and products, the purity has
to be high, a low ash content in the separated lignin product is required. As a result, the recent
developments in acid precipitation process have been focused on reducing the ash content of lignin.
After lignin filtration, a re-slurry washing operation, has been proposed, to improve the efficiency
of lignin washing, producing high purity lignin (Ohman, Wallmo, & Theliander, 2007a). Kouisni
et al. (2012) proposed black liquor oxidation, before acidification, and reported that it improved
the filtration, producing high purity lignin. Also, there have been efforts in precipitating lignin in
liquid form at high temperature and pressure, decantation and purification, to produce low ash
product (Lake & Blackburn, 2014).
1.6.1 Effects of Operating Parameters
The yield of lignin precipitation and the filterability of precipitated particles are highly dependent
on the process operating parameters namely precipitation pH, temperature, ionic strength and
mixing conditions. Although, it is possible to obtain higher yields by varying the operating
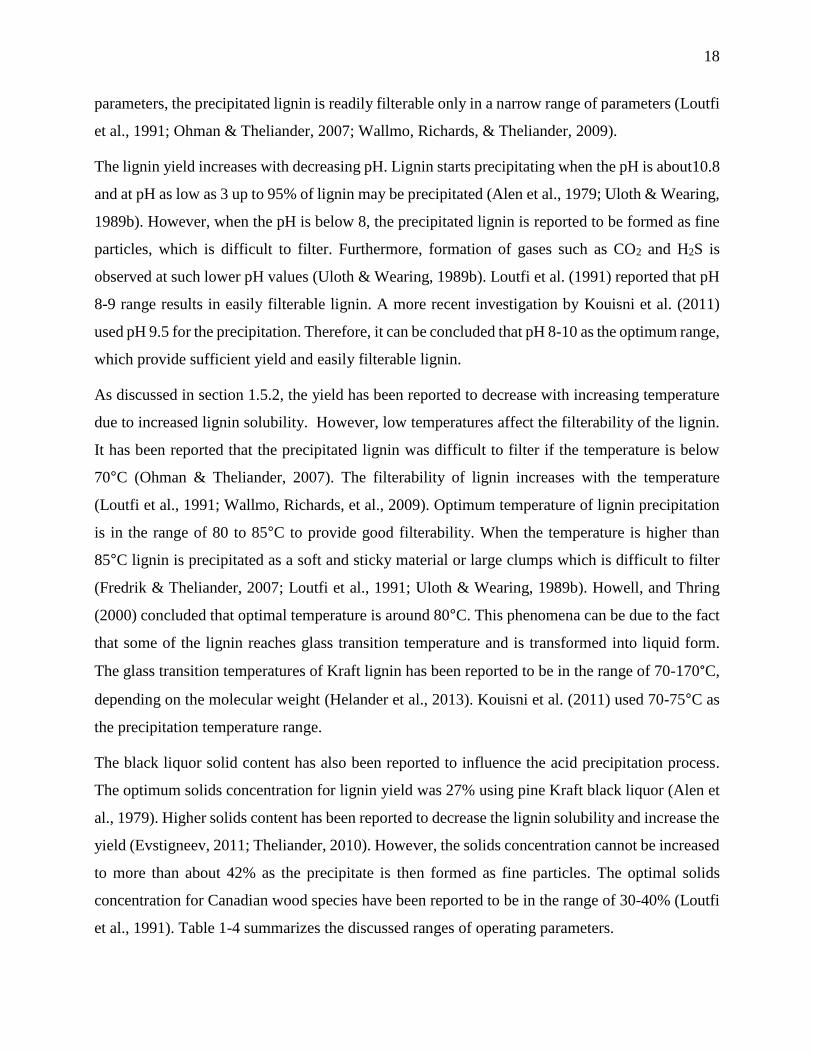
18
parameters, the precipitated lignin is readily filterable only in a narrow range of parameters (Loutfi
et al., 1991; Ohman & Theliander, 2007; Wallmo, Richards, & Theliander, 2009).
The lignin yield increases with decreasing pH. Lignin starts precipitating when the pH is about10.8
and at pH as low as 3 up to 95% of lignin may be precipitated (Alen et al., 1979; Uloth & Wearing,
1989b). However, when the pH is below 8, the precipitated lignin is reported to be formed as fine
particles, which is difficult to filter. Furthermore, formation of gases such as CO2 and H2S is
observed at such lower pH values (Uloth & Wearing, 1989b). Loutfi et al. (1991) reported that pH
8-9 range results in easily filterable lignin. A more recent investigation by Kouisni et al. (2011)
used pH 9.5 for the precipitation. Therefore, it can be concluded that pH 8-10 as the optimum range,
which provide sufficient yield and easily filterable lignin.
As discussed in section 1.5.2, the yield has been reported to decrease with increasing temperature
due to increased lignin solubility. However, low temperatures affect the filterability of the lignin.
It has been reported that the precipitated lignin was difficult to filter if the temperature is below
70°C (Ohman & Theliander, 2007). The filterability of lignin increases with the temperature
(Loutfi et al., 1991; Wallmo, Richards, et al., 2009). Optimum temperature of lignin precipitation
is in the range of 80 to 85°C to provide good filterability. When the temperature is higher than
85°C lignin is precipitated as a soft and sticky material or large clumps which is difficult to filter
(Fredrik & Theliander, 2007; Loutfi et al., 1991; Uloth & Wearing, 1989b). Howell, and Thring
(2000) concluded that optimal temperature is around 80°C. This phenomena can be due to the fact
that some of the lignin reaches glass transition temperature and is transformed into liquid form.
The glass transition temperatures of Kraft lignin has been reported to be in the range of 70-170°C,
depending on the molecular weight (Helander et al., 2013). Kouisni et al. (2011) used 70-75°C as
the precipitation temperature range.
The black liquor solid content has also been reported to influence the acid precipitation process.
The optimum solids concentration for lignin yield was 27% using pine Kraft black liquor (Alen et
al., 1979). Higher solids content has been reported to decrease the lignin solubility and increase the
yield (Evstigneev, 2011; Theliander, 2010). However, the solids concentration cannot be increased
to more than about 42% as the precipitate is then formed as fine particles. The optimal solids
concentration for Canadian wood species have been reported to be in the range of 30-40% (Loutfi
et al., 1991). Table 1-4 summarizes the discussed ranges of operating parameters.
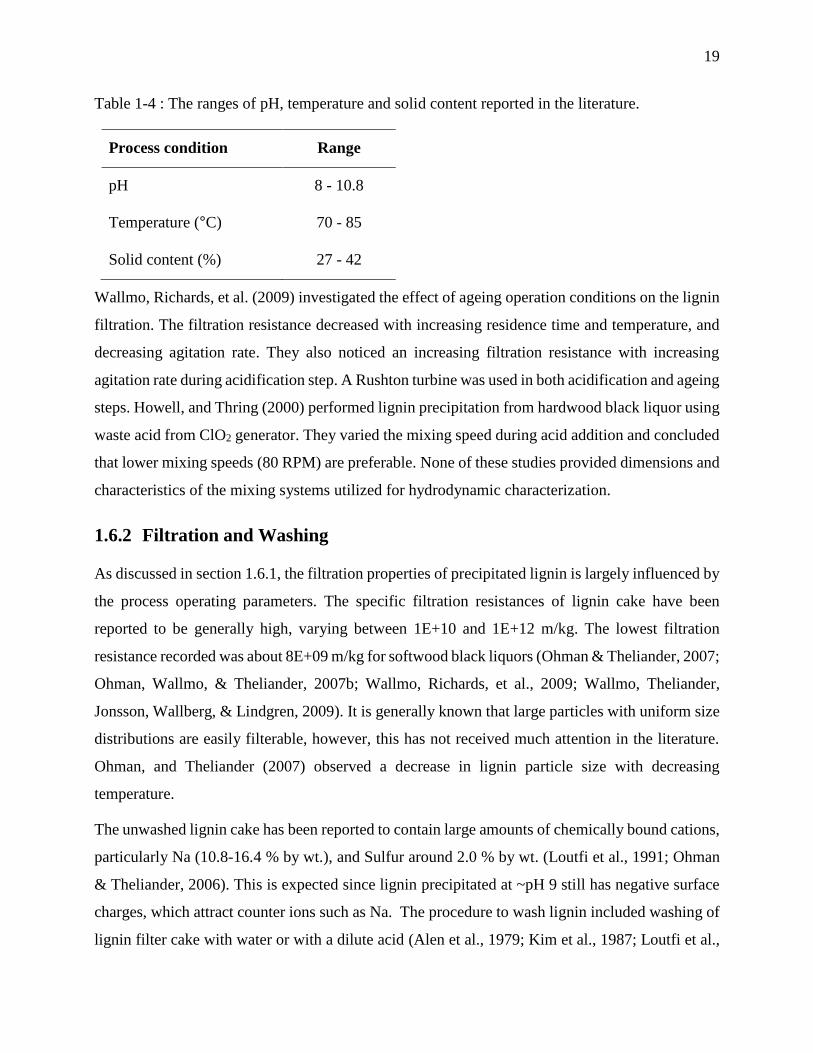
19
Table 1-4 : The ranges of pH, temperature and solid content reported in the literature.
Process condition Range
pH 8 - 10.8
Temperature (°C) 70 - 85
Solid content (%) 27 - 42
Wallmo, Richards, et al. (2009) investigated the effect of ageing operation conditions on the lignin
filtration. The filtration resistance decreased with increasing residence time and temperature, and
decreasing agitation rate. They also noticed an increasing filtration resistance with increasing
agitation rate during acidification step. A Rushton turbine was used in both acidification and ageing
steps. Howell, and Thring (2000) performed lignin precipitation from hardwood black liquor using
waste acid from ClO2 generator. They varied the mixing speed during acid addition and concluded
that lower mixing speeds (80 RPM) are preferable. None of these studies provided dimensions and
characteristics of the mixing systems utilized for hydrodynamic characterization.
1.6.2 Filtration and Washing
As discussed in section 1.6.1, the filtration properties of precipitated lignin is largely influenced by
the process operating parameters. The specific filtration resistances of lignin cake have been
reported to be generally high, varying between 1E+10 and 1E+12 m/kg. The lowest filtration
resistance recorded was about 8E+09 m/kg for softwood black liquors (Ohman & Theliander, 2007;
Ohman, Wallmo, & Theliander, 2007b; Wallmo, Richards, et al., 2009; Wallmo, Theliander,
Jonsson, Wallberg, & Lindgren, 2009). It is generally known that large particles with uniform size
distributions are easily filterable, however, this has not received much attention in the literature.
Ohman, and Theliander (2007) observed a decrease in lignin particle size with decreasing
temperature.
The unwashed lignin cake has been reported to contain large amounts of chemically bound cations,
particularly Na (10.8-16.4 % by wt.), and Sulfur around 2.0 % by wt. (Loutfi et al., 1991; Ohman
& Theliander, 2006). This is expected since lignin precipitated at ~pH 9 still has negative surface
charges, which attract counter ions such as Na. The procedure to wash lignin included washing of
lignin filter cake with water or with a dilute acid (Alen et al., 1979; Kim et al., 1987; Loutfi et al.,
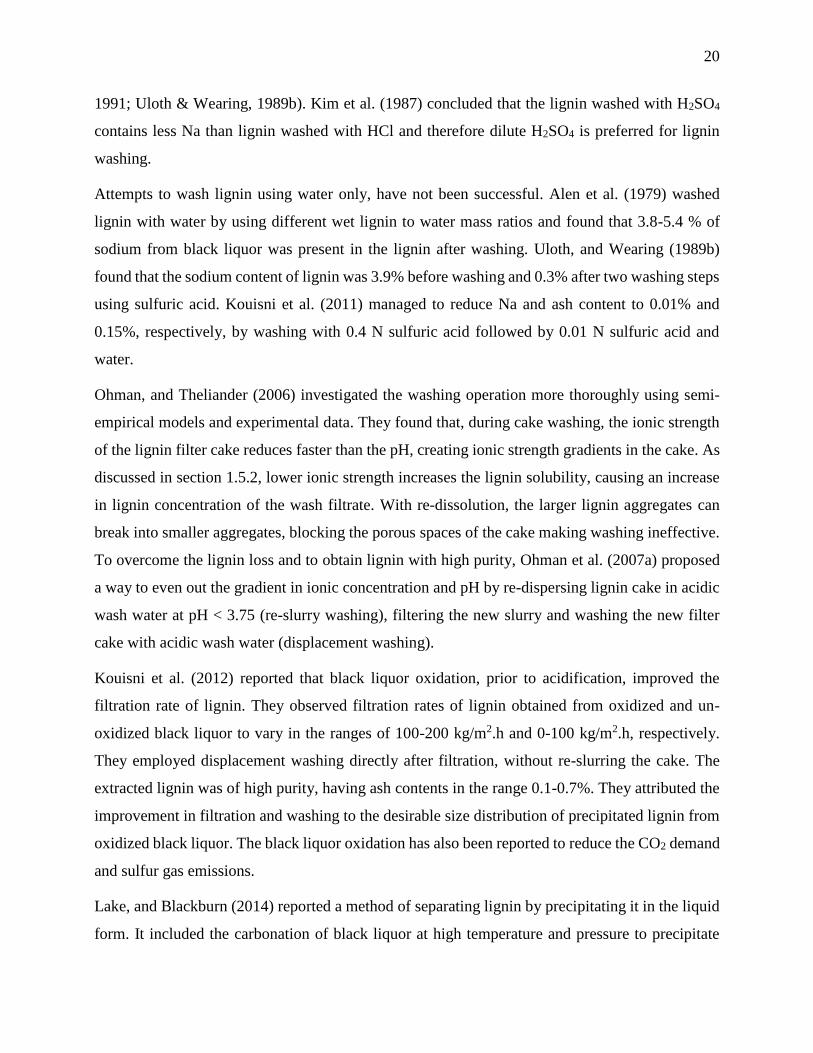
20
1991; Uloth & Wearing, 1989b). Kim et al. (1987) concluded that the lignin washed with H2SO4
contains less Na than lignin washed with HCl and therefore dilute H2SO4 is preferred for lignin
washing.
Attempts to wash lignin using water only, have not been successful. Alen et al. (1979) washed
lignin with water by using different wet lignin to water mass ratios and found that 3.8-5.4 % of
sodium from black liquor was present in the lignin after washing. Uloth, and Wearing (1989b)
found that the sodium content of lignin was 3.9% before washing and 0.3% after two washing steps
using sulfuric acid. Kouisni et al. (2011) managed to reduce Na and ash content to 0.01% and
0.15%, respectively, by washing with 0.4 N sulfuric acid followed by 0.01 N sulfuric acid and
water.
Ohman, and Theliander (2006) investigated the washing operation more thoroughly using semi-
empirical models and experimental data. They found that, during cake washing, the ionic strength
of the lignin filter cake reduces faster than the pH, creating ionic strength gradients in the cake. As
discussed in section 1.5.2, lower ionic strength increases the lignin solubility, causing an increase
in lignin concentration of the wash filtrate. With re-dissolution, the larger lignin aggregates can
break into smaller aggregates, blocking the porous spaces of the cake making washing ineffective.
To overcome the lignin loss and to obtain lignin with high purity, Ohman et al. (2007a) proposed
a way to even out the gradient in ionic concentration and pH by re-dispersing lignin cake in acidic
wash water at pH < 3.75 (re-slurry washing), filtering the new slurry and washing the new filter
cake with acidic wash water (displacement washing).
Kouisni et al. (2012) reported that black liquor oxidation, prior to acidification, improved the
filtration rate of lignin. They observed filtration rates of lignin obtained from oxidized and un-
oxidized black liquor to vary in the ranges of 100-200 kg/m2.h and 0-100 kg/m2.h, respectively.
They employed displacement washing directly after filtration, without re-slurring the cake. The
extracted lignin was of high purity, having ash contents in the range 0.1-0.7%. They attributed the
improvement in filtration and washing to the desirable size distribution of precipitated lignin from
oxidized black liquor. The black liquor oxidation has also been reported to reduce the CO2 demand
and sulfur gas emissions.
Lake, and Blackburn (2014) reported a method of separating lignin by precipitating it in the liquid
form. It included the carbonation of black liquor at high temperature and pressure to precipitate
21
lignin entirely in liquid form and reacting liquid lignin phase with sulfuric acid at pH 2-3 to
converting liquid lignin into large solid particles. The solid lignin particles were filtered and
washed with acid to reduce ash content. The ash content of the final lignin was around 1%.
1.6.3 Commercially Available Versions of the Process
MeadWestvaco has been producing Kraft lignin under the commercial name Indulin®. The
production of Indulin® reported is about 60 000 tons annually, with ash content of about 1.6%
(Luo et al., 2011; Smolarski, 2012). The recent efforts in producing high quality lignin have
resulted in several other process versions, which are commercially available.
The LignoBoostTM process employs the re-slurry stage (discussed in section 1.6.2) to produce low
ash lignin. This process has been reported to generate lignin with 0.01-1% ash content and currently
operates at demonstration and industrial scale (Tomani, 2013). The LignoForceTM process employs
a black liquor oxidation technology and it has been reported to produce lignin with 0.1-0.7% ash
content. It currently operates at demonstration scale (Kouisni et al., 2012; VanCaeseele, 2014). The
SLRPTM (Sequential Liquid-Lignin Recovery and Purification) process utilizes a liquid lignin
precipitation method. This process has been reported to operate at pilot scale in a continuous mode
and produces lignin at 1% ash content. It was reported to require less capital and operating costs
than the LignoBoostTM process (Gooding, 2012; Lake & Blackburn, 2014).
1.7 Implementation of Acid Precipitation Process in Kraft Pulping
Mills
The acid precipitation process can be implemented within the multiple effect evaporator train of
the Kraft mill liquor cycle, as shown in Figure 1-5. It receives black liquor usually at 30-40% solids
content. After precipitation, the lignin lean black liquor filtrate and wash filtrates are recycled back.
The lignin removal, chemical losses and additions and water addition, have been reported to have
impacts on mill balances and operations (Vakkilainen & Valimaki, 2009; Wising et al., 2006). This
is discussed in details in the following sections.
22
1.7.1 Impact on the Recovery boiler and Production Increase
Valimaki, Niemi, and Haaga (2010 ) found that the hearth heat release rate (HHRR) and adiabatic
temperature (Tad) of the recovery boiler are the critical parameters which determine the extent of
feasible lignin extraction. They reported estimated reduction of higher heating value (HHV) of
black liquor from 14.0 to 12.0 MJ/kg at 70% lignin extraction. To maintain the lowest limits for
HHRR (2.5 MW/m2) and Tad (1450°C), the lignin extraction should not exceed 50%. The steam
generation was reduced by 20% due to lower heat load to the recovery boiler. When the heat load
was maintained at fixed value with a production increase of 25% to keep the steam production
constant, the smelt flow rate from the recovery boiler was the limiting factor for a 50% lignin
extraction. Vakkilainen, and Valimaki (2009) found that at 40% lignin removal, the superheating
limit of the recovery boiler was reached and the minimum load that recovery boiler can run
corresponds to 50% lignin removal. They reported an estimated reduction of HHV of black liquor
from 14.1 to 9.9 MJ/kg at 90% lignin extraction. However, the lower furnace of the recovery boiler
starts running with difficulties from a level of 30% lignin removal. They also studied the increase
of the black liquor flow rate into recovery boiler (production increase) and concluded that 60% of
lignin removal can be achieved before the superheating limit of the recovery boiler is reached.
Hamaguchi, and Vakkilainen (2010) reported an estimated reduction of HHV of black liquor from
14.3 to 13.1 MJ/kg at 30% lignin extraction and this reduced the steam production of the recovery
boiler by 21%. It has been reported that the minimum HHV of black liquor for efficient recovery
boiler operation falls in the range of 12.5 to 12.8 MJ/kg for Canadian Kraft pulping mills, allowing
lignin extraction of 46-66 t/d from a softwood Kraft pulping mill with capacity of 400 adt/d (Benali
et al., 2014; Perin-Levasseur, Z., Savulescu, & Benali, 2011). Loutfi et al. (1991) reported a
maximum 9.5% lignin extraction ratio, which corresponds to 57 t/d lignin removal from a mill
running at 770 adt/d capacity.
Vakkilainen, and Valimaki (2009) and Hamaguchi, and Vakkilainen (2010) reported that the air
requirement and flue gas production decreases with decreasing HHV, allowing more black liquor
to be burned at lower HHV. This eliminates the need of significant retrofits in flue gas side of the
recovery boilers burning lignin lean black liquor at higher flow rates.
23
It has to be emphasized that the above reported lignin extraction ratios and HHV reduction should
not be taken as absolute values but rather as trends, since those values are dependent on the black
liquor composition.
1.7.2 Impacts on the Evaporator Train
The multiple effect evaporator steam demand has been reported to increase when the wash filtrates
from the acid precipitation process are recycled. Hamaguchi, and Vakkilainen (2010) estimated
this to be 3% increase at 30% lignin extraction for LignoboostTM process. The viscosity of black
liquor has been reported to reduce with lignin removal, with reductions up to 90% can be achieved
at solids contents above 40% (Moosavifar, Sedin, & Theliander, 2009; Moosavifar, Sedin, &
Theliander, 2006). A viscosity decrease in the range 10-90% can lead to increase in heat transfer
coefficients of about 4-124 %, thus making positive reductions in heat transfer surface areas. A
decrease in boiling point elevation has also been observed at low lignin contents. Therefore,
reduction in viscosity and boiling point elevation could lead to possible lower heat transfer area in
the evaporators, thus increasing the available capacities.
Benali et al. (2014) reported the increase in inorganics components (Na2CO3 and Na2SO4) in black
liquor, which can result in increased fouling. They suggested careful monitoring of carbonate to
sulfate ratios and critical solids concentrations in the evaporator train during lignin precipitation.
1.7.3 Impacts on Mill Total Energy Balance
As discussed in sections 1.7.1 and 1.7.2, the lignin extraction decreases recovery boiler steam
production and increases the evaporator train steam demand. Hamaguchi, and Vakkilainen (2010)
performed an energy balance on a modern Kraft pulping mill with integrated lignin precipitation
process. They estimated a 21% reduction in recovery boiler steam generation with 10.2% increase
in recovery boiler capacity in terms of total solids flow, for 30% lignin extraction. The electricity
production decreased by 54 MW. In a separate study, (Olsson et al., 2006) reported 19-30%
decrease in mill power generation, when lignin corresponding to 326-500 GWh/a was removed.
1.7.4 Impacts on Chemical Balance
The implementation of an acid precipitation process in a Kraft pulping mill have been reported to
disrupt the sodium and sulfur (Na/S) balance of the liquor cycle (Loutfi et al., 1991; Tomani, 2010;
24
Wising et al., 2006). The precipitated lignin contains significant amount of Na ranging from 10.2
to 16.4% by wt., removal of Na is achieved by washing with acid (Loutfi et al., 1991; Ohman &
Theliander, 2006). The wash filtrates contain large amounts of Na, which needs to be recycled back
to the liquor cycle. However, the total sulfur in wash filtrates can exceed the mill sulfur
requirement, thus disrupting the sulfur balance.
Wising et al. (2006) reported that the re-alkalization of spent liquor from an acid precipitation
process would be necessary before returning it to evaporators as low alkali content, which can
result in increased black liquor viscosity. They suggested that re-alkalizing of spent liquor with
white liquor, which increases the processing demand in the lime kiln. (Axelsson, Olsson, &
Berntsson, 2006) and (Loutfi et al., 1991) discussed the impact of acid precipitation process on a
Kraft mill chemical balance and suggested that the sulfur added from the wash filtrates can be best
purged from the Kraft mill as recovery boiler electrostatic precipitator (ESP) dust. To make up for
the Na loss, NaOH has to be added. Loutfi et al. (1991) suggested adding Na2CO3 to compensate
for Na loss, however with an increase in causticizing section loading.
Benali et al. (2014) discussed the changes in the black liquor chemical composition resulting from
the implementation of the acid precipitation process, predicting impacts on the evaporator train.
However, mill wide chemical balances have not been performed. None of the above studies
provided detailed Na/S balance estimates to evaluate the chemical additions, purges and changes
in the loads to chemical recovery operations.
1.8 Process integration opportunities within Kraft process
The lignin extraction reduces the steam production in the recovery boiler and increase evaporator
steam demand, creating net energy deficit in the Kraft process, unless the mill has a surplus of
energy. Moreover, the acid precipitation process requires chemicals (CO2 and H2SO4) and water to
operate. This section discusses the reported work on mass and energy integration of acid
precipitation with the receptor Kraft pulping mill.
1.8.1 Energy Integration
The energy optimization technologies, including pinch analysis, have been utilized to identify the
potential energy savings in the Kraft pulping mills to address energy deficits created by lignin
25
removal. Laaksometsä, Axelsson, Berntsson, and Lundström (2009) showed that energy savings
of 4.2 GJ/adt identified by pinch analysis was sufficient to provide increased energy demands
created by lignin extraction, in an eucalyptus Kraft pulping mill. Olsson et al. (2006) compared
lignin extraction versus increased power generation to export surplus steam from a Kraft pulping
mill. They concluded that lignin has to be priced above traditional biofuel use in order to be
competitive. Benali et al. (2014) showed that steam demand can increase by 27%, depending of
the amount of lignin extracted and the pulp production increase. They proposed 14.1 MW steam
savings, based on pinch analysis to address the increased demand, for a Canadian Kraft pulping
mill. Hamaguchi, and Vakkilainen (2010) proposed steam production increase in biomass boiler to
address the energy deficits created by lignin extraction.
1.8.2 Water and Chemical Integration
The water demand in the acid precipitation process is mainly earned by lignin washing and cooling
of the incoming black liquor. Benali et al. (2014) estimated this to be 2.5% increase in total water
demand for a 50 t/d lignin plant. They obtained 14.8% savings in water consumption by applying
water pinch analysis, demonstrating the feasibility of internal water supply.
1.8.2.1 Internal CO2 supply
Several studies suggested that the cost of CO2 is the largest operating cost of the lignin precipitation
plant and therefore using flue gas from lime kiln or recovery boiler to supply CO2 for the
precipitation process could improve its economics (Loutfi et al., 1991; Olsson et al., 2006; Tomani,
Axegard, Berglin, Lovell, & Nordgren, 2011). Benali et al. (2014) analyzed CO2 capture from flue
gases using monoethanolamine (MEA) for lignin precipitation and concluded that the operating
costs were prohibitive ($17 million/a). The annualized capital costs varied from 4,980 – 1,531,000
$/a without considering the flue gas cleaning and supplementary equipment costs. The carbon
capture process proposals, found in the literature, have been economically evaluated at the scale of
power plants, which emit large quantities of CO2. The lignin plants have capacities of about 50 t/d
with 12-15 t/d CO2 demand. Therefore, the differences in economies of scale have to be taken into
account during the analysis.
Wallmo, Richards, et al. (2009) concluded that the use of pure CO2 is not essential for precipitation.
They conducted studies with CO2 mixtures at 99.7%, 50%, 15% concentrations and observed
26
variations in acidification kinetics. When 99.7% CO2 is used, it took around 25 min to reach pH 9
while it took around 60 min to reach pH 9 when 50% CO2 is used. They did not observe differences
in filtration resistance of lignin cakes precipitated with dilute CO2. The cake washing or economic
analysis have not been performed.
1.8.2.2 Internal H2SO4 supply
ClO2 is required by most bleaching sequences of the mills that produce bleached pulp. Due to
highly unstable nature of ClO2 it is usually produced on site. It is manufactured by reduction of
sodium chlorate (NaClO3) with suitable reducing agent in a concentrated acidic medium. Some
variations of the process produce Generator Waste Acid (GWA), which consist of H2SO4 and
Na2SO4. Several studies suggest the use GWA for lignin precipitation (Davy et al., 1998; Howell
& Thring, 2000). These studies consider the use of GWA for precipitation operation and not for
the washing as it contains considerable amounts of Na2SO4. The use of GWA for acidification of
black liquor is limited by the availability as well as impact on the Na/S balance.
Addition of GWA to black liquor can easily exceed the limit of sulfur in the liquor cycle. This
forces a purge of additional sulfur and consequently increases caustic demand. Therefore, the
recent studies and commercially available processes use CO2 for black liquor acidification (Kouisni
et al., 2012; Lake & Blackburn, 2014; Ohman & Theliander, 2006; Ohman et al., 2007a;
Theliander, Ohman, Axegard, & Tomani, 2005). The use of salt cake or GWA can be an interesting
option to provide H2SO4 for lignin washing, although, it needs to be purified. Several commercial
processes are available for purification of GWA (Cloutier & Beaudoin, 2014; NORAM-
Engineering, 2015).
27
1.9 Critical Review
As discussed in the presented literature review, there is considerable amount of work and
knowledge available regarding the development, implementation and process integration of acid
precipitation based lignin biorefineries in Kraft pulping mills. The process development efforts
have been concentrated on analysis of lignin yield and filtration with varying operating parameters
and washing step improvement (Kouisni et al., 2012; Ohman et al., 2007a; Theliander, 2010;
Wallmo, Richards, et al., 2009). The implementation studies have focused on recovery boiler and
energy balance impacts and pulp production increase (Vakkilainen & Valimaki, 2009; Valimaki et
al., 2010 ; Wising et al., 2006) while the process integration has dealt with estimation of energy
demands and compensation using steam savings projects (Axelsson et al., 2006; Laaksometsä et
al., 2009). There is a lack of studies in the following areas.
The studies on energy balance impacts of the implementation and energy integration
potential between biorefinery and Kraft pulping mill have mostly been performed on actual
or model Scandinavian Kraft pulping mills. There is a lack of investigations assessing the
impacts lignin precipitation on the steam and power balance of the Kraft mill and addressing
the energy deficits in the Canadian context.
The disruption of the chemical balance of the liquor cycle caused by lignin precipitation
have been reported in the literature. There have been qualitative suggestions on re-adjusting
the balance. However, there is a lack of studies with detailed Na/S balance of the liquor
cycle in a Kraft mill with lignin precipitation. Furthermore, computer modeling of acid
precipitation process, which can largely assist chemical balance estimations, has not
received much attention. Also, there are no clear guidelines on balancing the Na and S of a
liquor cycle with integrated lignin biorefinery.
While, there are many studies investigating the effect of operating parameters on the
filtration and yield of acid precipitation, systematic parameter investigation has received
less attention. As a result, studies on the process optimization or parameter identification
could not be found in the literature.
The hydrodynamic conditions during colloidal aggregation and particle growth have been
reported to shape the particle size and structure in coagulation and flocculation processes.
28
However, this important aspect has not received much attention in the literature on lignin
precipitation processes. There is clearly a lack of studies investigating the effects of
hydrodynamics on lignin precipitation and, filtration and washing performances.
It has been reported that CO2 is a major operating cost factor in lignin precipitation plants.
However, there is a lack of studies determining the effects of using flue gases for the black
liquor acidification and its effect on filtration and washing. The economic attractiveness of
such proposals have not been determined.
The treatment of above mentioned points could considerably improve the design and integration
of lignin biorefineries. The success of the commercial implementation of biorefineries depends on
the cost effectiveness and environmental sustainability. Achieving that requires optimal biorefinery
design and implementation. In addition, it is required to determine the opportunities for process
integration in terms of energy and chemicals and, their profitability. This was achieved in this
thesis. The knowledge gaps identified were treated.
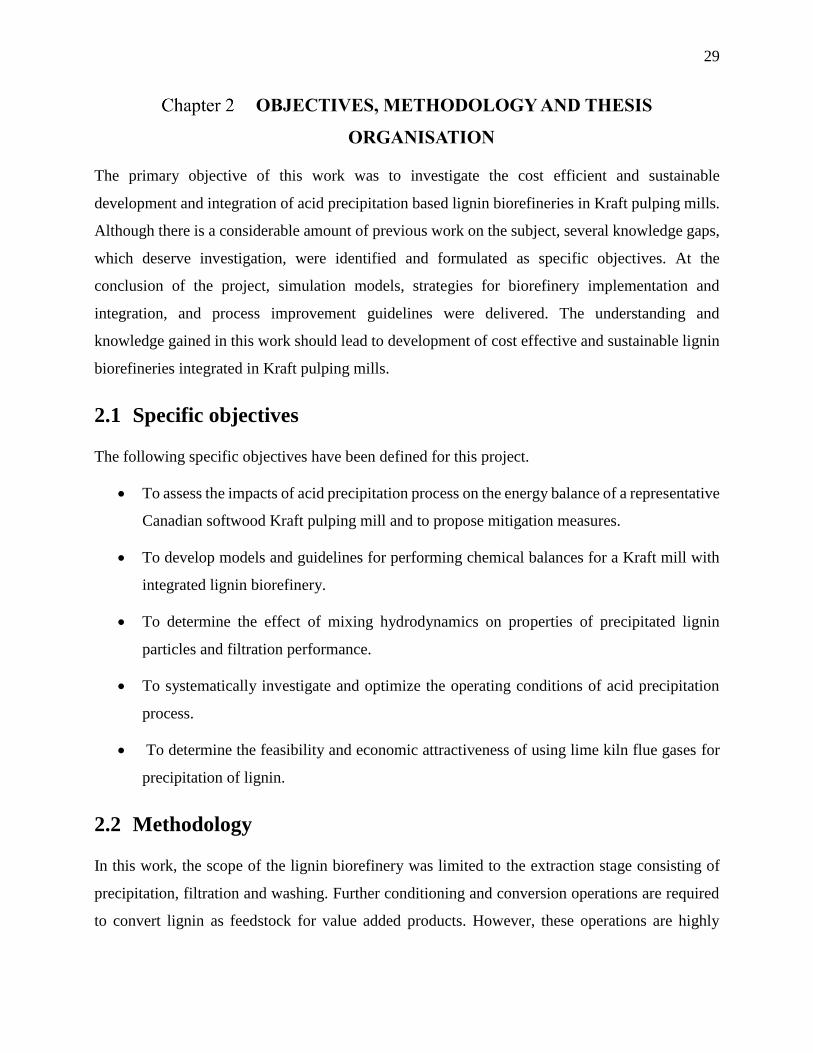
29
OBJECTIVES, METHODOLOGY AND THESIS
ORGANISATION
The primary objective of this work was to investigate the cost efficient and sustainable
development and integration of acid precipitation based lignin biorefineries in Kraft pulping mills.
Although there is a considerable amount of previous work on the subject, several knowledge gaps,
which deserve investigation, were identified and formulated as specific objectives. At the
conclusion of the project, simulation models, strategies for biorefinery implementation and
integration, and process improvement guidelines were delivered. The understanding and
knowledge gained in this work should lead to development of cost effective and sustainable lignin
biorefineries integrated in Kraft pulping mills.
2.1 Specific objectives
The following specific objectives have been defined for this project.
To assess the impacts of acid precipitation process on the energy balance of a representative
Canadian softwood Kraft pulping mill and to propose mitigation measures.
To develop models and guidelines for performing chemical balances for a Kraft mill with
integrated lignin biorefinery.
To determine the effect of mixing hydrodynamics on properties of precipitated lignin
particles and filtration performance.
To systematically investigate and optimize the operating conditions of acid precipitation
process.
To determine the feasibility and economic attractiveness of using lime kiln flue gases for
precipitation of lignin.
2.2 Methodology
In this work, the scope of the lignin biorefinery was limited to the extraction stage consisting of
precipitation, filtration and washing. Further conditioning and conversion operations are required
to convert lignin as feedstock for value added products. However, these operations are highly
30
dependent on the final valued added product, which have not been defined in this project. Figure
2-1 shows the overall methodological approach of the project.
Lignin biorefinery and Kraft mill model development
Lignin biorefinery and Kraft mill definition
Biorefinery and Kraft mill simulation
Literature and data from industrial partners
Simulation models, implementation strategies and guidelines, and process
improvement potentials for integrated lignin biorefineries.
Experimental trials and process improvement potential analysis
Implementation and process integration evaluation
Figure 2-1 : Overall methodological approach
The data for the definition of a lignin biorefinery were obtained mainly from pilot scale lignin
precipitation trials, provided by the industrial partners. It was based on the acid precipitation
process with a single filtration and washing step. Data from literature and laboratory trials have
also been used. Simulation models for the lignin biorefinery and Kraft pulping mill were developed.
Aspen Plus®, CadsimPlus® and ExcelTM were used as simulation software. Two Kraft pulping mills
were used in the study, a representative Canadian softwood bleached Kraft pulping mill with 750
31
adt/d capacity and a softwood bleached Kraft pulping mill with 285 adt/d capacity, which is located
in eastern Canada. The biorefinery implementation has been performed according to proposed
guidelines and strategies. Process integration measures in terms of energy and chemicals were
proposed.
During the process development phase, the improvement and optimization of the process, which
leads to cost effective process designs, were experimentally investigated. All the experimental trials
were conducted at laboratory scale using up to 1.8 L black liquor quantities. The possibility of
improving lignin filtration and washing by manipulating mixing hydrodynamics has been studied.
Systematic optimization of process operating parameters to obtain higher yield and filtration
performance have been conducted. Black liquor samples from three different Canadian softwood
Kraft pulping mills were used in the experimental investigations. Fundamental understanding of
lignin aggregation and growth as well as process performance behavior were gained.
2.3 Organisation of the Thesis
The following five chapters present the results of this thesis. In chapter 3 (Article 1), the energy
impacts of implementing lignin biorefinery in Kraft pulping mill is presented. The energy deficits
and demands were quantified and mitigation measures using process integration have been
performed. This article has been published in J-FOR, The Journal of Science and Technology for
Forest Products and Processes in 2012.
Chapter 4 (Article 2) presents the process modelling and chemical balances of implementing lignin
biorefinery in a Kraft pulping mill. Process modelling of a lignin biorefinery and liquor cycle of
the Kraft mill incorporating chemical balances have been conducted. The simulation models have
been utilized in analysing the Na/S balances of the liquor cycle. Strategies and guidelines for lignin
biorefinery implementation have been proposed. This article has been submitted to Industrial
Chemistry and Engineering Research journal in July, 2015.
Chapter 5 (Article 3) treats the feasibility of improving lignin filtration by manipulation of mixing
hydrodynamics. In this article, the effects of hydrodynamic conditions during lignin precipitation
on the aggregation and growth of the lignin flocs has been investigated. Differences in size and
shape of lignin flocs, that produced considerable improvements in lignin filtration, were observed.
32
The optimal hydrodynamic conditions for aggregation and growth of lignin particles have been
defined. This article will be submitted to Chemical Engineering Research and Design journal.
Chapter 6 presents an optimization study of process operating parameters of the acid precipitation
to obtain higher filtration performance and yield. The critical operating parameters have been
identified and behavior of process performance with varying operating parameters have been
discussed. Also, the optimal ranges of operating parameters and the effect on process economics
are discussed. This chapter will be formulated as an original research paper.
Chapter 7 treats the technical feasibility and economics of using lime kiln flue gases for
precipitation step of lignin biorefinery. The feasibility have been determined for several types of
black liquor and process simulation and economic analysis have been conducted.
Chapter 8 summarizes the results of the work in general. In this chapter, connections between
different results have been made. Limitations and improvements of the current work has been
discussed.
In chapter 9, general conclusions and recommendations for future work are presented. The original
contributions have been listed.
33
ARTICLE 1: LIGNIN RECOVERY BY ACID PRECIPITATION
IN A KRAFT MILL: AN ENERGY PERSPECTIVE
Miyuru Kannangara, Mariya Marinova, Louis Fradette, Jean Paris
Research Unit on Energy Efficiency and Sustainable Development of the Forest Biorefinery,
Chemical Engineering Department, Polytechnique Montreal, C.P. 6079 succ. Centre-Ville,
Montréal (QC) Canada H3C 3A7
ABSTRACT
Lignin, which is currently burned in the Kraft mill recovery boiler, can be recovered and converted
to a broad spectrum of bio-based products using the acid precipitation process. In this process, a
part of the black liquor is extracted from the evaporator train and treated with CO2 to precipitate
the lignin. The precipitated lignin is washed with H2SO4 and water to remove impurities. Removal
of lignin and recycle of dilute liquor back to the mill affect the Kraft mill energy balance. The
objective of this study is to quantify the impact of lignin extraction on the energy balance of the
Kraft mill. The study mill is a representative Canadian bleached Kraft pulp mill with a pulp
production capacity of 750 adt/d. The acid precipitation process is based on the LignoForce
SystemTM process developed by FPInnovations. It has been implemented in the model Kraft mill,
and mass and energy balances have been performed on the integrated biorefinery plant and receptor
mill. In the case of 15% lignin extraction from the m ill, the recovery boiler steam production was
decreased by 13.5%, and evaporator steam demand was increased by 2.4%–14.6%. The steam and
power deficits created by lignin extraction were estimated. Strategies including steam reduction
measures, energy efficiency improvement, and increased use of biomass fuel have shown that
addressing energy deficits internally is possible.
KEYWORDS
Lignin, acid precipitation, Kraft mill, integration, energy balance
3.1 Introduction
Lignin is considered to be the second most abundant naturally occurring polymer on Earth. In Kraft
pulping, it is selectively removed from wood and burned in the recovery boiler to produce steam
34
and power for the process. Instead of using lignin for energy generation, it can be extracted and
converted into a broad spectrum of bio-based products such as phenolic resins and carbon fibres,
which provide higher profit margins. Furthermore, removal of lignin can serve to offload a recovery
boiler which has reached its thermal design limits, thus removing a major bottleneck to increasing
pulp production. Several liquor have been proposed, among which acid precipitation is currently
being commercialized. In this process, black liquor is acidified to precipitate lignin. Lignin is
separated and then washed with dilute sulphuric acid to remove impurities and to produce purified
lignin for further processing. Among the commercial variations of the acid precipitation process
are the LignoForceSystemTM process developed by FPInnovations and the LignoboostTM process
developed by Innventia (Kouisni et al., 2011; Tomani, 2010).
The removal of lignin reduces the HHV of black liquor and therefore decreases recovery boiler
steam production. This affects the overall steam and power balance of the mill and creates steam
and power deficits. Furthermore, recycle of dilute liquors to the mill chemical recovery system
increases the energy demand for the evaporator train (Perin-Levasseur, Z. et al., 2011; Tomani et
al., 2011; Wising et al., 2006). As measures to address these energy and power deficits, process-
integrated evaporation, steam savings based on pinch analysis, evaporator and equipment upgrades,
and use of condensing turbines have been proposed (Axelsson et al., 2006; Laaksometsä et al.,
2009; Olsson et al., 2006).
The objective of this study is to quantify the impact of lignin extraction on the energy balance of a
representative Canadian Kraft mill. Energy production is analyzed in terms of steam and power,
and strategies to address steam and power deficits are proposed.
3.2 Lignin extraction process integrated into a Kraft mill
The receptor mill under study is a representative Canadian bleached Kraft mill with a pulp
production capacity of 750 adt/d. This mill is used as the reference Kraft process for integration of
the lignin biorefinery. The digester processes softwood at a yield of 46%. Pulp is washed, bleached,
and dried to produce market pulp. Black liquor produced during washing is concentrated in a six-
effect evaporator train and combusted in the recovery boiler. Mill steam and power demands are
covered entirely by recovery-boiler and biomass-boiler energy production. High pressure steam
produced in the boilers is used to generate power for internal use in the mill. Medium- and low-
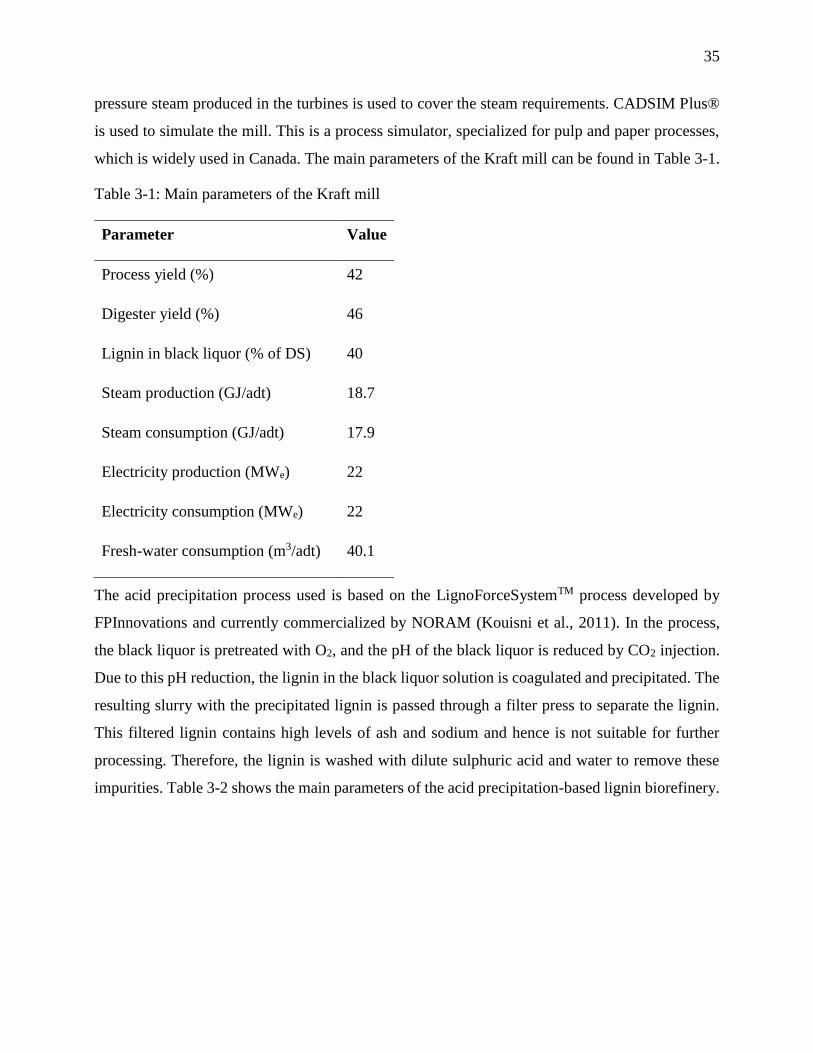
35
pressure steam produced in the turbines is used to cover the steam requirements. CADSIM Plus®
is used to simulate the mill. This is a process simulator, specialized for pulp and paper processes,
which is widely used in Canada. The main parameters of the Kraft mill can be found in Table 3-1.
Table 3-1: Main parameters of the Kraft mill
Parameter Value
Process yield (%) 42
Digester yield (%) 46
Lignin in black liquor (% of DS) 40
Steam production (GJ/adt) 18.7
Steam consumption (GJ/adt) 17.9
Electricity production (MWe) 22
Electricity consumption (MWe) 22
Fresh-water consumption (m3/adt) 40.1
The acid precipitation process used is based on the LignoForceSystemTM process developed by
FPInnovations and currently commercialized by NORAM (Kouisni et al., 2011). In the process,
the black liquor is pretreated with O2, and the pH of the black liquor is reduced by CO2 injection.
Due to this pH reduction, the lignin in the black liquor solution is coagulated and precipitated. The
resulting slurry with the precipitated lignin is passed through a filter press to separate the lignin.
This filtered lignin contains high levels of ash and sodium and hence is not suitable for further
processing. Therefore, the lignin is washed with dilute sulphuric acid and water to remove these
impurities. Table 3-2 shows the main parameters of the acid precipitation-based lignin biorefinery.
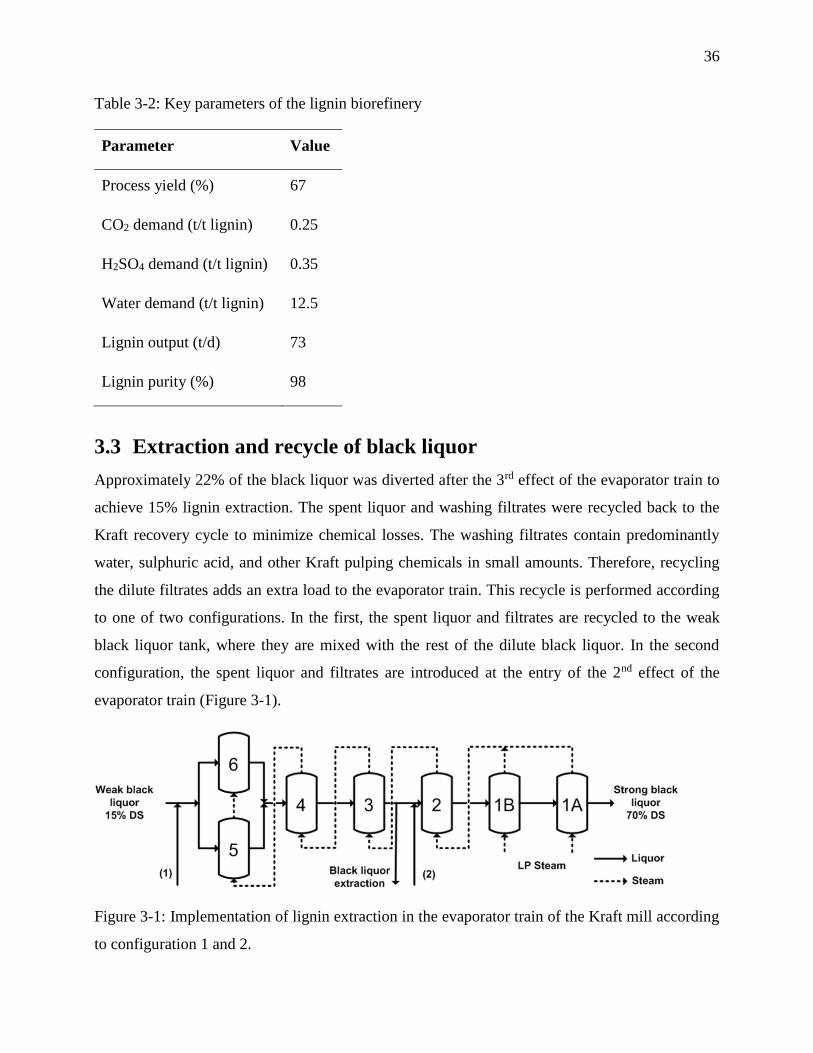
36
Table 3-2: Key parameters of the lignin biorefinery
Parameter Value
Process yield (%) 67
CO2 demand (t/t lignin) 0.25
H2SO4 demand (t/t lignin) 0.35
Water demand (t/t lignin) 12.5
Lignin output (t/d) 73
Lignin purity (%) 98
3.3 Extraction and recycle of black liquor
Approximately 22% of the black liquor was diverted after the 3rd effect of the evaporator train to
achieve 15% lignin extraction. The spent liquor and washing filtrates were recycled back to the
Kraft recovery cycle to minimize chemical losses. The washing filtrates contain predominantly
water, sulphuric acid, and other Kraft pulping chemicals in small amounts. Therefore, recycling
the dilute filtrates adds an extra load to the evaporator train. This recycle is performed according
to one of two configurations. In the first, the spent liquor and filtrates are recycled to the weak
black liquor tank, where they are mixed with the rest of the dilute black liquor. In the second
configuration, the spent liquor and filtrates are introduced at the entry of the 2nd effect of the
evaporator train (Figure 3-1).
Figure 3-1: Implementation of lignin extraction in the evaporator train of the Kraft mill according
to configuration 1 and 2.
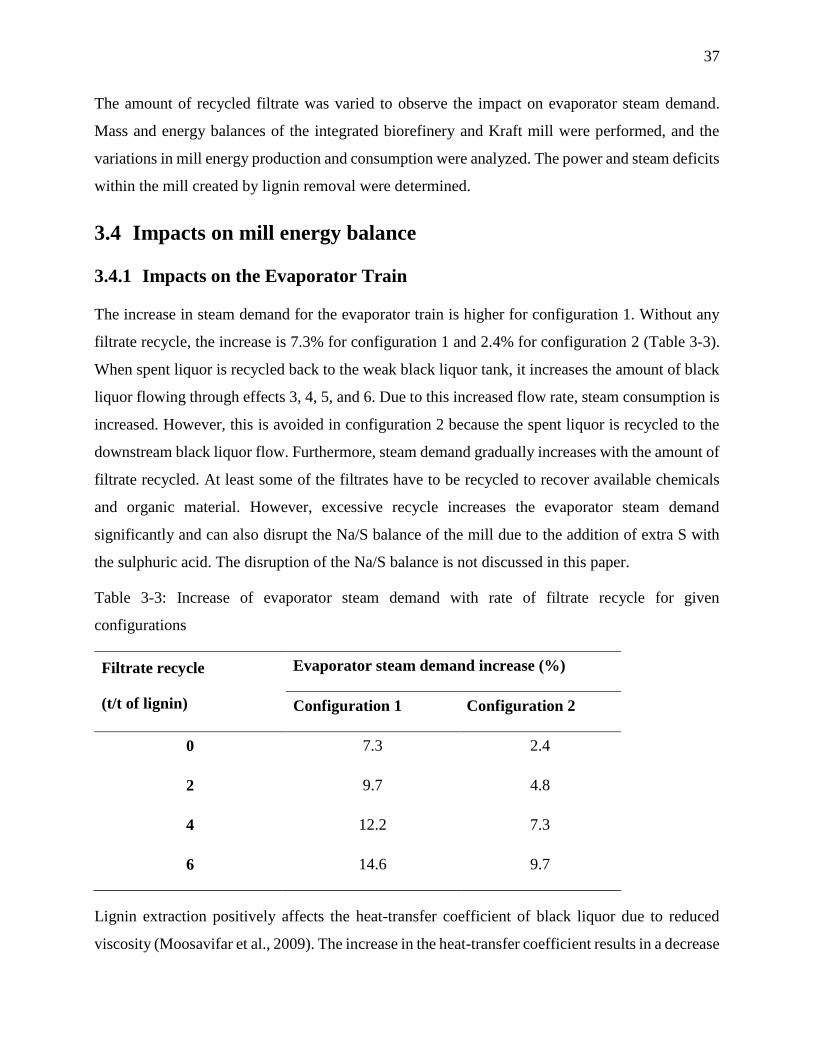
37
The amount of recycled filtrate was varied to observe the impact on evaporator steam demand.
Mass and energy balances of the integrated biorefinery and Kraft mill were performed, and the
variations in mill energy production and consumption were analyzed. The power and steam deficits
within the mill created by lignin removal were determined.
3.4 Impacts on mill energy balance
3.4.1 Impacts on the Evaporator Train
The increase in steam demand for the evaporator train is higher for configuration 1. Without any
filtrate recycle, the increase is 7.3% for configuration 1 and 2.4% for configuration 2 (Table 3-3).
When spent liquor is recycled back to the weak black liquor tank, it increases the amount of black
liquor flowing through effects 3, 4, 5, and 6. Due to this increased flow rate, steam consumption is
increased. However, this is avoided in configuration 2 because the spent liquor is recycled to the
downstream black liquor flow. Furthermore, steam demand gradually increases with the amount of
filtrate recycled. At least some of the filtrates have to be recycled to recover available chemicals
and organic material. However, excessive recycle increases the evaporator steam demand
significantly and can also disrupt the Na/S balance of the mill due to the addition of extra S with
the sulphuric acid. The disruption of the Na/S balance is not discussed in this paper.
Table 3-3: Increase of evaporator steam demand with rate of filtrate recycle for given
configurations
Filtrate recycle
(t/t of lignin)
Evaporator steam demand increase (%)
Configuration 1 Configuration 2
0 7.3 2.4
2 9.7 4.8
4 12.2 7.3
6 14.6 9.7
Lignin extraction positively affects the heat-transfer coefficient of black liquor due to reduced
viscosity (Moosavifar et al., 2009). The increase in the heat-transfer coefficient results in a decrease
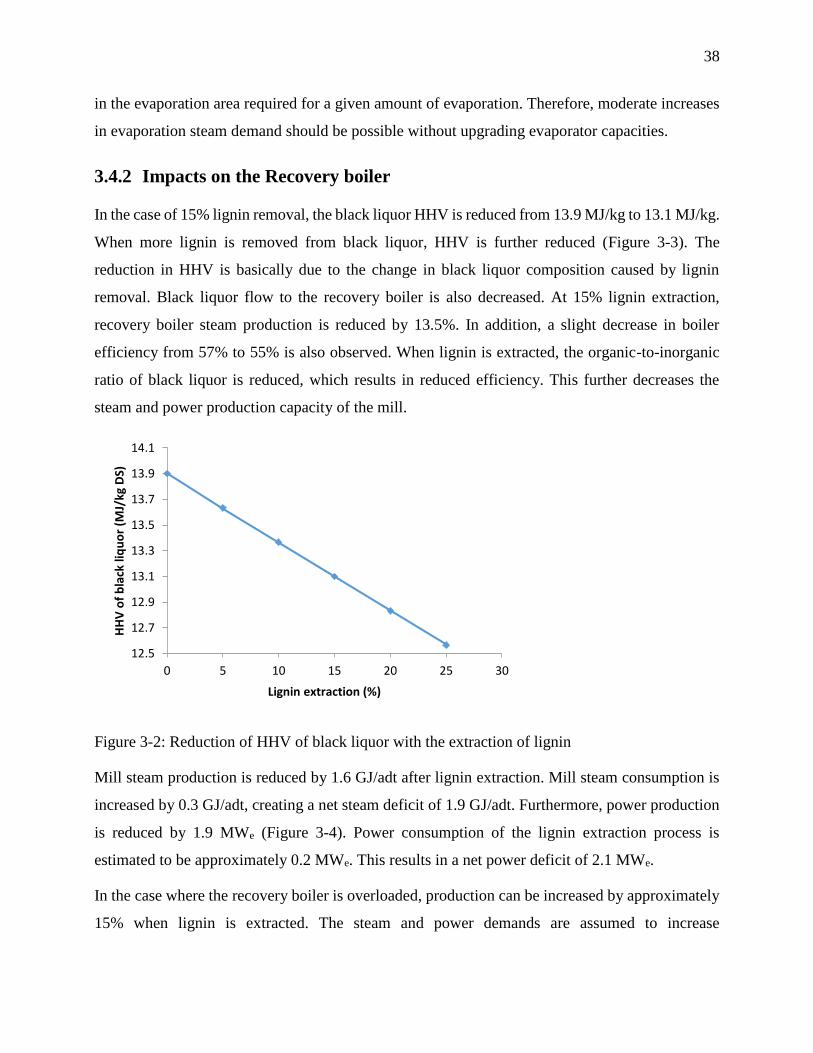
38
in the evaporation area required for a given amount of evaporation. Therefore, moderate increases
in evaporation steam demand should be possible without upgrading evaporator capacities.
3.4.2 Impacts on the Recovery boiler
In the case of 15% lignin removal, the black liquor HHV is reduced from 13.9 MJ/kg to 13.1 MJ/kg.
When more lignin is removed from black liquor, HHV is further reduced (Figure 3-3). The
reduction in HHV is basically due to the change in black liquor composition caused by lignin
removal. Black liquor flow to the recovery boiler is also decreased. At 15% lignin extraction,
recovery boiler steam production is reduced by 13.5%. In addition, a slight decrease in boiler
efficiency from 57% to 55% is also observed. When lignin is extracted, the organic-to-inorganic
ratio of black liquor is reduced, which results in reduced efficiency. This further decreases the
steam and power production capacity of the mill.
Figure 3-2: Reduction of HHV of black liquor with the extraction of lignin
Mill steam production is reduced by 1.6 GJ/adt after lignin extraction. Mill steam consumption is
increased by 0.3 GJ/adt, creating a net steam deficit of 1.9 GJ/adt. Furthermore, power production
is reduced by 1.9 MWe (Figure 3-4). Power consumption of the lignin extraction process is
estimated to be approximately 0.2 MWe. This results in a net power deficit of 2.1 MWe.
In the case where the recovery boiler is overloaded, production can be increased by approximately
15% when lignin is extracted. The steam and power demands are assumed to increase
12.5
12.7
12.9
13.1
13.3
13.5
13.7
13.9
14.1
0 5 10 15 20 25 30
HH
V o
f b
lack
liq
uo
r (M
J/kg
DS)
Lignin extraction (%)
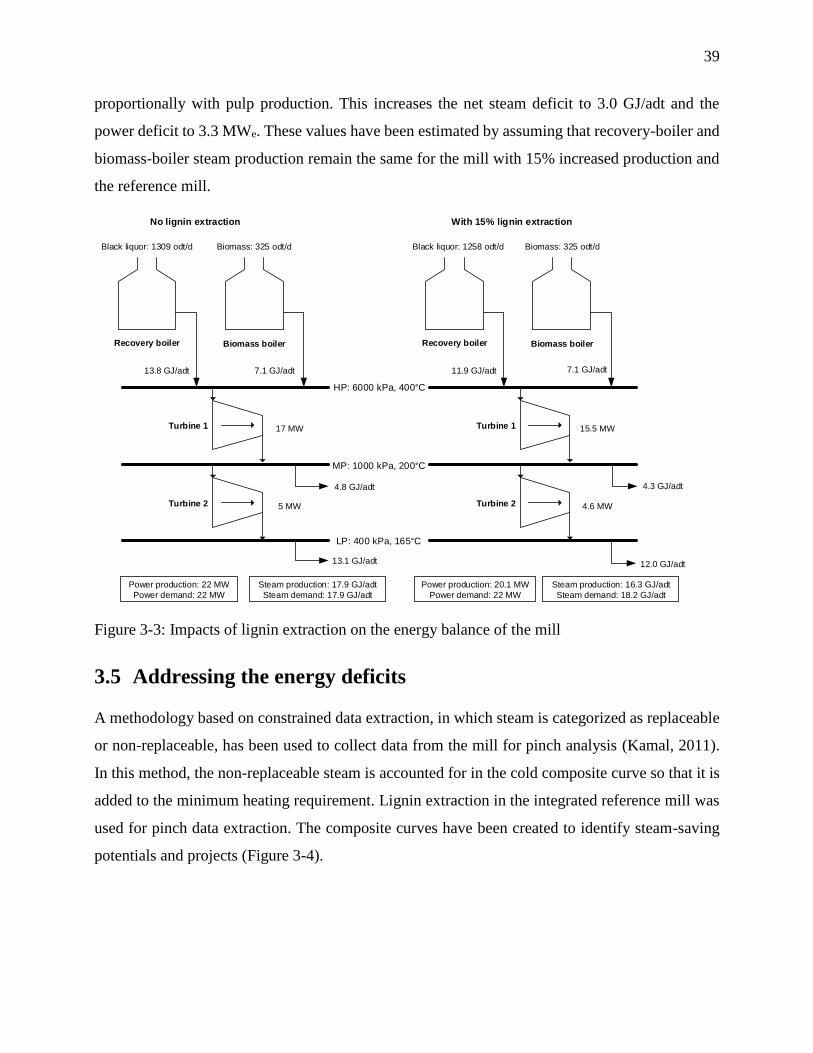
39
proportionally with pulp production. This increases the net steam deficit to 3.0 GJ/adt and the
power deficit to 3.3 MWe. These values have been estimated by assuming that recovery-boiler and
biomass-boiler steam production remain the same for the mill with 15% increased production and
the reference mill.
Recovery boiler Biomass boiler
HP: 6000 kPa, 400°C
MP: 1000 kPa, 200°C
LP: 400 kPa, 165°C
13.8 GJ/adt 7.1 GJ/adt
Black liquor: 1309 odt/d Biomass: 325 odt/d
17 MW
5 MW
4.8 GJ/adt
13.1 GJ/adt
Power production: 22 MW
Power demand: 22 MW
Steam production: 17.9 GJ/adt
Steam demand: 17.9 GJ/adt
Turbine 1
Turbine 2
Recovery boiler Biomass boiler
11.9 GJ/adt 7.1 GJ/adt
Black liquor: 1258 odt/d Biomass: 325 odt/d
15.5 MW
4.6 MW
4.3 GJ/adt
12.0 GJ/adt
Power production: 20.1 MW
Power demand: 22 MW
Steam production: 16.3 GJ/adt
Steam demand: 18.2 GJ/adt
Turbine 1
Turbine 2
No lignin extraction With 15% lignin extraction
Figure 3-3: Impacts of lignin extraction on the energy balance of the mill
3.5 Addressing the energy deficits
A methodology based on constrained data extraction, in which steam is categorized as replaceable
or non-replaceable, has been used to collect data from the mill for pinch analysis (Kamal, 2011).
In this method, the non-replaceable steam is accounted for in the cold composite curve so that it is
added to the minimum heating requirement. Lignin extraction in the integrated reference mill was
used for pinch data extraction. The composite curves have been created to identify steam-saving
potentials and projects (Figure 3-4).
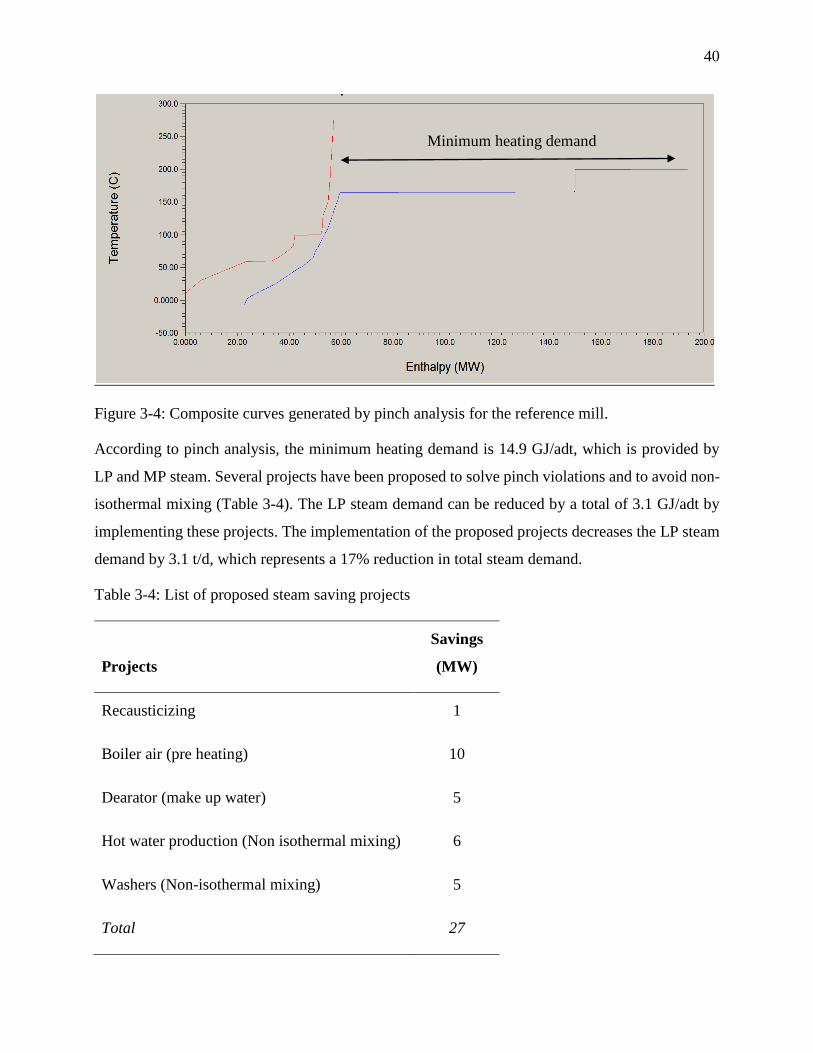
40
Figure 3-4: Composite curves generated by pinch analysis for the reference mill.
According to pinch analysis, the minimum heating demand is 14.9 GJ/adt, which is provided by
LP and MP steam. Several projects have been proposed to solve pinch violations and to avoid non-
isothermal mixing (Table 3-4). The LP steam demand can be reduced by a total of 3.1 GJ/adt by
implementing these projects. The implementation of the proposed projects decreases the LP steam
demand by 3.1 t/d, which represents a 17% reduction in total steam demand.
Table 3-4: List of proposed steam saving projects
Projects
Savings
(MW)
Recausticizing 1
Boiler air (pre heating) 10
Dearator (make up water) 5
Hot water production (Non isothermal mixing) 6
Washers (Non-isothermal mixing) 5
Total 27
Minimum heating demand
41
Although the implementation of steam saving projects can address the steam deficits, some means
of providing for the power deficits must be considered if all the steam and power demands are to
be met internally. Three strategies, which include steam-saving measures identified by the pinch
analysis, energy conversion efficiency improvements, and increasing fuel inputs, have been
proposed to cover the mill energy deficits created by lignin extraction. These strategies have been
applied to two cases: lignin extraction only, and lignin extraction with a 15% pulp production
increase. Table 3-5 summarizes the proposed strategies.
3.5.1 Strategy 1: Steam Saving Projects and Condensing Power
Mill steam demand is addressed by steam reduction projects identified by the pinch analysis. The
LP steam demand can be reduced by 3.1 GJ/adt by implementing these projects. MP steam demand
is covered by changing the ratio of MP/LP steam production at the turbines. However, the power
demand cannot be satisfied only by implementing steam-reduction projects. To compensate for the
power deficit, a condensing turbine with an isentropic efficiency of 86% is installed to use the LP
steam saved by the steam-saving projects. In this way, approximately 2 MW of electricity can be
produced, thus compensating for the power deficit. In the case of a pulp production increase,
however, the current steam savings are not enough to cover the steam and power demands
completely. Approximately 4.8 GJ/adt of steam savings are required to address the steam and
power demands using this strategy, which will require a higher level of process integration.
3.5.2 Strategy 2: Additional Biomass Use
Additional biomass is combusted in the biomass boiler under the assumption that the mill has the
capacity to burn more fuel. Additional wood or part of the extracted lignin can be used as the
additional biomass. By burning an extra 85 t/d of biomass, the steam and power deficits of the
Kraft mill can be addressed. If the lignin is extracted for the purpose of debottlenecking the
recovery boiler, the extracted lignin can be used again in the process as a fuel. In the case of a 15%
pulp production increase, by combusting 83 t/d of extracted lignin and an additional 47 t/d of
biomass, the energy requirements can be covered. A biomass-to-steam conversion efficiency of
75% is assumed for these estimates.
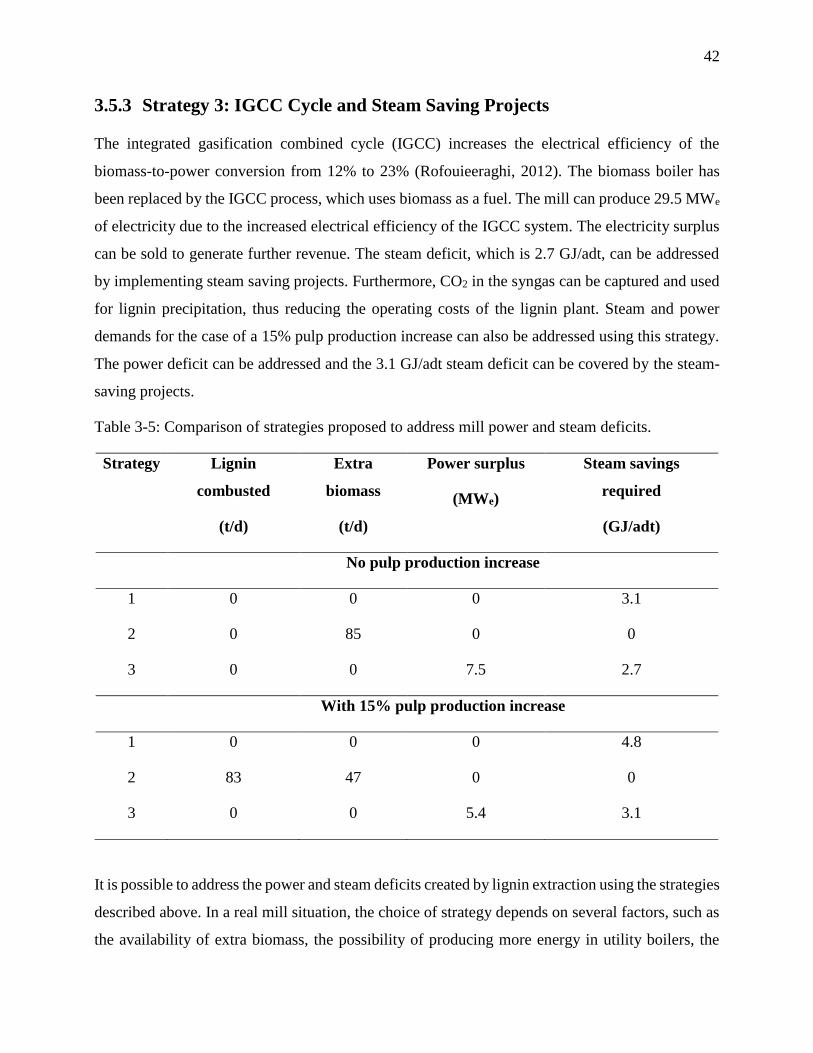
42
3.5.3 Strategy 3: IGCC Cycle and Steam Saving Projects
The integrated gasification combined cycle (IGCC) increases the electrical efficiency of the
biomass-to-power conversion from 12% to 23% (Rofouieeraghi, 2012). The biomass boiler has
been replaced by the IGCC process, which uses biomass as a fuel. The mill can produce 29.5 MWe
of electricity due to the increased electrical efficiency of the IGCC system. The electricity surplus
can be sold to generate further revenue. The steam deficit, which is 2.7 GJ/adt, can be addressed
by implementing steam saving projects. Furthermore, CO2 in the syngas can be captured and used
for lignin precipitation, thus reducing the operating costs of the lignin plant. Steam and power
demands for the case of a 15% pulp production increase can also be addressed using this strategy.
The power deficit can be addressed and the 3.1 GJ/adt steam deficit can be covered by the steam-
saving projects.
Table 3-5: Comparison of strategies proposed to address mill power and steam deficits.
Strategy Lignin
combusted
(t/d)
Extra
biomass
(t/d)
Power surplus
(MWe)
Steam savings
required
(GJ/adt)
No pulp production increase
1 0 0 0 3.1
2 0 85 0 0
3 0 0 7.5 2.7
With 15% pulp production increase
1 0 0 0 4.8
2 83 47 0 0
3 0 0 5.4 3.1
It is possible to address the power and steam deficits created by lignin extraction using the strategies
described above. In a real mill situation, the choice of strategy depends on several factors, such as
the availability of extra biomass, the possibility of producing more energy in utility boilers, the
43
desire to increase pulp production, and the feasibility of steam-saving projects. As the next step, an
economic analysis should be carried out to investigate the profitability of the various options.
3.6 Conclusion
Lignin extraction by acid precipitation alters the energy balance of the Kraft mill. In the case of
extraction of 15% lignin from the mill, recovery-boiler steam production was decreased by 13.5%
and evaporator steam demand was increased by 2.4%–14.6%, depending on the implemented
recycle configuration and the amount of filtrates recycled. Recycling the spent liquor upstream of
the evaporator train resulted in a lesser increase in evaporation steam demand. A power deficit of
2.1 MWe and a steam deficit of 2.7 GJ/adt are created by integrating a 15% lignin extraction unit
into the Kraft mill. If lignin is extracted to debottleneck the recovery boiler, pulp production can
be increased by approximately 15%. In this case, the mill steam and power deficits are increased
to 3.3 GJ/adt and 3.3 MWe respectively. Steam reduction measures of 3.1 GJ/adt have been
identified through pinch analysis. Three strategies based on steam reduction measures, energy-
conversion efficiency improvements, and extra fuel inputs are proposed to address power and steam
deficits. The possibility of addressing steam and power deficits internally has been demonstrated.
3.7 Acknowledgements
The authors acknowledge the financial support provided by NSERC and industrial partners.
3.8 References
Axelsson, E., Olsson, M. R., & Berntsson, T. (2006). Increased capacity in kraft pulp mills: Lignin
separation and reduced steam demand compared with recovery boiler upgrade. Nordic Pulp
and Paper Research Journal, 21(4), 485-492.
Kamal, W. (2011). Analysis of Energy Systems and Performance Improvement of a Kraft Pulping
Mill. École Polytechnique de Montréal.
Kouisni, L., Fang, Y., Paleologou, M., Ahvazi, B., Hawari, J., Zhang, Y., & Wang, X. M. (2011).
Kraft lignin recovery and its use in the preparation of lignin-based formaldehyde resins for
plywood. Cellulose Chemistry and Technology, 45(7-8), 515-520.
Laaksometsä, C., Axelsson, E., Berntsson, T., & Lundström, A. (2009). Energy savings combined
with lignin extraction for production increase: case study at a eucalyptus mill in Portugal.
Clean Technologies and Environmental Policy, 11(1), 77-82.
44
Loutfi, H., Blackwell, B., & Uloth, V. (1991). Lignin recovery from kraft black liquor: preliminary
process design. Tappi Journal, 74(1), 203-210.
Moosavifar, A., Sedin, M., & Theliander, H. (2009). Changes in viscosity and boiling point
elevation of black liquor when a fraction of lignin is removed - Consequences in the
evaporation stage. Appita Journal, 62(5), 383-390.
Olsson, M. R., Axelsson, E., & Berntsson, T. (2006). Exporting lignin or power from heat-
integrated kraft pulp mills: A techno-economic comparison using model mills. Nordic Pulp
and Paper Research Journal.
Perin-Levasseur, Z., Savulescu, L., & Benali, M. (2011). Lignin production path assessment:
Energy, water, and chemical integration perspective. J-FOR, 1(3), 25-30.
Rofouieeraghi, P. (2012). Biomass gasification integrated into a reference Canadian Kraft mill.
École Polytechnique de Montréal.
Tomani, P. (2010). The lignoboost process. Cellulose Chemistry and Technology, 44(1-3), 53-58.
Tomani, P., Axegard, P., Berglin, N., Lovell, A., & Nordgren, D. (2011, May 9-12, 2011).
Integration of lignin removal into kraft pulp mill and use of lignin as biofuel. Paper
presented at the 5th International colloquium on Eucalyptus Pulp, Porte Seguro, Bahia,
Brazil.
Wising, U., Algehed, J., Berntsson, T., & Delin, L. (2006). Consequences of lignin precipitation in
the pulp and paper industry.
45
ARTICLE 2: PROCESS MODELLING AND NA/S BALANCES
OF LIGNIN BIOREFINERIES IMPLEMENTED IN KRAFT PULPING
MILLS: APPLICATION TO A CANADIAN SOFTWOOD MILL
Miyuru Kannangara, Mariya Marinova, Louis Fradette, and Jean Paris
Research Unit on Energy Efficiency and Sustainable Development of the Forest Biorefinery,
Department of Chemical Engineering, Polytechnique Montreal, C.P. 6079, succ. Centre-Ville,
Montréal, QC, Canada H3C 3A7
Abstract
The implementation of lignin biorefineries in Kraft pulping mills has been studied with an emphasis
on minimization of the disruption of Na/S balances. A simulation approach based on Aspen Plus®
electrolytes and MS ExcelTM is proposed to accurately model the changes in liquor cycle balances
brought forth by the biorefinery integration. The biorefinery implementation was investigated
using four strategies for balancing Na and S based on wash filtrate recycle, black liquor pH re-
adjustment, make-up chemical additions and purges. For the studied Canadian softwood Kraft
pulping mill, a lignin extraction ratio of 15% was feasible according to the calorific value
constraints. The NaOH make-up demand was minimized at 146 kg/t of lignin by minimization of
the disruption of Na/S balances. The sensitivity analysis revealed that NaOH demand is a function
of the chemical recovery efficiency of the lignin washing step and it is feasible to reduce it below
100 kg/t of lignin when the washing operation is conducted with efficiency higher than 85% and
wash water demand lower than 5 t/t lignin. The analysis of the liquor cycle balances showed that
the Na/S balancing strategy also affects the loads of evaporator, causticizing loop and lime kiln
operations, thus becoming potential bottlenecks for the pulp production increase. The guidelines
for implementing the lignin biorefinery in the studied Kraft mill under given constraints were
provided. General recommendations on implementation of lignin biorefineries in Kraft pulping
mills were formulated.
Keywords
Lignin biorefinery, Kraft process, Process integration, chemical balances
46
4.1 Introduction
The pulp and paper industry in North America and Europe has been facing difficult economic
conditions since last two decade due to the falling demand for commodity papers including
newsprint and international competition. The industry has been actively seeking to use existing
infrastructure and equipment to separate wood components and convert them into novel bio-
products and chemicals. In this context, the integrated recovery of lignin from black liquor (BL)
has gained interest of the Kraft pulping industry as a way to separate a wood component and to
increase pulp production. Many Kraft pulping mills have been increasing their pulp production
over the years and have reached the thermal limit of the recovery boiler. The heat load to recovery
boiler is reduced by removing lignin, thus allowing mills to increase pulp production without
expensive recovery boiler upgrade.
The acid precipitation process has been identified as the most promising technology to remove
lignin in terms of economics (Alen et al., 1979; Loutfi et al., 1991; Uloth & Wearing, 1989a). In
this process, lignin is precipitated from BL by acidification with CO2, separated using filtration and
purified using sulfuric acid and water. The process can produce high purity lignin which can be
utilized as feedstock for many value added products including phenol formaldehyde resins, carbon
fibers and polyurethane foams (Bozell, Holladay, Johnson, & White, 2007; Silva et al., 2009).
Only a fraction of lignin can be recovered from BL to prevent excessive decrease of BL calorific
value, which hinders the safe and efficient operation of the recovery boiler. Therefore, lignin is
precipitated from a portion of BL that is diverted from the multiple effect evaporator train of the
mill. The filtrates resulting from lignin filtration and washing, containing mainly water, lignin,
hemicelluloses and spent chemicals are entirely or partly returned to the Kraft mill. The
implementation of lignin biorefinery affects the operations of the Kraft liquor cycle, in which the
chemicals required for Kraft pulping is recovered and produced, in terms of increased steam
demands, chemical requirements and operational loads. Although, lignin biorefinery process is not
energy intensive, the lignin removal reduces the steam production in the recovery boiler resulting
in a net energy deficit in the Kraft process. The entire or partial recycle of filtrates with additional
chemicals disrupts the sodium and sulfur (Na/S) balances of the liquor cycle, which has to be re-
adjusted using additional NaOH make-up and chemical purges. Excessive disruption of the Na/S
balance can negatively affect the profitability of the process due to the high cost of NaOH.
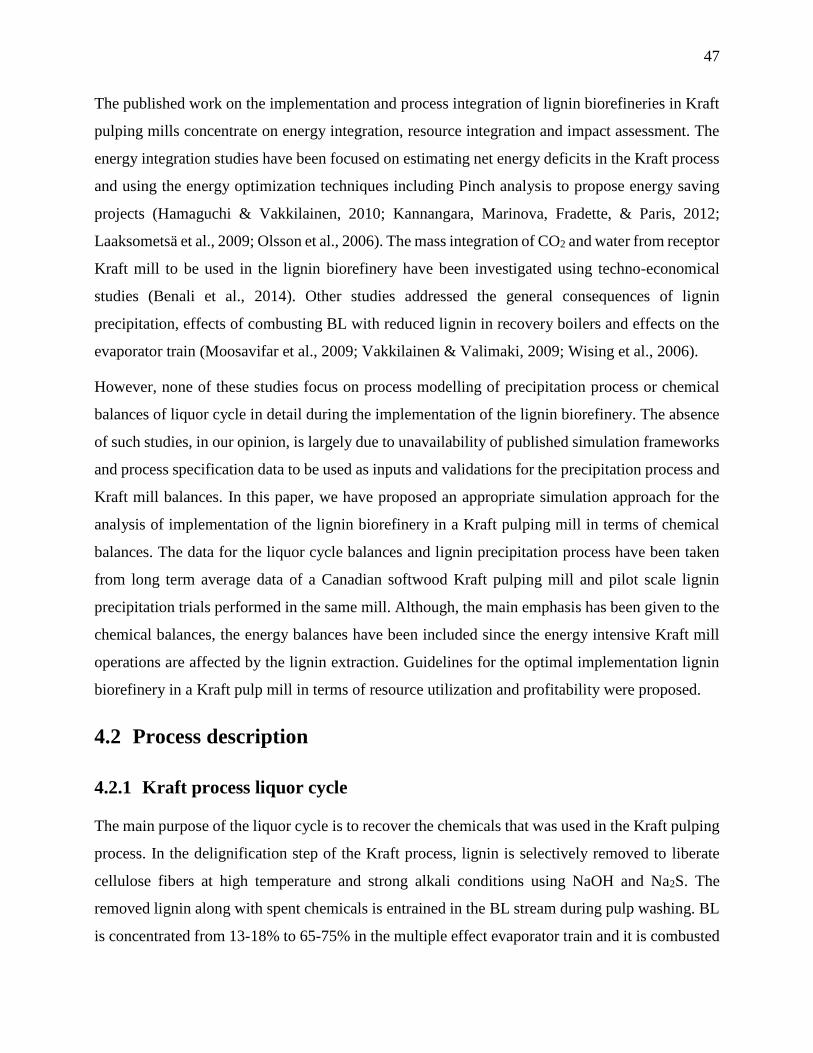
47
The published work on the implementation and process integration of lignin biorefineries in Kraft
pulping mills concentrate on energy integration, resource integration and impact assessment. The
energy integration studies have been focused on estimating net energy deficits in the Kraft process
and using the energy optimization techniques including Pinch analysis to propose energy saving
projects (Hamaguchi & Vakkilainen, 2010; Kannangara, Marinova, Fradette, & Paris, 2012;
Laaksometsä et al., 2009; Olsson et al., 2006). The mass integration of CO2 and water from receptor
Kraft mill to be used in the lignin biorefinery have been investigated using techno-economical
studies (Benali et al., 2014). Other studies addressed the general consequences of lignin
precipitation, effects of combusting BL with reduced lignin in recovery boilers and effects on the
evaporator train (Moosavifar et al., 2009; Vakkilainen & Valimaki, 2009; Wising et al., 2006).
However, none of these studies focus on process modelling of precipitation process or chemical
balances of liquor cycle in detail during the implementation of the lignin biorefinery. The absence
of such studies, in our opinion, is largely due to unavailability of published simulation frameworks
and process specification data to be used as inputs and validations for the precipitation process and
Kraft mill balances. In this paper, we have proposed an appropriate simulation approach for the
analysis of implementation of the lignin biorefinery in a Kraft pulping mill in terms of chemical
balances. The data for the liquor cycle balances and lignin precipitation process have been taken
from long term average data of a Canadian softwood Kraft pulping mill and pilot scale lignin
precipitation trials performed in the same mill. Although, the main emphasis has been given to the
chemical balances, the energy balances have been included since the energy intensive Kraft mill
operations are affected by the lignin extraction. Guidelines for the optimal implementation lignin
biorefinery in a Kraft pulp mill in terms of resource utilization and profitability were proposed.
4.2 Process description
4.2.1 Kraft process liquor cycle
The main purpose of the liquor cycle is to recover the chemicals that was used in the Kraft pulping
process. In the delignification step of the Kraft process, lignin is selectively removed to liberate
cellulose fibers at high temperature and strong alkali conditions using NaOH and Na2S. The
removed lignin along with spent chemicals is entrained in the BL stream during pulp washing. BL
is concentrated from 13-18% to 65-75% in the multiple effect evaporator train and it is combusted
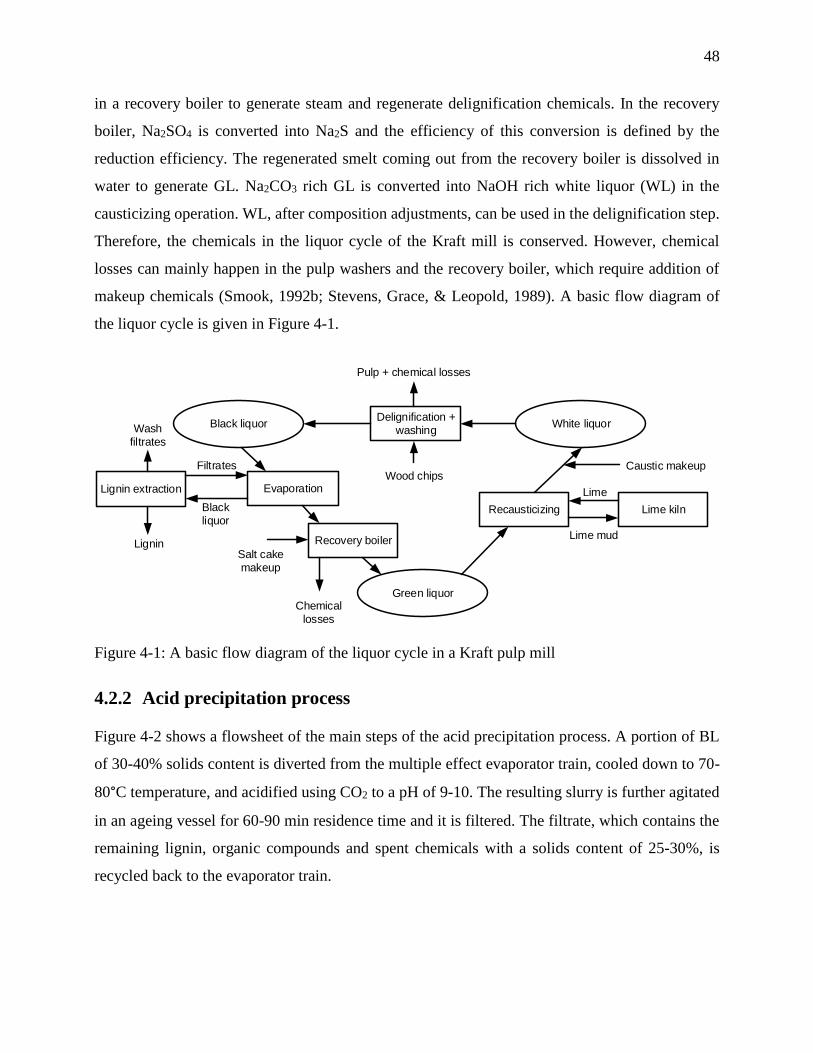
48
in a recovery boiler to generate steam and regenerate delignification chemicals. In the recovery
boiler, Na2SO4 is converted into Na2S and the efficiency of this conversion is defined by the
reduction efficiency. The regenerated smelt coming out from the recovery boiler is dissolved in
water to generate GL. Na2CO3 rich GL is converted into NaOH rich white liquor (WL) in the
causticizing operation. WL, after composition adjustments, can be used in the delignification step.
Therefore, the chemicals in the liquor cycle of the Kraft mill is conserved. However, chemical
losses can mainly happen in the pulp washers and the recovery boiler, which require addition of
makeup chemicals (Smook, 1992b; Stevens, Grace, & Leopold, 1989). A basic flow diagram of
the liquor cycle is given in Figure 4-1.
Black liquor
Green liquor
White liquor
Evaporation
Recovery boiler
Recausticizing
Delignification +
washing
Lime kiln
Lignin extraction
Pulp + chemical losses
Caustic makeup
Chemical
losses
Salt cake
makeup
Lignin
Wash
filtrates
Black
liquor
Filtrates
Lime mud
Lime
Wood chips
Figure 4-1: A basic flow diagram of the liquor cycle in a Kraft pulp mill
4.2.2 Acid precipitation process
Figure 4-2 shows a flowsheet of the main steps of the acid precipitation process. A portion of BL
of 30-40% solids content is diverted from the multiple effect evaporator train, cooled down to 70-
80°C temperature, and acidified using CO2 to a pH of 9-10. The resulting slurry is further agitated
in an ageing vessel for 60-90 min residence time and it is filtered. The filtrate, which contains the
remaining lignin, organic compounds and spent chemicals with a solids content of 25-30%, is
recycled back to the evaporator train.
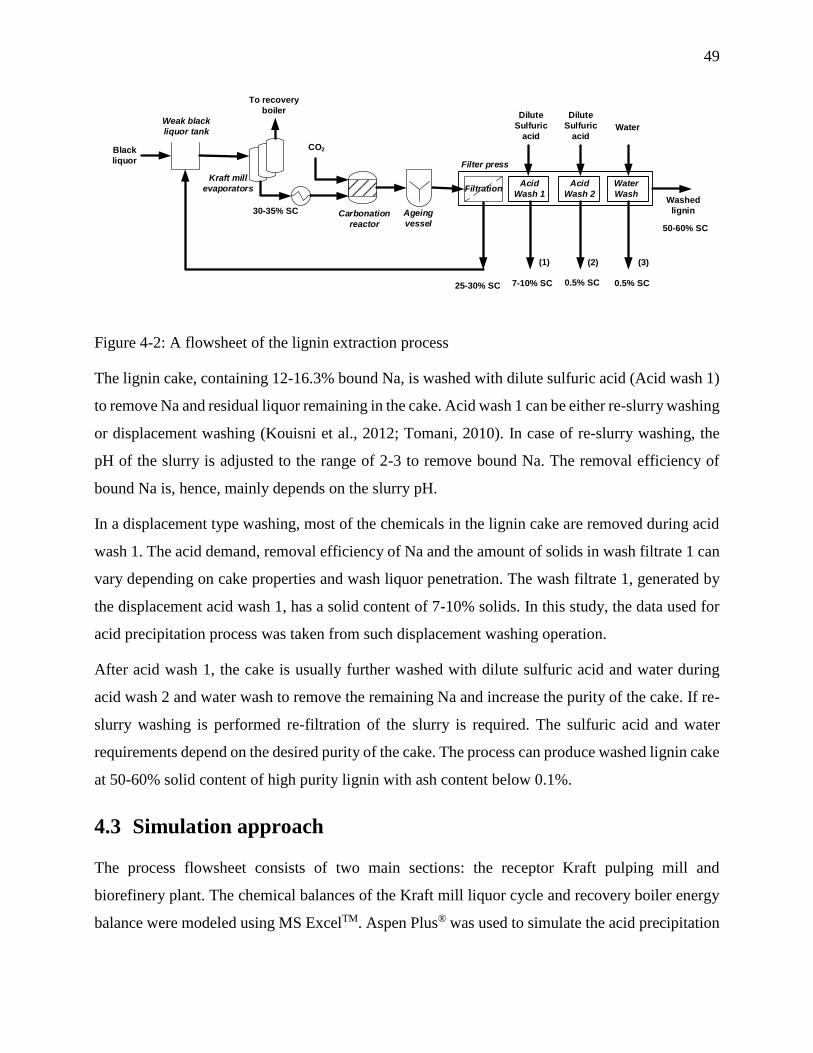
49
Black
liquor
Weak black
liquor tank
Kraft mill
evaporators
Carbonation
reactor
To recovery
boiler
CO2
Washed
ligninAgeing
vessel
30-35% SC
(1) (2)
Water
FiltrationAcid
Wash 1
Water
Wash
Acid
Wash 2
Dilute
Sulfuric
acid
(3)
Filter press
Dilute
Sulfuric
acid
25-30% SC 7-10% SC 0.5% SC 0.5% SC
50-60% SC
Figure 4-2: A flowsheet of the lignin extraction process
The lignin cake, containing 12-16.3% bound Na, is washed with dilute sulfuric acid (Acid wash 1)
to remove Na and residual liquor remaining in the cake. Acid wash 1 can be either re-slurry washing
or displacement washing (Kouisni et al., 2012; Tomani, 2010). In case of re-slurry washing, the
pH of the slurry is adjusted to the range of 2-3 to remove bound Na. The removal efficiency of
bound Na is, hence, mainly depends on the slurry pH.
In a displacement type washing, most of the chemicals in the lignin cake are removed during acid
wash 1. The acid demand, removal efficiency of Na and the amount of solids in wash filtrate 1 can
vary depending on cake properties and wash liquor penetration. The wash filtrate 1, generated by
the displacement acid wash 1, has a solid content of 7-10% solids. In this study, the data used for
acid precipitation process was taken from such displacement washing operation.
After acid wash 1, the cake is usually further washed with dilute sulfuric acid and water during
acid wash 2 and water wash to remove the remaining Na and increase the purity of the cake. If re-
slurry washing is performed re-filtration of the slurry is required. The sulfuric acid and water
requirements depend on the desired purity of the cake. The process can produce washed lignin cake
at 50-60% solid content of high purity lignin with ash content below 0.1%.
4.3 Simulation approach
The process flowsheet consists of two main sections: the receptor Kraft pulping mill and
biorefinery plant. The chemical balances of the Kraft mill liquor cycle and recovery boiler energy
balance were modeled using MS ExcelTM. Aspen Plus® was used to simulate the acid precipitation
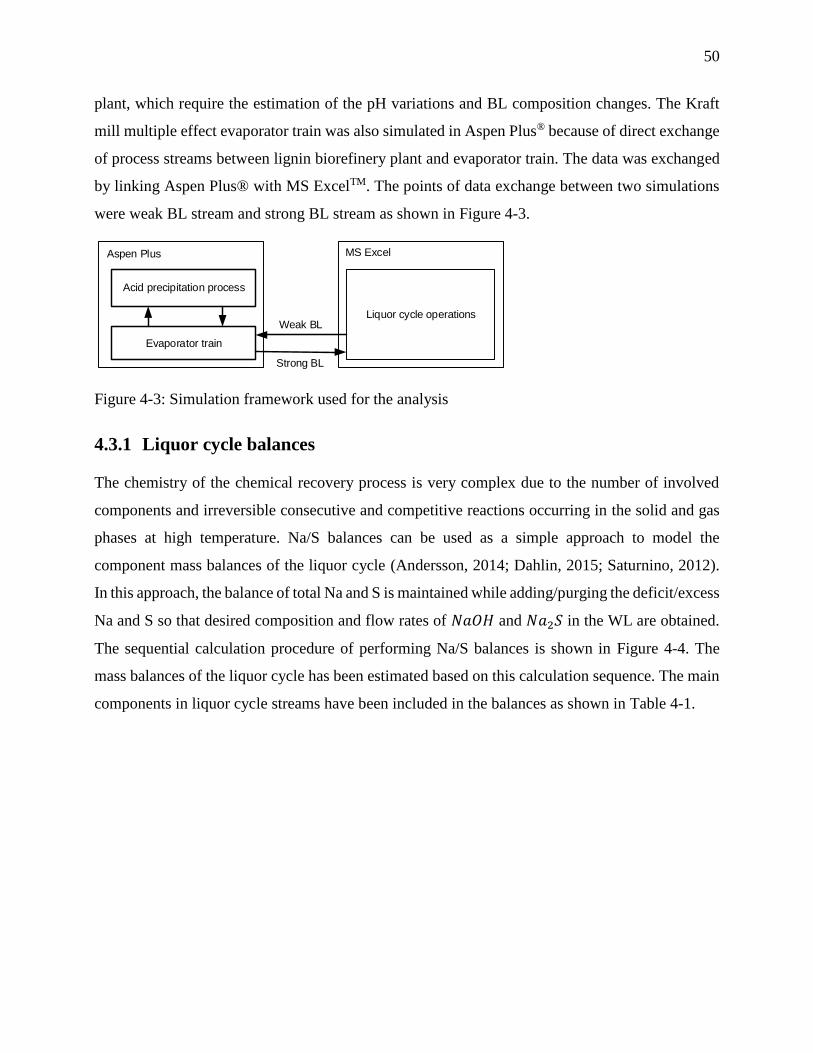
50
plant, which require the estimation of the pH variations and BL composition changes. The Kraft
mill multiple effect evaporator train was also simulated in Aspen Plus® because of direct exchange
of process streams between lignin biorefinery plant and evaporator train. The data was exchanged
by linking Aspen Plus® with MS ExcelTM. The points of data exchange between two simulations
were weak BL stream and strong BL stream as shown in Figure 4-3.
Acid precipitation process
Evaporator train
Liquor cycle operations
Aspen Plus MS Excel
Weak BL
Strong BL
Figure 4-3: Simulation framework used for the analysis
4.3.1 Liquor cycle balances
The chemistry of the chemical recovery process is very complex due to the number of involved
components and irreversible consecutive and competitive reactions occurring in the solid and gas
phases at high temperature. Na/S balances can be used as a simple approach to model the
component mass balances of the liquor cycle (Andersson, 2014; Dahlin, 2015; Saturnino, 2012).
In this approach, the balance of total Na and S is maintained while adding/purging the deficit/excess
Na and S so that desired composition and flow rates of 𝑁𝑎𝑂𝐻 and 𝑁𝑎2𝑆 in the WL are obtained.
The sequential calculation procedure of performing Na/S balances is shown in Figure 4-4. The
mass balances of the liquor cycle has been estimated based on this calculation sequence. The main
components in liquor cycle streams have been included in the balances as shown in Table 4-1.
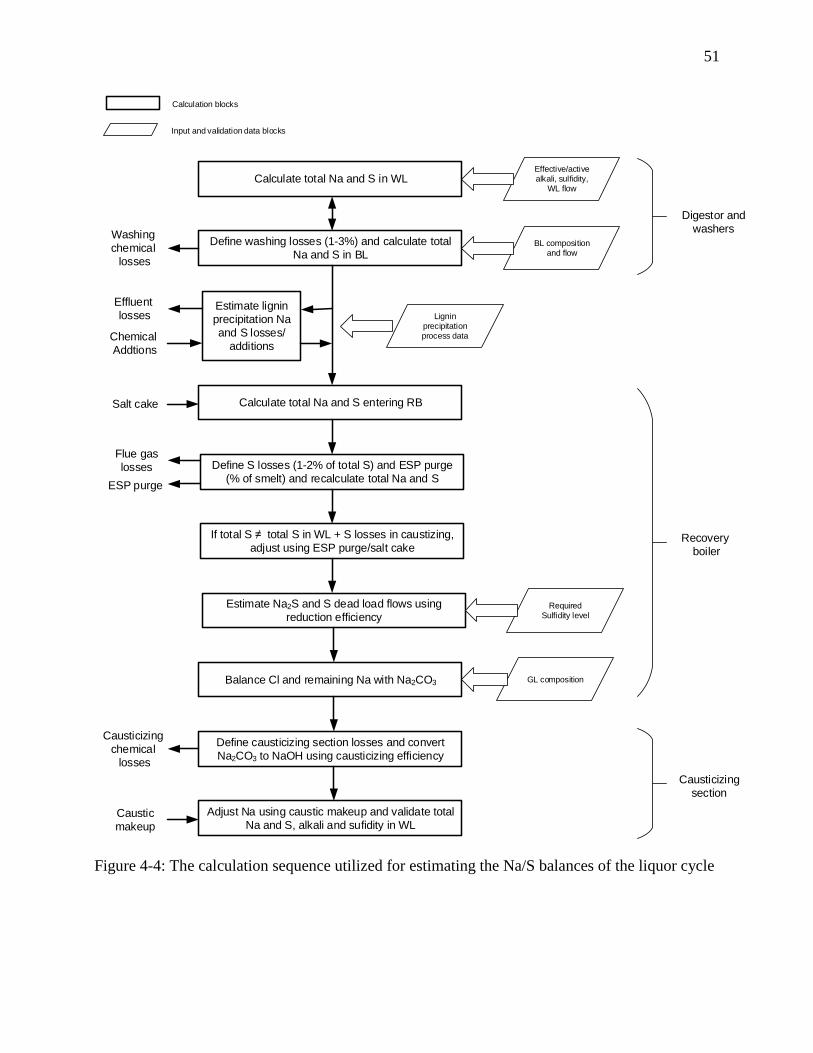
51
Calculate total Na and S in WLEffective/active alkali, sulfidity,
WL flow
Define washing losses (1-3%) and calculate total
Na and S in BLBL composition
and flow
Calculate total Na and S entering RB
Washing
chemical
losses
Salt cake
Estimate lignin
precipitation Na
and S losses/
additions
Define S losses (1-2% of total S) and ESP purge
(% of smelt) and recalculate total Na and SESP purge
Estimate Na2S and S dead load flows using
reduction efficiency
Balance Cl and remaining Na with Na2CO3
Required Sulfidity level
If total S ≠ total S in WL + S losses in caustizing,
adjust using ESP purge/salt cake
GL composition
Define causticizing section losses and convert
Na2CO3 to NaOH using causticizing efficiency
Causticizing
chemical
losses
Adjust Na using caustic makeup and validate total
Na and S, alkali and sufidity in WL
Digestor and
washers
Recovery
boiler
Causticizing
section
Calculation blocks
Input and validation data blocks
Effluent
losses
Chemical
Addtions
Lignin precipitation process data
Caustic
makeup
Flue gas
losses
Figure 4-4: The calculation sequence utilized for estimating the Na/S balances of the liquor cycle
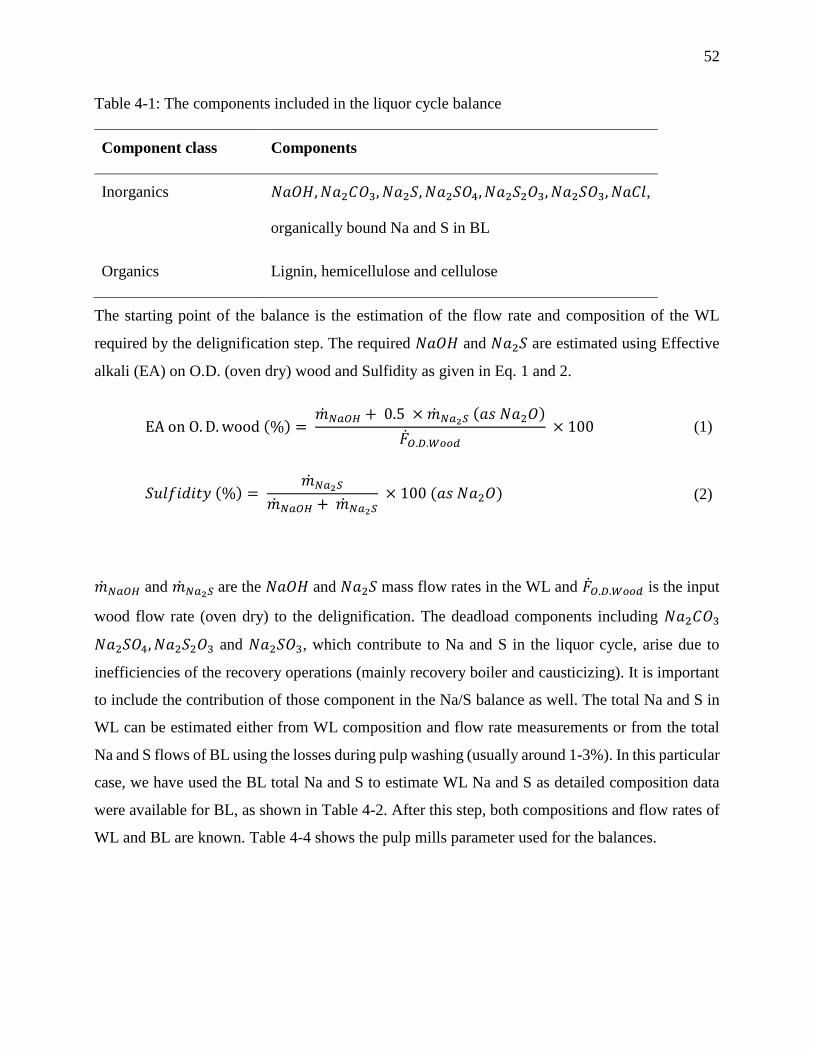
52
Table 4-1: The components included in the liquor cycle balance
Component class Components
Inorganics 𝑁𝑎𝑂𝐻, 𝑁𝑎2𝐶𝑂3, 𝑁𝑎2𝑆, 𝑁𝑎2𝑆𝑂4, 𝑁𝑎2𝑆2𝑂3, 𝑁𝑎2𝑆𝑂3, 𝑁𝑎𝐶𝑙,
organically bound Na and S in BL
Organics Lignin, hemicellulose and cellulose
The starting point of the balance is the estimation of the flow rate and composition of the WL
required by the delignification step. The required 𝑁𝑎𝑂𝐻 and 𝑁𝑎2𝑆 are estimated using Effective
alkali (EA) on O.D. (oven dry) wood and Sulfidity as given in Eq. 1 and 2.
EA on O. D. wood (%) =
��𝑁𝑎𝑂𝐻 + 0.5 × ��𝑁𝑎2𝑆 (𝑎𝑠 𝑁𝑎2𝑂)
��𝑂.𝐷.𝑊𝑜𝑜𝑑
× 100 (1)
𝑆𝑢𝑙𝑓𝑖𝑑𝑖𝑡𝑦 (%) =
��𝑁𝑎2𝑆
��𝑁𝑎𝑂𝐻 + ��𝑁𝑎2𝑆 × 100 (𝑎𝑠 𝑁𝑎2𝑂) (2)
��𝑁𝑎𝑂𝐻 and ��𝑁𝑎2𝑆 are the 𝑁𝑎𝑂𝐻 and 𝑁𝑎2𝑆 mass flow rates in the WL and ��𝑂.𝐷.𝑊𝑜𝑜𝑑 is the input
wood flow rate (oven dry) to the delignification. The deadload components including 𝑁𝑎2𝐶𝑂3
𝑁𝑎2𝑆𝑂4, 𝑁𝑎2𝑆2𝑂3 and 𝑁𝑎2𝑆𝑂3, which contribute to Na and S in the liquor cycle, arise due to
inefficiencies of the recovery operations (mainly recovery boiler and causticizing). It is important
to include the contribution of those component in the Na/S balance as well. The total Na and S in
WL can be estimated either from WL composition and flow rate measurements or from the total
Na and S flows of BL using the losses during pulp washing (usually around 1-3%). In this particular
case, we have used the BL total Na and S to estimate WL Na and S as detailed composition data
were available for BL, as shown in Table 4-2. After this step, both compositions and flow rates of
WL and BL are known. Table 4-4 shows the pulp mills parameter used for the balances.
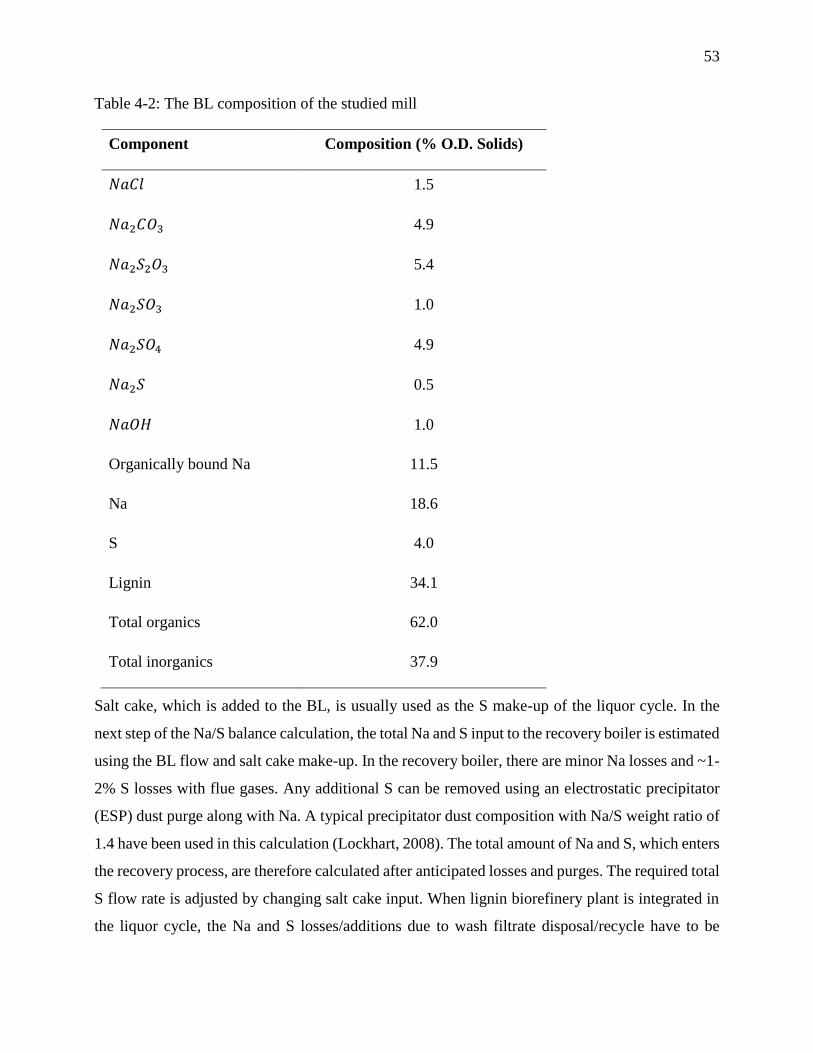
53
Table 4-2: The BL composition of the studied mill
Component Composition (% O.D. Solids)
𝑁𝑎𝐶𝑙 1.5
𝑁𝑎2𝐶𝑂3 4.9
𝑁𝑎2𝑆2𝑂3 5.4
𝑁𝑎2𝑆𝑂3 1.0
𝑁𝑎2𝑆𝑂4 4.9
𝑁𝑎2𝑆 0.5
𝑁𝑎𝑂𝐻 1.0
Organically bound Na 11.5
Na 18.6
S 4.0
Lignin 34.1
Total organics 62.0
Total inorganics 37.9
Salt cake, which is added to the BL, is usually used as the S make-up of the liquor cycle. In the
next step of the Na/S balance calculation, the total Na and S input to the recovery boiler is estimated
using the BL flow and salt cake make-up. In the recovery boiler, there are minor Na losses and ~1-
2% S losses with flue gases. Any additional S can be removed using an electrostatic precipitator
(ESP) dust purge along with Na. A typical precipitator dust composition with Na/S weight ratio of
1.4 have been used in this calculation (Lockhart, 2008). The total amount of Na and S, which enters
the recovery process, are therefore calculated after anticipated losses and purges. The required total
S flow rate is adjusted by changing salt cake input. When lignin biorefinery plant is integrated in
the liquor cycle, the Na and S losses/additions due to wash filtrate disposal/recycle have to be
54
included before this step. During recovery boiler operation, the input of S is converted into 𝑁𝑎2𝑆
and S deadload components including 𝑁𝑎2𝑆𝑂4, 𝑁𝑎2𝑆2𝑂3 and 𝑁𝑎2𝑆𝑂3 as defined by the reduction
efficiency (𝜂𝑅𝑒𝑑𝑢𝑐𝑡𝑖𝑜𝑛).
𝜂𝑅𝑒𝑑𝑢𝑐𝑡𝑖𝑜𝑛(%) =
��𝑁𝐴2𝑆
��𝑆,𝑡𝑜𝑡𝑎𝑙
× 100 (3)
��𝑁𝐴2𝑆 is the mole flow of 𝑁𝑎2𝑆 and ��𝑆,𝑡𝑜𝑡𝑎𝑙 is the total mole flow rate of S. After S balance, the
Cl is balanced as 𝑁𝑎𝐶𝑙 and the remaining Na is balanced as 𝑁𝑎2𝐶𝑂3. This sequence of calculations
allows to estimate the smelt flow and composition, which is translated into green liquor (GL) flow
and composition. The GL composition measurements, if available, can be used to validate the
obtained results.
The conversion of 𝑁𝑎2𝐶𝑂3 to 𝑁𝑎𝑂𝐻 is calculated using causticizing efficiency (𝜂𝐶𝑎𝑢𝑠𝑡𝑖𝑐𝑖𝑧𝑖𝑛𝑔) to
obtain the WL composition. ��𝑁𝑎𝑂𝐻 and ��𝑁𝑎2𝐶𝑂3 are the mass flow rate of 𝑁𝑎𝑂𝐻 and 𝑁𝑎2𝐶𝑂3
after causticizing section, which are given in the form of 𝑁𝑎2𝑂.
𝜂𝐶𝑎𝑢𝑠𝑡𝑖𝑐𝑖𝑧𝑖𝑛𝑔(%) =
��𝑁𝑎𝑂𝐻
��𝑁𝑎𝑂𝐻 + ��𝑁𝑎2𝐶𝑂3
× 100 (𝑎𝑠 𝑁𝑎2𝑂) (4)
The WL produced after the causticizing usually requires a make-up of 𝑁𝑎𝑂𝐻 to adjust the Na and
effective alkali levels of the delignification step, which is the final step of the calculation procedure.
The data requirements explained in this algorithm were kept minimum for the purpose of analyzing
chemical balances of the main operations of the liquor cycle. If more data is available, they can be
used to validate and further improve the balances of each operation.
4.3.2 Recovery boiler energy production and lignin extraction ratio
The energy balances of recovery boiler has been included in the liquor cycle simulation. The
recovery boiler energy production has been estimated using the total energy conversion efficiency
(𝜂𝑅𝐵) equation.
𝜂𝑅𝐵(%) =
E
𝑀𝑆 × 𝐻𝐻𝑉𝐵𝐿
(5)
55
E is the rate of energy production, 𝑀𝑆 is the total solid flow rate to the recovery boiler and 𝐻𝐻𝑉𝐵𝐿
is the calorific value of the BL. The extraction of lignin decreases the calorific value of BL, which
can hinder the safe and efficient operation of the recovery boiler. Therefore, the ratio of lignin
extraction is dependent on the constraints set by the recovery boiler. One way of estimating the
lignin extraction ratio is (1): Defining a minimum BL calorific value as allowed by the recovery
boiler and (2): Increasing the lignin extraction until the calorific value reaches the defined calorific
value (Benali et al., 2014; Perin-Levasseur, Z, Benali, & Paris, 2010). The original BL considered
in this study had a calorific value of 13.72 MJ/kg (O.D. basis) at 34.1% lignin content while the
filtrate after lignin extraction had a calorific value of 8.62 MJ/kg (O.D. basis) at 17% lignin content.
Considering the dilutions with added chemicals (CO2 and H2SO4), this reduction of lignin content
accounts to ~ 56% of lignin extraction, which is in accordance with the process lignin yield of 52%.
The recovery boiler in the studied mill had a minimum operating calorific value in the range from
11.86 to 12.32 MJ/kg (O.D. basis) as recommended by the operators. The linear interpolation has
shown that ~15% of lignin extraction to obtain 12.32 MJ/kg value. However, it is recommended
validating this value with a measured caloric value of a liquor containing appropriate portions of
original BL and filtrates. The estimated 15% lignin extraction corresponds to 24 t/d of lignin
removal from the mill. The addition and removal of inorganics compounds also affect the HHV of
BL.
The HHV of BL has usually been estimated according to the ultimate analysis of black liquor or
by means of regression using large number of proximate analysis data sets (Hamaguchi &
Vakkilainen, 2010; Vakkilainen, 2000; Vakkilainen & Valimaki, 2009; Valimaki et al., 2010 ). In
the absence of such data, an absolute prediction of HHV depending on the BL composition can be
erroneous. Therefore, we have used a differential type equation (Eq. (6)), which is based on total
energy content and considers the deviations from a reference calorific value, for preliminary
estimation of HHV and to minimize the prediction error. The reference calorific value can be a
measured calorific value for BL of a known composition, which has similar composition to the BL
after lignin extraction.
𝐻𝐻𝑉𝐵𝐿 =
𝐻𝐻𝑉𝐵𝐿,𝑟𝑒𝑓 × ��𝐵𝐿,𝑅𝑒𝑓 + 𝐻𝐻𝑉𝐿 × (��𝐿 − �� 𝐿,𝑟𝑒𝑓) + 𝐻𝐻𝑉𝑂 × (��𝑂 − �� 𝑂,𝑟𝑒𝑓)
��𝐵𝐿 (6)
56
𝐻𝐻𝑉𝐵𝐿 is the estimated calorific value of the BL, 𝐻𝐻𝑉𝐵𝐿,𝑟𝑒𝑓 is the reference calorific value at
reference composition.z 𝐻𝐻𝑉𝐿and 𝐻𝐻𝑉𝑂 are the calorific values of lignin and other remaining
organics, which were 27.5 MJ/kg and 13.7 MJ/kg respectively for this particular calculation. ��𝐿
and ��𝑂 are the current flow rates of lignin and remaining organics and �� 𝐿,𝑟𝑒𝑓 and �� 𝑂,𝑟𝑒𝑓 are the
reference flow rates of lignin and remaining organics. ��𝐵𝐿 and ��𝐵𝐿,𝑅𝑒𝑓 are the current and
reference total solids flow rates. For this particular mill, 𝐻𝐻𝑉𝐵𝐿,𝑟𝑒𝑓 of 12.32 MJ/kg was assumed
at BL composition resulted in recycling BL filtrate and 5 t/t of lignin of wash filtrates at lignin
extraction rate of 15%.
4.3.3 Modeling the BL acidification
The basic chemistry of the acid precipitation process involves the reduction of the BL pH by means
of acid. At high pH, the phenol and carboxyl hydroxide groups of lignin are dissociated providing
lignin macromolecules negative surface charges. As the pH is reduced, these charges are
neutralized causing lignin to coagulate and precipitate.
The solution pH can be modeled using electrolyte chemical equilibria that describe ionic
dissociation and acid-base reactions. Electrolyte capabilities in Aspen Plus® have been used to
simulate acid precipitation of BL (Benali et al., 2014; Perin-Levasseur, Z et al., 2010). In this paper,
the electrolyte NRTL physical property model has been used to represent the aqueous electrolytes
equilibrium behavior of BL.
The components that participate in the reactions in large quantities were included in the simulation.
The inorganic components were set to participate in the electrolyte equilibrium and organic solid
compounds including lignin, hemicellulose, lignin bound Na and S were treated as inert solid
components. The physical properties for lignin, hemicelluloses and cellulose have been retrieved
from the literature (Wooley & Putsche, 1996). In addition to the standard electrolyte components
generated in Aspen Plus®, the phenol hydroxyl groups in lignin were included in the ionic equilibria
to model the acid consumption by the phenolic groups in lignin. The electrolyte equilibria of the
inorganic compounds are given in Eq. (7) - (15) and lignin phenolic group ionic equilibria is given
in Eq. (16).
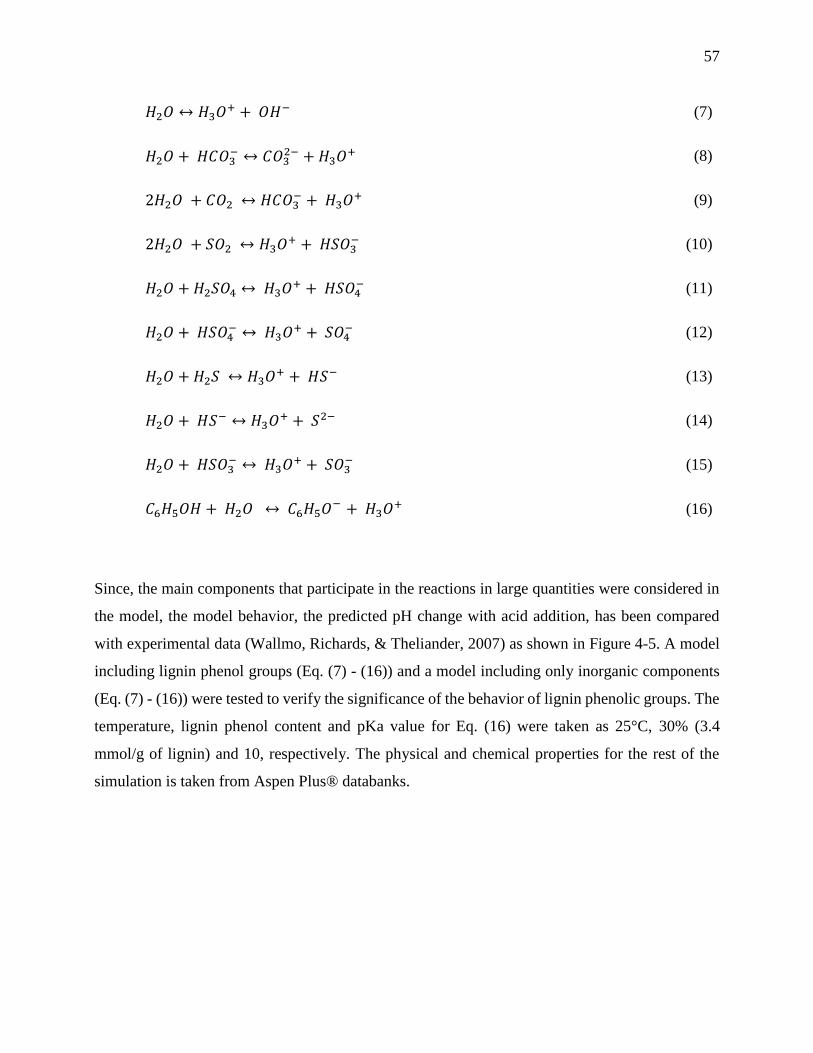
57
𝐻2𝑂 ↔ 𝐻3𝑂+ + 𝑂𝐻− (7)
𝐻2𝑂 + 𝐻𝐶𝑂3− ↔ 𝐶𝑂3
2− + 𝐻3𝑂+ (8)
2𝐻2𝑂 + 𝐶𝑂2 ↔ 𝐻𝐶𝑂3− + 𝐻3𝑂+ (9)
2𝐻2𝑂 + 𝑆𝑂2 ↔ 𝐻3𝑂+ + 𝐻𝑆𝑂3− (10)
𝐻2𝑂 + 𝐻2𝑆𝑂4 ↔ 𝐻3𝑂+ + 𝐻𝑆𝑂4− (11)
𝐻2𝑂 + 𝐻𝑆𝑂4− ↔ 𝐻3𝑂+ + 𝑆𝑂4
− (12)
𝐻2𝑂 + 𝐻2𝑆 ↔ 𝐻3𝑂+ + 𝐻𝑆− (13)
𝐻2𝑂 + 𝐻𝑆− ↔ 𝐻3𝑂+ + 𝑆2− (14)
𝐻2𝑂 + 𝐻𝑆𝑂3− ↔ 𝐻3𝑂+ + 𝑆𝑂3
− (15)
𝐶6𝐻5𝑂𝐻 + 𝐻2𝑂 ↔ 𝐶6𝐻5𝑂− + 𝐻3𝑂+ (16)
Since, the main components that participate in the reactions in large quantities were considered in
the model, the model behavior, the predicted pH change with acid addition, has been compared
with experimental data (Wallmo, Richards, & Theliander, 2007) as shown in Figure 4-5. A model
including lignin phenol groups (Eq. (7) - (16)) and a model including only inorganic components
(Eq. (7) - (16)) were tested to verify the significance of the behavior of lignin phenolic groups. The
temperature, lignin phenol content and pKa value for Eq. (16) were taken as 25°C, 30% (3.4
mmol/g of lignin) and 10, respectively. The physical and chemical properties for the rest of the
simulation is taken from Aspen Plus® databanks.
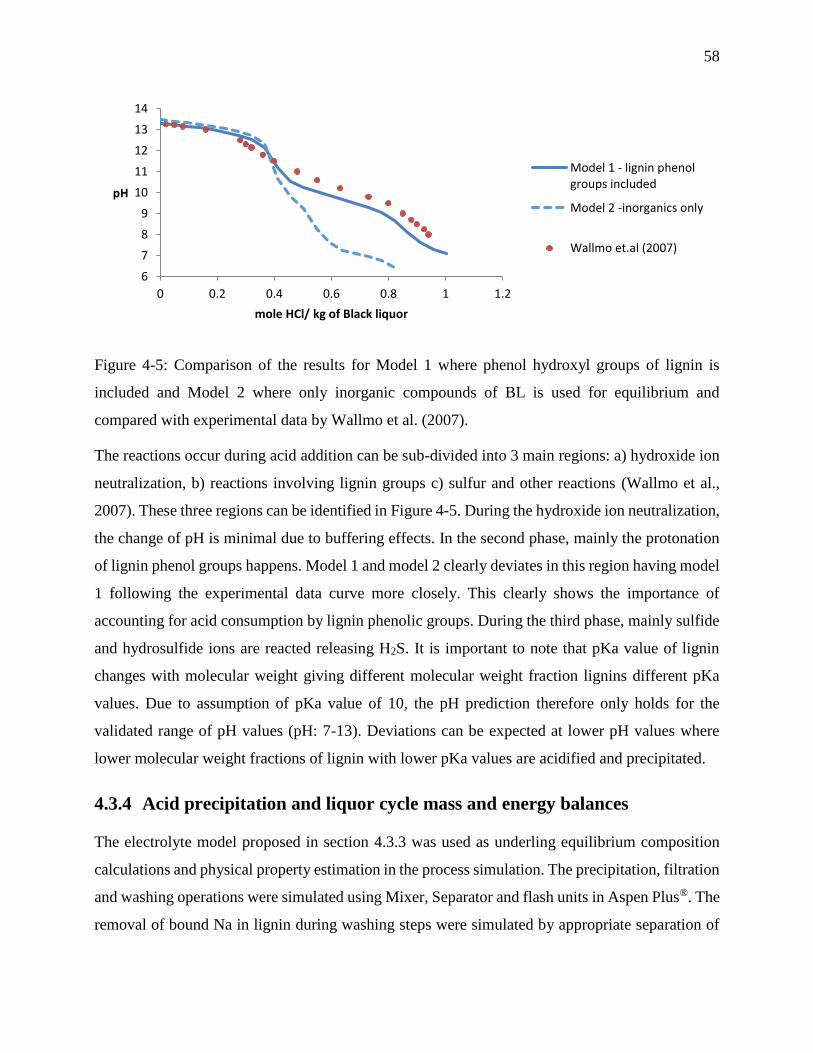
58
Figure 4-5: Comparison of the results for Model 1 where phenol hydroxyl groups of lignin is
included and Model 2 where only inorganic compounds of BL is used for equilibrium and
compared with experimental data by Wallmo et al. (2007).
The reactions occur during acid addition can be sub-divided into 3 main regions: a) hydroxide ion
neutralization, b) reactions involving lignin groups c) sulfur and other reactions (Wallmo et al.,
2007). These three regions can be identified in Figure 4-5. During the hydroxide ion neutralization,
the change of pH is minimal due to buffering effects. In the second phase, mainly the protonation
of lignin phenol groups happens. Model 1 and model 2 clearly deviates in this region having model
1 following the experimental data curve more closely. This clearly shows the importance of
accounting for acid consumption by lignin phenolic groups. During the third phase, mainly sulfide
and hydrosulfide ions are reacted releasing H2S. It is important to note that pKa value of lignin
changes with molecular weight giving different molecular weight fraction lignins different pKa
values. Due to assumption of pKa value of 10, the pH prediction therefore only holds for the
validated range of pH values (pH: 7-13). Deviations can be expected at lower pH values where
lower molecular weight fractions of lignin with lower pKa values are acidified and precipitated.
4.3.4 Acid precipitation and liquor cycle mass and energy balances
The electrolyte model proposed in section 4.3.3 was used as underling equilibrium composition
calculations and physical property estimation in the process simulation. The precipitation, filtration
and washing operations were simulated using Mixer, Separator and flash units in Aspen Plus®. The
removal of bound Na in lignin during washing steps were simulated by appropriate separation of
6
7
8
9
10
11
12
13
14
0 0.2 0.4 0.6 0.8 1 1.2
pH
mole HCl/ kg of Black liquor
Model 1 - lignin phenolgroups included
Model 2 -inorganics only
Wallmo et.al (2007)
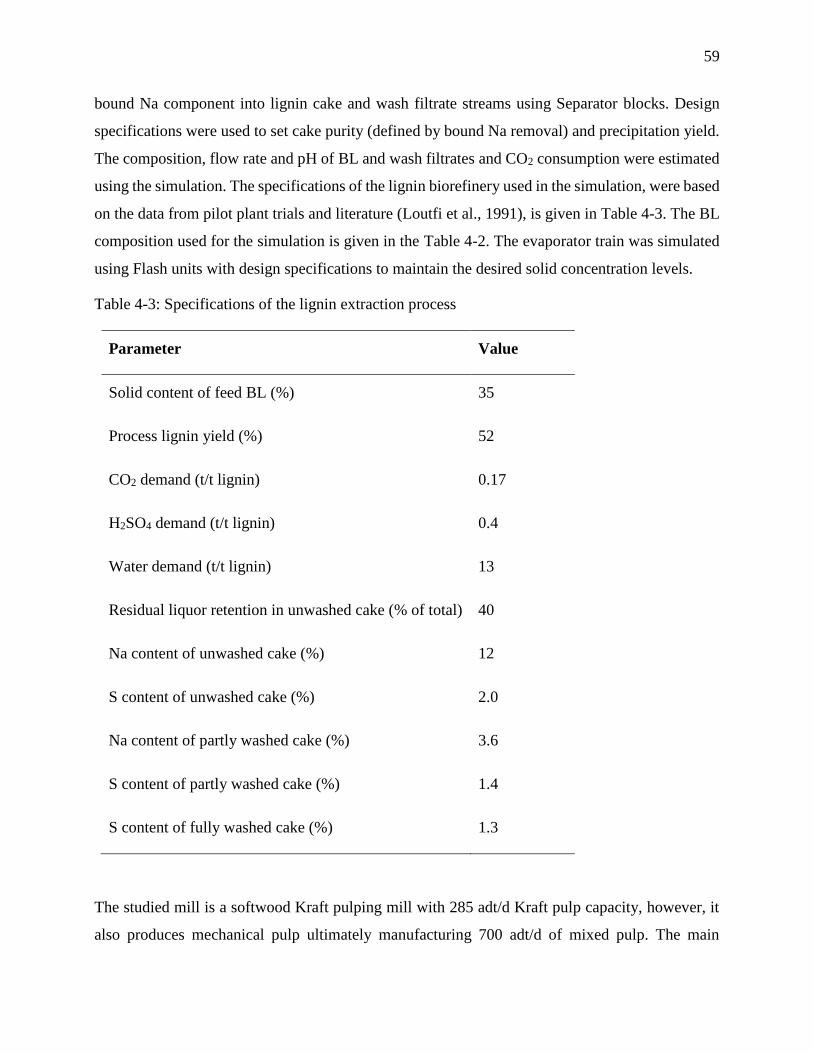
59
bound Na component into lignin cake and wash filtrate streams using Separator blocks. Design
specifications were used to set cake purity (defined by bound Na removal) and precipitation yield.
The composition, flow rate and pH of BL and wash filtrates and CO2 consumption were estimated
using the simulation. The specifications of the lignin biorefinery used in the simulation, were based
on the data from pilot plant trials and literature (Loutfi et al., 1991), is given in Table 4-3. The BL
composition used for the simulation is given in the Table 4-2. The evaporator train was simulated
using Flash units with design specifications to maintain the desired solid concentration levels.
Table 4-3: Specifications of the lignin extraction process
Parameter Value
Solid content of feed BL (%) 35
Process lignin yield (%) 52
CO2 demand (t/t lignin) 0.17
H2SO4 demand (t/t lignin) 0.4
Water demand (t/t lignin) 13
Residual liquor retention in unwashed cake (% of total) 40
Na content of unwashed cake (%) 12
S content of unwashed cake (%) 2.0
Na content of partly washed cake (%) 3.6
S content of partly washed cake (%) 1.4
S content of fully washed cake (%) 1.3
The studied mill is a softwood Kraft pulping mill with 285 adt/d Kraft pulp capacity, however, it
also produces mechanical pulp ultimately manufacturing 700 adt/d of mixed pulp. The main
60
parameters of the mill is given Table 4-4. Liquor cycle chemical balances were simulated including
energy balances in evaporator and recovery boiler sections. The studied mill has a production
bottleneck in the recovery boiler and unutilized capacities of the main chemical recovery operations
were; evaporators: 14%, causticizing: 24% and lime kiln: 10%.
Table 4-4: Pulp mill parameters for mill balances
Parameter Value
Kraft pulp production rate (adt/d) 285
Total pulp production rate (adt/d) 700
Effective alkali on O.D. wood (%) 14
Sulfidity (%) 22
Reduction efficiency (%) 70
Causticizing efficiency (%) 84
Wood flow rate to digester (odt/d) 619
Salt cake addition as 𝑁𝑎3𝐻(𝑆𝑂4)2 (t/d) 6
𝑁𝑎𝑂𝐻 make-up (t/d) 3
BL solids flow (t/d) 487
WL flow (L/min) 617
4.4 Results and discussion
4.4.1 Implementation strategies
A portion of 28% BL has been diverted from the multiple effect evaporator train at 35% solids
concentration in order to obtain a lignin extraction rate of 24 t/d. After lignin extraction, the BL
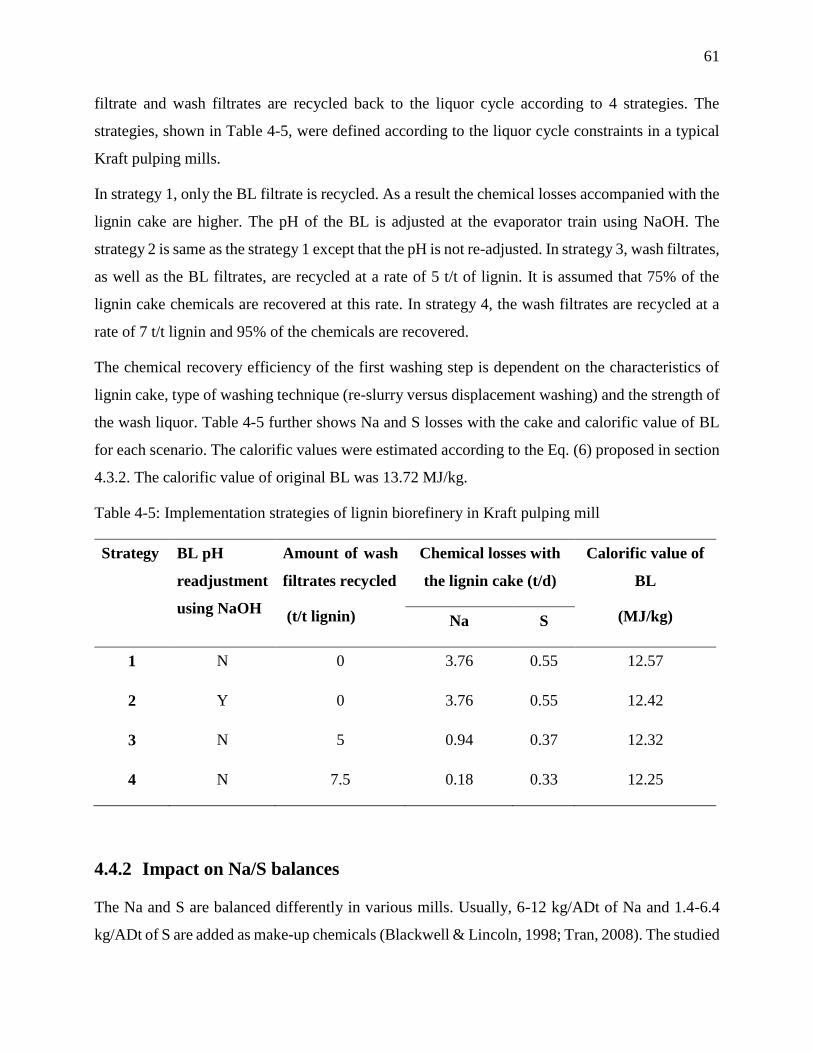
61
filtrate and wash filtrates are recycled back to the liquor cycle according to 4 strategies. The
strategies, shown in Table 4-5, were defined according to the liquor cycle constraints in a typical
Kraft pulping mills.
In strategy 1, only the BL filtrate is recycled. As a result the chemical losses accompanied with the
lignin cake are higher. The pH of the BL is adjusted at the evaporator train using NaOH. The
strategy 2 is same as the strategy 1 except that the pH is not re-adjusted. In strategy 3, wash filtrates,
as well as the BL filtrates, are recycled at a rate of 5 t/t of lignin. It is assumed that 75% of the
lignin cake chemicals are recovered at this rate. In strategy 4, the wash filtrates are recycled at a
rate of 7 t/t lignin and 95% of the chemicals are recovered.
The chemical recovery efficiency of the first washing step is dependent on the characteristics of
lignin cake, type of washing technique (re-slurry versus displacement washing) and the strength of
the wash liquor. Table 4-5 further shows Na and S losses with the cake and calorific value of BL
for each scenario. The calorific values were estimated according to the Eq. (6) proposed in section
4.3.2. The calorific value of original BL was 13.72 MJ/kg.
Table 4-5: Implementation strategies of lignin biorefinery in Kraft pulping mill
Strategy BL pH
readjustment
using NaOH
Amount of wash
filtrates recycled
(t/t lignin)
Chemical losses with
the lignin cake (t/d)
Calorific value of
BL
(MJ/kg) Na S
1 N 0 3.76 0.55 12.57
2 Y 0 3.76 0.55 12.42
3 N 5 0.94 0.37 12.32
4 N 7.5 0.18 0.33 12.25
4.4.2 Impact on Na/S balances
The Na and S are balanced differently in various mills. Usually, 6-12 kg/ADt of Na and 1.4-6.4
kg/ADt of S are added as make-up chemicals (Blackwell & Lincoln, 1998; Tran, 2008). The studied
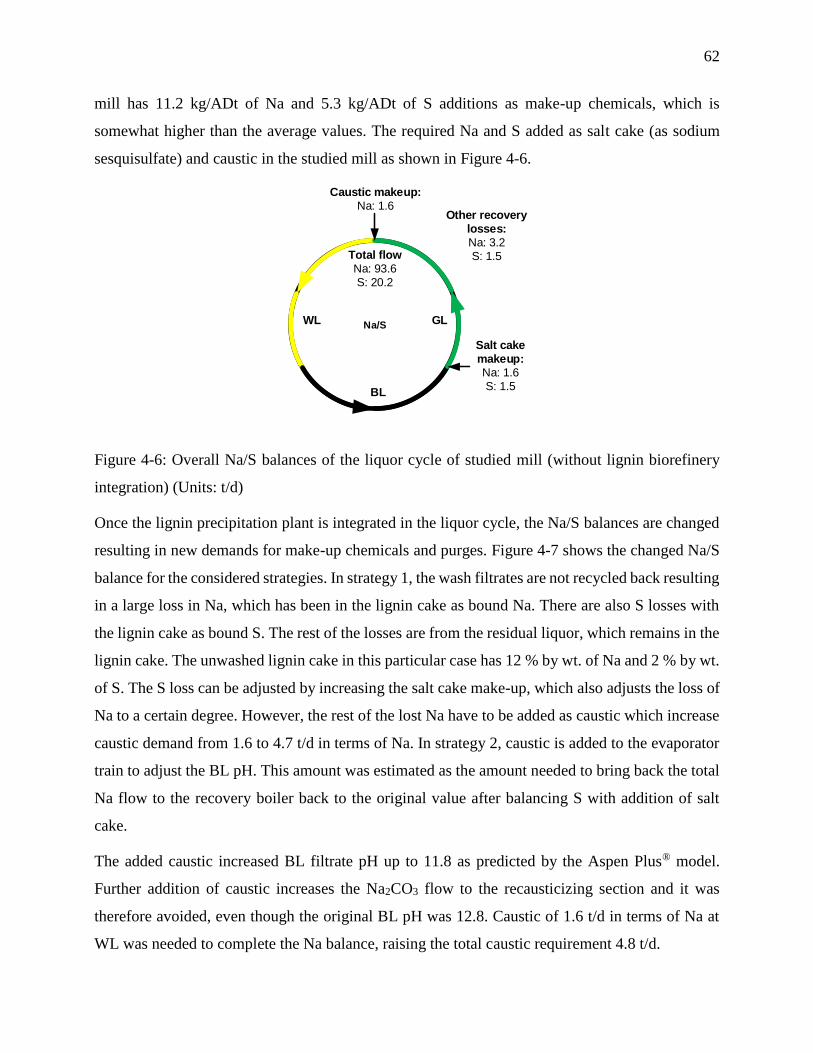
62
mill has 11.2 kg/ADt of Na and 5.3 kg/ADt of S additions as make-up chemicals, which is
somewhat higher than the average values. The required Na and S added as salt cake (as sodium
sesquisulfate) and caustic in the studied mill as shown in Figure 4-6.
Na/S
Caustic makeup:
Na: 1.6
Salt cake
makeup:
Na: 1.6
S: 1.5
Other recovery
losses:
Na: 3.2
S: 1.5Total flow
Na: 93.6
S: 20.2
BL
GLWL
Figure 4-6: Overall Na/S balances of the liquor cycle of studied mill (without lignin biorefinery
integration) (Units: t/d)
Once the lignin precipitation plant is integrated in the liquor cycle, the Na/S balances are changed
resulting in new demands for make-up chemicals and purges. Figure 4-7 shows the changed Na/S
balance for the considered strategies. In strategy 1, the wash filtrates are not recycled back resulting
in a large loss in Na, which has been in the lignin cake as bound Na. There are also S losses with
the lignin cake as bound S. The rest of the losses are from the residual liquor, which remains in the
lignin cake. The unwashed lignin cake in this particular case has 12 % by wt. of Na and 2 % by wt.
of S. The S loss can be adjusted by increasing the salt cake make-up, which also adjusts the loss of
Na to a certain degree. However, the rest of the lost Na have to be added as caustic which increase
caustic demand from 1.6 to 4.7 t/d in terms of Na. In strategy 2, caustic is added to the evaporator
train to adjust the BL pH. This amount was estimated as the amount needed to bring back the total
Na flow to the recovery boiler back to the original value after balancing S with addition of salt
cake.
The added caustic increased BL filtrate pH up to 11.8 as predicted by the Aspen Plus® model.
Further addition of caustic increases the Na2CO3 flow to the recausticizing section and it was
therefore avoided, even though the original BL pH was 12.8. Caustic of 1.6 t/d in terms of Na at
WL was needed to complete the Na balance, raising the total caustic requirement 4.8 t/d.
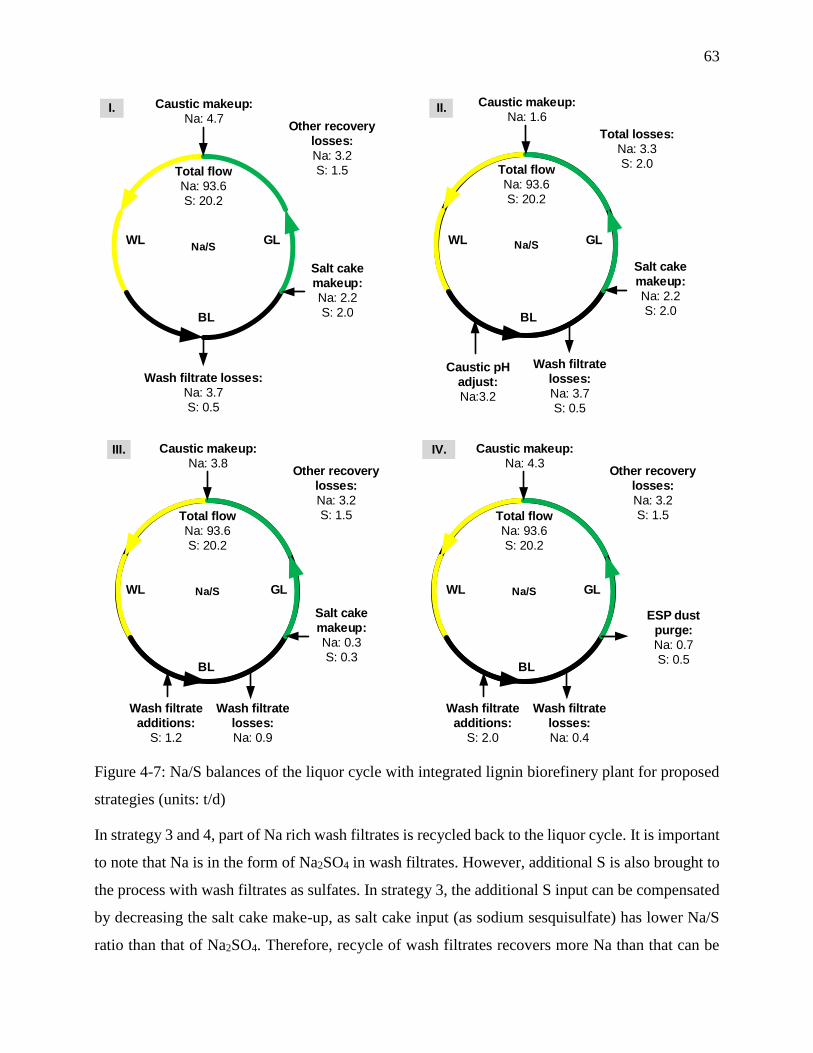
63
Na/S
Caustic makeup:Na: 4.7
Salt cake
makeup:
Na: 2.2S: 2.0
Total flow
Na: 93.6S: 20.2
Wash filtrate losses:
Na: 3.7
S: 0.5
Na/S
Caustic makeup:
Na: 1.6
Salt cake
makeup:Na: 2.2
S: 2.0
Total losses:
Na: 3.3S: 2.0
Total flowNa: 93.6
S: 20.2
Wash filtrate
losses:
Na: 3.7
S: 0.5
Caustic pH
adjust:Na:3.2
Other recovery losses:
Na: 3.2
S: 1.5
Na/S
Caustic makeup:Na: 3.8
Salt cake
makeup:
Na: 0.3
S: 0.3
Total flowNa: 93.6
S: 20.2
Wash filtrate
losses:
Na: 0.9
Other recovery
losses:
Na: 3.2S: 1.5
Wash filtrate
additions:
S: 1.2
Na/S
Caustic makeup:Na: 4.3
Total flowNa: 93.6
S: 20.2
Wash filtrate
losses:
Na: 0.4
Other recovery
losses:
Na: 3.2S: 1.5
Wash filtrate
additions:
S: 2.0
ESP dust
purge:
Na: 0.7
S: 0.5
I. II.
III. IV.
BL
GLWL
BL
GLWL
BL
GLWL
BL
GLWL
Figure 4-7: Na/S balances of the liquor cycle with integrated lignin biorefinery plant for proposed
strategies (units: t/d)
In strategy 3 and 4, part of Na rich wash filtrates is recycled back to the liquor cycle. It is important
to note that Na is in the form of Na2SO4 in wash filtrates. However, additional S is also brought to
the process with wash filtrates as sulfates. In strategy 3, the additional S input can be compensated
by decreasing the salt cake make-up, as salt cake input (as sodium sesquisulfate) has lower Na/S
ratio than that of Na2SO4. Therefore, recycle of wash filtrates recovers more Na than that can be
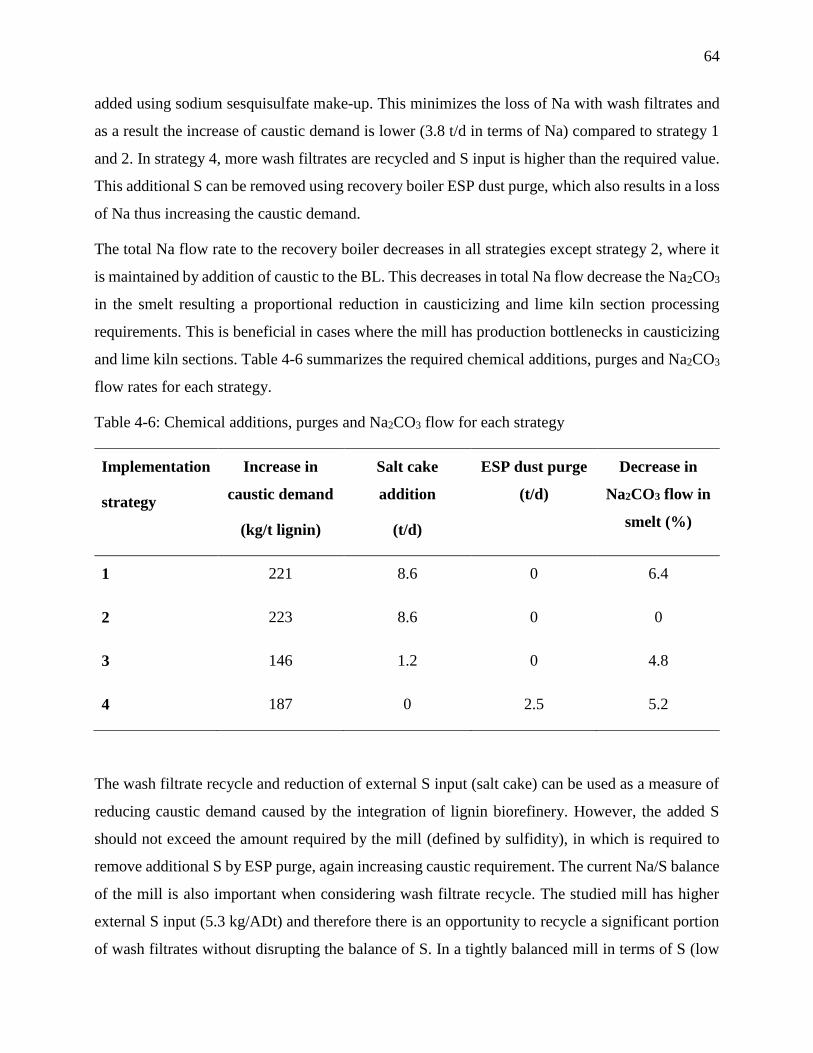
64
added using sodium sesquisulfate make-up. This minimizes the loss of Na with wash filtrates and
as a result the increase of caustic demand is lower (3.8 t/d in terms of Na) compared to strategy 1
and 2. In strategy 4, more wash filtrates are recycled and S input is higher than the required value.
This additional S can be removed using recovery boiler ESP dust purge, which also results in a loss
of Na thus increasing the caustic demand.
The total Na flow rate to the recovery boiler decreases in all strategies except strategy 2, where it
is maintained by addition of caustic to the BL. This decreases in total Na flow decrease the Na2CO3
in the smelt resulting a proportional reduction in causticizing and lime kiln section processing
requirements. This is beneficial in cases where the mill has production bottlenecks in causticizing
and lime kiln sections. Table 4-6 summarizes the required chemical additions, purges and Na2CO3
flow rates for each strategy.
Table 4-6: Chemical additions, purges and Na2CO3 flow for each strategy
Implementation
strategy
Increase in
caustic demand
(kg/t lignin)
Salt cake
addition
(t/d)
ESP dust purge
(t/d)
Decrease in
Na2CO3 flow in
smelt (%)
1 221 8.6 0 6.4
2 223 8.6 0 0
3 146 1.2 0 4.8
4 187 0 2.5 5.2
The wash filtrate recycle and reduction of external S input (salt cake) can be used as a measure of
reducing caustic demand caused by the integration of lignin biorefinery. However, the added S
should not exceed the amount required by the mill (defined by sulfidity), in which is required to
remove additional S by ESP purge, again increasing caustic requirement. The current Na/S balance
of the mill is also important when considering wash filtrate recycle. The studied mill has higher
external S input (5.3 kg/ADt) and therefore there is an opportunity to recycle a significant portion
of wash filtrates without disrupting the balance of S. In a tightly balanced mill in terms of S (low
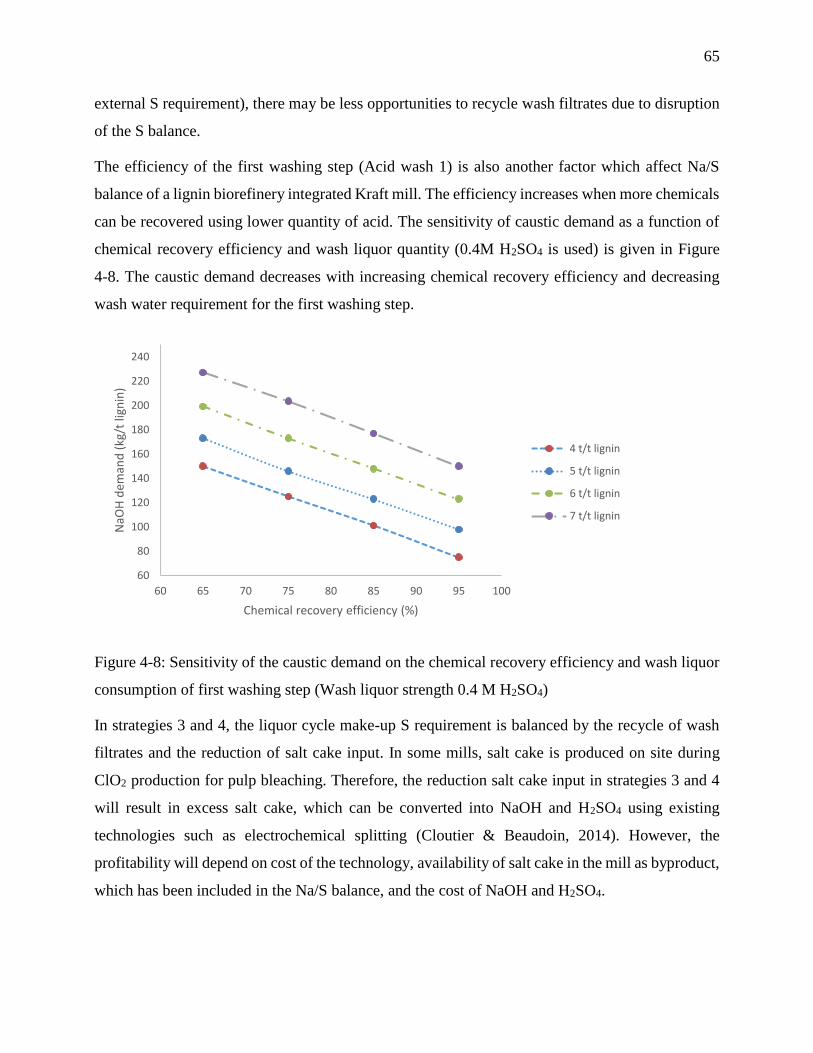
65
external S requirement), there may be less opportunities to recycle wash filtrates due to disruption
of the S balance.
The efficiency of the first washing step (Acid wash 1) is also another factor which affect Na/S
balance of a lignin biorefinery integrated Kraft mill. The efficiency increases when more chemicals
can be recovered using lower quantity of acid. The sensitivity of caustic demand as a function of
chemical recovery efficiency and wash liquor quantity (0.4M H2SO4 is used) is given in Figure
4-8. The caustic demand decreases with increasing chemical recovery efficiency and decreasing
wash water requirement for the first washing step.
Figure 4-8: Sensitivity of the caustic demand on the chemical recovery efficiency and wash liquor
consumption of first washing step (Wash liquor strength 0.4 M H2SO4)
In strategies 3 and 4, the liquor cycle make-up S requirement is balanced by the recycle of wash
filtrates and the reduction of salt cake input. In some mills, salt cake is produced on site during
ClO2 production for pulp bleaching. Therefore, the reduction salt cake input in strategies 3 and 4
will result in excess salt cake, which can be converted into NaOH and H2SO4 using existing
technologies such as electrochemical splitting (Cloutier & Beaudoin, 2014). However, the
profitability will depend on cost of the technology, availability of salt cake in the mill as byproduct,
which has been included in the Na/S balance, and the cost of NaOH and H2SO4.
60
80
100
120
140
160
180
200
220
240
60 65 70 75 80 85 90 95 100
NaO
H d
eman
d (
kg/t
lign
in)
Chemical recovery efficiency (%)
4 t/t lignin
5 t/t lignin
6 t/t lignin
7 t/t lignin
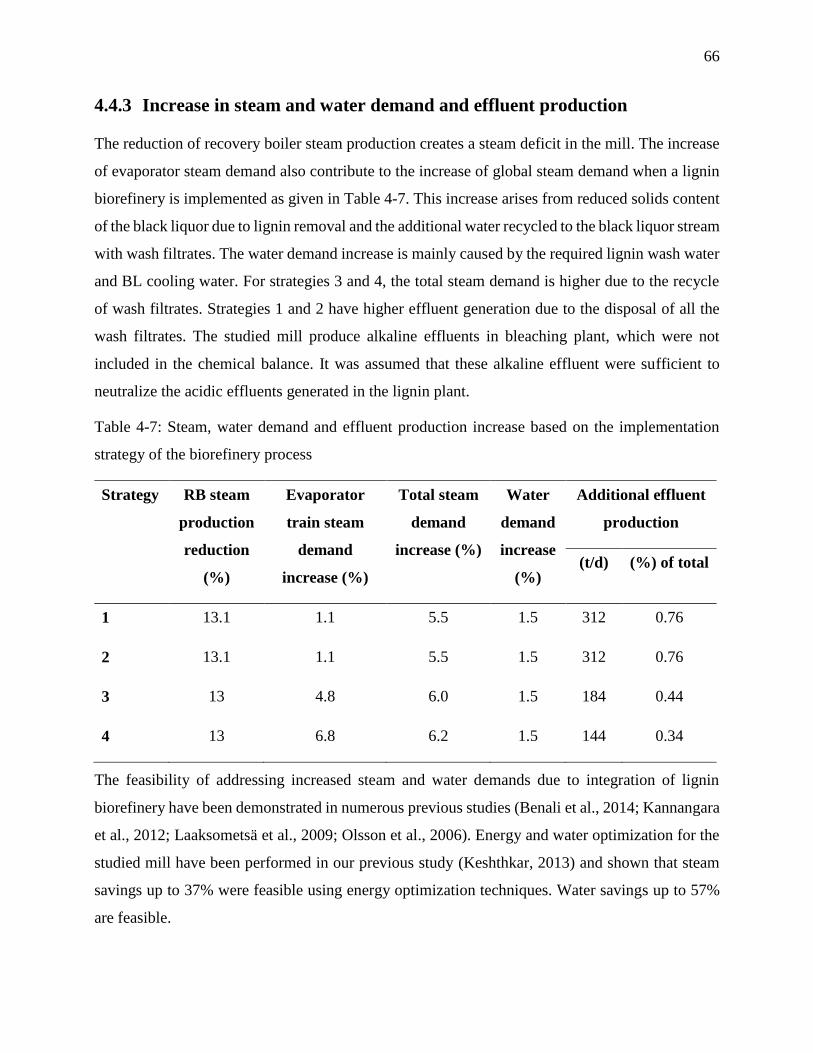
66
4.4.3 Increase in steam and water demand and effluent production
The reduction of recovery boiler steam production creates a steam deficit in the mill. The increase
of evaporator steam demand also contribute to the increase of global steam demand when a lignin
biorefinery is implemented as given in Table 4-7. This increase arises from reduced solids content
of the black liquor due to lignin removal and the additional water recycled to the black liquor stream
with wash filtrates. The water demand increase is mainly caused by the required lignin wash water
and BL cooling water. For strategies 3 and 4, the total steam demand is higher due to the recycle
of wash filtrates. Strategies 1 and 2 have higher effluent generation due to the disposal of all the
wash filtrates. The studied mill produce alkaline effluents in bleaching plant, which were not
included in the chemical balance. It was assumed that these alkaline effluent were sufficient to
neutralize the acidic effluents generated in the lignin plant.
Table 4-7: Steam, water demand and effluent production increase based on the implementation
strategy of the biorefinery process
Strategy RB steam
production
reduction
(%)
Evaporator
train steam
demand
increase (%)
Total steam
demand
increase (%)
Water
demand
increase
(%)
Additional effluent
production
(t/d) (%) of total
1 13.1 1.1 5.5 1.5 312 0.76
2 13.1 1.1 5.5 1.5 312 0.76
3 13 4.8 6.0 1.5 184 0.44
4 13 6.8 6.2 1.5 144 0.34
The feasibility of addressing increased steam and water demands due to integration of lignin
biorefinery have been demonstrated in numerous previous studies (Benali et al., 2014; Kannangara
et al., 2012; Laaksometsä et al., 2009; Olsson et al., 2006). Energy and water optimization for the
studied mill have been performed in our previous study (Keshthkar, 2013) and shown that steam
savings up to 37% were feasible using energy optimization techniques. Water savings up to 57%
are feasible.
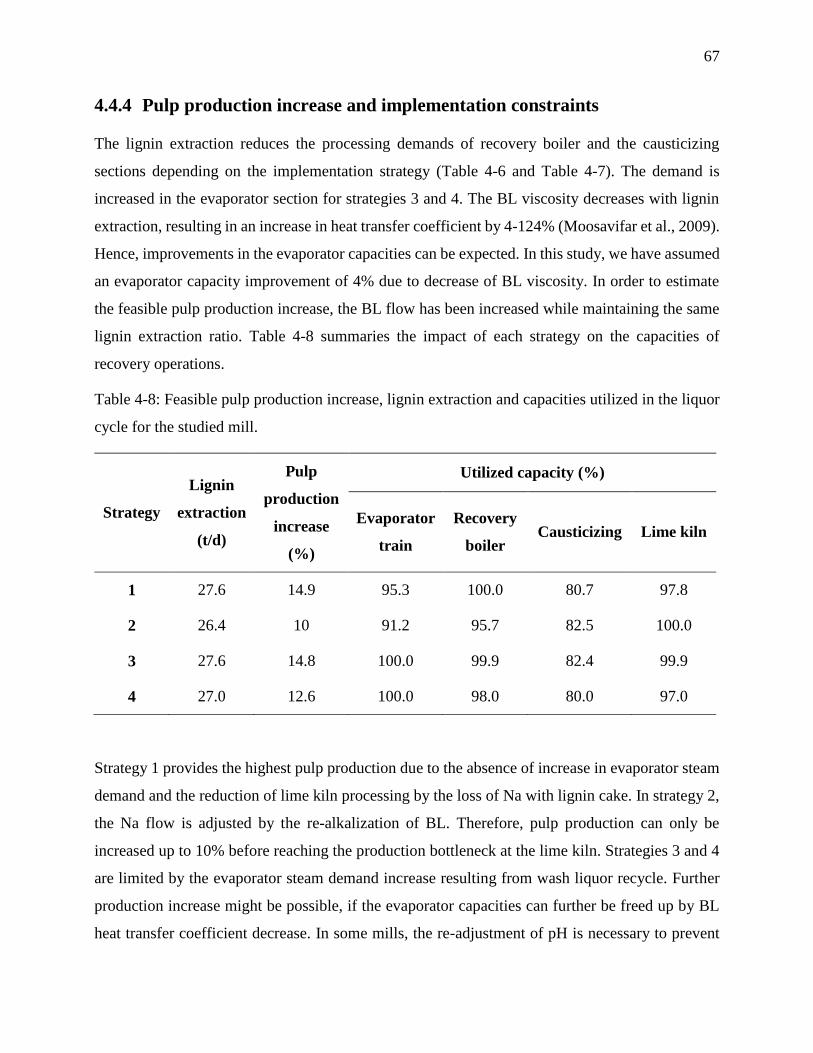
67
4.4.4 Pulp production increase and implementation constraints
The lignin extraction reduces the processing demands of recovery boiler and the causticizing
sections depending on the implementation strategy (Table 4-6 and Table 4-7). The demand is
increased in the evaporator section for strategies 3 and 4. The BL viscosity decreases with lignin
extraction, resulting in an increase in heat transfer coefficient by 4-124% (Moosavifar et al., 2009).
Hence, improvements in the evaporator capacities can be expected. In this study, we have assumed
an evaporator capacity improvement of 4% due to decrease of BL viscosity. In order to estimate
the feasible pulp production increase, the BL flow has been increased while maintaining the same
lignin extraction ratio. Table 4-8 summaries the impact of each strategy on the capacities of
recovery operations.
Table 4-8: Feasible pulp production increase, lignin extraction and capacities utilized in the liquor
cycle for the studied mill.
Strategy
Lignin
extraction
(t/d)
Pulp
production
increase
(%)
Utilized capacity (%)
Evaporator
train
Recovery
boiler Causticizing Lime kiln
1 27.6 14.9 95.3 100.0 80.7 97.8
2 26.4 10 91.2 95.7 82.5 100.0
3 27.6 14.8 100.0 99.9 82.4 99.9
4 27.0 12.6 100.0 98.0 80.0 97.0
Strategy 1 provides the highest pulp production due to the absence of increase in evaporator steam
demand and the reduction of lime kiln processing by the loss of Na with lignin cake. In strategy 2,
the Na flow is adjusted by the re-alkalization of BL. Therefore, pulp production can only be
increased up to 10% before reaching the production bottleneck at the lime kiln. Strategies 3 and 4
are limited by the evaporator steam demand increase resulting from wash liquor recycle. Further
production increase might be possible, if the evaporator capacities can further be freed up by BL
heat transfer coefficient decrease. In some mills, the re-adjustment of pH is necessary to prevent
68
increased sulfur gas emissions from BL and combustibility issues caused by reduced residual alkali
of BL. Therefore, the choice of BL re-alkalization and wash filtrates recycle strategy will also be
dependent on the constraints of the mill.
4.5 Conclusions
The proposed simulation approach was utilized to study the implementation of a lignin biorefinery
in a Kraft pulping mill with an emphasis on process chemistry and Na/S balances. For a Kraft
pulping mill with 285 ADt/d Kraft pulp capacity, a lignin extraction ratio of 15% was feasible
according to the recovery boiler calorific value constraints resulting in a lignin biorefinery plant of
24 t/d in a mill. Four strategies of Na/S balance were analyzed and following conclusions have
been made with regard to the implementation of lignin biorefineries in the studied Kraft pulping
mill.
The unwashed lignin cake is enriched with Na (around 12% by wt.) and hence the generated
wash filtrates contain a significant amount of Na mixed with S from H2SO4 and diluted
with water. Therefore, recycling of the most concentrated wash filtrates (from first washing
step) should be considered to minimize the loss of Na.
Additional S that is introduced with recycled wash filtrates, can be balanced by reducing
the S make-up (salt cake in the mill studied) or increasing ESP purge, which also removes
Na. The additional make-up caustic demand reached a minimum of 146 kg/t lignin for this
case when maximum amount of wash filtrates was recycled before increasing the ESP
purge. As increasing ESP purge increases the make-up caustic demand. Adding extra S
with wash filtrates to the liquor cycle than required by the mill sulfidity is not, hence,
recommended. Mills with larger external S requirement would be able handle more wash
filtrates than tightly balanced mills in terms of S.
The sensitivity analysis revealed that the minimum caustic demand is a function of the
chemical recovery efficiency and wash liquor demand of the first washing step and that it
can be decreased below 100 kg/t lignin by improving the washing efficiency. Therefore,
improving the washing operation, to achieve highest chemical removal with minimum
amount of acid, should be considered to minimize the disruption of Na/S balances.
Since most Kraft mill liquor cycles are also limited by other operations such as evaporator
train, causticizing and lime kiln, the recycling strategies should balance the impact on other
69
recovery operations. The recycle of water with wash filtrates increases the evaporator train
load, re-adjusting the pH of BL in evaporators can increase the causticizing and lime kiln
loads and recovery of Na with wash filtrate recycle can decrease the extent of reduction of
causticizing and lime kiln loads. Due to these impacts, Kraft pulping mills with limited
thermal capacities in recovery boiler and large unitized capacities in the rest of the liquor
cycle are ideal for implementation of lignin biorefineries with pulp production increase. For
the studied mill, a pulp production increase up to 14.9% was feasible without considering
other liquor cycle bottlenecks.
For the studied mill, a strategy of 5 t/t of lignin wash filtrate recycle with no BL pH
adjustment in the evaporators balanced the disruption of Na/S balance, evaporator steam
demand increase and chemical loads to causticizing loop and lime kiln, providing a
minimum caustic demand at 146 kg/t lignin and highest pulp production increase at 14.8%.
When applying to this strategy to another mill, the ability to accommodate external S, the
need to re-alkalize black liquor, available capacities in evaporator train and causticizing
loop have to be considered.
Although the estimated values of lignin extraction, caustic make-up demand and pulp production
increase are specific to the studied Kraft pulping mill, the conclusions can be used as general
guidelines in implementing lignin biorefineries in Kraft pulping mills. The constraints imposed by
each mill have to be taken into account together with changed mill balances in order obtain
successful biorefinery implementations.
4.6 Acknowledgements
This work was financially supported by the BioFuelNet Canada. The authors are grateful to
industrial partners for providing the data used in the study.
4.7 References
Alen, R., Patja, P., & Sjöström, E. (1979). Carbon dioxide precipitation of lignin from pine kraft
black liquor. Tappi, 62(11), 108-110.
Andersson, P. (2014). A dynamic Na/S balance of a kraft pulp mill. Karlstad University.
Benali, M., Périn-Levasseur, Z., Savulescu, L., Kouisni, L., Jemaa, N., Kudra, T., & Paleologou,
M. (2014). Implementation of lignin-based biorefinery into a Canadian softwood kraft pulp
70
mill: Optimal resources integration and economic viability assessment. Biomass and
Bioenergy, 67(0), 473-482.
Blackwell, B., & Lincoln, D. (1998). Sodium/sulphur/chlorine balance demonstrated low liquor
losses at a kraft mill. Pulp and Paper Canada, 99(1), 74-78.
Bozell, J., Holladay, J., Johnson, D., & White, J. (2007). Top value added Chemicals from
Biomass.Volume II–Results of Screening for Potential Candidates from Biorefinery Lignin,
US Department of energy, report PnnL-983. In P. N. N. Laboratory (Ed.),
http://www1.eere.energy.gov/bioenergy/pdfs/pnnl-16983.pdf.
Cloutier, J.-N., & Beaudoin, L. (2014, 8-13 June, 2014). New source of caustic for Kraft mills from
the electrolysis of sodium sulphate - preliminary economics. Paper presented at the
International Chemical Recovery Conference, Tampere, Finland.
Dahlin, P. (2015). Na/S balances at Skoghall mill 2015: Balances after reconstruction of the fiber
line. (Master), Karlstad University.
Hamaguchi, M., & Vakkilainen, E. (2010, 12-15 October). The influence of lignin removal on the
energy balance of future pulp mills. Paper presented at the XXI TECNICELPA Conference
and Exhibition, Lisbon, Portugal.
Kannangara, M., Marinova, M., Fradette, L., & Paris, J. (2012). Lignin recovery by acid
precipitation in a kraft mill: An energy perspective, 740 rue Notre-Dame ouest, Bureau 810,
Montreal, Quebec, H3C 3X6, Canada.
Keshthkar, J. (2013). Steam and water combined analysis, integration and efficiency enhancement
in Kraft pulping mills. (PhD), Ecole Polytechnique Montreal.
Kouisni, L., Holt-Hindle, P., Maki, K., & Paleologou, M. (2012). The lignoforce system: A new
process for the production of high-quality lignin from black liquor. J-FOR: The Journal of
Science and Technology for Forest Products and Processes, 2, 6-10.
Laaksometsä, C., Axelsson, E., Berntsson, T., & Lundström, A. (2009). Energy savings combined
with lignin extraction for production increase: case study at a eucalyptus mill in Portugal.
Clean Technologies and Environmental Policy, 11(1), 77-82.
Lockhart, J. (2008). Precipitator dust purification for Kraft mill chloride reduction. Paper
presented at the Black liquor recvoery boiler advisory committe Conference, Atlanta,
United States.
Loutfi, H., Blackwell, B., & Uloth, V. (1991). Lignin recovery from kraft black liquor: preliminary
process design. Tappi Journal, 74(1), 203-210.
Moosavifar, A., Sedin, M., & Theliander, H. (2009). Changes in viscosity and boiling point
elevation of black liquor when a fraction of lignin is removed - Consequences in the
evaporation stage. Appita Journal, 62(5), 383-390.
Olsson, M. R., Axelsson, E., & Berntsson, T. (2006). Exporting lignin or power from heat-
integrated kraft pulp mills: A techno-economic comparison using model mills. Nordic Pulp
and Paper Research Journal.
Perin-Levasseur, Z., Benali, M., & Paris, J. (2010). Lignin Extraction Technology Integrated in a
Kraft Pulp Mill : Implementation Strategy. Paper presented at the 3rd International
71
Conference on Efficiency, Cost, Optimization, Simulation and Environmental Impact of
Energy Systems, Lausanne, Switzerland.
Saturnino, D. M. (2012). Modeling of Kraft Mill Chemical Balance. University of Toronto.
Silva, E. A. B. d., Zabkova, M., Araújo, J. D., Cateto, C. A., Barreiro, M. F., Belgacem, M. N., &
Rodrigues, A. E. (2009). An integrated process to produce vanillin and lignin-based
polyurethanes from Kraft lignin. Chemical Engineering Research and Design, 87(9), 1276-
1292.
Smook, G. A. (1992). Handbook for pulp and paper technologists (Third Edition ed.). Vancouver:
Angus Wilde Publications.
Stevens, F., Grace, T., & Leopold, B. (1989). Alkaline pulping: Pulp and paper manufacture:
Technical Section, Canadian Pulp and Paper Association.
Tomani, P. (2010). The lignoboost process. Cellulose Chemistry and Technology, 44(1-3), 53-58.
Tran, H. (2008, 7-10 Januray, 2008). The Kraft Recovery Process. Paper presented at the Tappi
Kraft Recovey Short Course, St. Petersburg, Florida, United States.
Uloth, V. C., & Wearing, J. T. (1989). Kraft lignin recovery: acid precipitation versus
ultrafiltration, Part II: Technology and economics. Pulp & Paper Canada, 90(10), 34-37.
Vakkilainen, E., & Valimaki, E. (2009). Effect of lignin separation to black liquor and recovery
boiler operation, Memphis, TN, United states.
Vakkilainen, E. K. (2000). Estimation of elemental composition from proximate analysis of black
liquor. Paperi ja Puu/Paper and Timber, 82(7), 450-454.
Valimaki, E., Niemi, P., & Haaga, K. (2010 ). A case study on the effects of lignin recovery on
recovery boiler operation. Paper presented at the TAPPI/PAPTAC International Chemical
Recovery Conference, Williamsburg, VA, United states.
Wallmo, H., Richards, T., & Theliander, H. (2007). Lignin precipitation from kraft black liquors:
kinetics and carbon dioxide absorption. Paperi ja puu, 89(7-8), 436-442.
Wising, U., Algehed, J., Berntsson, T., & Delin, L. (2006). Consequences of lignin precipitation in
the pulp and paper industry.
Wooley, R., & Putsche, V. (1996). Development of an ASPEN PLUS Physical Property Database
for Biofuels Components. Golden,CO,: National Renewable Energy Laboratory.
72
ARTICLE 3: EFFECT OF MIXING HYDRODYNAMICS ON
THE PARTICLE AND FILTRATION PROPERTIES OF
PRECIPITATED LIGNIN
Miyuru Kannangara, Mariya Marinova, Louis Fradette, and Jean Paris
Research Unit on Energy Efficiency and Sustainable Development of the Forest Biorefinery,
Department of Chemical Engineering, Polytechnique Montreal, C.P. 6079, succ. Centre-Ville,
Montréal, QC, Canada H3C 3A7
Abstract
The effects of mixing hydrodynamics on the particle and filtration properties of precipitated lignin
from black liquor has been investigated. The hydrodynamics were varied in terms of turbulent
shear rate and impeller flow pattern in the stirred tank. The precipitated lignin flocs were
characterized in terms of particle size, size distribution, and particle shape. Our findings showed
that the effect of hydrodynamics on the size and shape of primary lignin particles were negligible.
However, as lignin primary particles aggregate into larger flocs, the impact of hydrodynamics
became increasingly important. More compact and smaller lignin flocs were produced at higher
turbulent shear levels during black liquor pH reduction (acidification step). Upon further mixing
(ageing step), these flocs aggregated into much larger flocs as the level of turbulence was reduced
after the acidification step. They had narrow size distributions. The size of the final flocs varied
mainly with the turbulent shear rate, minimum shear rate producing largest particles. However, low
shear acidification produced loose particles with wide size distributions and lower strength, making
them susceptible to breakage due to impeller action. The low shear impeller showed better
aggregation with loose particles. Lignin flocs with higher compactness and size showed better
filtration and washing properties. Optimal hydrodynamic conditions led to production of lignin
with good filtration and washing properties at 1.83E+09 m/kg specific filtration resistance, 243
kg/h.m2 lignin filtration rate and 0.09% ash content. The reproducibility of the results was validated
using black liquor samples from three Kraft pulping mills.
Keywords
Lignin precipitation, Kraft process, hydrodynamics, particle properties, filtration
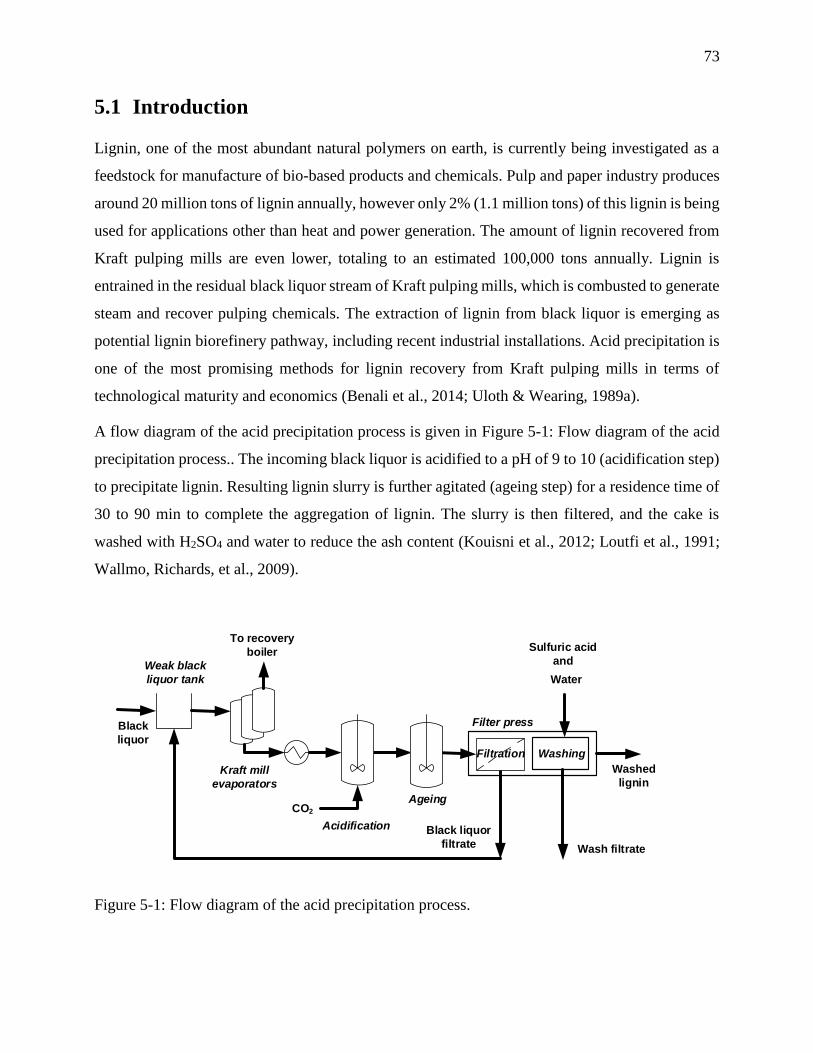
73
5.1 Introduction
Lignin, one of the most abundant natural polymers on earth, is currently being investigated as a
feedstock for manufacture of bio-based products and chemicals. Pulp and paper industry produces
around 20 million tons of lignin annually, however only 2% (1.1 million tons) of this lignin is being
used for applications other than heat and power generation. The amount of lignin recovered from
Kraft pulping mills are even lower, totaling to an estimated 100,000 tons annually. Lignin is
entrained in the residual black liquor stream of Kraft pulping mills, which is combusted to generate
steam and recover pulping chemicals. The extraction of lignin from black liquor is emerging as
potential lignin biorefinery pathway, including recent industrial installations. Acid precipitation is
one of the most promising methods for lignin recovery from Kraft pulping mills in terms of
technological maturity and economics (Benali et al., 2014; Uloth & Wearing, 1989a).
A flow diagram of the acid precipitation process is given in Figure 5-1: Flow diagram of the acid
precipitation process.. The incoming black liquor is acidified to a pH of 9 to 10 (acidification step)
to precipitate lignin. Resulting lignin slurry is further agitated (ageing step) for a residence time of
30 to 90 min to complete the aggregation of lignin. The slurry is then filtered, and the cake is
washed with H2SO4 and water to reduce the ash content (Kouisni et al., 2012; Loutfi et al., 1991;
Wallmo, Richards, et al., 2009).
Black
liquor
Weak black
liquor tank
Kraft mill
evaporators
Acidification
To recovery
boiler
CO2
Sulfuric acid
and
Water
Washed
lignin
Ageing
Filtration Washing
Filter press
Wash filtrate
Black liquor
filtrate
Figure 5-1: Flow diagram of the acid precipitation process.
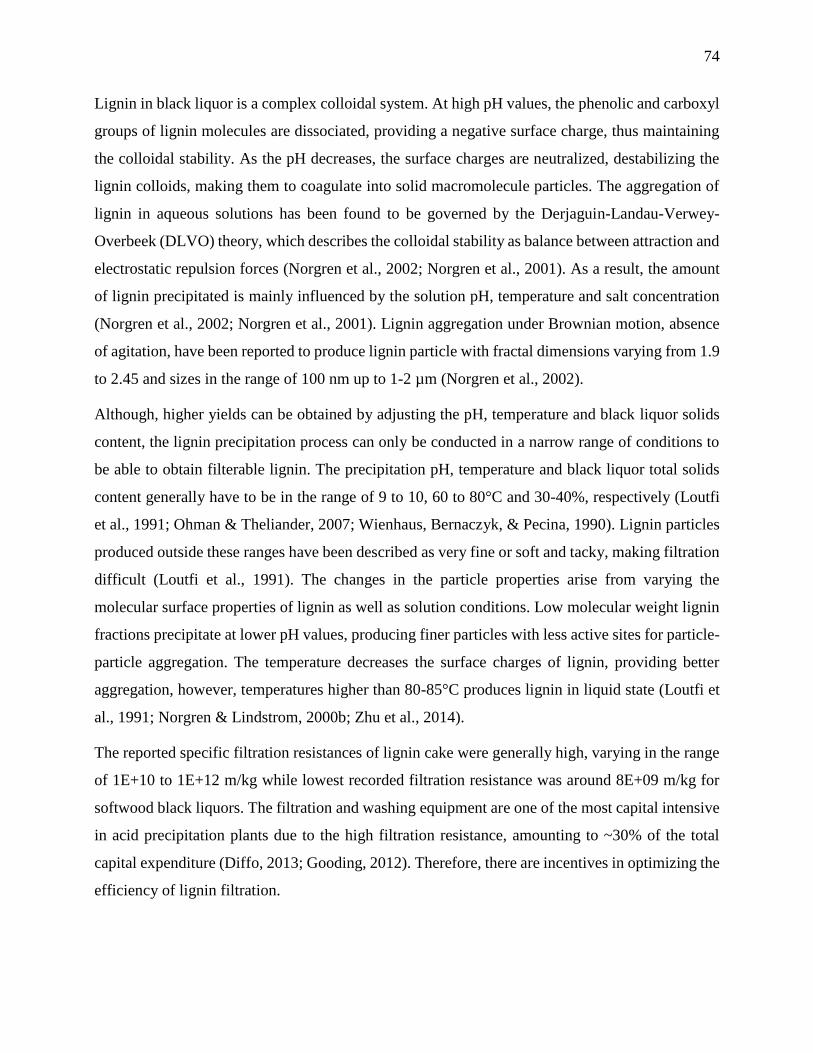
74
Lignin in black liquor is a complex colloidal system. At high pH values, the phenolic and carboxyl
groups of lignin molecules are dissociated, providing a negative surface charge, thus maintaining
the colloidal stability. As the pH decreases, the surface charges are neutralized, destabilizing the
lignin colloids, making them to coagulate into solid macromolecule particles. The aggregation of
lignin in aqueous solutions has been found to be governed by the Derjaguin-Landau-Verwey-
Overbeek (DLVO) theory, which describes the colloidal stability as balance between attraction and
electrostatic repulsion forces (Norgren et al., 2002; Norgren et al., 2001). As a result, the amount
of lignin precipitated is mainly influenced by the solution pH, temperature and salt concentration
(Norgren et al., 2002; Norgren et al., 2001). Lignin aggregation under Brownian motion, absence
of agitation, have been reported to produce lignin particle with fractal dimensions varying from 1.9
to 2.45 and sizes in the range of 100 nm up to 1-2 µm (Norgren et al., 2002).
Although, higher yields can be obtained by adjusting the pH, temperature and black liquor solids
content, the lignin precipitation process can only be conducted in a narrow range of conditions to
be able to obtain filterable lignin. The precipitation pH, temperature and black liquor total solids
content generally have to be in the range of 9 to 10, 60 to 80°C and 30-40%, respectively (Loutfi
et al., 1991; Ohman & Theliander, 2007; Wienhaus, Bernaczyk, & Pecina, 1990). Lignin particles
produced outside these ranges have been described as very fine or soft and tacky, making filtration
difficult (Loutfi et al., 1991). The changes in the particle properties arise from varying the
molecular surface properties of lignin as well as solution conditions. Low molecular weight lignin
fractions precipitate at lower pH values, producing finer particles with less active sites for particle-
particle aggregation. The temperature decreases the surface charges of lignin, providing better
aggregation, however, temperatures higher than 80-85°C produces lignin in liquid state (Loutfi et
al., 1991; Norgren & Lindstrom, 2000b; Zhu et al., 2014).
The reported specific filtration resistances of lignin cake were generally high, varying in the range
of 1E+10 to 1E+12 m/kg while lowest recorded filtration resistance was around 8E+09 m/kg for
softwood black liquors. The filtration and washing equipment are one of the most capital intensive
in acid precipitation plants due to the high filtration resistance, amounting to ~30% of the total
capital expenditure (Diffo, 2013; Gooding, 2012). Therefore, there are incentives in optimizing the
efficiency of lignin filtration.
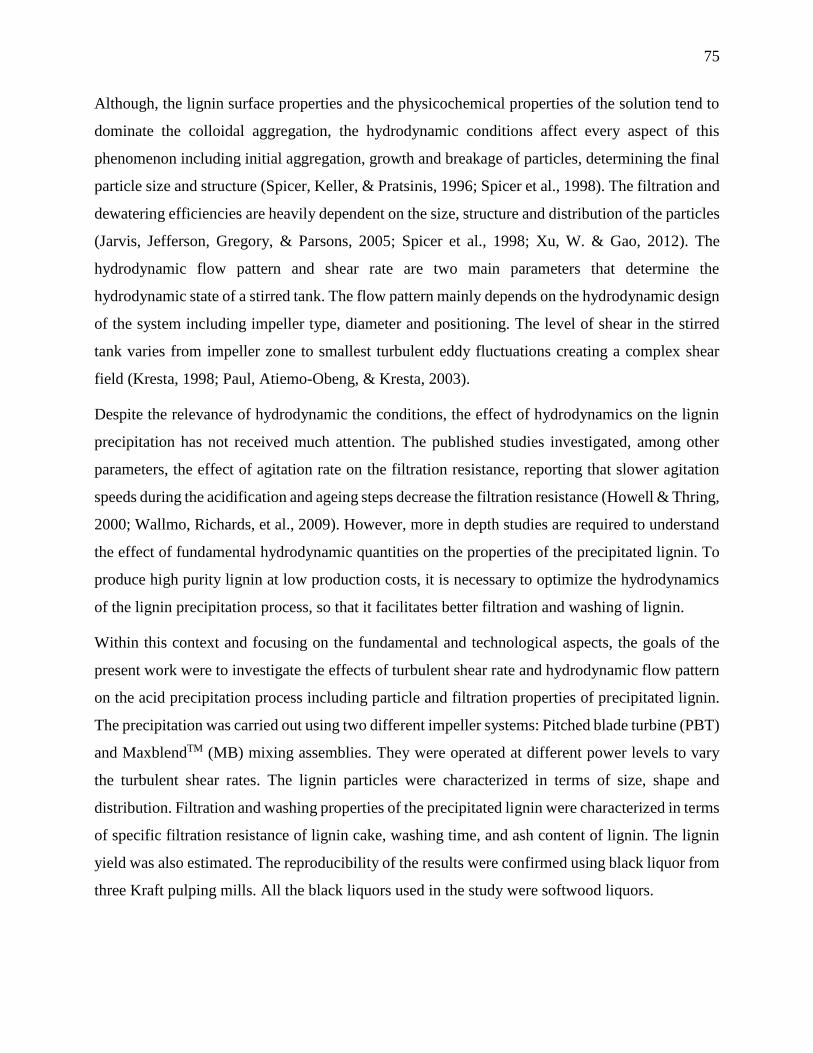
75
Although, the lignin surface properties and the physicochemical properties of the solution tend to
dominate the colloidal aggregation, the hydrodynamic conditions affect every aspect of this
phenomenon including initial aggregation, growth and breakage of particles, determining the final
particle size and structure (Spicer, Keller, & Pratsinis, 1996; Spicer et al., 1998). The filtration and
dewatering efficiencies are heavily dependent on the size, structure and distribution of the particles
(Jarvis, Jefferson, Gregory, & Parsons, 2005; Spicer et al., 1998; Xu, W. & Gao, 2012). The
hydrodynamic flow pattern and shear rate are two main parameters that determine the
hydrodynamic state of a stirred tank. The flow pattern mainly depends on the hydrodynamic design
of the system including impeller type, diameter and positioning. The level of shear in the stirred
tank varies from impeller zone to smallest turbulent eddy fluctuations creating a complex shear
field (Kresta, 1998; Paul, Atiemo-Obeng, & Kresta, 2003).
Despite the relevance of hydrodynamic the conditions, the effect of hydrodynamics on the lignin
precipitation has not received much attention. The published studies investigated, among other
parameters, the effect of agitation rate on the filtration resistance, reporting that slower agitation
speeds during the acidification and ageing steps decrease the filtration resistance (Howell & Thring,
2000; Wallmo, Richards, et al., 2009). However, more in depth studies are required to understand
the effect of fundamental hydrodynamic quantities on the properties of the precipitated lignin. To
produce high purity lignin at low production costs, it is necessary to optimize the hydrodynamics
of the lignin precipitation process, so that it facilitates better filtration and washing of lignin.
Within this context and focusing on the fundamental and technological aspects, the goals of the
present work were to investigate the effects of turbulent shear rate and hydrodynamic flow pattern
on the acid precipitation process including particle and filtration properties of precipitated lignin.
The precipitation was carried out using two different impeller systems: Pitched blade turbine (PBT)
and MaxblendTM (MB) mixing assemblies. They were operated at different power levels to vary
the turbulent shear rates. The lignin particles were characterized in terms of size, shape and
distribution. Filtration and washing properties of the precipitated lignin were characterized in terms
of specific filtration resistance of lignin cake, washing time, and ash content of lignin. The lignin
yield was also estimated. The reproducibility of the results were confirmed using black liquor from
three Kraft pulping mills. All the black liquors used in the study were softwood liquors.
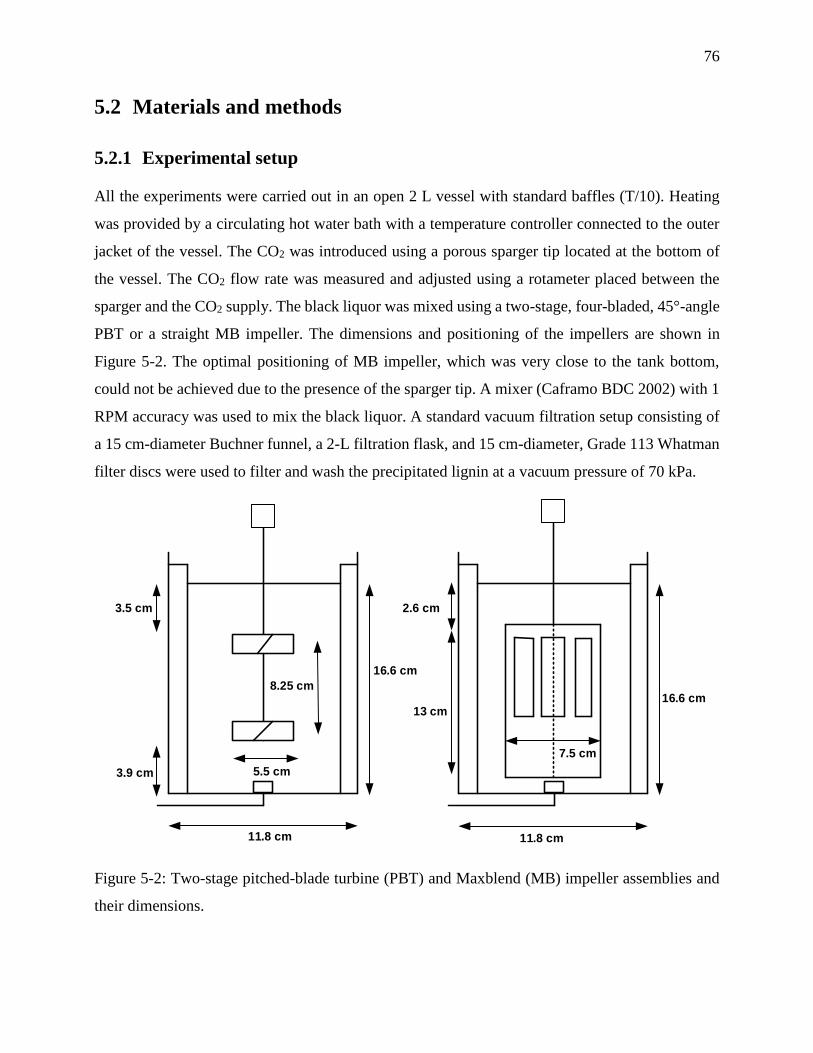
76
5.2 Materials and methods
5.2.1 Experimental setup
All the experiments were carried out in an open 2 L vessel with standard baffles (T/10). Heating
was provided by a circulating hot water bath with a temperature controller connected to the outer
jacket of the vessel. The CO2 was introduced using a porous sparger tip located at the bottom of
the vessel. The CO2 flow rate was measured and adjusted using a rotameter placed between the
sparger and the CO2 supply. The black liquor was mixed using a two-stage, four-bladed, 45°-angle
PBT or a straight MB impeller. The dimensions and positioning of the impellers are shown in
Figure 5-2. The optimal positioning of MB impeller, which was very close to the tank bottom,
could not be achieved due to the presence of the sparger tip. A mixer (Caframo BDC 2002) with 1
RPM accuracy was used to mix the black liquor. A standard vacuum filtration setup consisting of
a 15 cm-diameter Buchner funnel, a 2-L filtration flask, and 15 cm-diameter, Grade 113 Whatman
filter discs were used to filter and wash the precipitated lignin at a vacuum pressure of 70 kPa.
11.8 cm11.8 cm
3.9 cm
7.5 cm
8.25 cm16.6 cm
16.6 cm
5.5 cm
3.5 cm 2.6 cm
13 cm
Figure 5-2: Two-stage pitched-blade turbine (PBT) and Maxblend (MB) impeller assemblies and
their dimensions.
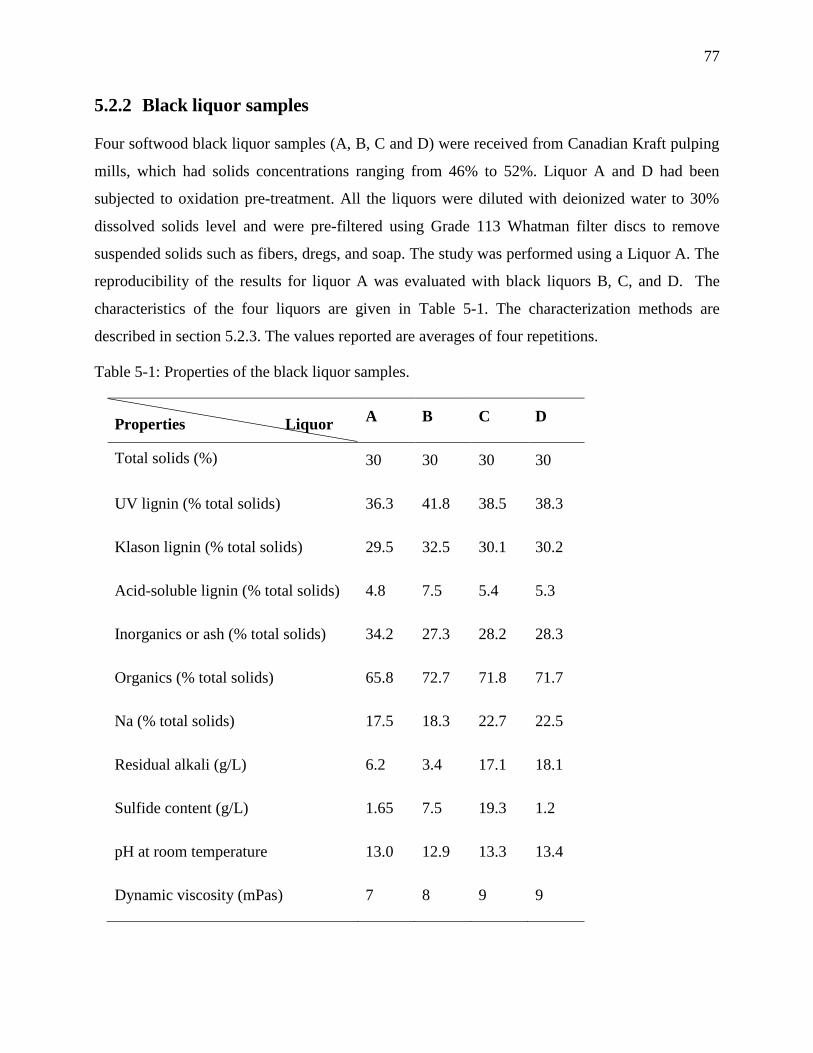
77
5.2.2 Black liquor samples
Four softwood black liquor samples (A, B, C and D) were received from Canadian Kraft pulping
mills, which had solids concentrations ranging from 46% to 52%. Liquor A and D had been
subjected to oxidation pre-treatment. All the liquors were diluted with deionized water to 30%
dissolved solids level and were pre-filtered using Grade 113 Whatman filter discs to remove
suspended solids such as fibers, dregs, and soap. The study was performed using a Liquor A. The
reproducibility of the results for liquor A was evaluated with black liquors B, C, and D. The
characteristics of the four liquors are given in Table 5-1. The characterization methods are
described in section 5.2.3. The values reported are averages of four repetitions.
Table 5-1: Properties of the black liquor samples.
Properties Liquor A B C D
Total solids (%) 30 30 30 30
UV lignin (% total solids) 36.3 41.8 38.5 38.3
Klason lignin (% total solids) 29.5 32.5 30.1 30.2
Acid-soluble lignin (% total solids) 4.8 7.5 5.4 5.3
Inorganics or ash (% total solids) 34.2 27.3 28.2 28.3
Organics (% total solids) 65.8 72.7 71.8 71.7
Na (% total solids) 17.5 18.3 22.7 22.5
Residual alkali (g/L) 6.2 3.4 17.1 18.1
Sulfide content (g/L) 1.65 7.5 19.3 1.2
pH at room temperature 13.0 12.9 13.3 13.4
Dynamic viscosity (mPas) 7 8 9 9
78
5.2.3 Characterization of the black liquors, filtrates, and lignin samples
The total solids content was estimated by drying a known amount of liquor or lignin at 105°C based
on the CPPA J.15 (II) standard test procedure. The UV lignin content was determined using a
Biochrom Ultrospec UV spectrophotometer at a wavelength of 280 nm. Black liquor (2 g) was
dissolved in 100 ml of 0.1 M NaOH and was diluted to absorbance at 280nm of 0.3-0.8 using an
absorption coefficient of 23.7 dm3g-1cm-1.
The Klason lignin content and acid soluble lignin content were determined using the procedure
described in (Zhu et al., 2014). In this method, 3 mL of 72% sulfuric acid was added to a 1.2 g
sample of black liquor. The sample was kept in a water bath at 30°C for 1 hour. The sample was
diluted with deionized water (84 g), was hydrolyzed at 125°C in an autoclave for 1 h and was then
filtered to recover the Klason lignin. The dry weight was determined gravimetrically. The filtrate
was diluted by a factor of 1/100 and the acid soluble lignin content was determined using a
Biochrom Ultrospec UV spectrophotometer at a wavelength of 205 nm using an absorption
coefficient of 110 dm3g-1cm-1.
The ash content of the black liquor was determined by heating a known quantity of residue from
total solids content determination at 950°C for 24 h. The measuring remaining inorganic residue
(ash) the in the sample was measured as described in (Holmqvist, Wallberg, & Jonsson, 2005;
Wallberg, Jonsson, & Wimmerstedt, 2003). The lignin ash content was determined by heating a
known dry weight of lignin in a furnace at 550°C until a constant weight was obtained. The sulfide
content of black liquor was determined using the CPPA J.15 (VI) standard test procedure. The
residual effective alkali content was determined using the method recommended in (Radiotis,
Sullivan, MacLeod, Syed, & O'Hagan, 2007). The viscosity measurements were performed with a
Bohlin Visco88 viscometer.
5.2.4 Experimental Procedure
The filtered black liquor at 30% dissolved solids (1.8 L) was poured into the vessel with the selected
impeller (PBT or MB) and heated to 75°C temperature while agitating. CO2 sparging (1 L/min)
was started and the mixing speed was adjusted to the desired level in order to apply the required
power to the fluid. The pH during acidification was measured periodically using a MetroHM
Unitrode glass pH electrode. The CO2 sparging was stopped when the pH reached 9.8 ± 0.5. This
79
pH reduction step corresponds to the black liquor acidification operation given in Figure 5-1. The
mixing was continued for 1 hour at the desired speed and 75°C temperature and this step
corresponds to the ageing operation of the process. The agitation rates during the acidification and
ageing operations are set to adjust the turbulent shear levels and it is discussed in section 5.2.5. The
pH and temperature values were chosen from pre-trial tests to produce filterable, washable lignin.
Lignin slurry samples (5 mL) were withdrawn during ageing step at 0, 5, 15, 30, and 60 min time
intervals. The samples were filtered using 15 cm diameter Grade 113 Whatman filter discs prior to
characterizing the particle properties.
After the ageing phase, the lignin slurry was cooled to about 55°C. It was then filtered, and the
filtrate volume versus time was recorded. The filtrate was analyzed for total solids, UV lignin
content, and viscosity. The filter cake was washed with 1 L of 0.4 M H2SO4 and 200 mL of water
poured on top of the cake. The total washing time and weight of the wet lignin cake were recorded.
The cake was air-dried at room temperature for 24 h and then oven-dried at 105°C overnight to
determine its dry weight.
5.2.5 Characterization of the hydrodynamic conditions in the stirred tank
The turbulent shear rate in the stirred tank was characterized by the average dissipation rate of the
turbulent kinetic energy (⟨𝜀⟩), estimated by the ratio (𝑃/𝜌𝑉), where 𝑃 is the total power input, 𝜌 is
the density of black liquor and 𝑉 is the volume of the stirred tank. 𝑃 was estimated using the power
number (𝑁𝑃) of the impeller.
𝑃 = 𝑁𝑃𝜌𝑁3𝐷5 [1]
The quantities, 𝑁 and 𝐷, are the agitation rate and the impeller diameter. The NP values were 2.2
for the two-stage PBT assembly and 6.1 for the MB impeller (Hidalgo-Millán et al., 2012; Paul et
al., 2003). The two impellers have largely different power numbers (NP) and therefore they created
significantly different impeller speeds and hence different shear rates in the impeller zone, in
addition to the differences in the created flow patterns.
The dissipation rate of turbulent kinetic energy (𝜀) is the primary parameter used in characterizing
the turbulence, including length, time and velocity scales. The average ⟨𝜀⟩ does not characterize
the local dissipation rates hence it does not take into account the variations of the shear field
generated by the flow fields of two impellers considered. However, the average turbulent shear
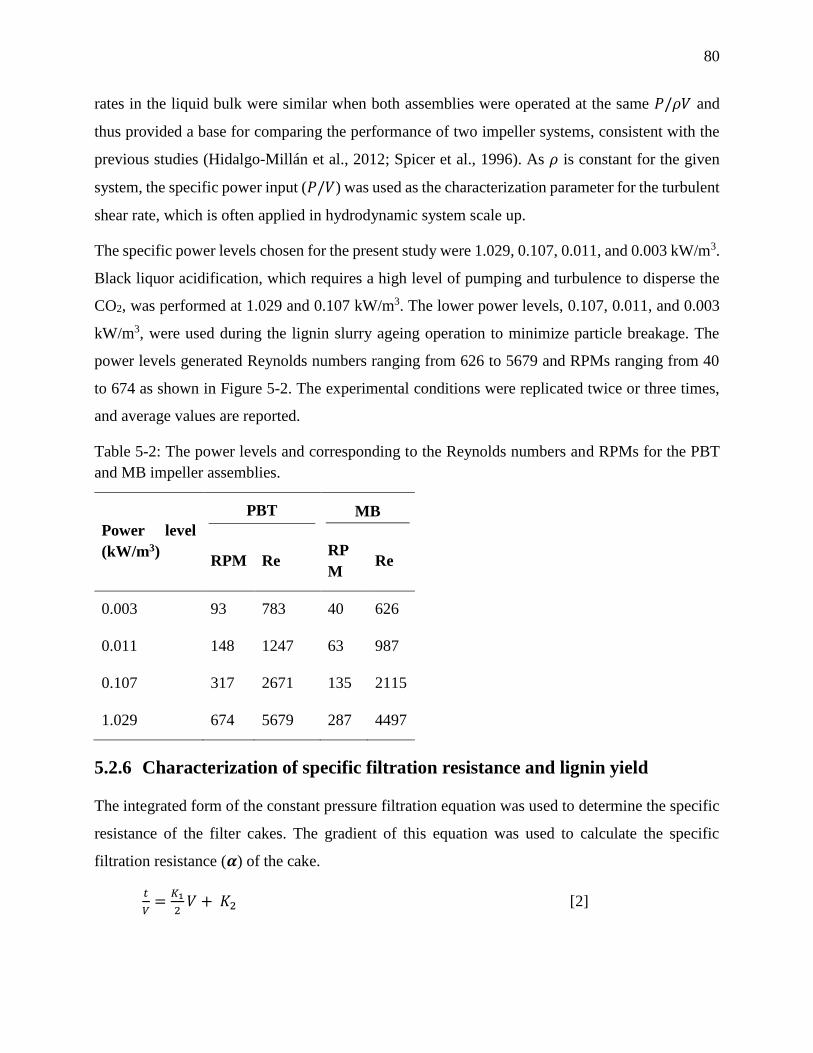
80
rates in the liquid bulk were similar when both assemblies were operated at the same 𝑃/𝜌𝑉 and
thus provided a base for comparing the performance of two impeller systems, consistent with the
previous studies (Hidalgo-Millán et al., 2012; Spicer et al., 1996). As 𝜌 is constant for the given
system, the specific power input (𝑃/𝑉) was used as the characterization parameter for the turbulent
shear rate, which is often applied in hydrodynamic system scale up.
The specific power levels chosen for the present study were 1.029, 0.107, 0.011, and 0.003 kW/m3.
Black liquor acidification, which requires a high level of pumping and turbulence to disperse the
CO2, was performed at 1.029 and 0.107 kW/m3. The lower power levels, 0.107, 0.011, and 0.003
kW/m3, were used during the lignin slurry ageing operation to minimize particle breakage. The
power levels generated Reynolds numbers ranging from 626 to 5679 and RPMs ranging from 40
to 674 as shown in Figure 5-2. The experimental conditions were replicated twice or three times,
and average values are reported.
Table 5-2: The power levels and corresponding to the Reynolds numbers and RPMs for the PBT
and MB impeller assemblies.
Power level
(kW/m3)
PBT MB
RPM Re RP
M Re
0.003 93 783 40 626
0.011 148 1247 63 987
0.107 317 2671 135 2115
1.029 674 5679 287 4497
5.2.6 Characterization of specific filtration resistance and lignin yield
The integrated form of the constant pressure filtration equation was used to determine the specific
resistance of the filter cakes. The gradient of this equation was used to calculate the specific
filtration resistance (𝜶) of the cake.
𝑡
𝑉=
𝐾1
2𝑉 + 𝐾2 [2]
81
𝐾1 =𝜶𝑐𝜇
𝐴2∆𝑝 [3]
𝐾2 = 𝜇𝑅𝑀
𝐴∆𝑝 [4]
The quantity 𝑉 is the filtrate volume, 𝑡 is the corresponding time taken to collect the filtrate volume,
𝑐 is the solids concentration of the slurry, 𝜇 is the dynamic viscosity of the filtrate, 𝐴 is the filtration
area, ∆𝑝 is the pressure difference of filtration, and 𝑅𝑀 is the filtration resistance of the medium.
The solid concentration of the slurry was estimated using the amount of dry lignin recovered. The
lignin yield was computed as the amount of dry lignin recovered from the total lignin in the black
liquor. The UV lignin content was used to estimate the total lignin in the black liquor.
5.2.7 Characterization of particle size distributions and structures
A laser diffraction instrument (Mastersizer 3000, Malvern, UK) was used to determine the particle
size distribution of the lignin samples. The wet lignin particles were dispersed using a Hydro EV
wet dispersion unit (Malvern, UK). A 3 M NaCl solution (500 mL) with the pH adjusted to the
precipitation level was used as a dispersant. DV50, the median particle size of the volume
distribution, and D3,2, the Sauter median diameter, were used as size characterization parameters.
The mass fractal dimension (𝐷𝑓), which is a measure of compactness of a fractal structure, has been
used to determine the compactness of precipitated lignin particles. The light scattering data from
the Mastersizer was used in this method to estimate the fractal dimensions of aggregates, as
described in the literature (Bo et al., 2012; Guan, Waite, & Amal, 1998; Jarvis, Jefferson, &
Parsons, 2005). The total scattered light intensity (𝐼) is related to scattering vector (𝑄) by power
law with 𝐷𝑓 as coefficient. 𝑄 was computed as given in Eq.6 (Guan et al., 1998).
𝐼 ∝ 𝑄−𝐷𝑓 [5]
𝑄 =4𝑛𝜋 sin(𝜃/2)
𝜆 [6]
where 𝜃 is the scattering angle, 𝜆 is the wave length of radiation in vacuum, 𝑛 is the refractive
index of the dispersant. 𝐷𝑓 is determined by the slope of the log 𝐼 vs log 𝑄 plot.
The structures of selected precipitated lignin samples were observed by scanning electron
microscopy (SEM). The samples were prepared by dispersing the sample in water, drying and metal
coating for conduciveness.
82
5.3 Results and Discussion
5.3.1 Effect of hydrodynamic conditions on particle properties
5.3.1.1 Evolution of particle size during ageing operation
5.3.1.1.1 Acidification power level of 1.029 kW/m3
Three ageing power levels (0.107, 0.011, and 0.003 kW/m3) were used in the experiments
performed with a 1.029 kW/m3 acidification power. As shown in Figure 5-3, the initial particle size
(ageing time = 0) was around 11 µm and the size increased rapidly, during the first 15 min of the
ageing operation. The rapid growth indicates more particle-to-particle aggregation than breakage.
After a certain size, which seems to be dependent on the power level, was reached, particle growth
slowed down considerably, suggesting that the rates of particle-to-particle aggregation and particle
breakage due to have become similar. The final particle size was dependent on the ageing power
level, albeit it was not affected by the type of impeller. This indicates that the turbulent shear rate
controlled the particle growth and the local shear fields created by the impeller flow patterns did
not play a major role in aggregation and breakage. The lowest specific power, which created the
lowest turbulent shear rate, produced the largest particle size. The values of DV50 and D3,2
paralleled the particle growth rate. The size difference between these two properties ranged from
2 to 4 µm, indicating narrow size distributions.
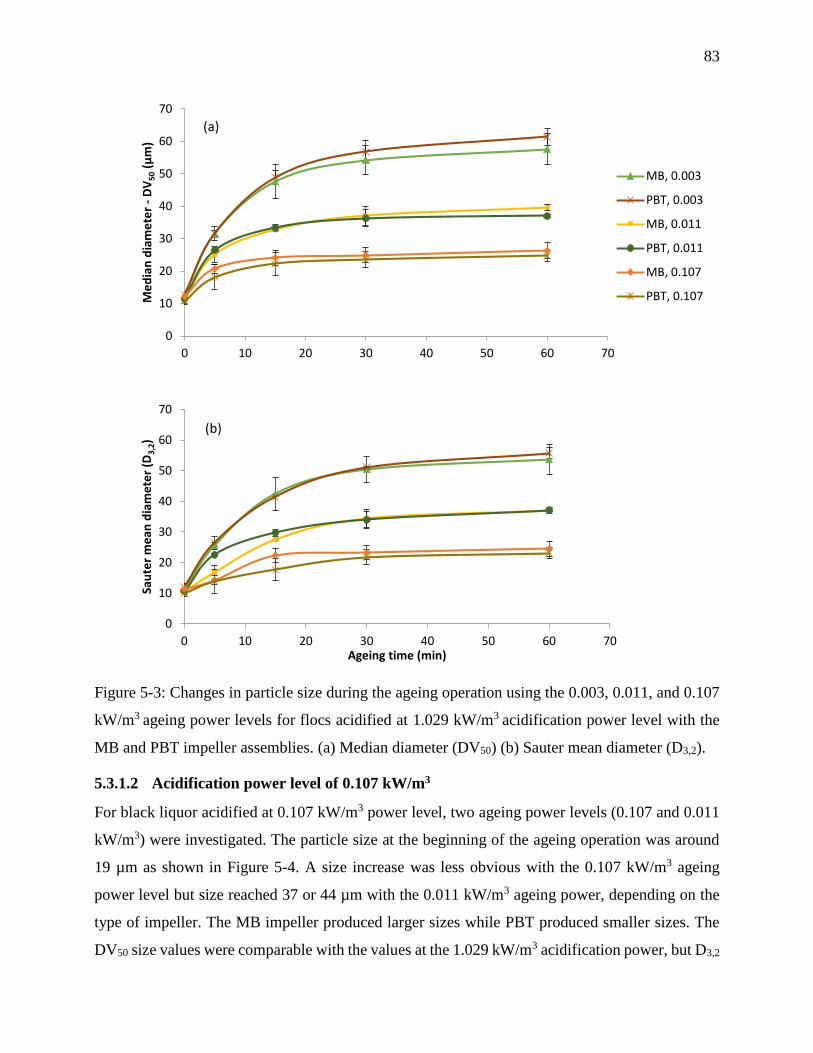
83
Figure 5-3: Changes in particle size during the ageing operation using the 0.003, 0.011, and 0.107
kW/m3 ageing power levels for flocs acidified at 1.029 kW/m3 acidification power level with the
MB and PBT impeller assemblies. (a) Median diameter (DV50) (b) Sauter mean diameter (D3,2).
5.3.1.2 Acidification power level of 0.107 kW/m3
For black liquor acidified at 0.107 kW/m3 power level, two ageing power levels (0.107 and 0.011
kW/m3) were investigated. The particle size at the beginning of the ageing operation was around
19 µm as shown in Figure 5-4. A size increase was less obvious with the 0.107 kW/m3 ageing
power level but size reached 37 or 44 µm with the 0.011 kW/m3 ageing power, depending on the
type of impeller. The MB impeller produced larger sizes while PBT produced smaller sizes. The
DV50 size values were comparable with the values at the 1.029 kW/m3 acidification power, but D3,2
0
10
20
30
40
50
60
70
0 10 20 30 40 50 60 70
Me
dia
n d
iam
ete
r -
DV
50
(µm
)
MB, 0.003
PBT, 0.003
MB, 0.011
PBT, 0.011
MB, 0.107
PBT, 0.107
(a)
0
10
20
30
40
50
60
70
0 10 20 30 40 50 60 70
Sau
ter
me
an d
iam
ete
r (D
3,2
)
Ageing time (min)
(b)
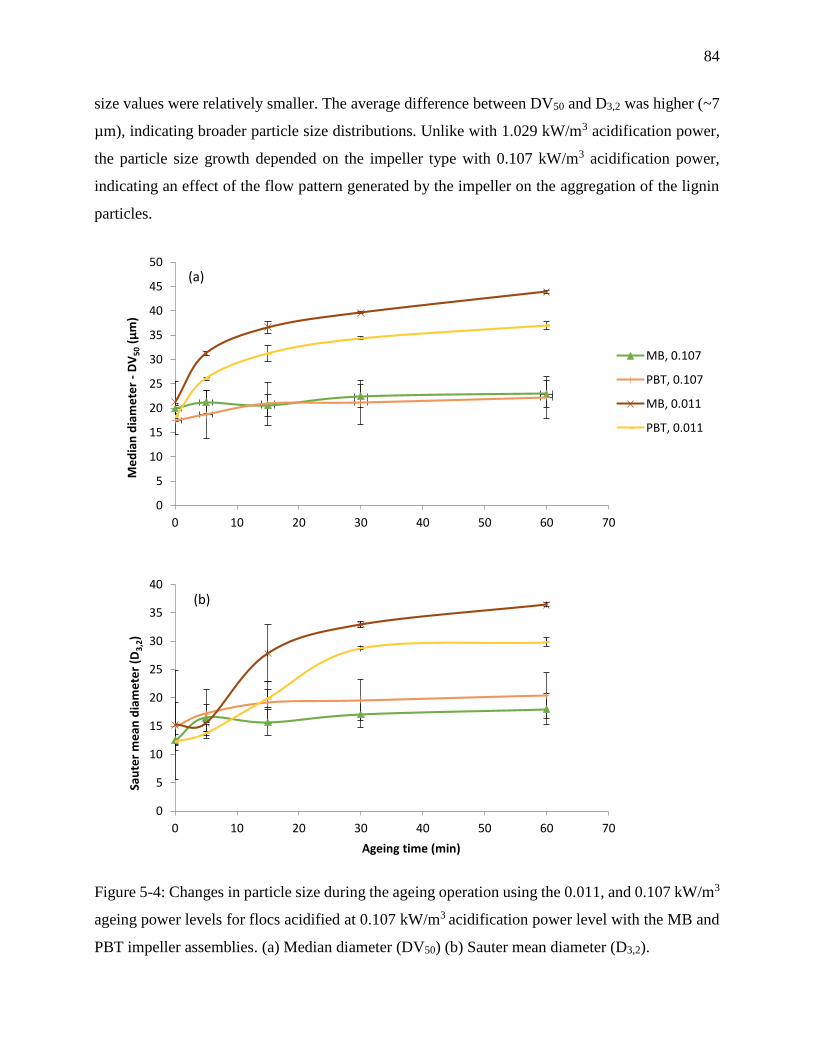
84
size values were relatively smaller. The average difference between DV50 and D3,2 was higher (~7
µm), indicating broader particle size distributions. Unlike with 1.029 kW/m3 acidification power,
the particle size growth depended on the impeller type with 0.107 kW/m3 acidification power,
indicating an effect of the flow pattern generated by the impeller on the aggregation of the lignin
particles.
Figure 5-4: Changes in particle size during the ageing operation using the 0.011, and 0.107 kW/m3
ageing power levels for flocs acidified at 0.107 kW/m3 acidification power level with the MB and
PBT impeller assemblies. (a) Median diameter (DV50) (b) Sauter mean diameter (D3,2).
0
5
10
15
20
25
30
35
40
45
50
0 10 20 30 40 50 60 70
Me
dia
n d
iam
ete
r -
DV
50
(µm
)
MB, 0.107
PBT, 0.107
MB, 0.011
PBT, 0.011
(a)
0
5
10
15
20
25
30
35
40
0 10 20 30 40 50 60 70
Sau
ter
me
an d
iam
ete
r (D
3,2
)
Ageing time (min)
(b)
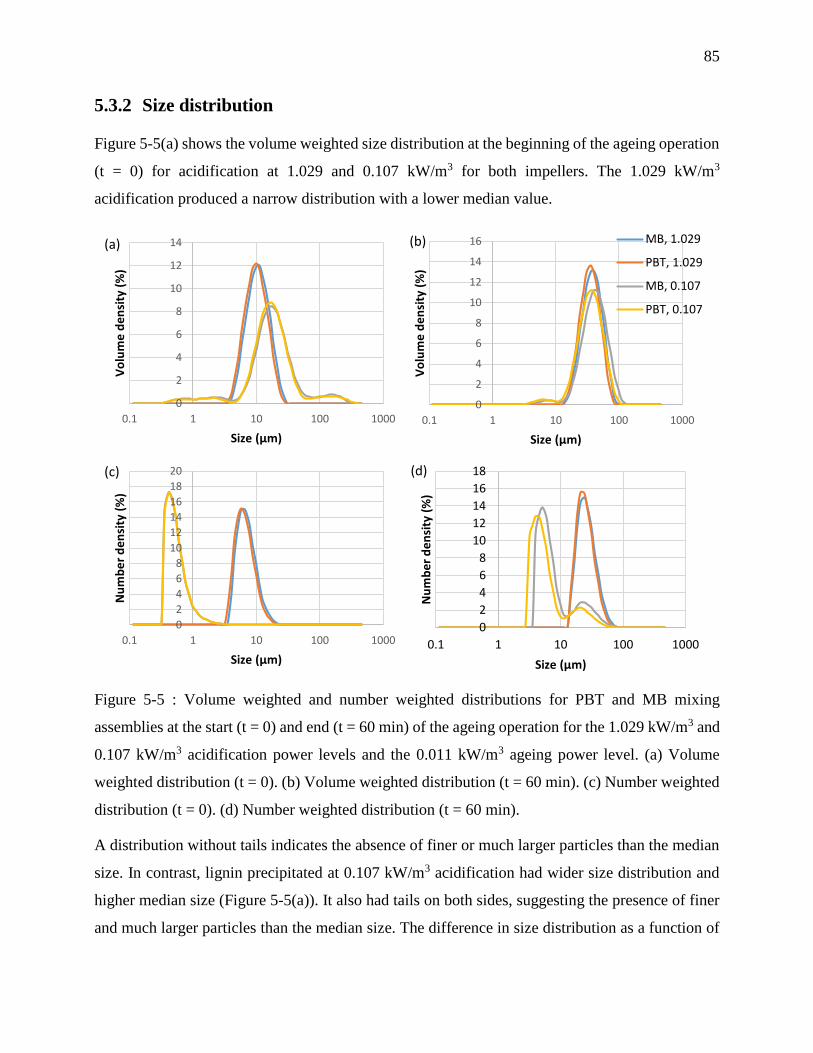
85
5.3.2 Size distribution
Figure 5-5(a) shows the volume weighted size distribution at the beginning of the ageing operation
(t = 0) for acidification at 1.029 and 0.107 kW/m3 for both impellers. The 1.029 kW/m3
acidification produced a narrow distribution with a lower median value.
Figure 5-5 : Volume weighted and number weighted distributions for PBT and MB mixing
assemblies at the start (t = 0) and end (t = 60 min) of the ageing operation for the 1.029 kW/m3 and
0.107 kW/m3 acidification power levels and the 0.011 kW/m3 ageing power level. (a) Volume
weighted distribution (t = 0). (b) Volume weighted distribution (t = 60 min). (c) Number weighted
distribution (t = 0). (d) Number weighted distribution (t = 60 min).
A distribution without tails indicates the absence of finer or much larger particles than the median
size. In contrast, lignin precipitated at 0.107 kW/m3 acidification had wider size distribution and
higher median size (Figure 5-5(a)). It also had tails on both sides, suggesting the presence of finer
and much larger particles than the median size. The difference in size distribution as a function of
0
2
4
6
8
10
12
14
16
0.1 1 10 100 1000V
olu
me
de
nsi
ty (
%)
Size (µm)
MB, 1.029
PBT, 1.029
MB, 0.107
PBT, 0.107
(b)
0
2
4
6
8
10
12
14
16
18
0.1 1 10 100 1000
Nu
mb
er
de
nsi
ty (
%)
Size (µm)
(d)
0
2
4
6
8
10
12
14
0.1 1 10 100 1000
Vo
lum
e d
en
sity
(%
)
Size (µm)
(a)
0
2
4
6
8
10
12
14
16
18
20
0.1 1 10 100 1000
Nu
mb
er
de
nsi
ty (
%)
Size (µm)
(c)
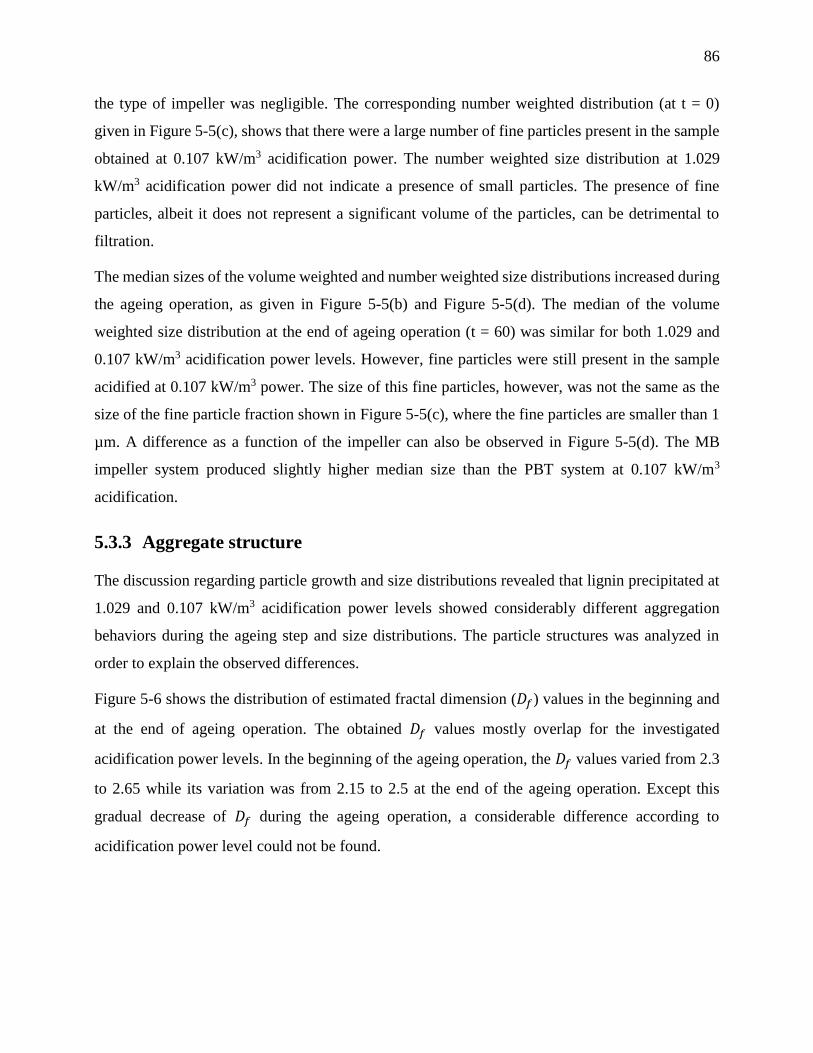
86
the type of impeller was negligible. The corresponding number weighted distribution (at t = 0)
given in Figure 5-5(c), shows that there were a large number of fine particles present in the sample
obtained at 0.107 kW/m3 acidification power. The number weighted size distribution at 1.029
kW/m3 acidification power did not indicate a presence of small particles. The presence of fine
particles, albeit it does not represent a significant volume of the particles, can be detrimental to
filtration.
The median sizes of the volume weighted and number weighted size distributions increased during
the ageing operation, as given in Figure 5-5(b) and Figure 5-5(d). The median of the volume
weighted size distribution at the end of ageing operation (t = 60) was similar for both 1.029 and
0.107 kW/m3 acidification power levels. However, fine particles were still present in the sample
acidified at 0.107 kW/m3 power. The size of this fine particles, however, was not the same as the
size of the fine particle fraction shown in Figure 5-5(c), where the fine particles are smaller than 1
µm. A difference as a function of the impeller can also be observed in Figure 5-5(d). The MB
impeller system produced slightly higher median size than the PBT system at 0.107 kW/m3
acidification.
5.3.3 Aggregate structure
The discussion regarding particle growth and size distributions revealed that lignin precipitated at
1.029 and 0.107 kW/m3 acidification power levels showed considerably different aggregation
behaviors during the ageing step and size distributions. The particle structures was analyzed in
order to explain the observed differences.
Figure 5-6 shows the distribution of estimated fractal dimension (𝐷𝑓) values in the beginning and
at the end of ageing operation. The obtained 𝐷𝑓 values mostly overlap for the investigated
acidification power levels. In the beginning of the ageing operation, the 𝐷𝑓 values varied from 2.3
to 2.65 while its variation was from 2.15 to 2.5 at the end of the ageing operation. Except this
gradual decrease of 𝐷𝑓 during the ageing operation, a considerable difference according to
acidification power level could not be found.
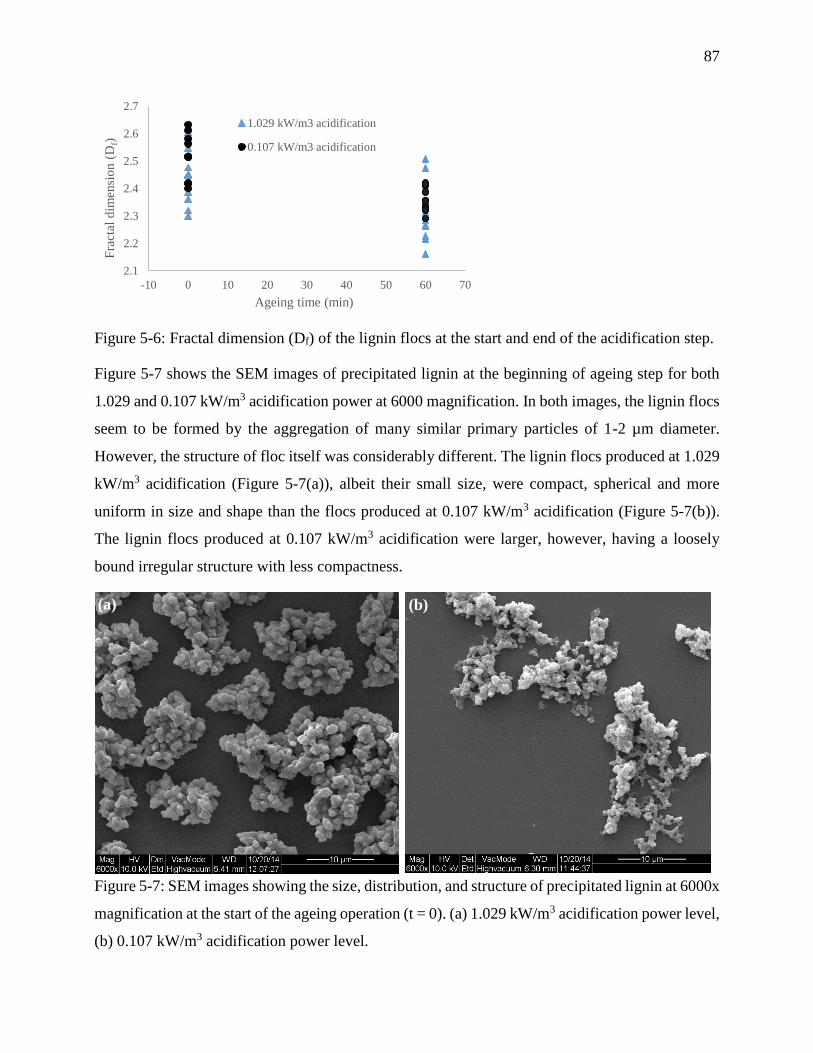
87
Figure 5-6: Fractal dimension (Df) of the lignin flocs at the start and end of the acidification step.
Figure 5-7 shows the SEM images of precipitated lignin at the beginning of ageing step for both
1.029 and 0.107 kW/m3 acidification power at 6000 magnification. In both images, the lignin flocs
seem to be formed by the aggregation of many similar primary particles of 1-2 µm diameter.
However, the structure of floc itself was considerably different. The lignin flocs produced at 1.029
kW/m3 acidification (Figure 5-7(a)), albeit their small size, were compact, spherical and more
uniform in size and shape than the flocs produced at 0.107 kW/m3 acidification (Figure 5-7(b)).
The lignin flocs produced at 0.107 kW/m3 acidification were larger, however, having a loosely
bound irregular structure with less compactness.
Figure 5-7: SEM images showing the size, distribution, and structure of precipitated lignin at 6000x
magnification at the start of the ageing operation (t = 0). (a) 1.029 kW/m3 acidification power level,
(b) 0.107 kW/m3 acidification power level.
2.1
2.2
2.3
2.4
2.5
2.6
2.7
-10 0 10 20 30 40 50 60 70
Fra
ctal
dim
ensi
on (
Df)
Ageing time (min)
1.029 kW/m3 acidification
0.107 kW/m3 acidification
(b) (a)
88
The structural difference of lignin flocs at different acidification power levels, which was observed
in SEM images, could not be identified using 𝐷𝑓 values. According to Figure 5-7, the lignin flocs
seem to have two level structures, where they are formed from the aggregation of many primary
particles with distinct size and shape. Light scattering methods have been reported to provide poor
𝐷𝑓 value estimations for flocs with two level structure (Ibaseta & Biscans, 2010). The 𝐷𝑓 values of
such flocs tend to measure to structure of the primary particles rather than the floc itself. The range
of estimated 𝐷𝑓 = 2.15-2.65 is consistent with the 𝐷𝑓 = 1.9-2.45 of lignin particles reported in the
literature, aggregated under the Brownian motion with sizes of 1-2 µm (Norgren et al., 2002). The
similarity of 𝐷𝑓 values and sizes of primary particles obtained under turbulent conditions in this
study and Brownian motion in the literature, suggests that the hydrodynamic conditions did not
have a large impact on the formation of primary lignin particles.
The length of turbulent eddy fluctuations, defined as the length scale (𝜐/⟨𝜀⟩)1
4 where 𝜐 is the
kinematic viscosity and ⟨𝜀⟩ is the mean dissipation rate of kinetic energy, was 125 µm for the power
level 1.029 kW/m3.. This could possibly explain the negligible effect of hydrodynamic conditions
on the size and shape of the primary particles, of which the size is at 1-2 µm range, much smaller
than turbulent length scale.
However, the impacts of hydrodynamics becomes increasingly important as the flocs grow in size,
as seen in Figure 5-7. The weak bonds between lignin flocs can be broken, causing them to
disintegrate. However, the disintegrated flocs aggregate again due to the high collisions. If the
bonds are not strong enough to withstand the shear forces, the flocs disintegrate once again. This
interplay of aggregation and breakage evolve the structure and size of the final flocs. As a
consequence, the flocs generated at higher shear levels (1.029 kW/m3) tend to have small and
compact structures. Compact aggregates have been reported to have higher strength, as the primary
particles are held together by many more bonds (Jarvis, Jefferson, Gregory, et al., 2005; Spicer et
al., 1998). On the hand, the flocs generated at low shear levels had larger sizes and loose structures.
The compact and small flocs generated at the end of high shear acidification step evolved into
larger particles, final size of which depending on the shear level during the ageing step. The size
increase was independent on the impeller type and size distributions were narrow without fine
particles, as shown in Figure 5-3 and Figure 5-5(c). Figure 5-5(c) shows the SEM images of lignin
flocs at the start and the end of ageing operation. From Figure 5-8(a) and Figure 5-8(c), it seems
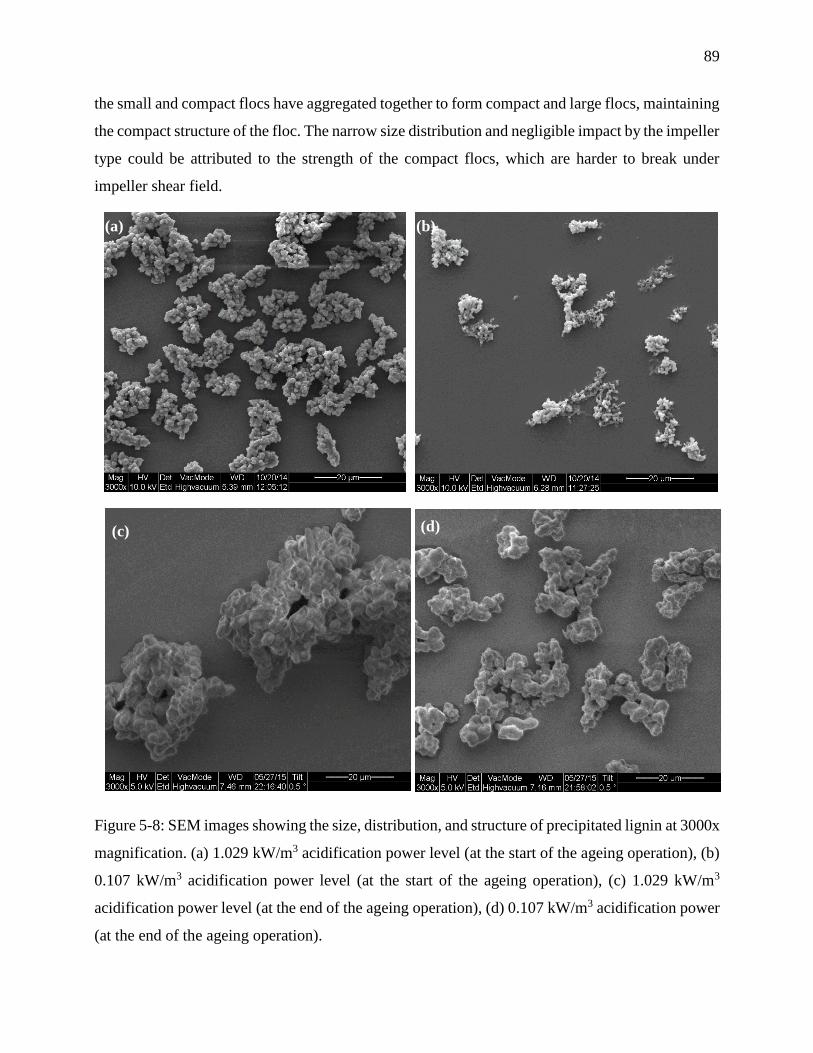
89
the small and compact flocs have aggregated together to form compact and large flocs, maintaining
the compact structure of the floc. The narrow size distribution and negligible impact by the impeller
type could be attributed to the strength of the compact flocs, which are harder to break under
impeller shear field.
Figure 5-8: SEM images showing the size, distribution, and structure of precipitated lignin at 3000x
magnification. (a) 1.029 kW/m3 acidification power level (at the start of the ageing operation), (b)
0.107 kW/m3 acidification power level (at the start of the ageing operation), (c) 1.029 kW/m3
acidification power level (at the end of the ageing operation), (d) 0.107 kW/m3 acidification power
(at the end of the ageing operation).
(a)
)
(b)
(c) (d)
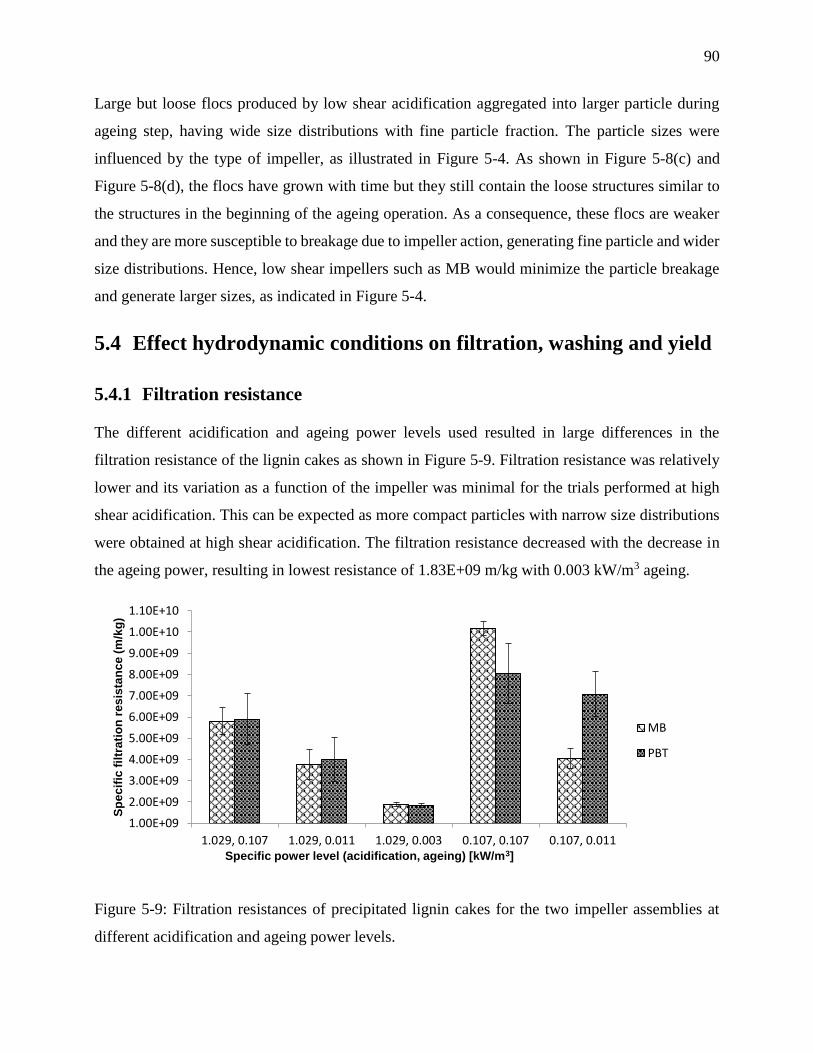
90
Large but loose flocs produced by low shear acidification aggregated into larger particle during
ageing step, having wide size distributions with fine particle fraction. The particle sizes were
influenced by the type of impeller, as illustrated in Figure 5-4. As shown in Figure 5-8(c) and
Figure 5-8(d), the flocs have grown with time but they still contain the loose structures similar to
the structures in the beginning of the ageing operation. As a consequence, these flocs are weaker
and they are more susceptible to breakage due to impeller action, generating fine particle and wider
size distributions. Hence, low shear impellers such as MB would minimize the particle breakage
and generate larger sizes, as indicated in Figure 5-4.
5.4 Effect hydrodynamic conditions on filtration, washing and yield
5.4.1 Filtration resistance
The different acidification and ageing power levels used resulted in large differences in the
filtration resistance of the lignin cakes as shown in Figure 5-9. Filtration resistance was relatively
lower and its variation as a function of the impeller was minimal for the trials performed at high
shear acidification. This can be expected as more compact particles with narrow size distributions
were obtained at high shear acidification. The filtration resistance decreased with the decrease in
the ageing power, resulting in lowest resistance of 1.83E+09 m/kg with 0.003 kW/m3 ageing.
Figure 5-9: Filtration resistances of precipitated lignin cakes for the two impeller assemblies at
different acidification and ageing power levels.
1.00E+09
2.00E+09
3.00E+09
4.00E+09
5.00E+09
6.00E+09
7.00E+09
8.00E+09
9.00E+09
1.00E+10
1.10E+10
1.029, 0.107 1.029, 0.011 1.029, 0.003 0.107, 0.107 0.107, 0.011
Sp
ec
ific
fil
trati
on
res
ista
nc
e (
m/k
g)
Specific power level (acidification, ageing) [kW/m3]
MB
PBT
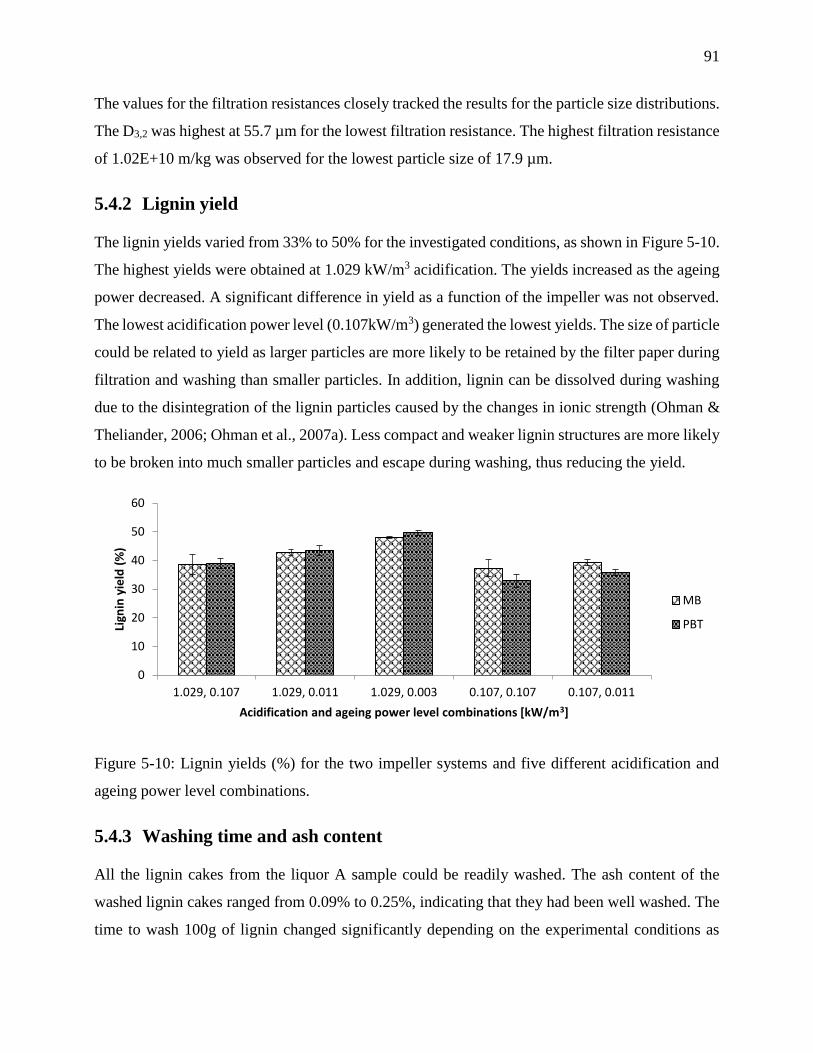
91
The values for the filtration resistances closely tracked the results for the particle size distributions.
The D3,2 was highest at 55.7 µm for the lowest filtration resistance. The highest filtration resistance
of 1.02E+10 m/kg was observed for the lowest particle size of 17.9 µm.
5.4.2 Lignin yield
The lignin yields varied from 33% to 50% for the investigated conditions, as shown in Figure 5-10.
The highest yields were obtained at 1.029 kW/m3 acidification. The yields increased as the ageing
power decreased. A significant difference in yield as a function of the impeller was not observed.
The lowest acidification power level (0.107kW/m3) generated the lowest yields. The size of particle
could be related to yield as larger particles are more likely to be retained by the filter paper during
filtration and washing than smaller particles. In addition, lignin can be dissolved during washing
due to the disintegration of the lignin particles caused by the changes in ionic strength (Ohman &
Theliander, 2006; Ohman et al., 2007a). Less compact and weaker lignin structures are more likely
to be broken into much smaller particles and escape during washing, thus reducing the yield.
Figure 5-10: Lignin yields (%) for the two impeller systems and five different acidification and
ageing power level combinations.
5.4.3 Washing time and ash content
All the lignin cakes from the liquor A sample could be readily washed. The ash content of the
washed lignin cakes ranged from 0.09% to 0.25%, indicating that they had been well washed. The
time to wash 100g of lignin changed significantly depending on the experimental conditions as
0
10
20
30
40
50
60
1.029, 0.107 1.029, 0.011 1.029, 0.003 0.107, 0.107 0.107, 0.011
Lign
in y
ield
(%
)
Acidification and ageing power level combinations [kW/m3]
MB
PBT
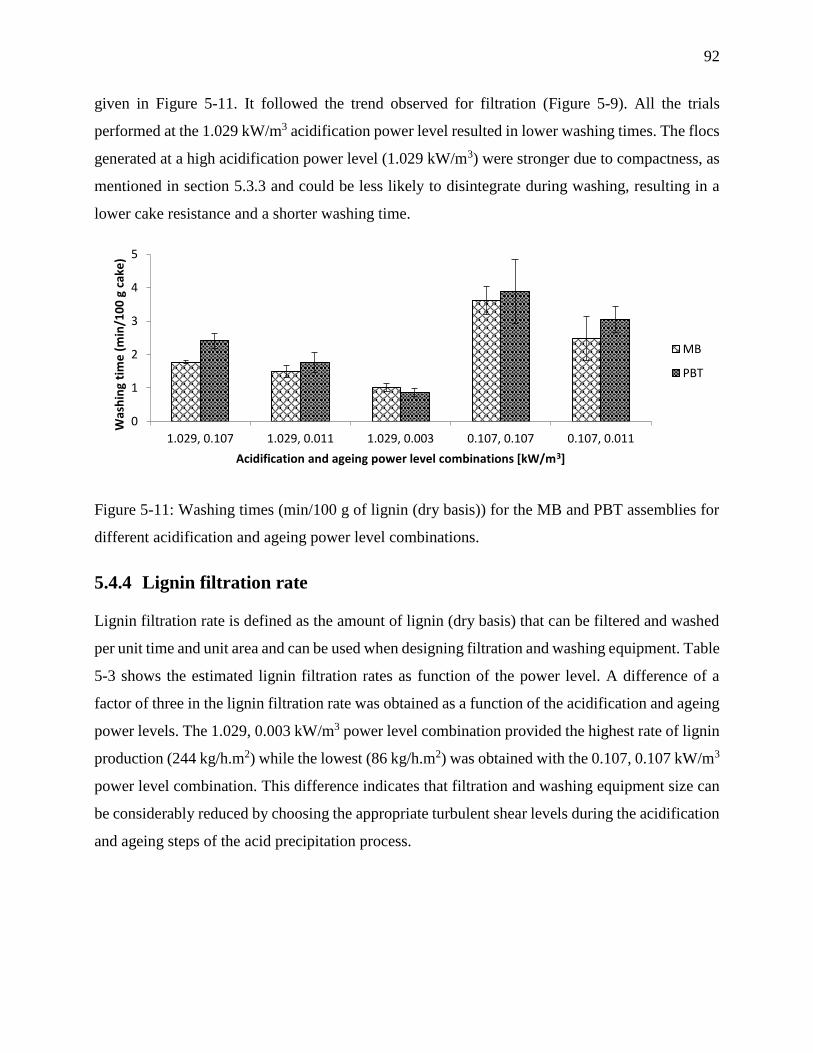
92
given in Figure 5-11. It followed the trend observed for filtration (Figure 5-9). All the trials
performed at the 1.029 kW/m3 acidification power level resulted in lower washing times. The flocs
generated at a high acidification power level (1.029 kW/m3) were stronger due to compactness, as
mentioned in section 5.3.3 and could be less likely to disintegrate during washing, resulting in a
lower cake resistance and a shorter washing time.
Figure 5-11: Washing times (min/100 g of lignin (dry basis)) for the MB and PBT assemblies for
different acidification and ageing power level combinations.
5.4.4 Lignin filtration rate
Lignin filtration rate is defined as the amount of lignin (dry basis) that can be filtered and washed
per unit time and unit area and can be used when designing filtration and washing equipment. Table
5-3 shows the estimated lignin filtration rates as function of the power level. A difference of a
factor of three in the lignin filtration rate was obtained as a function of the acidification and ageing
power levels. The 1.029, 0.003 kW/m3 power level combination provided the highest rate of lignin
production (244 kg/h.m2) while the lowest (86 kg/h.m2) was obtained with the 0.107, 0.107 kW/m3
power level combination. This difference indicates that filtration and washing equipment size can
be considerably reduced by choosing the appropriate turbulent shear levels during the acidification
and ageing steps of the acid precipitation process.
0
1
2
3
4
5
1.029, 0.107 1.029, 0.011 1.029, 0.003 0.107, 0.107 0.107, 0.011
Was
hin
g ti
me
(m
in/1
00
g c
ake
)
Acidification and ageing power level combinations [kW/m3]
MB
PBT
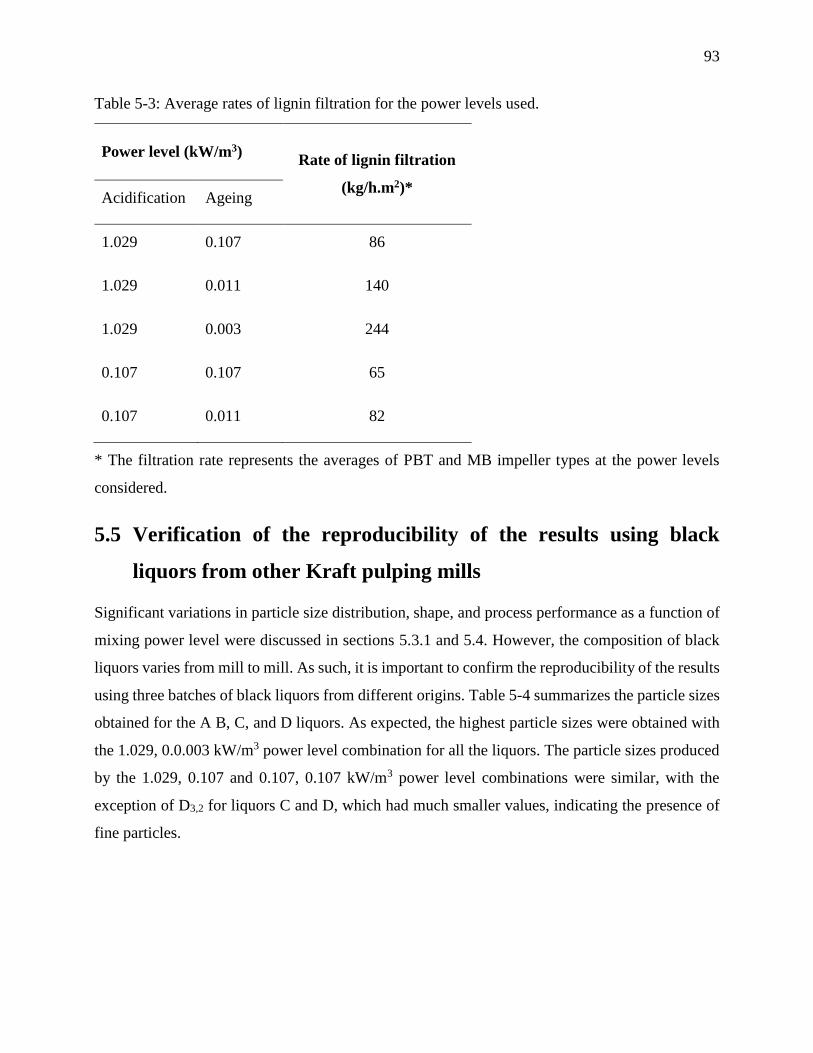
93
Table 5-3: Average rates of lignin filtration for the power levels used.
Power level (kW/m3) Rate of lignin filtration
(kg/h.m2)* Acidification Ageing
1.029 0.107 86
1.029 0.011 140
1.029 0.003 244
0.107 0.107 65
0.107 0.011 82
* The filtration rate represents the averages of PBT and MB impeller types at the power levels
considered.
5.5 Verification of the reproducibility of the results using black
liquors from other Kraft pulping mills
Significant variations in particle size distribution, shape, and process performance as a function of
mixing power level were discussed in sections 5.3.1 and 5.4. However, the composition of black
liquors varies from mill to mill. As such, it is important to confirm the reproducibility of the results
using three batches of black liquors from different origins. Table 5-4 summarizes the particle sizes
obtained for the A B, C, and D liquors. As expected, the highest particle sizes were obtained with
the 1.029, 0.0.003 kW/m3 power level combination for all the liquors. The particle sizes produced
by the 1.029, 0.107 and 0.107, 0.107 kW/m3 power level combinations were similar, with the
exception of D3,2 for liquors C and D, which had much smaller values, indicating the presence of
fine particles.
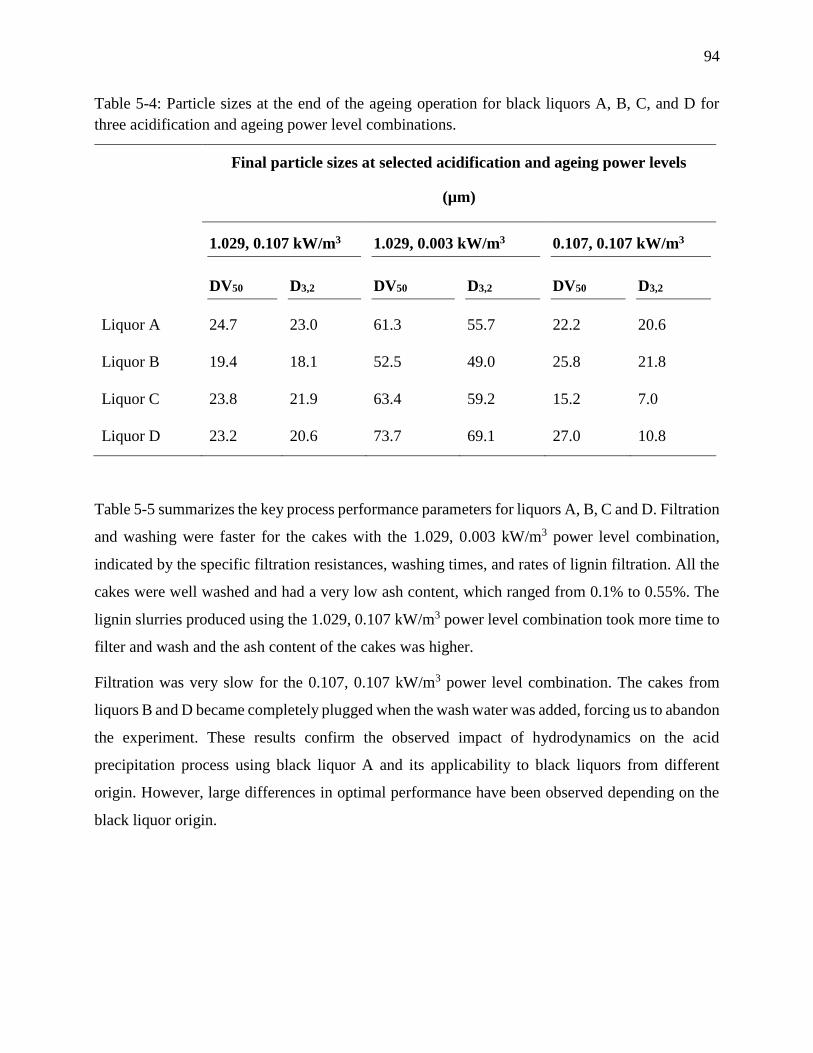
94
Table 5-4: Particle sizes at the end of the ageing operation for black liquors A, B, C, and D for
three acidification and ageing power level combinations.
Final particle sizes at selected acidification and ageing power levels
(µm)
1.029, 0.107 kW/m3 1.029, 0.003 kW/m3 0.107, 0.107 kW/m3
DV50 D3,2 DV50 D3,2 DV50 D3,2
Liquor A 24.7 23.0 61.3 55.7 22.2 20.6
Liquor B 19.4 18.1 52.5 49.0 25.8 21.8
Liquor C 23.8 21.9 63.4 59.2 15.2 7.0
Liquor D 23.2 20.6 73.7 69.1 27.0 10.8
Table 5-5 summarizes the key process performance parameters for liquors A, B, C and D. Filtration
and washing were faster for the cakes with the 1.029, 0.003 kW/m3 power level combination,
indicated by the specific filtration resistances, washing times, and rates of lignin filtration. All the
cakes were well washed and had a very low ash content, which ranged from 0.1% to 0.55%. The
lignin slurries produced using the 1.029, 0.107 kW/m3 power level combination took more time to
filter and wash and the ash content of the cakes was higher.
Filtration was very slow for the 0.107, 0.107 kW/m3 power level combination. The cakes from
liquors B and D became completely plugged when the wash water was added, forcing us to abandon
the experiment. These results confirm the observed impact of hydrodynamics on the acid
precipitation process using black liquor A and its applicability to black liquors from different
origin. However, large differences in optimal performance have been observed depending on the
black liquor origin.
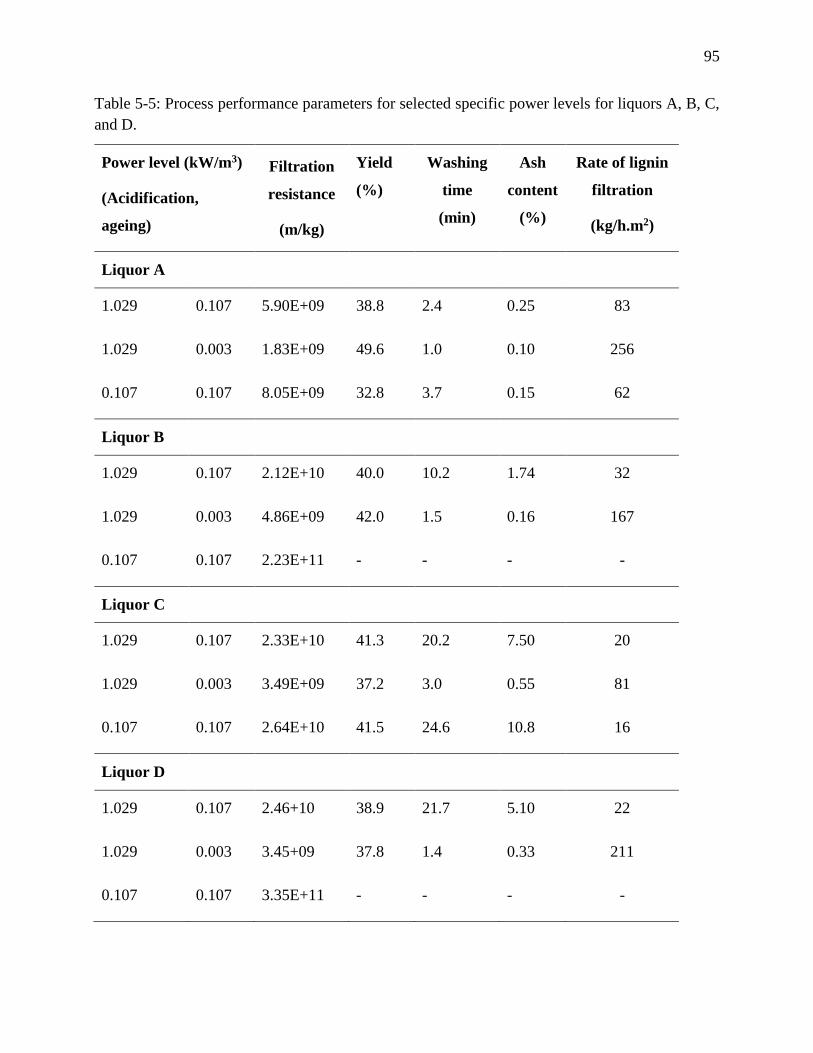
95
Table 5-5: Process performance parameters for selected specific power levels for liquors A, B, C,
and D.
Power level (kW/m3)
(Acidification,
ageing)
Filtration
resistance
(m/kg)
Yield
(%)
Washing
time
(min)
Ash
content
(%)
Rate of lignin
filtration
(kg/h.m2)
Liquor A
1.029 0.107 5.90E+09 38.8 2.4 0.25 83
1.029 0.003 1.83E+09 49.6 1.0 0.10 256
0.107 0.107 8.05E+09 32.8 3.7 0.15 62
Liquor B
1.029 0.107 2.12E+10 40.0 10.2 1.74 32
1.029 0.003 4.86E+09 42.0 1.5 0.16 167
0.107 0.107 2.23E+11 - - - -
Liquor C
1.029 0.107 2.33E+10 41.3 20.2 7.50 20
1.029 0.003 3.49E+09 37.2 3.0 0.55 81
0.107 0.107 2.64E+10 41.5 24.6 10.8 16
Liquor D
1.029 0.107 2.46+10 38.9 21.7 5.10 22
1.029 0.003 3.45+09 37.8 1.4 0.33 211
0.107 0.107 3.35E+11 - - - -
96
5.6 Conclusions
The effects of mixing hydrodynamics during precipitation on the lignin particle and filtration
properties was evaluated. The hydrodynamics were varied using Pitched blade turbine (PBT) and
MaxblendTM (MB) impeller assemblies and different mixing power levels during acidification and
ageing steps.
The impact of the mixing hydrodynamics on the size and shape of primary lignin particles, having
sizes ranging 1-2 µm and fractal dimensions 𝐷𝑓=2.15-2.65, was negligible. As primary lignin
particles aggregate into larger lignin flocs, the impact of hydrodynamics conditions became
increasingly important. Considerably different mixing power levels during the acidification step
exposed the aggregation of primary lignin particles into lignin flocs to largely different shear rates.
At high shear rates, flocs tend to acquire more compact structures due to intensive breakage and
aggregation under higher shear stresses, which eventually produced stronger flocs. On the other
hand, low shear rates allowed flocs to have larger sizes but their structures were loose.
It was shown that both compact and loose flocs generated in the acidification step could be
aggregated into much larger flocs during the ageing step, using reduced ageing power levels.
Lowest aging power level produced largest lignin flocs. However, large differences in structure
and size distribution were observed according to the condition of the initial flocs. The growth of
the compact flocs during ageing step was similar for both types of impellers and the size
distributions were narrow. The floc growth depended mainly on the turbulent shear rate.
However, the growth of loose flocs depended on the type of the impeller and the size distributions
were wide with a fraction of fine particles. These differences arose from the strength of the initial
flocs, where compact flocs were less susceptible to breakage by impeller action than loose flocs.
As a consequence, MB impeller showed better aggregation with loose flocs because it created
relatively low shear in the impeller zone.
The more compact and larger flocs showed better filtration and washing properties. Higher shear
during acidification and lower shear during ageing, independent of the type the impeller, led to
lowest filtration resistance of 1.83E+09 m/kg and highest filtration rate of 256 kg/h.m2. The tests
performed on black liquor samples from the other mills confirmed the above findings. However,
97
these confirmation tests resulted in largely different filtration performances and in the ability to
efficiently wash the cakes.
5.7 Acknowledgements
This work was financially supported by the BioFuelNet Canada. The authors are grateful to Prof.
Oumarou Savadogo and FPInnovations for providing the experimental facilities and setups and to
Jalil Baria for assistance with the experiments. We also thank the Kraft pulping mills for providing
the black liquor samples
5.8 References
Benali, M., Périn-Levasseur, Z., Savulescu, L., Kouisni, L., Jemaa, N., Kudra, T., & Paleologou,
M. (2014). Implementation of lignin-based biorefinery into a Canadian softwood kraft pulp
mill: Optimal resources integration and economic viability assessment. Biomass and
Bioenergy, 67(0), 473-482.
Bo, X., Gao, B., Peng, N., Wang, Y., Yue, Q., & Zhao, Y. (2012). Effect of dosing sequence and
solution pH on floc properties of the compound bioflocculant–aluminum sulfate dual-
coagulant in kaolin–humic acid solution treatment. Bioresource Technology, 113(0), 89-
96.
Diffo, C. (2013). Lignin Biorefinery Technology and Markets. Retrieved from
http://www.reseauvco.ca/fileadmin/vco/documents/Webinairs/PowerPoint_Presentation.p
df
Gooding, C. (2012). Comparison of the LignoBoost™ and SLRP™ Lignin Recovery Processes.
Paper presented at TAPPI International Bioenergy & Bioproducts Conference, Savannah,
United States.
Guan, J., Waite, T. D., & Amal, R. (1998). Rapid Structure Characterization of Bacterial
Aggregates. Environmental Science & Technology, 32(23), 3735-3742. doi:
10.1021/es980387u
Hidalgo-Millán, A., Zenit, R., Palacios, C., Yatomi, R., Horiguchi, H., Tanguy, P. A., & Ascanio,
G. (2012). On the hydrodynamics characterization of the straight Maxblend® impeller with
Newtonian fluids. Chemical Engineering Research and Design, 90(9), 1117-1128.
Holmqvist, A., Wallberg, O., & Jonsson, A.-S. (2005). Ultrafiltration of kraft black liquor from
two Swedish pulp mills. Chemical Engineering Research and Design, 83(8 A), 994-999.
doi: 10.1205/cherd.04204
Howell, J. F., & Thring, R. W. (2000). Hardwood lignin recovery using generator waste acid.
Statistical analysis and simulation. Industrial & engineering chemistry research, 39(7),
2534-2540.
Ibaseta, N., & Biscans, B. (2010). Fractal dimension of fumed silica: Comparison of light scattering
and electron microscope methods. Powder Technology, 203(2), 206-210.
Jarvis, P., Jefferson, B., Gregory, J., & Parsons, S. A. (2005). A review of floc strength and
breakage. Water Research, 39(14), 3121-3137.
98
Jarvis, P., Jefferson, B., & Parsons, S. A. (2005). Breakage, Regrowth, and Fractal Nature of
Natural Organic Matter Flocs. Environmental Science & Technology, 39(7), 2307-2314.
doi: 10.1021/es048854x
Kouisni, L., Holt-Hindle, P., Maki, K., & Paleologou, M. (2012). The lignoforce system: A new
process for the production of high-quality lignin from black liquor. J-FOR: The Journal of
Science and Technology for Forest Products and Processes, 2 6-10.
Kresta, S. (1998). Turbulence in stirred tanks: Anisotropic, approximate, and applied. The
Canadian Journal of Chemical Engineering, 76(3), 563-576. doi:
10.1002/cjce.5450760329
Loutfi, H., Blackwell, B., & Uloth, V. (1991). Lignin recovery from kraft black liquor: preliminary
process design. Tappi Journal, 74(1), 203-210.
Norgren, M., Edlund, H., & Wågberg, L. (2002). Aggregation of lignin derivatives under alkaline
conditions. Kinetics and aggregate structure. Langmuir, 18(7), 2859-2865.
Norgren, M., Edlund, H., Wågberg, L., Lindström, B., & Annergren, G. (2001). Aggregation of
kraft lignin derivatives under conditions relevant to the process, part I: phase behaviour.
Colloids and Surfaces A: Physicochemical and Engineering Aspects, 194(1–3), 85-96.
Norgren, M., & Lindstrom, B. (2000). Physico-chemical characterization of a fractionated kraft
lignin. Holzforschung, 54(5), 528-534. doi: 10.1515/HF.2000.089
Ohman, F., & Theliander, H. (2006). Washing lignin precipitated from kraft black liquor. Paperi
ja Puu, 88(5), 287-292.
Ohman, F., & Theliander, H. (2007). Fitration properties of lignin precipitated from black liquor.
Tappi Journal, 6(7), 3-9.
Ohman, F., Wallmo, H., & Theliander, H. (2007). A novel method for washing lignin precipitated
from kraft black liquor - Laboratory trials. Nordic Pulp and Paper Research Journal, 22(1),
9-16.
Paul, E. L., Atiemo-Obeng, V., & Kresta, S. M. (2003). Handbook of Industrial Mixing: Science
and Practice: Wiley.
Radiotis, T., Sullivan, J., MacLeod, M., Syed, S., & O'Hagan, T. (2007). Improved methods for
measuring residual effective alkali in kraft black liquors part 2: Comparison of titration
methods. Paper presented at Engineering, Pulping and Environmental Conference 2007,
TAPPI, October 21, 2007 - October 24, 2007, Jacksonville, FL, United states (Vol. 4, pp.
2388-2436).
Spicer, P. T., Keller, W., & Pratsinis, S. E. (1996). The Effect of Impeller Type on Floc Size and
Structure during Shear-Induced Flocculation. Journal of Colloid and Interface Science,
184(1), 112-122.
Spicer, P. T., Pratsinis, S. E., Raper, J., Amal, R., Bushell, G., & Meesters, G. (1998). Effect of
shear schedule on particle size, density, and structure during flocculation in stirred tanks.
Powder Technology, 97(1), 26-34.
Uloth, V. C., & Wearing, J. T. (1989). Kraft lignin recovery: acid precipitation versus
ultrafiltration, Part II: Technology and economics. Pulp & Paper Canada, 90(10), 34-37.
Wallberg, O., Jonsson, A.-S., & Wimmerstedt, R. (2003). Fractionation and concentration of kraft
black liquor lignin with ultrafiltration. Desalination, 154(2), 187-199. doi: 10.1016/S0011-
9164(03)80019-X
Wallmo, H., Richards, T., & Theliander, H. (2009). An investigation of process parameters during
lignin precipitation from kraft black liquors: A step towards an optimised precipitation
operation. Nordic Pulp and Paper Research Journal, 24(2), 158-164.
99
Wienhaus, O., Bernaczyk, H., & Pecina, H. (1990). Research into the precipitation of lignin from
sulfate black liquors, particularly by carbon dioxide. Das Papier, 44(11), 563-569.
Xu, W., & Gao, B. (2012). Effect of shear conditions on floc properties and membrane fouling in
coagulation/ultrafiltration hybrid process—The significance of Alb species. Journal of
Membrane Science, 415–416(0), 153-160.
Zhu, W., Westman, G., & Theliander, H. (2014). Investigation and characterization of lignin
precipitation in the lignoboost process. Journal of Wood Chemistry and Technology, 34(2),
77-97. doi: 10.1080/02773813.2013.838267
100
ACID PRECIPITATION OF LIGNIN FROM BLACK LIQUOR:
OPTIMIZATION OF FILTRATION PERFORMANCE AND YIELD
USING TAGUCHI METHOD
6.1 Introduction
The pulp and paper industry in Canada has been facing difficult economic conditions since the last
decade due to falling demand for traditional paper commodities and international competition; this
has caused mill closures and capacity reductions. Pulp and paper companies are re-evaluating their
business models and considering the manufacture of novel bioproducts and biochemicals using
biorefinery technologies. In this context, the extraction of lignin from the residual black liquor
stream of Kraft pulping mills and its conversion to novel products, such as phenolic resins, carbon
fibers and polyurethane foams has gained much attention in the research community and in
industry.
In the delignification step of Kraft pulping, lignin is removed from wood at high alkaline and high
temperature conditions to produce pulp. The removed lignin is entrained in the residual liquor,
called black liquor (BL), during the washing of the pulp. BL consists of degraded lignin and
hemicelluloses and spent delignification chemicals. It has a high calorific value and in a Kraft
process, it is concentrated and combusted in the recovery boiler to generate steam and power and
to regenerate the delignification chemicals (Smook, 1992b; Stevens et al., 1989).
Acid precipitation is a promising way of extracting lignin from black liquor (Kouisni et al., 2012;
Loutfi et al., 1991; Ohman et al., 2007a). In this method, lignin is precipitated by acidifying black
liquor using CO2 (acidification step) and the slurry is further agitated for 30-90 min (ageing step)
and then filtered. The produced cake is washed with H2SO4 and water to reduce the ash content of
lignin (Loutfi et al., 1991).
The lignin precipitation involves the neutralization of surface charges of lignin molecules, which
is mainly due to dissociated phenolic hydroxyl and carboxyl groups, inducing its coagulation into
solid particles, during the acidification step. These primary particles further aggregate into larger
lignin particle structures by mutual contact (Norgren et al., 2002; Norgren et al., 2001). The
aggregation of lignin in aqueous solutions has been explained using DLVO (Derjaguin Landau
101
Verwey Overbeek) theory, which describes colloidal stability as a balance between attraction
forces and electrostatic repulsion forces arising from the electrical double layer (Norgren et al.,
2002; Norgren et al., 2001; Norgren & Lindstrom, 2000a, 2000b). As a result, the process operating
conditions, including the precipitation pH, temperature, ionic strength of the black liquor and
mixing conditions influence the precipitation process.
The percentage of the total lignin that is precipitated out in the black liquor (lignin yield) can be
enhanced by decreasing the precipitation pH, however, filterable lignin can only be obtained in a
narrow range of pH values starting from 9 to 10.8 (Howell & Thring, 2000; Loutfi et al., 1991;
Ohman & Theliander, 2007; Theliander, 2010; Zhu et al., 2014). The lignin yield increases with
decreasing temperature although readily filterable lignin is only produced at temperatures from 60
to 80°C (Loutfi et al., 1991; Theliander, 2010; Wallmo, Richards, et al., 2009). The lignin particles
precipitated outside of the optimum ranges of pH and temperature have been reported to be very
fine or soft and tacky making it difficult to filter and wash them (Loutfi et al., 1991). The black
liquor concentration, which is suitable for lignin precipitation, was reported to be between 30 to
40% total solids(Loutfi et al., 1991). Dilute liquor results in lower yields but concentrated liquor is
difficult to handle and produces fine lignin particles (Alen et al., 1979; Loutfi et al., 1991). Higher
residence times and lower agitation rates during the ageing operation were also reported to decrease
the filtration resistance of the lignin cake (Wallmo, Richards, et al., 2009).
High value lignin applications such as carbon fibers require a lignin ash content lower than 0.1%
(Luo et al., 2011). Recent efforts in lignin precipitation process development have been focused on
producing low ash lignin by improving the filtration and washing steps. It has been reported that
gradients of ionic strength are created during washing the cake, causing the lignin to re-dissolve
and plug the cake (Ohman & Theliander, 2006; Ohman et al., 2007a). Re-slurring of the lignin cake
using sulfuric acid was proposed, followed by re-filtration and displacement washing to overcome
this drawback. Black liquor oxidation prior to acidification has been reported to produce larger
lignin particles, resulting in easier filtration and washing and low ash lignin product (Kouisni et
al., 2012).
To produce high purity lignin with low production costs, the lignin precipitation process, which is
influenced by many parameters, has to be carefully optimized. The application of statistical design
of experiments (DOE) can be highly useful in such a situation. In DOE, the parameters are
102
simultaneously varied in order to obtain valid and objective information using planned
experimental trials. Taguchi orthogonal array DOE has been widely used in industrial product and
process design and optimization. In this method, a large number of factors can be investigated using
a minimum number of experiments. Orthogonal arrays (OA), in which each pair of factors is tested
at least once in a balanced manner, are used in this method and this help to identify the main effects
of the investigated parameters. The method uses signal-to-noise (S/N) ratios, which incorporate
average factor effects as well as the variation in equal priority, to find out the optimum factor levels.
The method also facilitate performing the analysis of variance (ANOVA), which estimates the
significance and relative influence of each parameter.
To the best of our knowledge, no such systematic investigation studying the effects of operating
conditions of lignin precipitation process has been published. The objective of this work was to
determine the optimum operating conditions of the acid precipitation process that achieve higher
filtration performance and yield, thus producing low ash lignin product. Oxidized softwood black
liquor was used in this work. The investigation was carried out in the following sequence: (1)
Preliminary trials to screen and determine the range of main operating conditions; (2) Experimental
investigation using Taguchi design OA design; (3) Statistical analysis using S/N ratios and
ANOVA; (4) Verification of optimal conditions using confirmation experiments. The overall
optimum process operating ranges have been discussed.
6.2 Methodology
6.2.1 Experimental work
6.2.1.1 Experimental setup
The experiments were carried out in an open vessel of 2 L capacity and 11.8 cm inside diameter.
The vessel was fitted with standard baffles (T/10). A schematic of the setup with dimensions is
given in Figure 6-1. The vessel was heated by a circulating hot water bath with temperature control
connected to the outer jacket of the vessel. CO2 was injected into the tank by a sparger tip located
at the bottom of the vessel. A four bladed and 45° angle pitched blade turbine (PBT) with diameter
5.5 cm was used for the agitation. The impeller was placed 3.9 cm above the bottom of the tank.
The filtration was performed using a standard vacuum filtration setup consisting of a Buchner
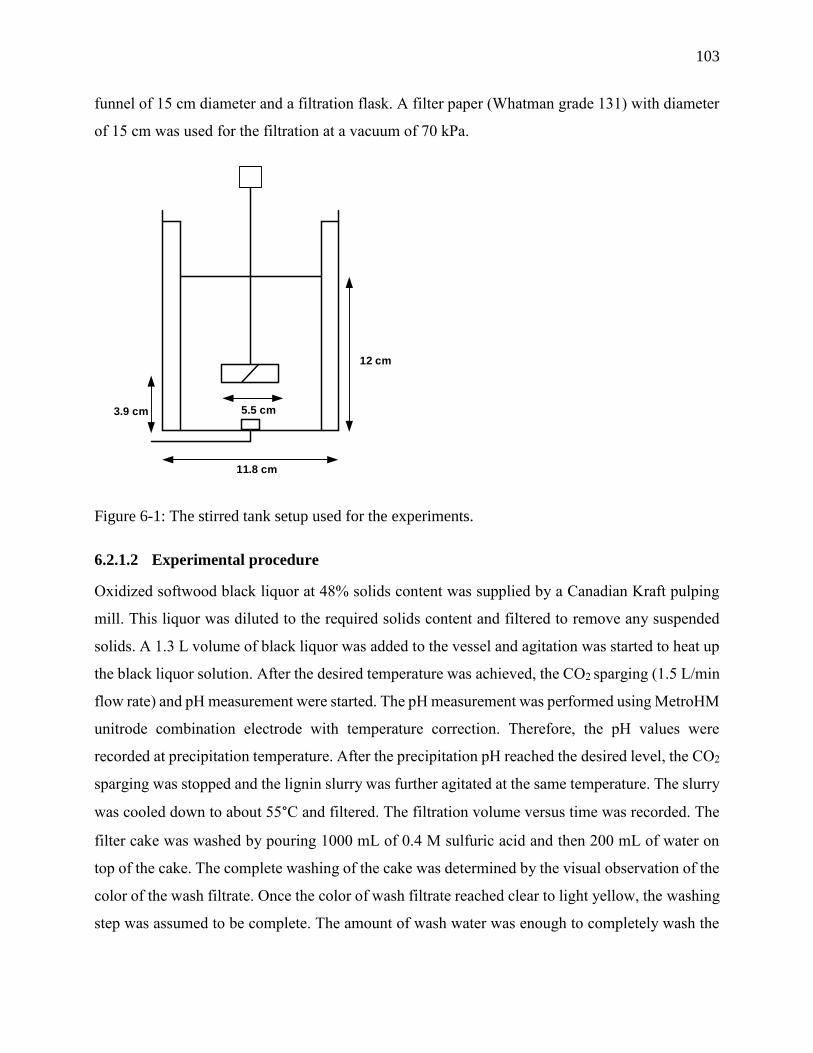
103
funnel of 15 cm diameter and a filtration flask. A filter paper (Whatman grade 131) with diameter
of 15 cm was used for the filtration at a vacuum of 70 kPa.
11.8 cm
3.9 cm 5.5 cm
12 cm
Figure 6-1: The stirred tank setup used for the experiments.
6.2.1.2 Experimental procedure
Oxidized softwood black liquor at 48% solids content was supplied by a Canadian Kraft pulping
mill. This liquor was diluted to the required solids content and filtered to remove any suspended
solids. A 1.3 L volume of black liquor was added to the vessel and agitation was started to heat up
the black liquor solution. After the desired temperature was achieved, the CO2 sparging (1.5 L/min
flow rate) and pH measurement were started. The pH measurement was performed using MetroHM
unitrode combination electrode with temperature correction. Therefore, the pH values were
recorded at precipitation temperature. After the precipitation pH reached the desired level, the CO2
sparging was stopped and the lignin slurry was further agitated at the same temperature. The slurry
was cooled down to about 55°C and filtered. The filtration volume versus time was recorded. The
filter cake was washed by pouring 1000 mL of 0.4 M sulfuric acid and then 200 mL of water on
top of the cake. The complete washing of the cake was determined by the visual observation of the
color of the wash filtrate. Once the color of wash filtrate reached clear to light yellow, the washing
step was assumed to be complete. The amount of wash water was enough to completely wash the
104
cakes generated in all the experiments. The washed cake was air dried for 24 hours and weighed.
Samples of the cake were oven dried at 105°C to determine solid content. Samples of the oven
dried cake was analyzed for ash content.
6.2.2 Black liquor, filtrate and lignin characterization
The properties of the black liquor are given in Table 6-1. The solid content black liquor, filtrate
and lignin were determined by oven drying a sample of known quantity at 105°C until a constant
weight was obtained according to the CPPA J.15 (II) standard test procedure. The UV lignin
content of the black liquor and filtrates were analyzed by using Biochrome Ultraspec UV
spectrophotometer at wave length of 280 nm. A liquor sample (2 g) was taken and dissolved in 100
mL of NaOH and diluted to an OD280 of 0.3-0.8. An absorption coefficient of 23.7 dm3g-1cm-1 was
used. The Klason and acid-soluble lignin content were determined by using a procedure described
in the literature (Zhu et al., 2014). The ash content of black liquor was determined by igniting a
known weight of black liquor at 950°C and weighing the inorganic residue (Holmqvist et al., 2005;
Wallberg et al., 2003). The ash content of lignin was determined by igniting a known quantity of
oven dried lignin at 525°C until a constant weight was obtained and weighing the remaining ash.
The residual alkali content was determined according to a procedure described in literature
(Radiotis et al., 2007). Sulfide content of black liquor was determined according to the CPPA J.15
(VI) standard test procedure. The lignin particle sizes were characterized using a laser refraction
instrument (Mastersizer 3000), in which the particles were dispersed in 3M NaCl solution with pH
adjusted to the precipitation pH.
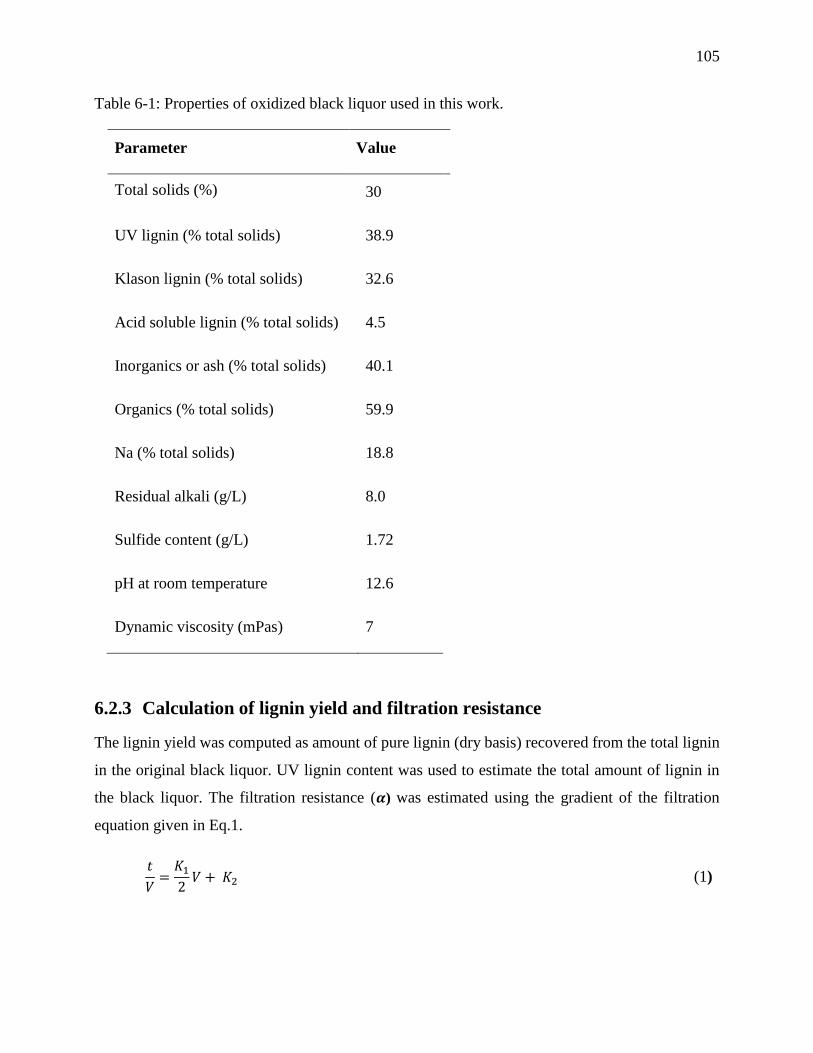
105
Table 6-1: Properties of oxidized black liquor used in this work.
Parameter Value
Total solids (%) 30
UV lignin (% total solids) 38.9
Klason lignin (% total solids) 32.6
Acid soluble lignin (% total solids) 4.5
Inorganics or ash (% total solids) 40.1
Organics (% total solids) 59.9
Na (% total solids) 18.8
Residual alkali (g/L) 8.0
Sulfide content (g/L) 1.72
pH at room temperature 12.6
Dynamic viscosity (mPas) 7
6.2.3 Calculation of lignin yield and filtration resistance
The lignin yield was computed as amount of pure lignin (dry basis) recovered from the total lignin
in the original black liquor. UV lignin content was used to estimate the total amount of lignin in
the black liquor. The filtration resistance (𝜶) was estimated using the gradient of the filtration
equation given in Eq.1.
𝑡
𝑉=
𝐾1
2𝑉 + 𝐾2 (1)
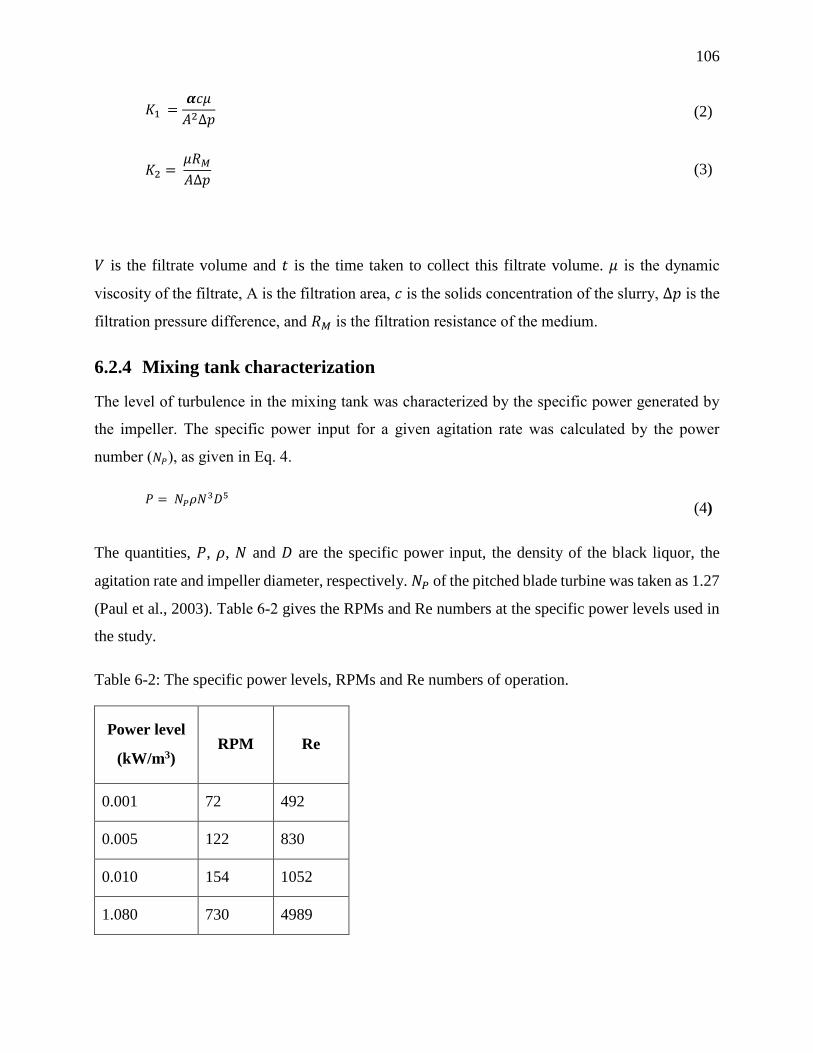
106
𝐾1 =𝜶𝑐𝜇
𝐴2∆𝑝 (2)
𝐾2 = 𝜇𝑅𝑀
𝐴∆𝑝 (3)
𝑉 is the filtrate volume and 𝑡 is the time taken to collect this filtrate volume. 𝜇 is the dynamic
viscosity of the filtrate, A is the filtration area, 𝑐 is the solids concentration of the slurry, ∆𝑝 is the
filtration pressure difference, and 𝑅𝑀 is the filtration resistance of the medium.
6.2.4 Mixing tank characterization
The level of turbulence in the mixing tank was characterized by the specific power generated by
the impeller. The specific power input for a given agitation rate was calculated by the power
number (𝑁𝑃), as given in Eq. 4.
𝑃 = 𝑁𝑃𝜌𝑁3𝐷5
(4)
The quantities, 𝑃, 𝜌, 𝑁 and 𝐷 are the specific power input, the density of the black liquor, the
agitation rate and impeller diameter, respectively. 𝑁𝑃 of the pitched blade turbine was taken as 1.27
(Paul et al., 2003). Table 6-2 gives the RPMs and Re numbers at the specific power levels used in
the study.
Table 6-2: The specific power levels, RPMs and Re numbers of operation.
Power level
(kW/m3) RPM Re
0.001 72 492
0.005 122 830
0.010 154 1052
1.080 730 4989
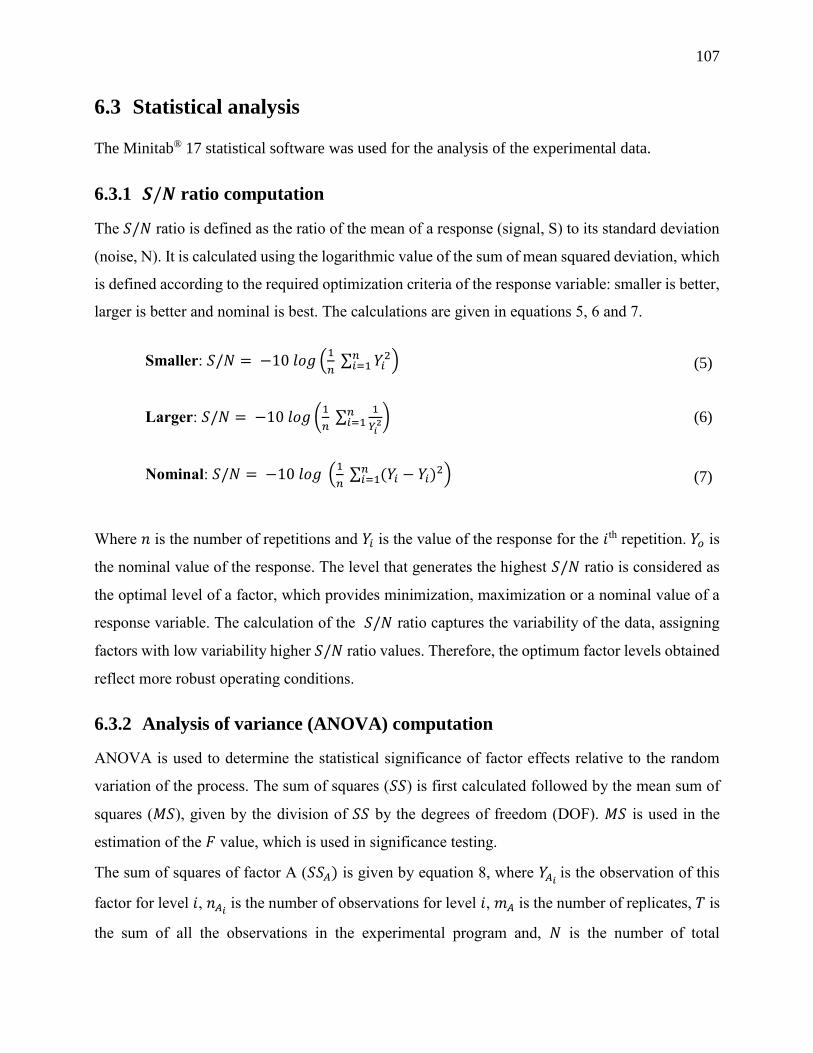
107
6.3 Statistical analysis
The Minitab® 17 statistical software was used for the analysis of the experimental data.
6.3.1 𝑺/𝑵 ratio computation
The 𝑆/𝑁 ratio is defined as the ratio of the mean of a response (signal, S) to its standard deviation
(noise, N). It is calculated using the logarithmic value of the sum of mean squared deviation, which
is defined according to the required optimization criteria of the response variable: smaller is better,
larger is better and nominal is best. The calculations are given in equations 5, 6 and 7.
Smaller: 𝑆/𝑁 = −10 𝑙𝑜𝑔 (1
𝑛 ∑ 𝑌𝑖
2𝑛𝑖=1 ) (5)
Larger: 𝑆/𝑁 = −10 𝑙𝑜𝑔 (1
𝑛 ∑
1
𝑌𝑖2
𝑛𝑖=1 ) (6)
Nominal: 𝑆/𝑁 = −10 𝑙𝑜𝑔 (1
𝑛 ∑ (𝑌𝑖 − 𝑌𝑖)
2𝑛𝑖=1 ) (7)
Where 𝑛 is the number of repetitions and 𝑌𝑖 is the value of the response for the 𝑖th repetition. 𝑌𝑜 is
the nominal value of the response. The level that generates the highest 𝑆/𝑁 ratio is considered as
the optimal level of a factor, which provides minimization, maximization or a nominal value of a
response variable. The calculation of the 𝑆/𝑁 ratio captures the variability of the data, assigning
factors with low variability higher 𝑆/𝑁 ratio values. Therefore, the optimum factor levels obtained
reflect more robust operating conditions.
6.3.2 Analysis of variance (ANOVA) computation
ANOVA is used to determine the statistical significance of factor effects relative to the random
variation of the process. The sum of squares (𝑆𝑆) is first calculated followed by the mean sum of
squares (𝑀𝑆), given by the division of 𝑆𝑆 by the degrees of freedom (DOF). 𝑀𝑆 is used in the
estimation of the 𝐹 value, which is used in significance testing.
The sum of squares of factor A (𝑆𝑆𝐴) is given by equation 8, where 𝑌𝐴𝑖is the observation of this
factor for level 𝑖, 𝑛𝐴𝑖 is the number of observations for level 𝑖, 𝑚𝐴 is the number of replicates, 𝑇 is
the sum of all the observations in the experimental program and, 𝑁 is the number of total
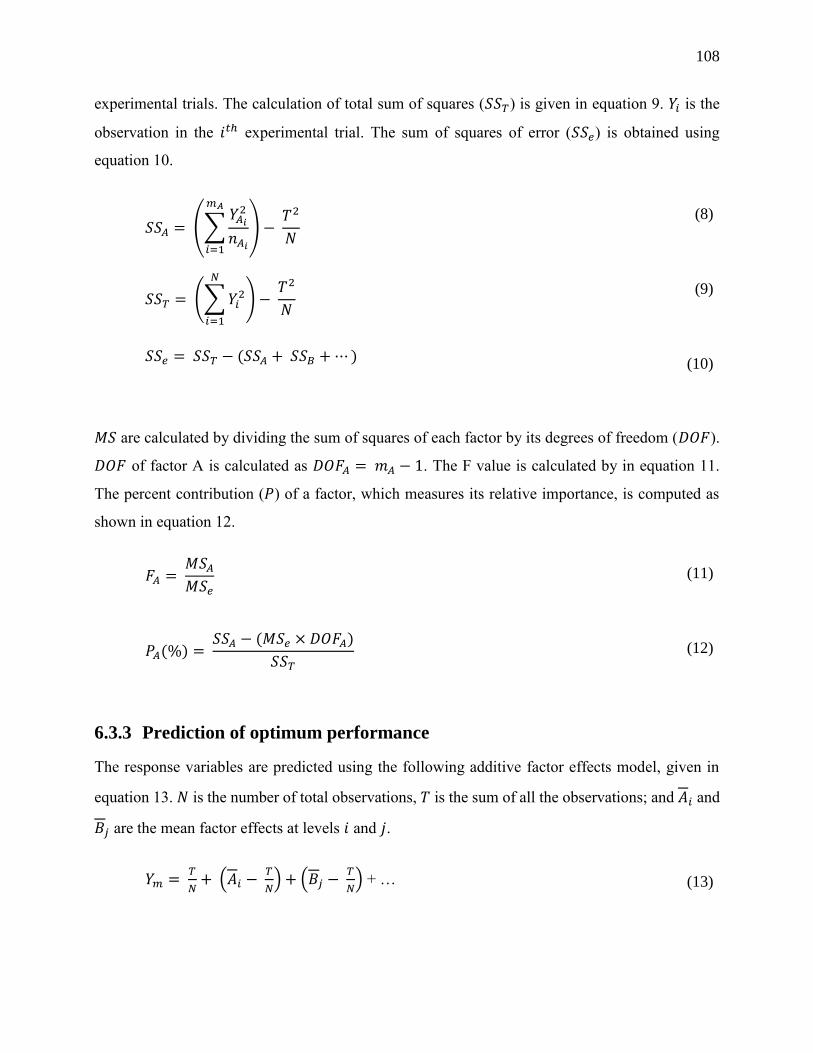
108
experimental trials. The calculation of total sum of squares (𝑆𝑆𝑇) is given in equation 9. 𝑌𝑖 is the
observation in the 𝑖𝑡ℎ experimental trial. The sum of squares of error (𝑆𝑆𝑒) is obtained using
equation 10.
𝑆𝑆𝐴 = (∑
𝑌𝐴𝑖
2
𝑛𝐴𝑖
𝑚𝐴
𝑖=1
) − 𝑇2
𝑁
(8)
𝑆𝑆𝑇 = (∑ 𝑌𝑖
2
𝑁
𝑖=1
) − 𝑇2
𝑁
(9)
𝑆𝑆𝑒 = 𝑆𝑆𝑇 − (𝑆𝑆𝐴 + 𝑆𝑆𝐵 + ⋯ )
(10)
𝑀𝑆 are calculated by dividing the sum of squares of each factor by its degrees of freedom (𝐷𝑂𝐹).
𝐷𝑂𝐹 of factor A is calculated as 𝐷𝑂𝐹𝐴 = 𝑚𝐴 − 1. The F value is calculated by in equation 11.
The percent contribution (𝑃) of a factor, which measures its relative importance, is computed as
shown in equation 12.
𝐹𝐴 = 𝑀𝑆𝐴
𝑀𝑆𝑒 (11)
𝑃𝐴(%) = 𝑆𝑆𝐴 − (𝑀𝑆𝑒 × 𝐷𝑂𝐹𝐴)
𝑆𝑆𝑇 (12)
6.3.3 Prediction of optimum performance
The response variables are predicted using the following additive factor effects model, given in
equation 13. 𝑁 is the number of total observations, 𝑇 is the sum of all the observations; and 𝐴𝑖 and
𝐵𝑗 are the mean factor effects at levels 𝑖 and 𝑗.
𝑌𝑚 = 𝑇
𝑁+ (𝐴𝑖 −
𝑇
𝑁) + (𝐵𝑗 −
𝑇
𝑁) + … (13)
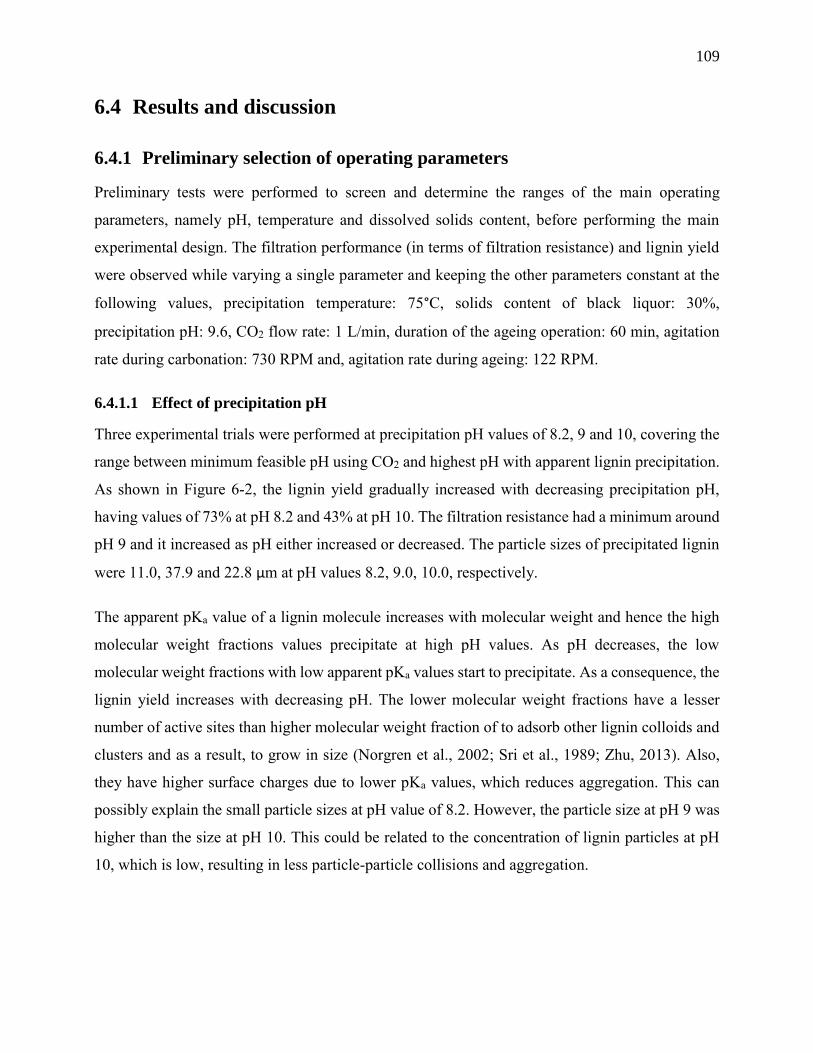
109
6.4 Results and discussion
6.4.1 Preliminary selection of operating parameters
Preliminary tests were performed to screen and determine the ranges of the main operating
parameters, namely pH, temperature and dissolved solids content, before performing the main
experimental design. The filtration performance (in terms of filtration resistance) and lignin yield
were observed while varying a single parameter and keeping the other parameters constant at the
following values, precipitation temperature: 75°C, solids content of black liquor: 30%,
precipitation pH: 9.6, CO2 flow rate: 1 L/min, duration of the ageing operation: 60 min, agitation
rate during carbonation: 730 RPM and, agitation rate during ageing: 122 RPM.
6.4.1.1 Effect of precipitation pH
Three experimental trials were performed at precipitation pH values of 8.2, 9 and 10, covering the
range between minimum feasible pH using CO2 and highest pH with apparent lignin precipitation.
As shown in Figure 6-2, the lignin yield gradually increased with decreasing precipitation pH,
having values of 73% at pH 8.2 and 43% at pH 10. The filtration resistance had a minimum around
pH 9 and it increased as pH either increased or decreased. The particle sizes of precipitated lignin
were 11.0, 37.9 and 22.8 µm at pH values 8.2, 9.0, 10.0, respectively.
The apparent pKa value of a lignin molecule increases with molecular weight and hence the high
molecular weight fractions values precipitate at high pH values. As pH decreases, the low
molecular weight fractions with low apparent pKa values start to precipitate. As a consequence, the
lignin yield increases with decreasing pH. The lower molecular weight fractions have a lesser
number of active sites than higher molecular weight fraction of to adsorb other lignin colloids and
clusters and as a result, to grow in size (Norgren et al., 2002; Sri et al., 1989; Zhu, 2013). Also,
they have higher surface charges due to lower pKa values, which reduces aggregation. This can
possibly explain the small particle sizes at pH value of 8.2. However, the particle size at pH 9 was
higher than the size at pH 10. This could be related to the concentration of lignin particles at pH
10, which is low, resulting in less particle-particle collisions and aggregation.
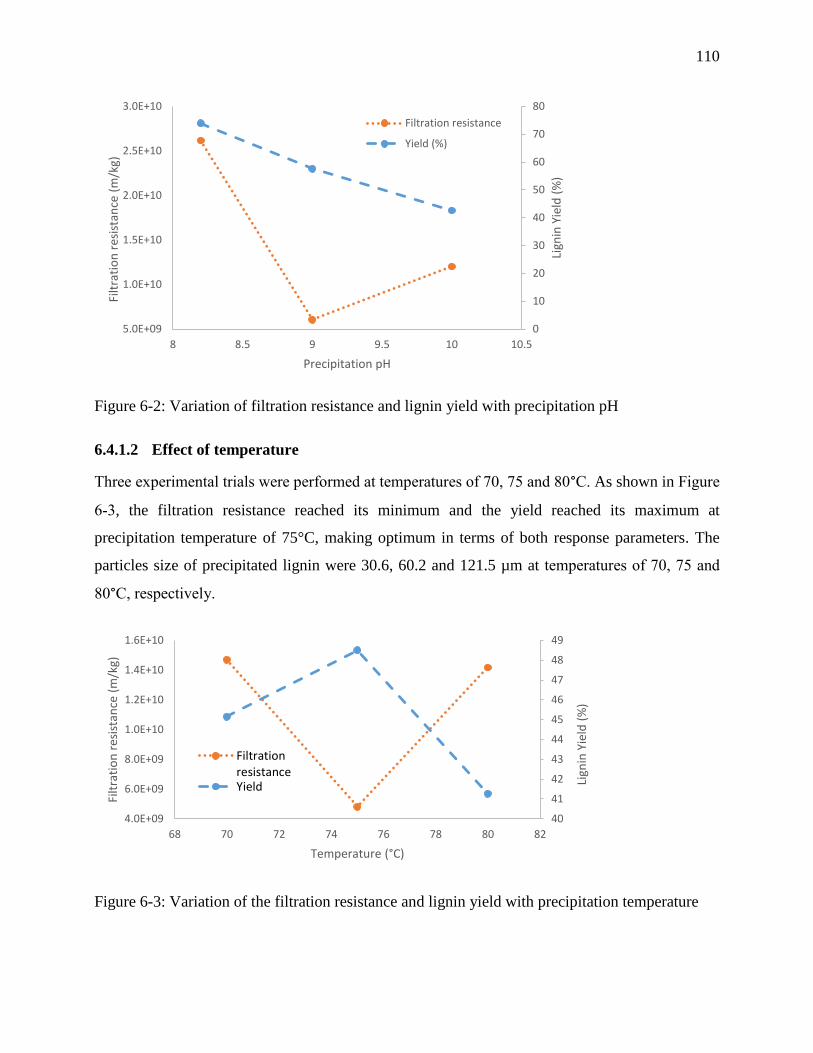
110
Figure 6-2: Variation of filtration resistance and lignin yield with precipitation pH
6.4.1.2 Effect of temperature
Three experimental trials were performed at temperatures of 70, 75 and 80°C. As shown in Figure
6-3, the filtration resistance reached its minimum and the yield reached its maximum at
precipitation temperature of 75°C, making optimum in terms of both response parameters. The
particles size of precipitated lignin were 30.6, 60.2 and 121.5 µm at temperatures of 70, 75 and
80°C, respectively.
Figure 6-3: Variation of the filtration resistance and lignin yield with precipitation temperature
0
10
20
30
40
50
60
70
80
5.0E+09
1.0E+10
1.5E+10
2.0E+10
2.5E+10
3.0E+10
8 8.5 9 9.5 10 10.5
Lign
in Y
ield
(%
)
Filt
rati
on
res
ista
nce
(m
/kg)
Precipitation pH
Filtration resistance
Yield (%)
40
41
42
43
44
45
46
47
48
49
4.0E+09
6.0E+09
8.0E+09
1.0E+10
1.2E+10
1.4E+10
1.6E+10
68 70 72 74 76 78 80 82
Lign
in Y
ield
(%
)
Filt
rati
on
res
ista
nce
(m
/kg)
Temperature (°C)
FiltrationresistanceYield
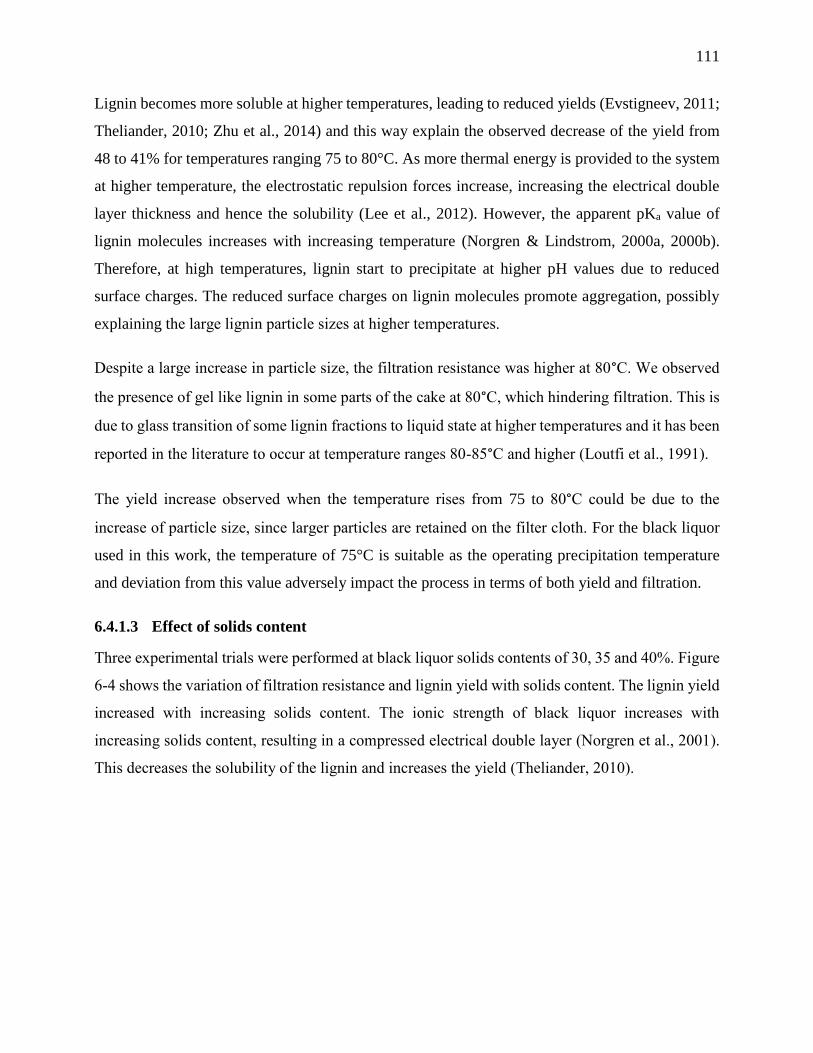
111
Lignin becomes more soluble at higher temperatures, leading to reduced yields (Evstigneev, 2011;
Theliander, 2010; Zhu et al., 2014) and this way explain the observed decrease of the yield from
48 to 41% for temperatures ranging 75 to 80°C. As more thermal energy is provided to the system
at higher temperature, the electrostatic repulsion forces increase, increasing the electrical double
layer thickness and hence the solubility (Lee et al., 2012). However, the apparent pKa value of
lignin molecules increases with increasing temperature (Norgren & Lindstrom, 2000a, 2000b).
Therefore, at high temperatures, lignin start to precipitate at higher pH values due to reduced
surface charges. The reduced surface charges on lignin molecules promote aggregation, possibly
explaining the large lignin particle sizes at higher temperatures.
Despite a large increase in particle size, the filtration resistance was higher at 80°C. We observed
the presence of gel like lignin in some parts of the cake at 80°C, which hindering filtration. This is
due to glass transition of some lignin fractions to liquid state at higher temperatures and it has been
reported in the literature to occur at temperature ranges 80-85°C and higher (Loutfi et al., 1991).
The yield increase observed when the temperature rises from 75 to 80°C could be due to the
increase of particle size, since larger particles are retained on the filter cloth. For the black liquor
used in this work, the temperature of 75°C is suitable as the operating precipitation temperature
and deviation from this value adversely impact the process in terms of both yield and filtration.
6.4.1.3 Effect of solids content
Three experimental trials were performed at black liquor solids contents of 30, 35 and 40%. Figure
6-4 shows the variation of filtration resistance and lignin yield with solids content. The lignin yield
increased with increasing solids content. The ionic strength of black liquor increases with
increasing solids content, resulting in a compressed electrical double layer (Norgren et al., 2001).
This decreases the solubility of the lignin and increases the yield (Theliander, 2010).
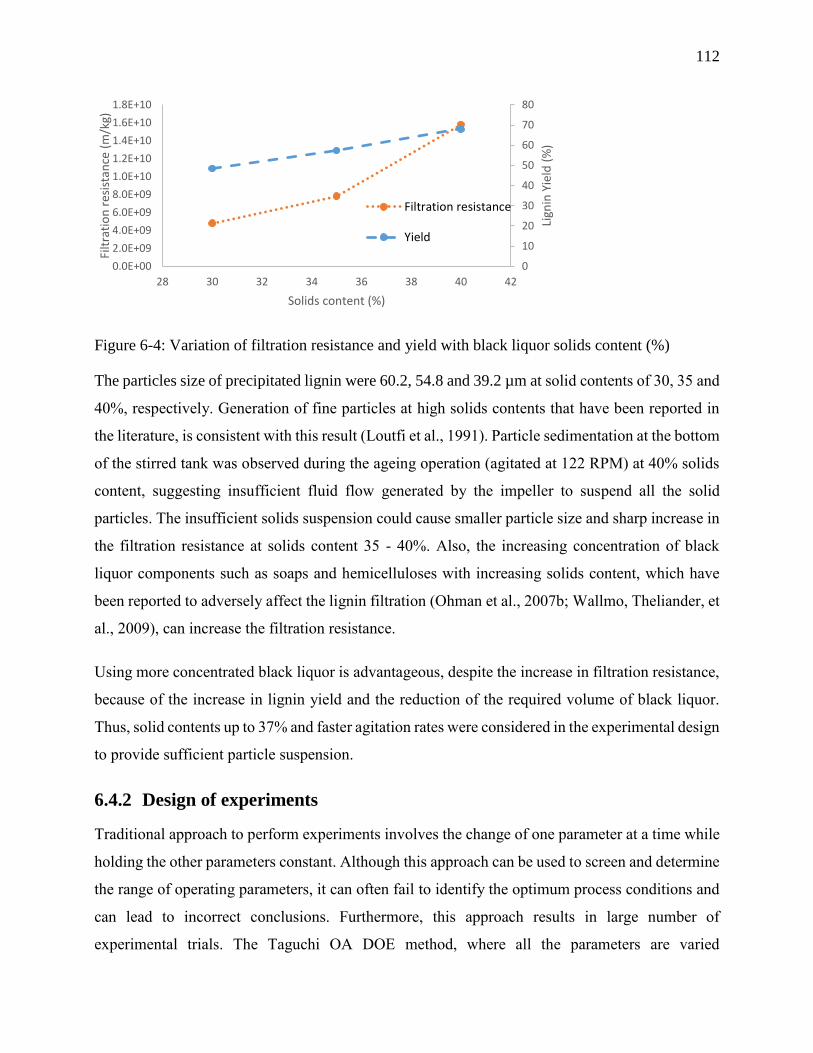
112
Figure 6-4: Variation of filtration resistance and yield with black liquor solids content (%)
The particles size of precipitated lignin were 60.2, 54.8 and 39.2 µm at solid contents of 30, 35 and
40%, respectively. Generation of fine particles at high solids contents that have been reported in
the literature, is consistent with this result (Loutfi et al., 1991). Particle sedimentation at the bottom
of the stirred tank was observed during the ageing operation (agitated at 122 RPM) at 40% solids
content, suggesting insufficient fluid flow generated by the impeller to suspend all the solid
particles. The insufficient solids suspension could cause smaller particle size and sharp increase in
the filtration resistance at solids content 35 - 40%. Also, the increasing concentration of black
liquor components such as soaps and hemicelluloses with increasing solids content, which have
been reported to adversely affect the lignin filtration (Ohman et al., 2007b; Wallmo, Theliander, et
al., 2009), can increase the filtration resistance.
Using more concentrated black liquor is advantageous, despite the increase in filtration resistance,
because of the increase in lignin yield and the reduction of the required volume of black liquor.
Thus, solid contents up to 37% and faster agitation rates were considered in the experimental design
to provide sufficient particle suspension.
6.4.2 Design of experiments
Traditional approach to perform experiments involves the change of one parameter at a time while
holding the other parameters constant. Although this approach can be used to screen and determine
the range of operating parameters, it can often fail to identify the optimum process conditions and
can lead to incorrect conclusions. Furthermore, this approach results in large number of
experimental trials. The Taguchi OA DOE method, where all the parameters are varied
0
10
20
30
40
50
60
70
80
0.0E+00
2.0E+09
4.0E+09
6.0E+09
8.0E+09
1.0E+10
1.2E+10
1.4E+10
1.6E+10
1.8E+10
28 30 32 34 36 38 40 42
Lign
in Y
ield
(%
)
Filt
rati
on
res
ista
nce
(m
/kg)
Solids content (%)
Filtration resistance
Yield
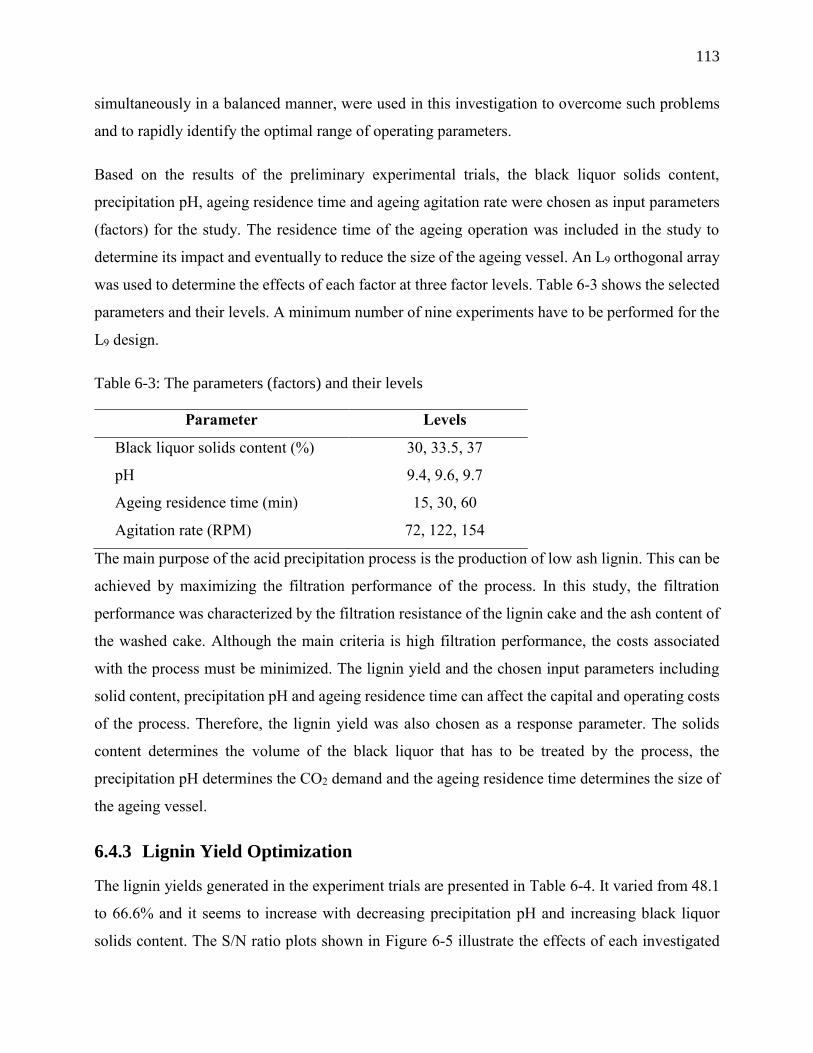
113
simultaneously in a balanced manner, were used in this investigation to overcome such problems
and to rapidly identify the optimal range of operating parameters.
Based on the results of the preliminary experimental trials, the black liquor solids content,
precipitation pH, ageing residence time and ageing agitation rate were chosen as input parameters
(factors) for the study. The residence time of the ageing operation was included in the study to
determine its impact and eventually to reduce the size of the ageing vessel. An L9 orthogonal array
was used to determine the effects of each factor at three factor levels. Table 6-3 shows the selected
parameters and their levels. A minimum number of nine experiments have to be performed for the
L9 design.
Table 6-3: The parameters (factors) and their levels
Parameter Levels
Black liquor solids content (%) 30, 33.5, 37
pH 9.4, 9.6, 9.7
Ageing residence time (min) 15, 30, 60
Agitation rate (RPM) 72, 122, 154
The main purpose of the acid precipitation process is the production of low ash lignin. This can be
achieved by maximizing the filtration performance of the process. In this study, the filtration
performance was characterized by the filtration resistance of the lignin cake and the ash content of
the washed cake. Although the main criteria is high filtration performance, the costs associated
with the process must be minimized. The lignin yield and the chosen input parameters including
solid content, precipitation pH and ageing residence time can affect the capital and operating costs
of the process. Therefore, the lignin yield was also chosen as a response parameter. The solids
content determines the volume of the black liquor that has to be treated by the process, the
precipitation pH determines the CO2 demand and the ageing residence time determines the size of
the ageing vessel.
6.4.3 Lignin Yield Optimization
The lignin yields generated in the experiment trials are presented in Table 6-4. It varied from 48.1
to 66.6% and it seems to increase with decreasing precipitation pH and increasing black liquor
solids content. The S/N ratio plots shown in Figure 6-5 illustrate the effects of each investigated
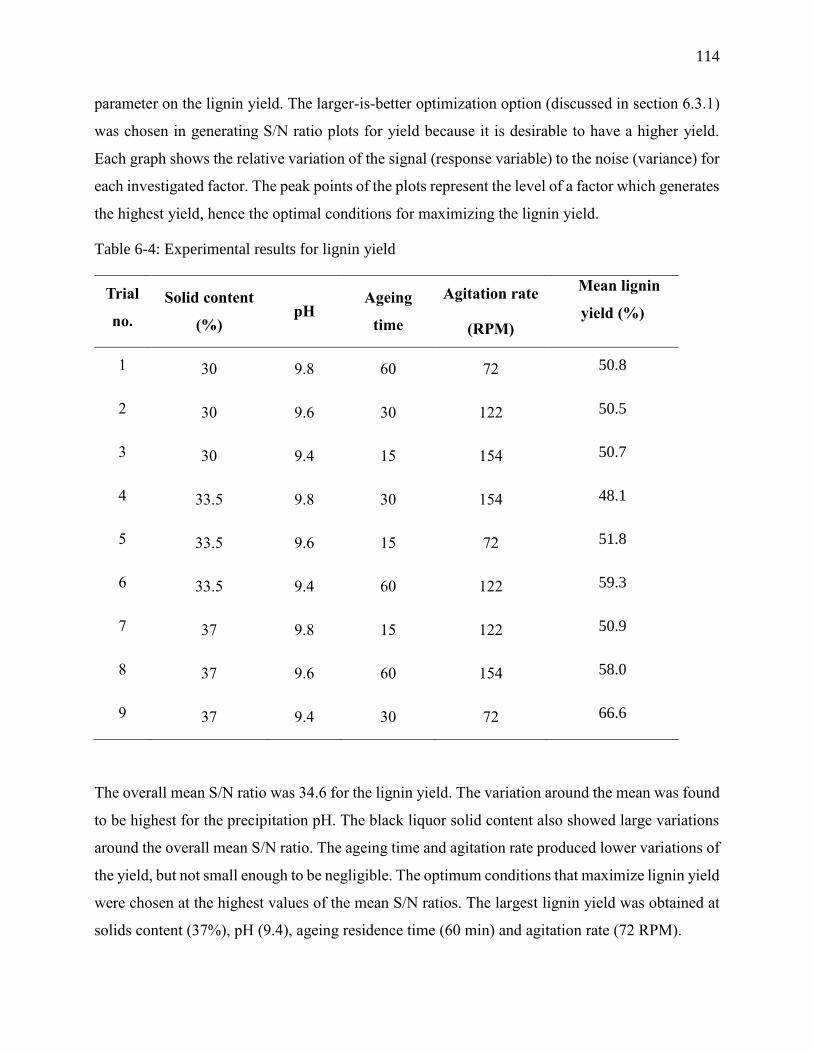
114
parameter on the lignin yield. The larger-is-better optimization option (discussed in section 6.3.1)
was chosen in generating S/N ratio plots for yield because it is desirable to have a higher yield.
Each graph shows the relative variation of the signal (response variable) to the noise (variance) for
each investigated factor. The peak points of the plots represent the level of a factor which generates
the highest yield, hence the optimal conditions for maximizing the lignin yield.
Table 6-4: Experimental results for lignin yield
Trial
no.
Solid content
(%) pH
Ageing
time
Agitation rate
(RPM)
Mean lignin
yield (%)
1 30 9.8 60 72 50.8
2 30 9.6 30 122 50.5
3 30 9.4 15 154 50.7
4 33.5 9.8 30 154 48.1
5 33.5 9.6 15 72 51.8
6 33.5 9.4 60 122 59.3
7 37 9.8 15 122 50.9
8 37 9.6 60 154 58.0
9 37 9.4 30 72 66.6
The overall mean S/N ratio was 34.6 for the lignin yield. The variation around the mean was found
to be highest for the precipitation pH. The black liquor solid content also showed large variations
around the overall mean S/N ratio. The ageing time and agitation rate produced lower variations of
the yield, but not small enough to be negligible. The optimum conditions that maximize lignin yield
were chosen at the highest values of the mean S/N ratios. The largest lignin yield was obtained at
solids content (37%), pH (9.4), ageing residence time (60 min) and agitation rate (72 RPM).
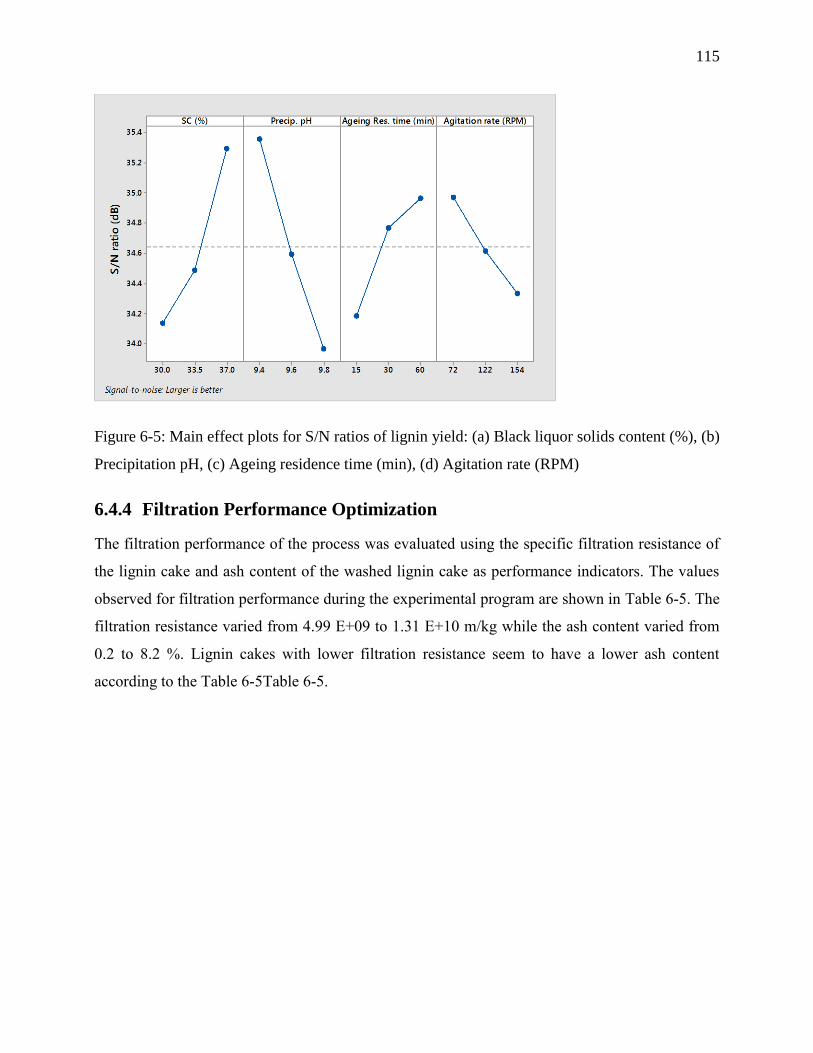
115
Figure 6-5: Main effect plots for S/N ratios of lignin yield: (a) Black liquor solids content (%), (b)
Precipitation pH, (c) Ageing residence time (min), (d) Agitation rate (RPM)
6.4.4 Filtration Performance Optimization
The filtration performance of the process was evaluated using the specific filtration resistance of
the lignin cake and ash content of the washed lignin cake as performance indicators. The values
observed for filtration performance during the experimental program are shown in Table 6-5. The
filtration resistance varied from 4.99 E+09 to 1.31 E+10 m/kg while the ash content varied from
0.2 to 8.2 %. Lignin cakes with lower filtration resistance seem to have a lower ash content
according to the Table 6-5Table 6-5.
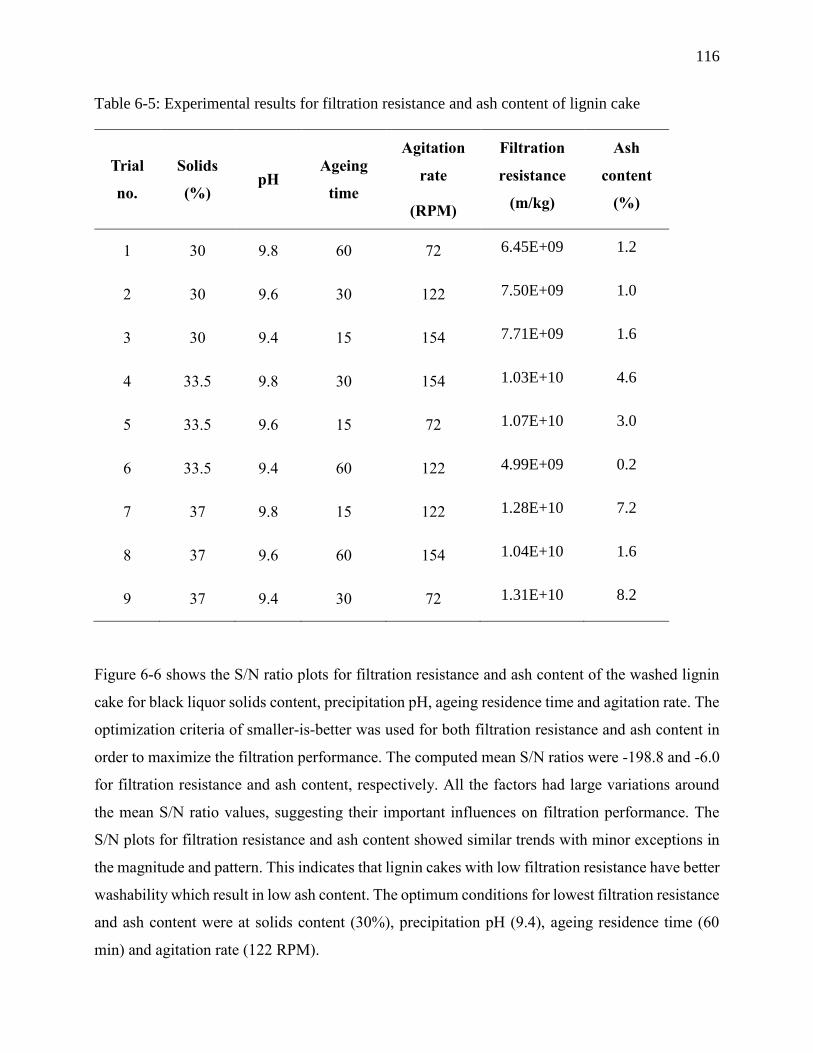
116
Table 6-5: Experimental results for filtration resistance and ash content of lignin cake
Trial
no.
Solids
(%) pH
Ageing
time
Agitation
rate
(RPM)
Filtration
resistance
(m/kg)
Ash
content
(%)
1 30 9.8 60 72 6.45E+09 1.2
2 30 9.6 30 122 7.50E+09 1.0
3 30 9.4 15 154 7.71E+09 1.6
4 33.5 9.8 30 154 1.03E+10 4.6
5 33.5 9.6 15 72 1.07E+10 3.0
6 33.5 9.4 60 122 4.99E+09 0.2
7 37 9.8 15 122 1.28E+10 7.2
8 37 9.6 60 154 1.04E+10 1.6
9 37 9.4 30 72 1.31E+10 8.2
Figure 6-6 shows the S/N ratio plots for filtration resistance and ash content of the washed lignin
cake for black liquor solids content, precipitation pH, ageing residence time and agitation rate. The
optimization criteria of smaller-is-better was used for both filtration resistance and ash content in
order to maximize the filtration performance. The computed mean S/N ratios were -198.8 and -6.0
for filtration resistance and ash content, respectively. All the factors had large variations around
the mean S/N ratio values, suggesting their important influences on filtration performance. The
S/N plots for filtration resistance and ash content showed similar trends with minor exceptions in
the magnitude and pattern. This indicates that lignin cakes with low filtration resistance have better
washability which result in low ash content. The optimum conditions for lowest filtration resistance
and ash content were at solids content (30%), precipitation pH (9.4), ageing residence time (60
min) and agitation rate (122 RPM).
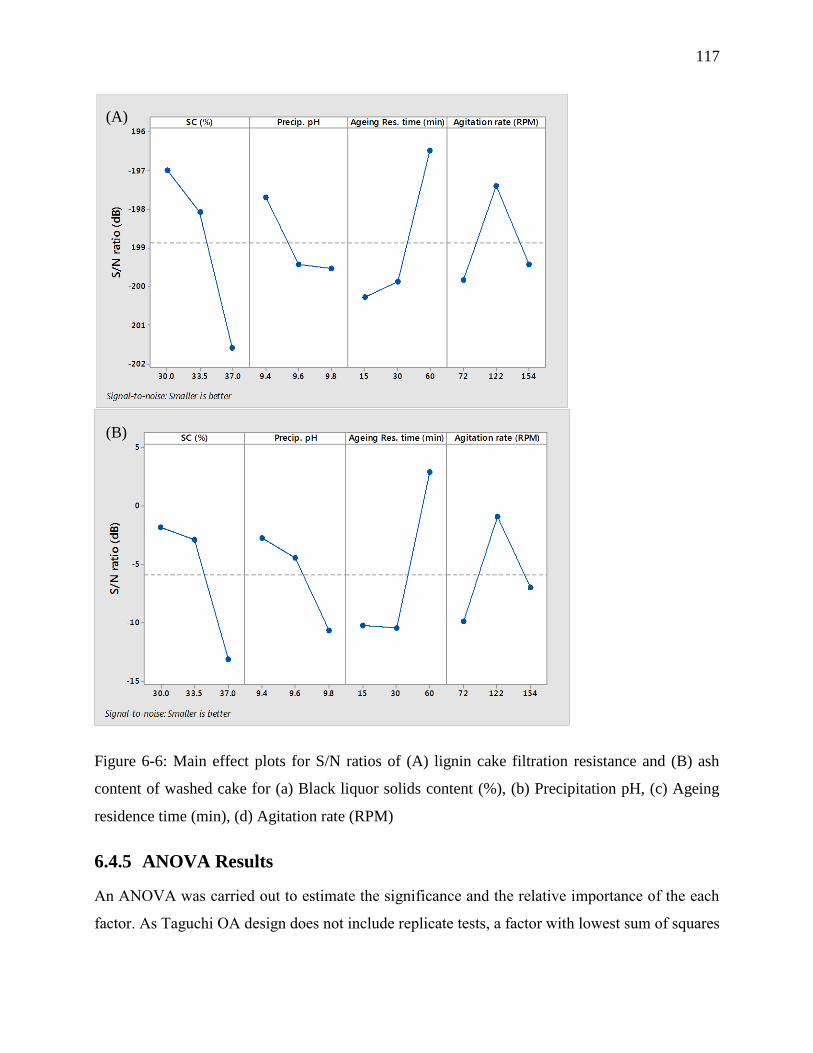
117
Figure 6-6: Main effect plots for S/N ratios of (A) lignin cake filtration resistance and (B) ash
content of washed cake for (a) Black liquor solids content (%), (b) Precipitation pH, (c) Ageing
residence time (min), (d) Agitation rate (RPM)
6.4.5 ANOVA Results
An ANOVA was carried out to estimate the significance and the relative importance of the each
factor. As Taguchi OA design does not include replicate tests, a factor with lowest sum of squares
(A)
(B)
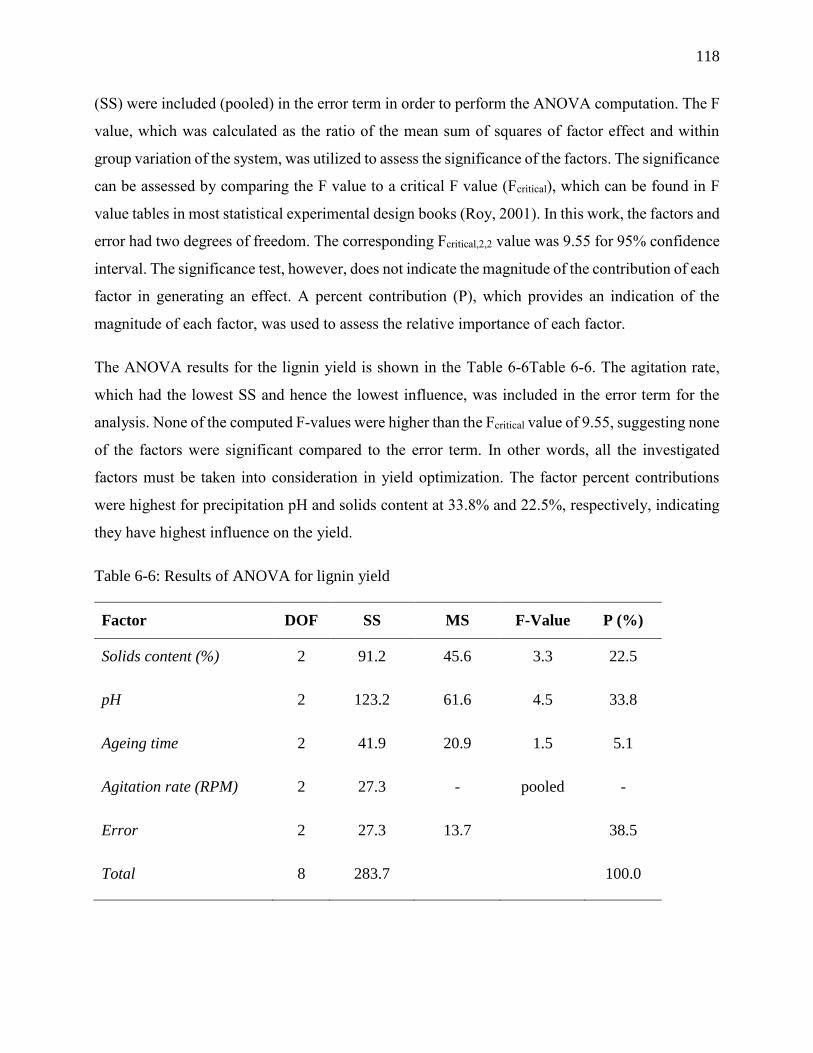
118
(SS) were included (pooled) in the error term in order to perform the ANOVA computation. The F
value, which was calculated as the ratio of the mean sum of squares of factor effect and within
group variation of the system, was utilized to assess the significance of the factors. The significance
can be assessed by comparing the F value to a critical F value (Fcritical), which can be found in F
value tables in most statistical experimental design books (Roy, 2001). In this work, the factors and
error had two degrees of freedom. The corresponding Fcritical,2,2 value was 9.55 for 95% confidence
interval. The significance test, however, does not indicate the magnitude of the contribution of each
factor in generating an effect. A percent contribution (P), which provides an indication of the
magnitude of each factor, was used to assess the relative importance of each factor.
The ANOVA results for the lignin yield is shown in the Table 6-6Table 6-6. The agitation rate,
which had the lowest SS and hence the lowest influence, was included in the error term for the
analysis. None of the computed F-values were higher than the Fcritical value of 9.55, suggesting none
of the factors were significant compared to the error term. In other words, all the investigated
factors must be taken into consideration in yield optimization. The factor percent contributions
were highest for precipitation pH and solids content at 33.8% and 22.5%, respectively, indicating
they have highest influence on the yield.
Table 6-6: Results of ANOVA for lignin yield
Factor DOF SS MS F-Value P (%)
Solids content (%) 2 91.2 45.6 3.3 22.5
pH 2 123.2 61.6 4.5 33.8
Ageing time 2 41.9 20.9 1.5 5.1
Agitation rate (RPM) 2 27.3 - pooled -
Error 2 27.3 13.7 38.5
Total 8 283.7 100.0
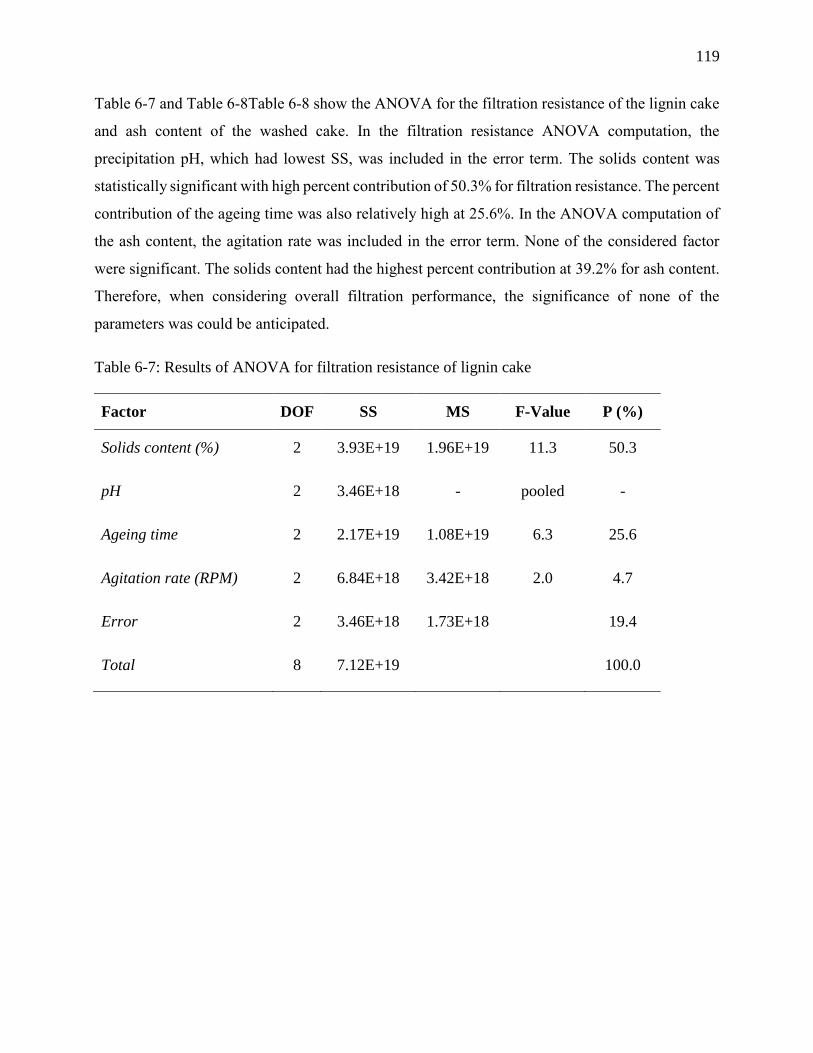
119
Table 6-7 and Table 6-8Table 6-8 show the ANOVA for the filtration resistance of the lignin cake
and ash content of the washed cake. In the filtration resistance ANOVA computation, the
precipitation pH, which had lowest SS, was included in the error term. The solids content was
statistically significant with high percent contribution of 50.3% for filtration resistance. The percent
contribution of the ageing time was also relatively high at 25.6%. In the ANOVA computation of
the ash content, the agitation rate was included in the error term. None of the considered factor
were significant. The solids content had the highest percent contribution at 39.2% for ash content.
Therefore, when considering overall filtration performance, the significance of none of the
parameters was could be anticipated.
Table 6-7: Results of ANOVA for filtration resistance of lignin cake
Factor DOF SS MS F-Value P (%)
Solids content (%) 2 3.93E+19 1.96E+19 11.3 50.3
pH 2 3.46E+18 - pooled -
Ageing time 2 2.17E+19 1.08E+19 6.3 25.6
Agitation rate (RPM) 2 6.84E+18 3.42E+18 2.0 4.7
Error 2 3.46E+18 1.73E+18 19.4
Total 8 7.12E+19 100.0
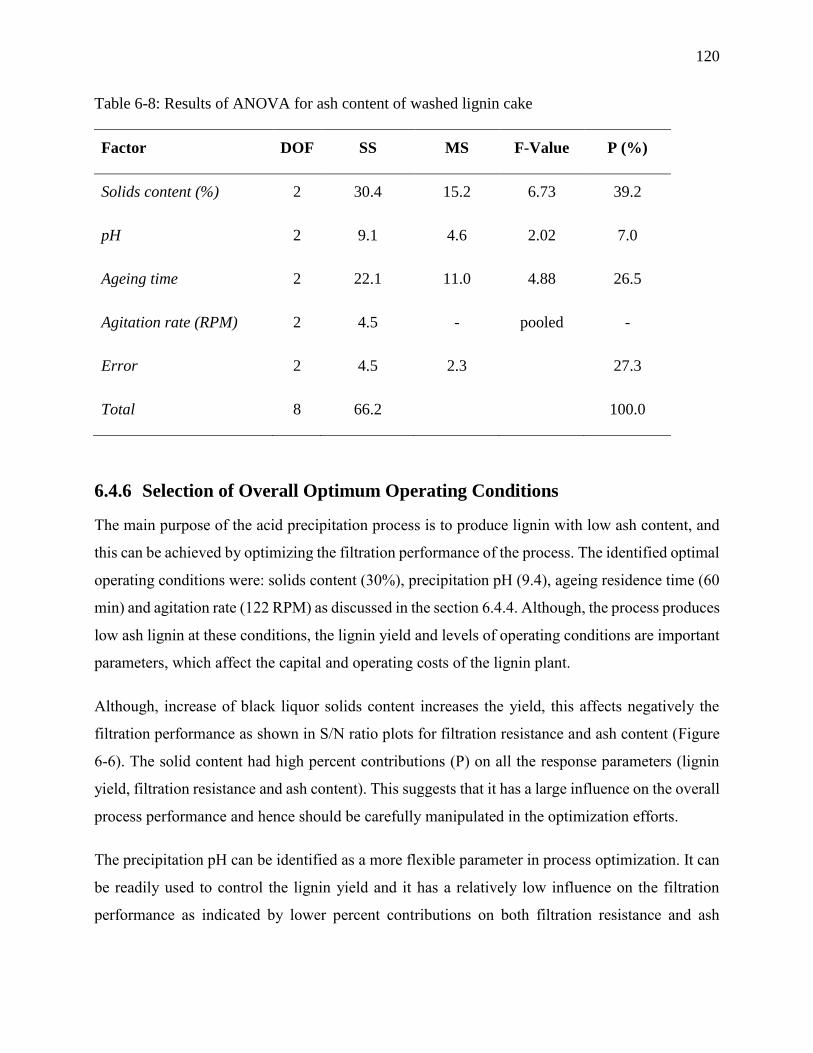
120
Table 6-8: Results of ANOVA for ash content of washed lignin cake
Factor DOF SS MS F-Value P (%)
Solids content (%) 2 30.4 15.2 6.73 39.2
pH 2 9.1 4.6 2.02 7.0
Ageing time 2 22.1 11.0 4.88 26.5
Agitation rate (RPM) 2 4.5 - pooled -
Error 2 4.5 2.3 27.3
Total 8 66.2 100.0
6.4.6 Selection of Overall Optimum Operating Conditions
The main purpose of the acid precipitation process is to produce lignin with low ash content, and
this can be achieved by optimizing the filtration performance of the process. The identified optimal
operating conditions were: solids content (30%), precipitation pH (9.4), ageing residence time (60
min) and agitation rate (122 RPM) as discussed in the section 6.4.4. Although, the process produces
low ash lignin at these conditions, the lignin yield and levels of operating conditions are important
parameters, which affect the capital and operating costs of the lignin plant.
Although, increase of black liquor solids content increases the yield, this affects negatively the
filtration performance as shown in S/N ratio plots for filtration resistance and ash content (Figure
6-6). The solid content had high percent contributions (P) on all the response parameters (lignin
yield, filtration resistance and ash content). This suggests that it has a large influence on the overall
process performance and hence should be carefully manipulated in the optimization efforts.
The precipitation pH can be identified as a more flexible parameter in process optimization. It can
be readily used to control the lignin yield and it has a relatively low influence on the filtration
performance as indicated by lower percent contributions on both filtration resistance and ash
121
content. It is optimal to operate the process at low pH value (9.4) in terms of lignin yield and
filtration performance, but it may increase the CO2 demand and size of the acidification vessel.
Despite having a low percentage contribution on the lignin yield, the ageing residence time had
higher contributions on filtration resistance and ash content. Both, yield and filtration performance
found to be highest at 60 min. It is therefore recommended to operate the process at this condition.
However, higher residence time implies larger vessels. The process could operate at lower
residence times for applications that do not require high purity lignin.
The agitation rate had larger effect on filtration performance than on lignin yield. Therefore,
operating at optimum condition for filtration performance (122 RPM) can be suggested. During
the experimental program, we observed the sedimentation of lignin particles in the bottom of the
mixing vessel for experimental trials with higher yield (at solid content of 37%) and lower agitation
rate (72 RPM). This may be caused by due to insufficient hydrodynamic flow to keep particles in
suspension and as a consequence reduce the filtration performance of the precipitated lignin. Even
though, higher agitation rates can keep the particles in suspension, high shear generated by faster
agitation could break-up the particles, and affecting the filtration adversely. Therefore, better
hydrodynamic systems, which provides sufficient hydrodynamic flow with low shear rates, must
be considered for acid precipitation processes operating with higher solids contents and yields.
6.4.7 Result Validation
The optimal conditions for filtration performance (solids content: 30%, precipitation pH: 9.4,
ageing residence time: 60 min and agitation rate: 122 RPM) was verified by performing a
confirmation trial. The observed values for lignin yield, filtration resistance and ash content were
56.4%, 3.53E+09 m/kg and 0.09%, respectively, while the additive main factor effects model,
given in Eq. 13, predicted 56.0%, 3.53E+09 m/kg and -1.14. Except from ash content, the observed
and predicted results for the lignin yield and filtration resistance were in good agreement for
optimal conditions. The additive model equation was clearly not adequate in predicting the ash
content, hence require different modeling approaches considering interaction effects.
The validation experimental trials confirmed that ash content of lignin can be kept very low (0.09-
0.2%) for solid content range of 30-33.5% while maintaining the remaining parameters at the
optimal values for filtration performance (pH: 9.4, ageing time: 60 min and agitation rate: 122
122
RPM). If higher ash content is acceptable (~1-2%), it is possible to operate the process at solids
content as high as 37%, as verified by trial 8, and this in turn reduce the production costs of lignin.
Better hydrodynamic design, however, should be considered when operating at higher solids
contents. Also, it is possible to reduce the ageing residence time, decreasing the ageing vessel size
for production of 1 to 2% ash content lignin.
6.4.8 The Acid Precipitation Process and Pulp Mill Interaction
The lignin precipitation process is integrated in the liquor cycle of the Kraft pulping mill. It receives
a stream of black liquor diverted from the multiple effect evaporator train, which concentrate black
liquor. After lignin separation, the acidified lignin lean black liquor is recycled back to the
evaporator section. Black liquor stream for lignin precipitation can be extracted between 2nd and
3rd effects of the multiple effects evaporator train, where the solids content is usually in the range
of 30 to 35%. In an operating Kraft pulping mill, there are operating disturbances, time and seasonal
changes in the operating conditions, which can change the properties of the black liquor including
solids content, inorganic salt content and lignin content.
The solids content had a large influence on lignin yield and filtration performance. Therefore,
variations in the black liquor solids content can produce significant variations in a lignin
precipitation process performance including yield and filtration performance. If they are not
monitored and controlled, variations in yield can increase or decrease the amount of extracted
lignin, affecting the calorific value of the black liquor. Also, variations in filtration performance
can lower the quality of the produced lignin and create bottlenecks in the filtration and washing
equipment. Therefore, further investigation is suggested. This should include controllability studies
and determination of robust operating points, less sensitive to variations in black liquor properties.
6.5 Conclusion
The influence of process parameters on the filtration performance and yield of the acid precipitation
process were analyzed using a oxidized softwood black liquor. The values of operating parameters,
namely solids content, precipitation pH, ageing residence time and agitation rate, that achieved
highest yield and filtration performance (minimum filtration resistance and ash content) were
determined using Taguchi method. The following main conclusions can be drawn.
123
According to the ANOVA analysis results, the solids content and ageing residence time had
the largest influences on filtration performance, while precipitation pH and solids content
had largest influences on lignin yield. However, the statistical significance of the
investigated parameters on both filtration performance and lignin yield was not justified,
indicating that all the studied parameters must be considered when optimizing the process
for yield and filtration performance.
Through the S/N ratio analysis, the optimal parameters for filtration performance have been
determined at solid content: 30%, precipitation pH: 9.4, ageing residence time: 60 min and
agitation rate: 122 RPM, while optimal parameters for lignin yield were at solid content:
37%, precipitation pH: 9.4, ageing residence time: 60 min and agitation rate: 72 RPM. A
confirmation test was performed to validate the prediction of optimal parameters for
filtration performance producing lignin having 0.09% ash content, with of 3.53 E+09 m/kg
filtration resistance and 56.4% yield.
The solid content was identified as the most critical parameter in optimization efforts as it
had large and opposite influences on filtration performance and yield. The operating range
of solids content for the investigated black liquor was determined as 30-33.5% which
produced lignin with 0.09 to 0.2% ash content and yield up to 59.3% while keeping the
other parameters at their optimal values for highest filtration performance.
The precipitation pH had a large influence on yield but a low influence on filtration
performance, making it a relatively flexible parameter to adjust and control the lignin yield.
Higher ageing residence times (60 min) were required to produce low ash lignin as indicated
by the S/N ratio and the ANOVA analysis. The agitation rate had a lower influence
compared to the other parameters but its significance was not negligible. The filtration
resistance was optimal at 122 RPM. Poor filtration performances were observed if agitation
rate was either higher or lower than optimal value, which could be due particle
sedimentation at tank bottom at slower speeds and particle shearing at faster speeds.
If a lignin product with higher ash content (1-2%) is acceptable for its intended use, the
operating conditions can be altered to achieve lower production costs. The solid content
can be increased so that lignin yield is increased and the treated black liquor volume
124
decreased. The ageing residence time can be decreased, resulting in smaller vessel size.
Consideration of better hydrodynamic mixing systems is recommended when increasing
the operating solid content.
6.6 Acknowledgements
This work was financially supported by the BiofuelNet Canada, a network of centers of excellence
and Natural Science and Engineering Research Council of Canada. We are also grateful to the
pulping mill which provided the black liquor.
125
FEASIBILITY AND ECONOMICS OF USING LIME KILN
FLUE GASES FOR PRECIPITATION OF LIGNIN FROM BLACK
LIQUOR
7.1 Introduction
Integrated forest biorefineries offer opportunities to increase the competitiveness and profitability
of pulp and paper mills. Lignin, which is currently burnt in the Kraft pulp mill recovery boiler, can
be recovered and converted into a broad spectrum of bio-based products using integrated
biorefinery processes. Extraction of lignin can also be used to debottleneck an overloaded recovery
boiler thus allowing mills to increase pulp production. Acid precipitation is one of the most
promising method for lignin extraction. In this process, part of the black liquor is diverted from the
evaporators and treated with CO2 to precipitate the lignin. The precipitated lignin is washed with
H2SO4 and water to remove impurities. Lignin lean black liquor after filtration and wash filtrates
are returned to the recovery cycle of the mill (Kouisni et al., 2011; Loutfi et al., 1991).
The cost of CO2 has been reported as one of the largest operating cost of the lignin precipitation
plant and therefore the use of internally supplied CO2 from flue gases has been suggested as a
measure of improving the economics of the process (Loutfi et al., 1991; Olsson et al., 2006; Tomani
et al., 2011). Benali et al. (2014) analyzed CO2 capture from flue gases using monoethanolamine
(MEA) and concluded that the operating costs were prohibitive, therefore CO2 capture by chemical
absorption cannot be considered as a viable option. The annualized capital costs varied from 4,980
– 1,531,000 $/a without considering the flue gas cleaning and temperature reduction equipment
costs. The higher capital and operating costs of carbon capture and storage has been one of the
factors that hinders its application in power plants. The production cost increase of electricity has
been estimated to be 42-66% for power plants with post combustion carbon capture (Rubin, Chen,
& Rao, 2007).
Wallmo, Richards, et al. (2009) conducted lignin precipitation studies with 99.7%, 50%, 15% CO2
concentrations and observed that the rate of pH reduction decreases with decreasing CO2
concentration. When 99.7% CO2 was used, it took around 25 min to reach pH 9 while it took around
60 min to reach pH 9 when 50% CO2 was used. The precipitated lignin had filtration resistances
ranging from 1E+10 to 3E+10 m/kg.
126
The two main CO2 producers in the Kraft mill are the recovery boiler and the lime kiln. Lime kiln
flue gases has a higher CO2 concentration due to its calcination reaction (Stevens et al., 1989). The
direct use of lime kiln flue gases for acidification eliminates the use of expensive carbon capture
technologies, it could therefore be an interesting option to improve the economics of precipitation
and to reduce greenhouse gas emissions of integrated lignin biorefinery plants.
However, there are only few studies on the effects of dilute CO2 on the acidification kinetics and
on the filtration and washing. To our knowledge, the economic attractiveness of such internal CO2
usage proposals have not been performed. In this work, we have investigated the feasibility of using
lime kiln flue gases in the acid precipitation process, using several types of softwood black liquor.
The process proposals were simulated in Aspen Plus® and the economic feasibility have been
evaluated.
7.2 Experimental Section
7.2.1 Experimental setup
The same experimental setup described in Chapter 6 was used in this work. A gas mixture of 25%
CO2 and 75% N2 (by volume) was used for black liquor acidification.
7.2.1.1 Experimental Procedure
The same experimental procedure as in Chapter 6 was followed in the experiments. It is briefly
described here. Black liquor of ~48% dissolved solids was received from the partner Kraft mills.
It was diluted to 30% and pre-filtered to remove any suspended solids such as fibers, dregs and
soap; 1.3 liters of black liquor was added to the vessel and the mixer was started. The black liquor
sample was heated up to the 75°C. 3 mL of Antifoam B emulsion (Sigma-Aldrich) was added to
the black liquor to minimize foaming. When the black liquor temperature was 75°C, the pH
measurement was started and gas bubbling for acidification of the black liquor was initiated. A
CO2 flow rate of 3 L/min was utilized throughout the acidification. The agitation speed was then
set to the 730 RPM. The pH was measured periodically throughout the acidification using a
MetroHM Unitrode combination glass pH electrode. The CO2 bubbling was stopped when the pH
reached the range of 9.9-10.0 (measured at room temperature). The agitation was continued using
the same impeller for 1 hour at 122 RPM speed and the temperature was maintained at the same
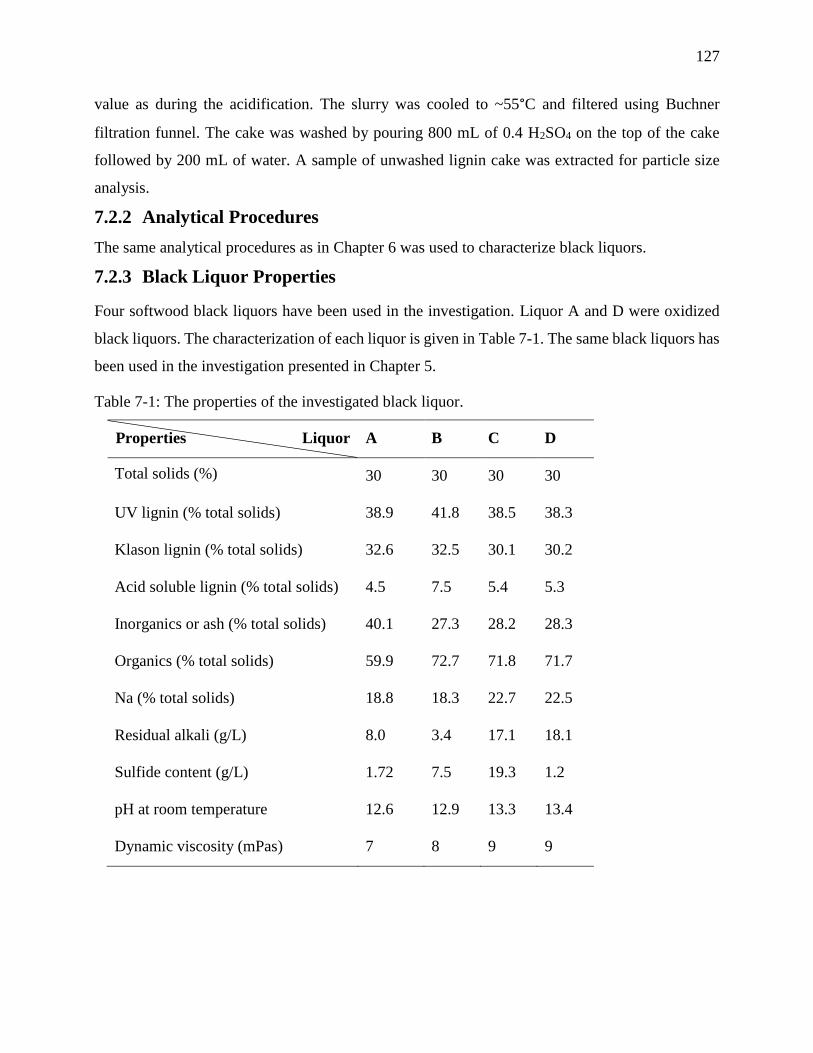
127
value as during the acidification. The slurry was cooled to ~55°C and filtered using Buchner
filtration funnel. The cake was washed by pouring 800 mL of 0.4 H2SO4 on the top of the cake
followed by 200 mL of water. A sample of unwashed lignin cake was extracted for particle size
analysis.
7.2.2 Analytical Procedures
The same analytical procedures as in Chapter 6 was used to characterize black liquors.
7.2.3 Black Liquor Properties
Four softwood black liquors have been used in the investigation. Liquor A and D were oxidized
black liquors. The characterization of each liquor is given in Table 7-1. The same black liquors has
been used in the investigation presented in Chapter 5.
Table 7-1: The properties of the investigated black liquor.
Properties Liquor A B C D
Total solids (%) 30 30 30 30
UV lignin (% total solids) 38.9 41.8 38.5 38.3
Klason lignin (% total solids) 32.6 32.5 30.1 30.2
Acid soluble lignin (% total solids) 4.5 7.5 5.4 5.3
Inorganics or ash (% total solids) 40.1 27.3 28.2 28.3
Organics (% total solids) 59.9 72.7 71.8 71.7
Na (% total solids) 18.8 18.3 22.7 22.5
Residual alkali (g/L) 8.0 3.4 17.1 18.1
Sulfide content (g/L) 1.72 7.5 19.3 1.2
pH at room temperature 12.6 12.9 13.3 13.4
Dynamic viscosity (mPas) 7 8 9 9
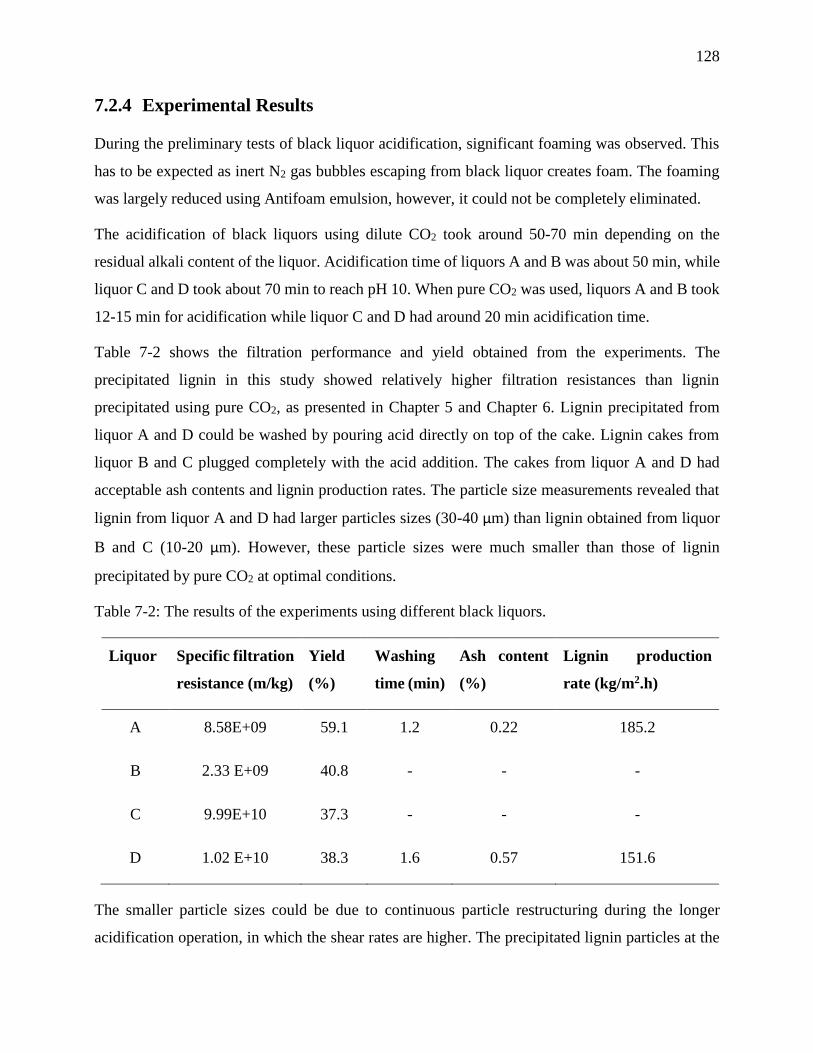
128
7.2.4 Experimental Results
During the preliminary tests of black liquor acidification, significant foaming was observed. This
has to be expected as inert N2 gas bubbles escaping from black liquor creates foam. The foaming
was largely reduced using Antifoam emulsion, however, it could not be completely eliminated.
The acidification of black liquors using dilute CO2 took around 50-70 min depending on the
residual alkali content of the liquor. Acidification time of liquors A and B was about 50 min, while
liquor C and D took about 70 min to reach pH 10. When pure CO2 was used, liquors A and B took
12-15 min for acidification while liquor C and D had around 20 min acidification time.
Table 7-2 shows the filtration performance and yield obtained from the experiments. The
precipitated lignin in this study showed relatively higher filtration resistances than lignin
precipitated using pure CO2, as presented in Chapter 5 and Chapter 6. Lignin precipitated from
liquor A and D could be washed by pouring acid directly on top of the cake. Lignin cakes from
liquor B and C plugged completely with the acid addition. The cakes from liquor A and D had
acceptable ash contents and lignin production rates. The particle size measurements revealed that
lignin from liquor A and D had larger particles sizes (30-40 µm) than lignin obtained from liquor
B and C (10-20 µm). However, these particle sizes were much smaller than those of lignin
precipitated by pure CO2 at optimal conditions.
Table 7-2: The results of the experiments using different black liquors.
Liquor Specific filtration
resistance (m/kg)
Yield
(%)
Washing
time (min)
Ash content
(%)
Lignin production
rate (kg/m2.h)
A 8.58E+09 59.1 1.2 0.22 185.2
B 2.33 E+09 40.8 - - -
C 9.99E+10 37.3 - - -
D 1.02 E+10 38.3 1.6 0.57 151.6
The smaller particle sizes could be due to continuous particle restructuring during the longer
acidification operation, in which the shear rates are higher. The precipitated lignin particles at the
129
end of the acidification operation can, therefore, be more stable, having achieved final structures,
hindering further particle growth during the ageing operation. The fact that, the precipitated lignin
from oxidized black liquors (A and D) had larger particles, could be due to increased aggregation
ability of oxidized lignin. It might be possible to improve filtration using low shear during the
acidification operation, but, this is not practical as higher agitation rates are required for good gas
dispersion. Use of other mass transfer devices such as packed columns could be a possibility,
however, foaming, fouling, lignin precipitation and sticking on mass transfer surfaces would be
operationally challenging.
In conclusion, it was feasible to use lime kiln flue gases to precipitate lignin without significant
difficulties in filtration and direct displacement washing, when oxidized liquor is used. If un-
oxidized liquor is used, re-slurry washing has to be considered, as the generated cakes were difficult
to wash directly. In the latter case, the filtration and washing equipment would be larger due to
higher filtration resistance.
7.3 Economic Evaluation
7.3.1 Process Flowsheets and Simulation
Two process flowsheet variations were considered in the analysis. They both produce 70 t/d of
lignin.
1. Process 1: The process uses externally purchased pure CO2 for the black liquor
acidification.
2. Process 2: CO2 for the black liquor acidification is supplied by the lime kiln flue gases. The
process includes pre-treatment of flue gases and post-treatment of acidification reactor
exhaust to remove sulphur gases. The process flowsheet is given in Figure 7-1.
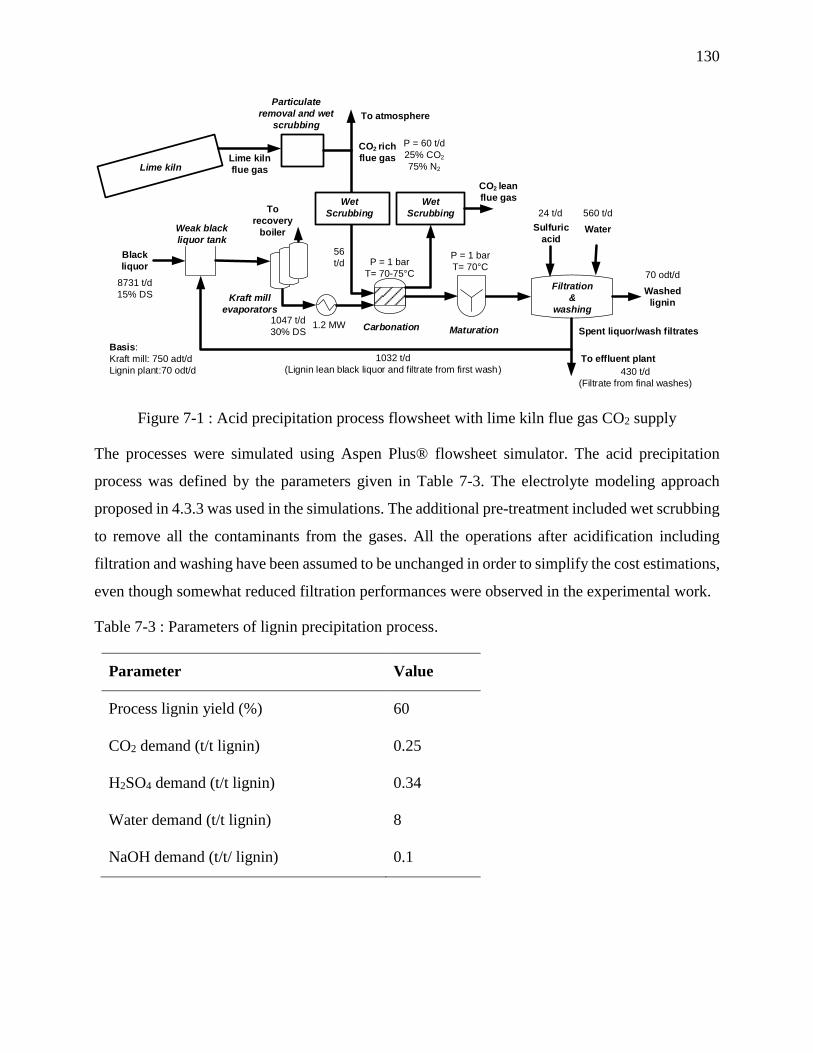
130
Black
liquor
Weak black
liquor tank
Kraft mill
evaporators
Carbonation
To
recovery
boiler
CO2 rich
flue gas
Filtration
&
washing
Sulfuric
acidWater
Spent liquor/wash filtrates
Washed
lignin
To effluent plant
Maturation
Lime kiln
flue gasLime kiln
Particulate
removal and wet
scrubbingTo atmosphere
8731 t/d
15% DS
P = 1 bar
T= 70-75°C
P = 1 bar
T= 70°C70 odt/d
P = 60 t/d
25% CO2
75% N2
560 t/d24 t/d
1047 t/d
30% DS1.2 MW
430 t/d
(Filtrate from final washes)
1032 t/d
(Lignin lean black liquor and filtrate from first wash)
Basis:
Kraft mill: 750 adt/d
Lignin plant:70 odt/d
CO2 lean
flue gas
56
t/d
Wet
Scrubbing
Wet
Scrubbing
Figure 7-1 : Acid precipitation process flowsheet with lime kiln flue gas CO2 supply
The processes were simulated using Aspen Plus® flowsheet simulator. The acid precipitation
process was defined by the parameters given in Table 7-3. The electrolyte modeling approach
proposed in 4.3.3 was used in the simulations. The additional pre-treatment included wet scrubbing
to remove all the contaminants from the gases. All the operations after acidification including
filtration and washing have been assumed to be unchanged in order to simplify the cost estimations,
even though somewhat reduced filtration performances were observed in the experimental work.
Table 7-3 : Parameters of lignin precipitation process.
Parameter Value
Process lignin yield (%) 60
CO2 demand (t/t lignin) 0.25
H2SO4 demand (t/t lignin) 0.34
Water demand (t/t lignin) 8
NaOH demand (t/t/ lignin) 0.1
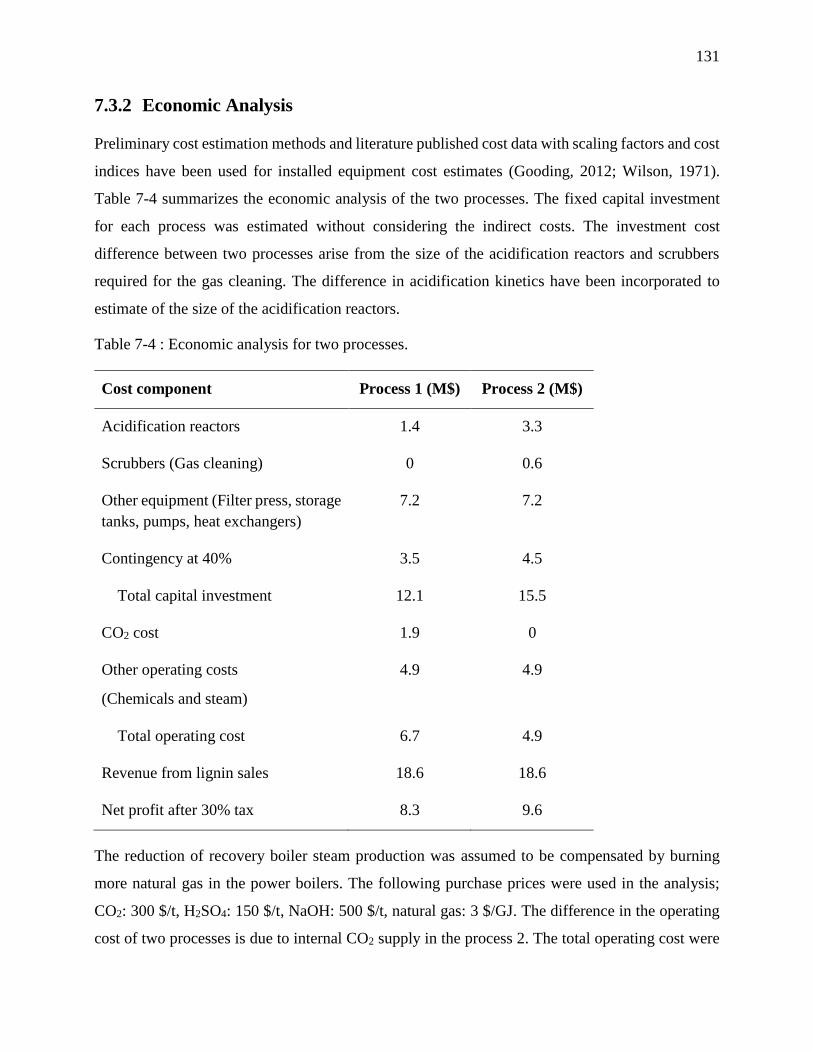
131
7.3.2 Economic Analysis
Preliminary cost estimation methods and literature published cost data with scaling factors and cost
indices have been used for installed equipment cost estimates (Gooding, 2012; Wilson, 1971).
Table 7-4 summarizes the economic analysis of the two processes. The fixed capital investment
for each process was estimated without considering the indirect costs. The investment cost
difference between two processes arise from the size of the acidification reactors and scrubbers
required for the gas cleaning. The difference in acidification kinetics have been incorporated to
estimate of the size of the acidification reactors.
Table 7-4 : Economic analysis for two processes.
Cost component Process 1 (M$) Process 2 (M$)
Acidification reactors 1.4 3.3
Scrubbers (Gas cleaning) 0 0.6
Other equipment (Filter press, storage
tanks, pumps, heat exchangers)
7.2 7.2
Contingency at 40% 3.5 4.5
Total capital investment 12.1 15.5
CO2 cost 1.9 0
Other operating costs
(Chemicals and steam)
4.9 4.9
Total operating cost 6.7 4.9
Revenue from lignin sales 18.6 18.6
Net profit after 30% tax 8.3 9.6
The reduction of recovery boiler steam production was assumed to be compensated by burning
more natural gas in the power boilers. The following purchase prices were used in the analysis;
CO2: 300 $/t, H2SO4: 150 $/t, NaOH: 500 $/t, natural gas: 3 $/GJ. The difference in the operating
cost of two processes is due to internal CO2 supply in the process 2. The total operating cost were
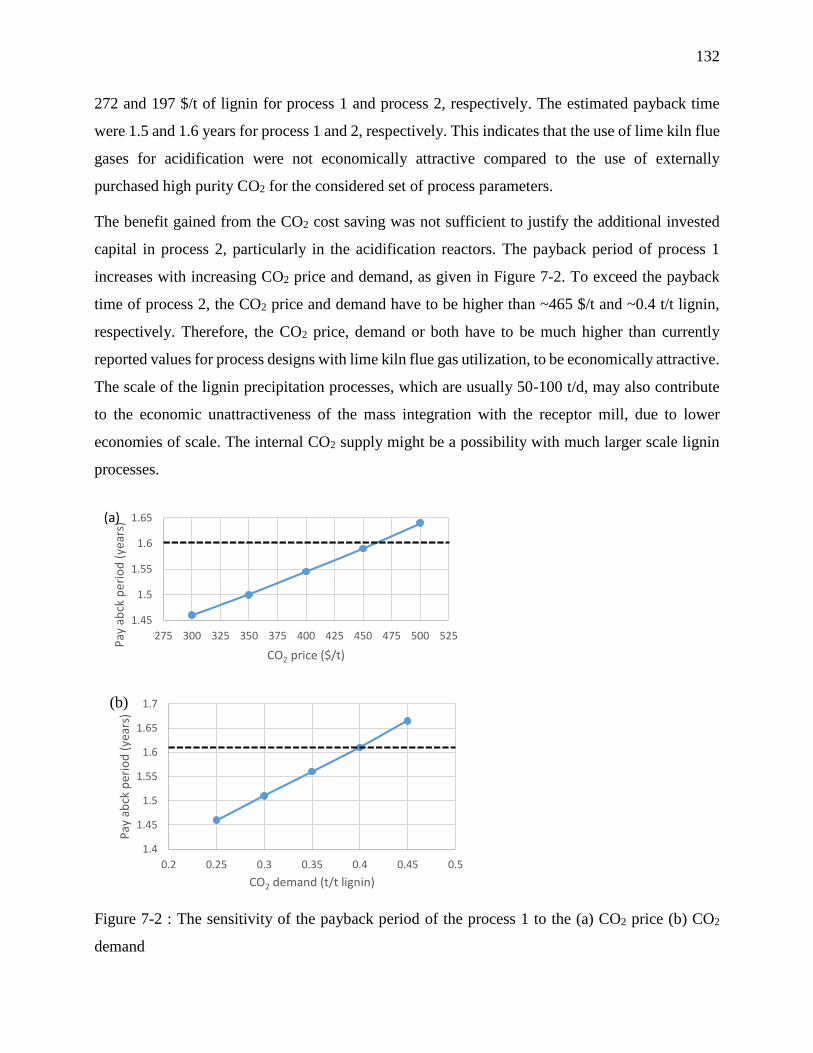
132
272 and 197 $/t of lignin for process 1 and process 2, respectively. The estimated payback time
were 1.5 and 1.6 years for process 1 and 2, respectively. This indicates that the use of lime kiln flue
gases for acidification were not economically attractive compared to the use of externally
purchased high purity CO2 for the considered set of process parameters.
The benefit gained from the CO2 cost saving was not sufficient to justify the additional invested
capital in process 2, particularly in the acidification reactors. The payback period of process 1
increases with increasing CO2 price and demand, as given in Figure 7-2. To exceed the payback
time of process 2, the CO2 price and demand have to be higher than ~465 $/t and ~0.4 t/t lignin,
respectively. Therefore, the CO2 price, demand or both have to be much higher than currently
reported values for process designs with lime kiln flue gas utilization, to be economically attractive.
The scale of the lignin precipitation processes, which are usually 50-100 t/d, may also contribute
to the economic unattractiveness of the mass integration with the receptor mill, due to lower
economies of scale. The internal CO2 supply might be a possibility with much larger scale lignin
processes.
Figure 7-2 : The sensitivity of the payback period of the process 1 to the (a) CO2 price (b) CO2
demand
1.45
1.5
1.55
1.6
1.65
275 300 325 350 375 400 425 450 475 500 525
Pay
ab
ck p
erio
d (
year
s)
CO2 price ($/t)
(a)
1.4
1.45
1.5
1.55
1.6
1.65
1.7
0.2 0.25 0.3 0.35 0.4 0.45 0.5
Pay
ab
ck p
erio
d (
year
s)
CO2 demand (t/t lignin)
(b)
133
Decreasing the size of the acidification vessel by using efficient mass transfer devices is another
possibility for improving the economic attractiveness of the process. However, capital and
operational costs and operational disturbances due to foaming and fouling have to be carefully
considered. Also, the kinetics of pure CO2 usage could be benefited from improved mass transfer
devices, further reducing the capital costs of process 1. Despite the economic indicators, the process
2 clearly reduces the greenhouse gas emissions from the Kraft mill, making it more
environmentally attractive. Incentives for environmental performance could improve its
profitability.
7.4 Conclusion
The lignin precipitation experiments were performed using dilute CO2 with a composition
corresponding to lime kiln flue gas. The study showed that it was feasible to use lime kiln flue
gases without a large impact on the lignin filtration performance, when oxidized black liquor was
used. This makes it possible to use direct displacement washing after filtration. However, the
filtration resistance was much higher for non-oxidized black liquor and direct displacement
washing was not feasible.
The process simulation and economic analysis revealed that the use of flue gases was less
economically attractive than the use of externally purchased CO2. The elimination of CO2 purchase
cost reduced the operating costs, however, the higher capital costs for gas cleaning and larger
acidification reactors increased the payback period. The CO2 price and demand have to be higher
than ~465 $/t and ~0.4 t/t lignin, respectively, for the use of flue gases to be profitable.
134
GENERAL DISCUSSION
The development and integration of lignin biorefineries in Kraft pulping mills have been discussed
in this thesis. Article 1 and 2 concentrate on the implementation and integration while article 3 and
4 focus on the acid precipitation process development. Chapter 7 considers both integration and
development aspects. In the following discussion, the main findings, limitations and connections
between different sections of the thesis have been examined, in a general manner.
8.1 Process Implementation and Integration
8.1.1 Energy Impacts and Mitigation
The lignin precipitation process does not require a major heating duty. The incoming black liquor
must be cooled to ~75°C before precipitation occur; temperature reduction is about 20°C. In some
cases, further cooling of the lignin slurry was required before filtration to improve the filterability.
The optimal slurry temperature was about 60°C for the black liquors investigated in this thesis.
However, these cooling duties were relatively small (0.03 MW/t lignin) hence they do not have a
major impact on the total energy demand of the Kraft mill.
Despite the absence of major heating or cooling duties in the acid precipitation process, the
recovery boiler steam production decreased with lignin extraction. The steam demand of multiple
effect evaporator train increased mainly due to recycle of wash filtrates. This creates extra energy
demands in terms of energy deficits in the Kraft pulping mill, when a lignin extraction plant is
implemented. The reduction of high pressure steam production in the recovery boiler reduces the
power production of the mill, as discussed in article 1. The least capital intensive way to address
the power and steam deficit is to increase the steam production of the biomass or power boilers of
the mill. Part of the produced lignin, biomass or natural gas can be combusted, depending on the
availability of power boilers with additional capacities.
In article 1, it has been shown that power and steam deficits generated by lignin removal can be
addressed by energy optimization with pinch analysis, for a representative Canadian softwood
Kraft pulping mill. Addressing power deficit, however, requires installation of condensing turbines
in order to generate power from medium and low pressure steam. Technologies such as biomass
gasification with integrated gasification combined cycle (IGCC) with higher energy efficiency,
135
could be potential options for addressing lignin extraction energy demands. An economic analysis
for the proposed options in the article 1 have not been performed.
For the Canadian Kraft pulping mill studied in article 2, a steam saving potential up to 37 % have
been identified at 0.32 M$/MW average heat exchanger cost in a previous study (Keshthkar, 2013).
The saved steam can be used to compensate low and medium pressure steam demands brought
forth by lignin precipitation, without considerable capital investments. However, addressing the
reduced power production requires further capital costs to change the steam turbine configuration.
Such implementations with steam saving projects and upgraded steam turbine configuration were
not profitable when compared with increased high pressure steam production in power boilers at
current natural gas prices of ~3 $/GJ.
8.1.2 Lignin Extraction Ratio and Pulp Production Increase
Estimating the lignin extraction ratio is crucial for the implementation of lignin precipitation
processes in Kraft pulping mills. It determines the size of the lignin plant as well as the possible
pulp production increase. The recovery boiler is the most affected equipment by the lignin
extraction in the Kraft mill. The energy content of black liquor, measured by the heating value,
reduces with lignin extraction as it becomes more diluted with inorganics. If it becomes too low,
the safe and efficient operation of the recovery boiler is compromised. Several recovery boiler
specific parameters can be used to estimate this impact. In this work, it has been estimated by
means of a simple parameter, the minimum acceptable higher heating value (HHV) of the black
liquor for a given recovery boiler. The minimum acceptable HHV of black liquor that guarantees
the efficient operation of the recovery boiler has been reported to be about 12.5 MJ/kg (Perin-
Levasseur, Z. et al., 2011).
The ultimate and proximate analyses can be used to estimate the HHV of black liquor, however,
the accuracy of the estimates depends on the quality and the quantity of the available experimental
data. In the absence of such data, a linear interpolation approach has been used in this work, as
discussed in article 2. A linear differential equation based on total energy content has been proposed
to estimate the deviations of HHV from a reference value.
A lignin extraction of 15% was estimated for the studied Canadian softwood Kraft pulping mill,
considering a minimum HHV of 12.3 MJ/kg. The recovery boiler steam production was reduced
136
by 13%. The decrease in recovery boiler energy production will allow increasing pulp production,
if the mill is limited by the recovery boiler thermal capacity. The pulp production could be
increased by 14.9% for the studied Kraft mill. It should be noted that these value are specific to the
mill and hence they may not be directly transferrable to the other mills.
The lignin extraction ratio is largely dependent on the black liquor composition, particularly on the
lignin content. The investigated mill had 35% lignin (o.d. basis) in the black liquor, which provides
a feasible 15% lignin extraction. If the lignin content is lower, such as in hardwood pulping mills,
the lignin extraction ratio would be higher. Lignin extraction ratios around 30% have been reported
from the mills with low lignin black liquor (Hamaguchi & Vakkilainen, 2010). On the other hand,
if the lignin content is higher (around 42%), lignin extraction ratios about 10% would be feasible.
The lignin extraction extents discussed in this work are the most economical because it can be
implemented without major upgrades to the recovery boiler. Lignin extraction up to 50% is feasible
as reported by Valimaki et al. (2010 ) to maintain a minimum adiabatic temperature (Tad) and a
hearth heat release rate (HHRR) for a operational recovery boiler. However, major upgrades will
be required to operate the recovey boiler at 50% lignin extraction. The lignin extraction ratios
reported in this thesis can hence be taken as most conservative values.
8.1.3 Process Modelling and Liquor Cycle Chemical Balance
The largest impacts of acid precipitation of lignin are on the Kraft mill energy balance, however
the effects on the chemical balance cannot be neglected. The chemical balance, usually expressed
in terms of Na and S, is mainly affected mainly by the higher percentage of bound Na (~12% wt.)
in the precipitated lignin. Removal of bound Na requires further lowering of the pH, which can be
done by H2SO4 washing. At lower pH values, the surface charges of lignin are completely
neutralized by protonation, thus removing bound Na ions. The wash filtrates produced in acid
washing operations contain the bound Na, however, mixed with S coming from sulfate ions.
Recycling the wash filtrates is a way to recover the Na, but it can also add extra S to the liquor
cycle. If additional S is introduced, it has to be removed from the process by a purge. A recovery
boiler electrostatic precipitator dust (ESP) purge can be used for this pupose in order to maintain
desired sulfidity level for Kraft mill operation. However, it also removes Na, which is then has to
be compensated by make-up NaOH or Na2CO3.
137
In the article 2, simulation models have been developed to estimate the pH and composition
variations in the black liquor and to compute the Na/S balances of the liquor cycle. The Aspen
Plus® electrolyte model has been used to estimate the pH and composition variations. The black
liquor ionic equilibrium involves not only the inorganic components but also organic components
such as lignin phenolic and carboxyl groups. The pH variation of the model including only the
inorganic components showed large deviations from experimental data for pH values below 11.
The prediction of the pH variation was significantly improved by adding an ionic component to
represent the typical composition and acidity of phenolic groups of lignin (3.4 mmol/g of lignin
and pKa value of 10), for the validated pH range of 7-13. This showed that the electrolyte
equilibrium approach can be successfully applied for modeling black liquor pH variation.
However, the pKa values of lignin can vary broadly (pKa: 6.2-11.3) depending on its structure,
functional groups and molecular weight. This requires the model to be validated for a different
black liquor application. Also, the model was validated only for the pH 7 to 13 range. The
estimation of lower pH values may require dividing lignin into several sub-groups based on their
molecular weight and pKa values to provide better distribution of lignin acidity. Further
development of the model can be suggested, extending it into the areas of prediction of the
protonation and bound Na removal and lignin aggregation. These efforts, however, require large
sets of experimental data in terms of molecular weights and pKa values for model structure
development and validation.
A mass balance model, which was implemented in MS ExcelTM, has been developed for the
estimation of Na/S balances of the liquor cycle. Balancing of Na and S was performed according
to several implementation scenarios involving wash filtrate recycle and black liquor pH re-
adjustment, based on the constraints of different Kraft pulping mills. The analysis revealed that
scenarios involving complete disposal or excessive recycle of wash filtrates increased the make-up
NaOH demand, which was about 0.2 t/t of lignin. The mill studied had an external S requirement
of 5.3 kg/adt, which was fulfilled by the addition of make-up salt cake (Na3H(SO4)2). Therefore,
the mill had room to accommodate the additional S that comes with wash filtrates by reducing the
salt cake input. This was feasible because Na3H(SO4)2 has lower Na/S ratio than Na2SO4.
Therefore, recycling wash filtrates recovered more Na than adding Na3H(SO4)2. Hence, it was
feasible to reduce the make-up NaOH demand down to 0.14 t/t of lignin by recycling 5 t/t of lignin
wash filtrates without re-alkalizing the black liquor. If the wash filtrate recycle increases further,
138
the make-up NaOH demand also increases as extra S has to be removed by ESP purge, thus
removing more Na. The additionally recycled water increased the evaporator steam demand. It is
important to note that the Na/S balance strategy have to be considered case by case. It is highly
dependent on the current balance of the Na and S in the mill.
The efficiency of the washing step, defined as the percentage of chemicals removed by adding a
certain quantity of acid, can depend on the cake properties as well as the type of the washing
operation (Re-slurry or displacement washing). If more acid is consumed for washing, the amount
of S in the wash filtrates will be higher, negatively affecting Na/S balance. The sensitivity of the
NaOH demand to various washing conditions was investigated by the changing the washing step
efficiency. It was feasible to reduce the make-up NaOH demand down to 0.1 t/t of lignin by
improving the washing efficiency.
Most Kraft pulping mills are also limited by the recovery operations other than the recovery boiler.
The Kraft pulping mill investigated had a bottleneck at the lime kiln, which only allowed a
production increase up to 10%. The recycling strategies changed the chemical loads to
recausticizing and lime kiln sections and the water load to the evaporators. Therefore, the recycling
strategy has to be balanced in order to minimize the chemical losses, loads to recovery operations
and to maximize the pulp production increase. The constraints of the Kraft mill such as the need to
re-alkalize the black liquor should also be taken into account when choosing the best strategy for
adjusting the chemical balances.
8.1.4 Internal Supply of Chemicals
The feasibility and economics of using lime kiln flue gases as acidification medium have been
discussed in Chapter 7. It was shown that it is feasible to obtain easily filterable and washable
lignin using dilute CO2 such as lime kiln flue gases in laboratory experiments, when oxidized liquor
was used. However, the acidification kinetics were slower and foaming problems were
encountered. An economic analysis was performed, considering additional gas cleaning and larger
acidification vessels to accommodate flue gases. The extra capital investment needed for flue gas
acidification did not bring enough returns in terms of CO2 cost savings. The CO2 price and demand
had to be higher than ~465 $/t and ~0.4 t/t lignin, respectively, for the process to be more
economically attractive than external CO2 purchase. More efficient mass transfer devices such as
139
packed columns could be interesting options, however, related costs and operational difficulties
such as foaming have to be considered.
The opportunities for internal supply of H2SO4 were qualitatively discussed, in the article 2. The
chemical balance strategies reduce the use of salt cake in the liquor cycle, which is a byproduct of
ClO2 generator. This readily available salt cake can be purified into H2SO4 and Na2SO4 or H2SO4
and NaOH using commercially available technologies. However, the amount of available salt cake
was lower than was needed by the lignin washing operation, for the mill investigated. If more
byproduct salt cake is available, the installation of purification technologies can become
interesting. However, the lower price of H2SO4 compared to the other chemicals used in acid
precipitation process (CO2 and NaOH) does not justify higher capital investment on purification
technologies.
8.2 Process Development
Filtration and washing of precipitated lignin have been found to be difficult due to higher filtration
resistances, slower washing rates and dissolution of lignin during washing. The filtration and
washing equipment have been reported to be the most capital intensive in a lignin precipitation
plant, making up to 30% of the total equipment cost. Therefore, there are incentives to optimize
the acid precipitation process, particularly the filtration and washing operations. In article 3, the
effects of mixing hydrodynamics during lignin precipitation has been presented as means of
improving lignin filtration. In article 4, a systematic optimization of process parameters to achieve
higher yield and filtration performance is presented.
8.2.1 Effects of Mixing Hydrodynamics
The hydrodynamic conditions during initial aggregation and growth of colloidal particles affect the
size and shape of the final particle structures. In article 3, the turbulent shear rate and hydrodynamic
flow pattern were varied during lignin coagulation and floc growth. The turbulent shear rate was
varied applying different mixing power levels during acidification and ageing steps while the flow
pattern was varied using two different impeller systems; MaxblendTM (MB) and Pitched Blade
Turbine (PBT). The particle and filtration properties were characterized.
140
The lignin flocs, generated at the end of the acidification step, were made of primary lignin particles
with 1-2 µm size and fractal dimension 𝐷𝑓=2.15-2.65. These sizes and shapes did show a
dependency on the hydrodynamic conditions. They were consistent with the properties of lignin
particles (1-2 µm size and fractal dimension 𝐷𝑓=1.9-2.45) that were aggregated by Brownian
motion, as reported in the literature (Norgren et al., 2002). Therefore, the hydrodynamic conditions
had a negligible effect on the size or shape of the primary lignin particles.
As primary particles aggregated to form larger flocs, the effects of hydrodynamic conditions
became important. As flocs get larger, their size become increasingly comparable with the size of
turbulent fluctuations (length scale), exposing the flocs to shear forces. Under shear, the weak flocs
tend to break and re-aggregate. This interplay of breakage and aggregation determines the final
particle size and shape. The lignin flocs generated at high shear acidification were small and
compact while low shear acidification produced large but loose flocs.
Both compact and loose flocs aggregated into much larger flocs, when the turbulent shear level
was reduced by decreasing the mixing power level during the ageing step. The final floc size was
mostly dependent on the shear level, having largest particle sizes at lowest shear rates. However,
the initial floc properties had a large impact on the size and the structure of the final flocs. The
effect of the impeller type in the aggregation of compact initial flocs into larger flocs was
negligible. These flocs had narrow distributions and SEM images showed compact and large final
flocs.
Despite negligible effect of the impeller type on growth of compact flocs, the impeller flow pattern
showed an impact on the aggregation of loose flocs into larger flocs. Moreover, the size distribution
of loose flocs were wide and had a fraction of fine particles. Loose flocs can generally be
considered to have lower strength due to fewer links between primary particles. Therefore, high
shear in the impeller zone can break-up these loose bonds, creating fine particles and wide size
distributions As a result, the MB impeller, which created relatively lower shear, minimized the
breakage of loose flocs and provided better aggregation of loose flocs.
The filtration performance of the compact and large flocs were clearly higher than loose and small
flocs. The filtration performance of loose flocs increased with increasing size, but remained below
the performance of the compact flocs. Differences in the lignin yield were also observed according
to lignin floc size and compactness. The lignin production rate at the filter varied from 86 to 244
141
kg/h.m2 for the investigated hydrodynamic power levels. Differences of this magnitude can lead to
large reductions on filter areas, resulting in large improvements in the filtration and washing
equipment sizes.
The results of this investigation were confirmed when three other black liquor samples from
different origins were used. As expected, large differences in particle sizes and filtration properties
were observed for varying hydrodynamic conditions. Higher turbulent shear levels during
acidification and lower levels during ageing produced best filtration performances. However,
differences according to the black liquor type was also observed. The oxidized black liquor samples
with lower sulfide content provided higher lignin filtration rates. The variation of filtration
performance according to black liquor composition was, however, not investigated in this study
and it is recommended that it is done in future studies.
8.2.2 Systematic Parameter Optimization
The lignin yield and filtration resistance of the acid precipitation process have been reported to be
affected by number of operating parameters. Easily filterable lignin can be obtained only in a
narrow range of conditions. In article 4, the operating parameters of the acid precipitation process
were optimized to achieve higher filtration performance and yield. The Taguchi experimental
design approach was used to investigate namely, black liquor solids content, precipitation pH,
ageing residence time and ageing agitation rate.
According to the statistical analysis, the solids content and ageing residence time had large
influences on filtration performance while precipitation pH and solids content had large influences
on lignin yield. The black liquor solids content have been identified as the most critical parameter
as it had large and opposite influences on filtration performance and yield. The filtration
performance was higher at lower solids content but the lignin yield was lower. The operating range
of solids content that provided good filtration performance with sufficient yield was 30-33.5%.
Both filtration performance and yield were higher at lower pH values. However, operating at lower
pH values may increase the CO2 demand. The sensitivity of the filtration performance to the
precipitation pH was low, which made it a flexible parameter to adjust lignin yield. Higher ageing
residence times close to 60 minutes provided good filtration performance and yield.
142
Among the agitation rates studied during ageing operation, a rate of 122 RPM provided highest
filtration performance, while a higher or lower rate deteriorated it. This observation is somewhat
different than the conclusion in article 3, where lowest agitation rate during ageing step provided
highest filtration performance. However, the operating black liquor solids content was 30% for the
study presented in article 3, while it varied from 30 to 37% for the study in article 4. At higher
solids content about 37%, lignin sedimentation at the bottom of the tank was observed. This is due
to insufficient hydrodynamic flows provided by the impeller and it can avoided by using better
hydrodynamic systems such as MB impeller described in article 3.
143
CONCLUSION AND RECOMMENDATIONS
9.1 Conclusion
The main objective of this thesis has been achieved. Novel understanding, models and guidelines
were developed for the design and integration of acid precipitation based biorefineries in Kraft
pulping mills to improve the cost effectiveness and environmental efficiency. The scope of the
project was limited to extraction and purification of lignin.
Process integration opportunities to supply lignin biorefineries with the required energy and
chemicals exist in Canadian Kraft pulping mills. It was shown that it is feasible to address the
demands of lignin biorefinery using internal heat and chemical recovery. The environmental
performance could be improved and reduction of greenhouse gas emissions could be achieved.
However, the economics of such lignin biorefineries with energy and chemical integration may not
be favorable under current circumstances. The low and medium pressure steam demands generated
by lignin biorefinery can be compensated with low cost steam saving projects. Addressing the
power deficits, however, require modifications in the steam turbine configuration, which could be
expensive. The CO2 and H2SO4 in the mill are at lower quality than required by the lignin
biorefinery, thus requiring additional equipment and purification processes to accommodate them
in the biorefinery. Given that lignin biorefineries are relatively small in scale, the energy and
chemical prices has to be higher than current levels, for such integrated process solutions to be
economically attractive, in the absence of incentives for the environmental performance.
Emphasis should be laid on the proper implementation of lignin biorefinery within the Kraft mill
so that disruptions on the liquor cycle mass and energy balances be minimal and the highest lignin
extraction ratio and pulp production increase are achieved. Minimizing the disruption of the liquor
cycle Na/S balance by using an appropriate wash filtrate recycle strategy is critical in reducing
NaOH make-up demand. The recycle strategy also affected the processing loads to other chemical
recovery operations, which would require the balancing of impacts to achieve optimal implantation
in terms of NaOH demand and pulp production increase. The affected operations are evaporator
train, recausticizing and lime kiln.
Potentials for process optimization exist during the process development phase, which could lead
to better economics. The analysis of the process revealed that the properties of precipitated lignin
144
can be controlled by manipulation of hydrodynamics of the process, facilitating better filtration and
washing. Considerable reductions of filtration equipment size was possible using hydrodynamic
optimization. Similarly, systematic investigation of operating parameters made it possible to
identify the most important parameters that affect the process performance. The optimization of
those parameters by considering the trade-offs between lignin purity and cost of production should
be considered to improve overall benefits.
9.2 Original Contributions
The main original contributions are summarized below.
Impact of lignin extraction on the steam and power balance of a representative Canadian
Kraft pulping mill have been established.
A simulation models for evaluation of implementation of lignin biorefinery were
developed. It included a validated electrolyte equilibrium model based on inorganic and
organic components in the black liquor for predicting pH and composition variations during
black liquor acidification and a mass and energy balance model incorporating Na/S
balances of the liquor cycle.
Guidelines for optimal implementation of lignin biorefineries in Kraft pulping mills in
terms of energy, chemicals, lignin extraction ratio and pulp production increase have been
developed.
Effects of mixing hydrodynamics during initial aggregation, growth and breakage of lignin
have been identified and it was used to improve the filtration step.
The most critical parameters that affect yield and filtration performance have been
identified and optimized.
145
9.3 Recommendations
This work left many topics open, which are recommended for future research.
9.3.1 Integrated Forest Biorefineries (IFBR)
This work focused on the implementation of lignin biorefineries in Kraft pulping mills. Impacts on
the Kraft pulping mill and process integration opportunities were indetified. For higher economic
and environmental performance, the impacts on the Kraft process must be minimized. The process
integration opportunities were promising in reducing external energy and chemical requirement of
the process, however, the proposals were not economically attractive at current energy and
chemical prices and for the scale of feasible lignin biorefineries.
Considering the implementation of several biorefinery technologies in the Kraft pulping mill could
lead to IFBR configurations with higher degree of process integration and cost effectiveness.
Increasing the number of implemented biorefinery technologies allow large number of such IFBR
configurations to be considered. There could be opportunities in counter balancing the impacts of
one biorefinery technologies with another biorefinery technology. For example, the energy deficits
crated by lignin extraction may be balanced by hemicellulose or cellulose biorefiney technology
which produce organic waste that can be recycled into black liquor. Similarly, the Na/S balance
could be addressed by a biorefiney process that uses Na based chemicals, which require recycling.
This would generate opportunities to utilize waste chemical purification technologies more
effectively. For example, a lignin biorefinery with acid washing and a hemicellulose biorefinery
with acid-hydrolysis would require sulfuric acid. Installation of ClO2 generator waste purification
technologies could be justified by an increased demand of sulfuric acid. Also, a waste stream from
one biorefiney can be used as an input in another. As example, CO2 generated in gasification based
biorefinery could be used in acid precipitation based lignin biorefinery.
Moreover, the consideration of multiple biorefinery options would produce more opportunities for
energy integration. Having multiple biorefinery options producing a wide array of products could
help to decrease the risk and improve the scale of a complete IFBR complex, providing better
economies of scale.
146
9.3.2 Process Modelling of the Lignin Biorefinery
An electrolyte equilibrium model for black liquor acidification was proposed and validated in this
work. This model offers further opportunities in improving process modeling of the lignin
biorefinery.
Modelling of lignin aggregation, which requires taking into account, charge neutralization of lignin
molecules, ionic strength of the solution and temperature, would facilitate the prediction of lignin
yield of the acid precipitation process. The currently proposed electrolyte equilibrium approach
could facilitate the development of a thermodynamic framework for such a model. The model
structure development could be semi-empirical and require validation from large number of
experimental data.
The development of lignin aggregation model will require measuring the properties of lignin such
as molecular weight, functional groups and pKa values. The model structure has to be determined
according to the behavior and patterns identified using experimental data. The model validation
and parameter identification will be required for different black liquor types.
9.3.3 Lignin Floc Strength Measurement and Improvement
In this thesis, the lignin floc strength was discussed in relation to its compactness. More compact
flocs were assumed to be stronger according to explanations in the published literature. However,
the characterization of the strength of lignin flocs could provide better understanding of the
properties of lignin flocs that produce efficient lignin filtration and washing.
Macroscopic and microscopic techniques can be used in floc strength measurement. The
macroscopic methods include impeller agitation and ultrasonic mixing, which provide relative
measurements of floc strength, depending on the final size of the flocs and the amount of energy
supplied to the system. However, results from different methods and materials are not directly
comparable as the strength is given as a relative quantity. The microscopic techniques, which
include micromechanics and micromanipulation, measure the forces required to break the flocs and
hence provide absolute strength values. These techniques require development of rigorous
experimental procedures to perform the measurements with sufficient accuracy.
By developing such techniques, the absolute floc strength values for lignin precipitated at different
operating conditions using different black liquor can be obtained. It would help to understand the
147
main parameters that affect floc strength, providing better control on lignin aggregation and on the
properties of precipitated lignin.
9.3.4 Novel Precipitation Reactor Proposals
In the acid precipitation process, the acidification and ageing operations are usually performed in
batch mode, resulting in large reactor and vessel sizes. This leads to higher investment costs.
Process intensification measures can be used to reduce reactor size, making lignin biorefinery
process more economically attractive.
As shown in this thesis, the level of turbulence plays an important role in lignin aggregation, growth
and breakage. The precipitated particle size and shape can be controlled using the turbulent shear
level. These concepts can be extended to designing novel intensified reactor types, which offer
hydrodynamic control and continuous operation. For example, the hydrodynamic cavitation
reactors, which create high intensity turbulence due to throttling effect, can be used to create the
higher turbulence levels required during the initial aggregation of lignin to create compact lignin
flocs.
9.3.5 Control and Stabilization of the Acid Precipitation Process
As found in this work, the black liquor solids content had a large influence on the lignin yield and
filtration. The varying solids content affects the concentration of black liquor components, resulting
in variations in the process performance as well. Apart from variations of black liquor composition
due to operation disturbances, there are timely and seasonal changes in the operating conditions,
which can change the composition of the black liquor including solids content, inorganic salt
content and lignin content in an operational Kraft pulping mill. If not monitored and controlled,
these variations can cause significant deviations of the process performance. The variations in yield
can increase or decrease the amount of extracted lignin, affecting the calorific value of the black
liquor. The variations in filtration performance can lower the quality of the lignin produced and
create bottlenecks in the filtration and washing equipment. Therefore, further investigation of this
aspect is recommended.
This investigation could be started by defining the variations of black liquor composition in an
operating Kraft pulping mill. Mill information systems and mass balance models, which were
148
developed in this work, could be used to estimate the black liquor composition. Once the variations
are defined, similar black liquor compositions can be extracted from the mill or model solutions
can be prepared. Experimental design approaches, including response surface designs or Taguchi
robust designs, can be used to model the process responses according to composition variations.
The response surface models can be used in designing advanced control strategies to ensure stable
operation of the process. The Taguchi robust design can be used to select process operating
conditions that have lowest sensitivities to black liquor composition.
9.3.6 Control of Lignin Properties
Value added lignin applications require a lignin feedstock to have certain chemical and physical
properties. These properties, which include molecular weight and polydispersity, ash content,
lignin content, volatiles content and structure and functional groups of lignin molecules, are highly
dependent on the intended use of lignin. Therefore, future lignin biorefinery development efforts
should focus on tailoring the properties of extracted lignin to the end use.
This work deals with extraction deals with extraction and primary treatment of lignin. Further work
can be done on controlling the lignin properties during extraction stage. The variation of lignin
properties with different process operating conditions should be investigated and ways to
precipitate lignin, with similar properties required by the intended use, should be studied. For
example, the molecular weight of lignin can be controlled using precipitation pH.
The definition of required lignin properties would be best performed in collaboration with groups
who develop lignin value added products. The characterization of lignin properties and molecular
structure, however, requires advanced analytical techniques, which is in the area of organic
chemistry. Development of such techniques would require related expertise or collaboration with
research groups focusing on lignin properties characterization.
149
BIBLIOGRAPHY
Abdelwahab, N. A., & Nassar, M. A. (2011). Preparation, optimisation and characterisation of
lignin phenol formaldehyde resin as wood adhesive. Pigment and Resin Technology, 40(3),
169-174. doi: 10.1108/03699421111130432
Ajao, O. (2014). Development of hemicellulose Biorefineries for integration into Kraft pulping
mills. (Ecole Polytechnique de Montreal, Montreal, Canada).
Alen, R., Patja, P., & Sjöström, E. (1979). Carbon dioxide precipitation of lignin from pine kraft
black liquor. Tappi, 62(11), 108-110.
Andersson, P. (2014). A dynamic Na/S balance of a kraft pulp mill. (Karlstad University).
Argyropoulos, D. S., Sun, Y., & Palu, E. (2002). Isolation of residual kraft lignin in high yield and
purity. Journal of Pulp and Paper Science, 28(2), 50-54.
Axelsson, E., Olsson, M. R., & Berntsson, T. (2006). Increased capacity in kraft pulp mills: Lignin
separation and reduced steam demand compared with recovery boiler upgrade. Nordic Pulp
and Paper Research Journal, 21(4), 485-492.
Baker, F. (2011, March 22-24, 2011). Utilization of sustainable resources for materials for
production of carbon fiber structural and energy efficiency applications. Paper presented
at Nordic Wood Biorefinery Conference, Stockholm, Sweden.
Benali, M., Périn-Levasseur, Z., Savulescu, L., Kouisni, L., Jemaa, N., Kudra, T., & Paleologou,
M. (2014). Implementation of lignin-based biorefinery into a Canadian softwood kraft pulp
mill: Optimal resources integration and economic viability assessment. Biomass and
Bioenergy, 67(0), 473-482.
Bhattacharjee, S., Datta, S., & Bhattacharjee, C. (2006). Performance study during ultrafiltration
of Kraft black liquor using rotating disk membrane module. Journal of Cleaner Production,
14(5), 497-504.
Biermann, C. J. (1996). Handbook of pulping and papermaking (2nd Ed ed. Vol. 2): Academic
press.
Blackwell, B., & Lincoln, D. (1998). Sodium/sulphur/chlorine balance demonstrated low liquor
losses at a kraft mill. Pulp and Paper Canada, 99(1), 74-78.
Bo, X., Gao, B., Peng, N., Wang, Y., Yue, Q., & Zhao, Y. (2012). Effect of dosing sequence and
solution pH on floc properties of the compound bioflocculant–aluminum sulfate dual-
coagulant in kaolin–humic acid solution treatment. Bioresource Technology, 113(0), 89-
96.
Bozell, J., Holladay, J., Johnson, D., & White, J. (2007). Top value added Chemicals from
Biomass.Volume II–Results of Screening for Potential Candidates from Biorefinery Lignin,
US Department of energy, report PnnL-983. In P. N. N. Laboratory (Ed.),
http://www1.eere.energy.gov/bioenergy/pdfs/pnnl-16983.pdf.
Brown, T., Gilsenan, R., Singbeil, D., & Paleologou, M. (2011). Bio-energy and Bio-chemicals
Synthesis Report. FPInnovations.
150
Chien-Wei Chen, M. (2014). Commercial viability analysis of lignin based carbon fibre. (Simon
Fraser University).
Cloutier, J. N., Azarniouch, M. K., & Callender, D. (1993). Electrolysis of weak black liquor Part
I: Laboratory study. Journal of Pulp and Paper Science, 19(No.6), J244-J248. doi:
10.1007/bf00260690
Cloutier, J. N., Azarniouch, M. K., & Callender, D. (1994). Electrolysis of weak black liquor Part
III: Continuous operation test and system design considerations. Pulp & Paper Canada,
95(5), T210-T214. doi: 10.1007/bf00260690
Cloutier, J. N., Azarniouch, M. K., & Callender, D. (1995). Electrolysis of weak black liquor Part
II: Effect of process parameters on the energy efficiency of the electrolytic cell. Journal of
Applied Electrochemistry, 25(5), 472-478. doi: 10.1007/bf00260690
Cloutier, J. N., & Beaudoin, L. (2014, 8-13 June, 2014). New source of caustic for Kraft mills from
the electrolysis of sodium sulphate - preliminary economics. Paper presented at
International Chemical Recovery Conference, Tampere, Finland.
Dahlin, P. (2015). Na/S balances at Skoghall mill 2015: Balances after reconstruction of the fiber
line. (Master, Karlstad University).
Danielson, B., & Simonson, R. (1998). Kraft lignin in phenol formaldehyde resin. Part 1. Partial
replacement of phenol by kraft lignin in phenol formaldehyde adhesives for plywood.
Journal of Adhesion Science and Technology, 12(9), 923-939. doi:
10.1163/156856198X00542
Davy, M., Uloth, V., & Cloutier, J. (1998). Economic evaluation of black liquor treatment
processes for incremental kraft pulp production: A comparison of two processes at
Paprican. Pulp & Paper Canada, 99(2), 35-39.
Diffo, C. (2013). Lignin Biorefinery Technology and Markets. Retrieved from
http://www.reseauvco.ca/fileadmin/vco/documents/Webinairs/PowerPoint_Presentation.p
df
Dong, D., Fricke, A. L., Moudgil, B., & Johnson, H. (1996). Electrokinetic study of kraft lignin.
Tappi journal, 79(7), 191-197.
Duarte, G., Ramarao, B., Amidon, T., & Ferreira, P. (2011). Effect of hot water extraction on
hardwood kraft pulp fibers (Acer saccharum, sugar maple). Industrial and Engineering
Chemistry Research, 50(17), 9949-9959. doi: 10.1021/ie200639u
Evstigneev, E. (2011). Factors affecting lignin solubility. Russian Journal of Applied Chemistry,
84(6), 1040-1045. doi: 10.1134/S1070427211060243
Farag, S., & Chaouki, J. (2015). Economics evaluation for on-site pyrolysis of kraft lignin to value-
added chemicals. Bioresource Technology, 175 254-261. Retrieved from
http://www.sciencedirect.com/science/article/pii/S0960852414015284
Frank, E., Steudle, L., Ingildeev, D., Sporl, J., & Buchmeiser, M. (2014). Carbon fibers: Precursor
systems, processing, structure, and properties. Angewandte Chemie - International Edition,
53(21), 5262-5298. doi: 10.1002/anie.201306129
Fredrik, O., & Theliander, H. (2007). Filtration properties of lignin precipitated from black liquor.
Tappi Journal, 6(7), 3-9.
151
Gellerstedt, G., & Henriksson, G. (2008). Chapter 9 - Lignins: Major Sources, Structure and
Properties. In M. N. B. Gandini (Ed.) Monomers, Polymers and Composites from
Renewable Resources (pp. 201-224). Amsterdam: Elsevier.
Gindl-Altmutter, W., Fürst, C., Mahendran, A., Obersriebnig, M., Emsenhuber, G., Kluge, M., . . .
Liebner, F. (2015). Electrically conductive kraft lignin-based carbon filler for polymers.
Carbon, 89(0), 161-168.
Gooding, C. (2012). Comparison of the LignoBoost™ and SLRP™ Lignin Recovery Processes.
Paper presented at TAPPI International Bioenergy & Bioproducts Conference, Savannah,
United States.
Guan, J., Waite, T., & Amal, R. (1998). Rapid Structure Characterization of Bacterial Aggregates.
Environmental Science & Technology, 32(23), 3735-3742. doi: 10.1021/es980387u
Hamaguchi, M., & Vakkilainen, E. (2010, 12-15 October). The influence of lignin removal on the
energy balance of future pulp mills. Paper presented at XXI TECNICELPA Conference
and Exhibition, Lisbon, Portugal.
He, Z., He, L., Yang, J., & Lu, Q. (2013). Removal and recovery of Au(III) from aqueous solution
using a low-cost lignin-based biosorbent. Industrial and Engineering Chemistry Research,
52(11), 4103-4108. doi: 10.1021/ie303410g
Helander, M., Sevastyanova, O., Chowdhury, S., Lange, H., Zhang, L., Wedin, H., . . . Lindström,
M. (2013). Evaluation of Physico-Chemical Properties and Prediction of Spinning
Parameters for High-Quality Lignins Produced by Ultra-Filtration of Industrial Kraft
Pulping Liquor. Paper presented at 17th International Symposium on Wood, Fiber and
Pulping Chemistry (SWFPC), Vancouver, British Columbia, Canada.
Helmerius, J., von Walter, J., Rova, U., Berglund, K., & Hodge, D. (2010). Impact of hemicellulose
pre-extraction for bioconversion on birch Kraft pulp properties. Bioresource Technology,
101(15), 5996-6005. doi: 10.1016/j.biortech.2010.03.029
Hidalgo-Millán, A., Zenit, R., Palacios, C., Yatomi, R., Horiguchi, H., Tanguy, P. A., & Ascanio,
G. (2012). On the hydrodynamics characterization of the straight Maxblend® impeller with
Newtonian fluids. Chemical Engineering Research and Design, 90(9), 1117-1128.
Holmqvist, A., Wallberg, O., & Jonsson, A. (2005). Ultrafiltration of kraft black liquor from two
Swedish pulp mills. Chemical Engineering Research and Design, 83(8 A), 994-999. doi:
10.1205/cherd.04204
Howell, J., & Thring, R. (2000). Hardwood lignin recovery using generator waste acid. Statistical
analysis and simulation. Industrial & engineering chemistry research, 39(7), 2534-2540.
Ibaseta, N., & Biscans, B. (2010). Fractal dimension of fumed silica: Comparison of light scattering
and electron microscope methods. Powder Technology, 203(2), 206-210.
Jarvis, P., Jefferson, B., Gregory, J., & Parsons, S. A. (2005). A review of floc strength and
breakage. Water Research, 39(14), 3121-3137.
Jarvis, P., Jefferson, B., & Parsons, S. (2005). Breakage, Regrowth, and Fractal Nature of Natural
Organic Matter Flocs. Environmental Science & Technology, 39(7), 2307-2314. doi:
10.1021/es048854x
152
Jin, W., Tolba, R., Wen, J., Li, K., & Chen, A. (2013). Efficient extraction of lignin from black
liquor via a novel membrane-assisted electrochemical approach. Electrochimica Acta,
107(0), 611-618.
Joensson, A., Nordin, A., & Wallberg, O. (2008). Concentration and purification of lignin in
hardwood kraft pulping liquor by ultrafiltration and nanofiltration. Chemical Engineering
Research and Design, 86(11), 1271-1280.
Joensson, A., & Wallberg, O. (2009). Cost estimates of kraft lignin recovery by ultrafiltration.
Desalination, 237(1-3), 254-267.
Kamal, W. (2011). Analysis of Energy Systems and Performance Improvement of a Kraft Pulping
Mill. (École Polytechnique de Montréal).
Kamm, B., Gruber, P., & Kamm, M. (2006). Biorefineries - Industrial Processes and Products -
Volume 2 (Vol. 1). Weinheim: Wiley-VCH Verlag GmbH & Co. KGaA.
Kannangara, M., Marinova, M., Fradette, L., & Paris, J. (2012). Lignin recovery by acid
precipitation in a kraft mill: An energy perspective. Paper presented, 740 rue Notre-Dame
ouest, Bureau 810, Montreal, Quebec, H3C 3X6, Canada (Vol. 2, pp. 28-32).
Keshthkar, J. (2013). Steam and water combined analysis, integration and efficiency enhancement
in Kraft pulping mills. (Ecole Polytechnique Montreal).
Kim, H., Hill, M. K., & Fricke, A. L. (1987). Preparation of kraft lignin from black liquor. Tappi
journal (USA).
Kouisni, L., Fang, Y., Paleologou, M., Ahvazi, B., Hawari, J., Zhang, Y., & Wang, X. M. (2011).
Kraft lignin recovery and its use in the preparation of lignin-based formaldehyde resins for
plywood. Cellulose Chemistry and Technology, 45(7-8), 515-520.
Kouisni, L., Holt-Hindle, P., Maki, K., & Paleologou, M. (2012). The lignoforce system: A new
process for the production of high-quality lignin from black liquor. J-FOR: The Journal of
Science and Technology for Forest Products and Processes, 2 6-10.
Kresta, S. (1998). Turbulence in stirred tanks: Anisotropic, approximate, and applied. The
Canadian Journal of Chemical Engineering, 76(3), 563-576. doi:
10.1002/cjce.5450760329
Laaksometsä, C., Axelsson, E., Berntsson, T., & Lundström, A. (2009). Energy savings combined
with lignin extraction for production increase: case study at a eucalyptus mill in Portugal.
Clean Technologies and Environmental Policy, 11(1), 77-82.
Lake, M., & Blackburn, J. (2014). SLRP(TM)-An Innovative lignin-recovery technology.
Cellulose Chemistry and Technology, 48(9-10), 799-804.
Lee, R., Stack, K., Richardson, D., Lewis, T., & Garnier, G. (2012). Effect of shear, temperature
and pH on the dynamics of salt induced coagulation of wood resin colloids. Colloids and
Surfaces A: Physicochemical and Engineering Aspects, 396(0), 106-114.
Lin, M. Y., Lindsay, H. M., Weitz, D. A., Ball, R. C., Klein, R., & Meakin, P. (1989). Universality
in colloid aggregation. Nature, 339(6223), 360-362.
153
Lockhart, J. (2008). Precipitator dust purification for Kraft mill chloride reduction. Paper
presented at Black liquor recvoery boiler advisory committe Conference, Atlanta, United
States.
Loutfi, H., Blackwell, B., & Uloth, V. (1991). Lignin recovery from kraft black liquor: preliminary
process design. Tappi Journal, 74(1), 203-210.
Lundberg, V., Axelsson, E., Mahmoudkhani, M., & Berntsson, T. (2012). Process integration of
near-neutral hemicellulose extraction in a Scandinavian kraft pulp mill – Consequences for
the steam and Na/S balances. Applied Thermal Engineering, 43(0), 42-50.
Luo, J., Genco, J., Cole, B., & Fort, R. (2011). Lignin recovered from the near-neutral
hemicellulose extraction process as a precursor for carbon fiber. BioResources, 6(4), 4566-
4593.
Maciel, A. V., Job, A. E., Mussel, W. N., & Pasa, V. M. D. (2012). Pyrolysis and auto-gasification
of black liquor in presence of ZnO: An integrated process for Zn/ZnO nanostructure
production and bioenergy generation. Biomass and Bioenergy, 46(0), 538-545.
Mao, H., Genco, J., Heiningen, A., Zou, H., Luo, J., & Pendse, H. (2008). Technical economic
evualation of a northern hardwood biorefinery using the "near-neutral" hemicellulose pre-
extraction process. Paper presented at Engineering, Pulping and Environmental Conference
2008, TAPPI, August 24, 2008 - August 27, 2008, Portland, OR, United states (Vol. 3, pp.
2088-2139).
Mao, H., Genco, J. M., Yoon, S. H., van Heiningen, A., & Pendse, H. (2008). Technical economic
evaluation of a hardwood biorefinery using the "near-neutral" hemicellulose pre-
extraction process. Paper presented, 25650 North Lewis Way, Stevenson Ranch, CA 9138-
1439, United States (Vol. 2, pp. 177-185). doi: 10.1166/jbmb.2008.309
Marinova, M., Mateos-Espejel, E., Jemaa, N., & Paris, J. (2009). Addressing the increased energy
demand of a Kraft mill biorefinery: The hemicellulose extraction case. Chemical
Engineering Research and Design, 87(9), 1269-1275.
Mateos-Espejel, E., Radiotis, T., & Jemaa, N. (2013). Implications of converting a kraft pulp mill
to a dissolving pulp operation with a hemicellulose extraction stage. Tappi Journal, 12(2),
29-38.
Moosavifar, A., Sedin, M., & Theliander, H. (2009). Changes in viscosity and boiling point
elevation of black liquor when a fraction of lignin is removed - Consequences in the
evaporation stage. Appita Journal, 62(5), 383-390.
Moosavifar, A., Sedin, P., & Theliander, H. (2006). Viscosity and boiling point elevation of black
liquor: Consequences when lignin is extracted from the black liquor. Nordic Pulp and
Paper Research Journal, 21(2), 180-187.
Natural-Resources-Canada. (2006). Benchmarking energy use in Canadian pulp and paper mills.
Ottawa: Natural Resources Canada.
Natural-Resources-Canada. (2015). Canadian Forest Industry: Statistical data. Retrieved from
http://cfs.nrcan.gc.ca/statsprofile
154
NORAM-Engineering. (2015). Generator Acid Purification (GAP™) - Reducing Chemical Make-
up Costs. Retrieved from http://www.noram-eng.com/docs/groups/pulp-
paper/Generator%20Acid%20Purification%20%28GAP%29.pdf
Norgren, M., & Edlund, H. (2014). Lignin: Recent advances and emerging applications. Current
Opinion in Colloid & Interface Science, 19(5), 409-416.
Norgren, M., Edlund, H., & Wågberg, L. (2002). Aggregation of lignin derivatives under alkaline
conditions. Kinetics and aggregate structure. Langmuir, 18(7), 2859-2865.
Norgren, M., Edlund, H., Wågberg, L., Lindström, B., & Annergren, G. (2001). Aggregation of
kraft lignin derivatives under conditions relevant to the process, part I: phase behaviour.
Colloids and Surfaces A: Physicochemical and Engineering Aspects, 194(1–3), 85-96.
Norgren, M., & Lindstrom, B. (2000a). Dissociation of phenolic groups in kraft lignin at elevated
temperatures. Holzforschung, 54(5), 519-527. doi: 10.1515/HF.2000.088
Norgren, M., & Lindstrom, B. (2000b). Physico-chemical characterization of a fractionated kraft
lignin. Holzforschung, 54(5), 528-534. doi: 10.1515/HF.2000.089
Ohman, F., & Theliander, H. (2006). Washing lignin precipitated from kraft black liquor. Paperi
ja Puu, 88(5), 287-292.
Ohman, F., & Theliander, H. (2007). Fitration properties of lignin precipitated from black liquor.
Tappi Journal, 6(7), 3-9.
Ohman, F., Wallmo, H., & Theliander, H. (2007a). A novel method for washing lignin precipitated
from kraft black liquor - Laboratory trials. Nordic Pulp and Paper Research Journal, 22(1),
9-16.
Ohman, F., Wallmo, H., & Theliander, H. (2007b). Precipitation and filtration of lignin from black
liquor of different origin. Nordic Pulp and Paper Research Journal, 22(2), 188-193.
Olsson, M. R., Axelsson, E., & Berntsson, T. (2006). Exporting lignin or power from heat-
integrated kraft pulp mills: A techno-economic comparison using model mills. Nordic Pulp
and Paper Research Journal.
Paul, E. L., Atiemo-Obeng, V., & Kresta, S. (2003). Handbook of Industrial Mixing: Science and
Practice: Wiley.
Perin-Levasseur, Z., Benali, M., & Paris, J. (2010). Lignin Extraction Technology Integrated in a
Kraft Pulp Mill : Implementation Strategy. Paper presented at 3rd International Conference
on Efficiency, Cost, Optimization, Simulation and Environmental Impact of Energy
Systems, Lausanne, Switzerland.
Perin-Levasseur, Z., Savulescu, L., & Benali, M. (2011). Lignin production path assessment:
Energy, water, and chemical integration perspective. J-FOR, 1(3), 25-30.
Preto, F., Zhang, X., & Wang, J. (2008). Gasification behavior of carbon residue in bed solids of
black liquor gasifier. Experimental Thermal and Fluid Science, 32(7), 1421-1428.
Radiotis, T., Sullivan, J., MacLeod, M., Syed, S., & O'Hagan, T. (2007). Improved methods for
measuring residual effective alkali in kraft black liquors part 2: Comparison of titration
methods. Paper presented at Engineering, Pulping and Environmental Conference 2007,
155
TAPPI, October 21, 2007 - October 24, 2007, Jacksonville, FL, United states (Vol. 4, pp.
2388-2436).
Ragnar, M., Lindgren, C., & Nilvebrant, N. (2000). pKa-values of guaiacyl and syringyl phenols
related to lignin. Journal of wood chemistry and technology, 20(3), 277-305.
Rofouieeraghi, P. (2012). Biomass gasification integrated into a reference Canadian Kraft mill.
(École Polytechnique de Montréal).
Rose, M. (2013). Catalysis for the Conversion of Biomass and its Derivatives. (Max Planck
Research Library for the History and Development of Knowledge.) Edited by Malte
Behrens and Abhaya K. Datye. Angewandte Chemie International Edition, 52(37), 9613-
9613. doi: 10.1002/anie.201305619
Roy, R. (2001). Design of experiments using the Taguchi approach: Wiley-Interscience.
Rubin, E., Chen, C., & Rao, A. (2007). Cost and performance of fossil fuel power plants with CO2
capture and storage. Energy Policy, 35(9), 4444-4454.
Saake, B., & Lehnen, R. (2000). Lignin. In Ullmann's Encyclopedia of Industrial Chemistry:
Wiley-VCH Verlag GmbH & Co. KGaA.
Saito, T., Perkins, J., Jackson, D., Trammel, N., Hunt, M., & Naskar, A. (2013). Development of
lignin-based polyurethane thermoplastics. RSC Advances, 3(44), 21832-21840. doi:
10.1039/c3ra44794d
Saturnino, D. (2012). Modeling of Kraft Mill Chemical Balance. (University of Toronto).
Savulescu, L., Kim, J., & Smith, R. (2005). Studies on simultaneous energy and water
minimisation—Part I: Systems with no water re-use. Chemical engineering science, 60(12),
3279-3290. doi: 10.1016/j.ces.2004.12.037
Silva, E., Zabkova, M., Araújo, J., Cateto, C., Barreiro, M., Belgacem, M., & Rodrigues, A. (2009).
An integrated process to produce vanillin and lignin-based polyurethanes from Kraft lignin.
Chemical Engineering Research and Design, 87(9), 1276-1292.
Smolarski, N. (2012). High-Value Opportunities for Lignin: Unlocking its Potential. Frost &
Sullivan.
Smook, G. (1992a). Chemical recovery. In Handbook for pulp and paper technologists (Third
Edition ed.). Vancouver: Angus Wilde Publications.
Smook, G. (1992b). Handbook for pulp and paper technologists (Third Edition ed.). Vancouver:
Angus Wilde Publications.
Smook, G. (1992c). Kraft pulping. In Handbook for pulp and paper technologists (Third Edition
ed.). Vancouver: Angus Wilde Publications.
Smook, G. (1992d). Overview of pulping methodology. In Handbook for pulp and paper
technologists (Third Edition ed.). Vancouver: Angus Wilde Publications.
Snowdon, M., Mohanty, A., & Misra, M. (2014). A Study of Carbonized Lignin as an Alternative
to Carbon Black. ACS Sustainable Chemistry & Engineering, 2(5), 1257-1263. doi:
10.1021/sc500086v
156
Spicer, P., Keller, W., & Pratsinis, S. (1996). The Effect of Impeller Type on Floc Size and
Structure during Shear-Induced Flocculation. Journal of Colloid and Interface Science,
184(1), 112-122.
Spicer, P., Pratsinis, S., Raper, J., Amal, R., Bushell, G., & Meesters, G. (1998). Effect of shear
schedule on particle size, density, and structure during flocculation in stirred tanks. Powder
Technology, 97(1), 26-34.
Sri, R., Yasar, L., & Douglas, L. (1989). Association of Kraft Lignin in Aqueous Solution. In Lignin
(Vol. 397, pp. 144-154): American Chemical Society.
St. Pierre, J., Duran, L., & van Heiningen, A. (2015). Fast pyrolysis of muconic acid and formic
acid salt mixtures. Journal of Analytical and Applied Pyrolysis, 113(0), 591-598.
Statistics-Canada. (2013). The Great U.S. Recession and Canadian Forest Products. Retrieved from
http://www.statcan.gc.ca/pub/11-626-x/11-626-x2013028-eng.htm
Stevens, F., Grace, T., & Leopold, B. (1989). Alkaline pulping: Pulp and paper manufacture:
Technical Section, Canadian Pulp and Paper Association.
Stewart, D. (2008). Lignin as a base material for materials applications: Chemistry, application and
economics. Industrial Crops and Products, 27(2), 202-207.
Theliander, H. (2010). The lignoboost process: Solubility of lignin. Paper presented at International
Chemical Recovery Conference, Williamsburg, VA, United states (Vol. 2, pp. 33-42).
Theliander, H., Ohman, F., Axegard, P., & Tomani, P. (2005). Novel process for separation of
lignin from kraft black liquor. Paper presented, Cincinnati, OH, United states (pp. 9535-
9535).
Tomani, P. (2010). The lignoboost process. Cellulose Chemistry and Technology, 44(1-3), 53-58.
Tomani, P. (2013). Update on LignoBoost lignin and Applications. Retrieved from
http://www.spci.se/shared/files/Per_Tomani_SPCI_2013_UT.pdf
Tomani, P., Axegard, P., Berglin, N., Lovell, A., & Nordgren, D. (2011, May 9-12, 2011).
Integration of lignin removal into kraft pulp mill and use of lignin as biofuel. Paper
presented at 5th International colloquium on Eucalyptus Pulp, Porte Seguro, Bahia, Brazil.
Tomlinson, G., & Tomlinson, G. (1948). Canada Patent No. Canada Patent No. 448.476.
Tran, H. (2008, 7-10 Januray, 2008). The Kraft Recovery Process. Paper presented at Tappi Kraft
Recovey Short Course, St. Petersburg, Florida, United States.
Uloth, V., & Wearing, J. (1989a). Kraft Lignin Recovery: Acid Precipitation Versus Ultrafiltration,
Part II: Technology and Economics. Pulp and Paper Canada, 90(10), 357-360.
Uloth, V., & Wearing, J. (1989b). Kraft lignin recovery: acid precipitation versus ultrafiltration. I:
Laboratory test results. Pulp & Paper Canada, 90(9), 67-71.
Vakkilainen, E. (2000). Estimation of elemental composition from proximate analysis of black
liquor. Paperi ja Puu/Paper and Timber, 82(7), 450-454.
Vakkilainen, E., & Valimaki, E. (2009). Effect of lignin separation to black liquor and recovery
boiler operation. Paper presented, Memphis, TN, United states (Vol. 3, pp. 1515-1556).
157
Valimaki, E., Niemi, P., & Haaga, K. (2010 ). A case study on the effects of lignin recovery on
recovery boiler operation. Paper presented at TAPPI/PAPTAC International Chemical
Recovery Conference, Williamsburg, VA, United states (Vol. 2, pp. 148-159).
Van Heiningen, A. (2006). Converting a kraft pulp mill into an integrated forest biorefinery. Pulp
and Paper Canada, 107(6), 38-43.
VanCaeseele, S. (2014). LIGNOFORCE Lignin Recovery from the Kraft Pulping Process.
Retrieved from http://www.canbio.ca/upload/documents/van-12-presentations/van-
caeseele-shane.pdf
Wallberg, O., & Joensson, A. (2006). Separation of lignin in kraft cooking liquor from a continuous
digester by ultrafiltration at temperatures above 100°C. Desalination, 195(1-3), 187-200.
Wallberg, O., Jonsson, A., & Wimmerstedt, R. (2003). Fractionation and concentration of kraft
black liquor lignin with ultrafiltration. Desalination, 154(2), 187-199. doi: 10.1016/S0011-
9164(03)80019-X
Wallmo, H., Richards, T., & Theliander, H. (2007). Lignin precipitation from kraft black liquors:
kinetics and carbon dioxide absorption. Paperi ja puu, 89(7-8), 436-442.
Wallmo, H., Richards, T., & Theliander, H. (2009). An investigation of process parameters during
lignin precipitation from kraft black liquors: A step towards an optimised precipitation
operation. Nordic Pulp and Paper Research Journal, 24(2), 158-164.
Wallmo, H., Theliander, H., Jonsson, A. S., Wallberg, O., & Lindgren, K. (2009). The influence
of hemicelluloses during the precipitation of lignin in kraft black liquor. Nordic Pulp and
Paper Research Journal, 24(2), 165-171.
Wienhaus, O., Bernaczyk, H., & Pecina, H. (1990). Research into the precipitation of lignin from
sulfate black liquors, particularly by carbon dioxide. Das Papier, 44(11), 563-569.
Wilson, G. (1971). Capital investment for chemical plant. British Chemical Engineering and
Process Technology, 16(10), 931-&.
Wising, U., Algehed, J., Berntsson, T., & Delin, L. (2006). Consequences of lignin precipitation in
the pulp and paper industry.
Wooley, R., & Putsche, V. (1996). Development of an ASPEN PLUS Physical Property Database
for Biofuels Components. Golden,CO,: National Renewable Energy Laboratory.
Xu, Q., Gao, Y., Qin, M., Wu, K., Fu, Y., & Zhao, J. (2013). Nanocrystalline cellulose from aspen
kraft pulp and its application in deinked pulp. International Journal of Biological
Macromolecules, 60(0), 241-247.
Xu, W., & Gao, B. (2012). Effect of shear conditions on floc properties and membrane fouling in
coagulation/ultrafiltration hybrid process—The significance of Alb species. Journal of
Membrane Science, 415–416(0), 153-160.
Yang, L., & Ragauskas, A. (2012). Kraft Lignin-based Rigid Polyurethane Foam. Journal of Wood
Chemistry and Technology, 32(3), 210-224. doi: 10.1080/02773813.2011.652795
Zhao, L., & Luo, X. (2010). Fractional isolation and purification of lignin from Pulping Black
Liquor. Paper presented, Piscataway, NJ, USA (pp. 4 pp.). doi:
10.1109/icbbe.2010.5517631
158
Zhou, M., Qiu, X., Yang, D., Lou, H., & Ouyang, X. (2007). High-performance dispersant of coal–
water slurry synthesized from wheat straw alkali lignin. Fuel Processing Technology,
88(4), 375-382.
Zhu, W. (2013). Equilibrium of Lignin Precipitation. (Chalmers University of Technology,
Gothenburg, Sweden).
Zhu, W., & Theliander, H. (2015). Precipitation of lignin from softwood black liquor: An
investigation of the equilibrium and molecular properties of lignin. BioResources, 10(1),
1696-1714.
Zhu, W., Westman, G., & Theliander, H. (2014). Investigation and characterization of lignin
precipitation in the lignoboost process. Journal of Wood Chemistry and Technology, 34(2),
77-97. doi: 10.1080/02773813.2013.838267