
UNIVERSITÉ DU QUÉBEC THESIS SUBMITTED TO THE …
53
UNIVERSITÉ DU QUÉBEC THESIS SUBMITTED TO THE UNIVERSITÉ DU QUÉBEC À CHICOUTIMI IN PARTIAL FULFILLMENT OF THE REQUIREMENTS FOR THE MASTER'S DEGREE IN ADMINISTRATION BY PAN-MING TITLE OF THESIS Research on Detecting Mechanism for Trojan horse Based on PEfile MAY 2009
Transcript of UNIVERSITÉ DU QUÉBEC THESIS SUBMITTED TO THE …
UNIVERSITÉ DU QUÉBEC
THESIS
SUBMITTED TO
THE UNIVERSITÉ DU QUÉBEC À CHICOUTIMI
IN PARTIAL FULFILLMENT OF
THE REQUIREMENTS FOR THE
MASTER'S DEGREE IN ADMINISTRATION
BYPAN-MING
TITLE OF THESISResearch on Detecting Mechanism for Trojan horse Based on PEfile
MAY 2009

bibliothèquePaul-Emile-Bouletj
UIUQAC
Mise en garde/Advice
Afin de rendre accessible au plusgrand nombre le résultat destravaux de recherche menés par sesétudiants gradués et dans l'esprit desrègles qui régissent le dépôt et ladiffusion des mémoires et thèsesproduits dans cette Institution,l'Université du Québec àChicoutimi (UQAC) est fière derendre accessible une versioncomplète et gratuite de cette �uvre.
Motivated by a desire to make theresults of its graduate students'research accessible to all, and inaccordance with the rulesgoverning the acceptation anddiffusion of dissertations andtheses in this Institution, theUniversité du Québec àChicoutimi (UQAC) is proud tomake a complete version of thiswork available at no cost to thereader.
L'auteur conserve néanmoins lapropriété du droit d'auteur quiprotège ce mémoire ou cette thèse.Ni le mémoire ou la thèse ni desextraits substantiels de ceux-ci nepeuvent être imprimés ou autrementreproduits sans son autorisation.
The author retains ownership of thecopyright of this dissertation orthesis. Neither the dissertation orthesis, nor substantial extracts fromit, may be printed or otherwisereproduced without the author'spermission.
ABSTRACT
As malicious programs, Trojan horses have become a huge threat to computernetworks security. Trojan horses can easily cause loss, damage or even theft of data becausethey are usually disguised as something useful or desirable, and are always mistakenlyactivated by computer users, corporations and other organizations. Thus, it is important toadopt an effective and efficient method to detect the Trojan horses, and the exploration of anew method of detection is of greater significance.
Scientists and experts have tried many approaches to detecting Trojan horses sincethey realized the harms of the programs. Up to now, these methods fall mainly into twocategories [2]. The first category is to detect Trojan horses through checking the port ofcomputers since the Trojan horses send out message through computer ports [2]. However,these methods can only detect the Trojan horses that are just working when detected. Thesecond class is to detect Trojan horses by examining the signatures of files [2] [19], in thesame way as people deal with computer virus. As new Trojan horses may contain unknownsignatures, methods in this category may not be effective enough when new and unknownTrojan horses appear continuously, sending out unknown signatures that escape detection.
For the above-mentioned reasons, without exception, there are limitations in theexisting methods if the un-awakened and unknown Trojan horses are to be detected. Thisthesis proposes a new method that can detect un-awakened and unknown Trojan horses- thedetection by using of a file's static characteristics. This thesis takes PE file format as theobject of the research, because approximately 75% of personal computers worldwide areinstalled the Microsoft Windows [4], and that Trojan horses usually exist as a PortableExecutable (PE) file in the Windows platform. Based on the (PE) file format, my researchgets all the static information of each part of PE file which is characteristic of a file. Then,this static information is analyzed by the intelligent information processing techniques.Next, a detection model is established to estimate whether a PE file is a Trojan horse. Thismodel can detect the unknown Trojan horses by analyzing static characteristics of a file.The information that is used to verify detecting model is new and unknown to the detectingmodel; in other words, the information is not used during the training of the model.
The thesis is organized as follows. First, this thesis discusses the limitations oftraditional detection techniques, related works of research, and a new method to detect

Trojan horse based on file's static information. Second, the thesis focuses on the research ofthe Trojan horse detecting models, covering the extracting of the static information from PEfile, choice of intelligent information processing techniques, and setting up the Trojan horsedetecting model. Lastly, the thesis discusses the direction of future research in this field.

ACKNOWLEDGEMENTS
I wish to express my sincere gratitude to my Research Supervisor Fan-Xiumei who
helped and guided me towards my academic as well as my professional success. This thesis
would also not be successful without my Research Associate Director Dai-Min who helped
me to analyze project and solve problems. She told me how to think and how to solve the
problem. She gave me many useful advices to help me complete my thesis successfully. I
would also want to thank my classmates who help me to find some useful information and
encourage me when I am depressed. I would also like to thank my parents for their
unending support and eagerness to love.

TABLE OF CONTENTS
CHAPTER 1 INTRODUCTION. 9
1.1 Introduction of Trojan horse 9
1.1.1 Trojan horse and its harms 10
1.1.2 Traditional methods for detecting Trojan horses 11
1.2 Detecting Trojan horse based on file's static characteristics 12
1.2.1 Related work 12
1.2.2 To detect Trojan horse by using file's static characteristics 14
1.3 Thesis organization 14
CHAPTER 2 EXTRACT THE STATIC INFORMATION FROM PE FILE 15
2.1 Introduction of PE file 15
2.2 Information extracting and its organization 16
CHAPTER 3 WHAT IS THE TROJAN HORSES DETECTING PROBLEM? 21
3.1 Is it a classification problem? 21
3.2 The methods for solving the problem 21
3.2.1 About the methods of classification 21
3.2.2 Trojans detecting based on BP network 23
CHAPTER 4 TROJAN HORSES DETECTING MODEL 27
4.1 The difficulties in setting up models 27
4.2 The classifiers of the model 29
4.2.1 The classifier for the File header 30
4.2.2 The classifier for the Section header 36
4.2.3 The classifier for the Section body 39
CHAPTER 5 COMBING THE RESULTS OF CLASSIFIERS. 43
5.1 The capabilities of classifiers 43
5.2 To judge the Trojan horse 43
CHAPTER 6 CONCLUSION. 47
6.1 Summary 47
6.2 The future works 49
REFERENCE 50

LIST OF FIGURES
Figure 1 The structure of PE file 16
Figure 2 The structure of PE format 16
Figure 3 The connections of normal file 18
Figure 4 The connections of Trojan file 19
Figure 5 The example of Backpropagation Algorithm 24
Figure 6 The Backpropagation Algorithm 25
Figure 7 The process of our method 28
Figure 8 The interface of universal model 29
Figure 9 Import Section examples 40

Vil
LIST OF TABLES
Table 1 Statistical Information of samples 17
Table 2 The ways to deal with the fields of file's PE header 31
Table 3 Establish the best structure of model of file's PE header 32
Table 4 The experimental result of file's PE header after adjust the initial weight of model 34
Table 5 The experimental result of file's PE header after add momentum 34
Table 6 Establish the best structure of model of file's PE header (after optimized) 35
Table 7 The last results of model of file's PE header 36
Table 8 The information of count probability of file's section's header 37
Table 9 The ways to deal with the other fields of section's header 38
Table 10 Establish the best structure of model of file's section' header 38
Table 11 The last results of model of file's section's header 39
Table 12 The ways to deal with the other fields of import section 41
Table 13 Establish the best structure of model of file's import section 42
Table 14 The last results of model of file's import section 42
Table 15 The capabilities of classifiers 43
Table 16 The best result of method of weighted mean 44
Table 17 The best result of method of unweighted mean 45
Table 18 The result of method of majority voting 45
Table 19 The result of different way to combine the classifier 45
Table 20 The results of different method to combine the classifiers (particular) 48

CHAPTER 1
INTRODUCTION
Trojan horses have become a huge threat to the computer networks security because
they can easily cause loss, damage or even theft of data. Since people realized the harm that
Trojan horses bring, they have tried many ways to detect these malicious programs. This
chapter begins with a brief introduction of Trojan horses and the harms they bring. The
current approaches that people take to detect Trojan horses and their limitations will then be
discussed in this chapter. Finally, a new method based on the static characteristics of PE file
is proposed to detect Trojan horses, which can overcome the limitations of the previous
ways.
1.1 Introduction of Trojan horse
The term, Trojan horse, comes from a Greek story of the Trojan War, in which the
Greeks give a giant wooden horse to their foes, the Trojans, ostensibly as a peace offering.
But after the Trojans drag the horse inside their city walls, Greek soldiers sneak out of the
horse's hollow belly and open the city gates, allowing their compatriots to pour in and
capture Troy.

1.1.1 Trojan horses and its harms
A Trojan horse program is a piece of computer software that includes hidden
functionality in addition to its declared functionality. They will typically have a server that
is installed on the victim computer and a client on the attacker's computer [17]. The server
listens for commands sent from the client and responds by sending data back to the client.
Trojan horse enables an attacker to bypass existing security measures to access a computer,
thereby Trojan horse provide a "backdoor" or instill harmful pieces of software into the
computer and provides any functionality that a client/server program operating in a
networked environment can provide. The reason for this is that the server runs on the
victim's computer and will typically run as administrator or as a highly privileged user.
Listed below are the types of actions that a Trojan horse might take [17]:
� Log the victim's keystrokes (including passwords)
� Render the victim's screen on the attacker's computer
� Monitor network traffic on the victim's network
� Hijack TCP sessions involving the victim's computer
� Record conversations via the victim computer's microphone or control a web cam
� Send files from the victim's computer to the attacker
� Use the computer as a platform for attacks on other computers
� Modify data on the victim's computer
Unlike viruses and worms, a Trojan horse is not capable of propagating itself [17],
but Trojan horse successfully spreads itself by new approaches. It is often delivered to a
victim through an email message where it masquerades as an image or joke, or by a

10
malicious Web site that installs the Trojan horse on a computer through vulnerabilities in
the Web browser software such as Microsoft Internet Explorer. Moreover, Trojans are the
first stage of an attack and their primary purpose is to stay hidden while downloading and
installing more sophisticated threats [17]. After it is installed, the Trojan horse lurks silently
on the infected machine, invisibly carrying out its misdeeds such as downloading spy ware
while victims continues on with their Web surfing or other normal activities.
In summary, Trojan horse is clever at hiding itself and spreading itself by various
approaches and these characteristics bring difficulty to detect Trojan horse by using
traditional detecting methods.
1.1.2 Traditional ways for detecting Trojan horses
As Trojan horses have become a huge security threat to computer network, it is of
great importance to detect the Trojan horse efficiently for the network security. After people
realized the harms of Trojan horse, they try every means to detect Trojan horse. Up to now,
the approaches to detecting the Trojan horse can be grouped into two categories [2].
The first category is to detect Trojan horses through checking the port of computers
since the Trojan horses send out message through computer ports [2]. However, these
methods can only detect the Trojan horses that are just working when detected.
The second class is to detect Trojan horses by examining the signatures of files
[2][19], in the same way as people deal with a computer virus. As new Trojan horses may
contain unknown signatures, methods in this category may not be effective enough when
new and unknown Trojan horses appear continuously, sending out unknown signatures that

11
escape detection.
For the above-mentioned reasons, without exception, there are limitations in the
existing methods if the un-awakened and unknown Trojan horses are to be detected. This
thesis proposes a new method that can detect un-awakened and unknown Trojan horses�
the detection by using of a file's static characteristics.
1.2 Detecting Trojan horse based on file's static characteristics
One characteristic of Trojan horse is that it can hide successfully and spreads itself
by various approaches, which brings troubles in detecting Trojan horses. The traditional
detecting methods based on the file's dynamic characteristics cannot resolve these problems
in detecting. So we propose a new method to detect Trojan horse, and this method can
detect all the Trojan horse.
Now, many researchers try new detection techniques to solve the problem of
network security. A group of researchers use file's static information to detect the Virus and
malicious program, and finally they got satisfactory results [4] [6] [15] [16].
1.2.1 Related work
Some researches use a data mining approach based on a file's static characters to
detect the Virus and malicious programs, and they got a recognition rate of over 80%. [4] [6]
One of the researches is "Learning to Detect New and Unknown Malicious Programs".
They proposed the Bayesian method to differentiate between benign programs and

12
malicious programs. In their experiments, they detected 81.54% of previously unknown
malicious programs with a 0.96% false-positive rate [4]. In another research "Neural
Networks for Computer Virus Recognition", the researchers were able to identify 80-85%
of unknown boot sector viruses successfully with a very low false positive rate (<1%) [6].
Some researchers conduct a static analysis of exécutables of a file. For example, the
research entitled "Static Analysis of Exécutables to Detect Malicious Patterns" presents a
unique viewpoint on malicious code detection [15]. They tested the resilience of three
commercial virus scanners against code-obfuscation attacks. The results were surprising:
the three commercial virus scanners could be subverted by very simple obfuscation
transformations! They present an architecture for detecting malicious patterns in
exécutables that is resilient to common obfuscation transformations. Experimental results
demonstrate the capability of their prototype tool, SAFE (a Static Analyzer For Exécutables)
[15].
Another research aims to use the Windows Portable Executable (PE) file to
determine whether malicious code has been inserted into an application after compilation
[16].
However, Trojan horse is characterized by its ability to transform [2][19], which
differentiates it from various other malicious programs, so the above-mentioned approaches,
ie. "the malicious code detection"[15], and the approach to determine whether malicious
code has been inserted[16] are not effective enough to detect Trojans with numerous new
Trojans keep appearing day after day.
We want to detect Trojans based on a file's static characters. Considering about 75%

13
of world's personal computer install the Microsoft Windows [4] and Trojan horse usually
exists as a Portable Executable (PE) file in Windows platform, the PE file format is
accepted as the object of our research. The aim of our research is to differentiate the Trojan
horse files and normal files based on PE format. We assume if there are differences between
the static characters of a Trojan file and the static characters of a normal file, all the Trojan
horses can be detected with this method.
1.2.2 To detect Trojan horse by using file's static characteristics
In this thesis, a new detecting method is proposed which is based on file's static
characteristics. Intelligent information processing techniques are used to analyze these
static information. Then, a detection model is established to estimate whether a PE file is a
Trojan horse or not, which can also detect the unknown Trojan horse by analyzing file's
static characteristics. The information used to verify detecting model is new and unknown
to our model, in other words, the information is not used during training the model.
1.3 Thesis organization
The rest of this thesis is organized into the following chapters: Chapter 2 introduces
the PE format , and presents how to extract the static information form files according to PE
Trojan horses detecting and use the neural network as our method to analyze the static
information. Chapter 4 presents all the details of the problems in setting up Trojan horse
detecting models. Because the static information involves three parts, we set up a respective

14
model as a classifier for each part, and combine the results of these classifiers to judge
whether the file is a Trojan file or not. Chapter 5 deals with the details of judging the Trojan
horse. Chapters 6 summarize the thesis.

CHAPTER 2
EXTRACTS THE STATIC INFORMATION FROM PE FILE
Now that we have decided to use file's static characters to detect a Trojan horse, we
need to get the static information from files. There are many ways to get the static
characters of a file. Considering about 75% of world's personal computer install the
Microsoft Windows [4] and Trojan horse usually exists as a Portable Executable (PE) file in
Windows platform, the PE file format is accepted as the object of our research.
2.1 Introduction of the PE file
The Portable Executable (PE) file format is a new executable file format, which was
introduced by the Windows NT� (version 3.1) operating system [12] [20].
The PE file format begins with an MS-DOS header, a real-mode program stub,
and a PE file signature. Immediately following is a PE file header and optional header.
Beyond that, all the section headers appear, followed by all of the section bodies [20]. The
structure of PE file is shown in Figure 1.

MS-DOS Header
Usai-mode Program Stab
?E Fife Signature
PE File Header
PE File Optional Header
Section Headers
Ssctica Bodies
Figure 1. The structure of PE file
16
2.2 Information extracting and its organization
In Microsoft Portable Executable and Common Object File Format Specification,
the description of the PE format is: "the entire format of PE file consists of File header
followed by all of the section headers, and finally, all of the section bodies. And The File
header consists of an MS-DOS MZ header, the real-mode stub program, the PE file
signature, the PE file header, and the PE optional header." [14] So the PE format can be
divided into three parts: File header, section header, and section body, the structure of PE
format is shown in Figure2.
PEfbsmat
Fife Header Section Header SeciioaBcdy
Figure 2. The structure of PE format

17
"The memory-mapped file is one of the coolest features of Windows NT." [20]
Memory-mapped files permit the use of simple pointer dereferencing to access the data
contained within the file. So the static information from each field can be extracted by
using memory-mapped files for accessing data in PE files.
The information in the fields of each part of PE format will be extracted. In total,
there are 56 fields in the File header and there are 10 fields in the Section header. In the
section body, an application for Windows NT typically has nine predefined sections [20].
Some applications do not need all of these sections, while others may define still more
sections to suit their specific needs [20]. If we extracted the static information of each
section body, the workload would be very large. So we decide to extract the static
information of two of the nine section bodies, because it is generally believed that if one
section body can be processed, the other Section bodies can be processed likewise. The
selected section bodies are import section ( .idata) and export section ( .edata), with 8 fields
in the former and 14 in the latter one. The statistical information is shown in Table 1.
Place in the PE
FileHeader
SectionHeader
ImportSection
ExportSection
Trojan sample
TrojanHeader
TrojanSectionHeader
TrojanlmportDirectoryTrojanExportDirectoryTrojanExportFunction
Normal sample
NormalHeader
NormalSectionHeaderNormallmportDirectoryNormalExportDirectoryNormalExportFunction
Number offields
56108113
Table 1. Statistical Information

18
Then we put the information in SQL server database. The connections among the
tables of database are shown in Figure 3 and Figure 4.
FileHwe
dHS_KEADF,H_«_»agi c
dBOS_KSAIffiS_s_cl>lp
dDOS_HEAI)HK_«_ep
dDOS_HEAI)ER_._cpSrhclr
dD0S_HIU!R_8_»ia«lloc
dHE_HEM)ER_«_i»a!talloc
dWS_HEMIER_e_s5
dD0SJ�AIER_e_5p
dDOS_HEADEK_e_c:aii
dDOS HEADER « ip
dMB_HEAIIH8_«_ci
dBOS_HEAIÏK_e_oaiid
dBOS_HEABM_e_o�info
dD0S_H8ABIR_e_r«s2J0
dFILE jKEHIÏRJfimlieiOfSecti ons
anU_HEAIIBt_Tiii>tD>teSt»p
::-:-: :�
�:��:�:�:,
Vf�!�m
�y-
�s. - : � : - . - :
:Sè:: ' : � : � .
� : � : � � :
ïm�-
� � : � : � : �
: : : : - . -
fi:: � : � : � :
;�
:�:¥::
ddFILEJDUDE£_Si leOfDpti onalKeader
dFILEJ�HIERClur « t « r i s t i «
èOniOÏAL_HEAI)ÏKJacic
byteOFHOÏAL_)�AI)EÏ_l»j orLicksrYar s i on
byteOFIIOÏAL.HEAJEEJinorLinia-Verîion
d8SÏCII0ï_KB*IIER_iii«
ddSECTIOIJEMERJlisc
ddSECTIOI_HEABER_Virttial*ddress
ddSECTIOM_HEMER_Si zsOfEwData
ddSECTIOÏ_HE*IER_Pointa-Toï«wD»t»
ddSÏCHOM_HE*IIEK_PointerToR«loc»lions
ddSECTIOS^KEAIIEKJointsrToLinHnmbsrs
dSECII0I_HEH)ffi_Ha«b8r0£Eeloestion!
dSECTIOS_ffiADEE_HraiberO£Linen�bers
d dSECTIQSJfEMEI_Char6ct eri s t i e s
Eijort_id
ddîïFOEIJIEECTOEI_Cbjricteristics
dd!î?OSTJIEÏCIORI_TiB«I)at«Sta»p
dEÏPOKTJIRECIORÎJaj orVtrsi on
dE!FORIJIEÏCT0RÏJiniirV«rsimi
ddEIPORT_DIRECTORT_ïaae
ddEÏPORI_BIRECIORÏ_ïn»btrOffmiction:
ddEÏPORIJIRECTORT_ïn«berO£ïa«ss
ddIXFORIJIRECTORI.ÀddresiOfrmctionî
ddïIÎORIJIRECIORI.AddrtsrflfflMes
ddZITOBIJIIBECTOST_A(ldr«»0{B«i<OrJinali
Znport^id
S e c t i o n e d
dfflrORTJESCEIPIORJri
dIBFORI_BESCRIPIOR_TimeBatsSt:
dIÏPORT_IIESCRirTOR_ForwardtrC:
dIMFOBT_DZSCK[fTOIJfaie
dBjrORIJESCRIPIORJirstThmil:
dTHUlffiJAIA.al
dIIPORI_ÎI_S*ll!_Kint
Forte tioztAddr
Figure 3. The connections of normal file

19
dDOS_HEADER.ejft&ci c
dDOS.KEADEE.e.cblp
dMS.HEiBES.t.cp
dDOS.HEÀBEE.e.crl c
dDOS.HEWEB.e.cparhdr
dDOS_HEAI)E&_e.miii&Hoc
dDOS.KEiDEK.e.ianlloc
dDOS.K£iKBi.e_ss
dH)S.HEUEIl_e.sp
4D0S_HEUIEK.«_cstim
fflOS.HEUBS.t.ip
dMS_HEME&_e_cs
dBOS.HEitEE.s.lfsrlc
dDOS.HBilEK.e.oroo
dDOS_KEAIES_«_OMid
dK)S_HEàDES_t_OMinfo
ect ions
dmE.HEiBES.TineDateStMip
ddFIiE_HEADES_?oint erToSratolIabl t
ddFIU.HEàDElMhiilKrOf Sjwtol s
1m: | section.id
Fil d u t
ddSEaiOS.HEiBEK.Misc
âdSKTIOH.HEAÏES.ÏirtiaUddrtss
ddSECTIOI.HU1IEa.Si zeOfBaïOat»
ddSEalOÏ.KE*BEK_PointerIoRa»(lata
ddSECTIOÏ_HEiim_PointerIoReloc»tioai
ddSECTIOS.HEUES.Point erloLinemmbers
dSECTIOS.HEUIEE.KuaberOfltelocatioiis
dSECTIOg.KEUEEJfarterOfLine&uters
Ezpoxt.id
ddEKPOBI.IHaKIOEf.Cliarac) e r i s t i c s
ddQÎOKr.DIllECTOBr.TUeDat eStsup
dIXT0KI_BUICT0KÏ_KilBrt8rsion
ddEX70II.BIBECT01tI.iru8
dJBfPORrjIBICTOH.Bsse
ddEKP0SI.DISECI0IiI.Flab8i0flfe.es
ddEXÏ0RT_DIII£CT0BT_Addr*s50f7mkctioiis
d�XPOST.DIBECTOSI.àddiessOflaiHS
ddEÏPOST.DISECroRï.àddressOfïa» «Ordinals
FilsSu».
ir t . id
StcUon. id
dlKPOSI.BESCÏIPTOS.Ori (iBalFl rstThmi
dIKPOST.DESClUPIOS.Ti«eB«teSta«p
dHIPOM.BESCRIPTOÏ.ForKirderClaia
dlKPOST.BESCSIPTOE.HMe
dIKP0ET.BESCEIPT08.Fi rstTlnillk
dTHUn.niH.nl
dIWOK_tT.IU(E_Hint
W
FmctionldEiport.idOrdinalRmctionBuxFimctioaAddr
Note:
Figure 4. The connections of Trojan file
The total number of samples is 299 , with 157 Trojan samples and 142 normal samples in it.
The prefix is Normal means it is the information of Normal sample.
The prefix is Trojan means it is the information of Trojan sample.
The postfix of table is Header means it belongs to the structure of Dos Header, PE Header or
Optional Header.
The postfix of table is Section means it belongs to the structure of Section Table.
The postfix of table is Import Directory means it belongs to the structure of Import Table.
The postfix of table is Export Directory means it belongs to the structure of Export Table.
The postfix of table is Export Function means it belongs to the structure of Export Function.


CHAPTER 3
WHAT IS THE TROJAN HORSES DETECTING PROBLEM
3.1 Is it a classification problem?
We use static information to judge whether the file is Trojan file or not. hi other
words, we want to differentiate a Trojan file from a normal file based on the file's static
infonnation. To differentiate a Trojan file from a normal file means to classify the files, so
the true nature of Trojan horses detecting problem is a classification problem.
3.2 The methods for solving the problem
There are many algorithms to solve the problem of classification: Decision Tree,
Neural Networks, Bayesian, Genetic Algorithms and so on [7] [24].
3.2.1 The methods of classification
1. Decision Tree
A decision-tree learning algorithm approximates a target concept using a tree
representation, where each internal unit corresponds to an attribute, and every terminal unit
corresponds to a class [24]. Decision trees are powerful and popular tools for
classification and prediction. The strengths of decision tree methods are [24]:

22
� Decision trees are able to generate understandable rules.
� Decision trees perform classification without requiring much computation.
� Decision trees are able to handle both continuous and categorical variables.
� Decision trees provide a clear indication of which fields are most important for
prediction or classification.
The weaknesses of decision tree methods are [24]:
� Error-Prone with Too Many Classes.
� Computationally Expensive to Train.
� Trouble with Non-Rectangular Regions.
2. Neural Networks
Strengths of Artificial Neural Networks are [24]:
� Neural Networks Are Versatile.
� Neural Networks Can Produce Good Results in Complicated Domains.
� Neural Networks Can Handle Categorical and Continuous Data Types.
Weaknesses of Artificial Neural Networks are [24]:
� All Inputs and Outputs Must Be Massaged to [0.1].
� Neural Networks Cannot Explain Results.
There are some other algorithms that can solve the problem of classification, such as
Bayesian, Genetic Algorithms. Because the data of the samples is rather large, and it is
impossible to find out the relations directly, we select the neural network to solve the
problem as the neural network can produce good results in complicated domains [24].

23
Moreover, the theory of neural network is mature, and there are rich experiences
summarized.
3.2.2 Trojans detecting based on BP network
The neural network with probably the closest analogy to the human brain is the
Multi-layer Perceptron or MLP for short. This network has found a wide range of
applications[7]. It uses supervised learning, which means that input and output data are
required during the training phase. The most common training algorithm for the MLP is
Backpropagation (BP)[7].
Introduction of the Backpropagation Algorithm
BACKPROPAGATION(training_examples,/7, nin, nouh nhutden) [24]
Each training example is a pair of the form ( x, t ) , where x is the vector of
network input values, and t is the vector of target network output values.
fjis the learning rate (e.g., .05). nin is the number of networks, nMdden is the numberof units in hidden layer, and nout the number of output units.The input from unit i into unity is denoted xjt and the weight from unit i to unit j isdenoted by wjidenoted by wji.
� Create a feed-forward network with n-m inputs, midden hidden units, and nout
output units.� Initialize all the weights to small random values (e.g., between -0.05 and 0.05)� Until termination condition is met, Do
A" *\o For each \x,t) in trainingexamples, Do
Propagate the input forward through the network:

24
1. Input the instance x to the network and compute the output ou ofevery unit u in the network.
For example: create a feed-forward network with 2 inputs, 2 hidden units,and 1 output unit. Initialize all the weights to small random values (e.g., between -0.05and 0.05). So the output ou= X53 W53 + x^vi^and x53=x w3i +x w32, xS4=x w4i +x w42.As shown in Figure 5.
Figure 5. The example of Backpropagation Algorithm
Propagate the errors backward through the network:2. For each output unit k, calculate its error term <5*
3. For each hidden unit h, calculate its error term
keoutputs4. Update each network weight w,,
ji + Awji
where ^ = JJÔjXjt
The training process is shown in Figure 6.

25
ihputkyer
output layer
�- Actualoutput
correct weights ^rect weights Desifedoutput
Figure 6. The Backpropagation Algorithm

26

CHAPTER 4
TROJAN HORSES DETECTING MODEL
The information extracted from PE file cannot be used into the model of neural
network directly. The reasons are as follows:
First, there are many (more than one) sections in one PE file, and these sections are
paratactic. Therefore, the structure of these multi-dimensions will bring difficulties in
setting up the model of neural network.
Second, the values of all the inputs of the neural network must fall in the range of
0-1. But the types of attributes in the PE file are multiform. The type of some attributes is
string and the lengths of them are inequable, thus some way must be found to solve the
problem of normalization.
4.1 The difficulties in setting up models
According to chapter 2, we first organize the data in three parts, and then set up
classifiers to different parts (one classifier for each part). Finally, we combine the results of
classifiers to judge whether the file is a Trojan file or not. The process of our method is
shown in Figure 7.

28
PEFile
File Header
Section Header
SectwnBqdy
Figure7. The process of our method
The first problem mentioned at the beginning of this chapter can be explained as
how to set up the classifiers for Section header. All the attributes of each Section header are
the same and the numbers of Section headers in each file are different. According to "the
attributes of each Section header are the same", the data of each Section header is viewed
as an input data for classifier, and the desired output of the file that the Section header
belongs is taken as the desired output of section header classifier. Then these data are used
to train and test the classifier model. To solve the problem of "the numbers of Section
headers in each file are different", the highest actual output of all the Section headers
classifier in one file is used to judge whether the file is Trojan horse or not. If the classifier
judges one Section header of a file to be a Trojan horse, the file is a Trojan horse. If the
classifier judges all the Section headers of a file to be normal files, the file is a normal one.
For example, there are three files in database, and the numbers of Section headers of filel
to file3 are 2, 3, and 4. And if the classifier judges that two Section headers of filel are
Trojan horses, one of the three Section headers of file2 is Trojan horse, and all the 4 Section
headers of file3 are normal files, the filel and file2 will be judged as Trojan horse, and file3

29
will be judged as normal file.
As to the second problem raised at the beginning of this chapter, the solution to it
will be discussed in section 4.2.2.
4.2 The classifiers of the model
Owing to the complexity of the structure of the samples, we will do various
experiments in our research. However, the workload would be too large if we set up a
special model for each particular experiment and each model with a different structure. In
order to simplify our workload and shorten the time of the experiment, we setup a universal
training platform of neural network. And the structure of universal training platform can be
changed easily to suit various experiments. The changeability includes the change of the
numbers of units of input-layer and hide-layer, the usage and management of the sample
space. We created the training platform of neural network in JAVA. It is based on the BP
learning algorithm of neural network. There is one hide layer in the training platform. As
the problem of Trojan horse detecting is a question of classification, the three layers neural
network (single hide layer) can solve it [7].
DataName: Ifflfjrojan
:
TabteName P
Number trfHWel
ehead
Figure8. The interface of universal model

30
4.2.1 The classifier for the File header
The PE header (LtnageFileHeader,ImageOptionalHeader) mainly includes the three
parts of DosHeader, PEHeader and OptionalHeader. There are altogether 56 fields in the
File header, among which 31 will be insignificant to classifier model because they show no
differences between the Trojan file and the normal file when analyzed. So the other 25
fields will be enough to set up classifier model. The selected 25 fields are shown in Table 2.
All the fields of File header must be processed before being put into classifier model.
All the data in the fields (used to set up classifier model) from File header are hexadecimal
numbers. According to the distributing of their values, the data will be processed in two
ways: linearity and discretization.
If the distributing of the values is uniformity, the linearity way may be used to
process them. For example, if the value of field is within the range of [a, b], the way of
processing is:
_ Value-aToOne =
b-a
When the distributing of the values is asymmetric, discretization way should be
used to process them. Then we use user-defined function of database to implement the
processing.
31
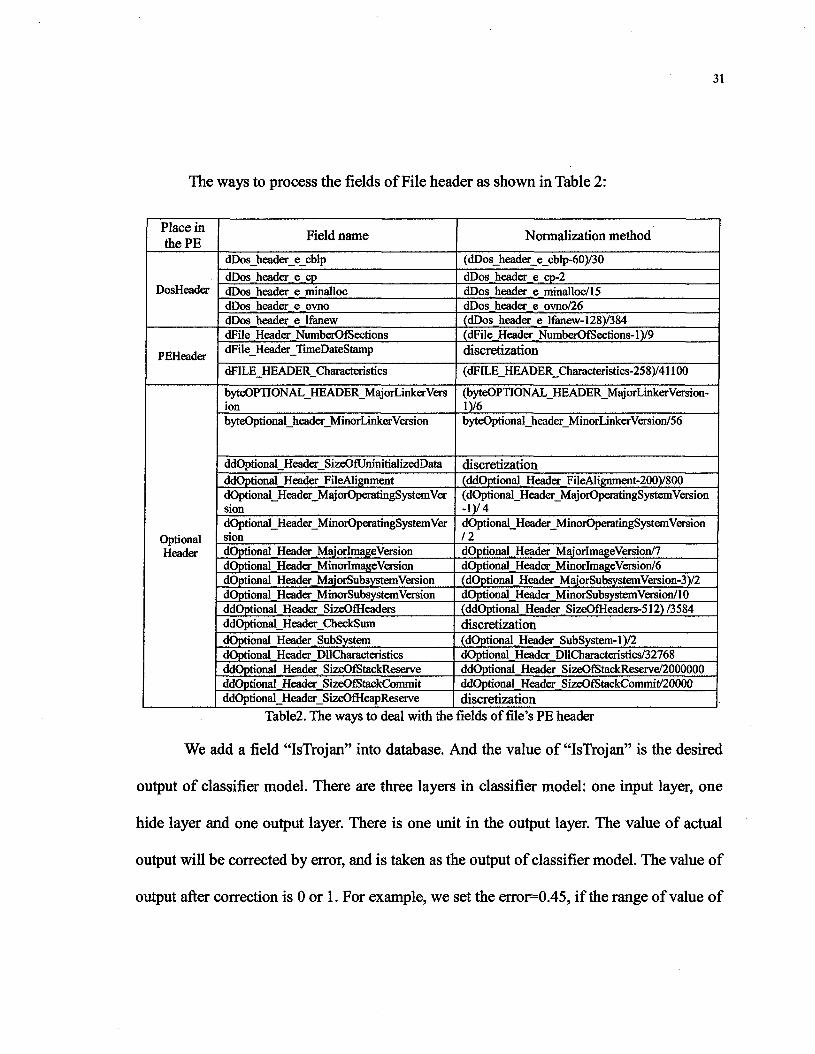
The ways to process the fields of File header as shown in Table 2:
Place inthePE
DosHeader
PEHeader
OptionalHeader
Field name
dDos_header_e_cblpdDos header e cpdDos header e minallocdDos header e ovnodDos header e lfanewdFile Header NumberOfSectionsdFileHeaderJTimeDateStamp
dFILE_HEADER_Characteristics
byteOPnONAL_HEADER_MajorLinkerVersionbyteOptional_header_MinorLinkerVersion
ddOptional_Header_SizeOfUninitializedDataddOptional Header FileAlignmentdOptional_Header_MajorOperatingSystemVersiondOptional_Header_MinorOperatingSysternVersiondOptional Header MajorlmageVersiondOptional Header MinorlmageVersiondOptional Header MajorSubsystemVersiondOptional Header MinorSubsystemVersionddOptional Header SizeOfHeadersddOptional_Header_CheckSumdOptional Header SubSystemdOptional Header DHCharacteristicsddOptional Header SizeOfStackReserveddOptional Header SizeOfStackCommitddOptional_Header_SizeOfHeapReserve
Normalization method
(dDos_header_e_cblp-60)/30dDos header e cp-2dDos header e minalloc/15dDos header e ovno/26(dDos header e lfanew-128)/384(dFile Header NumberOfSections-1)/9discretization
(dFILE_HEADER_Characteristics-258)/41100
(byteOPHONAL HEADER MajorLinkerVersion-l)/6byteOptional_header_MinorLinkerVersion/56
discretization(ddOptional Header FileAlignment-200)/800(dOptional Header MajorOperatingSystemVersion-l) /4dOptional Header MinorOperatingSystemVersion11dOptional Header MajorImageVersion/7dOptional Header MinorImageVersion/6(dOptional Header MajorSubsystemVersion-3)/2dOptional Header MinorSubsystem Version/10(ddOptional Header SizeOfHeaders-512)/3584discretization(dOptional Header SubSystem-1)/2dOptional Header DHCharacteristics/32768ddOptional Header SizeOfStackReserve/2000000ddOptional Header SizeOfStackCommit/20000discretization
Table2. The ways to deal with the fields of file's PE header
We add a field "IsTrojan" into database. And the value of "IsTrojan" is the desired
output of classifier model. There are three layers in classifier model: one input layer, one
hide layer and one output layer. There is one unit in the output layer. The value of actual
output will be corrected by error, and is taken as the output of classifier model. The value of
output after correction is 0 or 1. For example, we set the error=0.45, if the range of value of

32
the actual output is [-0.45, 0.45], the value of output will be corrected to 0. And if the range
of value of the actual output is [0.55,1.45], the value of output will be corrected toi. If the
value of output is 0, this file is to be judged as normal file, and if the value of output is 1,
the file is a Trojan file.
hi the input layer, the values of the 25 fields are the input of classifier model, so
there are 25 units in the input layer.
In the hide layer, from the experienced formula:
Number of units in hide layer= ^numberofunitininput * numberofunitinoutput [7]
So the number of units in hide layer is about 5. Then we make experiments to
establish the best structure of model.
Experiment parameters :the number of units in input layer is 25, the number of units
in output layer is 1, the total number of samples is 299, and the number of samples to train
the model is 200, error=0.45, learning=0.001, train times is 2000.
~~~~~�^̂ ^ ParametersTimes~"*--~-~^_^
123456789
Number of units inhide layer
2345678910
Recognition rate for train(average) (%)
47.545.542.545.2547.548.7547.7547.547.5
Table3. Establish the best structure of model of file header
The entire model is not convergent. We make the following assumption to the
mam reasons.

33
First, the algorithm needs to be optimized.
Second, using all of the many attributes in this layer is not likely to produce a
satisfactory result in setting up a model. So we should select some important attributes to
set up the model in order to raise the Recognition rate of model.
Optimization of the BP learning algorithm
The back propagation (BP) algorithm is a systematic method for training multilayer
neural networks. It has many drawbacks despite many successful applications of back
propagation. As to many complex problems, it may require a long time to train the
networks, and it may even not train at all. Long training time can be the result of the
non-optimal parameters [7]. It is not easy to choose appropriate value of the parameters for
a particular problem [7].
By now, there are many ways to optimize the BP learning algorithm, some of
which will be selected to optimize classifier model. Now take the experiment of file's PE
header as an example to introduce the improvement after optimizing the BP learning
algorithm.
1. Adjust the initial weight of model
Adjust the initial weight to every nerve cell work at the place where the transfer
function has the most sensitivity. The method is: firstly to adjust the weights of hide layer to
an enough small value, and then to adjust the range of weights of output layer from [-1, +1]

34
to [-0.5, +0.5] [7].
Train the model after adjusting the initial weight. The experimental data as shown
in following Table4:
~~~~---̂ ^ Parameter
Times ^ " " - \123456789
Structure
25-2-125-3-125-4-125-5-125-6-125-7-125-8-125-9-125-10-1
Recognition rate fortrain (%)
(Before optimize)47.545.542.545.2547.548.7547.7547.547.5
Recognition rate fortrain (%)
(After optimize)54.7552.5048.5049.7555.5060.2552.5055.7552.50
Table4. The experimental result of file's PE header after adjust the initial weight of model
2. Add the momentum
Trains the model after adding the momentum. The experimental data as shown in
following Table 5:
~^"-\^^ Parameters ^ ^ " - \ ^ ^Times ^"""-"--̂
123456789
Structure
25-2-125-3-125-4-125-5-125-6-125-7-125-8-125-9-1
25-10-1
Recognition ratefor train (%)
(Before optimize)54.7552.5048.5049.7555.5060.2552.5050.7552.50
Recognition ratefor train (%)
(After optimize)53.7553.5057.5059.5057.2562.7555.5053.2551.75
Table5. The experimental result of file's PE header after add momentum
From the experiment, the advanced capability of the neural network after being
optimized is illustrated. But the recognition rate for training the model is lower. The highest

35
recognition rate for training the model is 62.75%. Then some more important attributes will
be selected to set up models.
We use ID3 algorithm of decision tree to select the more important attributes. We
figure out the information gain and entropy of the attributes, and select the attributes by
comparing the information gain and entropy. Then we set up model with selected attributes
that get the best result. After repeated experiments, 10 attributes are selected to setup
classifier model.
To establish the best structure of model: Experiment parameters : the number of
units in input layer is 10, number of units in output layer is 1, total number of samples is
299, number of samples to train the model is 200, error=0.45, learning=0.001, train times is
2000.
~~~"�-̂ ^^ Parameters ^ ^Times ^~~-~^
12345678
Structure
10-2-110-3-110-4-110-5-110-6-110-7-110-8-110-9-1
Recognition rate fortrain (%)
70.7670.8371.772.0173.6871.8471.7770.56
Table6. Establish the best structure of model of file's PE header
The highest recognition rate is "73.68", so the structure 10-6-1 is selected as the
structure of classifier model. Then test the model.
Experiment parameters : The structure of model is 10-6-1, the total number of
samples is 299, the number of samples to train the model is 200, the number of samples to

36
test the model is 99,error=0.45.
^\JjJarametersTimes\^^
12345
Learning
O.OO10.0010.0010.0010.05
Train times
20001000800600800
Recognition ratefor train (%)
81.5082.8082.0076.7577.50.
Recognition ratefor test (%)
42.4262.4268.6561.6067.64
Table7. The last results of model of file's PE headerNow the classifier of File header has been set up. The capability of model has
become stronger after being optimized. Then the classifier for the other part will be set up.
4.2.2 The classifier for the Section header
There are fewer attributes in section header, and among them, only 7 values of
attributes are unfixed, all the others being fixed.
In section header, the type of field named d8SECTION_HEADER_name is string.
Its most length is 8. Now we come to the problem mentioned at the beginning of this
chapter.
If we use the ASCII to solve the problem of normalization, then the value of 8
strings of one field is F (al, a2, a3, a4, a5, a6, a7, a8), and the range of a.\ is [0,255]. So the
value of 8 strings must reach the precision of 2568, it is very difficult for computer.
If we only select the fixed initiatory several strings, the different value of fields will
become the same value after pretreatment, and the distributing cannot distribute uniformity.
This may cause problem when we train the model and may even lead to failure for training
model. So it is not suitable to use the ASCII to solve the problem of normalization.
Since the values of inputs must be in the area [0.1], and the value of probability
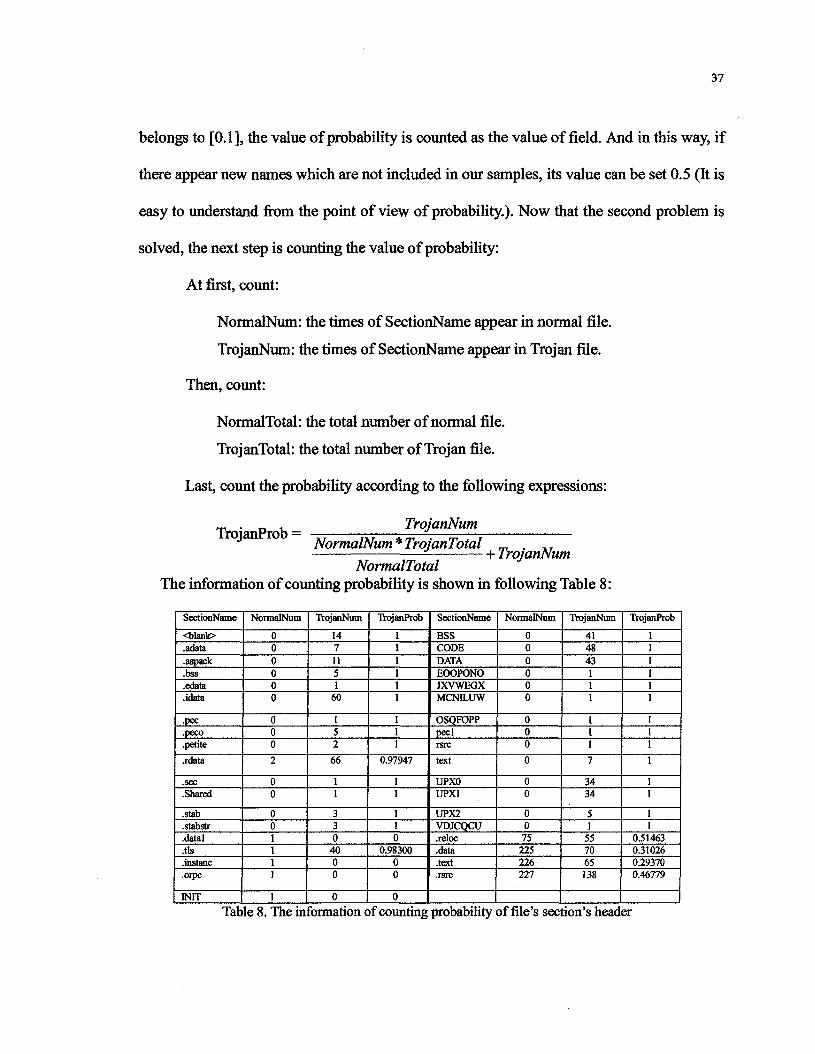
37
belongs to [0.1], the value of probability is counted as the value of field. And in this way, if
there appear new names which are not included in our samples, its value can be set 0.5 (It is
easy to understand from the point of view of probability). Now that the second problem is
solved, the next step is counting the value of probability:
At first, count:
NormalNum: the times of SectionName appear in normal file.
TrojanNum: the times of SectionName appear in Trojan file.
Then, count:
NormalTotal: the total number of normal file.
TrojanTotal: the total number of Trojan file.
Last, count the probability according to the following expressions:
TrojanProb =TrojanNum
NormalNum * TrojanTotal+ TrojanNum
NormalTotalThe information of counting probability is shown in following Table 8:
SectionName
<blank>.adata.aspack.bss.edata.idata
.pec
.peco
.petite
.rdata
.sec
.Shared
.stab
.stabstr
.datai
.tls
.instanc
.orpc
INIT
NormalNum
000000
000
2
00
001111
1
TrojanNum
1471151
60
152
66
11
3304000
0
TrojanProb
111111
111
0.97947
11
110
0.9830000
0
SectionName
BSSCODEDATAEOOPONOJXVWEGXMCNILUW
OSQFOPPpeelrsrc
text
UPX0UPXI
UPX2VDJCQCU.reloc.data.text.rerc
NormalNum
000000
000
0
00
0075225226227
TrojanNum
414843111
111
7
3434
51
557065138
TrojanProb
1
0.514630.310260.293700.46779
Table 8. The information of counting probability of file's section's header

38
The ways of other field's normalization are shown in Table 9:
Field nameddSECTION HEADER MiseddSECTION_HEADER_VirtualAddress
ddSECTION HEADER SizeOfRawDataddSECTION_HEADER_PointerToRawData
ddSECTION_HEADER_PointerToRelocations
ddSECTION_HEADER_PointerToLmenumbers
Normalization methodddSECTION HEADER Misc/19688132.0ddSECTION_HEADER_VirtualAddress /20004864.0
ddSECTION HEADER SizeOfRawData/1339392.0ddSECnON_HEADER_PointerToRawData /1343488.0
ddSECTION_HEADER_PointerToRelocations/12800606.0
ddSECTION_HEADER_PointerToLinenumbers/5152.0
Table 9. The ways to deal with the other fields of section's header
Now the classifier for the Section header will be set up. For the input layer: seven
fields are established to setup model. The names of fields are shown in Table 5. For the hide
layer: From the experienced formula:
Number of units in hide layer= yjnumberofunitininput * numberofunitinoutput [7]
The number of units in hide layer is about 3. Then we make the experiments to
establish the best structure of model.
Experiment parameters : the number of units in input layer is 7, the number of units
in output layer is 1, the total number of samples is 1336, the number of samples to train the
model is 1000, error=0.45, learning=0.001, train times is 2000.
- - ^ ^ ^ ParametersTimes"""----^^^
12345678
Number of units inhide layer
23456789
Recognition rate fortrain (%)(average)
73.7572.5567.6375.94
69.5070.6572.5069.24
Table 10. Establish the best structure of model of file's section' header

39
From the experiment above, the highest recognition rate is 75.94%. So the structure
7-5-1 is selected as the structure of our model. Then the model will be tested.
Experiment parameters : The structure of model is 7-5-1, the total number of
samples is 1336, the number of samples to train the model is 1000, the number of samples
to test the model is 366, error=0.45.
""""�-^ParametersT imes" - \^^
123
Learning
0.0010.0010.05
Traintimes
200010001000
Recognitionrate for train
(%)75.5077.2576.50
Recognitionrate for test
(%)62.7568.6766.58
Table 11. The last results of model of file's section's header
4.2.3 The classifier for the Section body
As the names and numbers of attributes of each section body are different, we
cannot find the common attributes of section bodies. The problem would be solved if we
made experiments on each section body respectively. However, this would lead to too
heavy workload. On the other hand, as it is a general opinion that if one can process one
Section body, he can process the other Section bodies, we decide to conduct experiment of
one section body: import section.
It is the most complex part of all the work to deal with this one field of import
section: import function name.
Import Section structure features.
Import Section include 2 layers :
Import Files�> Import Function, as shown in Figure 9 :

40
InsportFiie name
keraeBl-dîi
keme!32.dïi
kernei32.diî
k«raeB2.dïl
us�r32.dB
nser32.dK
usar32.d2
ussr32.dtt
lasportFtiQctEoa name
GeSFifeSizs
GetSyslemTime
GeîFilelype
CreateFileA
OoseHaodte
GetKeyîîoardiype
LoadSinsgA
MessageBoxA
OarNextA
Figure9. Import Section examples
For the field of import file name, the way used in the model of file's section header
can be used to calculate the probability as the value of field.
When we calculate the probability of Import Function in the same way as we used
in the model of file's section header, we get the following situation:
The total number of function file used: 46652
The total number of function file ( not repeated ) used: 4792
The repeated rate: ( 4 6 6 5 2 4 7 4 9> = 89.82%46652
If there are 10 import Files in the PE file and there are about 100 import functions in
every import File, then it will match 10*100*4792=4792000 times, the efficiency is too low.
And there are 4792 functions which need to be calculated. It is too difficulty to calculate all
the 4792 functions. And these 4792 functions are not all the functions. If there are some
new functions, the probability cannot be calculated by this way. So this method cannot be

41
used to solve the question.
After repeated experiments, we get the most effective method - as every function
consists of several words, we count these words with the same method that we count the
section name. The total number of words (not repeated) is 2375. Then the probability of
these words will be calculated, and then we use average value of the probability of words to
calculate the probability of Import function name.
The ways of other field's normalization as shown in Tablel2:
Field namedIMPORT DESCRIPTOR OriginalFirstThunkdMPORT DESCRIPTOR TimeDateStampdIMPORT DESCRIPTOR ForwarderChaindIMPORT DESCRIPTOR FirstThunk
Normalization methoddIMPORT DESCRIPTOR OriginalFirstThunk/20001512.0Int(dIMPORT DESCRIPTOR TimeDateStamp) +1Int(dIMPORT DESCRIPTOR ForwarderChain) +1dIMPORT DESCRIPTOR FirstThunk /20002288.0
Table 12. The ways to deal with the other fields of import section
Next, we setup the classifier. In the input layer, all the 6 fields are determined to set
up model. They are import file name, import function and the other four fields. The names
of the other four fields are shown in Table 7. In the hide layer, from the experienced
formula:
Number of units in hide layer= ^numberofunitininput * numberofunitinoutput [7]
The reasonable calculation of the number of units in hide layer is about 3. Then
experiments are made to establish the best structure of model.
Experiment parameters : The number of units in input layer is 6, the number of units
in output layer is 1, the total number of samples is 1300, the number of samples to train the
model is 1000, error=0.45, learning=0.001, train times is 2000.

42
�--^ParametersTimes ^ ^ ~ ~ - \ ^
12345678
Structure
6-2-16-3-16-4-16-5-16-6-16-7-16-8-16-9-1
Recognition ratefor train (%)
53.6758.5662.5665.5659.4461.8962.1252.56
Table 13. Establish the best structure of model of file's import section
From the Table above, the structure of model, 6-5-1, is established. Then the model
will be tested:
Experiment parameters: structure is 6-5-1, the total number of samples is 1300, the
number of samples to train the model is 1000, the number of samples to test the model is
300, error=0.45.
"^"-^ParametersT i m e s \ ^ ^
123
Learning
0.0010.0010.05
Traintimes
200010001000
Recognitionrate for train
(%)66.5067.2565.75
Recognitionrate for test
(%)58.5566.3365.50
Table 14. The last results of model of file's import section
The classifiers for each part have been set up, and then the results of classifiers will
be combined to judge whether the file is Trojan horse or not. The particulars of combining
the results of classifiers are presented in Chapter 5.

CHAPTER 5
COMBINING THE RESULTS OF CLASSIFIERS
5.1 The capabilities of classifiers
The classifiers set up in chapter 4 are shown in Table 15.
Num
1
2
3
Name
Classifier 1
Classifier 2
Classifier 3
Place in File
File header
Section header
Section body
Recognition ratefor train
82.00%
77.25%
67.25%
Recognition ratefor test
68.65%
68.67%
66.33%
Table 15. The capabilities of classifiers
Now that the classifiers for each part are set up, the results should be combined to
judge whether the file is Trojan horse or not.
5.2 To judge the Trojan horse
In the experiments, the outputs of classifiers for each part are the value after
correcting. The "error" is used to correct the actual outputs. But in the experiments to
combine the results of classifiers, the actual outputs of classifiers are accepted as the results
of classifiers to judge whether the file is Trojan horse or not.
The methods, which will be used to combine the results of classifier, are weighted

44
mean, unweighted mean and majority voting. As to the method of weighted mean, a model
of two layers neural network (one input layer and one output layer)will be set up to
establish the weights. The data used to train and test the model are the three results (actual
output) of the three classifiers. And the best result is shown in following Table 16.
The classifiers
Classifier 1
Classifier 2
Classifier 3
method to combine
weighted mean
Weighting
0.414
0.389
0.213
Recognition rate
76.67%
Table 16. The best result of method of weighted mean
For the method of unweighted mean, the average of three results (actual output) of
classifiers is calculated directly, and the average is used to judge whether a file is Trojan
horse. In this experiment , the key factor affecting the Recognition rate is the "dividing
point" that is used to judge. The "dividing point" is a value which is used to distinguish the
Trojan horses from a normal file. If the average is higher than the "dividing point", then the
file is Trojan horse, and if the average is less than "dividing point", the file is a normal file.
And when we set the value of "dividing point" in the range of [5.5, 6], it will get better
Recognition rate. In the experiment, the best Recognition rate is gotten when the value of
"dividing point" is 5.67. And the best result is shown in following Table 17.

45
The classifiers
Classifier 1
Classifier 2
Classifier 3
method to combine
unweighted mean
Recognition rate
74.66%
Table 17. The best result of method of unweighted mean
With the method of majority voting, a file can be judged as Trojan horse if more
than two classifiers judge it to be a Trojan. In the same way, a file will be a normal file if
more than two classifiers judge it to be a normal one. The result is shown in the following
Table 18.
The classifiers
Classifier 1
Classifier 2
Classifier 3
method to combine
majority voting
Recognition rate
71.54%
Table 18. The result of method of majority voting
The results of different way to combine the classifiers are shown in Table 19:
Num
1
2
3
Way to combine
weighted mean
unweighted mean
majority voting
Recognition rate
76.67%
74.66%
71.54%
Table 19. The results of different way to combine the classifiers

46
The highest recognition rate is 76.67%. Though we try hard and the recognition rate
has been raised greatly, but the last result is not good enough. We think the main reason is
that the capabilities of classifiers for each part are not good enough. All the Recognition
rates of classifiers are below 70%.
In Table 19, it is obvious that the result of the method of weighted mean is better
than the result of the method of unweighted mean, while the result of method of
unweighted mean is better than the result of the method of majority voting. It indicates that
the effects (to judge the Trojan horse) of different part of FE file are different, and in our
model the File header is the more important part to judge the Trojan horse.

CHAPTER 6
CONCLUSION
6.1 Summary
In conclusion, as traditional detection techniques have limitations in detecting
Trojan horse [2] [19], new ways of detecting Trojan horse must be established to solve the
problem which have posed a huge security threat to computer network. In this thesis, we
present a new method to detect Trojan horse by analyzing a file's static characteristics. This
new method can detect all the Trojan horses. Considering about 75% of world's personal
computer install the Microsoft Windows [4] and Trojan horse usually exists as a Portable
Executable (PE) file in Windows platform, we take PE format as our subject, then we
extract the static information of files according to PE format, and finally we use the neural
network to analyze the static information. We setup models as classifiers to judge whether a
PE file is a Trojan horse or not. By dividing the data of PE file in three groups, we solve the
problem caused by the structure of PE file in setting up the model of neural network. As we
divide the data in three groups, we setup classifier for each group. At last we combine the
results of classifiers to judge whether the file is Trojan file or not. And with the model, we
can detect the unknown Trojan horse by analyzing static characteristics of file. We verify
our results by the information that is not used during training (i.e., the files to which the

48
information belongs is new and unknown to our model).The final results are as follows:
The classifiers for different parts of PE file are shown in following Table.
Num
1
2
3
Name
Classifier 1
Classifier 2
Classifier 3
Place in File
File header
Section header
Section body
Recognition ratefor train (%)
82.00
77.25
67.25
Recognition ratefor test (%)
68.65
68.67
66.33
Table 15. The classifier of three parts
The results of different methods to combine the classifiers are shown in following
Table.
Num
1
2
3
The classifiers
Classifier 1
Classifier 2
Classifier 3
Classifier 1
Classifier 2
Classifier 3
Classifier 1
Classifier 2
Classifier 3
Way to combine
weighted mean
unweighted mean
majority voting
Weighting
0.414
0.389
0.213
0.333
0.333
0.333
Recognition rate
76.67%
74.66%
71.54%
Table 20. The results of different method to combine the classifiers (particular)
49
The highest recognition rate is 76.67%. Though we try hard and the recognition rate
has been raised greatly, the last result is not good enough. We think the main reason is that
the capabilities of classifiers for each part are not good enough. The Recognition rates of
classifiers are less than 70% all. So we should try to raise the recognition rate of classifiers
of each part.
6.2 The future works
As time is limited and the workload very large, the work we did are far from enough.
In the future we should endeavor in the following aspects:
*v" Try other methods of intelligent information processing technique. There are
many methods which can solve the problem of classification. Try other methods
or use other methods to assist neural network in more links of experiments. It
will get better results.
�$� Try to optimize the BP learning algorithm. We only use some basic ways to
optimize the algorithm, which may partly explain why the results of our
classifiers are not good enough. Try more ways to optimize the algorithm in
order to get better results.
*�� Try more ways of pretreatment of input data. The pretreatment of input data can
decide whether the experiment can be successful, and it is a difficult problem in
our works. Trying more solving ways will help our work greatly.
-^ Increase the number of samples. The number of samples of models is small,
such as the models of file header which have many units of input layer,
Sufficient samples avail us to find more important attributes and parts of the PE
file for detecting Trojan horse.

50
References
[1] Bishop, CM (1996). Neural networks for pattern recognition.
[2] Ccidnet. The overall analysis of Trojan horse. Date posted in ITsecvirity.com: 10 sep2004 (in Chinese)
[3] Chellappa, R., Fukishima, K., Katsaggelos, A., Kung, S-Y., LeCun, Y., Nasrabadi, N. M.and Poggio, T. A., "Applications of artificial neural networks to image processing." IEEETransactions on Image Processing, vol. 7, no. 8, Aug. 1998.
[4] Eleazar Eskin, Matthew G. Schultz, Erez Zadok, and Salvatore J. Stolfo "Learning toDetect New and Unknown Malicious Programs" 2004 Computer Science Department,Columbia University.
[5] Fred Cohen. A Short Course on Computer Viruses. ASP Press, 1990.
[6] Gerald Tesauro, Jeffrey O. Kephart, Gregory B. Sorkin, "Neural Networks for ComputerVirus Recognition." High Integrity Computing Laboratory IBM Thomas J. WatsonResearch Center IEEE Expert, vol. 11, no. 4, August 1996
[7] Han Liqun {The theory , design and application of artificial neural network^ ISBN:7-5025-3354-0 2002.1 (in Chinese)
[8] J.E. Dickerson, J. Juslin*, O. Koukousoula*, J.A. Dickerson, "Fuzzy intrusiondetection," IFSA World Congress and 20th North American Fuzzy Information ProcessingSociety (NAFIPS) International Conference, Vancouver, British Columbia, Volume 3,1506-1510, July, 2001.
[9] LeCun, Y, Boser, B., Denker, J. S., Henderson, D., Howard, R. E., Hubbard, W. andJackel, L. D., "Backpropagation Applied to Handwritten Zip Code Recognition." NeuralComputation, vol. 1, no. 4, 1989.
[10] LeCun, Y and Bengio, Y, "Pattern Recognition and Neural Networks" in TheHandbook of Brain Theory and Neural Networks, Arbib, M. A. (Ed.), MIT Press, 1995.
51
[11] Matt Pietrek. An In-Depth Look into the Win32 Portable Executable File Format.February 2002 MSDN
[12] Matt Pietrek. Peering Inside the PE: A Tour of the Win32 Portable Executable FileFormat. March 1994 msdn.microsopft.com
[13] Michael (Micha) Shafir. Are WEB applications Trojan horses? 9 July 2002
[14] Microsoft. Microsoft Portable Executable and Common Object File FormatSpecification Microsoft Corporation Revision 6.0. February 1999
[15] Mihai Christodorescu, Somesh Jha. Static Analysis of Exécutables to Detect MaliciousPatterns. Computer Sciences Department University of Wisconsin, Madison, 2003.
[16] Michael Weber, Matthew Schmid & Michael Schatz Cigital, Inc. A toolkit fordetecting and analyzing malicious software. Dulles, VA 20166. 2002
[17] National Infrastructure Security Co-Ordination Centre Trojan Horse Programs andRootkits. NISCC Technical Note 08/03
[18] Prasad Dabak, Milind Borate, Sandeep Phadke. Portable Executable File Format.October 1999
[19] Rising. Introduce of Trojan horse, Date posted in rising.com: Dec 2002 (in Chinese)
[20] Randy Kath. The Portable Executable File Format from Top to Bottom. MicrosoftDeveloper Network Technology Group (MSDN)
[21] Sackinger, E., Boser, B., Bromley, J., LeCun, Y. and Jackel, L. D., "Application of theANN Neural Network Chip to High-Speed Character Recognition." IEEE Transaction onNeural Networks, vol. 3, no. 2, March, 1992.
[22] Solla, S. and LeCun, Y., "Constrained Neural Networks for Pattern Recognition"Neural Networks: Concepts, Applications and Implementations Vol IV, Antognetti, P. andMilutinovic, V. (Ed.), Prentice Hall, 1991.
[23] Steven M. Beattie, Andrew P. Black, Crispin Cowan, Calton Pu, Lateef P. Yang.Guardhouse: Locking the Stable door ahead of the Trojan horse. Department of ComputerScience & Engineering, Oregon Graduate Institute of Science & Technology. 1999
[24] Tom M.Mitchell. {Machine Learning} ISBN: 0070428077 Publisher: McGraw-Hill
Science/Engineering/Math; (March 1,1997)

52