UAE bAnking sEctormec.biz/term/uploads/UAEBankingSector_05012010.pdf · 2010. 1. 7. · January 05,...
31
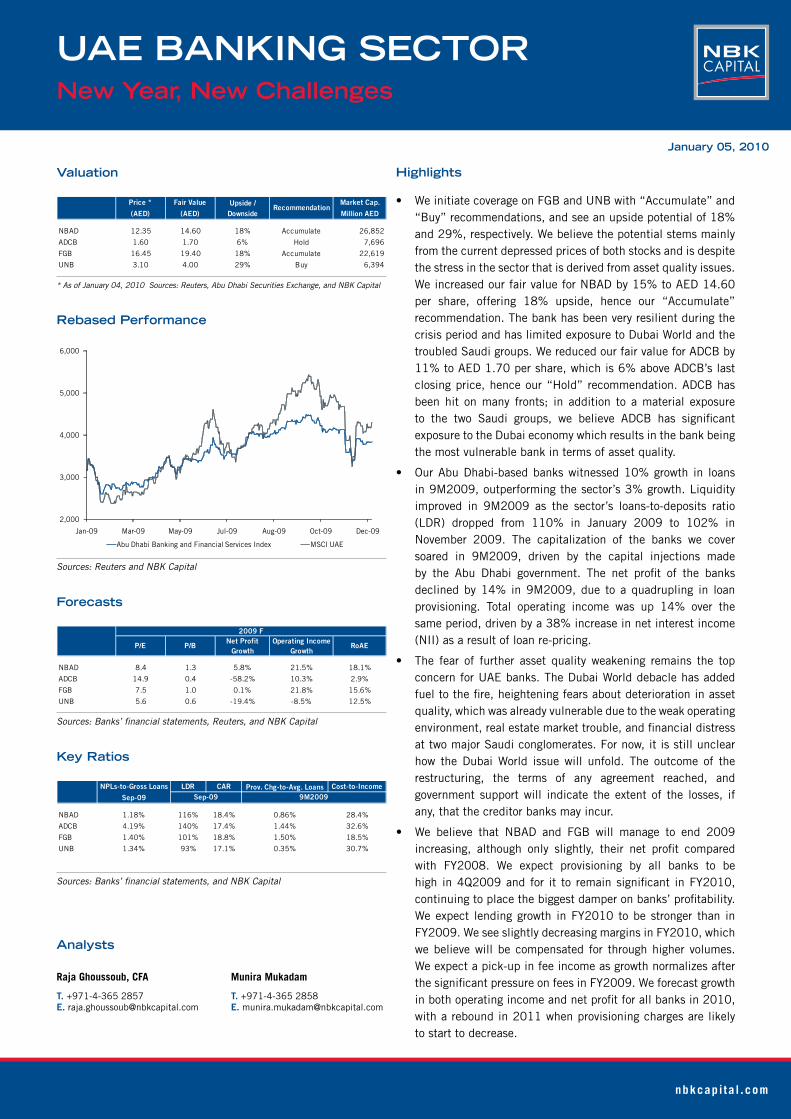
January 05, 2010 nbkcapital.com UAE BANKING SECTOR New Year, New Challenges Analysts Raja Ghoussoub, CFA T. +971-4-365 2857 E. [email protected] Munira Mukadam T. +971-4-365 2858 E. [email protected] Valuation Price * Fair Value Upside / Market Cap. (AED) (AED) Downside Million AED NBAD 12.35 14.60 18% Accumulate 26,852 ADCB 1.60 1.70 6% Hold 7,696 FGB 16.45 19.40 18% Accumulate 22,619 UNB 3.10 4.00 29% Buy 6,394 Recommendation * As of January 04, 2010 Sources: Reuters, Abu Dhabi Securities Exchange, and NBK Capital Rebased Performance 2,000 3,000 4,000 5,000 6,000 Jan-09 Mar-09 May-09 Jul-09 Aug-09 Oct-09 Dec-09 Abu Dhabi Banking and Financial Services Index MSCI UAE Sources: Reuters and NBK Capital Forecasts Net Profit Operating Income Growth Growth NBAD 8.4 1.3 5.8% 21.5% 18.1% ADCB 14.9 0.4 -58.2% 10.3% 2.9% FGB 7.5 1.0 0.1% 21.8% 15.6% UNB 5.6 0.6 -19.4% -8.5% 12.5% RoAE P/E P/B 2009 F Sources: Banks’ financial statements, Reuters, and NBK Capital Key Ratios NPLs-to-Gross Loans LDR CAR Prov. Chg-to-Avg. Loans Cost-to-Income Sep-09 NBAD 1.18% 116% 18.4% 0.86% 28.4% ADCB 4.19% 140% 17.4% 1.44% 32.6% FGB 1.40% 101% 18.8% 1.50% 18.5% UNB 1.34% 93% 17.1% 0.35% 30.7% Sep-09 9M2009 Sources: Banks’ financial statements, and NBK Capital Highlights • We initiate coverage on FGB and UNB with “Accumulate” and “Buy” recommendations, and see an upside potential of 18% and 29%, respectively. We believe the potential stems mainly from the current depressed prices of both stocks and is despite the stress in the sector that is derived from asset quality issues. We increased our fair value for NBAD by 15% to AED 14.60 per share, offering 18% upside, hence our “Accumulate” recommendation. The bank has been very resilient during the crisis period and has limited exposure to Dubai World and the troubled Saudi groups. We reduced our fair value for ADCB by 11% to AED 1.70 per share, which is 6% above ADCB’s last closing price, hence our “Hold” recommendation. ADCB has been hit on many fronts; in addition to a material exposure to the two Saudi groups, we believe ADCB has significant exposure to the Dubai economy which results in the bank being the most vulnerable bank in terms of asset quality. • Our Abu Dhabi-based banks witnessed 10% growth in loans in 9M2009, outperforming the sector’s 3% growth. Liquidity improved in 9M2009 as the sector’s loans-to-deposits ratio (LDR) dropped from 110% in January 2009 to 102% in November 2009. The capitalization of the banks we cover soared in 9M2009, driven by the capital injections made by the Abu Dhabi government. The net profit of the banks declined by 14% in 9M2009, due to a quadrupling in loan provisioning. Total operating income was up 14% over the same period, driven by a 38% increase in net interest income (NII) as a result of loan re-pricing. • The fear of further asset quality weakening remains the top concern for UAE banks. The Dubai World debacle has added fuel to the fire, heightening fears about deterioration in asset quality, which was already vulnerable due to the weak operating environment, real estate market trouble, and financial distress at two major Saudi conglomerates. For now, it is still unclear how the Dubai World issue will unfold. The outcome of the restructuring, the terms of any agreement reached, and government support will indicate the extent of the losses, if any, that the creditor banks may incur. • We believe that NBAD and FGB will manage to end 2009 increasing, although only slightly, their net profit compared with FY2008. We expect provisioning by all banks to be high in 4Q2009 and for it to remain significant in FY2010, continuing to place the biggest damper on banks’ profitability. We expect lending growth in FY2010 to be stronger than in FY2009. We see slightly decreasing margins in FY2010, which we believe will be compensated for through higher volumes. We expect a pick-up in fee income as growth normalizes after the significant pressure on fees in FY2009. We forecast growth in both operating income and net profit for all banks in 2010, with a rebound in 2011 when provisioning charges are likely to start to decrease.
Transcript of UAE bAnking sEctormec.biz/term/uploads/UAEBankingSector_05012010.pdf · 2010. 1. 7. · January 05,...
January 05, 2010
nbkcapi ta l .com
UAE bAnking sEctornew Year, new challenges
Analysts
Raja Ghoussoub, CFA
T. +971-4-365 2857E. [email protected]
Munira Mukadam
T. +971-4-365 2858E. [email protected]
Valuation
Price * Fair Value Upside / Market Cap.
(AED) (AED) Downside Million AED
NBAD 12.35 14.60 18% Accumulate 26,852
ADCB 1.60 1.70 6% Hold 7,696
FGB 16.45 19.40 18% Accumulate 22,619
UNB 3.10 4.00 29% Buy 6,394
Recommendation
* As of January 04, 2010 Sources: Reuters, Abu Dhabi Securities Exchange, and NBK Capital
rebased Performance
2,000
3,000
4,000
5,000
6,000
Jan-09 Mar-09 May-09 Jul-09 Aug-09 Oct-09 Dec-09
Abu Dhabi Banking and Financial Services Index MSCI UAE
Sources: Reuters and NBK Capital
Forecasts
Net Profit Operating IncomeGrowth Growth
NBAD 8.4 1.3 5.8% 21.5% 18.1%
ADCB 14.9 0.4 -58.2% 10.3% 2.9%
FGB 7.5 1.0 0.1% 21.8% 15.6%
UNB 5.6 0.6 -19.4% -8.5% 12.5%
RoAEP/E P/B
2009 F
Sources: Banks’ financial statements, Reuters, and NBK Capital
key ratios
NPLs-to-Gross Loans LDR CAR Prov. Chg-to-Avg. Loans Cost-to-Income
Sep-09
NBAD 1.18% 116% 18.4% 0.86% 28.4%
ADCB 4.19% 140% 17.4% 1.44% 32.6%
FGB 1.40% 101% 18.8% 1.50% 18.5%
UNB 1.34% 93% 17.1% 0.35% 30.7%
Sep-09 9M2009
Sources: Banks’ financial statements, and NBK Capital
Highlights
• We initiate coverage on FGB and UNB with “Accumulate” and “Buy” recommendations, and see an upside potential of 18% and 29%, respectively. We believe the potential stems mainly from the current depressed prices of both stocks and is despite the stress in the sector that is derived from asset quality issues. We increased our fair value for NBAD by 15% to AED 14.60 per share, offering 18% upside, hence our “Accumulate” recommendation. The bank has been very resilient during the crisis period and has limited exposure to Dubai World and the troubled Saudi groups. We reduced our fair value for ADCB by 11% to AED 1.70 per share, which is 6% above ADCB’s last closing price, hence our “Hold” recommendation. ADCB has been hit on many fronts; in addition to a material exposure to the two Saudi groups, we believe ADCB has significantexposure to the Dubai economy which results in the bank being the most vulnerable bank in terms of asset quality.
• Our Abu Dhabi-based banks witnessed 10% growth in loans in 9M2009, outperforming the sector’s 3% growth. Liquidity improved in 9M2009 as the sector’s loans-to-deposits ratio (LDR) dropped from 110% in January 2009 to 102% in November 2009. The capitalization of the banks we cover soared in 9M2009, driven by the capital injections made by the Abu Dhabi government. The net profit of the banksdeclined by 14% in 9M2009, due to a quadrupling in loan provisioning. Total operating income was up 14% over the same period, driven by a 38% increase in net interest income (NII) as a result of loan re-pricing.
• The fear of further asset quality weakening remains the top concern for UAE banks. The Dubai World debacle has added fueltothefire,heighteningfearsaboutdeteriorationinassetquality, which was already vulnerable due to the weak operating environment,realestatemarkettrouble,andfinancialdistressat two major Saudi conglomerates. For now, it is still unclear how the Dubai World issue will unfold. The outcome of the restructuring, the terms of any agreement reached, and government support will indicate the extent of the losses, if any, that the creditor banks may incur.
• We believe that NBAD and FGB will manage to end 2009 increasing, although only slightly, their net profit comparedwith FY2008. We expect provisioning by all banks to be high in4Q2009and for it to remainsignificant inFY2010,continuingtoplacethebiggestdamperonbanks’profitability.We expect lending growth in FY2010 to be stronger than in FY2009. We see slightly decreasing margins in FY2010, which we believe will be compensated for through higher volumes. We expect a pick-up in fee income as growth normalizes after thesignificantpressureonfeesinFY2009.Weforecastgrowthinbothoperatingincomeandnetprofitforallbanksin2010,with a rebound in 2011 when provisioning charges are likely to start to decrease.

Banking Sector - UAEJanuary 05, 2010
nbkcapi ta l .com | 2
contEnts
sEctor HigHligHts .............................................................................. 3
Lending and Deposit Growth ................................................................................. 3
Liquidity ............................................................................................................... 5
Capitalization ........................................................................................................ 6
Earnings ............................................................................................................... 7
Cost Efficiency ................................................................................................... 10
Asset Quality .......................................................................................... 11
nAtionAl bAnk oF AbU dHAbi (nbAd)............................................. 15
AbU dHAbi commErciAl bAnk (Adcb) ............................................. 16
First gUlF bAnk (Fgb) ....................................................................... 17
Union nAtionAl bAnk (Unb) ............................................................. 21
FinAnciAl stAtEmEnts ..................................................................... 25
Banking Sector - UAEJanuary 05, 2010
nbkcapi ta l .com | 3
sEctor HigHligHts
lending and deposit growth
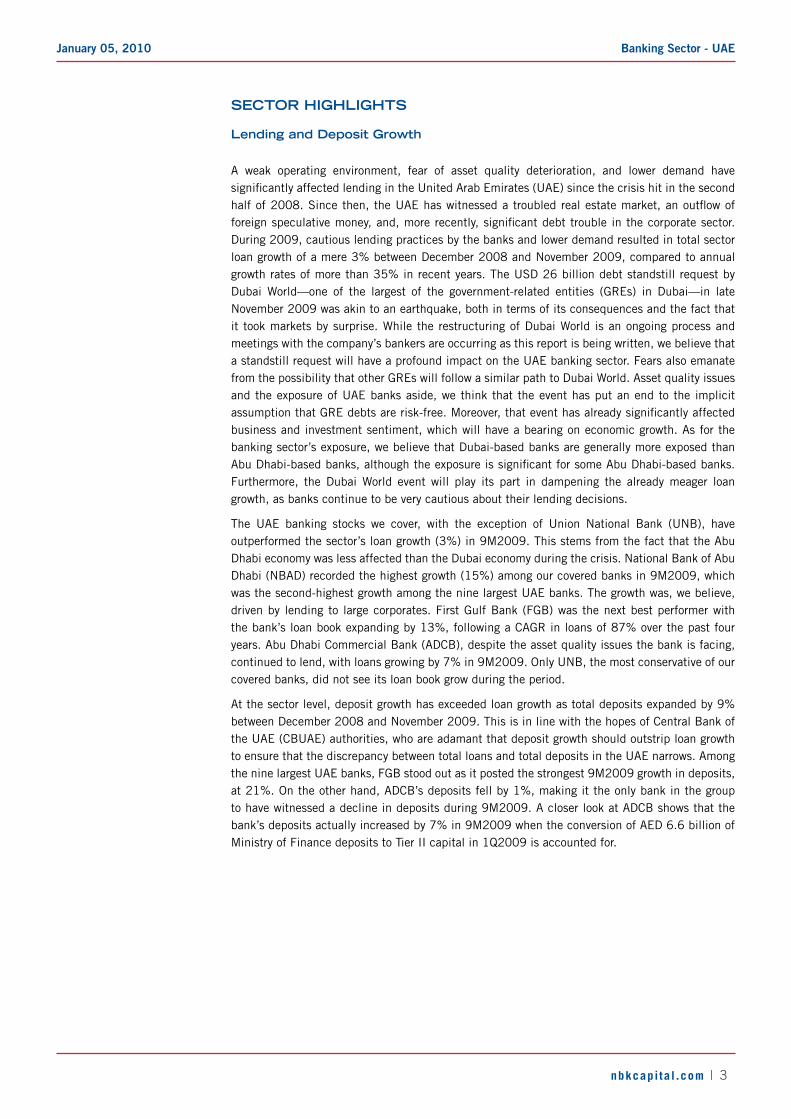
A weak operating environment, fear of asset quality deterioration, and lower demand have significantlyaffectedlendingintheUnitedArabEmirates(UAE)sincethecrisishitinthesecondhalfof2008.Sincethen,theUAEhaswitnessedatroubledrealestatemarket,anoutflowofforeignspeculativemoney,and,morerecently,significantdebttroubleinthecorporatesector.During 2009, cautious lending practices by the banks and lower demand resulted in total sector loan growth of a mere 3% between December 2008 and November 2009, compared to annual growth rates of more than 35% in recent years. The USD 26 billion debt standstill request by Dubai World—one of the largest of the government-related entities (GREs) in Dubai—in late November 2009 was akin to an earthquake, both in terms of its consequences and the fact that it took markets by surprise. While the restructuring of Dubai World is an ongoing process and meetings with the company’s bankers are occurring as this report is being written, we believe that a standstill request will have a profound impact on the UAE banking sector. Fears also emanate from the possibility that other GREs will follow a similar path to Dubai World. Asset quality issues and the exposure of UAE banks aside, we think that the event has put an end to the implicit assumptionthatGREdebtsarerisk-free.Moreover,thateventhasalreadysignificantlyaffectedbusiness and investment sentiment, which will have a bearing on economic growth. As for the banking sector’s exposure, we believe that Dubai-based banks are generally more exposed than AbuDhabi-basedbanks,althoughtheexposureissignificantforsomeAbuDhabi-basedbanks.Furthermore, the Dubai World event will play its part in dampening the already meager loan growth, as banks continue to be very cautious about their lending decisions.
The UAE banking stocks we cover, with the exception of Union National Bank (UNB), have outperformed the sector’s loan growth (3%) in 9M2009. This stems from the fact that the Abu Dhabi economy was less affected than the Dubai economy during the crisis. National Bank of Abu Dhabi (NBAD) recorded the highest growth (15%) among our covered banks in 9M2009, which was the second-highest growth among the nine largest UAE banks. The growth was, we believe, driven by lending to large corporates. First Gulf Bank (FGB) was the next best performer with the bank’s loan book expanding by 13%, following a CAGR in loans of 87% over the past four years. Abu Dhabi Commercial Bank (ADCB), despite the asset quality issues the bank is facing, continued to lend, with loans growing by 7% in 9M2009. Only UNB, the most conservative of our covered banks, did not see its loan book grow during the period.
At the sector level, deposit growth has exceeded loan growth as total deposits expanded by 9% between December 2008 and November 2009. This is in line with the hopes of Central Bank of the UAE (CBUAE) authorities, who are adamant that deposit growth should outstrip loan growth to ensure that the discrepancy between total loans and total deposits in the UAE narrows. Among the nine largest UAE banks, FGB stood out as it posted the strongest 9M2009 growth in deposits, at 21%. On the other hand, ADCB’s deposits fell by 1%, making it the only bank in the group to have witnessed a decline in deposits during 9M2009. A closer look at ADCB shows that the bank’s deposits actually increased by 7% in 9M2009 when the conversion of AED 6.6 billion of Ministry of Finance deposits to Tier II capital in 1Q2009 is accounted for.

Banking Sector - UAEJanuary 05, 2010
nbkcapi ta l .com | 4
Figure 1 Lending and Deposit Growth: 9M2009
14.7%
7.0%
13.4%
0.6%
6.8%
-1.0%
20.8%
10.5%
-5%
0%
5%
10%
15%
20%
25%
NBAD ADCB FGB UNB NBAD ADCB FGB UNB
Growth in Loans Growth in Deposits
Sources: Banks’ financial statements and NBK Capital
While we expect lending growth in 2010 to exceed 2009 levels, we remain cautious as we believe the Dubai World debacle will weigh heavily on lending appetites. Despite recent events, the macroeconomic outlook for the UAE (especially Abu Dhabi) remains bullish, and Gross Domestic Product (GDP) growth estimates are now slightly higher than at the beginning of the year (estimates for UAE real GDP growth in 2010 range between 0.5% and 3.5%). The improving oil price (up 153% since the December 2008 low), stabilizing real estate prices, and sustained government spending will support economic growth in 2010 and beyond. We expect sector loans and deposits to show a CAGR of 9% between 2009 and 2014.
Figure 2 Loan Growth and Market Share Forecasts
0%
2%
4%
6%
8%
10%
12%
14%
0%
2%
4%
6%
8%
10%
12%
14%
16%
18%
20%
NBAD ADCB FGB UNB
Loan
Gro
wth
2010F 2011F 2012F 2012F Market Share (RHS)
Sources: Banks’ financial statements and NBK Capital
FGB outperformed the other
banks in 9M2009
We expect NBAD and FGB to
witness the highest loan growth
in FY2010
Banking Sector - UAEJanuary 05, 2010
nbkcapi ta l .com | 5
liquidity
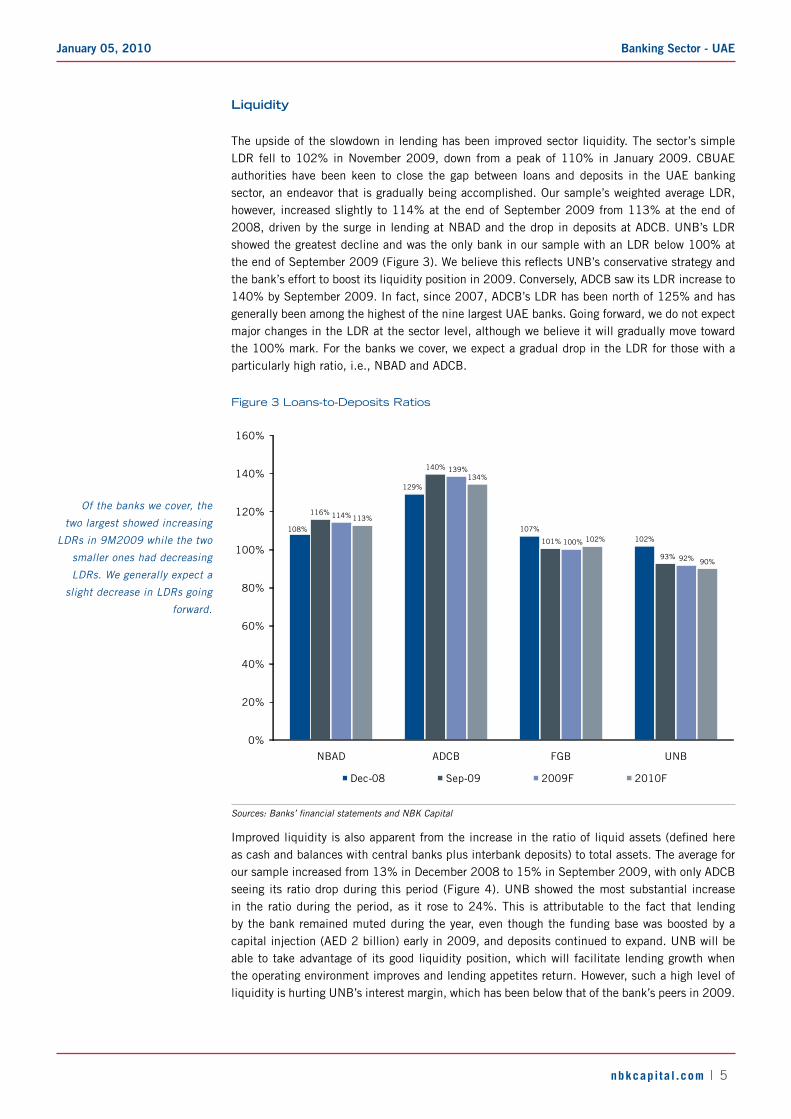
The upside of the slowdown in lending has been improved sector liquidity. The sector’s simple LDR fell to 102% in November 2009, down from a peak of 110% in January 2009. CBUAE authorities have been keen to close the gap between loans and deposits in the UAE banking sector, an endeavor that is gradually being accomplished. Our sample’s weighted average LDR, however, increased slightly to 114% at the end of September 2009 from 113% at the end of 2008, driven by the surge in lending at NBAD and the drop in deposits at ADCB. UNB’s LDR showed the greatest decline and was the only bank in our sample with an LDR below 100% at theendofSeptember2009(Figure3).WebelievethisreflectsUNB’sconservativestrategyandthe bank’s effort to boost its liquidity position in 2009. Conversely, ADCB saw its LDR increase to 140% by September 2009. In fact, since 2007, ADCB’s LDR has been north of 125% and has generally been among the highest of the nine largest UAE banks. Going forward, we do not expect major changes in the LDR at the sector level, although we believe it will gradually move toward the 100% mark. For the banks we cover, we expect a gradual drop in the LDR for those with a particularly high ratio, i.e., NBAD and ADCB.
Figure 3 Loans-to-Deposits Ratios
108%
129%
107%102%
116%
140%
101%
93%
114%
139%
100%
92%
113%
134%
102%
90%
0%
20%
40%
60%
80%
100%
120%
140%
160%
NBAD ADCB FGB UNB
Dec-08 Sep-09 2009F 2010F
Sources: Banks’ financial statements and NBK Capital
Improvedliquidityisalsoapparentfromtheincreaseintheratioofliquidassets(definedhereas cash and balances with central banks plus interbank deposits) to total assets. The average for our sample increased from 13% in December 2008 to 15% in September 2009, with only ADCB seeing its ratio drop during this period (Figure 4). UNB showed the most substantial increase in the ratio during the period, as it rose to 24%. This is attributable to the fact that lending by the bank remained muted during the year, even though the funding base was boosted by a capital injection (AED 2 billion) early in 2009, and deposits continued to expand. UNB will be able to take advantage of its good liquidity position, which will facilitate lending growth when the operating environment improves and lending appetites return. However, such a high level of liquidity is hurting UNB’s interest margin, which has been below that of the bank’s peers in 2009.
Of the banks we cover, the
two largest showed increasing
LDRs in 9M2009 while the two
smaller ones had decreasing
LDRs. We generally expect a
slight decrease in LDRs going
forward.

Banking Sector - UAEJanuary 05, 2010
nbkcapi ta l .com | 6
Figure 4 Liquid Assets-to-Total Assets
16%
15%
7%
14%
18%
13%
9%
24%
18%
14%
10%
24%
18%
13%
9%
24%
0%
5%
10%
15%
20%
25%
30%
NBAD ADCB FGB UNB
Dec-08 Sep-09 2009F 2010F
Sources: Banks’ financial statements and NBK Capital
capitalization
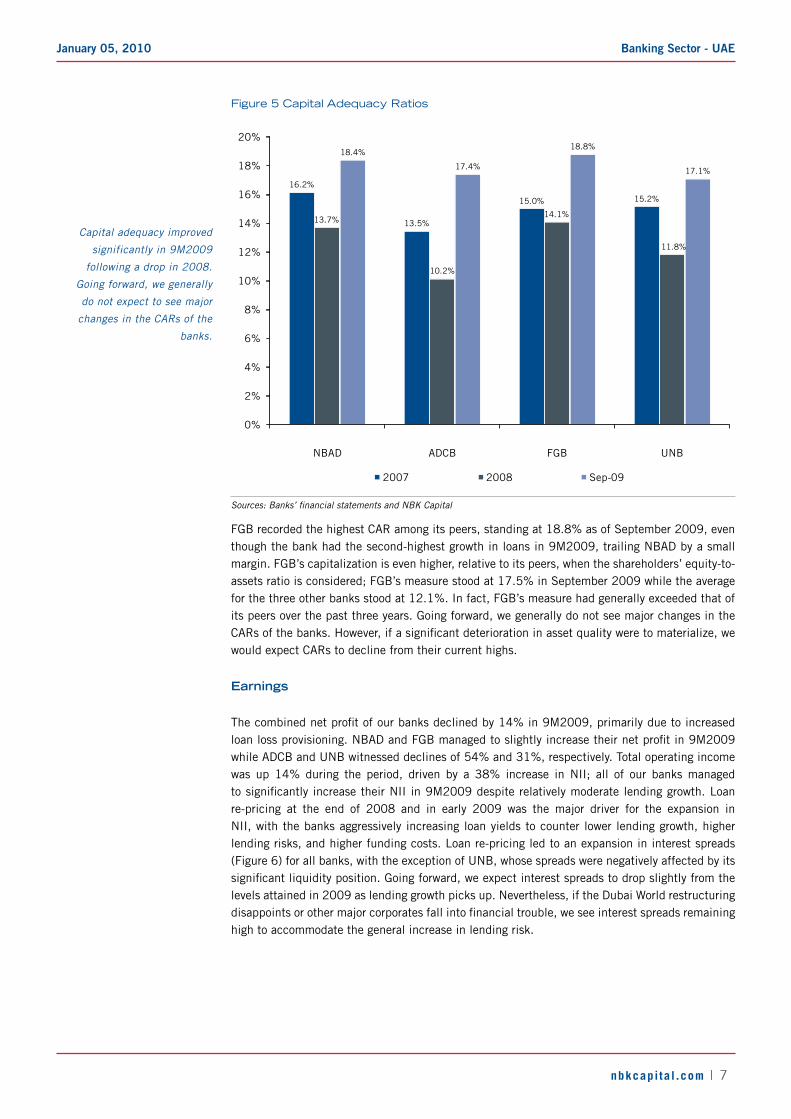
The UAE banking sector experienced improved capitalization in 9M2009, whereby the capital adequacyratio(CAR)ofallourbanksimprovedsignificantlyduringtheperiod,ascanbeseenin Figure 5. The primary reason for the improvement was the issuance of Tier I notes to the government of Abu Dhabi in February 2009. This followed a decline in capital adequacy in 2008 for the largest nine banks in the UAE banking sector. The current CARs in the UAE stand well above the latest CBUAE guidelines, which require banks to have a minimum CAR of 11% and Tier I of 7% by September 2009 and a minimum CAR of 12% and Tier I of 8% by June 2010. These high CARs are especially important in the current environment as UAE banks face yet another challenging year in terms of asset quality, particularly after the Dubai World restructuring.
Liquidity generally improved in
9M2009
Banking Sector - UAEJanuary 05, 2010
nbkcapi ta l .com | 7
Figure 5 Capital Adequacy Ratios
16.2%
13.5%
15.0% 15.2%
13.7%
10.2%
14.1%
11.8%
18.4%
17.4%
18.8%
17.1%
0%
2%
4%
6%
8%
10%
12%
14%
16%
18%
20%
NBAD ADCB FGB UNB
2007 2008 Sep-09
Sources: Banks’ financial statements and NBK Capital
FGB recorded the highest CAR among its peers, standing at 18.8% as of September 2009, even though the bank had the second-highest growth in loans in 9M2009, trailing NBAD by a small margin. FGB’s capitalization is even higher, relative to its peers, when the shareholders’ equity-to-assets ratio is considered; FGB’s measure stood at 17.5% in September 2009 while the average for the three other banks stood at 12.1%. In fact, FGB’s measure had generally exceeded that of its peers over the past three years. Going forward, we generally do not see major changes in the CARsofthebanks.However,ifasignificantdeteriorationinassetqualityweretomaterialize,wewould expect CARs to decline from their current highs.
Earnings
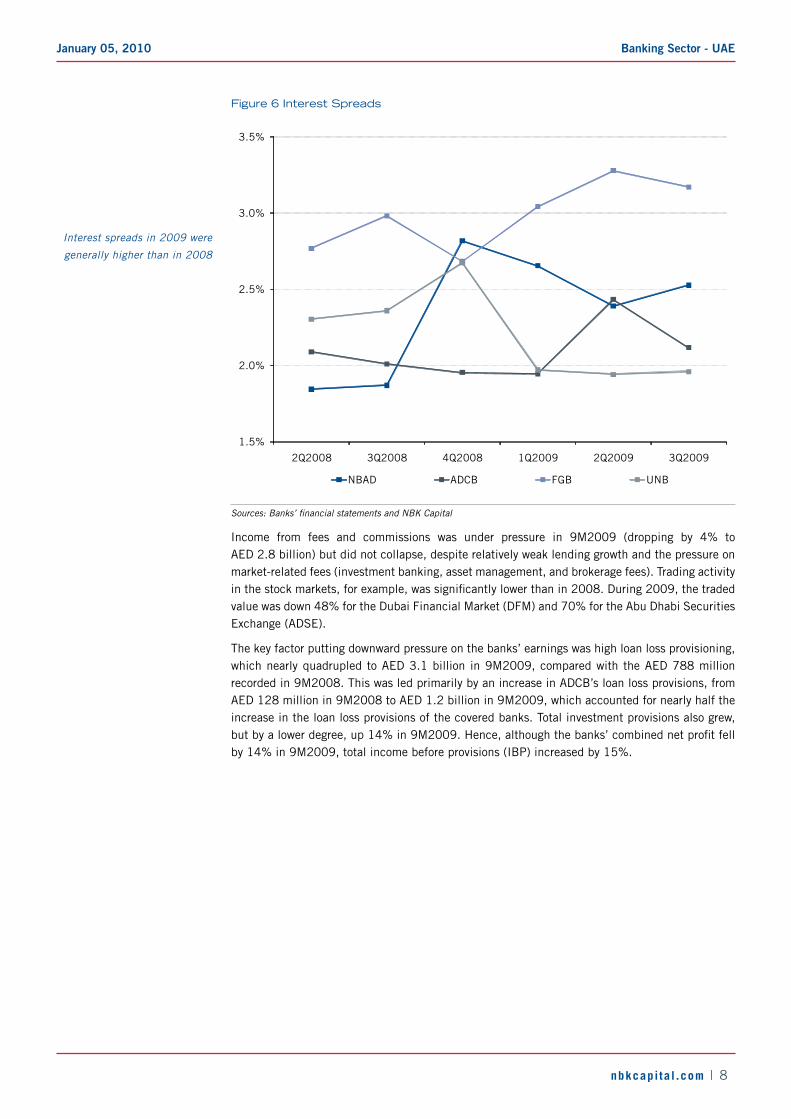
Thecombinednetprofitofourbanksdeclinedby14%in9M2009,primarilyduetoincreasedloanlossprovisioning.NBADandFGBmanagedtoslightlyincreasetheirnetprofitin9M2009while ADCB and UNB witnessed declines of 54% and 31%, respectively. Total operating income was up 14% during the period, driven by a 38% increase in NII; all of our banks managed tosignificantlyincreasetheirNIIin9M2009despiterelativelymoderatelendinggrowth.Loanre-pricing at the end of 2008 and in early 2009 was the major driver for the expansion in NII, with the banks aggressively increasing loan yields to counter lower lending growth, higher lending risks, and higher funding costs. Loan re-pricing led to an expansion in interest spreads (Figure 6) for all banks, with the exception of UNB, whose spreads were negatively affected by its significantliquidityposition.Goingforward,weexpectinterestspreadstodropslightlyfromthelevels attained in 2009 as lending growth picks up. Nevertheless, if the Dubai World restructuring disappointsorothermajorcorporatesfallintofinancialtrouble,weseeinterestspreadsremaininghigh to accommodate the general increase in lending risk.
Capital adequacy improved
significantly in 9M2009
following a drop in 2008.
Going forward, we generally
do not expect to see major
changes in the CARs of the
banks.
Banking Sector - UAEJanuary 05, 2010
nbkcapi ta l .com | 8
Figure 6 Interest Spreads
1.5%
2.0%
2.5%
3.0%
3.5%
2Q2008 3Q2008 4Q2008 1Q2009 2Q2009 3Q2009
NBAD ADCB FGB UNB
Sources: Banks’ financial statements and NBK Capital
Income from fees and commissions was under pressure in 9M2009 (dropping by 4% to AED 2.8 billion) but did not collapse, despite relatively weak lending growth and the pressure on market-related fees (investment banking, asset management, and brokerage fees). Trading activity inthestockmarkets,forexample,wassignificantlylowerthanin2008.During2009,thetradedvalue was down 48% for the Dubai Financial Market (DFM) and 70% for the Abu Dhabi Securities Exchange (ADSE).
The key factor putting downward pressure on the banks’ earnings was high loan loss provisioning, which nearly quadrupled to AED 3.1 billion in 9M2009, compared with the AED 788 million recorded in 9M2008. This was led primarily by an increase in ADCB’s loan loss provisions, from AED 128 million in 9M2008 to AED 1.2 billion in 9M2009, which accounted for nearly half the increase in the loan loss provisions of the covered banks. Total investment provisions also grew, butbyalowerdegree,up14%in9M2009.Hence,althoughthebanks’combinednetprofitfellby 14% in 9M2009, total income before provisions (IBP) increased by 15%.
Interest spreads in 2009 were
generally higher than in 2008
Banking Sector - UAEJanuary 05, 2010
nbkcapi ta l .com | 9
Figure 7 Income Statement Accounts: 9M2009 versus 9M2008
7.1
2.9
12.5
3.3
0.8
7.78.5
9.8
2.8
14.3
3.83.1
6.7
9.8
0
2
4
6
8
10
12
14
16
Net Interest Income
Fees Operating Income
Costs Loan Loss Provisions
Net Profit IBP *
Bill
ion
AE
D
9M2008 9M2009
* Note: IBP = Income before loan loss provisions Sources: Banks’ financial statements and NBK Capital
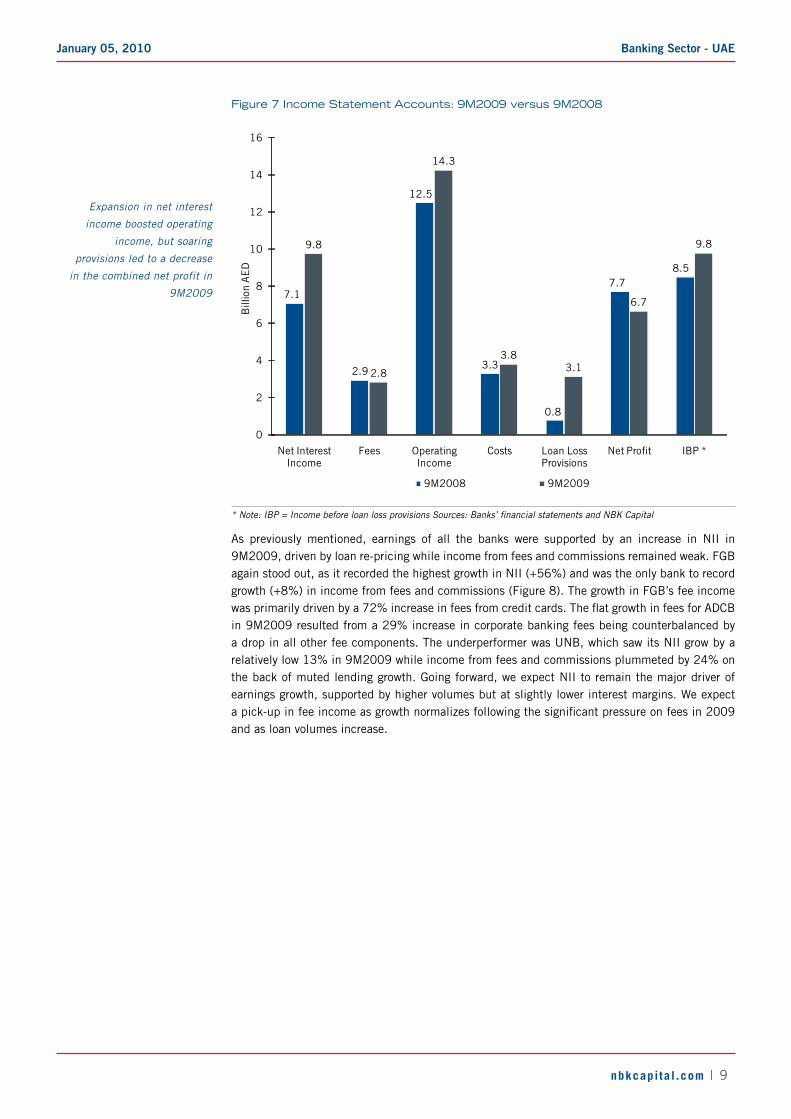
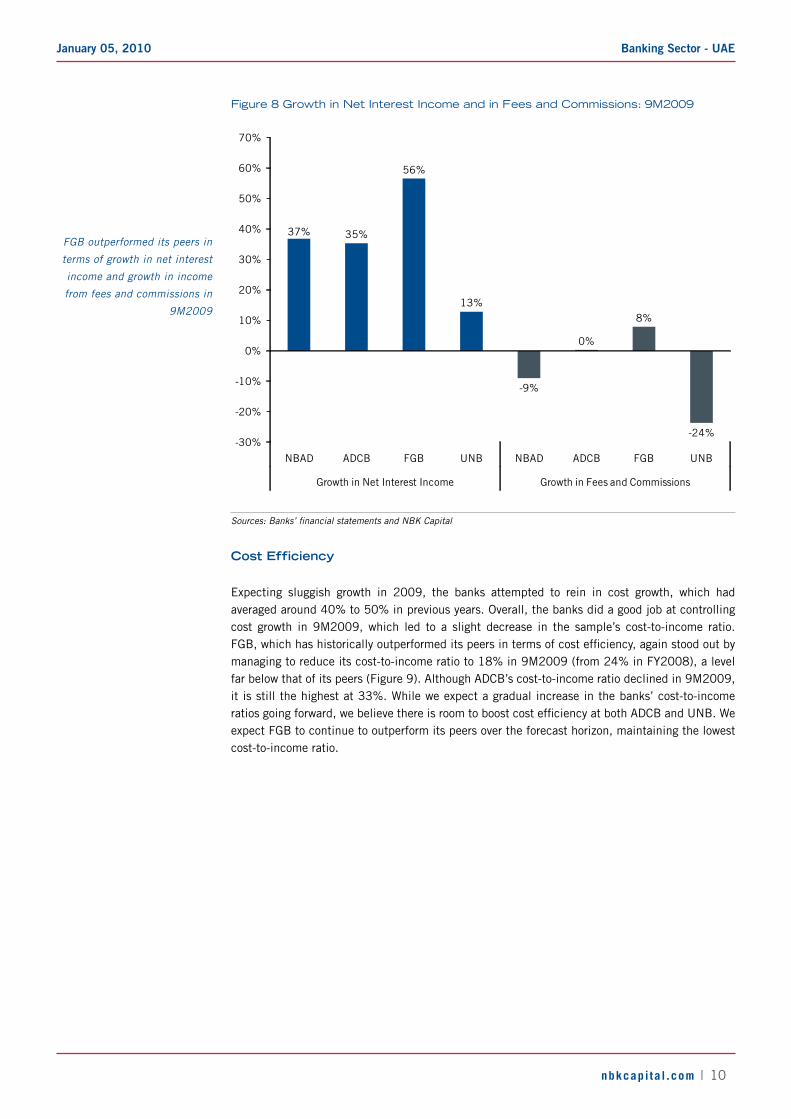
As previously mentioned, earnings of all the banks were supported by an increase in NII in 9M2009, driven by loan re-pricing while income from fees and commissions remained weak. FGB again stood out, as it recorded the highest growth in NII (+56%) and was the only bank to record growth (+8%) in income from fees and commissions (Figure 8). The growth in FGB’s fee income wasprimarilydrivenbya72%increaseinfeesfromcreditcards.TheflatgrowthinfeesforADCBin 9M2009 resulted from a 29% increase in corporate banking fees being counterbalanced by a drop in all other fee components. The underperformer was UNB, which saw its NII grow by a relatively low 13% in 9M2009 while income from fees and commissions plummeted by 24% on the back of muted lending growth. Going forward, we expect NII to remain the major driver of earnings growth, supported by higher volumes but at slightly lower interest margins. We expect apick-upinfeeincomeasgrowthnormalizesfollowingthesignificantpressureonfeesin2009and as loan volumes increase.
Expansion in net interest
income boosted operating
income, but soaring
provisions led to a decrease
in the combined net profit in
9M2009
Banking Sector - UAEJanuary 05, 2010
nbkcapi ta l .com | 10
Figure 8 Growth in Net Interest Income and in Fees and Commissions: 9M2009
37% 35%
56%
13%
-9%
0%
8%
-24%-30%
-20%
-10%
0%
10%
20%
30%
40%
50%
60%
70%
NBAD ADCB FGB UNB NBAD ADCB FGB UNB
Growth in Net Interest Income Growth in Fees and Commissions
Sources: Banks’ financial statements and NBK Capital
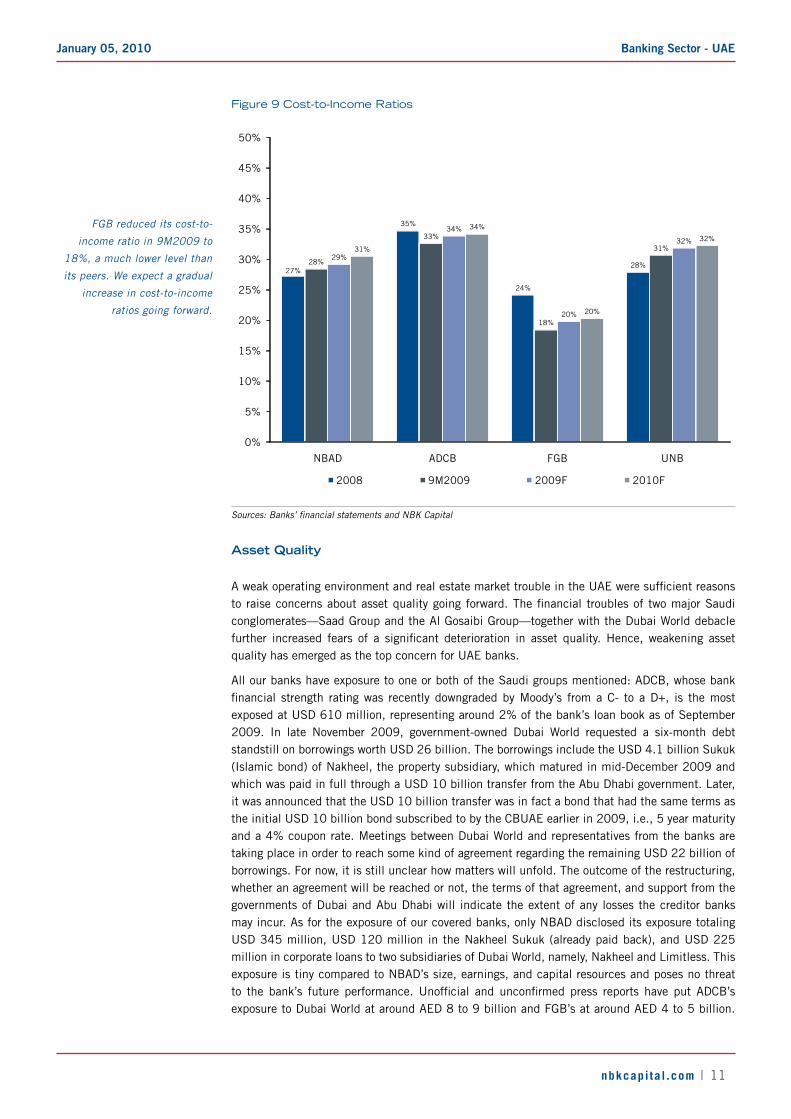
cost Efficiency
Expecting sluggish growth in 2009, the banks attempted to rein in cost growth, which had averaged around 40% to 50% in previous years. Overall, the banks did a good job at controlling cost growth in 9M2009, which led to a slight decrease in the sample’s cost-to-income ratio. FGB,whichhashistoricallyoutperformeditspeersintermsofcostefficiency,againstoodoutbymanaging to reduce its cost-to-income ratio to 18% in 9M2009 (from 24% in FY2008), a level far below that of its peers (Figure 9). Although ADCB’s cost-to-income ratio declined in 9M2009, it is still the highest at 33%. While we expect a gradual increase in the banks’ cost-to-income ratiosgoingforward,webelievethereisroomtoboostcostefficiencyatbothADCBandUNB.Weexpect FGB to continue to outperform its peers over the forecast horizon, maintaining the lowest cost-to-income ratio.
FGB outperformed its peers in
terms of growth in net interest
income and growth in income
from fees and commissions in
9M2009
Banking Sector - UAEJanuary 05, 2010
nbkcapi ta l .com | 11
Figure 9 Cost-to-Income Ratios
27%
35%
24%
28%28%
33%
18%
31%29%
34%
20%
32%31%
34%
20%
32%
0%
5%
10%
15%
20%
25%
30%
35%
40%
45%
50%
NBAD ADCB FGB UNB
2008 9M2009 2009F 2010F
Sources: Banks’ financial statements and NBK Capital
Asset Quality
AweakoperatingenvironmentandrealestatemarkettroubleintheUAEweresufficientreasonstoraiseconcernsaboutassetqualitygoingforward.Thefinancial troublesof twomajorSaudiconglomerates—Saad Group and the Al Gosaibi Group—together with the Dubai World debacle further increased fears of a significant deterioration in asset quality.Hence,weakening assetquality has emerged as the top concern for UAE banks.
All our banks have exposure to one or both of the Saudi groups mentioned: ADCB, whose bank financial strength ratingwas recentlydowngradedbyMoody’s fromaC- to aD+, is themostexposed at USD 610 million, representing around 2% of the bank’s loan book as of September 2009. In late November 2009, government-owned Dubai World requested a six-month debt standstill on borrowings worth USD 26 billion. The borrowings include the USD 4.1 billion Sukuk (Islamic bond) of Nakheel, the property subsidiary, which matured in mid-December 2009 and which was paid in full through a USD 10 billion transfer from the Abu Dhabi government. Later, it was announced that the USD 10 billion transfer was in fact a bond that had the same terms as the initial USD 10 billion bond subscribed to by the CBUAE earlier in 2009, i.e., 5 year maturity and a 4% coupon rate. Meetings between Dubai World and representatives from the banks are taking place in order to reach some kind of agreement regarding the remaining USD 22 billion of borrowings. For now, it is still unclear how matters will unfold. The outcome of the restructuring, whether an agreement will be reached or not, the terms of that agreement, and support from the governments of Dubai and Abu Dhabi will indicate the extent of any losses the creditor banks may incur. As for the exposure of our covered banks, only NBAD disclosed its exposure totaling USD 345 million, USD 120 million in the Nakheel Sukuk (already paid back), and USD 225 million in corporate loans to two subsidiaries of Dubai World, namely, Nakheel and Limitless. This exposure is tiny compared to NBAD’s size, earnings, and capital resources and poses no threat to the bank’s future performance.Unofficial and unconfirmed press reports have put ADCB’sexposure to Dubai World at around AED 8 to 9 billion and FGB’s at around AED 4 to 5 billion.
FGB reduced its cost-to-
income ratio in 9M2009 to
18%, a much lower level than
its peers. We expect a gradual
increase in cost-to-income
ratios going forward.

Banking Sector - UAEJanuary 05, 2010
nbkcapi ta l .com | 12
FGBsubsequently issuedanofficialstatementdenyingthis levelofexposure,sayingthat it is“absolutely overstated”. Rating agencies have issued several statements, we believe, implying that, among our covered banks, ADCB is the most exposed, followed by FGB, while nothing has been said about UNB. We estimate that, from a geographic breakdown perspective, Dubai represented around 37% of ADCB’s loan book as of June 2009. As for FGB, we estimate that the bank had a minimum exposure of around AED 2.26 billion, as part of the bank’s loan book, totheoverallgovernmentandpublicsectorofDubaiandnotspecificallytoDubaiWorld.Itisverylikelythatadditionalexposureto“DubaiInc”isintheformoffixed-incomeinstrumentsandnon-funded commitments.
It is important at this point to mention that, as of December 2008, the banks showed strong asset quality indicators, with an average NPLs-to-gross loans ratio of 0.9% and an NPL coverage ratio of 166%. FGB stood out with the lowest NPLs-to-gross loans ratio of 0.6% and the highest NPL coverage ratio, exceeding 200%. During 9M2009, however, asset quality indicators across the banks weakened, especially for ADCB, which saw its NPLs-to-gross loans ratio spike to 4.2% as of September 2009 (Figure 10), underpinned by a quadrupling in NPLs. Consequently, ADCB’s NPL coverage ratio dropped to 52%, despite a massive increase in loan loss provisioning charges during 9M2009. All other banks maintained coverage ratios exceeding 100% as of September 2009, but saw their NPLs-to-gross loans ratios increase compared to December 2008 levels.
Figure 10 Asset Quality Indicators: September 2009
1.2%
4.2%
1.4% 1.3%
0.5%
-2.0%
0.7%
0.1%
146%
52%
150%
106%
-100%
-50%
0%
50%
100%
150%
200%
-2.5%
-1.5%
-0.5%
0.5%
1.5%
2.5%
3.5%
4.5%
5.5%
NBAD ADCB FGB UNB
NPLs-to-Gross Loans (Left) Excess Provisions-to-Gross Loans (Left) NPL Coverage (Right)
Sources: Banks’ financial statements and NBK Capital
Another important indicator to look at is the amount of excess provisions (meaning provisions in excess of NPLs) in relation to a bank’s gross loans. This indicator shows the additional NPLs (as a share of loans) that a bank can take before total NPLs become less than 100% covered by provisions. FGB outperforms, according to this criterion, with a “cushion” equal to 0.7% of the bank’s gross loans (around AED 644 million) as of September 2009. NBAD follows with a cushion of 0.5% of its gross loans (around AED 713 million) as of September 2009, followed by UNB. ADCB’s NPLs, on the other hand, already surpassed the bank’s total provisions. We expect an increase in the NPLs-to-gross loans ratio throughout our forecast horizon for all banks, but
Despite the weakening in
9M2009, asset quality
indicators were, with the
exception of ADCB, still good
as of September 2009
Banking Sector - UAEJanuary 05, 2010
nbkcapi ta l .com | 13
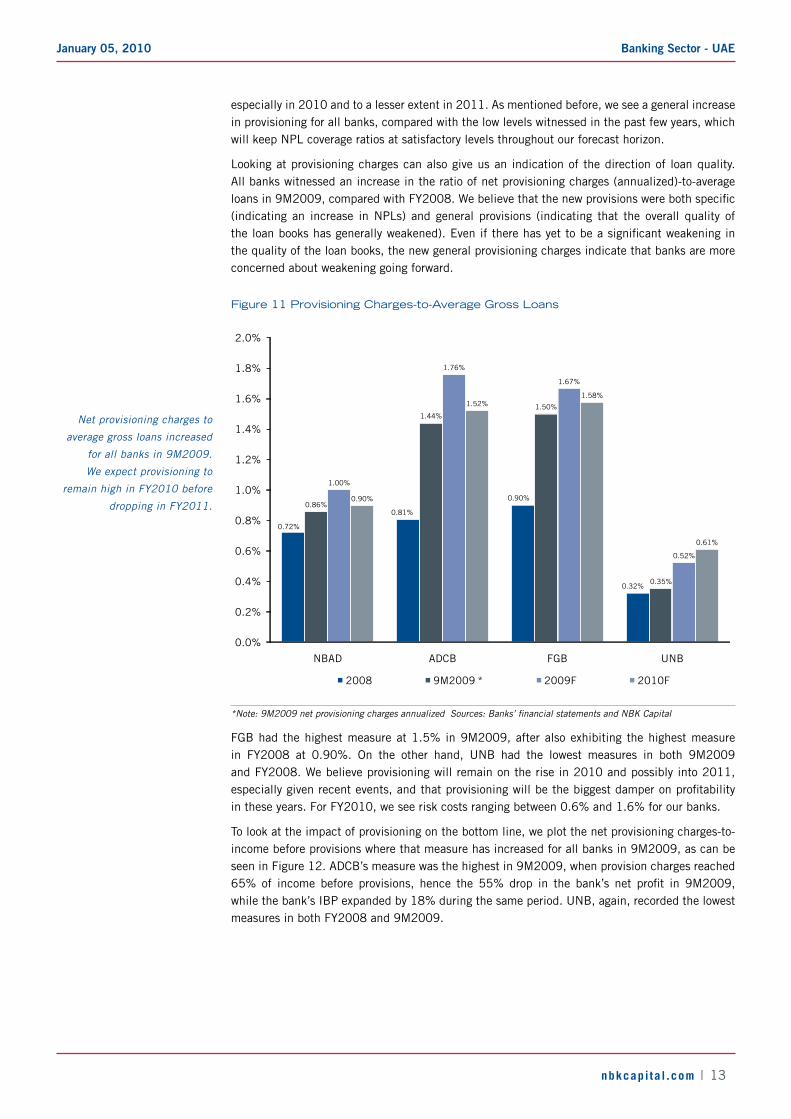
especially in 2010 and to a lesser extent in 2011. As mentioned before, we see a general increase in provisioning for all banks, compared with the low levels witnessed in the past few years, which will keep NPL coverage ratios at satisfactory levels throughout our forecast horizon.
Looking at provisioning charges can also give us an indication of the direction of loan quality. All banks witnessed an increase in the ratio of net provisioning charges (annualized)-to-average loansin9M2009,comparedwithFY2008.Webelievethatthenewprovisionswerebothspecific(indicating an increase in NPLs) and general provisions (indicating that the overall quality of theloanbookshasgenerallyweakened).Eveniftherehasyettobeasignificantweakeninginthe quality of the loan books, the new general provisioning charges indicate that banks are more concerned about weakening going forward.
Figure 11 Provisioning Charges-to-Average Gross Loans
0.72%
0.81%
0.90%
0.32%
0.86%
1.44%1.50%
0.35%
1.00%
1.76%
1.67%
0.52%
0.90%
1.52%1.58%
0.61%
0.0%
0.2%
0.4%
0.6%
0.8%
1.0%
1.2%
1.4%
1.6%
1.8%
2.0%
NBAD ADCB FGB UNB
2008 9M2009 * 2009F 2010F
*Note: 9M2009 net provisioning charges annualized Sources: Banks’ financial statements and NBK Capital
FGB had the highest measure at 1.5% in 9M2009, after also exhibiting the highest measure in FY2008 at 0.90%. On the other hand, UNB had the lowest measures in both 9M2009 and FY2008. We believe provisioning will remain on the rise in 2010 and possibly into 2011, especiallygivenrecentevents,andthatprovisioningwillbethebiggestdamperonprofitabilityin these years. For FY2010, we see risk costs ranging between 0.6% and 1.6% for our banks.
To look at the impact of provisioning on the bottom line, we plot the net provisioning charges-to-income before provisions where that measure has increased for all banks in 9M2009, as can be seen in Figure 12. ADCB’s measure was the highest in 9M2009, when provision charges reached 65%of income before provisions, hence the 55%drop in the bank’s net profit in 9M2009,while the bank’s IBP expanded by 18% during the same period. UNB, again, recorded the lowest measures in both FY2008 and 9M2009.
Net provisioning charges to
average gross loans increased
for all banks in 9M2009.
We expect provisioning to
remain high in FY2010 before
dropping in FY2011.

Banking Sector - UAEJanuary 05, 2010
nbkcapi ta l .com | 14
Figure 12 Net Provisioning Charges-to-IBP*: 9M2009 versus FY2008
19%
38%
16%
9%
23%
65%
28%
13%
0%
10%
20%
30%
40%
50%
60%
70%
NBAD ADCB FGB UNB
2008 9M2009
* Note: IBP = Income before Loan Loss Provisions Sources: Banks’ financial statements and NBK Capital
Finally, we believe NBAD and FGB will manage to end 2009 with a slight increase in their net profitcomparedwithFY2008.Weexpect4Q2009provisioningtobehighforallbanksandtoremainsoinFY2010,continuingtobethebiggestdamperonbanks’profitability.Weseepositivegrowthinbothoperatingincomeandnetprofitforallbanksin2010andareboundin2011whenprovisioning charges start to decrease.
Net provisioning charges-to-
IBP increased for all banks in
9M2009

Banking Sector - UAEJanuary 05, 2010
nbkcapi ta l .com | 15
national bank of Abu dhabi (nbAd)
Valuation
Discounted Equity Cash Flow (DECF)Dividend Discount Model (DDM)Peer-Based Valuation
Weighted Average Fair Value
Weight (%)Value (AED)Valuation Method
20%
14.60 100%
18.6011.2013.30
40%40%
Source: NBK Capital
rebased Performance
4
6
8
10
12
14
16
Jan-09 Mar-09 May-09 Jul-09 Aug-09 Oct-09 Dec-09
NBAD MSCI UAE Abu Dhabi Banking and Financial Services Index
Sources: Reuters and NBK Capital
Historical Performance
Q-o-Q Q-o-Q YTD
Change % Change % Change %
Net Loans and Advances 124,250,463 7.2% 128,194,058 3.2% 14.7%
Customer Deposits 111,673,700 14.1% 110,487,841 -1.1% 6.8%
Shareholders' Equity 19,077,680 4.2% 20,292,685 6.4% 41.3%
Total Assets 181,029,318 12.3% 185,565,866 2.5% 12.7%
Y-o-Y Y-o-Y 9M2009
Change % Change % Change %
Net Interest Income 1,065,697 29.4% 1,180,837 39.7% 36.7%
Net Fees and Commissions 292,901 -8.9% 314,132 1.3% -8.9%
Net Invest. Gains/(Losses) 102,353 -33.3% 156,754 n/m 1991.0%
Total Operating Income 1,648,925 13.4% 1,708,413 40.8% 21.3%
Total Costs (436,453) 22.2% (492,634) 35.2% 30.0%
Prov. for Credit Losses, net (285,857) 272.9% (284,439) 59.4% 142.6%
Net Profit 906,519 -9.5% 913,973 40.5% 2.5%
Sep-09
Figures in '000 AED 2Q2009 3Q2009
Figures in '000 AED Jun-09
Sources: Bank’s financial statements and NBK Capital
Forecasts
Old New Change 2009 2010
Net Loans and Advances 123,168,324 131,536,799 6.8% 17.7% 16.4% 10.3%
Customer Deposits 105,510,556 114,965,978 9.0% 11.1% 17.9% 11.2%
Net Interest Income 4,212,382 4,551,555 8.1% 26.2% 15.0% 11.6%
Net Fees and Commissions 947,043 1,148,286 21.2% 1.5% 10.8% 9.8%
Total Operating Income 5,779,008 6,439,410 11.4% 21.5% 11.8% 10.5%
Total Costs (1,752,816) (1,880,255) 7.3% 30.0% 16.9% 13.4%
Prov. for Credit Losses, net (789,289) (1,239,772) 57.1% 76.4% 5.4% -15.6%
Net Profit 3,102,407 3,194,952 3.0% 5.8% 11.2% 14.5%
Figures in '000 AED% Change2009 Forecasts 5-year
CAGR *
3Q2009 IBP a 3Q2009 IBP fAED 1198 million AED 959 million
4Q2009 IBP f 1Q2010 IBP fAED 1059 million AED 1214 million
* CAGR: 2009–2014 Sources: Bank’s financial statements and NBK Capital
12-month Fair Value: AEd 14.60
recommendation: Accumulate – risk level**: 2
reason for report: 3Q2009 Update
• Our new estimate of NBAD’s fair value per share stands at AED 14.60, 18% above the share’s closing price as of January 04, 2010—hence our “Accumulate” recommendation. This value is 15% above our previous fair value estimate of AED 12.70. NBAD has been one of the most resilient banks in the UAE banking sector during the crisis period, with an expanding loan book and balance sheet as well as positive bottom-line growth. NBAD displays one of the strongest asset quality indicators in the UAE banking sector, with an NPLs-to-gross loans ratio at 1.18% and an NPL coverage ratio at 146% as of September 2009, albeit slightly weaker than the levels at the end of 2008.
• NBADachievedanetprofitofAED2.6billionin9M2009,up 2.5% year on year (YoY) despite a 143% surge in provisioning, a 30% increase in costs, and a 9% drop in fees and commissions. The growth in 9M2009 was primarily supported by strong performance in net interest income, up 37%, on the back of improving margins, higher loan volumes, and a decline in the cost of funds. The other driving factor was net investment gains, which surged during 2Q2009 and 3Q2009, following three consecutive quarters of net losses,andaccountedforalmostonefifthof the increasein operating income during 9M2009. NBAD continued its expansion during the year by increasing investments in the bank’s infrastructure and network, while simultaneously opening new branches in the UAE and abroad.
• NBAD’s CAR stood at a very comfortable 18.4% as of September 2009, exceeding the regulatory requirements by a wide margin. Moreover, when the deposits injected by the Ministry of Finance in 2008, worth AED 5.6 billion, are converted into subordinated debt, NBAD’s CAR will be further boosted. NBAD’s exposure to the Saad and Gosaibi group is negligible, standing at USD 8.7 million. NBAD wasoneofthefirstbanksintheUAEtorevealitsexposureto Dubai World. The bank has general corporate loans of USD 225 million (0.6% of net loans) to Nakheel and Limitless and an investment worth USD 120 million in Nakheel’s Sukuk (which has already been repaid).
• NBAD’s prudent strategy, the bank’s significant businesswith the public sector and large corporates (key growth drivers), as well as the bank’s strong ties with the Abu Dhabi government are clear advantages that NBAD has over its peers. We now forecast loans to grow by a CAGR of 10% in thecomingfiveyears,asopposedtoourpreviousforecastof9%.WeexpectNBAD’snetprofittogrowby6%inFY2009,even as provisioning continues at a high level in 4Q2009. Between 2009 and 2014, we see operating income and net profitincreasingbyaCAGRof10%and15%,respectively.
** Please refer to page 29 for recommendations and risk ratings.
Banking Sector - UAEJanuary 05, 2010
nbkcapi ta l .com | 16
Abu dhabi commercial bank (Adcb)
Valuation
Discounted Equity Cash Flow (DECF)Dividend Discount Model (DDM)Peer-Based Valuation
Weighted Average Fair Value 1.70 100%
2.001.601.40
40%40%20%
Valuation Method Value (AED) Weight (%)
Source: NBK Capital
rebased Performance
1.0
1.5
2.0
2.5
3.0
3.5
Jan-09 Mar-09 May-09 Jul-09 Aug-09 Oct-09 Dec-09
ADCB MSCI UAE Abu Dhabi Banking and Financial Services Index
Sources: Reuters and NBK Capital
Historical Performance
Q-o-Q Q-o-Q YTD
Change % Change % Change %
Net Loans and Advances 114,437,681 3.8% 116,703,041 2.0% 7.0%
Customer Deposits 82,555,047 12.7% 83,504,180 1.1% -1.0%
Shareholders' Equity 19,946,830 25.5% 20,114,097 0.8% 27.2%
Total Assets 154,465,019 7.0% 158,626,108 2.7% 7.2%
Y-o-Y Y-o-Y 9M2009
Change % Change % Change %
Net Interest Income 886,168 40.7% 823,358 26.5% 35.3%
Net Fees and Commissions 292,128 18.1% 252,666 6.6% 0.2%
Net Invest. Gains/(Losses) (22,962) n/m 32,930 64.1% -94.2%
Total Operating Income 1,317,583 7.8% 1,243,961 9.3% 8.8%
Total Costs (400,791) 16.1% (388,666) 3.1% 11.6%
Prov. for Credit Losses, net (401,000) 150.7% (708,239) n/m 874.0%
Prov. on Invest. and others (211,699) 260.2% (102,472) -70.9% -5.5%
Net Profit 294,861 -52.5% 34,774 -91.7% -54.5%
Figures in '000 AED Jun-09 Sep-09
Figures in '000 AED 2Q2009 3Q2009
Sources: Bank’s financial statements and NBK Capital
Forecasts
Old New Change 2009 2010
Net Loans and Advances 114,585,550 118,482,138 3.4% 8.6% 8.7% 8.1%
Customer Deposits 83,842,449 85,515,953 2.0% 1.4% 12.1% 10.2%
Net Interest Income 2,838,205 3,228,478 13.8% 30.1% 10.9% 8.6%
Net Fees and Commissions 846,973 1,005,092 18.7% 2.3% 9.9% 9.8%
Total Operating Income 4,134,677 4,844,095 17.2% 10.3% 11.3% 8.9%
Total Costs (1,632,427) (1,639,816) 0.5% 7.5% 12.4% 10.6%
Prov. for Credit Losses, net (856,633) (2,048,510) 139.1% 170.1% -4.9% -21.0%
Net Profit 985,387 516,937 -47.5% -58.2% 128.1% 50.9%
Figures in '000 AED2009 Forecasts % Change 5-year
CAGR *
3Q2009 IBP a 3Q2009 IBP fAED 845 million AED 618 million4Q2009 IBP f 1Q2010 IBP f
AED 786 million AED 862 million
* CAGR: 2009–2014 Sources: Bank’s financial statements and NBK Capital
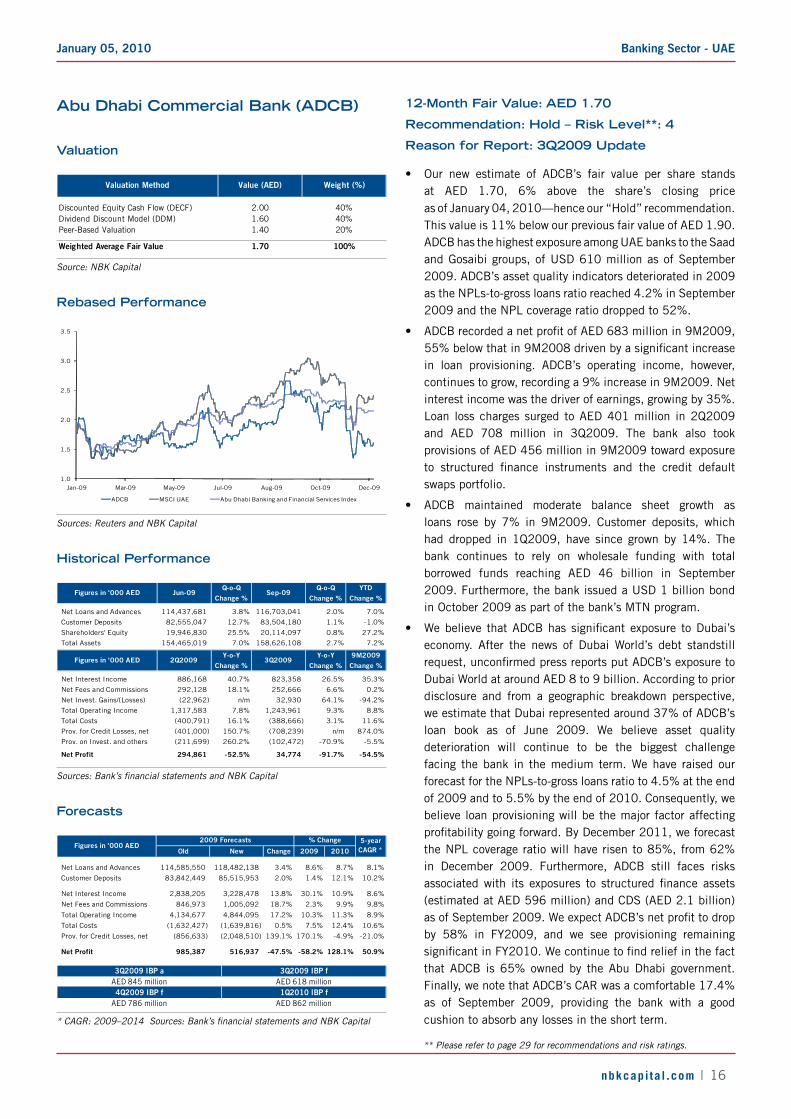
12-month Fair Value: AEd 1.70
recommendation: Hold – risk level**: 4
reason for report: 3Q2009 Update
• Our new estimate of ADCB’s fair value per share stands at AED 1.70, 6% above the share’s closing price as of January 04, 2010—hence our “Hold” recommendation. This value is 11% below our previous fair value of AED 1.90. ADCB has the highest exposure among UAE banks to the Saad and Gosaibi groups, of USD 610 million as of September 2009. ADCB’s asset quality indicators deteriorated in 2009 as the NPLs-to-gross loans ratio reached 4.2% in September 2009 and the NPL coverage ratio dropped to 52%.
• ADCBrecordedanetprofitofAED683millionin9M2009,55%belowthatin9M2008drivenbyasignificantincreasein loan provisioning. ADCB’s operating income, however, continues to grow, recording a 9% increase in 9M2009. Net interest income was the driver of earnings, growing by 35%. Loan loss charges surged to AED 401 million in 2Q2009 and AED 708 million in 3Q2009. The bank also took provisions of AED 456 million in 9M2009 toward exposure to structured finance instruments and the credit defaultswaps portfolio.
• ADCB maintained moderate balance sheet growth as loans rose by 7% in 9M2009. Customer deposits, which had dropped in 1Q2009, have since grown by 14%. The bank continues to rely on wholesale funding with total borrowed funds reaching AED 46 billion in September 2009. Furthermore, the bank issued a USD 1 billion bond in October 2009 as part of the bank’s MTN program.
• Webelieve thatADCBhassignificantexposure toDubai’seconomy. After the news of Dubai World’s debt standstill request,unconfirmedpressreportsputADCB’sexposuretoDubai World at around AED 8 to 9 billion. According to prior disclosure and from a geographic breakdown perspective, we estimate that Dubai represented around 37% of ADCB’s loan book as of June 2009. We believe asset quality deterioration will continue to be the biggest challenge facing the bank in the medium term. We have raised our forecast for the NPLs-to-gross loans ratio to 4.5% at the end of 2009 and to 5.5% by the end of 2010. Consequently, we believe loan provisioning will be the major factor affecting profitabilitygoingforward.ByDecember2011,weforecastthe NPL coverage ratio will have risen to 85%, from 62% in December 2009. Furthermore, ADCB still faces risks associatedwith its exposures to structured finance assets(estimated at AED 596 million) and CDS (AED 2.1 billion) asofSeptember2009.WeexpectADCB’snetprofittodropby 58% in FY2009, and we see provisioning remaining significantinFY2010.Wecontinuetofindreliefinthefactthat ADCB is 65% owned by the Abu Dhabi government. Finally, we note that ADCB’s CAR was a comfortable 17.4% as of September 2009, providing the bank with a good cushion to absorb any losses in the short term.
** Please refer to page 29 for recommendations and risk ratings.
Banking Sector - UAEJanuary 05, 2010
nbkcapi ta l .com | 17
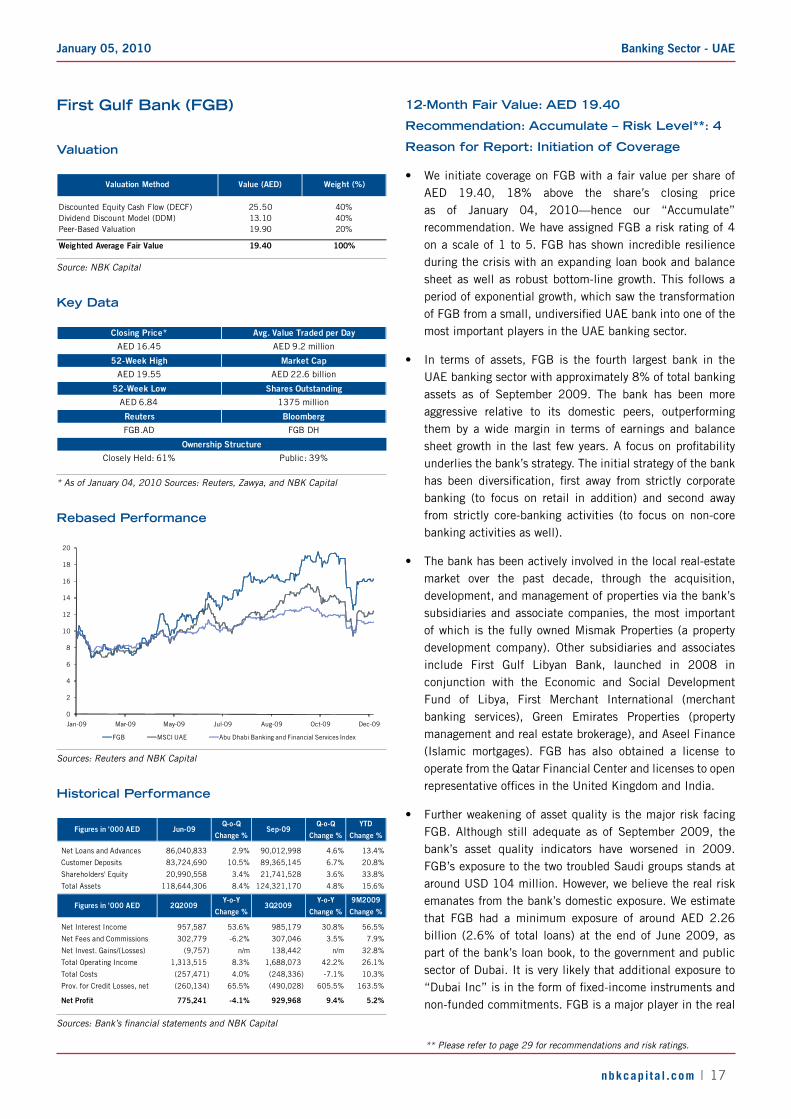
First gulf bank (Fgb)
Valuation
Discounted Equity Cash Flow (DECF)Dividend Discount Model (DDM)Peer-Based Valuation
Weighted Average Fair Value
40%40%
Weight (%)Value (AED)Valuation Method
20%
19.40 100%
25.5013.1019.90
Source: NBK Capital
key data
Closing Price* Avg. Value Traded per Day
AED 16.45 AED 9.2 million
52-Week High Market Cap
AED 19.55 AED 22.6 billion
52-Week Low Shares Outstanding
AED 6.84 1375 million
Reuters Bloomberg
FGB.AD FGB DH
Closely Held: 61% Public: 39%
Ownership Structure
* As of January 04, 2010 Sources: Reuters, Zawya, and NBK Capital
rebased Performance
0
2
4
6
8
10
12
14
16
18
20
Jan-09 Mar-09 May-09 Jul-09 Aug-09 Oct-09 Dec-09
FGB MSCI UAE Abu Dhabi Banking and Financial Services Index
Sources: Reuters and NBK Capital
Historical Performance
Q-o-Q Q-o-Q YTD
Change % Change % Change %
Net Loans and Advances 86,040,833 2.9% 90,012,998 4.6% 13.4%
Customer Deposits 83,724,690 10.5% 89,365,145 6.7% 20.8%
Shareholders' Equity 20,990,558 3.4% 21,741,528 3.6% 33.8%
Total Assets 118,644,306 8.4% 124,321,170 4.8% 15.6%
Y-o-Y Y-o-Y 9M2009
Change % Change % Change %
Net Interest Income 957,587 53.6% 985,179 30.8% 56.5%
Net Fees and Commissions 302,779 -6.2% 307,046 3.5% 7.9%
Net Invest. Gains/(Losses) (9,757) n/m 138,442 n/m 32.8%
Total Operating Income 1,313,515 8.3% 1,688,073 42.2% 26.1%
Total Costs (257,471) 4.0% (248,336) -7.1% 10.3%
Prov. for Credit Losses, net (260,134) 65.5% (490,028) 605.5% 163.5%
Net Profit 775,241 -4.1% 929,968 9.4% 5.2%
Figures in '000 AED 2Q2009 3Q2009
Figures in '000 AED Jun-09 Sep-09
Sources: Bank’s financial statements and NBK Capital
12-month Fair Value: AEd 19.40
recommendation: Accumulate – risk level**: 4
reason for report: initiation of coverage
• We initiate coverage on FGB with a fair value per share of AED 19.40, 18% above the share’s closing price as of January 04, 2010—hence our “Accumulate” recommendation. We have assigned FGB a risk rating of 4 on a scale of 1 to 5. FGB has shown incredible resilience during the crisis with an expanding loan book and balance sheet as well as robust bottom-line growth. This follows a period of exponential growth, which saw the transformation ofFGBfromasmall,undiversifiedUAEbankintooneofthemost important players in the UAE banking sector.
• In terms of assets, FGB is the fourth largest bank in the UAE banking sector with approximately 8% of total banking assets as of September 2009. The bank has been more aggressive relative to its domestic peers, outperforming them by a wide margin in terms of earnings and balance sheetgrowthinthelastfewyears.Afocusonprofitabilityunderlies the bank’s strategy. The initial strategy of the bank has been diversification, first away from strictly corporatebanking (to focus on retail in addition) and second away from strictly core-banking activities (to focus on non-core banking activities as well).
• The bank has been actively involved in the local real-estate market over the past decade, through the acquisition, development, and management of properties via the bank’s subsidiaries and associate companies, the most important of which is the fully owned Mismak Properties (a property development company). Other subsidiaries and associates include First Gulf Libyan Bank, launched in 2008 in conjunction with the Economic and Social Development Fund of Libya, First Merchant International (merchant banking services), Green Emirates Properties (property management and real estate brokerage), and Aseel Finance (Islamic mortgages). FGB has also obtained a license to operate from the Qatar Financial Center and licenses to open representativeofficesintheUnitedKingdomandIndia.
• Further weakening of asset quality is the major risk facing FGB. Although still adequate as of September 2009, the bank’s asset quality indicators have worsened in 2009. FGB’s exposure to the two troubled Saudi groups stands at around USD 104 million. However, we believe the real risk emanates from the bank’s domestic exposure. We estimate that FGB had a minimum exposure of around AED 2.26 billion (2.6% of total loans) at the end of June 2009, as part of the bank’s loan book, to the government and public sector of Dubai. It is very likely that additional exposure to “DubaiInc”isintheformoffixed-incomeinstrumentsandnon-funded commitments. FGB is a major player in the real
** Please refer to page 29 for recommendations and risk ratings.

Banking Sector - UAEJanuary 05, 2010
nbkcapi ta l .com | 18
Forecasts
2009 2010 2009 2010
Net Loans and Advances 92,624,939 107,050,681 16.7% 15.6% 10.3%
Customer Deposits 92,249,580 105,071,295 24.7% 13.9% 10.5%
Net Interest Income 3,856,039 4,377,215 49.4% 13.5% 10.5%
Net Fees and Commissions 1,241,538 1,404,127 11.5% 13.1% 11.7%
Total Operating Income 5,720,598 6,467,565 21.8% 13.1% 10.5%
Total Costs (1,134,401) (1,313,575) 0.0% 15.8% 13.4%
Prov. for Credit Losses, net (1,462,563) (1,624,068) 158.2% 11.0% -10.5%
Net Profit 3,007,809 3,418,891 0.1% 13.7% 16.6%
Figures in '000 AEDForecasts % Change 5-year
CAGR *
2Q2009 IBP a 3Q2009 IBP aAED 1055 million AED 1440 million
4Q2009 IBP f 1Q2010 IBP fAED 1065 million AED 1216 million
* CAGR: 2009–2014 Sources: Bank’s financial statements and NBK Capital
loan growth: Fgb versus sector
77%79%
13%17% 16%
12%
39%42%
3%5%
12%9%
0%
10%
20%
30%
40%
50%
60%
70%
80%
90%
2007 2008 9M2009 2009F 2010F 2011F
FGB Sector
Sources: Bank’s financial statements, CBUAE, and NBK Capital
breakdown of Fgb’s loan book
12% 15% 17%25%
11%
15% 13%
13%14%
22% 24%
24%
14%
14%18%
16%
16%
9%
12%9%
14%2%
1%3%
19% 22%15%
11%
0%
10%
20%
30%
40%
50%
60%
70%
80%
90%
100%
2005 2006 2007 2008
Others
Government
Trading and Manufacturing
Services
Real Estate and Construction
Personal (Other)
Personal (Retail)
Sources: Bank’s financial statements and NBK Capital
estatesectorandwasoneofthefirstbankstoventureintothat sector.We believe the bank currently has significantexposure, whether direct or indirect, to the UAE real estate sector. However, unless there is a further sharp drop in the realestatemarket,wedonotthinkFGBwillbesignificantlyaffected, although losses might very well be there.
• FGB outperformed its peers in 9M2009, posting solid operating incomeandnetprofit growth,drivenby soaringnet interest income and despite a surge in provisioning. FGB also outperformed in terms of both loan and deposit growth. Going forward, we see a further increase in provisioning butstillforecastnetprofittoshowaCAGRof17%inthecomingfiveyears,withloansanddepositseachrecordingaCAGR of 10%.
• FGB expanded its loan book by a whopping CAGR of 87% between 2004 and 2008, considerably outdoing the sector’s CAGR of 40% during the same period. In 9M2009, albeit much slower than in previous years, FGB’s loan book expanded by 13% to reach AED 90 billion, once again outperforming the 3% growth in sector loans.
• The breakdown of the lending portfolio shows that the primary focus for FGB has been personal loans. Personal “retail” loans, consisting of retail loans, retail mortgages and credit cards, grew as a percentage of total loans from 12% in 2005 to 25% in 2008—mirroring the bank’s strategy of boosting the retail business. Reflecting FGB’sreal estate involvement, real estate and construction loans increased as a percentage of the loan book from 14% in 2005 to 24% in 2008, although, we believe, the overall real estate exposure in FGB’s loan book is higher than that. On the other hand, the share of government loans has dropped from14%in2005to3%in2008,reflecting,webelieve,FGB’s aggressive nature and its focus on profitability. InDecember 2006, FGB won a mandate from the Government of Abu Dhabi to manage the Private Housing Home Loan Scheme. Funds worth AED 5 billion were injected into FGB’s deposit base at that time for this scheme, and by the end of September 2009, housing loans worth AED 5.7 billion had been extended.
• Similartoloangrowth,FGBhassignificantlyoutperformedthe sector in terms of deposit growth since 2006. In 9M2009, FGB recorded a notable 21% increase in deposits (the highest among the largest nine UAE banks) compared to 6% growth in sector deposits. In fact, FGB’s deposit base increased in each of the last four quarters, unlike most other UAE banks, although at a much slower pace than in previous years. Similar to other UAE banks, FGB received deposits from the Ministry of Finance in 2008 with the option of converting them into Tier II capital. As of September 2009, these funds (worth AED 4.5 billion) still formed part of

Banking Sector - UAEJanuary 05, 2010
nbkcapi ta l .com | 19
deposit growth: Fgb versus sector
52%
42%
21%
25%
14%12%
38%
29%
6%9%
12%9%
0%
10%
20%
30%
40%
50%
60%
2007 2008 9M2009 2009F 2010F 2011F
FGB Sector
Sources: Bank’s financial statements, CBUAE, and NBK Capital
net Profit growth: Fgb versus Peers
45%
31%
50%
5%
-8%
8%
1%
-22%-30%
-20%
-10%
0%
10%
20%
30%
40%
50%
60%
2006 2007 2008 9M2009
FGB Peers
Sources: Banks’ financial statements and NBK Capital
roAE: Fgb versus Peers
21%
23%
17%
16%14%
17%
21%
17%
10%11% 11%
14%
0%
5%
10%
15%
20%
25%
2007 2008 9M2009 * 2009F 2010F 2011F
FGB Peers
* Annualized Sources: Banks’ financial statements and NBK Capital
FGB’s deposits. Post-conversion, however, these funds will further boost FGB’s already comfortable CAR. The faster growth in deposits relative to loans during 2009 served to improve the bank’s liquidity as the LDR declined to 101% in September 2009, compared to 114% in September 2008. Going forward, we expect the LDR to remain close to 100%, with both net loans and deposits recording a CAGR of 10% inthecomingfiveyears.
• Whatappliestoloansanddepositsisalsotrueforprofitability,with FGB substantially outperforming the other UAE banks we cover in terms of net profit growth over the past fouryears.NetprofitballoonedtoAED3billion in2008froma mere AED 245 million in 2004, driven primarily by core earnings but also supported by non-core earnings, especially earnings from real estate. The performance in 9M2009 wasalsoimpressive,withFGB’snetprofitgrowingby5%,outperforming the largest nine UAE banks, all of which sawtheirnetprofitdeclinein9M2009,withtheexceptionof NBAD. Net interest income was the primary driver of earnings growth in 9M2009, soaring by 57%, driven by better margins and higher volumes. This performance came despite a surge in loan provisioning, which reached AED 970 million in 9M2009 compared with AED 368 million in 9M2008, and despite an AED 95 million impairment of AFS investments that was absent in 9M2008. In 2008, FGB’snetprofitgrewby50%,thehighestgrowthamongthelargest nine UAE banks. NII grew by an enormous 94% in 2008, while fee and commission income more than doubled during the year, supporting the 66% growth in operating income.
• In terms of RoAE, FGB outperformed its peers in 2008 and so far in 2009, even if we exclude ADCB. This is the case even though FGB has the highest shareholders’ equity-to-assets ratio, which stood at 17.5% as of September 2009, significantlyhigher than thebank’speers.Webelieve theoutperformance in terms ofRoAE reflects FGB’s businessmodel,wheremaximizingprofitabilityisthepriority.
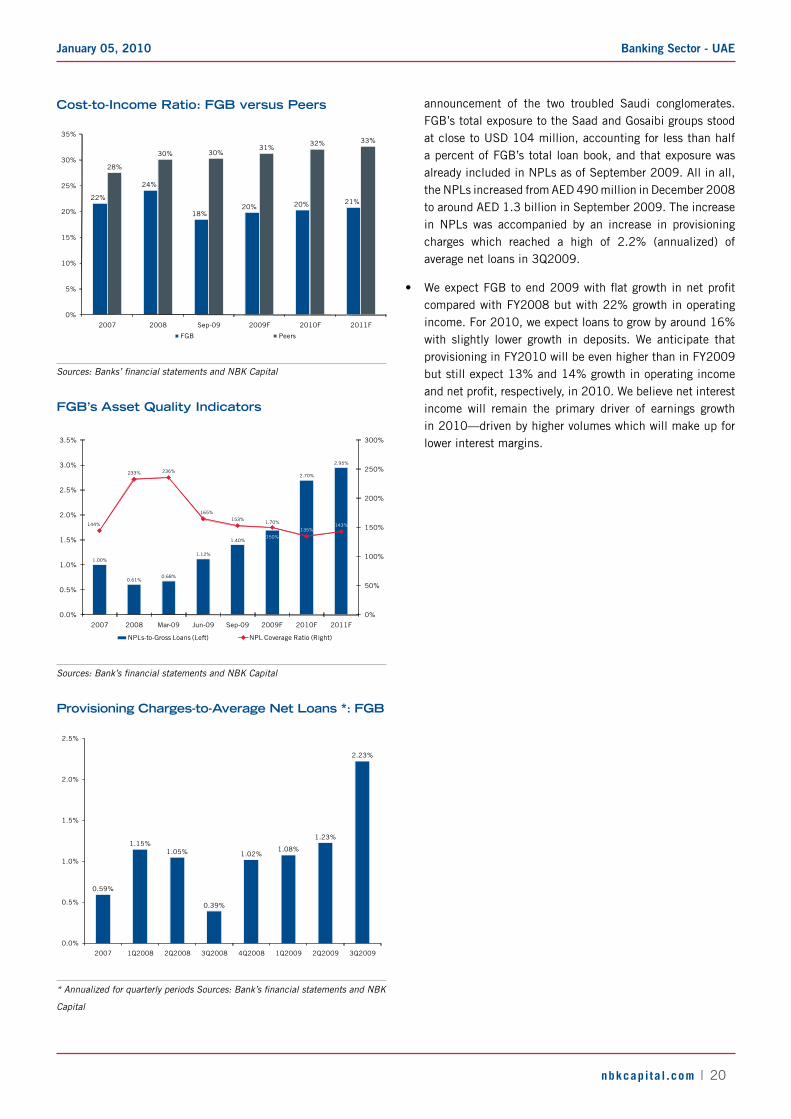
• FGBalsooutperformed in termsof cost efficiency,withasignificantlylowercost-to-incomeratiothantheaverageforthe bank’s peers over the past four years. In 9M2009, FGB’s cost-to-income ratio declined to 18.5%, as the bank made a conscious effort to reduce costs given expectations of low operatingprofitsinthecurrentenvironment.Thus,9M2009costs grew by only 10%, compared to 86% in FY2008.
• FGB displayed strong and improving asset quality indicators between 2006 and 2008 as the NPLs-to-gross loans ratio dropped from 1.4% to 0.6%, while the NPL coverage ratio increased from 130% to 233% in the same period. However, the ratios started to deteriorate in 2Q2009 and 3Q2009 as NPLs-to-gross loans doubled and NPL coverage fell. Amidst the already weak operating environment in 2009 came the
Banking Sector - UAEJanuary 05, 2010
nbkcapi ta l .com | 20
cost-to-income ratio: Fgb versus Peers
22%
24%
18%20% 20% 21%
28%
30% 30%31%
32% 33%
0%
5%
10%
15%
20%
25%
30%
35%
2007 2008 Sep-09 2009F 2010F 2011F
FGB Peers
Sources: Banks’ financial statements and NBK Capital
Fgb’s Asset Quality indicators
1.00%
0.61%0.68%
1.12%
1.40%
1.70%
2.70%
2.95%
144%
233% 236%
165%
153%
150%
135%143%
0%
50%
100%
150%
200%
250%
300%
0.0%
0.5%
1.0%
1.5%
2.0%
2.5%
3.0%
3.5%
2007 2008 Mar-09 Jun-09 Sep-09 2009F 2010F 2011F
NPLs-to-Gross Loans (Left) NPL Coverage Ratio (Right)
Sources: Bank’s financial statements and NBK Capital
Provisioning charges-to-Average net loans *: Fgb
0.59%
1.15%1.05%
0.39%
1.02%1.08%
1.23%
2.23%
0.0%
0.5%
1.0%
1.5%
2.0%
2.5%
2007 1Q2008 2Q2008 3Q2008 4Q2008 1Q2009 2Q2009 3Q2009
* Annualized for quarterly periods Sources: Bank’s financial statements and NBK
Capital
announcement of the two troubled Saudi conglomerates. FGB’s total exposure to the Saad and Gosaibi groups stood at close to USD 104 million, accounting for less than half a percent of FGB’s total loan book, and that exposure was already included in NPLs as of September 2009. All in all, the NPLs increased from AED 490 million in December 2008 to around AED 1.3 billion in September 2009. The increase in NPLs was accompanied by an increase in provisioning charges which reached a high of 2.2% (annualized) of average net loans in 3Q2009.
• WeexpectFGBtoend2009withflatgrowthinnetprofitcompared with FY2008 but with 22% growth in operating income. For 2010, we expect loans to grow by around 16% with slightly lower growth in deposits. We anticipate that provisioning in FY2010 will be even higher than in FY2009 but still expect 13% and 14% growth in operating income andnetprofit,respectively,in2010.Webelievenetinterestincome will remain the primary driver of earnings growth in 2010—driven by higher volumes which will make up for lower interest margins.

Banking Sector - UAEJanuary 05, 2010
nbkcapi ta l .com | 21
Union national bank (Unb)
Valuation
Discounted Equity Cash Flow (DECF)Dividend Discount Model (DDM)Peer-Based Valuation
Weighted Average Fair Value
40%40%
Weight (%)Value (AED)Valuation Method
20%
4.00 100%
3.903.904.60
Source: NBK Capital
key data
Closing Price* Avg. Value Traded per Day
AED 3.1 AED 2.1 million
52-Week High Market Cap
AED 4.5 AED 6.4 billion
52-Week Low Shares Outstanding
AED 1.39 2062.5 million
Reuters Bloomberg
UNB.AD UNB DH
Closely Held: 60% Public: 40%
Ownership Structure
* As of January 04, 2010 Sources: Reuters and NBK Capital
rebased Performance
0
1
2
3
4
5
Jan-09 Mar-09 May-09 Jul-09 Aug-09 Oct-09 Dec-09
UNB MSCI UAE Abu Dhabi Banking and Financial Services Index
Sources: Reuters and NBK Capital
Historical Performance
Q-o-Q Q-o-Q YTD
Change % Change % Change %
Net Loans and Advances 49,529,637 0.7% 50,712,626 2.4% 0.6%
Customer Deposits 51,155,465 -5.2% 54,690,385 6.9% 10.5%
Shareholders' Equity 9,922,919 3.1% 10,320,483 4.0% 37.1%
Total Assets 71,026,854 -2.0% 75,660,991 6.5% 16.0%
Y-o-Y Y-o-Y 9M2009
Change % Change % Change %
Net Interest Income 392,292 7.0% 403,378 2.5% 12.9%
Net Fees and Commissions 109,260 -27.0% 113,699 -24.6% -23.6%
Net Invest. Gains/(Losses) 13,556 81.8% 15,777 n/m n/m
Net Gain/(Loss) on Invest. Prop. (19,600) n/m - n/m n/m
Total Operating Income 520,141 -7.2% 557,098 -28.4% -13.8%
Total Costs (171,045) 8.0% (164,276) -1.3% 4.1%
Prov. for Credit Losses, net (76,160) n/m (31,390) n/m n/m
Net Profit 272,853 -35.7% 358,045 -38.4% -30.5%
Figures in '000 AED
Figures in '000 AED 2Q2009 3Q2009
Jun-09 Sep-09
Sources: Bank’s financial statements and NBK Capital
12-month Fair Value: AEd 4.00
recommendation: buy – risk level**: 3
reason for report: initiation of coverage
• We initiate coverage on UNB with a fair value per share of AED 4.00, 29% above the share’s closing price as of January 04, 2010—hence our “Buy” recommendation. We have assigned UNB a risk rating of 3 on a scale of 1 to 5. Among its UAE peers, UNB displayed strong asset quality indicators, high capitalization, and ample liquidity at the endofSeptember2009.Whilethecurrentfinancialcrisisled to weaker operating results in 2009, we believe that the bank’s conservative nature and its strong ownership structure are key advantages.
• UNB is a mid-sized UAE bank with a 5% market share of total banking assets as of September 2009. The bank operates with a fairly conservative strategy and tight risk management policies, as is evident from the relatively controlled credit expansion, even in the past few years when credit growth was soaring at the sector level. The Abu Dhabi Government, through the Abu Dhabi Investment Council (ADIC), and the Government of Dubai are the largest shareholders in UNB, owning stakes of 50% and 10%, respectively. The bank’s subsidiaries include Al Wifaq Finance Company, Union Brokerage Company (UBC), and Union National Bank – Egypt(UNBE).UNBhasarepresentativeofficeinShanghai,China, and has received approval from the Qatar Financial Center Regulatory Authority to set up a branch in the Qatar Financial Center.
• Similar to all UAE banks, UNB faces a major risk of asset quality deterioration. Although fairly adequate as of September 2009, UNB’s asset quality indicators have weakened during 2009 amid slower economic growth, real estatemarkettrouble,andthefinancialdifficultyfacedbythe two Saudi conglomerates. The bank has also increased its focus on non-government lending, which, although more profitable,isriskierthangovernmentlending,especiallyinthe current environment. Additionally, following the news of the troubled Saudi and UAE groups, the risk of major corporate defaults looms over all GCC banks, including UNB. Furthermore, UNB’s operations are primarily domestic, exposing both its balance sheet and earnings growth to the health of the UAE economy, which is very much tied to the price of oil.
• UNB’s9M2009performance,webelieve,reflectsthebank’sconservative strategy, as loans were flat while liquidityimproved considerably. Net interest income grew by 13%, but a 24% drop in fees, significant gains on investmentproperties in 9M2008 turning into losses in 9M2009, and a surge in credit loss provisioning resulted in a 31% decline innetprofit.WebelievenetprofitwillreachAED1.1billion
** Please refer to page 29 for recommendations and risk ratings.

Banking Sector - UAEJanuary 05, 2010
nbkcapi ta l .com | 22
Forecasts
2009 2010 2009 2010
Net Loans and Advances 51,780,174 57,196,405 2.7% 10.5% 10.2%
Customer Deposits 56,373,568 63,517,240 13.9% 12.7% 9.8%
Net Interest Income 1,601,888 1,721,378 7.0% 7.5% 11.4%
Net Fees and Commissions 434,398 491,278 -17.7% 13.1% 11.2%
Total Operating Income 2,098,026 2,402,332 -8.5% 14.5% 12.5%
Total Costs (668,806) (775,097) 4.4% 15.9% 13.9%
Prov. for Credit Losses, net (271,212) (338,892) 88.5% 25.0% -3.0%
Net Profit 1,131,924 1,270,749 -19.4% 12.3% 14.5%
Figures in '000 AEDForecasts % Change 5-year
CAGR *
2Q2009 IBP a 3Q2009 IBP aAED 349 million AED 389 million4Q2009 IBP f 1Q2010 IBP f
AED 336 million AED 370 million
CAGR: 2009–2014 Sources: Bank’s financial statements and NBK Capital
loan growth: Unb versus sector
36%35%
1%3%
10% 11%
39%
42%
3%
5%
12%
9%
0%
5%
10%
15%
20%
25%
30%
35%
40%
45%
2007 2008 9M2009 2009F 2010F 2011F
UNB Sector
Sources: Bank’s financial statements, CBUAE, and NBK Capital
breakdown of Unb’s loan book
12% 14% 15% 18%
14% 15%15%
3%
6%9%
12%
20%
21%
23%
45%
12%
12%
12%
40%33%
28%20%
0%
20%
40%
60%
80%
100%
2005 * 2006 2007 2008
Public Sector
Others
Real Estate and Construction
Financial Institutions
Trade and Services
Consumer
* Note: 2005 loan breakdown in financials does not show Trade and Services, Real Estate and Construction sectors Sources: Bank’s financial statements and NBK Capital
in FY2009, 19% below FY2008 while we forecast operating income to stand at AED 2.1 billion, 9% below FY2008. We expectnetprofitgrowthandoperatingincomegrowthtoturnpositive again in 2010, registering growth of 12% and 15%, respectively, although we still expect loan loss provisioning to be high during the year.
• UNB witnessed rapid lending growth over the past four years recording a CAGR of 33% between 2004 and 2008, but lagging the sector’s CAGR of 40% over the same period. The underperformance continued in 2009, as UNB’s loan book remainednearlyflat in9M2009,compared to3%growthinsector loans, reflecting,webelieve,UNB’sconservativestrategy.
• Theshareofpublicsector loans,definedhereasthesumof both government and public sector loans in UNB’s loan book, dropped from 40% in 2005 to 20% in 2008. On the other hand, the share of consumer loans increased from 12% in 2005 to 18% in 2008. The bank has increased its focus on the corporate and consumer segments, rather than on direct government lending, to help improve margins. The bank, which offers both conventional and Shari’ah-compliant products and services through a network of nearly 50 branches across the UAE, also offers Islamic banking services through its subsidiary, Al Wifaq Finance Company. Since the launch of this subsidiary in 2006, the Islamic banking business has grown rapidly, accounting for nearly 13% of UNB’s total loan book as of September 2009.
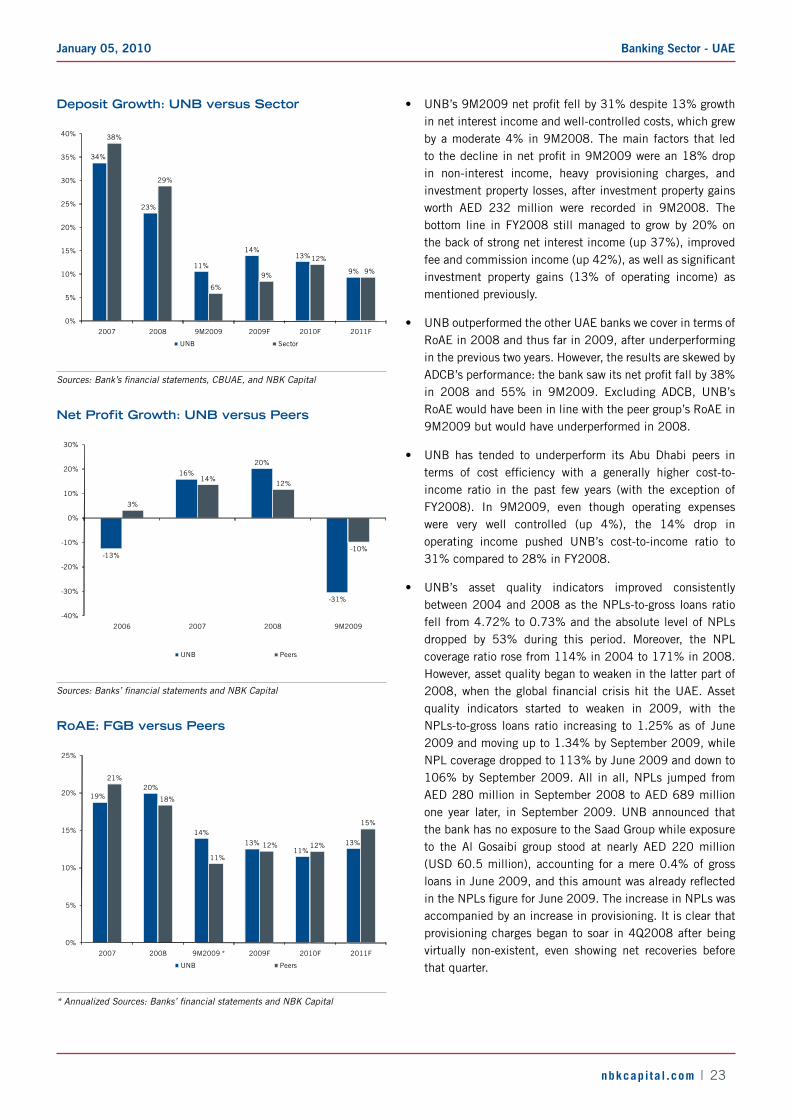
• UNB also underperformed the sector in terms of deposit growth in the 2006–2008 period. However, in 9M2009, UNB increased deposits by 11%, nearly double the growth rate witnessed in the sector as a whole. In fact, UNB has made a conscious effort to boost its liquidity in 9M2009. This was done successfully with liquid assets representing 24% of total assets as of September 2009 compared to 14% as of December 2008. Moreover, the bank’s LDR slid from 102% at the end of 2008 to 93% as of September 2009. In fact, the bank’s LDR has tended to remain below 100%. Although UNB’s conservative nature has resulted in lower loan growth during 2009, we believe the bank’s improved liquidity will facilitate lending growth when economic conditions improve.
• Similar to other UAE banks, UNB received deposits from the Ministry of Finance in 2008, with the option of converting them into Tier II capital. As of September 2009, these funds (worth AED 3.2 billion) were still part of UNB’s deposits. Post-conversion, however, these funds will further boost UNB’s already comfortable CAR. Moreover, UNB issued Tier I capital notes (to the Abu Dhabi government) worth AED 2 billion in February 2009, boosting the bank’s CAR from 11.8% in December 2008 to 17.1% in September 2009.
Banking Sector - UAEJanuary 05, 2010
nbkcapi ta l .com | 23
deposit growth: Unb versus sector
34%
23%
11%
14%13%
9%
38%
29%
6%
9%
12%
9%
0%
5%
10%
15%
20%
25%
30%
35%
40%
2007 2008 9M2009 2009F 2010F 2011F
UNB Sector
Sources: Bank’s financial statements, CBUAE, and NBK Capital
net Profit growth: Unb versus Peers
-13%
16%
20%
-31%
3%
14%12%
-10%
-40%
-30%
-20%
-10%
0%
10%
20%
30%
2006 2007 2008 9M2009
UNB Peers
Sources: Banks’ financial statements and NBK Capital
roAE: Fgb versus Peers
19%20%
14%
13%11%
13%
21%
18%
11%
12% 12%
15%
0%
5%
10%
15%
20%
25%
2007 2008 9M2009 * 2009F 2010F 2011F
UNB Peers
* Annualized Sources: Banks’ financial statements and NBK Capital
• UNB’s9M2009netprofitfellby31%despite13%growthin net interest income and well-controlled costs, which grew by a moderate 4% in 9M2008. The main factors that led tothedeclineinnetprofitin9M2009werean18%dropin non-interest income, heavy provisioning charges, and investment property losses, after investment property gains worth AED 232 million were recorded in 9M2008. The bottom line in FY2008 still managed to grow by 20% on the back of strong net interest income (up 37%), improved feeandcommissionincome(up42%),aswellassignificantinvestment property gains (13% of operating income) as mentioned previously.
• UNB outperformed the other UAE banks we cover in terms of RoAE in 2008 and thus far in 2009, after underperforming in the previous two years. However, the results are skewed by ADCB’sperformance:thebanksawitsnetprofitfallby38%in 2008 and 55% in 9M2009. Excluding ADCB, UNB’s RoAE would have been in line with the peer group’s RoAE in 9M2009 but would have underperformed in 2008.
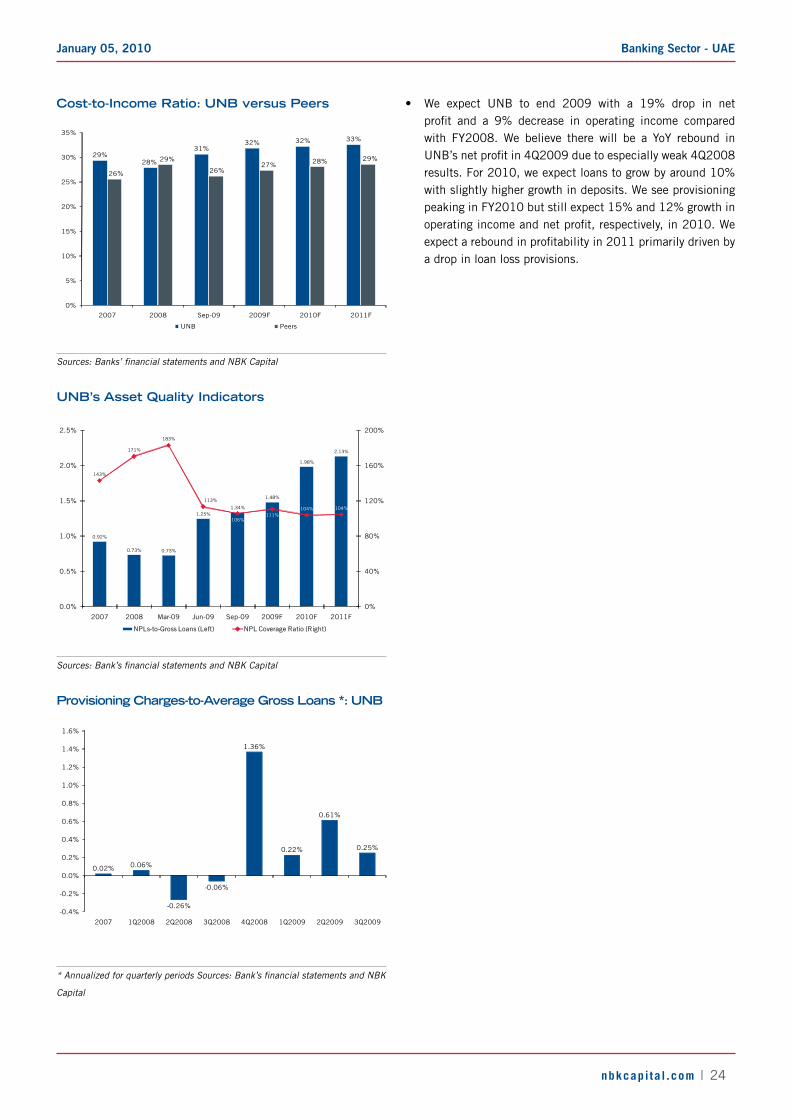
• UNB has tended to underperform its Abu Dhabi peers in terms of cost efficiency with a generally higher cost-to-income ratio in the past few years (with the exception of FY2008). In 9M2009, even though operating expenses were very well controlled (up 4%), the 14% drop in operating income pushed UNB’s cost-to-income ratio to 31% compared to 28% in FY2008.
• UNB’s asset quality indicators improved consistently between 2004 and 2008 as the NPLs-to-gross loans ratio fell from 4.72% to 0.73% and the absolute level of NPLs dropped by 53% during this period. Moreover, the NPL coverage ratio rose from 114% in 2004 to 171% in 2008. However, asset quality began to weaken in the latter part of 2008,when theglobalfinancialcrisishit theUAE.Assetquality indicators started to weaken in 2009, with the NPLs-to-gross loans ratio increasing to 1.25% as of June 2009 and moving up to 1.34% by September 2009, while NPL coverage dropped to 113% by June 2009 and down to 106% by September 2009. All in all, NPLs jumped from AED 280 million in September 2008 to AED 689 million one year later, in September 2009. UNB announced that the bank has no exposure to the Saad Group while exposure to the Al Gosaibi group stood at nearly AED 220 million (USD 60.5 million), accounting for a mere 0.4% of gross loansinJune2009,andthisamountwasalreadyreflectedintheNPLsfigureforJune2009.TheincreaseinNPLswasaccompanied by an increase in provisioning. It is clear that provisioning charges began to soar in 4Q2008 after being virtually non-existent, even showing net recoveries before that quarter.
Banking Sector - UAEJanuary 05, 2010
nbkcapi ta l .com | 24
cost-to-income ratio: Unb versus Peers
29%28%
31%32% 32% 33%
26%
29%
26%27% 28% 29%
0%
5%
10%
15%
20%
25%
30%
35%
2007 2008 Sep-09 2009F 2010F 2011F
UNB Peers
Sources: Banks’ financial statements and NBK Capital
Unb’s Asset Quality indicators
0.92%
0.73% 0.73%
1.25%1.34%
1.48%
1.98%
2.13%
143%
171%
183%
113%
106%111%
104% 104%
0%
40%
80%
120%
160%
200%
0.0%
0.5%
1.0%
1.5%
2.0%
2.5%
2007 2008 Mar-09 Jun-09 Sep-09 2009F 2010F 2011F
NPLs-to-Gross Loans (Left) NPL Coverage Ratio (Right)
Sources: Bank’s financial statements and NBK Capital
Provisioning charges-to-Average gross loans *: Unb
0.02% 0.06%
-0.26%
-0.06%
1.36%
0.22%
0.61%
0.25%
-0.4%
-0.2%
0.0%
0.2%
0.4%
0.6%
0.8%
1.0%
1.2%
1.4%
1.6%
2007 1Q2008 2Q2008 3Q2008 4Q2008 1Q2009 2Q2009 3Q2009
* Annualized for quarterly periods Sources: Bank’s financial statements and NBK
Capital
• We expect UNB to end 2009 with a 19% drop in net profit and a 9% decrease in operating income comparedwith FY2008. We believe there will be a YoY rebound in UNB’snetprofitin4Q2009duetoespeciallyweak4Q2008results. For 2010, we expect loans to grow by around 10% with slightly higher growth in deposits. We see provisioning peaking in FY2010 but still expect 15% and 12% growth in operatingincomeandnetprofit,respectively,in2010.Weexpectareboundinprofitabilityin2011primarilydrivenbya drop in loan loss provisions.

Banking Sector - UAEJanuary 05, 2010
nbkcapi ta l .com | 25
FinAnciAl stAtEmEnts
national bank of Abu dhabi
Balance Sheet (AED Thousands)
Fiscal Year Ends December 2007 2008 2009 2010 2011 2012 2013
ASSETS
Cash and Balances with Central Banks 36,399,339 19,432,923 12,562,532 14,361,750 16,670,392 17,922,706 19,782,262 Due from Banks 8,158,270 6,788,528 22,356,659 24,456,153 26,011,368 27,461,166 29,012,479 Net Investments 11,254,949 16,278,397 17,092,317 18,794,322 20,665,949 22,724,114 24,987,422 Net Loans and Advances 79,729,100 111,764,267 131,536,799 153,058,677 168,032,726 182,666,172 198,555,176 Net Fixed Assets 583,296 1,319,200 2,098,222 2,322,203 2,314,778 2,306,834 2,298,333 Other Assets 3,305,764 9,071,165 4,597,321 4,948,253 5,325,089 5,666,944 6,018,662
Total Assets 139,430,718 164,654,480 190,243,850 217,941,357 239,020,302 258,747,935 280,654,332
LIABILITIES & EQUITY
Due to Banks 27,041,015 25,796,996 30,061,675 35,080,554 36,285,792 36,557,208 37,616,325 Repurchase Agreements with Banks 5,305,965 4,535,345 2,676,955 2,944,651 3,239,116 3,563,028 3,919,330 Customer Deposits 81,736,671 103,481,145 114,965,978 135,578,115 150,728,311 164,804,247 179,874,227 Other Purchased Funds 9,950,742 11,719,219 15,523,015 13,961,174 14,140,786 14,322,193 14,505,415 Other Liabilities 4,182,093 4,765,176 6,120,334 6,584,138 7,084,485 7,583,958 8,122,580
Total Liabilities 128,216,486 150,297,881 169,347,957 194,148,632 211,478,489 226,830,634 244,037,877
Total Shareholders' Equity 11,214,232 14,356,599 20,895,894 23,792,725 27,541,813 31,917,301 36,616,455
Total Liabilities and Equity 139,430,718 164,654,480 190,243,850 217,941,357 239,020,302 258,747,935 280,654,332
ForecastHistorical
Income Statement (AED Thousands)
Fiscal Year Ends December 2007 2008 2009 2010 2011 2012 2013
Net Interest Income 2,404,957 3,607,565 4,551,555 5,232,802 5,965,655 6,619,256 7,227,764 Income from Fees and Commissions 885,277 1,131,307 1,148,286 1,272,360 1,383,649 1,518,673 1,673,351 Other Operating Income 375,370 562,410 739,569 691,328 721,781 778,857 837,017
Total Operating Income 3,665,604 5,301,282 6,439,410 7,196,491 8,071,085 8,916,787 9,738,132 Provisions for Credit Losses (41,690) (702,941) (1,239,772) (1,306,753) (858,057) (557,745) (520,773) Salaries and Employee-Related Expenses (620,191) (900,907) (1,162,170) (1,333,671) (1,535,763) (1,742,756) (1,955,568) General and Administrative Expenses (328,014) (463,025) (597,302) (679,473) (775,639) (872,425) (970,234) Depreciation (67,992) (82,171) (120,783) (184,138) (219,563) (234,932) (251,378) Other Provisions - (14,139) - - - - -
Total Operating Expenses (1,057,887) (2,163,183) (3,120,027) (3,504,036) (3,389,023) (3,407,858) (3,697,953)
Net Operating Profit 2,607,717 3,138,099 3,319,383 3,692,454 4,682,062 5,508,929 6,040,179 Other Income / (Expenses) (38,172) (47,313) (48,334) (54,370) (59,057) (70,746) (86,303) Income Taxes (64,408) (72,051) (76,097) (83,707) (92,078) (105,889) (121,773)
Net Profit 2,505,137 3,018,735 3,194,952 3,554,378 4,530,928 5,332,293 5,832,103
EPS (AED) 1.19 1.40 1.47 1.63 2.08 2.45 2.68
Historical Forecast
Key Ratios
Fiscal Year Ends December 2007 2008 2009 2010 2011 2012 2013
Growth in Loans 38.7% 40.2% 17.7% 16.4% 9.8% 8.7% 8.7%Growth in Deposits 15.5% 26.6% 11.1% 17.9% 11.2% 9.3% 9.1%Growth in Net Profit 19.0% 20.5% 5.8% 11.2% 27.5% 17.7% 9.4%Growth in Operating Income 24.0% 44.6% 21.5% 11.8% 12.2% 10.5% 9.2%
Loans-to-Assets 57.2% 67.9% 69.1% 70.2% 70.3% 70.6% 70.7%Loans-to-Deposits 97.5% 108.0% 114.4% 112.9% 111.5% 110.8% 110.4%NPLs-to-Gross Loans 1.1% 0.9% 1.4% 2.1% 2.2% 2.3% 2.3%NPL Coverage 106.0% 144.6% 144.6% 122.0% 125.5% 125.8% 124.1%Capital Adequacy 16.2% 13.7% 17.3% 16.6% 16.8% 17.3% 17.7%
Growth in Costs 46.6% 42.3% 30.0% 16.9% 15.2% 12.6% 11.5%Non-Interest Expense-to-Average Assets 0.9% 1.4% 1.8% 1.7% 1.5% 1.4% 1.4%Cost-to-Income 27.7% 27.3% 29.2% 30.5% 31.4% 32.0% 32.6%Non-Interest Income-to-Operating Inc. 34.4% 31.9% 29.3% 27.3% 26.1% 25.8% 25.8%
Dividend Payout 26.3% 19.6% 20.4% 21.8% 20.9% 21.1% 22.8%Net Interest Margin 2.1% 2.5% 2.7% 2.6% 2.7% 2.7% 2.8%RoAE 24.8% 23.6% 18.1% 15.9% 17.7% 17.9% 17.0%RoAA 2.1% 2.0% 1.8% 1.7% 2.0% 2.1% 2.2%
ForecastHistorical
Sources: Bank’s financial statements and NBK Capital
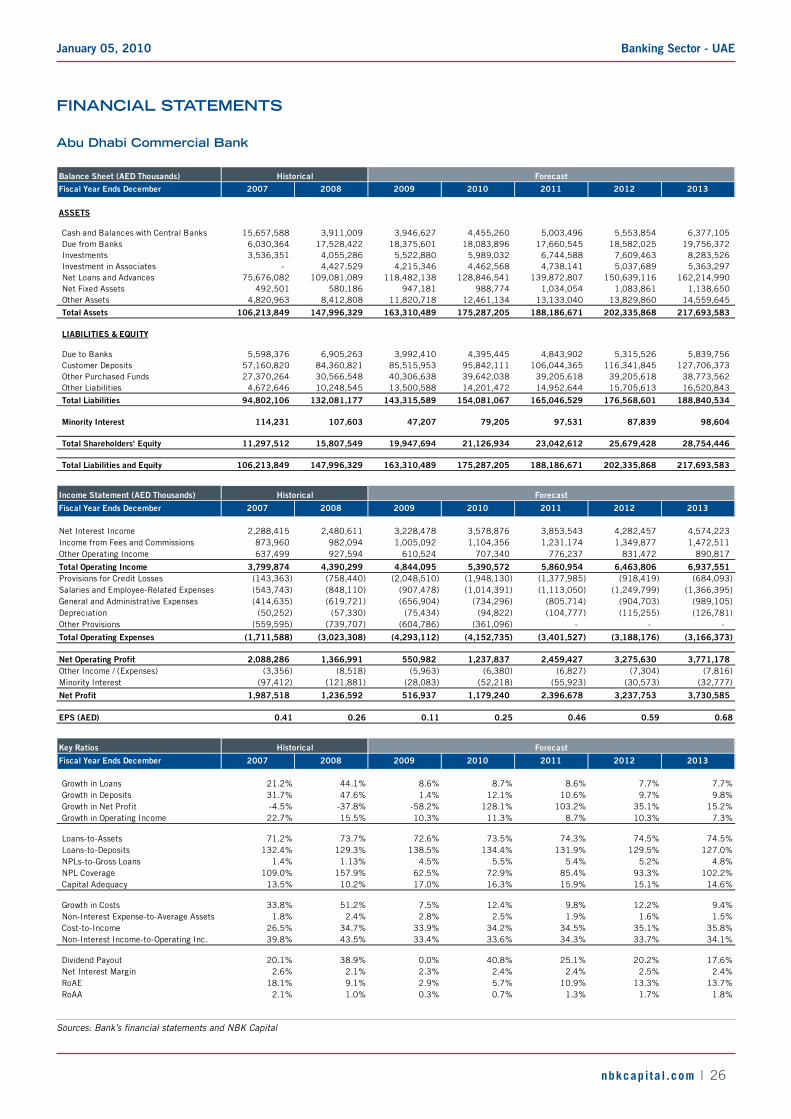
Banking Sector - UAEJanuary 05, 2010
nbkcapi ta l .com | 26
FinAnciAl stAtEmEnts
Abu dhabi commercial bank
Balance Sheet (AED Thousands)
Fiscal Year Ends December 2007 2008 2009 2010 2011 2012 2013
ASSETS
Cash and Balances with Central Banks 15,657,588 3,911,009 3,946,627 4,455,260 5,003,496 5,553,854 6,377,105 Due from Banks 6,030,364 17,528,422 18,375,601 18,083,896 17,660,545 18,582,025 19,756,372 Investments 3,536,351 4,055,286 5,522,880 5,989,032 6,744,588 7,609,463 8,283,526 Investment in Associates - 4,427,529 4,215,346 4,462,568 4,738,141 5,037,689 5,363,297 Net Loans and Advances 75,676,082 109,081,089 118,482,138 128,846,541 139,872,807 150,639,116 162,214,990 Net Fixed Assets 492,501 580,186 947,181 988,774 1,034,054 1,083,861 1,138,650 Other Assets 4,820,963 8,412,808 11,820,718 12,461,134 13,133,040 13,829,860 14,559,645
Total Assets 106,213,849 147,996,329 163,310,489 175,287,205 188,186,671 202,335,868 217,693,583
LIABILITIES & EQUITY
Due to Banks 5,598,376 6,905,263 3,992,410 4,395,445 4,843,902 5,315,526 5,839,756 Customer Deposits 57,160,820 84,360,821 85,515,953 95,842,111 106,044,365 116,341,845 127,706,373 Other Purchased Funds 27,370,264 30,566,548 40,306,638 39,642,038 39,205,618 39,205,618 38,773,562 Other Liabilities 4,672,646 10,248,545 13,500,588 14,201,472 14,952,644 15,705,613 16,520,843
Total Liabilities 94,802,106 132,081,177 143,315,589 154,081,067 165,046,529 176,568,601 188,840,534
Minority Interest 114,231 107,603 47,207 79,205 97,531 87,839 98,604
Total Shareholders' Equity 11,297,512 15,807,549 19,947,694 21,126,934 23,042,612 25,679,428 28,754,446
Total Liabilities and Equity 106,213,849 147,996,329 163,310,489 175,287,205 188,186,671 202,335,868 217,693,583
ForecastHistorical
Income Statement (AED Thousands)
Fiscal Year Ends December 2007 2008 2009 2010 2011 2012 2013
Net Interest Income 2,288,415 2,480,611 3,228,478 3,578,876 3,853,543 4,282,457 4,574,223 Income from Fees and Commissions 873,960 982,094 1,005,092 1,104,356 1,231,174 1,349,877 1,472,511 Other Operating Income 637,499 927,594 610,524 707,340 776,237 831,472 890,817
Total Operating Income 3,799,874 4,390,299 4,844,095 5,390,572 5,860,954 6,463,806 6,937,551 Provisions for Credit Losses (143,363) (758,440) (2,048,510) (1,948,130) (1,377,985) (918,419) (684,093) Salaries and Employee-Related Expenses (543,743) (848,110) (907,478) (1,014,391) (1,113,050) (1,249,799) (1,366,395) General and Administrative Expenses (414,635) (619,721) (656,904) (734,296) (805,714) (904,703) (989,105) Depreciation (50,252) (57,330) (75,434) (94,822) (104,777) (115,255) (126,781) Other Provisions (559,595) (739,707) (604,786) (361,096) - - -
Total Operating Expenses (1,711,588) (3,023,308) (4,293,112) (4,152,735) (3,401,527) (3,188,176) (3,166,373)
Net Operating Profit 2,088,286 1,366,991 550,982 1,237,837 2,459,427 3,275,630 3,771,178 Other Income / (Expenses) (3,356) (8,518) (5,963) (6,380) (6,827) (7,304) (7,816) Minority Interest (97,412) (121,881) (28,083) (52,218) (55,923) (30,573) (32,777)
Net Profit 1,987,518 1,236,592 516,937 1,179,240 2,396,678 3,237,753 3,730,585
EPS (AED) 0.41 0.26 0.11 0.25 0.46 0.59 0.68
Historical Forecast
Key Ratios
Fiscal Year Ends December 2007 2008 2009 2010 2011 2012 2013
Growth in Loans 21.2% 44.1% 8.6% 8.7% 8.6% 7.7% 7.7%Growth in Deposits 31.7% 47.6% 1.4% 12.1% 10.6% 9.7% 9.8%Growth in Net Profit -4.5% -37.8% -58.2% 128.1% 103.2% 35.1% 15.2%Growth in Operating Income 22.7% 15.5% 10.3% 11.3% 8.7% 10.3% 7.3%
Loans-to-Assets 71.2% 73.7% 72.6% 73.5% 74.3% 74.5% 74.5%Loans-to-Deposits 132.4% 129.3% 138.5% 134.4% 131.9% 129.5% 127.0%NPLs-to-Gross Loans 1.4% 1.13% 4.5% 5.5% 5.4% 5.2% 4.8%NPL Coverage 109.0% 157.9% 62.5% 72.9% 85.4% 93.3% 102.2%Capital Adequacy 13.5% 10.2% 17.0% 16.3% 15.9% 15.1% 14.6%
Growth in Costs 33.8% 51.2% 7.5% 12.4% 9.8% 12.2% 9.4%Non-Interest Expense-to-Average Assets 1.8% 2.4% 2.8% 2.5% 1.9% 1.6% 1.5%Cost-to-Income 26.5% 34.7% 33.9% 34.2% 34.5% 35.1% 35.8%Non-Interest Income-to-Operating Inc. 39.8% 43.5% 33.4% 33.6% 34.3% 33.7% 34.1%
Dividend Payout 20.1% 38.9% 0.0% 40.8% 25.1% 20.2% 17.6%Net Interest Margin 2.6% 2.1% 2.3% 2.4% 2.4% 2.5% 2.4%RoAE 18.1% 9.1% 2.9% 5.7% 10.9% 13.3% 13.7%RoAA 2.1% 1.0% 0.3% 0.7% 1.3% 1.7% 1.8%
Historical Forecast
Sources: Bank’s financial statements and NBK Capital

Banking Sector - UAEJanuary 05, 2010
nbkcapi ta l .com | 27
FinAnciAl stAtEmEnts
First gulf bank
Balance Sheet (AED Thousands)
Fiscal Year Ends December 2007 2008 2009 2010 2011 2012 2013
ASSETS
Cash and balances with Central Banks 8,977,874 5,005,045 7,112,941 6,855,344 8,331,531 11,327,375 13,944,824 Due from Banks 4,184,886 2,837,412 5,452,338 5,708,772 5,954,637 6,171,749 6,406,242 Net Investments 13,358,855 14,523,947 19,309,158 20,664,024 22,713,192 24,969,283 27,453,303 Net Loans and Advances 44,409,268 79,362,996 92,624,939 107,050,681 119,396,704 129,134,660 140,138,104 Net Fixed Assets 1,525,849 2,012,260 994,238 1,065,838 1,131,502 1,203,732 1,283,186 Other Assets 740,813 3,780,048 4,430,272 5,080,597 5,817,364 6,635,099 7,551,921
Total Assets 73,197,545 107,521,708 129,923,885 146,425,256 163,344,930 179,441,898 196,777,580
LIABILITIES & EQUITY
Due to Banks 2,786,232 3,112,642 5,724,955 5,937,123 6,133,276 6,295,184 6,534,367 Customer Deposits 52,256,069 73,962,659 92,249,580 105,071,295 117,364,540 128,220,126 139,944,792 Other Purchased Funds 5,784,975 5,784,975 4,865,225 5,114,530 5,368,820 5,628,196 5,892,760 Other Liabilities 2,249,835 8,041,822 4,407,539 4,671,345 4,955,171 5,244,152 5,546,796
Total Liabilities 63,077,111 90,902,098 107,247,298 120,794,292 133,821,808 145,387,659 157,918,715
Minority Interest 9 374,369 382,780 383,811 385,100 386,712 388,726
Total Shareholders' Equity 10,120,425 16,245,241 22,293,807 25,247,152 29,138,022 33,667,528 38,470,139
Total Liabilities and Equity 73,197,545 107,521,708 129,923,885 146,425,256 163,344,930 179,441,898 196,777,580
ForecastHistorical
Income Statement (AED Thousands)
Fiscal Year Ends December 2007 2008 2009 2010 2011 2012 2013
Net Interest Income 1,331,312 2,580,500 3,856,039 4,377,215 4,896,766 5,365,508 5,775,233 Income from Fees and Commissions 461,521 1,113,715 1,241,538 1,404,127 1,567,109 1,717,228 1,937,346 Other Operating Income 1,032,973 1,004,234 623,021 686,223 750,641 818,978 881,285
Total Operating Income 2,825,806 4,698,449 5,720,598 6,467,565 7,214,516 7,901,714 8,593,864 Provisions for Credit Losses (206,946) (566,350) (1,462,563) (1,624,068) (1,208,525) (802,611) (790,892) Salaries and Employee-Related Expenses (330,190) (559,502) (542,717) (629,864) (721,504) (811,874) (907,346) General and Administrative Expenses (255,051) (536,584) (537,657) (623,991) (714,777) (804,304) (898,887) Depreciation (25,460) (38,810) (54,027) (59,720) (65,691) (72,261) (79,487) Other Provisions - - (115,000) (110,000) - - -
Total Operating Expenses (817,647) (1,701,246) (2,711,964) (3,047,643) (2,710,497) (2,491,050) (2,676,611)
Net Operating Profit 2,008,159 2,997,203 3,008,634 3,419,922 4,504,019 5,410,665 5,917,253 Minority Interest 21 8,047 (825) (1,031) (1,289) (1,611) (2,014)
Net Profit 2,008,180 3,005,250 3,007,809 3,418,891 4,502,730 5,409,053 5,915,239
EPS (AED) 1.46 2.19 2.19 2.49 3.16 3.61 3.94
Historical Forecast
Key Ratios
Fiscal Year Ends December 2007 2008 2009 2010 2011 2012 2013
Growth in Loans 76.5% 78.7% 16.7% 15.6% 11.5% 8.2% 8.5%Growth in Deposits 51.8% 41.5% 24.7% 13.9% 11.7% 9.2% 9.1%Growth in Net Profit 30.8% 49.7% 0.1% 13.7% 31.7% 20.1% 9.4%Growth in Operating Income 36.6% 66.3% 21.8% 13.1% 11.5% 9.5% 8.8%
Loans-to-Assets 60.7% 73.8% 71.3% 73.1% 73.1% 72.0% 71.2%Loans-to-Deposits 85.0% 107.3% 100.4% 101.9% 101.7% 100.7% 100.1%NPLs-to-Gross Loans 1.0% 0.6% 1.7% 2.7% 2.9% 3.0% 3.1%NPL Coverage 144.4% 232.9% 150.1% 135.0% 143.0% 147.0% 148.0%Capital Adequacy 15.0% 14.1% 18.8% 18.7% 19.2% 20.0% 20.7%
Growth in Costs 52.6% 85.8% 0.0% 15.8% 14.3% 12.4% 11.7%Non-Interest Expense-to-Average Assets 1.4% 1.9% 2.3% 2.2% 1.8% 1.5% 1.4%Cost-to-Income 21.6% 24.2% 19.8% 20.3% 20.8% 21.4% 21.9%Non-Interest Income-to-Operating Inc. 52.9% 45.1% 32.6% 32.3% 32.1% 32.1% 32.8%
Dividend Payout 12.4% 15.9% 15.5% 17.9% 19.5% 20.6% 22.4%Net Interest Margin 2.3% 3.1% 3.6% 3.5% 3.4% 3.4% 3.3%RoAE 21.0% 22.8% 15.6% 14.4% 16.6% 17.2% 16.4%RoAA 3.3% 3.3% 2.5% 2.5% 2.9% 3.2% 3.1%
ForecastHistorical
Sources: Bank’s financial statements and NBK Capital
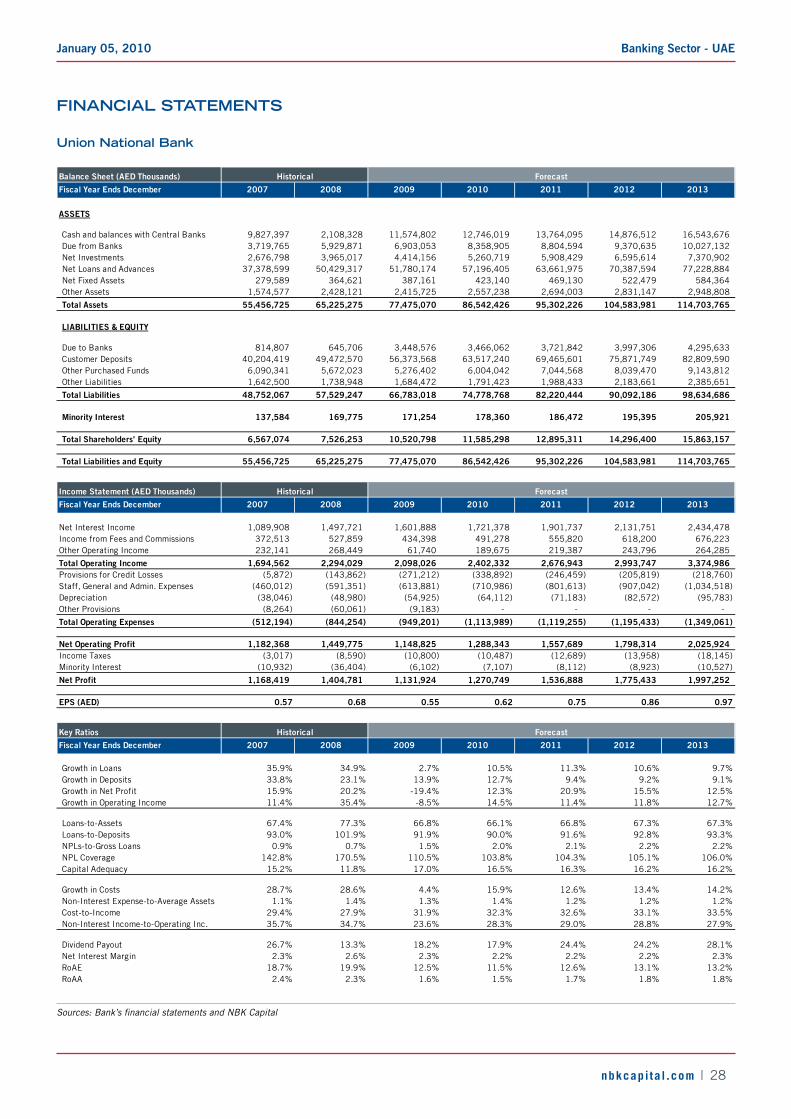
Banking Sector - UAEJanuary 05, 2010
nbkcapi ta l .com | 28
FinAnciAl stAtEmEnts
Union national bank
Balance Sheet (AED Thousands)
Fiscal Year Ends December 2007 2008 2009 2010 2011 2012 2013
ASSETS
Cash and balances with Central Banks 9,827,397 2,108,328 11,574,802 12,746,019 13,764,095 14,876,512 16,543,676 Due from Banks 3,719,765 5,929,871 6,903,053 8,358,905 8,804,594 9,370,635 10,027,132 Net Investments 2,676,798 3,965,017 4,414,156 5,260,719 5,908,429 6,595,614 7,370,902 Net Loans and Advances 37,378,599 50,429,317 51,780,174 57,196,405 63,661,975 70,387,594 77,228,884 Net Fixed Assets 279,589 364,621 387,161 423,140 469,130 522,479 584,364 Other Assets 1,574,577 2,428,121 2,415,725 2,557,238 2,694,003 2,831,147 2,948,808
Total Assets 55,456,725 65,225,275 77,475,070 86,542,426 95,302,226 104,583,981 114,703,765
LIABILITIES & EQUITY
Due to Banks 814,807 645,706 3,448,576 3,466,062 3,721,842 3,997,306 4,295,633 Customer Deposits 40,204,419 49,472,570 56,373,568 63,517,240 69,465,601 75,871,749 82,809,590 Other Purchased Funds 6,090,341 5,672,023 5,276,402 6,004,042 7,044,568 8,039,470 9,143,812 Other Liabilities 1,642,500 1,738,948 1,684,472 1,791,423 1,988,433 2,183,661 2,385,651
Total Liabilities 48,752,067 57,529,247 66,783,018 74,778,768 82,220,444 90,092,186 98,634,686
Minority Interest 137,584 169,775 171,254 178,360 186,472 195,395 205,921
Total Shareholders' Equity 6,567,074 7,526,253 10,520,798 11,585,298 12,895,311 14,296,400 15,863,157
Total Liabilities and Equity 55,456,725 65,225,275 77,475,070 86,542,426 95,302,226 104,583,981 114,703,765
ForecastHistorical
Income Statement (AED Thousands)
Fiscal Year Ends December 2007 2008 2009 2010 2011 2012 2013
Net Interest Income 1,089,908 1,497,721 1,601,888 1,721,378 1,901,737 2,131,751 2,434,478 Income from Fees and Commissions 372,513 527,859 434,398 491,278 555,820 618,200 676,223 Other Operating Income 232,141 268,449 61,740 189,675 219,387 243,796 264,285
Total Operating Income 1,694,562 2,294,029 2,098,026 2,402,332 2,676,943 2,993,747 3,374,986 Provisions for Credit Losses (5,872) (143,862) (271,212) (338,892) (246,459) (205,819) (218,760) Staff, General and Admin. Expenses (460,012) (591,351) (613,881) (710,986) (801,613) (907,042) (1,034,518) Depreciation (38,046) (48,980) (54,925) (64,112) (71,183) (82,572) (95,783) Other Provisions (8,264) (60,061) (9,183) - - - -
Total Operating Expenses (512,194) (844,254) (949,201) (1,113,989) (1,119,255) (1,195,433) (1,349,061)
Net Operating Profit 1,182,368 1,449,775 1,148,825 1,288,343 1,557,689 1,798,314 2,025,924 Income Taxes (3,017) (8,590) (10,800) (10,487) (12,689) (13,958) (18,145) Minority Interest (10,932) (36,404) (6,102) (7,107) (8,112) (8,923) (10,527)
Net Profit 1,168,419 1,404,781 1,131,924 1,270,749 1,536,888 1,775,433 1,997,252
EPS (AED) 0.57 0.68 0.55 0.62 0.75 0.86 0.97
Historical Forecast
Key Ratios
Fiscal Year Ends December 2007 2008 2009 2010 2011 2012 2013
Growth in Loans 35.9% 34.9% 2.7% 10.5% 11.3% 10.6% 9.7%Growth in Deposits 33.8% 23.1% 13.9% 12.7% 9.4% 9.2% 9.1%Growth in Net Profit 15.9% 20.2% -19.4% 12.3% 20.9% 15.5% 12.5%Growth in Operating Income 11.4% 35.4% -8.5% 14.5% 11.4% 11.8% 12.7%
Loans-to-Assets 67.4% 77.3% 66.8% 66.1% 66.8% 67.3% 67.3%Loans-to-Deposits 93.0% 101.9% 91.9% 90.0% 91.6% 92.8% 93.3%NPLs-to-Gross Loans 0.9% 0.7% 1.5% 2.0% 2.1% 2.2% 2.2%NPL Coverage 142.8% 170.5% 110.5% 103.8% 104.3% 105.1% 106.0%Capital Adequacy 15.2% 11.8% 17.0% 16.5% 16.3% 16.2% 16.2%
Growth in Costs 28.7% 28.6% 4.4% 15.9% 12.6% 13.4% 14.2%Non-Interest Expense-to-Average Assets 1.1% 1.4% 1.3% 1.4% 1.2% 1.2% 1.2%Cost-to-Income 29.4% 27.9% 31.9% 32.3% 32.6% 33.1% 33.5%Non-Interest Income-to-Operating Inc. 35.7% 34.7% 23.6% 28.3% 29.0% 28.8% 27.9%
Dividend Payout 26.7% 13.3% 18.2% 17.9% 24.4% 24.2% 28.1%Net Interest Margin 2.3% 2.6% 2.3% 2.2% 2.2% 2.2% 2.3%RoAE 18.7% 19.9% 12.5% 11.5% 12.6% 13.1% 13.2%RoAA 2.4% 2.3% 1.6% 1.5% 1.7% 1.8% 1.8%
ForecastHistorical
Sources: Bank’s financial statements and NBK Capital
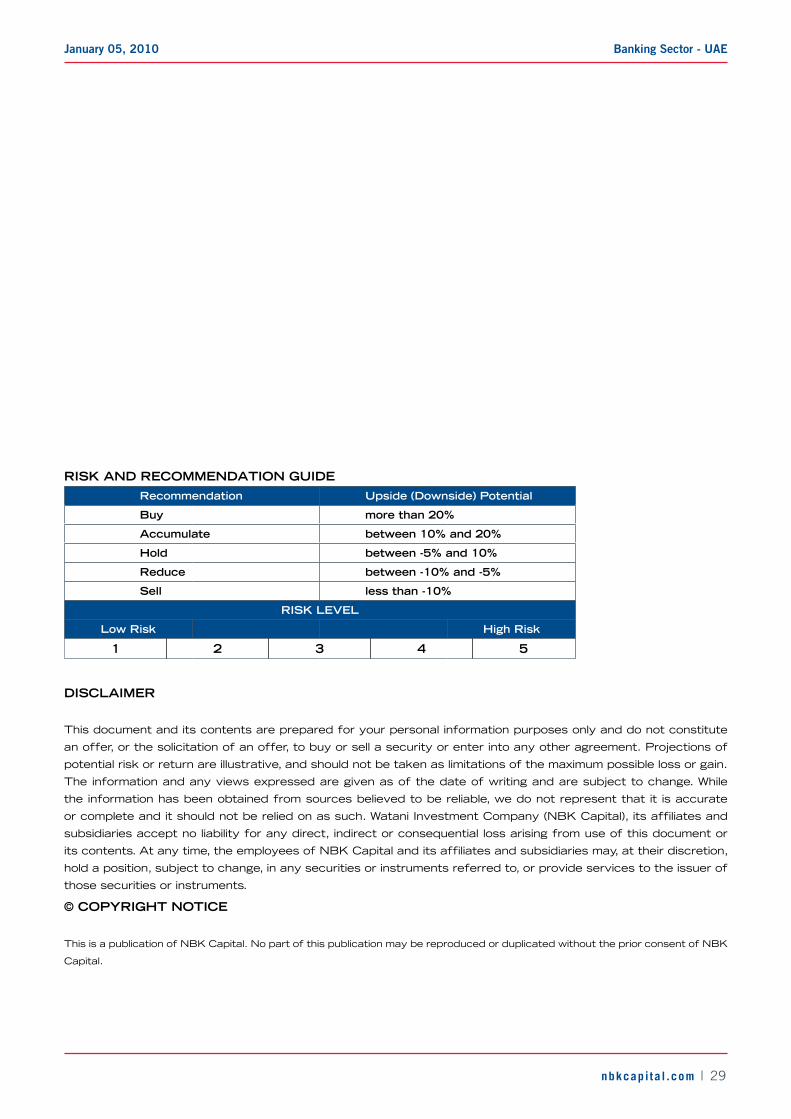
Banking Sector - UAEJanuary 05, 2010
nbkcapi ta l .com | 29
risk And rEcommEndAtion gUidE
recommendation Upside (downside) Potential
buy more than 20%
Accumulate between 10% and 20%
Hold between -5% and 10%
reduce between -10% and -5%
sell less than -10%
risk lEVEl
low risk High risk
1 2 3 4 5
disclAimEr
This document and its contents are prepared for your personal information purposes only and do not constitute
an offer, or the solicitation of an offer, to buy or sell a security or enter into any other agreement. Projections of
potential risk or return are illustrative, and should not be taken as limitations of the maximum possible loss or gain.
The information and any views expressed are given as of the date of writing and are subject to change. While
the information has been obtained from sources believed to be reliable, we do not represent that it is accurate
or complete and it should not be relied on as such. Watani Investment Company (NBK Capital), its affiliates and
subsidiaries accept no liability for any direct, indirect or consequential loss arising from use of this document or
its contents. At any time, the employees of NBK Capital and its affiliates and subsidiaries may, at their discretion,
hold a position, subject to change, in any securities or instruments referred to, or provide services to the issuer of
those securities or instruments.
© coPYrigHt noticE
This is a publication of NBK Capital. No part of this publication may be reproduced or duplicated without the prior consent of NBK
Capital.

Banking Sector - UAEJanuary 05, 2010
nbkcapi ta l .com | 30
Kuwait
National Bank of Kuwait SAKAbdullah Al-Ahmed StreetP.O. Box 95, Safat 13001KuwaitCity,KuwaitT. +965 2242 2011F. +965 2243 1888Telex:22043-22451NATBANK
intErnAtionAl nEtWork
Bahrain
National Bank of Kuwait SAKBahrain BranchSeef Tower, Al-Seef DistrictP.O. Box 5290, Manama, BahrainT. +973 17 583 333F. +973 17 587 111
Saudi Arabia
National Bank of Kuwait SAKJeddah BranchAl-Andalus Street, Red Sea PlazaP.O. Box 15385Jeddah 21444, Saudi ArabiaT. +966 2 653 8600F. +966 2 653 8653
United Arab Emirates
National Bank of Kuwait SAKDubai BranchSheikh Rashed Road, Port Saeed Area, ACICO Business ParkP.O. Box 88867, DubaiUnited Arab EmiratesT. +971 4 2929 222F. +971 4 2943 337
Jordan
National Bank of Kuwait SAKHead OfficeAl Hajj Mohd Abdul Rahim StreetHijazi Plaza, Building # 70P.O.Box 941297,Amman -11194, JordanT. +962 6 580 0400F. +962 6 580 0441
Lebanon
National Bank of Kuwait(Lebanon) SALSanayehHeadOfficeBAC Building, Justinian StreetP.O. Box 11-5727, Riyad El Solh1107 2200 Beirut, LebanonT. +961 1 759 700F. +961 1 747 866
Iraq
Credit Bank of IraqStreet 9, Building 187Sadoon Street, District 102P.O.Box 3420, Baghdad, IraqT. +964 1 7182198/7191944 +964 1 7188406/7171673F. +964 1 7170156
Egypt
Al Watany Bank of Egypt13 Al Themar StreetGameat Al Dowal AlArabiaFouad Mohie El Din SquareMohandessin, Giza, EgyptT. +202 333 888 16/17F. +202 333 79302
United States of America
National Bank of Kuwait SAKNew York Branch299 Park Avenue, 17th FloorNew York, NY 10171, USAT. +1 212 303 9800F. +1 212 319 8269
United Kingdom
National Bank of Kuwait (Intl.) PlcHead Office13 George Street,LondonW1U3QJ,UKT. +44 20 7224 2277F. +44 20 7224 2101
NBK InvestmentManagement Limited13 George StreetLondonW1U3QJ,UKT. +44 20 7224 2288F. +44 20 7224 2102
France
National Bank of Kuwait (Intl.) PlcParis Branch90 Avenue des Champs-Elysees75008 Paris, FranceT. +33 1 5659 8600F. +33 1 5659 8623
Singapore
National Bank of Kuwait SAKSingapore Branch9RafflesPlace#51-01/02Republic Plaza, Singapore 048619T. +65 6222 5348F. +65 6224 5438
Vietnam
National Bank of Kuwait SAKVietnam Representative OfficeRoom 2006, Sun Wah Tower115 Nguyen Hue Blvd, District 1Ho Chi Minh City, VietnamT. +84 8 3827 8008F. +84 8 3827 8009
China
National Bank of Kuwait SAKShanghai Representative OfficeSuite 1003, 10th Floor,Azia Center, 1233 Lujiazui Ring Rd.Shanghai 200120, ChinaT. +86 21 6888 1092F. +86 21 5047 1011AssociAtEs
Qatar
International Bank of Qatar (QSC)Suhaim bin Hamad StreetP.O.Box 2001Doha, QatarT. +974 447 3700F. +974 447 3710
Turkey
Turkish BankHead OfficeValikonagl Avenue No. 1P.O.Box 34371 Nisantasi,Istanbul, TurkeyT. +90 212 373 6373F. +90 212 225 0353
nAtionAl bAnk oF kUWAit
Kuwait
Head Office38th Floor, Arraya IIAl Shuhada Street, Block 6, SharqP.O.Box 4950, Safat 13050KuwaitT. +965 2224 6900F. +965 2224 6905
MENA Research35th Floor, Arraya IIAl Shuhada Street, Block 6, SharqP.O.Box4950,Safat13050,KuwaitT. +965 2224 6663F. +965 2224 6905E. [email protected]
Brokerage37th Floor, Arraya IIAl Shuhada Street, Block 6, SharqP.O.Box4950,Safat13050,KuwaitT. +965 2224 6964F. +965 2224 6978E. [email protected]
United Arab Emirates
NBK Capital LimitedPrecinctBuilding3,Office404Dubai International Financial CenterP.O.Box 506506Dubai, UAET. +971 4 365 2800F. +971 4 365 2805
Turkey
NBK CapitalArastima ve Musavirlik AS,Sun Plaza, 30th Floor,Dereboyu Sk. No.24Maslak 34398, Istanbul, TurkeyT. +90 212 276 5400F. +90 212 276 5401
nbk cAPitAl

KUWAIT DUBAI ISTANBUL