Full-length transcriptome analysis reveals the mechanism ...
1
Transcriptome-wide association study identifies new candidate susceptibility genes for glioma
Isabelle Atkins1*, Ben Kinnersley1*, Quinn T Ostrom2,3, Karim Labreche1, Dora Il’yasova4,5, Georgina N
Armstrong3, Jeanette E Eckel-Passow6, Minouk J Schoemaker1, Markus M Nöthen7,8, Jill S Barnholtz-
Sloan2, Anthony J Swerdlow1,9, Matthias Simon10, Preetha Rajaraman11, Stephen J Chanock11, Joellen
Shildkraut12, Jonine L Bernstein13, Per Hoffmann14,15, Karl-Heinz Jöckel16, Rose K Lai17, Elizabeth B
Claus18,19, Sara H Olson13, Christoffer Johansen20,21, Margaret R Wrensch22,23, Beatrice Melin24, Robert
B Jenkins25, Marc Sanson26,27, Melissa L Bondy3, Richard S Houlston1,28.
* Equal contribution.
Author affiliations:
1. Division of Genetics and Epidemiology, The Institute of Cancer Research, 15 Cotswold Road,
London, SM2 5NG, UK.
2. Case Comprehensive Cancer Center, School of Medicine, Case Western Reserve University,
Cleveland, OH, USA.
3. Department of Medicine, Section of Epidemiology and Population Sciences, Dan L. Duncan
Comprehensive Cancer Center, Baylor College of Medicine, Houston, TX, USA.
4. Department of Population Health Sciences, School of Public Health, Georgia State University,
Atlanta, GA, USA.
5. Cancer Control and Prevention Program, Department of Community and Family Medicine,
Duke University Medical Center, Durham, NC, USA.
6. Division of Biomedical Statistics and Informatics, Mayo Clinic College of Medicine, Rochester,
MN, USA.
7. Department of Genomics, Life & Brain Center, University of Bonn, Bonn, Germany.
8. Institute of Human Genetics, University of Bonn School of Medicine & University Hospital
Bonn, Bonn, Germany.
9. Division of Breast Cancer Research, The Institute of Cancer Research, London, SW7 3RP, UK.
10. Department of Neurosurgery, University of Bonn Medical Center, Sigmund-Freud Str. 25,
53105, Bonn, Germany.
11. Division of Cancer Epidemiology and Genetics, National Cancer Institute, Bethesda, USA.
12. Department of Public Health Sciences, University of Virginia, Charlottesville, VA, USA.
13. Department of Epidemiology and Biostatistics, Memorial Sloan Kettering Cancer Center, New
York, NY, 10017, USA.
Research. on March 17, 2021. © 2019 American Association for Cancercancerres.aacrjournals.org Downloaded from
Author manuscripts have been peer reviewed and accepted for publication but have not yet been edited. Author Manuscript Published OnlineFirst on February 1, 2019; DOI: 10.1158/0008-5472.CAN-18-2888
2
14. Human Genomics Research Group, Department of Biomedicine, University of Basel, Basel,
4031, Switzerland.
15. Department of Genomics, Life & Brain Center, University of Bonn, Bonn, 53127, Germany.
16. Institute for Medical Informatics, Biometry and Epidemiology, University Hospital Essen,
University of Duisburg-Essen, Essen, 45147, Germany.
17. Departments of Neurology and Preventive Medicine, Keck School of Medicine, University of
Southern California, Los Angeles, CA, USA.
18. School of Public Health, Yale University, New Haven, CT, USA.
19. Department of Neurosurgery, Brigham and Women's Hospital, Boston, MA, USA.
20. Institute of Cancer Epidemiology, Danish Cancer Society, Copenhagen, Denmark.
21. Rigshospitalet, University of Copenhagen, Copenhagen, Denmark.
22. Department of Neurological Surgery, School of Medicine, University of California, San
Francisco, San Francisco, CA, USA.
23. Institute of Human Genetics, University of California, San Francisco, CA, USA.
24. Department of Radiation Sciences, Umeå University, Umeå, Sweden.
25. Department of Laboratory Medicine and Pathology, Mayo Clinic Comprehensive Cancer
Center, Mayo Clinic, Rochester, MN, USA.
26. Sorbonne Universités UPMC Univ Paris 06, INSERM CNRS, U1127, UMR 7225, ICM, F-75013,
Paris, France.
27. AP-HP, Groupe Hospitalier Pitié-Salpêtrière, Service de neurologie 2-Mazarin, Paris, France.
28. Division of Molecular Pathology, The Institute of Cancer Research, London, UK
Running title: Glioma transcriptome-wide association study
Keywords: Glioma, transcriptome-wide association study, susceptibility, GBM
Correspondence to: Ben Kinnersley; Division of Genetics and Epidemiology, The Institute of Cancer
Research, 15 Cotswold Road, London, SM2 5NG, UK; Tel +44 (0) 208 722 4424; E-mail:
The authors declare no potential conflicts of interest
Research. on March 17, 2021. © 2019 American Association for Cancercancerres.aacrjournals.org Downloaded from
Author manuscripts have been peer reviewed and accepted for publication but have not yet been edited. Author Manuscript Published OnlineFirst on February 1, 2019; DOI: 10.1158/0008-5472.CAN-18-2888
3
ABSTRACT
Genome-wide association studies (GWAS) have so far identified 25 loci associated with glioma risk,
with most showing specificity for either glioblastoma (GBM) or non-GBM tumors. The majority of
these GWAS susceptibility variants reside in non-coding regions and the causal genes underlying
the associations are largely unknown. Here we performed a transcriptome-wide association study
to search for novel risk loci and candidate causal genes at known GWAS loci using Genotype-Tissue
Expression Project (GTEx) data to predict cis-predicted gene expression in relation to GBM and
non-GBM risk in conjunction with GWAS summary statistics on 12,488 glioma cases (6,183 GBM,
5,820 non-GBM) and 18,169 controls. Imposing a Bonferroni-corrected significance level of
P<5.69×10⁻⁶, we identified 31 genes, including GALNT6 at 12q13.33, as a candidate novel risk locus
for GBM (mean Z=4.43, P=5.68×10⁻⁶). GALNT6 resides at least 55 Mb away from any previously-
identified glioma risk variant, while all other 30 significantly-associated genes were located within
1 Mb of known GWAS-identified loci and were not significant after conditioning on the known
GWAS-identified variants. These data identify a novel locus (GALNT6 at 12q13.33) and 30 genes at
12 known glioma risk loci associated with glioma risk, providing further insights into glioma
tumorigenesis.
Significance: Our study identifies new genes associated with glioma risk, increasing our
understanding of how these tumors develop.
Research. on March 17, 2021. © 2019 American Association for Cancercancerres.aacrjournals.org Downloaded from
Author manuscripts have been peer reviewed and accepted for publication but have not yet been edited. Author Manuscript Published OnlineFirst on February 1, 2019; DOI: 10.1158/0008-5472.CAN-18-2888
4
INTRODUCTION
Diffuse gliomas are the most common malignant primary brain tumor affecting adults (1). Gliomas
can be broadly classified into glioblastoma (GBM) and low-grade non-GBM tumors. Gliomas typically
have a poor prognosis irrespective of medical care, with the most common form, glioblastoma
multiforme (GBM), having a median overall survival of only 10–15 months (1). While the glioma
subtypes have distinct molecular profiles resulting from different aetiological pathways, no
environmental exposures have consistently been linked to risk except for ionizing radiation, which
only accounts for a very small number of cases (1). Inherited genetic factors do, however play an
important role in the aetiology of glioma and genome-wide association studies (GWAS) have so far
identified common variants at 25 loci influencing disease risk (2). Perhaps not surprisingly given
differences in the molecular profile of GBM and non-GBM tumors, subtype-specific associations are
shown for a number of the risk variants (3,4). Collectively, the known risk loci only account for
around a third of the familial risk of both GBM and non-GBM glioma (2) indicating that additional
susceptibility variants remain to be identified.
Many of the GWAS risk variants are likely to have a small effect size, and thus are difficult to identify
in individual SNP-based GWAS, even with large sample numbers (2). Applying gene-based
approaches that aggregate the effects of multiple variants into a single testing unit is thus attractive
and offers the prospect of increasing study power. Most GWAS risk variants reside in non-coding
regions and are primarily located in active chromatin regions, which are highly-enriched with
expression quantitative trait loci (eQTL) (5). Hence transcriptome-wide association studies (TWAS)
that systematically investigate the association of genetically predicted gene expression with disease
risk offers a potentially attractive strategy to identify novel susceptibility genes for glioma (6,7).
Herein, we report results from a TWAS of glioma implementing the MetaXcan (8) methodology to
analyse summary statistics data from 12,488 cases and 18,169 controls of European descent. We
identify 31 genes at 13 loci associated with glioma risk, and provide additional evidence of a
potential role for a number of genes which are dysregulated in glioma tumorigenesis.
Research. on March 17, 2021. © 2019 American Association for Cancercancerres.aacrjournals.org Downloaded from
Author manuscripts have been peer reviewed and accepted for publication but have not yet been edited. Author Manuscript Published OnlineFirst on February 1, 2019; DOI: 10.1158/0008-5472.CAN-18-2888

5
METHODS
Ethics
A TWAS was undertaken using previously reported GWAS data (2). Ethical approval was not sought
for this specific project because all data came from the summary statistics from the published GWAS,
and no individual-level data were used.
GWAS data
Glioma genotyping data were derived from the most recent meta-analysis of GWAS in glioma, which
related > 6 million genetic variants (after imputation) to glioma, in 12,488 patients and 18,169
controls from eight independent studies of individuals of European descent (Supplementary Figures
1 and 2, Supplementary Table 1). Comprehensive details of the genotyping and quality control of
these GWAS have been previously reported (2). Gliomas are heterogeneous and different tumor
subtypes, defined in part by malignancy grade (e.g. pilocytic astrocytoma World Health Organization
(WHO) grade I, diffuse ‘low-grade’ glioma WHO grade II, anaplastic glioma WHO grade III and
glioblastoma (GBM) WHO grade IV) can be distinguished. For the sake of brevity we considered
gliomas as being either GBM or non-GBM tumors.
Association analysis of predicted gene expression with glioma risk
Associations between predicted gene expression and glioma risk were examined using MetaXcan (8),
which combines GWAS and eQTL data, accounting for LD-confounded associations. Briefly, genes
likely to be disease-causing were prioritised using S-PrediXcan which uses GWAS summary statistics
and pre-specified weights to predict gene expression, given co-variances of SNPs. SNP weights and
their respective covariance for 13 brain tissues (amygdala, anterior cingulate cortex, caudate basal
ganglia, cerebellar hemisphere, cerebellum, cortex, frontal cortex, hippocampus, hypothalamus,
nucleus accumbens basal ganglia, putamen basal ganglia, spinal cord and substantia nigra) from 80-
154 individuals were obtained from predict.db (http://predictdb.org/) (8), which is based on GTEx
version 7 eQTL data (Supplementary Table 2). To combine S-PrediXcan data across the different
brain tissues taking into account tissue-tissue correlations we used S-MultiXcan.
To determine if associations between genetically-predicted gene expression and glioma risk were
influenced by variants previously identified by GWAS, we performed conditional analyses adjusting
Research. on March 17, 2021. © 2019 American Association for Cancercancerres.aacrjournals.org Downloaded from
Author manuscripts have been peer reviewed and accepted for publication but have not yet been edited. Author Manuscript Published OnlineFirst on February 1, 2019; DOI: 10.1158/0008-5472.CAN-18-2888
6
for sentinel GWAS risk SNPs (Supplementary Table 3) using GCTA-COJO (9,10). Adjusted output files
were provided as the input GWAS summary statistics for S-PrediXcan analyses as above.
For all significant genes identified by S-MultiXcan analyses we additionally considered the effect of
the top eSNP on glioma risk. For each identified gene, the most significant eSNP for each brain tissue
was identified from GTEx v7 “allpairs.txt.gz” files. Glioma GWAS summary statistics for the
surrounding region were estimated after conditioning on identified significant eSNP/s using GCTA-
COJO (9,10), using “—cojo-slct” and “—cojo-p 0.05” to select independent eSNPs and avoid
collinearity in association testing.
To account for multiple comparisons we first considered a simple Bonferroni-corrected P-value
threshold of 3.45×10⁻⁶ (i.e. 0.05/14,486 genes) to determine a statistically significant association.
This is, however, inherently conservative because expression of genes can be correlated. To identify
highly correlated genes we performed a weighted correlation network analysis using WGCNA v1.63
(11). Plots of soft threshold against the scale-free topology model fit were used to determine the
threshold preserving 90% of topology (Supplementary Table 4). Dendograms and heatmaps were
generated to visualise co-expression of genes (Supplementary Figures 3 to 5). The number of
clusters reflects the number of independent gene sets. We examined the comparability of gene
clustering across brain tissues by dendogram Z-values; with a Z-value of 5-10 corresponding to
moderate preservation and a Z-value >10 being indicative of strong preservation (Supplementary
Table 5). To estimate the number of independently expressed genes per brain tissue we assessed
gene-gene adjacency (i.e. correlation) values. Significantly correlated gene-gene pairs were
identified as those with adjacency values greater than three standard deviations from the mean .
Removing at random one correlated gene from each pair left an estimate of the number of
“independent genes” (Supplementary Table 4). The median number of independent genes was
8,781 which defined the TWAS Bonferroni-correct threshold as P < 5.69x10⁻⁶.
S-PrediXcan analyses were additionally carried out on 922 whole-blood samples from Depression
Genes and Networks (DGN), in order to compare associations at genes identified as significant from
S-MultiXcan analyses in brain, and aid interpretation of potential tissue-specific and generic eQTL
effects.
Research. on March 17, 2021. © 2019 American Association for Cancercancerres.aacrjournals.org Downloaded from
Author manuscripts have been peer reviewed and accepted for publication but have not yet been edited. Author Manuscript Published OnlineFirst on February 1, 2019; DOI: 10.1158/0008-5472.CAN-18-2888

7
Identified genes were annotated by their potential presence in the v87 COSMIC cancer gene census
(https://cancer.sanger.ac.uk/cosmic/) as well as their potential overlap with copy number gains and
losses as annotated in CosmicCompleteCNA.tsv.gz.
Statistical power for association tests
To assess the power of our TWAS to identify associations we performed a simulation analysis
adopting a similar strategy to Wu et al., 2018 (6). We set the number of cases and controls as 12,488
(6,183 GBM, 5,820 non-GBM) and 18,169, respectively. Glioma prevalence estimates were obtained
from CBTRUS 2017 (12), assuming an overall incidence of primary brain and CNS tumors to be 22.6
per 100,000, of which 27% are gliomas and 56% of gliomas are GBM. We generated the gene
expression levels from the empirical distribution of gene expression levels in GTEx normalised
expression dataset for each brain tissue. We calculated statistical power at P < 5.69 × 10⁻⁶,
corresponding to the TWAS genome-wide significance level, according to various cis-heritability (h2)
thresholds that are assumed to be equivalent to gene expression prediction models (R2). The results,
based on 1,000 replicates are summarized in Supplementary Figure 6.
Research. on March 17, 2021. © 2019 American Association for Cancercancerres.aacrjournals.org Downloaded from
Author manuscripts have been peer reviewed and accepted for publication but have not yet been edited. Author Manuscript Published OnlineFirst on February 1, 2019; DOI: 10.1158/0008-5472.CAN-18-2888
8
RESULTS
We evaluated the association between predicted gene expression levels and glioma risk using
MetaXcan with summary statistics for GWAS SNPs in 12,488 glioma cases and 18,169 controls. In
view of associations for glioma being strongly subtype-specific (2), we analysed TWAS results for
GBM and non-GBM cases. Figure 1 shows Manhattan plots for respective TWAS associations.
Quantile-quantile plots of TWAS association statistics did not show evidence of systematic inflation
(Supplementary Figure 1).
In total the expression levels of 14,485 genes were tested for an association with glioma. To establish
the threshold for assigning genomewide statistical significance taking into account correlations
between gene expression we carried out WGCNA (11) analysis to determine the number of
independent gene sets (Supplementary Table 4). Based on an estimated number of uncorrelated
genes of 8,781 we imposed a Bonferroni multiple-testing threshold of P < 5.69 x 10⁻⁶ to declare
significant associations.
Applying this threshold, we identified 23 genes associated with GBM (Figure 1A), and eight with non-
GBM glioma (Figure 1B , Table 1, Supplementary Table 6, Supplementary Table 7). All identified
genes but one were within 1Mb of previously reported glioma risk SNPs. After conditioning on the
nearby GWAS glioma risk SNP in each case gene associations were severely abrogated, consistent
with the TWAS associations reflecting the prevously identified GWAS associations. The exception
was GALNT6 at 12q13.13, which did not map within 1Mb of a previously identified GWAS risk SNP
and was significantly associated with GBM. The risk allele (T) of sentinel SNP rs3782473 at 12q13.13
had an association P-value of 9.08x10⁻⁸ (Odds ratio 1.15, 95% confidence interval 1.09-1.21) with
GBM (Figure 2). After conditioning on rs3782473 there were no significant TWAS associations at
12q13.13, consistent with the association signal defined by rs3782473 underlying the association
with GALNT6 (Supplementary Table 6). In nine out of 13 brain regions there was a significant
association between the risk allele (T) of rs3782473 and increased expression of GALNT6
(Supplementary Figure 7).
For many loci our TWAS findings broadly supports the involvement of a number of genes that have
previously been proposed to be implicated in defining glioma risk (3). Specifically, single gene
associations were identified at 1p31.3 (JAK1), 7p11.2 (EGFR), 9p21.3 (CDKN2B) and 16q12.1
Research. on March 17, 2021. © 2019 American Association for Cancercancerres.aacrjournals.org Downloaded from
Author manuscripts have been peer reviewed and accepted for publication but have not yet been edited. Author Manuscript Published OnlineFirst on February 1, 2019; DOI: 10.1158/0008-5472.CAN-18-2888
9
(HEATR3). However, at a number of loci our analysis identified multiple significant genes, notably
5p15.33 (TERT and NKD2), 11q23.3 (PHLBD1, TREH, RPL5P30, TMEM25) and 20q13.33 (ZGPAT,
SLC2A4RG, ARFRP1, STMN3, GMEB2, LIME1, HAR1A, OPRL1, PFMTD2, DIDO1, TCEA2). No significant
genes were identified at nine previously reported glioma risk loci (3p14.1, 8q24.21, 10q24.33,
10q25.2, 11q23.2, 12q12.1, 14q12, 15q24.1, 17p13.1).
To explore the possibility of generic eQTL effects we considered S-PrediXcan analyses at the 31
identified genes using 922 whole-blood samples from the Depression Genes and Networks (DGN)
study (Supplementary Table 8). Twelve genes were significantly associated at P<0.05 and had a
consistent direction of effect with S-MultiXcan analyses (GBM: JAK1 at 1p31.3, TERT at 5p15.33,
GALNT6 at 12q13.13, HEATR3 at 16q12.1, ZGPAT, ARFRP1, GMEB2, LIME1 and PCMTD2 at 20q13.33;
non-GBM: TERT at 5p15.33, TMEM25 at 11q23.3, ZGPAT at 20q13.33), six genes were inconsistent
(GBM: CDKN2B at 9p21.3, SLC2A4RG, STMN3, OPRL1 and TCEA2 at 20q13.33; non-GBM: PHLDB1 at
11q23.3), four genes were not significantly associated (GBM: DIDO1 at 20q13.33, BAIAP2L2 and
PICK1 at 22q13.1; non-GBM: SLC2A4RG at 20q13.33) and eight genes could not be assessed (GBM:
NKD2 at 5p15.33, EGFR at 7p11.2, IL9RP3 at 16p13.3, HAR1A at 20q13.33, SLC16A8 and CTA-228A9.3
at 22q13.1; non-GBM: TREH and RPL5P30 at 11q23.3).
Following on we further investigated the relationship between the 31 genes identified as
significantly associated with GBM or non-GBM by examining associations after adjusting for the top
eSNP/s at each gene (Supplementary Figure 8). For most loci, association signals were abrogated
after adjusting for the top eSNP/s, consistent with variation in expression of the identified gene
being functional. In contrast, the association signals at 11q23.3 and 20q13.33 were only really
affected by adjusting for multiple rather than individual gene eSNPs, raising the possibility of
combinatorial effects. Intriguingly at 7p11.2, which is characterised by two independent risk loci
(marked by rs75061358 and rs723527 respectively), after adjustment for the EGFR eSNPs the
rs75061358 signal disappears, while the rs723527 signal is unaffected, perhaps indicative of an
additional distinct as yet unidentified functional mechanism.
Finally, we compared overlap of the 31 identified genes with presence in the COSMIC cancer gene
census as an oncogene or tumor suppressor gene, as well as whether the given gene is subject to
copy number gains and/or losses (Supplementary Table 9). Most TWAS directions of effect are
consistent with the gene’s probable role in tumorigenesis, such as the tumor suppressor gene
Research. on March 17, 2021. © 2019 American Association for Cancercancerres.aacrjournals.org Downloaded from
Author manuscripts have been peer reviewed and accepted for publication but have not yet been edited. Author Manuscript Published OnlineFirst on February 1, 2019; DOI: 10.1158/0008-5472.CAN-18-2888

10
CDKN2B, whereby decreased expression is associated with increased glioma risk. However, at 7p11.2
increased expression of the oncogene EGFR, which is commonly upregulated in gliomas, was found
by S-MultiXcan analyses to be negatively associated with glioma risk, perhaps indicative of different
mechanisms before and after tumor initiation.
Research. on March 17, 2021. © 2019 American Association for Cancercancerres.aacrjournals.org Downloaded from
Author manuscripts have been peer reviewed and accepted for publication but have not yet been edited. Author Manuscript Published OnlineFirst on February 1, 2019; DOI: 10.1158/0008-5472.CAN-18-2888

11
DISCUSSION
In this large TWAS involving 12,488 glioma cases of European ancestry, we identified genetically-
predicted expression levels in 23 genes associated with GBM, and eight with non-GBM glioma risk.
One of these genes, GALNT6, is located at least 55 Mb away from any previously identified GWAS
glioma variant, consistent with it representing a potential novel risk locus. All other 30 genes
identified were located within 1 Mb of known GWAS loci, including 14 genes at three loci that had
not previously been associated with glioma risk.
Our findings provide further support study for a number of the genes previously implicated by GWAS
whose expression influences the risk of developing glioma. These include JAK1 at 1p31.3, PHLDB1 at
11q23.3, EGFR at 7p11.2 and HEATR3 at 16q12.1. Additionally, our TWAS implicates new genes at
known glioma loci, including TMEM25 at 11q23.3 and NKD2 at 5p15.33 as playing a role in defining
risk of non-GBM and GBM tumors respectively. TMEM25 has been identified as a member of the
immunoglobulin superfamily, whose members are implicated in immune responses, growth factor
signalling and cell adhesion (13). Intriguingly, NKD2 encodes a Wnt-pathway inhibitor that is
hypermethylated in a large proportion of GBM tumors (14). The functional consequence of
rs10069690 at 5p15.33 has previously been reported to be due to the risk allele (A) creating an
additional splice donor site in the fourth intron of TERT, resulting in expression of a dominant
negative transcript inhibiting telomerase (15). Therefore the TWAS association with TERT may not be
directly due to cis-regulatory effects but as an indirect consequence of this dominant negative effect,
with a possible, albeit currently undetermined, effect on expression of NKD2.
In addition to refining the genes underscoring previously reported GWAS associations, our TWAS
study identified a new gene, GALNT6 at 12q13.33, a locus not previously identified as playing a role
in GBM. The gene product of GALNT6 is polypeptide N-acetylgalactosaminyltransferase 6, which is a
class of proteins frequently disrupted in cancers (16). Of note is that GALNT6 expression regulates
EGFR activity (17). While requiring further investigation, GALNT6 and rs3782473 represent a
promising new glioma risk locus.
A large number of genes associated with glioma risk were located at 20q13.33. These include DIDO1,
PCMTD2, HAR1A and TCEA2. HAR1A expression is reduced in GBM and has been shown to be a
prognostic biomarker for diffuse glioma (18). While DIDO1, PCMTD2 and TCEA2 have not previously
Research. on March 17, 2021. © 2019 American Association for Cancercancerres.aacrjournals.org Downloaded from
Author manuscripts have been peer reviewed and accepted for publication but have not yet been edited. Author Manuscript Published OnlineFirst on February 1, 2019; DOI: 10.1158/0008-5472.CAN-18-2888

12
been shown to be associated with glioma, DIDO1 promotes cell-fate differentiation in embryonic
stem cells (19) and TCEA2 encodes transcription elongation factor A protein 2, which interacts with
BRCA1 (20). Future work will be required to reveal the contribution of these genes to glioma
development and determine if any are acting as “passengers”.
A number of previously reported glioma risk loci were not implicated in our TWAS. The reason may
be obvious for some loci where the demonstrated functional mechanism is not mediated through a
cis-regulatory effect on gene expression and therefore is unlikely to be detected by TWAS (e.g. at
17p13.1 the SNP rs78378222 directly affects TP53 mRNA poly-adenylation (21)). At other loci such as
8q24.21 it is less obvious why an association was not detected. It may be that adult brain tissues do
not represent the best model for these loci, as many genes in this region were not retained for the
TWAS (genes were only retained if the nested cross-validated correlation between predicted and
actual levels > 0.10 (R2>1%) and P-value of the correlation test < 0.05). Indeed, we observed a far
larger number of significant genes for GBM than non-GBM loci. Speculatively, models at earlier
developmental stages may yield greater insights at these loci, especially if they are influencing
differentiation down oligodendrocyte/astrocyte lineages. Additionally, other mechanistic effects may
explain the functional basis of such loci, including methylation and splicing.
Our ability to identify genes significantly associated with glioma risk in this TWAS has inevitably been
affected by tissue specificity and the sample size of the data set used in the genetic prediction model
of gene expression. Because of the importance of tissue or cell specific regulators in governing
development and function, we have sought to analyse the most appropriate tissue-specific model to
best capture the transcriptional regulatory mechanisms relevant to deciphering glioma
development. Here we have sought to analyse an appropriate tissue transcriptome to model gene
expression. We acknowledge that brain tissue does however comprise both neurons and glial cells
(which include oligodendrocytes, astrocytes, ependymal cells, Schwann cells, microglia, and satellite
cells). However, in light of abundant shared cis-regulation of expression across multiple brain tissues
(22), by combining data on multiple brain tissues we would expect any model to yield greater power
as the number of tissues in which a variant is functional increases. Hence we aimed to robustly
capture genetically regulated genes expression using a large sample size.
In conclusion, this study identified new genes whose predicted expression is associated with glioma
and serves to illustrate that the TWAS approach can be a useful method of utilising pre-existing
Research. on March 17, 2021. © 2019 American Association for Cancercancerres.aacrjournals.org Downloaded from
Author manuscripts have been peer reviewed and accepted for publication but have not yet been edited. Author Manuscript Published OnlineFirst on February 1, 2019; DOI: 10.1158/0008-5472.CAN-18-2888

13
GWAS to identify new susceptibility genes. On the basis of the power calculation, our TWAS analysis
had only 80% power to detect an odds ratio of around 1.1 or 1.2 for GBM or non-GBM glioma risk
per one standard deviation increase (or decrease) in the expression level of a gene whose cis-
heritability is 60% and 20% respectively. Hence, the application of TWAS based on larger eQTL and
GWAS datasets is likely to provide further insights into the genetics of glioma.
Research. on March 17, 2021. © 2019 American Association for Cancercancerres.aacrjournals.org Downloaded from
Author manuscripts have been peer reviewed and accepted for publication but have not yet been edited. Author Manuscript Published OnlineFirst on February 1, 2019; DOI: 10.1158/0008-5472.CAN-18-2888

14
ACKNOWLEDGEMENTS
I.A. was supported by a Wellcome Trust Summer Student bursary. In the UK, additional funding was
provided by Cancer Research UK (C1298/A8362). The Glioma International Case-Control Consortium
Study was supported by grants from the National Institutes of Health, Bethesda, Maryland
(R01CA139020, R01CA52689, P50097257, P30CA125123). The UK Interphone Study was supported
by the European Commission Fifth Framework Program “Quality of Life and Management of Living
Resources” and the UK Mobile Telecommunications and Health Programme. The Mobile
Manufacturers Forum and the GSM Association provided funding for the study through the
scientifically independent International Union against Cancer (UICC). R code for power calculations
was kindly provided by Lang Wu.
Availability of data and materials
Genotype data from the Glioma International Case-Control Consortium Study GWAS are available
from the database of Genotypes and Phenotypes (dbGaP) under accession phs001319.v1.p1.
Additionally, genotypes from the GliomaScan GWAS can be accessed through dbGaP accession
phs000652.v1.p1. Summary statistics from the glioma GWAS meta-analysis are available from the
European Genome-phenome Archive (EGA, http://www.ebi.ac.uk/ega/) under accession number
EGAS00001003372.
Research. on March 17, 2021. © 2019 American Association for Cancercancerres.aacrjournals.org Downloaded from
Author manuscripts have been peer reviewed and accepted for publication but have not yet been edited. Author Manuscript Published OnlineFirst on February 1, 2019; DOI: 10.1158/0008-5472.CAN-18-2888

15
REFERENCES
1. Bondy ML, Scheurer ME, Malmer B, Barnholtz-Sloan JS, Davis FG, Il'yasova D, et al. Brain tumor epidemiology: consensus from the Brain Tumor Epidemiology Consortium. Cancer 2008;113:1953-68
2. Melin BS, Barnholtz-Sloan JS, Wrensch MR, Johansen C, Il'yasova D, Kinnersley B, et al. Genome-wide association study of glioma subtypes identifies specific differences in genetic susceptibility to glioblastoma and non-glioblastoma tumors. Nature genetics 2017;49:789-94
3. Labreche K, Kinnersley B, Berzero G, Di Stefano AL, Rahimian A, Detrait I, et al. Diffuse gliomas classified by 1p/19q co-deletion, TERT promoter and IDH mutation status are associated with specific genetic risk loci. Acta Neuropathol 2018
4. Eckel-Passow JE, Lachance DH, Molinaro AM, Walsh KM, Decker PA, Sicotte H, et al. Glioma Groups Based on 1p/19q, IDH, and TERT Promoter Mutations in Tumors. The New England journal of medicine 2015;372:2499-508
5. Sud A, Kinnersley B, Houlston RS. Genome-wide association studies of cancer: current insights and future perspectives. Nature reviews Cancer 2017;17:692-704
6. Wu L, Shi W, Long J, Guo X, Michailidou K, Beesley J, et al. A transcriptome-wide association study of 229,000 women identifies new candidate susceptibility genes for breast cancer. Nature genetics 2018;50:968-78
7. Lu Y, Beeghly-Fadiel A, Wu L, Guo X, Li B, Schildkraut JM, et al. A transcriptome-wide association study among 97,898 women to identify candidate susceptibility genes for epithelial ovarian cancer risk. Cancer research 2018
8. Barbeira AN, Dickinson SP, Bonazzola R, Zheng J, Wheeler HE, Torres JM, et al. Exploring the phenotypic consequences of tissue specific gene expression variation inferred from GWAS summary statistics. Nat Commun 2018;9:1825
9. Yang J, Lee SH, Goddard ME, Visscher PM. GCTA: a tool for genome-wide complex trait analysis. American journal of human genetics 2011;88:76-82
10. Yang J, Ferreira T, Morris AP, Medland SE, Genetic Investigation of ATC, Replication DIG, et al. Conditional and joint multiple-SNP analysis of GWAS summary statistics identifies additional variants influencing complex traits. Nature genetics 2012;44:369-75, S1-3
11. Langfelder P, Horvath S. WGCNA: an R package for weighted correlation network analysis. BMC Bioinformatics 2008;9:559
12. Ostrom QT, Gittleman H, Liao P, Vecchione-Koval T, Wolinsky Y, Kruchko C, et al. CBTRUS Statistical Report: Primary brain and other central nervous system tumors diagnosed in the United States in 2010-2014. Neuro Oncol 2017;19:v1-v88
13. Katoh M, Katoh M. Identification and characterization of human TMEM25 and mouse Tmem25 genes in silico. Oncol Rep 2004;12:429-33
14. Gotze S, Wolter M, Reifenberger G, Muller O, Sievers S. Frequent promoter hypermethylation of Wnt pathway inhibitor genes in malignant astrocytic gliomas. International journal of cancer Journal international du cancer 2010;126:2584-93
15. Killedar A, Stutz MD, Sobinoff AP, Tomlinson CG, Bryan TM, Beesley J, et al. A Common Cancer Risk-Associated Allele in the hTERT Locus Encodes a Dominant Negative Inhibitor of Telomerase. PLoS genetics 2015;11:e1005286
16. Vojta A, Samarzija I, Bockor L, Zoldos V. Glyco-genes change expression in cancer through aberrant methylation. Biochim Biophys Acta 2016;1860:1776-85
17. Lin TC, Chen ST, Huang MC, Huang J, Hsu CL, Juan HF, et al. GALNT6 expression enhances aggressive phenotypes of ovarian cancer cells by regulating EGFR activity. Oncotarget 2017;8:42588-601
Research. on March 17, 2021. © 2019 American Association for Cancercancerres.aacrjournals.org Downloaded from
Author manuscripts have been peer reviewed and accepted for publication but have not yet been edited. Author Manuscript Published OnlineFirst on February 1, 2019; DOI: 10.1158/0008-5472.CAN-18-2888
16
18. Zou H, Wu LX, Yang Y, Li S, Mei Y, Liu YB, et al. lncRNAs PVT1 and HAR1A are prognosis biomarkers and indicate therapy outcome for diffuse glioma patients. Oncotarget 2017;8:78767-80
19. Futterer A, de Celis J, Navajas R, Almonacid L, Gutierrez J, Talavera-Gutierrez A, et al. DIDO as a Switchboard that Regulates Self-Renewal and Differentiation in Embryonic Stem Cells. Stem Cell Reports 2017;8:1062-75
20. Hill SJ, Rolland T, Adelmant G, Xia X, Owen MS, Dricot A, et al. Systematic screening reveals a role for BRCA1 in the response to transcription-associated DNA damage. Genes Dev 2014;28:1957-75
21. Stacey SN, Sulem P, Jonasdottir A, Masson G, Gudmundsson J, Gudbjartsson DF, et al. A germline variant in the TP53 polyadenylation signal confers cancer susceptibility. Nature genetics 2011;43:1098-103
22. Ongen H, Brown AA, Delaneau O, Panousis NI, Nica AC, Consortium GT, et al. Estimating the causal tissues for complex traits and diseases. Nature genetics 2017;49:1676-83
Research. on March 17, 2021. © 2019 American Association for Cancercancerres.aacrjournals.org Downloaded from
Author manuscripts have been peer reviewed and accepted for publication but have not yet been edited. Author Manuscript Published OnlineFirst on February 1, 2019; DOI: 10.1158/0008-5472.CAN-18-2888
17
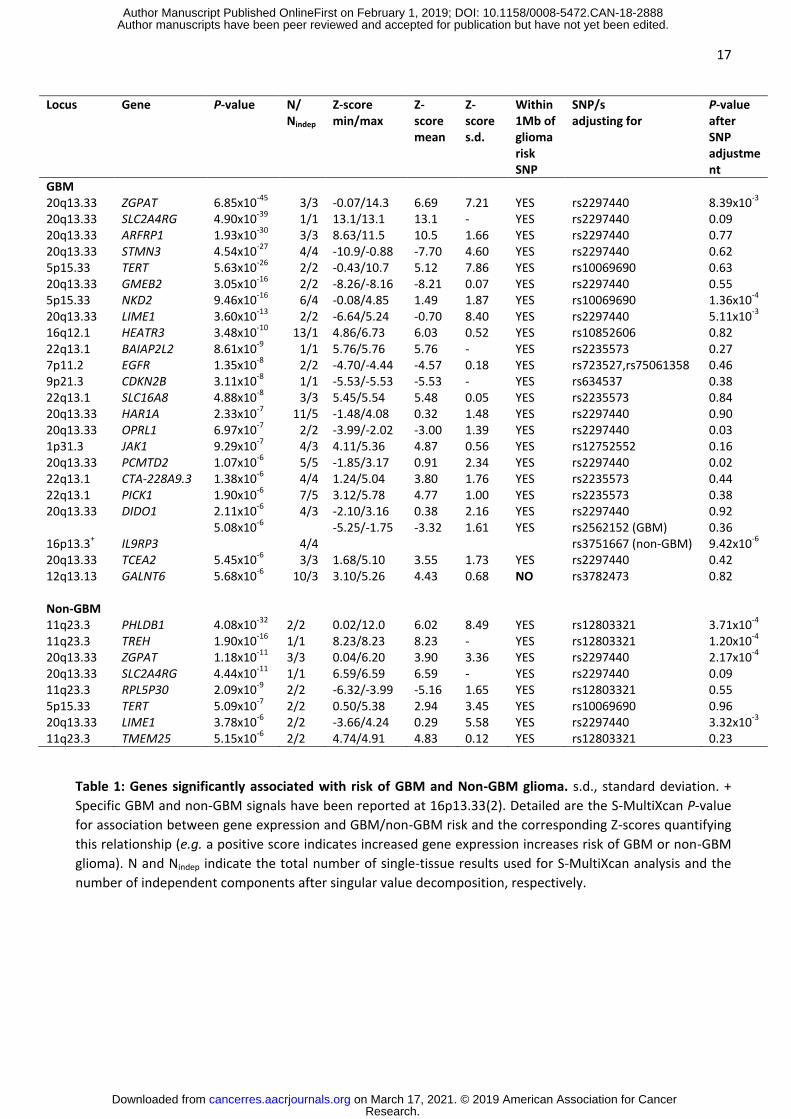
Table 1: Genes significantly associated with risk of GBM and Non-GBM glioma. s.d., standard deviation. +
Specific GBM and non-GBM signals have been reported at 16p13.33(2). Detailed are the S-MultiXcan P-value
for association between gene expression and GBM/non-GBM risk and the corresponding Z-scores quantifying
this relationship (e.g. a positive score indicates increased gene expression increases risk of GBM or non-GBM
glioma). N and Nindep indicate the total number of single-tissue results used for S-MultiXcan analysis and the
number of independent components after singular value decomposition, respectively.
Locus Gene P-value N/ Nindep
Z-score min/max
Z-score mean
Z-score s.d.
Within 1Mb of glioma risk SNP
SNP/s adjusting for
P-value after SNP adjustment
GBM 20q13.33 ZGPAT 6.85x10-45 3/3 -0.07/14.3 6.69 7.21 YES rs2297440 8.39x10⁻³
20q13.33 SLC2A4RG 4.90x10-39 1/1 13.1/13.1 13.1 - YES rs2297440 0.09 20q13.33 ARFRP1 1.93x10⁻³⁰ 3/3 8.63/11.5 10.5 1.66 YES rs2297440 0.77 20q13.33 STMN3 4.54x10⁻²⁷ 4/4 -10.9/-0.88 -7.70 4.60 YES rs2297440 0.62 5p15.33 TERT 5.63x10⁻²⁶ 2/2 -0.43/10.7 5.12 7.86 YES rs10069690 0.63 20q13.33 GMEB2 3.05x10⁻¹⁶ 2/2 -8.26/-8.16 -8.21 0.07 YES rs2297440 0.55 5p15.33 NKD2 9.46x10⁻¹⁶ 6/4 -0.08/4.85 1.49 1.87 YES rs10069690 1.36x10⁻⁴
20q13.33 LIME1 3.60x10⁻¹³ 2/2 -6.64/5.24 -0.70 8.40 YES rs2297440 5.11x10⁻³
16q12.1 HEATR3 3.48x10⁻¹⁰ 13/1 4.86/6.73 6.03 0.52 YES rs10852606 0.82 22q13.1 BAIAP2L2 8.61x10⁻⁹ 1/1 5.76/5.76 5.76 - YES rs2235573 0.27 7p11.2 EGFR 1.35x10⁻⁸ 2/2 -4.70/-4.44 -4.57 0.18 YES rs723527,rs75061358 0.46 9p21.3 CDKN2B 3.11x10⁻⁸ 1/1 -5.53/-5.53 -5.53 - YES rs634537 0.38 22q13.1 SLC16A8 4.88x10⁻⁸ 3/3 5.45/5.54 5.48 0.05 YES rs2235573 0.84 20q13.33 HAR1A 2.33x10⁻⁷ 11/5 -1.48/4.08 0.32 1.48 YES rs2297440 0.90 20q13.33 OPRL1 6.97x10⁻⁷ 2/2 -3.99/-2.02 -3.00 1.39 YES rs2297440 0.03 1p31.3 JAK1 9.29x10⁻⁷ 4/3 4.11/5.36 4.87 0.56 YES rs12752552 0.16 20q13.33 PCMTD2 1.07x10⁻⁶ 5/5 -1.85/3.17 0.91 2.34 YES rs2297440 0.02 22q13.1 CTA-228A9.3 1.38x10⁻⁶ 4/4 1.24/5.04 3.80 1.76 YES rs2235573 0.44 22q13.1 PICK1 1.90x10⁻⁶ 7/5 3.12/5.78 4.77 1.00 YES rs2235573 0.38 20q13.33 DIDO1 2.11x10⁻⁶ 4/3 -2.10/3.16 0.38 2.16 YES rs2297440 0.92
16p13.3+ IL9RP3 5.08x10⁻⁶
4/4 -5.25/-1.75 -3.32 1.61 YES rs2562152 (GBM)
rs3751667 (non-GBM) 0.36 9.42x10⁻⁶
20q13.33 TCEA2 5.45x10⁻⁶ 3/3 1.68/5.10 3.55 1.73 YES rs2297440 0.42 12q13.13 GALNT6 5.68x10⁻⁶ 10/3 3.10/5.26 4.43 0.68 NO rs3782473 0.82 Non-GBM 11q23.3 PHLDB1 4.08x10⁻³² 2/2 0.02/12.0 6.02 8.49 YES rs12803321 3.71x10⁻⁴
11q23.3 TREH 1.90x10⁻¹⁶ 1/1 8.23/8.23 8.23 - YES rs12803321 1.20x10⁻⁴
20q13.33 ZGPAT 1.18x10⁻¹¹ 3/3 0.04/6.20 3.90 3.36 YES rs2297440 2.17x10⁻⁴
20q13.33 SLC2A4RG 4.44x10⁻¹¹ 1/1 6.59/6.59 6.59 - YES rs2297440 0.09 11q23.3 RPL5P30 2.09x10⁻⁹ 2/2 -6.32/-3.99 -5.16 1.65 YES rs12803321 0.55 5p15.33 TERT 5.09x10⁻⁷ 2/2 0.50/5.38 2.94 3.45 YES rs10069690 0.96 20q13.33 LIME1 3.78x10⁻⁶ 2/2 -3.66/4.24 0.29 5.58 YES rs2297440 3.32x10⁻³
11q23.3 TMEM25 5.15x10⁻⁶ 2/2 4.74/4.91 4.83 0.12 YES rs12803321 0.23
Research. on March 17, 2021. © 2019 American Association for Cancercancerres.aacrjournals.org Downloaded from
Author manuscripts have been peer reviewed and accepted for publication but have not yet been edited. Author Manuscript Published OnlineFirst on February 1, 2019; DOI: 10.1158/0008-5472.CAN-18-2888
18
FIGURE LEGENDS
Figure 1: Manhattan Plots of gene genomic co-ordinates against –log10 (P-value) of TWAS results.
(a) GBM glioma; (b) Non-GBM glioma. The red line represents the Bonferroni-corrected threshold of
P≤5.69×10⁻⁶.
Figure 2: Regional plot of association results, recombination rates and chromatin state
segmentation tracks at 12q13.33 in GBM glioma. Plot shows discovery association results of both
genotyped (triangles) and imputed (circles) SNPs in the GWAS samples and recombination rates.
−log10 P values (y axes) of the SNPs are shown according to their chromosomal positions (x axes).
The lead SNP rs3782473 is shown as a large circle. The color intensity of each symbol reflects the
extent of LD with the top genotyped SNP, white (r2 = 0) through to dark red (r2 = 1.0). Genetic
recombination rates, estimated using HapMap samples from Utah residents of western and northern
European ancestry (CEU), are shown with a light blue line. Physical positions are based on NCBI build
37 of the human genome. Also shown are the relative positions of GENCODE v19 genes mapping to
the region of association. Below the association plot the location of GALNT6 eSNPs are indicated, as
well as the relative positions of GENCODE v19 genes mapping to the region of association and the
chromatin state segmentation tracks (ChromHMM) for H1 and H9 neural progenitor cells derived
from the epigenome roadmap project, as per the legend. TSS, transcriptional start sites.
Research. on March 17, 2021. © 2019 American Association for Cancercancerres.aacrjournals.org Downloaded from
Author manuscripts have been peer reviewed and accepted for publication but have not yet been edited. Author Manuscript Published OnlineFirst on February 1, 2019; DOI: 10.1158/0008-5472.CAN-18-2888
Published OnlineFirst February 1, 2019.Cancer Res Isabelle Atkins, Ben Kinnersley, Quinn T Ostrom, et al. candidate susceptibility genes for gliomaTranscriptome-wide association study identifies new
Updated version
10.1158/0008-5472.CAN-18-2888doi:
Access the most recent version of this article at:
Material
Supplementary
http://cancerres.aacrjournals.org/content/suppl/2019/02/01/0008-5472.CAN-18-2888.DC1
Access the most recent supplemental material at:
Manuscript
Authorbeen edited. Author manuscripts have been peer reviewed and accepted for publication but have not yet
E-mail alerts related to this article or journal.Sign up to receive free email-alerts
Subscriptions
Reprints and
To order reprints of this article or to subscribe to the journal, contact the AACR Publications
Permissions
Rightslink site. Click on "Request Permissions" which will take you to the Copyright Clearance Center's (CCC)
.http://cancerres.aacrjournals.org/content/early/2019/02/01/0008-5472.CAN-18-2888To request permission to re-use all or part of this article, use this link
Research. on March 17, 2021. © 2019 American Association for Cancercancerres.aacrjournals.org Downloaded from
Author manuscripts have been peer reviewed and accepted for publication but have not yet been edited. Author Manuscript Published OnlineFirst on February 1, 2019; DOI: 10.1158/0008-5472.CAN-18-2888