
Towards mixed-initiative human-robot interaction: a cooperative …depozit.isae.fr › theses ›...
217
et discipline ou spécialité Jury : le Institut Supérieur de l’Aéronautique et de l’Espace Paulo Eduardo UBALDINO DE SOUZA jeudi 19 octobre 2017 Vers une interaction humain-robot à une initiative mixe : une équipe coopérative composée par des drones et un opérateur humain Towards mixed-initiative human-robot interaction: a cooperative human-drone team framework EDSYS : Robotique Équipe d'accueil ISAE-ONERA CSDV M. Gilles COPPIN Professeur IMT Atlantique - Président M. Frédéric DEHAIS Professeur ISAE-SUPAERO - Directeur de thèse M. Sidney GIVIGI Professeur Associé Royal Military College of Canada M. Abdel-Illah MOUADDIB Professeur Université de Caen Rapporteur Mme Caroline PONZONI CARVALHO CHANEL Professeur Associé ISAE-SUPAERO - Co- directrice de thèse M. Frédéric VANDERHAEGEN Professeur Université de Valenciennes - Rapporteur M. Frédéric DEHAIS (directeur de thèse) Mme Caroline PONZONI CARVALHO CHANEL (co-directrice de thèse)
Transcript of Towards mixed-initiative human-robot interaction: a cooperative …depozit.isae.fr › theses ›...
et discipline ou spécialité
Jury :
le
Institut Supérieur de l’Aéronautique et de l’Espace
Paulo Eduardo UBALDINO DE SOUZA
jeudi 19 octobre 2017
Vers une interaction humain-robot à une initiative mixe : une équipecoopérative composée par des drones et un opérateur humain
Towards mixed-initiative human-robot interaction: a cooperative human-droneteam framework
EDSYS : Robotique
Équipe d'accueil ISAE-ONERA CSDV
M. Gilles COPPIN Professeur IMT Atlantique - PrésidentM. Frédéric DEHAIS Professeur ISAE-SUPAERO - Directeur de thèse
M. Sidney GIVIGI Professeur Associé Royal Military College of CanadaM. Abdel-Illah MOUADDIB Professeur Université de Caen Rapporteur
Mme Caroline PONZONI CARVALHO CHANEL Professeur Associé ISAE-SUPAERO - Co-directrice de thèse
M. Frédéric VANDERHAEGEN Professeur Université de Valenciennes - Rapporteur
M. Frédéric DEHAIS (directeur de thèse)Mme Caroline PONZONI CARVALHO CHANEL (co-directrice de thèse)


to Ian
i


Acknowledgments
Now, after completing this mission, I can say, without a doubt, that one of the most difficult partsof writing my thesis was finding the right words to express my gratitude to those who helpedme get here. This incredible journey has been made possible and especially made pleasant bythe experiences, conversations and relationships shared with all the people I had the privilege tomeet along the way.
I would like to start by thanking my advisors, Frédéric DEHAIS and Caroline CHANEL,for accepting me as a PhD student. I came to Toulouse without much knowledge of decisiontheories, human factors, or even a clear idea of what it meant to conduct proper research. Ilearned so much under your tutelage and you provided me wise counsels every step of the wayincluding knowing when to give me close guidance as well as when to give me the freedom toexplore on my own.
I thank Frédéric VANDERHAEGEN, Abdel-Illah MOUADDIB, Gilles COPPIN and SidneyGIVIGI for accepting to be members of my committee.
My deep gratitude goes to Jean-Paul BRUYANT (Defence & Security Business Develop-ment - ONERA), Osvaldo CATSUMI (Institute for Advanced Studies - IEAV/DCTA) and PatrickFABIANI (ISAE), who opened doors for this quest to begin.
Heartfelt thanks go to Sidney for his constant wise guidance, humor and encouragement.
I was fortunate enough to share the Ph.D. experience with a number of fellow students andyoung doctors who all became my friends: Angela, Benoit, Corentin, Facundo, Igor, Jan, Lean-dro, Martin, Raphaelle, Raquel, Sebastien, Sergio, Soheib, Thibaut and all the others that I forgotto cite here. I enjoyed our conversations which have ranged from being academically stimulatingto deeply profound to utter silly and everything in between. It was a privilege to work alongsidesuch a group of bright and talented researchers.
I also tank all the 133 participants and the beta-testers in my experiments, without their“brains” I would not have gotten to the end of this project.
Finally, I would like to thank my family for the love and support they have provided me overthe years. First and foremost, I would like to thank my wife Marina, for always pushing me andbelieving in me. Your care helped to encourage and motivate me, particularly at the momentsduring our simultaneous abroad Ph.D. when things were at their most difficult. Additionally, Iwould like to thank my eternal children: Aimée, Nathan and Ian. I consider myself to be blessedbeyond all measure to be a member of such an amazing and loving family. Everything I haveachieved in my life, I have done to make all of you proud.
iii

This project has been financially supported by CNPq to whom I am sincerely grateful.
iv
Contents
Table des sigles et acronymes xv
Introduction 1
I Literature review 5
1 3D robots 7
1.1 Dirty, dull or dangerous (3D) missions . . . . . . . . . . . . . . . . . . . . . . . 8
1.2 Multi-robot systems (MRS) . . . . . . . . . . . . . . . . . . . . . . . . . . . . . 10
1.3 Robots interacting with humans . . . . . . . . . . . . . . . . . . . . . . . . . . 12
1.4 Summary . . . . . . . . . . . . . . . . . . . . . . . . . . . . . . . . . . . . . . 16
2 The “H” factor 19
2.1 Human decision making process . . . . . . . . . . . . . . . . . . . . . . . . . . 20
2.2 Bounded rationality . . . . . . . . . . . . . . . . . . . . . . . . . . . . . . . . . 20
2.3 Dual process theory (DPT) . . . . . . . . . . . . . . . . . . . . . . . . . . . . . 21
2.4 Heuristics and biases . . . . . . . . . . . . . . . . . . . . . . . . . . . . . . . . 22
2.5 Improving decision making . . . . . . . . . . . . . . . . . . . . . . . . . . . . . 26
2.6 Summary . . . . . . . . . . . . . . . . . . . . . . . . . . . . . . . . . . . . . . 28
3 Decisions and utilities 29
3.1 Decision theory (DT) . . . . . . . . . . . . . . . . . . . . . . . . . . . . . . . . 29
3.2 Utility theory (UT) . . . . . . . . . . . . . . . . . . . . . . . . . . . . . . . . . 30
3.3 Expected utility theory (EUT) . . . . . . . . . . . . . . . . . . . . . . . . . . . 32
v
3.4 Subjective expected utility theory (SEU) . . . . . . . . . . . . . . . . . . . . . . 34
3.5 Prospect Theory . . . . . . . . . . . . . . . . . . . . . . . . . . . . . . . . . . . 35
3.6 Summary . . . . . . . . . . . . . . . . . . . . . . . . . . . . . . . . . . . . . . 38
4 Shall we play a game? 39
4.1 What is a game? . . . . . . . . . . . . . . . . . . . . . . . . . . . . . . . . . . . 40
4.2 Normal form games . . . . . . . . . . . . . . . . . . . . . . . . . . . . . . . . . 42
4.3 Potential games . . . . . . . . . . . . . . . . . . . . . . . . . . . . . . . . . . . 53
4.4 Repeated games . . . . . . . . . . . . . . . . . . . . . . . . . . . . . . . . . . . 55
4.5 Stochastic games . . . . . . . . . . . . . . . . . . . . . . . . . . . . . . . . . . 55
4.6 Extensive-form games (EFG) . . . . . . . . . . . . . . . . . . . . . . . . . . . . 55
4.7 A game against Nature (GAN) . . . . . . . . . . . . . . . . . . . . . . . . . . . 56
4.8 Summary . . . . . . . . . . . . . . . . . . . . . . . . . . . . . . . . . . . . . . 58
II Contributions 59
5 The patrolling problem 65
5.1 Motivation . . . . . . . . . . . . . . . . . . . . . . . . . . . . . . . . . . . . . . 66
5.2 Objective . . . . . . . . . . . . . . . . . . . . . . . . . . . . . . . . . . . . . . 67
5.3 Problem formulation . . . . . . . . . . . . . . . . . . . . . . . . . . . . . . . . 67
5.4 Moving game . . . . . . . . . . . . . . . . . . . . . . . . . . . . . . . . . . . . 68
5.5 Simulation Experiments . . . . . . . . . . . . . . . . . . . . . . . . . . . . . . . 73
5.6 Discussion . . . . . . . . . . . . . . . . . . . . . . . . . . . . . . . . . . . . . . 78
5.7 Summary . . . . . . . . . . . . . . . . . . . . . . . . . . . . . . . . . . . . . . 80
6 The framing effect 81
vi
6.1 Motivation . . . . . . . . . . . . . . . . . . . . . . . . . . . . . . . . . . . . . . 82
6.2 Experimental design . . . . . . . . . . . . . . . . . . . . . . . . . . . . . . . . 83
6.3 Experiment I . . . . . . . . . . . . . . . . . . . . . . . . . . . . . . . . . . . . 84
6.4 Experiment II . . . . . . . . . . . . . . . . . . . . . . . . . . . . . . . . . . . . 91
6.5 Limitations . . . . . . . . . . . . . . . . . . . . . . . . . . . . . . . . . . . . . 93
6.6 Discussion and Conclusions . . . . . . . . . . . . . . . . . . . . . . . . . . . . 93
6.7 Summary . . . . . . . . . . . . . . . . . . . . . . . . . . . . . . . . . . . . . . 94
7 The human utility 97
7.1 Motivation . . . . . . . . . . . . . . . . . . . . . . . . . . . . . . . . . . . . . . 98
7.2 Personal utility model . . . . . . . . . . . . . . . . . . . . . . . . . . . . . . . . 98
7.3 Previous Experiment . . . . . . . . . . . . . . . . . . . . . . . . . . . . . . . . 100
7.4 Proposed Prospect theory model . . . . . . . . . . . . . . . . . . . . . . . . . . 101
7.5 Discussion . . . . . . . . . . . . . . . . . . . . . . . . . . . . . . . . . . . . . . 106
7.6 Conclusion . . . . . . . . . . . . . . . . . . . . . . . . . . . . . . . . . . . . . 107
7.7 Summary . . . . . . . . . . . . . . . . . . . . . . . . . . . . . . . . . . . . . . 107
8 Closing the loop 109
8.1 Motivation . . . . . . . . . . . . . . . . . . . . . . . . . . . . . . . . . . . . . . 110
8.2 System description . . . . . . . . . . . . . . . . . . . . . . . . . . . . . . . . . 111
8.3 Overall utility . . . . . . . . . . . . . . . . . . . . . . . . . . . . . . . . . . . . 111
8.4 Guideline . . . . . . . . . . . . . . . . . . . . . . . . . . . . . . . . . . . . . . 113
8.5 Search game . . . . . . . . . . . . . . . . . . . . . . . . . . . . . . . . . . . . . 115
8.6 HRI game . . . . . . . . . . . . . . . . . . . . . . . . . . . . . . . . . . . . . . 120
8.7 Evaluation . . . . . . . . . . . . . . . . . . . . . . . . . . . . . . . . . . . . . . 123
8.8 Drone simulation . . . . . . . . . . . . . . . . . . . . . . . . . . . . . . . . . . 124
vii
8.9 Experiment III . . . . . . . . . . . . . . . . . . . . . . . . . . . . . . . . . . . . 125
8.10 Considerations for a Real-World operation . . . . . . . . . . . . . . . . . . . . . 137
8.11 Summary . . . . . . . . . . . . . . . . . . . . . . . . . . . . . . . . . . . . . . 139
Conclusion 141
A MOMDP-based target search mission taking into accountthe human operator’s cognitive state 145
A.1 Introduction . . . . . . . . . . . . . . . . . . . . . . . . . . . . . . . . . . . . . 145
A.2 Background . . . . . . . . . . . . . . . . . . . . . . . . . . . . . . . . . . . . . 147
A.3 Previous Experiments . . . . . . . . . . . . . . . . . . . . . . . . . . . . . . . . 152
A.4 Modeling the collaborative target identification mission . . . . . . . . . . . . . . 155
A.5 Simulation Results . . . . . . . . . . . . . . . . . . . . . . . . . . . . . . . . . 158
A.6 Conclusions . . . . . . . . . . . . . . . . . . . . . . . . . . . . . . . . . . . . . 160
Bibliographie 174
viii
List of Figures
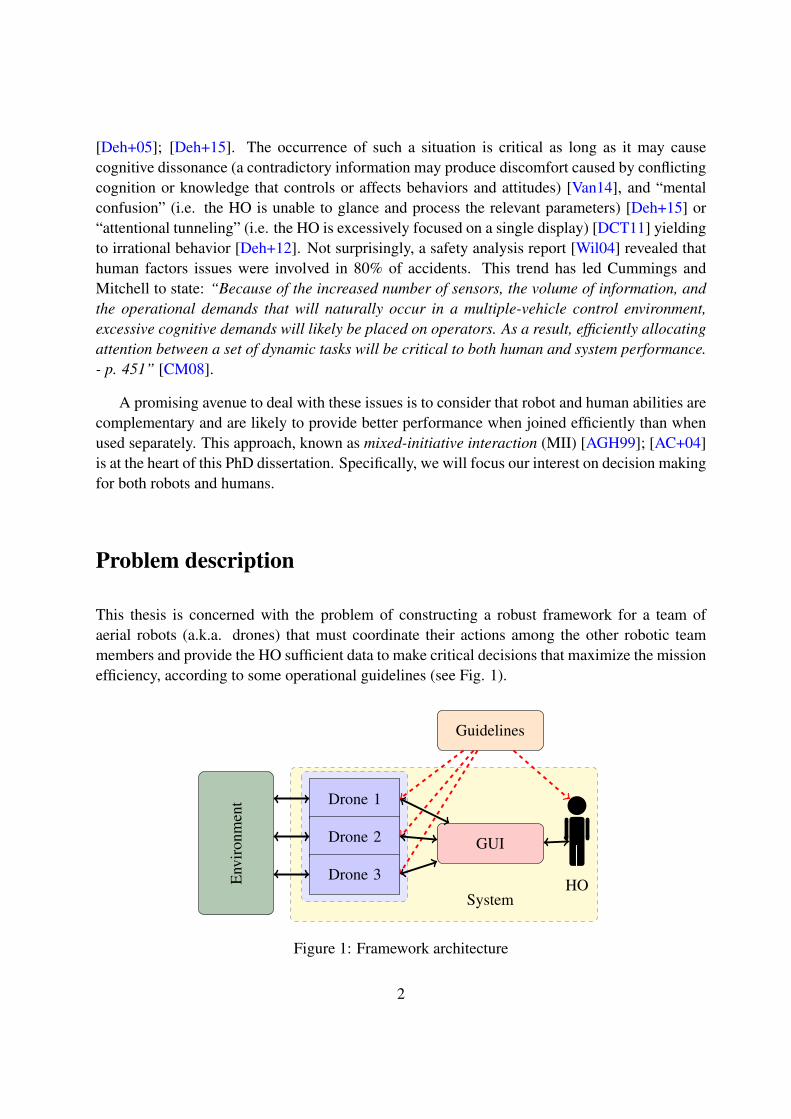
1 Framework architecture . . . . . . . . . . . . . . . . . . . . . . . . . . . . . . . 2
1.1 Hayabusa asteroid-sample capsule recovered in Outback - By JAXA . . . . . . . 9
1.2 Mars sample return concept - By JPL/NASA . . . . . . . . . . . . . . . . . . . . 10
1.3 Types of interactions of multiple-robot systems [Par08]. . . . . . . . . . . . . . . 11
1.4 Robots operated by humans. . . . . . . . . . . . . . . . . . . . . . . . . . . . . 12
1.5 Robots operated by humans. . . . . . . . . . . . . . . . . . . . . . . . . . . . . 12
1.6 Three dimensions determining the autonomy level for unmanned systems [Hua+04] 14
1.7 Optionally-piloted Black Hawk - By Sikorsky . . . . . . . . . . . . . . . . . . . 14
3.1 Graphical Representation of Risk Preferences in EUT. . . . . . . . . . . . . . . . 34
3.2 Prospect theory typical value function. . . . . . . . . . . . . . . . . . . . . . . 36
4.1 Rock, Paper, Scissors, Lizard, Spock. – by The Big Bang Theory Wiki . . . . . . 45
4.2 Sequential version of chicken game . . . . . . . . . . . . . . . . . . . . . . . . . 56
4.3 Thesis design. . . . . . . . . . . . . . . . . . . . . . . . . . . . . . . . . . . . . 61
5.1 Topological model with the points of interest and all possible transitions. . . . . 73
5.2 Geometric model. . . . . . . . . . . . . . . . . . . . . . . . . . . . . . . . . . 74
5.3 Average idleness of the graph per number of drones. . . . . . . . . . . . . . . . . 77
5.4 Predictability versus idleness. . . . . . . . . . . . . . . . . . . . . . . . . . . . . 78
5.5 Paths generated with three drones. The “path” axis contains the nodes of the graph. 79
6.1 Operator’s graphical interface. . . . . . . . . . . . . . . . . . . . . . . . . . . . 84
6.2 Operator’s graphical interface. . . . . . . . . . . . . . . . . . . . . . . . . . . . 85
ix
6.3 Random effects by subject. . . . . . . . . . . . . . . . . . . . . . . . . . . . . . 87
6.4 Average operators’ decisions in function of the Text framing and the Scenario . . 89
6.5 Satisfaction and confidence subjective levels in function of the operator’s positiveactions . . . . . . . . . . . . . . . . . . . . . . . . . . . . . . . . . . . . . . . . 90
6.6 Operators’ decisions in function of the framing, the scenario and the probabilityvalue. . . . . . . . . . . . . . . . . . . . . . . . . . . . . . . . . . . . . . . . . 91
6.7 Operators’ decisions in function of the ‘text’ and ‘visual’ framing . . . . . . . . 94
7.1 Probability of saying YES according to the objective probability. . . . . . . . . . 103
7.2 Probability of saying “YES” according to the number of used assets. The darkblue line is the approximated personal value function pv(·) of Equation (3.5). . . 104
7.3 Personal utility in function of the framing for the earthquake scenario. The greencolor represents the positive framing (ψ+(·)) and the red color the negative fram-ing (ψ−(·)). . . . . . . . . . . . . . . . . . . . . . . . . . . . . . . . . . . . . . 105
8.1 Flowchart of a typical mission. . . . . . . . . . . . . . . . . . . . . . . . . . . . 112
8.2 Square (SPQ) search pattern . . . . . . . . . . . . . . . . . . . . . . . . . . . . 116
8.3 Star (SPT ) search pattern . . . . . . . . . . . . . . . . . . . . . . . . . . . . . 116
8.4 Snail (SPN ) search pattern . . . . . . . . . . . . . . . . . . . . . . . . . . . . . 117
8.5 Indifference curve among the Search patterns with b = 1 . . . . . . . . . . . . . 117
8.6 Sequential form for the Drone vs HO game, in which A > C and D > B. . . . . 123
8.7 System developed in MORSE . . . . . . . . . . . . . . . . . . . . . . . . . . . 124
8.8 Site developed for the experiment . . . . . . . . . . . . . . . . . . . . . . . . . 125
8.9 Experiment graphical interface . . . . . . . . . . . . . . . . . . . . . . . . . . . 127
8.10 Briefing for the “game” . . . . . . . . . . . . . . . . . . . . . . . . . . . . . . . 128
8.11 Operational guideline example: be fast! (BFG). . . . . . . . . . . . . . . . . . . 129
8.12 Framed question. . . . . . . . . . . . . . . . . . . . . . . . . . . . . . . . . . . 129
8.13 Total helped people at the end of a mission. . . . . . . . . . . . . . . . . . . . . 130
x
8.14 Distribution of first-aid kit usefulness probability values. . . . . . . . . . . . . . 131
8.15 Proportion of kits released in function of the guidelines and frame selection con-ditions. . . . . . . . . . . . . . . . . . . . . . . . . . . . . . . . . . . . . . . . 132
8.16 Average mission duration. . . . . . . . . . . . . . . . . . . . . . . . . . . . . . 134
A.1 Transition models of a POMDP and a MOMDP. . . . . . . . . . . . . . . . . . . 147
A.2 Operator’s interface and areas of interest [Rég+14]. . . . . . . . . . . . . . . . . 152
A.3 Mission phases and summarized transitions. The loop transitions (red lines) in-dicate the transitions observed after getAttention or cMeasure actions. . . . . . . 156
xi

List of Tables
2.1 Examples of decision making theories . . . . . . . . . . . . . . . . . . . . . . . 21
2.2 Comparison between intuitive and analytical thinking. . . . . . . . . . . . . . . . 22
2.3 Kahneman and Tversky framing effect experiment. . . . . . . . . . . . . . . . . 25
4.1 Normal form game . . . . . . . . . . . . . . . . . . . . . . . . . . . . . . . . . 42
4.2 Common-payoff game . . . . . . . . . . . . . . . . . . . . . . . . . . . . . . . 43
4.3 Hi-Lo game . . . . . . . . . . . . . . . . . . . . . . . . . . . . . . . . . . . . . 43
4.4 Chicken game . . . . . . . . . . . . . . . . . . . . . . . . . . . . . . . . . . . . 44
4.5 Zero-sum game . . . . . . . . . . . . . . . . . . . . . . . . . . . . . . . . . . . 46
4.6 A less trivial game . . . . . . . . . . . . . . . . . . . . . . . . . . . . . . . . . 46
4.7 Mixed strategy game example . . . . . . . . . . . . . . . . . . . . . . . . . . . 48
4.8 Hang out game . . . . . . . . . . . . . . . . . . . . . . . . . . . . . . . . . . . 49
4.9 Asymmetrical friends game . . . . . . . . . . . . . . . . . . . . . . . . . . . . . 50
4.10 Intersection game . . . . . . . . . . . . . . . . . . . . . . . . . . . . . . . . . . 50
4.11 Minmax regret . . . . . . . . . . . . . . . . . . . . . . . . . . . . . . . . . . . 52
4.12 Prisoner dilemma - Potential game . . . . . . . . . . . . . . . . . . . . . . . . . 53
7.1 GLMM summary . . . . . . . . . . . . . . . . . . . . . . . . . . . . . . . . . . 101
7.2 Logistic regression analysis . . . . . . . . . . . . . . . . . . . . . . . . . . . . . 102
7.3 Confusion Matrix and Statistics . . . . . . . . . . . . . . . . . . . . . . . . . . . 106
8.1 Search pattern vs Nature . . . . . . . . . . . . . . . . . . . . . . . . . . . . . . 118
8.2 Search pattern vs Nature (Fast) . . . . . . . . . . . . . . . . . . . . . . . . . . . 120
8.3 Search pattern vs Nature (Accurate) . . . . . . . . . . . . . . . . . . . . . . . . 120
xiii
8.4 Drone vs Human - a team game . . . . . . . . . . . . . . . . . . . . . . . . . . 121
8.5 Sample distribution . . . . . . . . . . . . . . . . . . . . . . . . . . . . . . . . . 130
8.6 Experiment III - GLMM summary . . . . . . . . . . . . . . . . . . . . . . . . . 133
8.7 Experiment III - LMM summary of the interactions among guidelines and con-ditions and their effects in the mission duration . . . . . . . . . . . . . . . . . . 135
A.1 Sensors statuses . . . . . . . . . . . . . . . . . . . . . . . . . . . . . . . . . . . 153
A.2 Attention tunneling probability function . . . . . . . . . . . . . . . . . . . . . . 155
A.3 Mission phases . . . . . . . . . . . . . . . . . . . . . . . . . . . . . . . . . . . 156
A.4 Fully accomplished mission example . . . . . . . . . . . . . . . . . . . . . . . . 159
A.5 Aborted Mission example . . . . . . . . . . . . . . . . . . . . . . . . . . . . . . 160
xiv
Table of Acronyms
3D Dirty, dull, or dangerous
ACG Anti-coordination game
AFE Attribute framing effect
ALFUS Autonomy levels for unmanned systems
BAG “Be accurate” guideline
BFG “Be fast” guideline
C Contribution
CH Contribution in Human factors
COG Coordination game
CPG Common-payoff game
CR Contribution in robotics
DM Decision maker
DPT Dual process theory
DT Decision theory
Dec-POMDP Decentralized POMDP
EFG Extensive-form game
ESA European Space Agency
EUT Expected utility theory
FE Framing effect
GAN Game against Nature
GFE Goal framing effect
GLMM Generalized linear mixed model
xv
GT Game theory
GUARDIANS Group of Unmanned Assistant Robots Deployed In Aggressive Navigation byScent
HLG High-low game
HO Human operator
HCI Human-computer interaction
HRI Human-robot interaction
IAC “In accordance” condition
JAXA Japanese Aerospace Exploration Agency
JPL Jet Propulsion Laboratory
LOA Levels of autonomy
LMM Linear mixed model
LRT Likelihood Ratio Test
MAS Multi-agent system
MDP Markov decision process
MEMS Micro-Electro-Mechanical Systems
MI-HRI Mixed-initiative human-robot interaction
MII Mixed-initiative interaction
MOMDP Mixed observability Markov decision process
MORSE Modular open robots simulation engine
MRS Multiple-robot system
NASA National aeronautics and space administration
NATO North Atlantic Treaty Organization
NCG Non-cooperative game
NDM Naturalistic decision making
xvi
NE Nash equilibrium
NIST National Institute of Standards and Technology
NS Non-significant
NTC “Neutral” condition
OMPFC Orbital and medial prefrontal cortex
P study report
POA Price of anarchy
POI Point of interest
POMDP Parcially observable Markov decision process
PT Prospect theory
RCF Risk choice framing
RPAS Remotely piloted aircraft system
RPSLS Rock, Paper, Scissors, Lizard, Spock
RQ Research question
SAR Search and rescue
SEU Subjective expected utility
SPN Search pattern “Snail”
SPQ Search pattern “Square”
SPT Search pattern “Star”
UAV Unmanned air vehicle
UMS Unmanned system
USAF United States Air Force
USAR Urban search and rescue
UT Utility theory
VCV victim completely visible
xvii

VVS Victim only visible by one side
VVT Victim only visible from the top
WLU Wonderful life utility
ZSG Zero-sum game
xviii
Introduction
In theory, theory and practice are thesame. In practice, they are not.
Anonymous
Human-robot interaction (HRI) is a field that is still in its infancy. In the recent past, wehave seen robots develop into autonomous artificial agents capable of executing more and morecomplex tasks. In the future, robots will likely develop the ability to adapt and learn from theirsurroundings.
Robots designed for dirty, dull or dangerous (“3D”) tasks have reliance, do not get boredand can operate in hostile and dynamics environments - all attributes well suited for space ex-ploration, and emergency or military situations. They also reduce mission costs, increase designflexibility, and maximize data production. Moreover, multi-robot systems (MRSs) may poten-tially provide several advantages over systems with a single robot, namely speed, accuracy, androbustness [Bur+00]; [Bur+05]; [Vin+08].
On the other hand, when faced with unexpected events, robots fade-out in comparison withintuitive and creative human beings. For instance, military commanders and first responders areoften required to make decisions under conditions of limited, incomplete or ambiguous informa-tion, and severe time pressure. These experts can take charge of life-threatening situations anddecide how to use their crews and assets in a very effective way. However, in those situations,they have to work in very hard conditions, and are subject to cognitive and physical fatigue,which can lead to a reduction in the situational awareness and in the quality of their decisions.Thus, the future will require an intelligent balance between the human flexibility and creativity,and robust and sophisticated robotic systems.
Nonetheless, concerning the human-robot interactions, it is not easy to design a robust andefficient framework. Recently most of the scientific and technical efforts have focused on theimplementation of smart sensors, complex embedded systems and autonomy to enhance theefficiency of the robots [Thr+04], especially when the human operator can not analyze or accessvisual data [Thr+04]; [SMT09]; [FO05]; [CM03]. However, these developments were generallyachieved without questioning the integration of the human operators (HOs) in the control loop[SST03]: the HO is considered as a providential agent that will be able to takeover when sensorsor automation fail [CM03]; [FO05]; [SMT09]. Yet, poor user interface design, the complexity ofautomation and high operational pressure can leave the HO ill-equipped when mental workloadexceeds human capacity [Dur+14]. For instance, a careless design of authority sharing can lead tohuman-automation conflicts when the human operator misunderstands the automation behavior
1
[Deh+05]; [Deh+15]. The occurrence of such a situation is critical as long as it may causecognitive dissonance (a contradictory information may produce discomfort caused by conflictingcognition or knowledge that controls or affects behaviors and attitudes) [Van14], and “mentalconfusion” (i.e. the HO is unable to glance and process the relevant parameters) [Deh+15] or“attentional tunneling” (i.e. the HO is excessively focused on a single display) [DCT11] yieldingto irrational behavior [Deh+12]. Not surprisingly, a safety analysis report [Wil04] revealed thathuman factors issues were involved in 80% of accidents. This trend has led Cummings andMitchell to state: “Because of the increased number of sensors, the volume of information, andthe operational demands that will naturally occur in a multiple-vehicle control environment,excessive cognitive demands will likely be placed on operators. As a result, efficiently allocatingattention between a set of dynamic tasks will be critical to both human and system performance.- p. 451” [CM08].
A promising avenue to deal with these issues is to consider that robot and human abilities arecomplementary and are likely to provide better performance when joined efficiently than whenused separately. This approach, known as mixed-initiative interaction (MII) [AGH99]; [AC+04]is at the heart of this PhD dissertation. Specifically, we will focus our interest on decision makingfor both robots and humans.
Problem description
This thesis is concerned with the problem of constructing a robust framework for a team ofaerial robots (a.k.a. drones) that must coordinate their actions among the other robotic teammembers and provide the HO sufficient data to make critical decisions that maximize the missionefficiency, according to some operational guidelines (see Fig. 1).
Env
iron
men
t Drone 1
Drone 2
Drone 3
Guidelines
GUI
SystemHO
Figure 1: Framework architecture
2
In this way, this project meets the dual purpose of taking care of the effectiveness of thehuman-robot team (we will call it robotic perspective) and improving the human-decision processin such an operational context (human perspective).
Thesis statement
In this thesis, we consider the problem of designing the utility functions of utility-maximizingagents in a multi-robot system (MRS) with a (fallible and emotional) human operator (HO) inthe loop, so that they work synergistically to maximize a global utility.
Thereby, one approach that we initially consider to make use was the decentralized (partiallyobservable) Markov decision process (Dec-(PO)MDP), an extension of POMDP1 framework forrepresenting multi-agent coordination problems. Dec-POMDPs have been broadly used in arti-ficial intelligence (AI) as a way of approaching fundamental differences in decision-making indecentralized environments [WVO12]; [MJM+12]; [Ama+13]. [Ama+14] argues that any prob-lem where several robots share a single global reward or cost function can be formalized as aDec-POMDP. As such, a Dec-POMDP solver could generate policies for decentralized controlproblems in the presence of uncertainty in position, sensors, and information about teammates.Unfortunately, this generality has a cost: Dec-POMDPs are typically unfeasible to solve, exceptfor very small problems [Ber+02]; [AKK14]. This means that to update the state of each po-sition at each timestep would be computational and memory excessively expensive and, then,impractical in real-world scenarios [Men08]; [PR11].
As [MG92] stated: “Real-life strategic situations are often extremely complicated. Gametheory provides a model of this complexity”. Hence, we decided to use a game-theoretic ap-proach, which is an elegant way to model a decision-making process of an agent (a player) basedon the others agents decisions in a decentralized and distributed way. A game involves multipleand sometimes different kinds of players that act under uncertainty based on partial views of theworld. In a game, each player chooses an option (in parallel or sequentially) based purely onlocally observable information, resulting in an immediate payoff [SLB08].
In the robotic perspective, in order to improve the overall performance, first we designedasynchronous games, in which the game occurs when a drone is available to play, independentlyof the situation of the other players; second, instead of playing a game at each timestep, ourapproach use “macro-actions” (i.e., the game occurs when a drone conclude its current task),which can be seen as a simple and efficient modeling for real systems.
The interaction between the drones and the HO is also a game, in which the human payoff (orutility) function is estimated by the drones. But the nature of human decision making is intensely
1Parcially observable Markov decision process
3
complex, hence, our approach in the human perspective is founded on the the Prospect theory(PT) [KT79]; [TK92], and the Naturalistic decision making (NDM) framework [Kle99]. In thissense, we do not consider the HO as a flawless and rational decision maker (DM) that can decidewith logical consistency, regardless of the manner in which the options are presented. However,instead of attempting to “cure” the HO to have a logical and clear thinking, which consumes timeand needs complete information (not always available), we make use of the human emotional andintuitive way of thinking to lead the HO to act as an expert and make the best possible decisionunder uncertainty and time stress.
Thesis overview
This thesis is divided into two parts, in the first one we present the literature review used to modelour proposed system: Chapter 1 presents the theories about the human-robot interaction and somereal cases about robots operating in dirty, dull or dangerous situations. Then, in Chapter 2 wecontextualize the human decision making process, describe the heuristics and bias theory, inparticular the framing effect, and introduce the naturalistic decision-making framework. Chapter3 is dedicated to a general review, mainly about the utility theory and the prospect theory, thatwill help in understanding and relating later concepts in this manuscript. Following, Chapter 4introduces essential knowledge about the game theory used in this thesis.
The second part presents the contributions of this thesis: in Chapter 5 we present a decentral-ized utility function to coordinate a drone team; In Chapter 6 we introduce the human operator inthe team and a framing effect experiment in that context is conducted; the data produced in thisprevious experiment is also used to estimate a human utility in Chapter 7; and finally Chapter 8put everything together, formalizing and evaluating the whole system.
In the end, it is presented in Appendix A our first study that acted as a exploratory researchabout “mixed-initiative” and decision-making processes such as MDP2, POMDP and MOMDP3.It was reported in a conference paper with the title “MOMDP-based target search mission takinginto account the human operator’s cognitive state”, presented at IEEE International Conferenceon Tools with Artificial Intelligence(ICTAI 2015). This exploratory study is not in the main coreof this thesis.
2Markov decision process3Mixed observability Markov decision process
4

Part I
Literature review
5

CHAPTER 1
3D robots
Contents1.1 Dirty, dull or dangerous (3D) missions . . . . . . . . . . . . . . . . . . . . . . . 8
1.1.1 Search and rescue (SAR) . . . . . . . . . . . . . . . . . . . . . . . . . . . 8
1.1.2 Sample-return mission . . . . . . . . . . . . . . . . . . . . . . . . . . . . 9
1.2 Multi-robot systems (MRS) . . . . . . . . . . . . . . . . . . . . . . . . . . . . . 10
1.3 Robots interacting with humans . . . . . . . . . . . . . . . . . . . . . . . . . . 12
1.3.1 Levels of autonomy (LOA) . . . . . . . . . . . . . . . . . . . . . . . . . . 13
1.3.2 Initiative modes . . . . . . . . . . . . . . . . . . . . . . . . . . . . . . . . 14
1.4 Summary . . . . . . . . . . . . . . . . . . . . . . . . . . . . . . . . . . . . . . . 16
The Three Laws of Robotics:1: A robot may not injure a human beingor, through inaction, allow a human beingto come to harm;2: A robot must obey the orders given itby human beings except where suchorders would conflict with the First Law;3: A robot must protect its own existenceas long as such protection does notconflict with the First or Second Law;The Zeroth Law: A robot may not harmhumanity, or, by inaction, allow humanityto come to harm.
Isaac Asimov
Human safety is the utmost concern in the modern society, thus, dirty, dull, or dangerous(3D) tasks have been gradually transferred to robots. In this chapter, we point out some initiatives
7
about these “3D” robots and their levels of autonomy. Then, we present the idea of a frameworkwith a dynamic adjustment of the autonomy levels, accordingly with the mission phase, the typeof interactions that can exist among robotic teammates and a framework to include a human as amember of the team.
1.1 Dirty, dull or dangerous (3D) missions
In these type of missions, the operating environment can be dynamic, uncertain, unstructured,and hostile (e.g., radiation, explosive material, chemical or biological contamination, extremelyhot or extremely cold, outer space or in another celestial body). Nowadays, although severalinitiatives about autonomous systems [MSØ03]; [TL09], in general, real-life robots that operatein those contexts are remotely operated, such as the robots used in the World Trade Center andin the Fukushima nuclear plant [JA15], the military unmanned air vehicles (UAVs – or more pre-cisely, remotely piloted aircraft systems RPAS) [EAS17]; [Col04], and the Mars rovers [JPL17].Hence, the human operator (HO) and the robot must stay apart from each other and the dis-tance can create a disconnection between them, which presents some challenges for effectivecollaboration within the human-robot team (e.g., situational awareness and time delay).
Following, we present two different types of missions that we will consider for our frame-work.
1.1.1 Search and rescue (SAR)
SAR1 missions can be dirty, dull and dangerous, so, they are excellent candidates to a robot task.There are several types of SAR missions, they can be activated after an aircraft crash or whena ship loses its engines in the middle of nowhere, or even when some adventurous tourists getlost in the jungle or in mountain areas. There are also Urban SAR (USAR) missions that involvethe rescue of victims from the collapse of man-made structures. In general, this environment isunstable and dangerous, with piles of concrete rubble, exposed metal, dust, and debris.
For instance, small mobile robots were used in the aftermath of the World Trade Center dis-aster and Fukushima nuclear plant meltdown, offering a valuable contribution to the efforts inthose difficult environments in that they can go into places deemed too small or unsafe for peopleor dogs [JA15]. Another example is the European project GUARDIANS (Group of UnmannedAssistant Robots Deployed In Aggressive Navigation by Scent) that applies the concept of au-tonomous robots in USAR operations [Nag+08].
1Search and rescue
8
Robots involved in SAR operations must team with people both physically as well as per-ceptually [BM04]. For instance, [AT+15] proposed a Dec-POMDP Framework for human-robotteamwork coordination in SAR missions. Where robots and humans are teammates and the hu-mans are considered as intelligent agents with their own observations and actions.
[BM04] argues that an effective HRI2 in Urban SAR (USAR) missions currently requires aminimum 2:1 human-to-robot ratio, in order to maintain the HO situational awareness and reducethe cognitive and physical fatigue.
On the other hand, [Sch+04] affirms that completely autonomous robots for USAR are notfeasible in the near future. So HOs must work as teammates with the robots, with all partiescontributing according to their skills and capabilities.
1.1.2 Sample-return mission
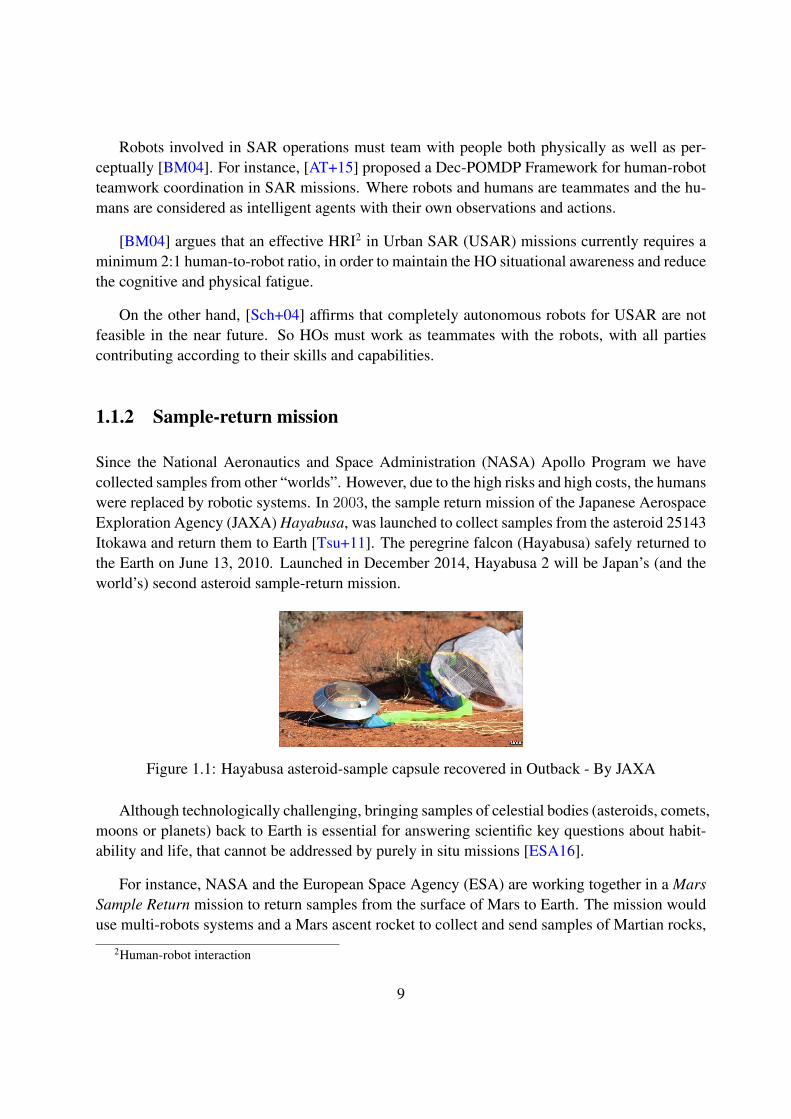
Since the National Aeronautics and Space Administration (NASA) Apollo Program we havecollected samples from other “worlds”. However, due to the high risks and high costs, the humanswere replaced by robotic systems. In 2003, the sample return mission of the Japanese AerospaceExploration Agency (JAXA) Hayabusa, was launched to collect samples from the asteroid 25143Itokawa and return them to Earth [Tsu+11]. The peregrine falcon (Hayabusa) safely returned tothe Earth on June 13, 2010. Launched in December 2014, Hayabusa 2 will be Japan’s (and theworld’s) second asteroid sample-return mission.
Figure 1.1: Hayabusa asteroid-sample capsule recovered in Outback - By JAXA
Although technologically challenging, bringing samples of celestial bodies (asteroids, comets,moons or planets) back to Earth is essential for answering scientific key questions about habit-ability and life, that cannot be addressed by purely in situ missions [ESA16].
For instance, NASA and the European Space Agency (ESA) are working together in a MarsSample Return mission to return samples from the surface of Mars to Earth. The mission woulduse multi-robots systems and a Mars ascent rocket to collect and send samples of Martian rocks,
2Human-robot interaction
9
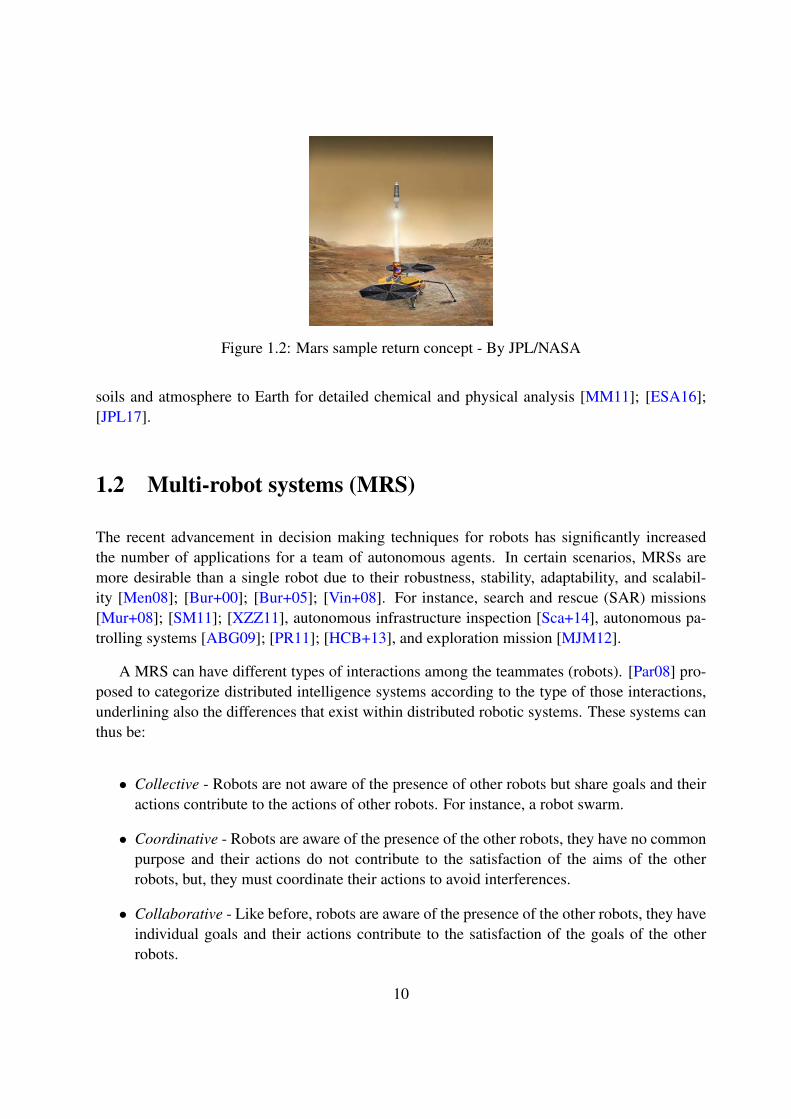
Figure 1.2: Mars sample return concept - By JPL/NASA
soils and atmosphere to Earth for detailed chemical and physical analysis [MM11]; [ESA16];[JPL17].
1.2 Multi-robot systems (MRS)
The recent advancement in decision making techniques for robots has significantly increasedthe number of applications for a team of autonomous agents. In certain scenarios, MRSs aremore desirable than a single robot due to their robustness, stability, adaptability, and scalabil-ity [Men08]; [Bur+00]; [Bur+05]; [Vin+08]. For instance, search and rescue (SAR) missions[Mur+08]; [SM11]; [XZZ11], autonomous infrastructure inspection [Sca+14], autonomous pa-trolling systems [ABG09]; [PR11]; [HCB+13], and exploration mission [MJM12].
A MRS can have different types of interactions among the teammates (robots). [Par08] pro-posed to categorize distributed intelligence systems according to the type of those interactions,underlining also the differences that exist within distributed robotic systems. These systems canthus be:
• Collective - Robots are not aware of the presence of other robots but share goals and theiractions contribute to the actions of other robots. For instance, a robot swarm.
• Coordinative - Robots are aware of the presence of the other robots, they have no commonpurpose and their actions do not contribute to the satisfaction of the aims of the otherrobots, but, they must coordinate their actions to avoid interferences.
• Collaborative - Like before, robots are aware of the presence of the other robots, they haveindividual goals and their actions contribute to the satisfaction of the goals of the otherrobots.
10
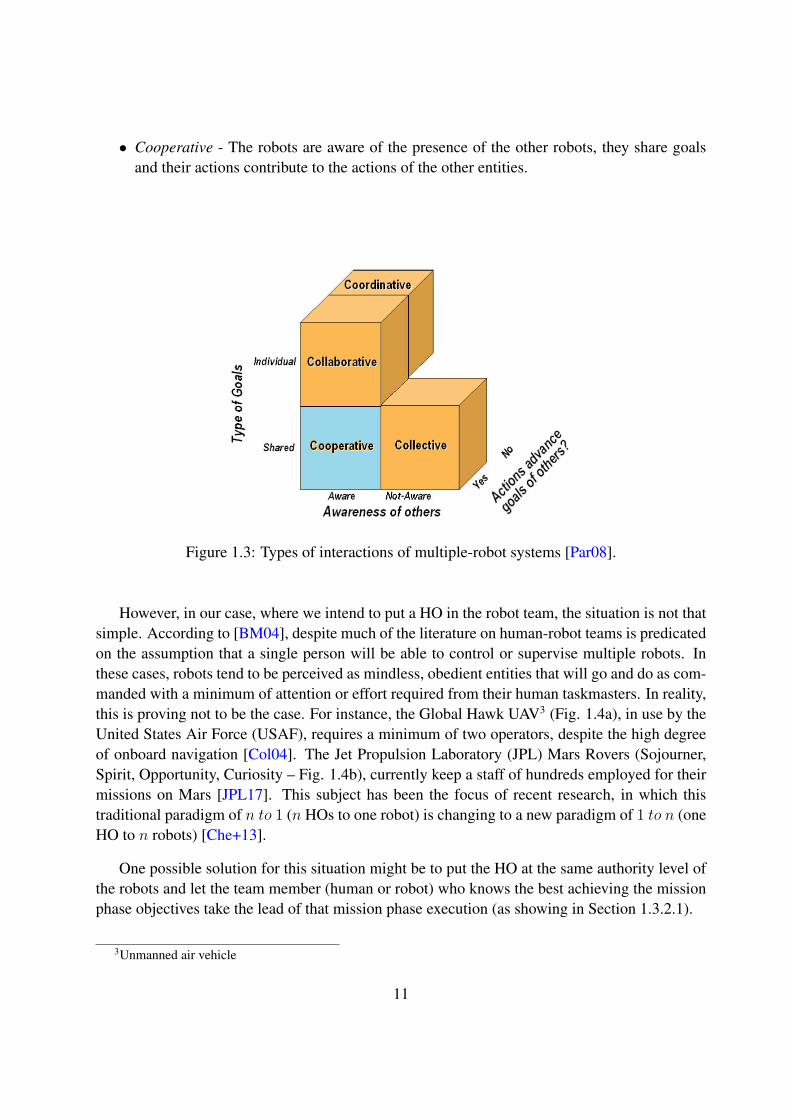
• Cooperative - The robots are aware of the presence of the other robots, they share goalsand their actions contribute to the actions of the other entities.
Figure 1.3: Types of interactions of multiple-robot systems [Par08].
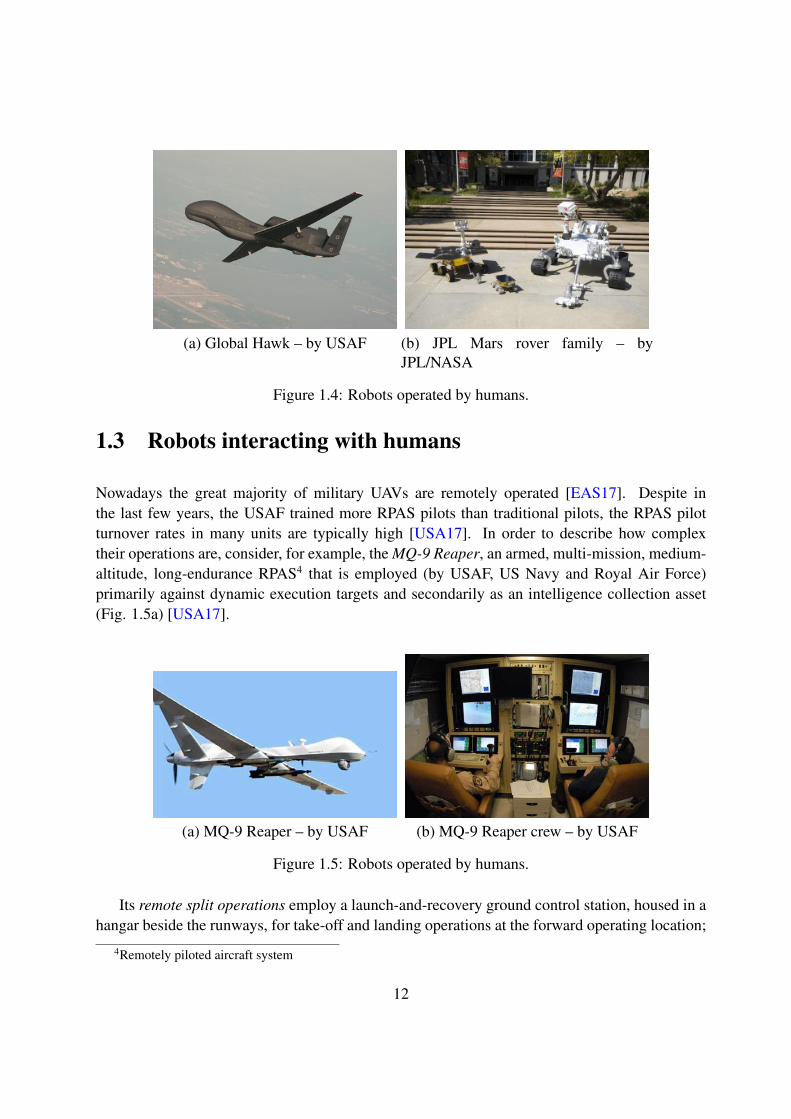
However, in our case, where we intend to put a HO in the robot team, the situation is not thatsimple. According to [BM04], despite much of the literature on human-robot teams is predicatedon the assumption that a single person will be able to control or supervise multiple robots. Inthese cases, robots tend to be perceived as mindless, obedient entities that will go and do as com-manded with a minimum of attention or effort required from their human taskmasters. In reality,this is proving not to be the case. For instance, the Global Hawk UAV3 (Fig. 1.4a), in use by theUnited States Air Force (USAF), requires a minimum of two operators, despite the high degreeof onboard navigation [Col04]. The Jet Propulsion Laboratory (JPL) Mars Rovers (Sojourner,Spirit, Opportunity, Curiosity – Fig. 1.4b), currently keep a staff of hundreds employed for theirmissions on Mars [JPL17]. This subject has been the focus of recent research, in which thistraditional paradigm of n to 1 (n HOs to one robot) is changing to a new paradigm of 1 to n (oneHO to n robots) [Che+13].
One possible solution for this situation might be to put the HO at the same authority level ofthe robots and let the team member (human or robot) who knows the best achieving the missionphase objectives take the lead of that mission phase execution (as showing in Section 1.3.2.1).
3Unmanned air vehicle
11
(a) Global Hawk – by USAF (b) JPL Mars rover family – byJPL/NASA
Figure 1.4: Robots operated by humans.
1.3 Robots interacting with humans
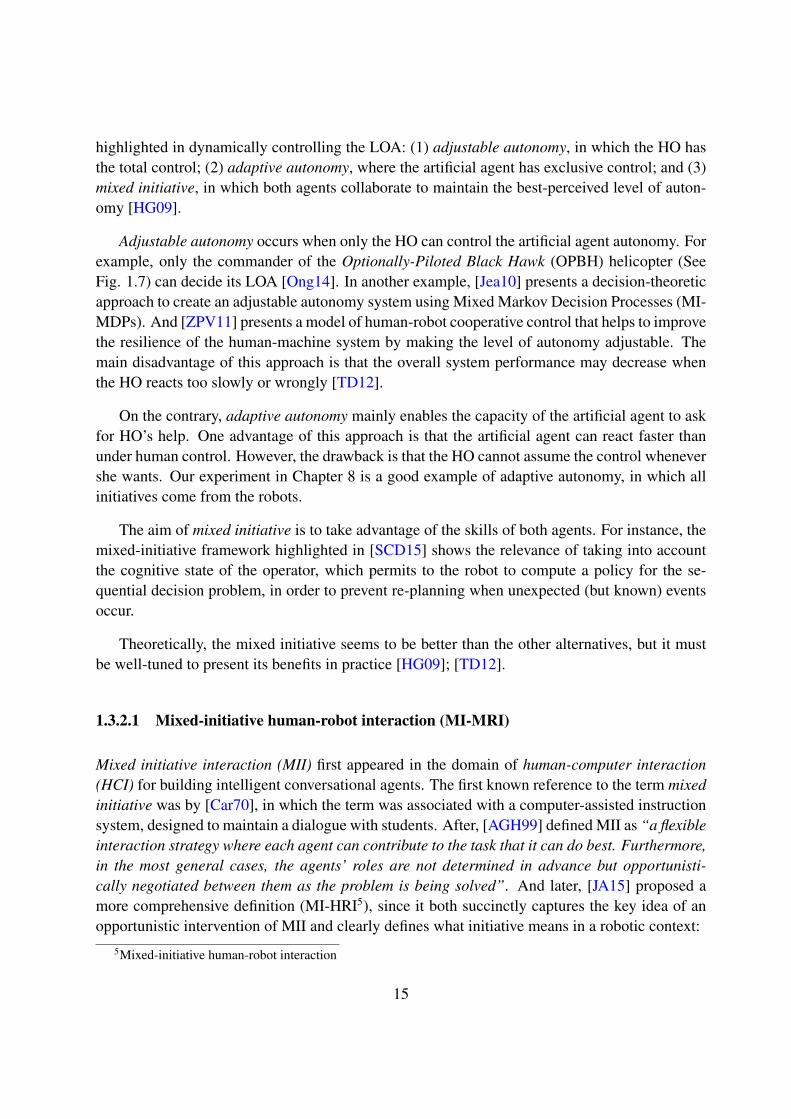
Nowadays the great majority of military UAVs are remotely operated [EAS17]. Despite inthe last few years, the USAF trained more RPAS pilots than traditional pilots, the RPAS pilotturnover rates in many units are typically high [USA17]. In order to describe how complextheir operations are, consider, for example, the MQ-9 Reaper, an armed, multi-mission, medium-altitude, long-endurance RPAS4 that is employed (by USAF, US Navy and Royal Air Force)primarily against dynamic execution targets and secondarily as an intelligence collection asset(Fig. 1.5a) [USA17].
(a) MQ-9 Reaper – by USAF (b) MQ-9 Reaper crew – by USAF
Figure 1.5: Robots operated by humans.
Its remote split operations employ a launch-and-recovery ground control station, housed in ahangar beside the runways, for take-off and landing operations at the forward operating location;
4Remotely piloted aircraft system
12

while a three-member crew, based a thousand miles apart, executes the remainder of the missionvia beyond-line-of-sight satellite links. Both teams have a pilot and a sensor operator sit in frontof several video screens, with a keyboard and a joystick (Fig. 1.5b), the remote team has also amission coordinator. This concept of operation results in a smaller number of personnel deployedto a forward location, however, it requires several remote teams (supported by meteorologists,communications specialists, intelligence analysts and so on), each operating for six fatiguinghours in a 12 hours shift, for keeping a minimum of aircraft aloft 24 hours per day, seven days aweek [USA17]; [MPR09].
In flight, the RPAS pilot, likewise a traditional pilot, must control the aircraft, communicatewith air traffic agencies, and maintain situational awareness of flight parameters, system health,atmospheric conditions, restricted airspaces, and other aircraft in the vicinity. But, through sixflat displays with information in different formats, without “feeling” the aircraft. Fatigue is notthe only complaint of the pilots. They argue that it is difficult to focus in their “top secret” missionwhen on duty, making critical decisions that involve life and death, and, afterward, return hometo fix the heater or to play soccer with their kids [MPR09].
Despite this demanding environment, there is a vision to broaden the use of RPAS by havinga small crew operating multiple UAVs (from 3 to 50 drones). However, considerable researchand development must be done to reach this capability [Cal+16].
1.3.1 Levels of autonomy (LOA)
Currently, an unmanned system (UMS) can be remotely controlled (tethered or wireless), assistedby a human operator, totally autonomous, or somewhere in between. While, on one hand, someresearches have tried to avoid all human behavior complexity, delegating all decisions to com-plete autonomous systems based on Artificial Intelligence (AI) algorithms [Mur+08]; [SM11];[XZZ11]. On the other hand, others have tried to enhance robots and computer interfaces to helphuman users in the execution of their missions [Hea99]; [Nag+08]; [Sch+04].
In order to formulate a logical framework for characterizing the UMS autonomy, coveringissues of levels of autonomy (LOA), mission complexity, and environmental complexity, the USNational Institute of Standards and Technology (NIST) created in 2003 the workgroup AutonomyLevels for Unmanned Systems (ALFUS) [Hua+05]; [Hua07]. Figure 1.6 illustrates the ALFUSdetailed model.
In this framework, the autonomy level of a particular UMS can be represented with a triangu-lar surface fitted through the values on the three axes. This model suggests vectors, as opposedto a single scale, to characterize unmanned system autonomy levels. Observe that the humaninterface in Fig. 1.6 is inversely proportional to the autonomy level, in other words, how much aUMS is independent of an interaction with humans.
13

Figure 1.6: Three dimensions determining the autonomy level for unmanned systems [Hua+04]
For example, consider the project of the Optionally-Piloted Black Hawk (OPBH) helicopter[Ong14] (Fig. 1.7). It could provide the commander with the flexibility to determine au-tonomous, remotely-operated or piloted operations, according to the complexity of the missionand the environment. The idea is to maximize the mission efficiency. The great advantage wouldbe the capability to spare pilots boring, repetitive, and relatively simple phases of a mission (e.g.,to return to the base for refueling on a sunny day). They could instead focus their energies onmore demanding missions involving difficult weather and human lives.
Figure 1.7: Optionally-piloted Black Hawk - By Sikorsky
In this case, although the LOA can variate, the initiative always comes from the humanbeings. HO (the pilot) is like a flawless god (for the machine) and decides when the helicoptercan or cannot “take decisions”.
1.3.2 Initiative modes
Sometimes it is interesting to change not only the LOA of an artificial system but also the ini-tiative mode, allowing it to define its own LOA. In the recent literature, three approaches are
14
highlighted in dynamically controlling the LOA: (1) adjustable autonomy, in which the HO hasthe total control; (2) adaptive autonomy, where the artificial agent has exclusive control; and (3)mixed initiative, in which both agents collaborate to maintain the best-perceived level of auton-omy [HG09].
Adjustable autonomy occurs when only the HO can control the artificial agent autonomy. Forexample, only the commander of the Optionally-Piloted Black Hawk (OPBH) helicopter (SeeFig. 1.7) can decide its LOA [Ong14]. In another example, [Jea10] presents a decision-theoreticapproach to create an adjustable autonomy system using Mixed Markov Decision Processes (MI-MDPs). And [ZPV11] presents a model of human-robot cooperative control that helps to improvethe resilience of the human-machine system by making the level of autonomy adjustable. Themain disadvantage of this approach is that the overall system performance may decrease whenthe HO reacts too slowly or wrongly [TD12].
On the contrary, adaptive autonomy mainly enables the capacity of the artificial agent to askfor HO’s help. One advantage of this approach is that the artificial agent can react faster thanunder human control. However, the drawback is that the HO cannot assume the control whenevershe wants. Our experiment in Chapter 8 is a good example of adaptive autonomy, in which allinitiatives come from the robots.
The aim of mixed initiative is to take advantage of the skills of both agents. For instance, themixed-initiative framework highlighted in [SCD15] shows the relevance of taking into accountthe cognitive state of the operator, which permits to the robot to compute a policy for the se-quential decision problem, in order to prevent re-planning when unexpected (but known) eventsoccur.
Theoretically, the mixed initiative seems to be better than the other alternatives, but it mustbe well-tuned to present its benefits in practice [HG09]; [TD12].
1.3.2.1 Mixed-initiative human-robot interaction (MI-MRI)
Mixed initiative interaction (MII) first appeared in the domain of human-computer interaction(HCI) for building intelligent conversational agents. The first known reference to the term mixedinitiative was by [Car70], in which the term was associated with a computer-assisted instructionsystem, designed to maintain a dialogue with students. After, [AGH99] defined MII as “a flexibleinteraction strategy where each agent can contribute to the task that it can do best. Furthermore,in the most general cases, the agents’ roles are not determined in advance but opportunisti-cally negotiated between them as the problem is being solved”. And later, [JA15] proposed amore comprehensive definition (MI-HRI5), since it both succinctly captures the key idea of anopportunistic intervention of MII and clearly defines what initiative means in a robotic context:
5Mixed-initiative human-robot interaction
15
A collaboration strategy for human-robot teams where humans and robots op-portunistically seize (relinquish) initiative from (to) each other as a mission is beingexecuted, where initiative is an element of the mission that can range from low-levelmotion control of the robot to high-level specification of mission goals, and the ini-tiative is mixed only when each member is authorized to intervene and seize controlof it.
Thus, MI-HRI is a framework where HO6 and a robot can collaborate as peers in an effectiveteam. Both have their own respective limitations when operating under extreme conditions, how-ever, they each also have a set of complementary skills [JA15]. Here we can see the advantagesof a MI-HRI system, where the HO do not have and do not need to have a complete situationalawareness in order to optimize the results of a mission. In this case, the artificial system must beable to decide for itself and take over the initiative when necessary.
Particularly, in complex missions, an MI-HRI system should require some level of supervi-sion but not necessarily continual monitoring [BCJ15]. In these cases, a single operator may beresponsible for multiple unmanned systems, thus, expanding the HO’s role to even harder tacticalor ethical decision. For example, [Bev+15] presented a mixed-initiative planning and executionframework for human-multi-drones interaction during SAR missions.
1.4 Summary
This chapter was dedicated to describe our view about “3D” robots and point out some MRS7
missions used in our experiments and to illustrate our proposition throughout this thesis.
Initially, we listed some researches and initiatives involving robots in SAR and Sample-return operations. Following, we introduced the MRS, the different types of interactions amongthe robotic teammates, and the challenges to change the traditional paradigm of n operatorsto 1 robot to a new paradigm of 1 operator (or a few operators) to n robots. In this sense, webriefly described the current USAF operation of the MQ-9 Reaper RPAS. Then, we presented theALFUS8, a framework for dynamical adjustments of the autonomy levels, and the categorizationof initiative modes.
Finally, we defined MII and MI-HRI, frameworks where humans and artificial agents cancollaborate as peers in an effective team. These concepts were used in our studies as overarchinggoals to be pursued.
6Human operator7Multiple-robot system8Autonomy levels for unmanned systems
16

Next, we will address the human decision-making process and its theories.
17

CHAPTER 2
The “H” factor
Contents2.1 Human decision making process . . . . . . . . . . . . . . . . . . . . . . . . . . 20
2.2 Bounded rationality . . . . . . . . . . . . . . . . . . . . . . . . . . . . . . . . . 20
2.3 Dual process theory (DPT) . . . . . . . . . . . . . . . . . . . . . . . . . . . . . 21
2.4 Heuristics and biases . . . . . . . . . . . . . . . . . . . . . . . . . . . . . . . . 22
2.4.1 Endowment effect . . . . . . . . . . . . . . . . . . . . . . . . . . . . . . 24
2.4.2 Framing effect (FE) . . . . . . . . . . . . . . . . . . . . . . . . . . . . . . 24
2.5 Improving decision making . . . . . . . . . . . . . . . . . . . . . . . . . . . . . 26
2.5.1 Naturalistic decision making (NDM) . . . . . . . . . . . . . . . . . . . . . 27
2.6 Summary . . . . . . . . . . . . . . . . . . . . . . . . . . . . . . . . . . . . . . . 28
A compelling narrative fosters an illusionof inevitability.
Daniel Kahneman
Decision making is a critical issue for humans cooperate with intelligent robots. While sometheories of decision making affirm that many cognitive biases affect human judgments, leadingto suboptimal or irrational decisions, and tend to emphasize the use of analytical processes inguiding human decisions, others argues that intuitive and emotional responses can play a keyrole in human decision-making process under time constraints and limited information conditions[DM+06]. In this chapter, we introduce these theories in order to make use of them to put thehuman operator (HO) in the loop as a teammate of the drones.
19

2.1 Human decision making process
The introduction of highly automatized systems has radically changed the role of human opera-tors from direct controllers to a system supervisor and decision maker. As a matter of fact, thereis a need to better understand theoretical models of human decision-making process to optimizedHRI and to implement mixed-initiative interactions. The models and theories of this process canbe separated into two classes: prescriptive (or normative) and descriptive [Bar07]; [Kah11].
The first category explores how people should make decisions. These theories typically as-sume ideal circumstances, as for instance, complete information, awareness of all options, anabundance of time to decide, and so on, in order to model the best and most rational path a per-son can take in order to come to the most suitable decision [TG00]. They assume that DM1s havea stable set of preferences and they are always trying to maximize their satisfaction [Suh07].
Prescriptive models are useful in highlighting how real-world decision-making processesmight be improved and in efforts to make computers and robots think (e.g., Expected utilitytheory, Subjective expected utility theory, Behavioral decision theory, and others). However,they remain theoretical in nature, because people rarely, if ever, operate under the circumstancesthat such theories propose [TG00].
In contrast to prescriptive theories, descriptive models describe how people actually makedecisions in the real-life situations, regardless of their rationality, elegance or efficacy [Suh07](e.g., Heuristics and biases, Naturalistic Decision Making, Team cognition and others). Descrip-tive theories acknowledge that there are finite bounds to human cognition that frequently resultin irrational decisions. Table 2.1 shows some examples for comparison and better understanding.
2.2 Bounded rationality
As said before, prescriptive models have tended to view human DMs as possessing supernaturalpowers of reason, limitless knowledge, and endless time. Conversely, instead of operating underthose perfect circumstances, bounded rationality theory proposes that human DMs in the realworld have to function under three crucial constraints that effectively limit human’s rationality:(1) limited access to information, (2) cognitive limitations inherent to the human mind, and(3) limited time to make a decision [Sim55]; [Sim57]. This theory overturns the notion thathumans process information and make decisions in a purely rational way, notably in situationsthat involve risk and uncertainty.
Some of the most important works in this regard has been conducted by Amos Tversky and
1Decision maker
20
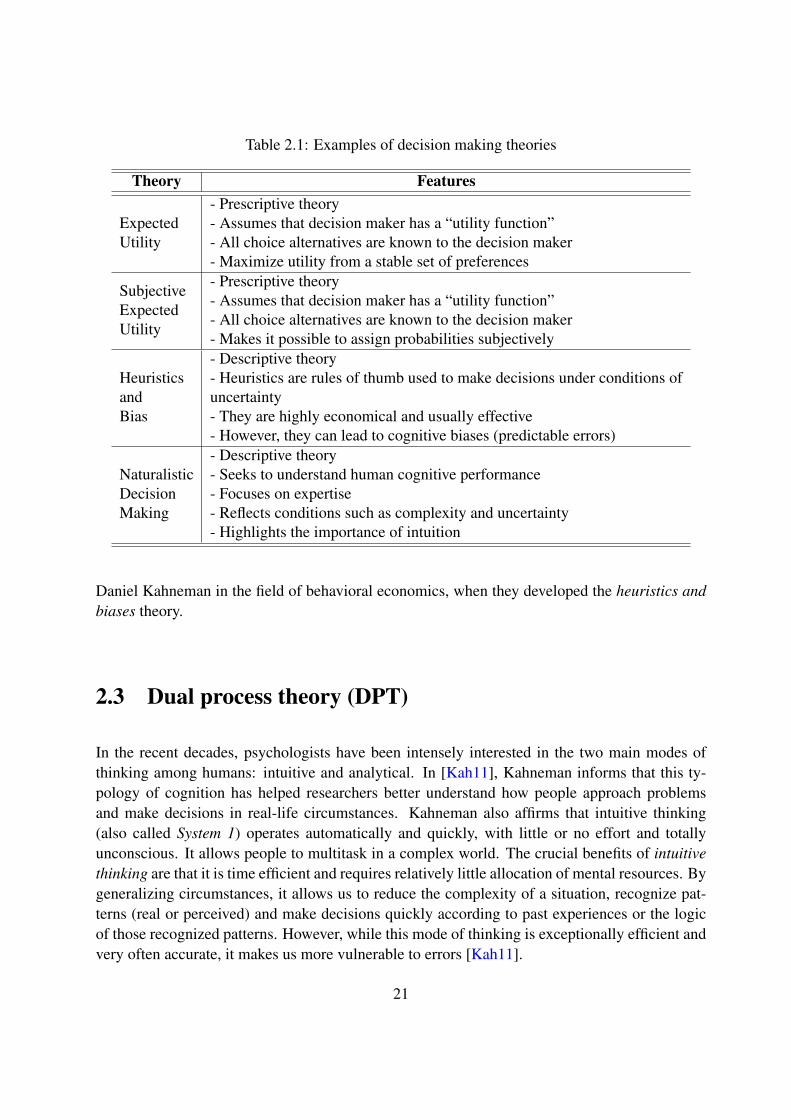
Table 2.1: Examples of decision making theories
Theory Features
ExpectedUtility
- Prescriptive theory- Assumes that decision maker has a “utility function”- All choice alternatives are known to the decision maker- Maximize utility from a stable set of preferences
SubjectiveExpectedUtility
- Prescriptive theory- Assumes that decision maker has a “utility function”- All choice alternatives are known to the decision maker- Makes it possible to assign probabilities subjectively
HeuristicsandBias
- Descriptive theory- Heuristics are rules of thumb used to make decisions under conditions ofuncertainty- They are highly economical and usually effective- However, they can lead to cognitive biases (predictable errors)
NaturalisticDecisionMaking
- Descriptive theory- Seeks to understand human cognitive performance- Focuses on expertise- Reflects conditions such as complexity and uncertainty- Highlights the importance of intuition
Daniel Kahneman in the field of behavioral economics, when they developed the heuristics andbiases theory.
2.3 Dual process theory (DPT)
In the recent decades, psychologists have been intensely interested in the two main modes ofthinking among humans: intuitive and analytical. In [Kah11], Kahneman informs that this ty-pology of cognition has helped researchers better understand how people approach problemsand make decisions in real-life circumstances. Kahneman also affirms that intuitive thinking(also called System 1) operates automatically and quickly, with little or no effort and totallyunconscious. It allows people to multitask in a complex world. The crucial benefits of intuitivethinking are that it is time efficient and requires relatively little allocation of mental resources. Bygeneralizing circumstances, it allows us to reduce the complexity of a situation, recognize pat-terns (real or perceived) and make decisions quickly according to past experiences or the logicof those recognized patterns. However, while this mode of thinking is exceptionally efficient andvery often accurate, it makes us more vulnerable to errors [Kah11].
21
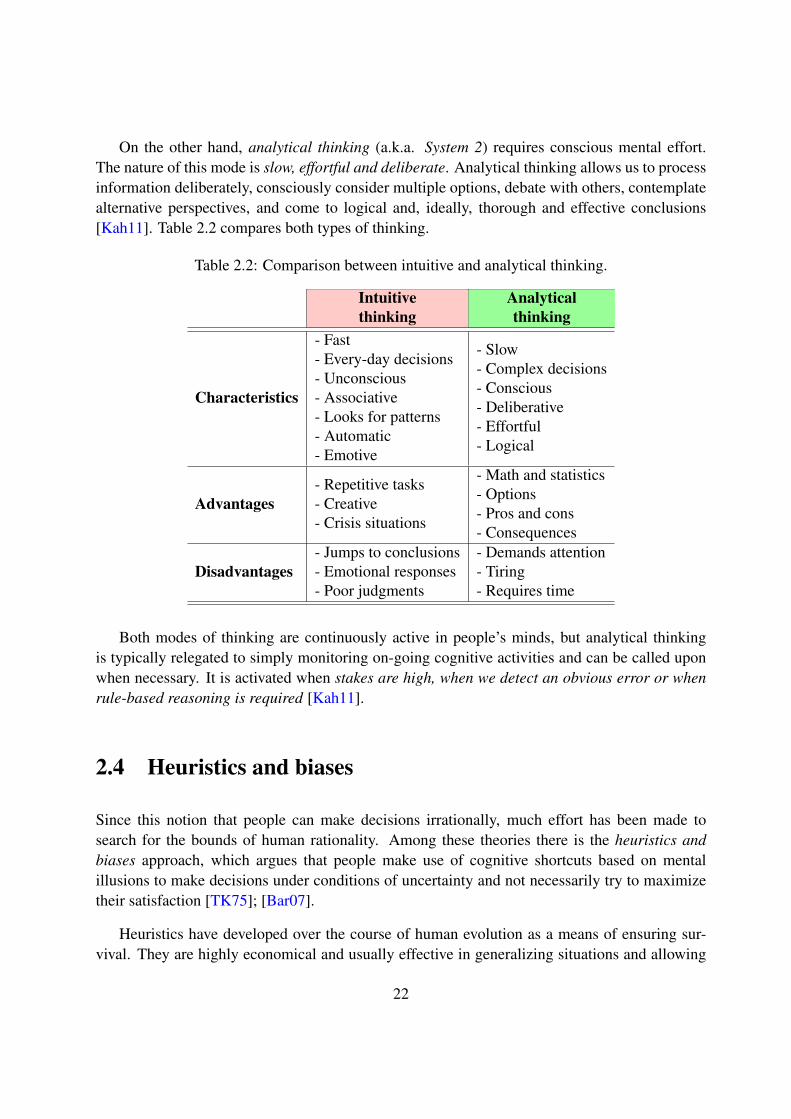
On the other hand, analytical thinking (a.k.a. System 2) requires conscious mental effort.The nature of this mode is slow, effortful and deliberate. Analytical thinking allows us to processinformation deliberately, consciously consider multiple options, debate with others, contemplatealternative perspectives, and come to logical and, ideally, thorough and effective conclusions[Kah11]. Table 2.2 compares both types of thinking.
Table 2.2: Comparison between intuitive and analytical thinking.
Intuitivethinking
Analyticalthinking
Characteristics
- Fast- Every-day decisions- Unconscious- Associative- Looks for patterns- Automatic- Emotive
- Slow- Complex decisions- Conscious- Deliberative- Effortful- Logical
Advantages- Repetitive tasks- Creative- Crisis situations
- Math and statistics- Options- Pros and cons- Consequences
Disadvantages- Jumps to conclusions- Emotional responses- Poor judgments
- Demands attention- Tiring- Requires time
Both modes of thinking are continuously active in people’s minds, but analytical thinkingis typically relegated to simply monitoring on-going cognitive activities and can be called uponwhen necessary. It is activated when stakes are high, when we detect an obvious error or whenrule-based reasoning is required [Kah11].
2.4 Heuristics and biases
Since this notion that people can make decisions irrationally, much effort has been made tosearch for the bounds of human rationality. Among these theories there is the heuristics andbiases approach, which argues that people make use of cognitive shortcuts based on mentalillusions to make decisions under conditions of uncertainty and not necessarily try to maximizetheir satisfaction [TK75]; [Bar07].
Heuristics have developed over the course of human evolution as a means of ensuring sur-vival. They are highly economical and usually effective in generalizing situations and allowing
22
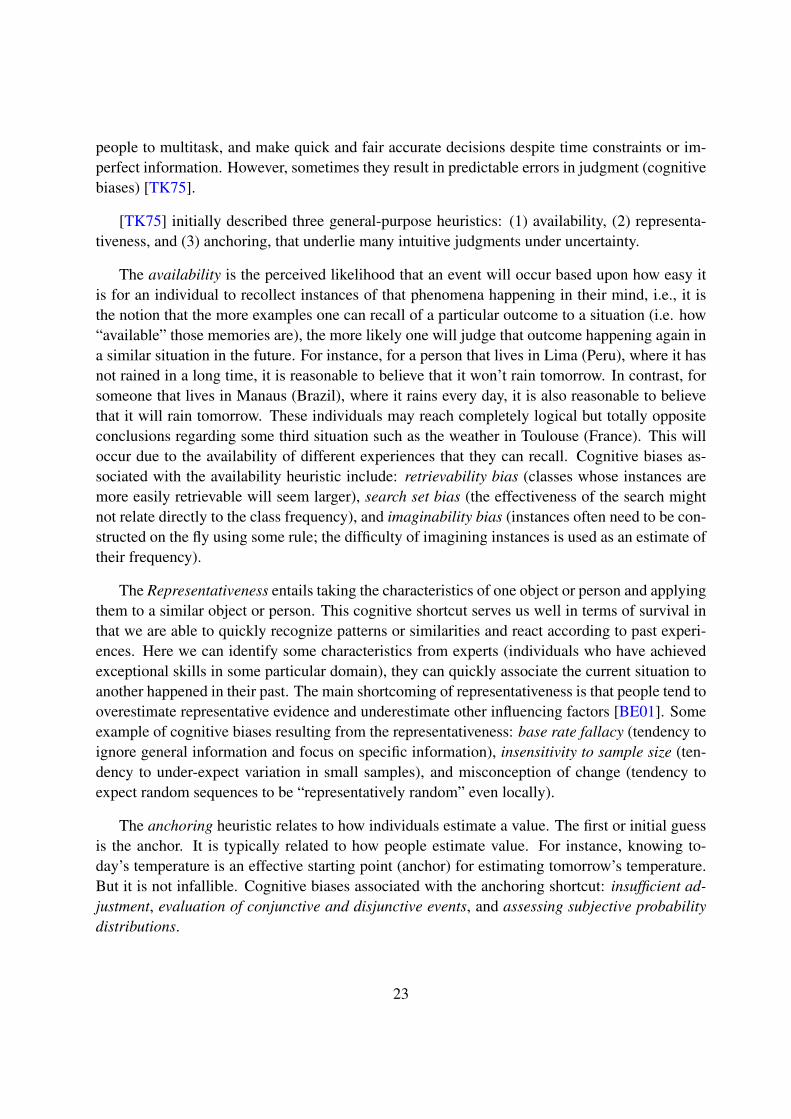
people to multitask, and make quick and fair accurate decisions despite time constraints or im-perfect information. However, sometimes they result in predictable errors in judgment (cognitivebiases) [TK75].
[TK75] initially described three general-purpose heuristics: (1) availability, (2) representa-tiveness, and (3) anchoring, that underlie many intuitive judgments under uncertainty.
The availability is the perceived likelihood that an event will occur based upon how easy itis for an individual to recollect instances of that phenomena happening in their mind, i.e., it isthe notion that the more examples one can recall of a particular outcome to a situation (i.e. how“available” those memories are), the more likely one will judge that outcome happening again ina similar situation in the future. For instance, for a person that lives in Lima (Peru), where it hasnot rained in a long time, it is reasonable to believe that it won’t rain tomorrow. In contrast, forsomeone that lives in Manaus (Brazil), where it rains every day, it is also reasonable to believethat it will rain tomorrow. These individuals may reach completely logical but totally oppositeconclusions regarding some third situation such as the weather in Toulouse (France). This willoccur due to the availability of different experiences that they can recall. Cognitive biases as-sociated with the availability heuristic include: retrievability bias (classes whose instances aremore easily retrievable will seem larger), search set bias (the effectiveness of the search mightnot relate directly to the class frequency), and imaginability bias (instances often need to be con-structed on the fly using some rule; the difficulty of imagining instances is used as an estimate oftheir frequency).
The Representativeness entails taking the characteristics of one object or person and applyingthem to a similar object or person. This cognitive shortcut serves us well in terms of survival inthat we are able to quickly recognize patterns or similarities and react according to past experi-ences. Here we can identify some characteristics from experts (individuals who have achievedexceptional skills in some particular domain), they can quickly associate the current situation toanother happened in their past. The main shortcoming of representativeness is that people tend tooverestimate representative evidence and underestimate other influencing factors [BE01]. Someexample of cognitive biases resulting from the representativeness: base rate fallacy (tendency toignore general information and focus on specific information), insensitivity to sample size (ten-dency to under-expect variation in small samples), and misconception of change (tendency toexpect random sequences to be “representatively random” even locally).
The anchoring heuristic relates to how individuals estimate a value. The first or initial guessis the anchor. It is typically related to how people estimate value. For instance, knowing to-day’s temperature is an effective starting point (anchor) for estimating tomorrow’s temperature.But it is not infallible. Cognitive biases associated with the anchoring shortcut: insufficient ad-justment, evaluation of conjunctive and disjunctive events, and assessing subjective probabilitydistributions.
23

2.4.1 Endowment effect
The endowment effect is defined as a tendency that people have to attribute more value to anobject when they own it, that when they do not own it. [TK92] postulates that individuals perceivethe separation of property owned as constituting a greater loss than the potential gain generatedby the purchase of another item of the same value (loss aversion).
However, [Mor+09] argues that it is the ownership that causes the endowment effect. Toprove this hypothesis, they carried out two experiments in which sellers were distinguished fromowners. In the first experiment, buyers were willing to pay just as much for a mug as sellersdemanded if the buyers already own an identical mug. In the other experiment, buyers’ brokersand sellers’ brokers agreed on the price of a mug, but both brokers traded at higher prices whenthey happened to own mugs that were identical to the ones they were trading. According to them,if loss aversion drives the endowment effect, sellers should value the object more than buyers do,regardless if those buyers already own a similar object or not. On the other hand, if ownershipdrives the endowment effect, then owners should value the object more than non-owners do,regardless of whether they are selling or buying. As their results showed.
In an interesting case involving human-robot interaction, [MBJ15] conducted an experiment,where a humanoid robot replaces the experimenter to study the endowment effect. Their findingssuggested that there was no endowment effect in that HRI.
Another cognitive bias of our interest occurs when people react to a particular choice indifferent ways depending on how it is presented. It is called Framing effect and will be presentednext.
2.4.2 Framing effect (FE)
The Framing Effect is a key aspect of Prospect theory (see Sec. 3.5), which states that differentdescriptions of formally identical problems can result in different choices [Kah11]; [TK75]. Thecore concepts in explain it resides in the combination of beliefs, fears, values, desires, mentalmodels, and so on, which human beings use to perceive a situation. People effectively lookthrough this frame in the way they would look through colored sunglasses. The frame signifi-cantly affects how we infer meaning and hence understand the situation.
In the classical experiment, [TK81] explored how different phrasing affected participants’responses to a choice in a hypothetical life and death situation. In this experiment, participantswere asked to choose between two treatments for 600 people affected by a deadly disease. Treat-ment A was predicted to result in 400 deaths, whereas treatment B had a 33% chance that no onewould die but a 66% chance that everyone would die. This choice was then presented to partic-ipants either with positive framing, i.e. how many people would live, or with negative framing,
24
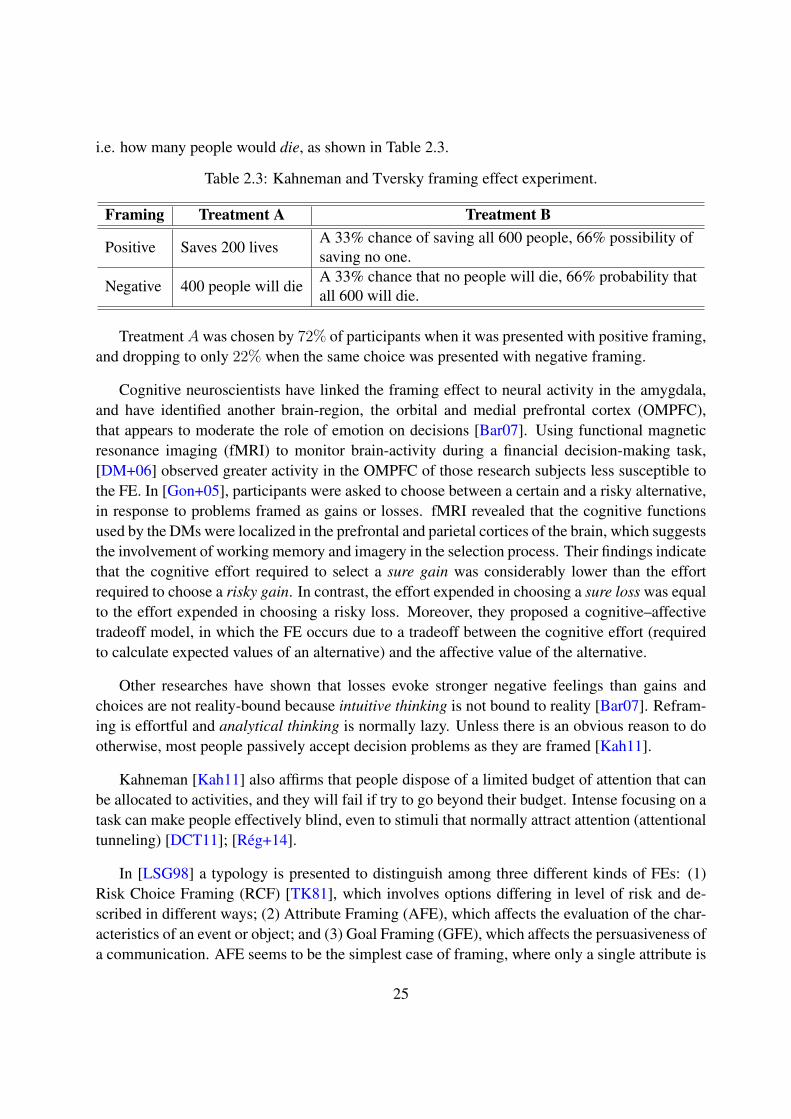
i.e. how many people would die, as shown in Table 2.3.
Table 2.3: Kahneman and Tversky framing effect experiment.
Framing Treatment A Treatment B
Positive Saves 200 livesA 33% chance of saving all 600 people, 66% possibility ofsaving no one.
Negative 400 people will dieA 33% chance that no people will die, 66% probability thatall 600 will die.
TreatmentA was chosen by 72% of participants when it was presented with positive framing,and dropping to only 22% when the same choice was presented with negative framing.
Cognitive neuroscientists have linked the framing effect to neural activity in the amygdala,and have identified another brain-region, the orbital and medial prefrontal cortex (OMPFC),that appears to moderate the role of emotion on decisions [Bar07]. Using functional magneticresonance imaging (fMRI) to monitor brain-activity during a financial decision-making task,[DM+06] observed greater activity in the OMPFC of those research subjects less susceptible tothe FE. In [Gon+05], participants were asked to choose between a certain and a risky alternative,in response to problems framed as gains or losses. fMRI revealed that the cognitive functionsused by the DMs were localized in the prefrontal and parietal cortices of the brain, which suggeststhe involvement of working memory and imagery in the selection process. Their findings indicatethat the cognitive effort required to select a sure gain was considerably lower than the effortrequired to choose a risky gain. In contrast, the effort expended in choosing a sure loss was equalto the effort expended in choosing a risky loss. Moreover, they proposed a cognitive–affectivetradeoff model, in which the FE occurs due to a tradeoff between the cognitive effort (requiredto calculate expected values of an alternative) and the affective value of the alternative.
Other researches have shown that losses evoke stronger negative feelings than gains andchoices are not reality-bound because intuitive thinking is not bound to reality [Bar07]. Refram-ing is effortful and analytical thinking is normally lazy. Unless there is an obvious reason to dootherwise, most people passively accept decision problems as they are framed [Kah11].
Kahneman [Kah11] also affirms that people dispose of a limited budget of attention that canbe allocated to activities, and they will fail if try to go beyond their budget. Intense focusing on atask can make people effectively blind, even to stimuli that normally attract attention (attentionaltunneling) [DCT11]; [Rég+14].
In [LSG98] a typology is presented to distinguish among three different kinds of FEs: (1)Risk Choice Framing (RCF) [TK81], which involves options differing in level of risk and de-scribed in different ways; (2) Attribute Framing (AFE), which affects the evaluation of the char-acteristics of an event or object; and (3) Goal Framing (GFE), which affects the persuasiveness ofa communication. AFE seems to be the simplest case of framing, where only a single attribute is
25
the subject of the framing manipulation and the evaluation can be measured by choices betweenyes or no. AFEs are also less likely when dealing with extremes [LSG98].
In another study and using a within-subjects framing manipulation and applying a differencescore between positive and negative conditions as the unit of analysis for each type of framing,[Lev+02] presented new ways of looking at FEs. For instance, they illustrate that even more canbe learned by going beyond aggregate results and examining individual differences in the effectsbeing examined.
2.5 Improving decision making
Despite the vast body of research since the 1970s, there remains a lack of consensus on ap-propriate and effective methods of “debiasing”. [GGK02] suggests that understanding biasesmight decrease their effects. Another proposed strategy for overcoming cognitive biases is todeliberately shift people from intuitive thinking to analytical thinking. This involves promot-ing meta-cognitive skills to help people replace intuition with more deliberate analytic processes[Mor+15], and consumes time. [MCB09] explains that it may be possible to achieve this cogni-tive shift through several approaches, for instance, taking an outsider’s perspective and consider-ing the opposite of whatever decision the decision-maker is about to make.
However, this comes into direct conflict with the nature of many of the decision making sce-narios that military and first-responder professionals (doctors, nurses, firemen, police officers,and so forth) expect to face. The complexity and uncertainty of these situations may not affordindividuals the luxury of time or collaboration that the methods detailed above require, particu-larly for soldiers operating at the tactical level where commanders must rely on quick, and ofteninherently intuitive, decisions [Kle89]. For example, [TG00] describe the following situation “Aman is rushed to a hospital in the throes of a heart attack. The doctor needs to decide whether thevictim should be treated as a low-risk or a high-risk patient. He is at high risk if his life is trulythreatened, and should receive the most expensive and detailed care. Although this decision cansave or cost a life, the doctor must decide using only the available cues, each of which is, at best,merely an uncertain predictor of the patient’s risk level”. To resolve this kind of problem, theyexplored fast and frugal heuristics approach [GT99], which, according to them, can enable bothliving organisms and artificial systems to make smart choices quickly and with a minimum ofinformation by exploiting the way that information is structured in particular environments.
One such approach to developing intuitive expertise and thereby mitigating or even eliminat-ing the effects of cognitive biases is based on the Naturalistic decision making (NDM) approach.
26
2.5.1 Naturalistic decision making (NDM)
The NDM deals with how people make decisions in demanding real-world situations, under timepressure and uncertainty, with team constraints, unstable conditions, and varying amounts ofexperience [Kle99].
As a descriptive theory, NDM attempts to describe what people do, instead of trying to dis-cover deviations from optimal strategies. The proponents of NDM argue that the benefit ofselecting an optimal choice may not be so clear, because of Fredkin’s paradox (that states that“in a choice situation, as the options become more closely matched on utility, the decision be-comes more difficult, but the consequences become less significant”). Then, when you have tomake a choice, you spend some time weighing the options (for simplicity let us say that there areonly two options to be weighed). If one option is obviously better the time you spend ponderingwill be minimal. As the two options get closer and closer to each other in quality, the time youspend considering them will increase.
Whereas prescriptive models have the strength of being generic, they cannot be groundedwithin the context of a specific domain. That is an advantage of NDM. For instance, a domain-specific and context-restricted strategy is used by air-traffic controllers to detect early signs thatan aircraft may soon be violating separation criteria. Seems that have not much value teachingexpected utility methods or Bayesian statistics to air-traffic controllers [Kle97].
On the other hand, contrary to the arguments from other descriptive theories that humans arelimited and fallible, and need medicines (like training to learn how to think logically and clearly),NDM denies the need to mitigate biases at all, and instead, proposes to appropriate them in orderto improve decision making [Kle97]. Klein and his colleagues argue that heuristics highlightspecific human strengths of cognition that are “hard-wired” into us [Kle99]. Consequently, theirresearch suggests that it is possible to take advantage of cognitive biases (and emotions) in orderto improve decision making.
Another positive aspect of NDM is that it can use the strategies of skilled DMs (a.k.a. experts)to serve as criteria for evaluating novices. For instance, in [KH93] they list the ways that expertssee the world differently from novices.
Overall, it shows that emotions can play a role in decision making when information is in-complete or too complex, serving as a time-critical rules of thumb.
27
2.6 Summary
In this chapter, we described how the human decision-making process is theorized. Then, wefocus on the descriptive theories, the dual-process theory, and the heuristics and biases theory. Inthe latter, we presented two cognitive biases very important for our study: the endowment effectand the framing effect. Finally, we described the NDM and its assumptions.
In this thesis, our approach is to explore the FE, instead of attempting to debias the decisionbehavior, in order to make novices act and decide like experts, leading the former to repeatpatterns and strategies used by the latter.
Next, we will address in Chapter 3 some formal prescriptive models in the decision theory,like the Expected utility theory (EUT), and at the end the Prospect theory (PT), a descriptivemodel that attempts to be an alternative to EUT.
28

CHAPTER 3
Decisions and utilities
Contents3.1 Decision theory (DT) . . . . . . . . . . . . . . . . . . . . . . . . . . . . . . . . . 29
3.2 Utility theory (UT) . . . . . . . . . . . . . . . . . . . . . . . . . . . . . . . . . . 30
3.2.1 Additive utility . . . . . . . . . . . . . . . . . . . . . . . . . . . . . . . . 31
3.3 Expected utility theory (EUT) . . . . . . . . . . . . . . . . . . . . . . . . . . . 32
3.3.1 Existence of a utility function . . . . . . . . . . . . . . . . . . . . . . . . 33
3.3.2 Risk aversion . . . . . . . . . . . . . . . . . . . . . . . . . . . . . . . . . 33
3.3.3 Criticism . . . . . . . . . . . . . . . . . . . . . . . . . . . . . . . . . . . 33
3.4 Subjective expected utility theory (SEU) . . . . . . . . . . . . . . . . . . . . . . 34
3.5 Prospect Theory . . . . . . . . . . . . . . . . . . . . . . . . . . . . . . . . . . . 35
3.6 Summary . . . . . . . . . . . . . . . . . . . . . . . . . . . . . . . . . . . . . . . 38
Money has no utility to me beyond acertain point.
Bill Gates
In this thesis, we consider situations where robots and human have to take critical decisionsunder uncertainty. As shown in the previous chapters, robots may fail to adapt to new situationsand the HO may experience decision biases. Therefore, we need to define a formal frameworkto optimize human-robot decision making under such circumstances. The goal of this chapter isto present the field of decision theories that could be applied to such a problem.
3.1 Decision theory (DT)
Decisions often involve conflict. There may be a conflict between goals or the desirability ofan outcome [Bar07]. The best answer to this conflict depends on the costs and benefits (conse-
29
quences) of each alternative and the probability that it happens.
In this sense, the aim of DT is to help decision makers (DMs) who face complex problems,choosing between different possible alternatives, taking into account the consequences of eachdecision and their preferences. Then, the two central concepts in DT are prospects (or options)and preferences. Roughly speaking, an agent prefers the option A over B. It is intuitive that pref-erence is a comparative attitude. The numerical representations (or measurements) of preferencesare known as utility functions [SS16].
3.2 Utility theory (UT)
In economics, utility is a measure of satisfaction (rewards) gained from a good or a service[Bar07]. For instance, the reward might be the amount of money earned in a financial invest-ment. In robotics, for instance, the reward could indicate the amount of remaining battery aftera mobile robot goes from a place to another. In other applications with humans, the reward maybe subjective, based on the enjoyment or misery in performing a task. For example, what is thereward for washing dishes, in comparison to making the diner? In this case (and others), differentpeople can have different preferences.
The idea behind utility theory is simple: for each object on which the DM has preferences,it is assigned a real number, in such a way that the higher the number, the preferred the object.Then, comparing objects amounts to comparing their associated numbers, which is a trivial taskfor a computer. The DM expresses her preferences through a set of attributes. Each attribute cantake a certain number of values (a.k.a. levels of satisfaction). [Gon07].
Definition 3.1Let X be the set of objects over which the DM has preferences. DM prefers xi to xj or isindifferent between xi and xj . U : X → R is a utility function if and only if
∀x ∈ X, xi xj ⇐⇒ U(xi) ≥ U(xj)
When there are multiple attributes, the set of objects X can be represented as X = X1 ×...×Xn.
Moreover, when there are conflicting goals (for example, speed and accuracy), a utility func-tion can specify the appropriate trade-off [RN09].
Utility functions are computationally very attractive because they provide easy and fast waysto extract the DM’s preferences [Gon07]. However, elicitation of a DM’s utility function is
30

challenging. Since Nicolas Bernoulli described the St. Petersburg paradox in 1713 [SS16],several theories presented their solutions. We will discuss some of them in the next sections.
Following we present some utility functions used in this thesis.
3.2.1 Additive utility
Computationally, in general, utilities require as much memory as pairwise comparison tables (n-dimensional set) [Gon07]. For example, suppose that there are 5 attributes and that each one has10 levels of satisfaction, then the outcome set X is a set with 510 = 9765625 elements and, tostore the utility function into memory, up to 9765625 bytes may be needed.
Definition 3.2A utility function U is said to be additively separable (or an additive utility) if and only if it is autility function and there exist functions u1, ..., un such thatU(x1, ..., xn) = U1(x1)+...+Un(xn).
In words, xi and xj are orthogonal to each other. It means that the amount of good xi thatyou consume does not have any impact on the enjoyment you get from consuming any amountof good xj . Back to our example, if the utility function is additively separable, then storing eachUi(xi) requires only 10 bytes, and the whole utility is stored in at most 50 bytes.
Remarkwhen utility is additively separable in xi and xj , then U(xi) does not depend on the level of xj ,and vice-versa.
Note that, since utility functions are not unique, it is sometimes possible to transform func-tions which are not additively separable into equivalent functions which are.
Example 3.2.1Some examples:
• U(xi, xj) = axi + bxj ⇐⇒ a · u(xi) + b · u(xj)
• U(xi, xj) = xai · xbj is not additively separable, but as an ordinal representation of prefer-ences, it’s isomorphic to the additively separable utility function
U(xi, xj) = a · log(xi) + b · log(xj)
where a, b ∈ R are scaling constants and do not indicate the relative importance of attributes.
31
Generally, mixing addition, multiplication and exponentiation will destroy additive separa-bility.
3.3 Expected utility theory (EUT)
EUT is a normative model of decision making when outcomes are uncertain (probabilistic), thatis, the theory of how we should choose among possible actions under ideal conditions. In thissense, it deals with the analysis of choices among Lotteries (risky projects) [Bar07]. For a lotteryL with many possible options:
EU(L) =n∑i=1
U(xi)pi (3.1)
where x denotes the possible outcomes and pi the probability of the outcome xi, with∑i pi = 1,
denoting the probability of each outcome to happen.
The first important use of EUT was that of Von Neumann and Morgenstern [VNM07], whoused the assumption of expected utility maximization in their formulation of Game theory. Theyaddressed situations in which the outcomes of choices are not known with certainty, but haveprobabilities attached to them.
In this way, EUT requires that the agent specifies preferences among probability distribu-tions pi ∈ P of outcomes and being rational when assigning those preferences, i.e., the agent’spreferences must be in accordance with the rationality axioms here after recalled [LaV06]:
Axiom 3.1completeness - If p1, p2 ∈ P , then either p1 p2 or p2 p1.
Axiom 3.2transitivity - If p1 p2 and p2 p3, then p1 p3.
Axiom 3.3independence - If p1 ≺ p2, then αp1 + (1 − α)p3 ≺ αp2 + (1 − α)p3, for any p3 ∈ P andα ∈ [0, 1].
Axiom 3.4continuity - If p1 ≺ p2 ≺ p3, then there exists some α ∈ [0, 1] and β ∈ [0, 1] such thatαp1 + (1− α)p3 ≺ p2 and p2 ≺ βp1 + (1− β)p3.
32
3.3.1 Existence of a utility function
If it is possible to determine the preferences in a rational way, then it can be shown that a utilityfunction U always exists. This means that there exists a function U : X → R such that
p1 ≺ p2 ⇐⇒ EUp1 < EUp2 ,∀p1, p2 ∈ P (3.2)
Where EUpidenotes the expected value of U under the probability distribution pi.
The existence of U implies that it is safe to determine the best action by maximizing theexpected utility [LaV06].
Hence, a rational agent has clear preferences, models uncertainty via expected values ofvariables, and always chooses to perform the action with the optimal expected outcome for itselffrom among all feasible actions.
However, establishing the existence of a utility function does not provide a systematic wayto construct it. In general, a trial-and-error process is used to design U .
3.3.2 Risk aversion
EUT takes into account that individuals may be risk-averse [VNM07]. Risk aversion impliesthat utility functions are concave and show diminishing marginal wealth utility (see Fig. 3.1).
Figure 3.1 shows that the risk behavior is directly related to the utility function curvature:risk neutral individuals have linear utility functions, while risk-seeking individuals have convexutility functions and risk-averse individuals have concave utility functions. The degree of riskaversion can be measured by the curvature of the utility function.
3.3.3 Criticism
Despite the mathematical correctness of EUT , it is not guaranteed that this is a reliable guideto human behavior or optimal practice. In empirical applications, several violations have beenshown to be systematic. For example, Prospect theory [KT79] showed empirically how prefer-ences of individuals are inconsistent among the same choices, depending on how those choicesare presented (see Section 3.5).
33
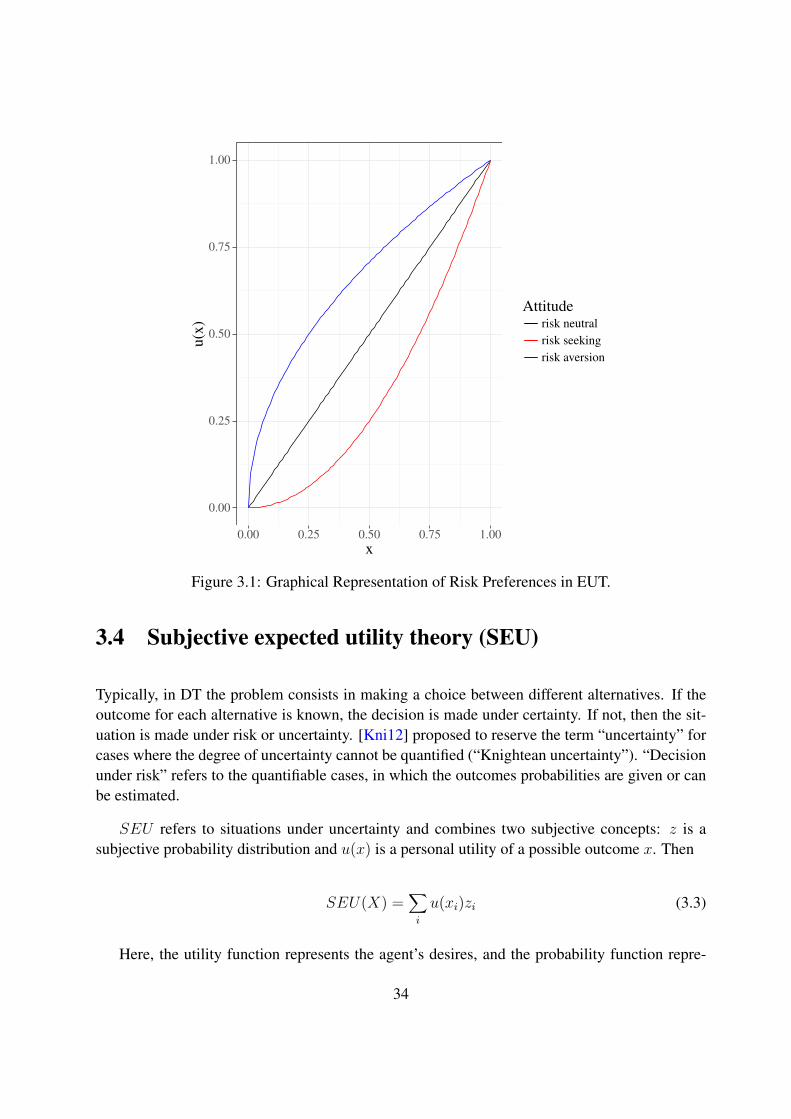
0.00
0.25
0.50
0.75
1.00
0.00 0.25 0.50 0.75 1.00x
u(x)
Attituderisk neutralrisk seekingrisk aversion
Figure 3.1: Graphical Representation of Risk Preferences in EUT.
3.4 Subjective expected utility theory (SEU)
Typically, in DT the problem consists in making a choice between different alternatives. If theoutcome for each alternative is known, the decision is made under certainty. If not, then the sit-uation is made under risk or uncertainty. [Kni12] proposed to reserve the term “uncertainty” forcases where the degree of uncertainty cannot be quantified (“Knightean uncertainty”). “Decisionunder risk” refers to the quantifiable cases, in which the outcomes probabilities are given or canbe estimated.
SEU refers to situations under uncertainty and combines two subjective concepts: z is asubjective probability distribution and u(x) is a personal utility of a possible outcome x. Then
SEU(X) =∑i
u(xi)zi (3.3)
Here, the utility function represents the agent’s desires, and the probability function repre-
34
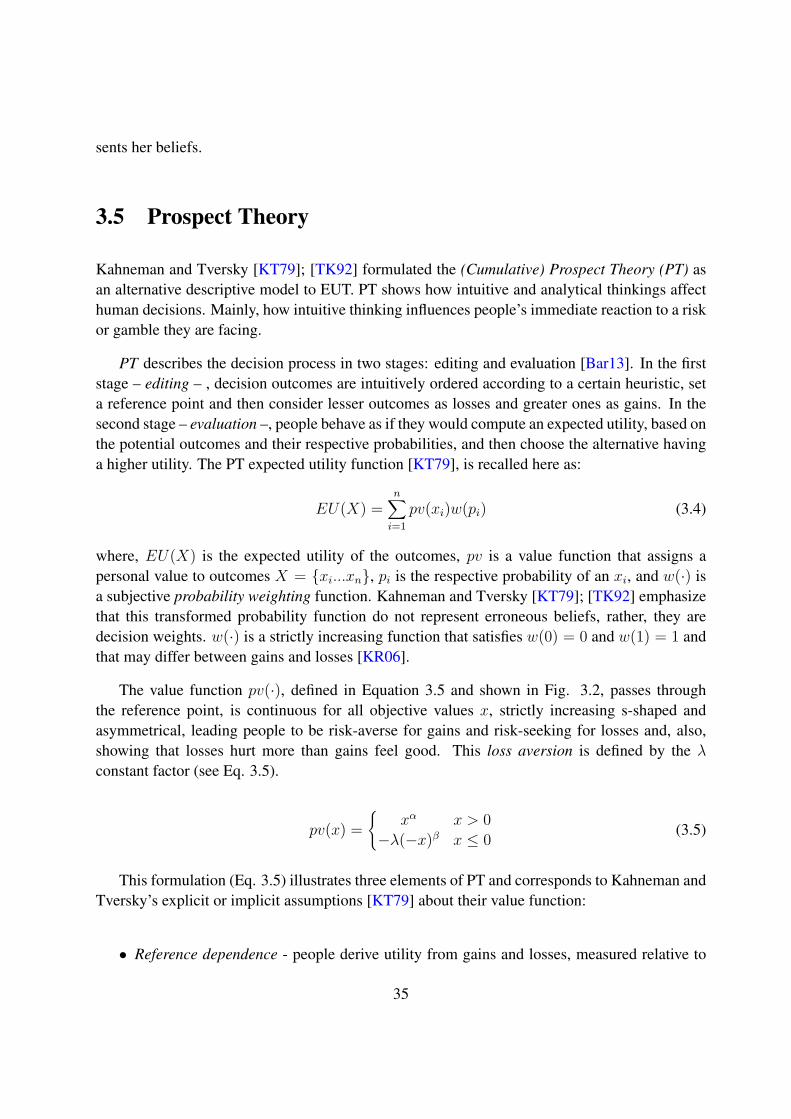
sents her beliefs.
3.5 Prospect Theory
Kahneman and Tversky [KT79]; [TK92] formulated the (Cumulative) Prospect Theory (PT) asan alternative descriptive model to EUT. PT shows how intuitive and analytical thinkings affecthuman decisions. Mainly, how intuitive thinking influences people’s immediate reaction to a riskor gamble they are facing.
PT describes the decision process in two stages: editing and evaluation [Bar13]. In the firststage – editing – , decision outcomes are intuitively ordered according to a certain heuristic, seta reference point and then consider lesser outcomes as losses and greater ones as gains. In thesecond stage – evaluation –, people behave as if they would compute an expected utility, based onthe potential outcomes and their respective probabilities, and then choose the alternative havinga higher utility. The PT expected utility function [KT79], is recalled here as:
EU(X) =n∑i=1
pv(xi)w(pi) (3.4)
where, EU(X) is the expected utility of the outcomes, pv is a value function that assigns apersonal value to outcomes X = xi...xn, pi is the respective probability of an xi, and w(·) isa subjective probability weighting function. Kahneman and Tversky [KT79]; [TK92] emphasizethat this transformed probability function do not represent erroneous beliefs, rather, they aredecision weights. w(·) is a strictly increasing function that satisfies w(0) = 0 and w(1) = 1 andthat may differ between gains and losses [KR06].
The value function pv(·), defined in Equation 3.5 and shown in Fig. 3.2, passes throughthe reference point, is continuous for all objective values x, strictly increasing s-shaped andasymmetrical, leading people to be risk-averse for gains and risk-seeking for losses and, also,showing that losses hurt more than gains feel good. This loss aversion is defined by the λconstant factor (see Eq. 3.5).
pv(x) =
xα x > 0−λ(−x)β x ≤ 0 (3.5)
This formulation (Eq. 3.5) illustrates three elements of PT and corresponds to Kahneman andTversky’s explicit or implicit assumptions [KT79] about their value function:
• Reference dependence - people derive utility from gains and losses, measured relative to
35
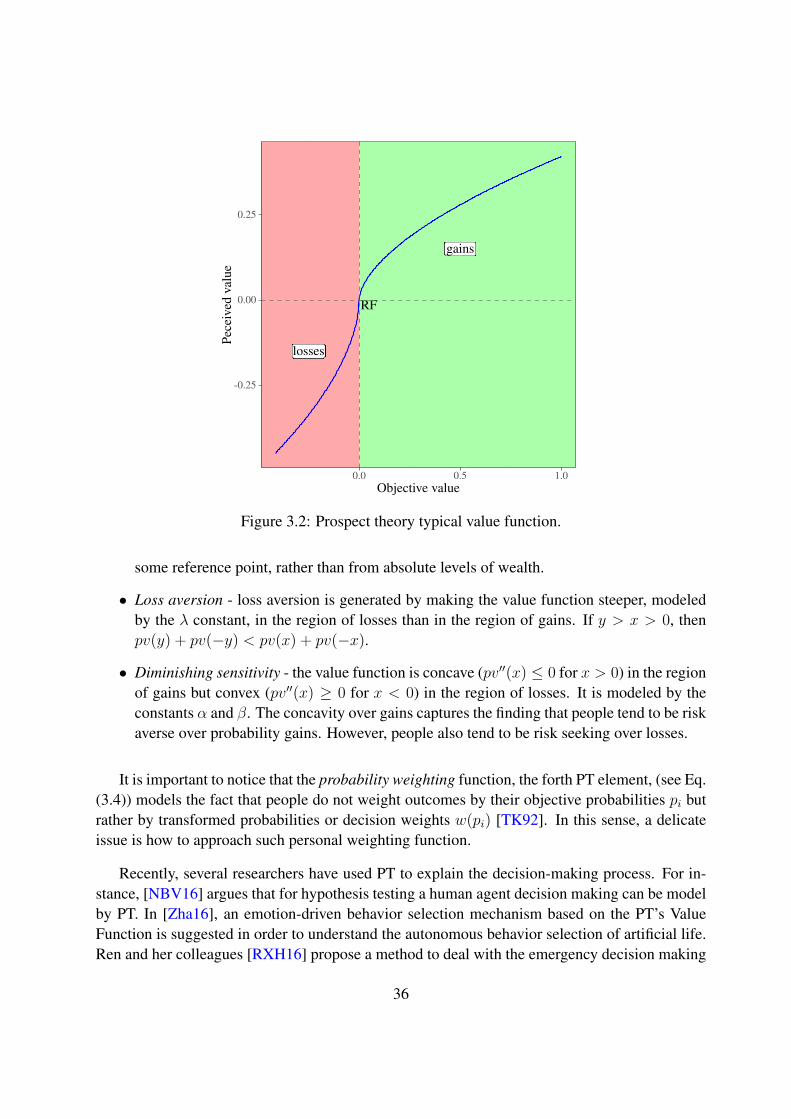
RF
losseslosseslosseslosseslosseslosseslosseslosseslosseslosseslosseslosseslosseslosseslosseslosseslosseslosseslosseslosseslosseslosseslosseslosseslosseslosseslosseslosseslosseslosseslosseslosseslosseslosseslosseslosseslosseslosseslosseslosseslosseslosseslosseslosseslosseslosseslosseslosseslosseslosseslosseslosseslosseslosseslosseslosseslosseslosseslosseslosseslosseslosseslosseslosseslosseslosseslosseslosseslosseslosseslosseslosseslosseslosseslosseslosseslosseslosseslosseslosseslosseslosseslosseslosseslosseslosseslosseslosseslosseslosseslosseslosseslosseslosseslosseslosseslosseslosseslosseslosseslosseslosseslosseslosseslosseslosseslosseslosseslosseslosseslosseslosseslosseslosseslosseslosseslosseslosseslosseslosseslosseslosseslosseslosseslosseslosseslosseslosseslosseslosseslosseslosseslosseslosseslosseslosseslosseslosseslosseslosseslosseslosseslosseslosseslosseslosseslosseslosseslosseslosseslosseslosseslosseslosseslosseslosseslosseslosseslosseslosseslosseslosseslosseslosseslosseslosseslosseslosseslosseslosseslosseslosseslosseslosseslosseslosseslosseslosseslosseslosseslosseslosseslosseslosseslosseslosseslosseslosseslosseslosseslosseslosseslosseslosseslosseslosseslosseslosseslosseslosseslosseslosseslosseslosseslosseslosseslosseslosseslosseslosseslosseslosseslosseslosseslosseslosseslosseslosseslosseslosseslosseslosseslosseslosseslosseslosseslosseslosseslosseslosseslosseslosseslosseslosseslosseslosseslosseslosseslosseslosseslosseslosseslosseslosseslosseslosseslosseslosseslosseslosseslosseslosseslosseslosseslosseslosseslosseslosseslosseslosseslosseslosseslosseslosseslosseslosseslosseslosseslosseslosseslosseslosseslosseslosseslosseslosseslosseslosseslosseslosseslosseslosseslosseslosseslosseslosseslosseslosseslosseslosseslosseslosseslosseslosseslosseslosseslosseslosseslosseslosseslosseslosseslosseslosseslosseslosseslosseslosseslosseslosseslosseslosseslosseslosseslosseslosseslosseslosseslosseslosseslosseslosseslosseslosseslosseslosseslosseslosseslosseslosseslosseslosseslosseslosseslosseslosseslosseslosseslosseslosseslosseslosseslosseslosseslosseslosseslosseslosseslosseslosseslosseslosseslosseslosseslosseslosseslosseslosseslosseslosseslosseslosseslosseslosseslosseslosseslosseslosseslosseslosseslosseslosseslosseslosseslosseslosseslosseslosseslosseslosseslosseslosseslosseslosseslosseslosseslosseslosseslosseslosseslosseslosseslosseslosseslosseslosseslosseslosseslosseslosseslosseslosseslosseslosseslosseslosseslosseslosseslosseslosseslosseslosseslosseslosseslosseslosseslosseslosseslosseslosseslosseslosseslosseslosseslosseslosseslosseslosseslosseslosseslosseslosseslosseslosseslosseslosseslosseslosseslosseslosseslosseslosseslosseslosseslosseslosseslosseslosseslosseslosseslosseslosseslosseslosseslosseslosseslosseslosseslosseslosseslosseslosseslosseslosseslosseslosseslosseslosseslosseslosseslosseslosseslosseslosseslosseslosseslosseslosseslosseslosses
gainsgainsgainsgainsgainsgainsgainsgainsgainsgainsgainsgainsgainsgainsgainsgainsgainsgainsgainsgainsgainsgainsgainsgainsgainsgainsgainsgainsgainsgainsgainsgainsgainsgainsgainsgainsgainsgainsgainsgainsgainsgainsgainsgainsgainsgainsgainsgainsgainsgainsgainsgainsgainsgainsgainsgainsgainsgainsgainsgainsgainsgainsgainsgainsgainsgainsgainsgainsgainsgainsgainsgainsgainsgainsgainsgainsgainsgainsgainsgainsgainsgainsgainsgainsgainsgainsgainsgainsgainsgainsgainsgainsgainsgainsgainsgainsgainsgainsgainsgainsgainsgainsgainsgainsgainsgainsgainsgainsgainsgainsgainsgainsgainsgainsgainsgainsgainsgainsgainsgainsgainsgainsgainsgainsgainsgainsgainsgainsgainsgainsgainsgainsgainsgainsgainsgainsgainsgainsgainsgainsgainsgainsgainsgainsgainsgainsgainsgainsgainsgainsgainsgainsgainsgainsgainsgainsgainsgainsgainsgainsgainsgainsgainsgainsgainsgainsgainsgainsgainsgainsgainsgainsgainsgainsgainsgainsgainsgainsgainsgainsgainsgainsgainsgainsgainsgainsgainsgainsgainsgainsgainsgainsgainsgainsgainsgainsgainsgainsgainsgainsgainsgainsgainsgainsgainsgainsgainsgainsgainsgainsgainsgainsgainsgainsgainsgainsgainsgainsgainsgainsgainsgainsgainsgainsgainsgainsgainsgainsgainsgainsgainsgainsgainsgainsgainsgainsgainsgainsgainsgainsgainsgainsgainsgainsgainsgainsgainsgainsgainsgainsgainsgainsgainsgainsgainsgainsgainsgainsgainsgainsgainsgainsgainsgainsgainsgainsgainsgainsgainsgainsgainsgainsgainsgainsgainsgainsgainsgainsgainsgainsgainsgainsgainsgainsgainsgainsgainsgainsgainsgainsgainsgainsgainsgainsgainsgainsgainsgainsgainsgainsgainsgainsgainsgainsgainsgainsgainsgainsgainsgainsgainsgainsgainsgainsgainsgainsgainsgainsgainsgainsgainsgainsgainsgainsgainsgainsgainsgainsgainsgainsgainsgainsgainsgainsgainsgainsgainsgainsgainsgainsgainsgainsgainsgainsgainsgainsgainsgainsgainsgainsgainsgainsgainsgainsgainsgainsgainsgainsgainsgainsgainsgainsgainsgainsgainsgainsgainsgainsgainsgainsgainsgainsgainsgainsgainsgainsgainsgainsgainsgainsgainsgainsgainsgainsgainsgainsgainsgainsgainsgainsgainsgainsgainsgainsgainsgainsgainsgainsgainsgainsgainsgainsgainsgainsgainsgainsgainsgainsgainsgainsgainsgainsgainsgainsgainsgainsgainsgainsgainsgainsgainsgainsgainsgainsgainsgainsgainsgainsgainsgainsgainsgainsgainsgainsgainsgainsgainsgainsgainsgainsgainsgainsgainsgainsgainsgainsgainsgainsgainsgainsgainsgainsgainsgainsgainsgainsgainsgainsgainsgainsgainsgainsgainsgainsgainsgainsgainsgainsgainsgainsgainsgainsgainsgainsgainsgainsgainsgainsgainsgains
-0.25
0.00
0.25
0.0 0.5 1.0Objective value
Pece
ived
valu
e
Figure 3.2: Prospect theory typical value function.
some reference point, rather than from absolute levels of wealth.
• Loss aversion - loss aversion is generated by making the value function steeper, modeledby the λ constant, in the region of losses than in the region of gains. If y > x > 0, thenpv(y) + pv(−y) < pv(x) + pv(−x).
• Diminishing sensitivity - the value function is concave (pv′′(x) ≤ 0 for x > 0) in the regionof gains but convex (pv′′(x) ≥ 0 for x < 0) in the region of losses. It is modeled by theconstants α and β. The concavity over gains captures the finding that people tend to be riskaverse over probability gains. However, people also tend to be risk seeking over losses.
It is important to notice that the probability weighting function, the forth PT element, (see Eq.(3.4)) models the fact that people do not weight outcomes by their objective probabilities pi butrather by transformed probabilities or decision weights w(pi) [TK92]. In this sense, a delicateissue is how to approach such personal weighting function.
Recently, several researchers have used PT to explain the decision-making process. For in-stance, [NBV16] argues that for hypothesis testing a human agent decision making can be modelby PT. In [Zha16], an emotion-driven behavior selection mechanism based on the PT’s ValueFunction is suggested in order to understand the autonomous behavior selection of artificial life.Ren and her colleagues [RXH16] propose a method to deal with the emergency decision making
36
based on PT, applying thermodynamics concepts such as energy and entropy to take the quantityand the quality of the decision values into account.
Moreover, Koszegi and Robin [KR06] propose a formal framework for applying PT in eco-nomics. They argue their proposal is both disciplined and portable across different contexts. Theidea is that the reference point people use to compute gains and losses is fully determined bytheir expectations (instead of the status quo). In particular, they propose that people derive util-ity from the difference between consumption and expected consumption, for instance, a salaryof $50, 000 to an employee who expected $60, 000 will not be assessed as a gain relative tostatus-quo wealth, but rather as a loss relative to expectations of wealth. They also assume thatexpectations are rational, in that they match the distribution of outcomes that people will faceif they follow the plan of action that is optimal, given their expectations. Then, according tothem, a person’s utility depends on her multi-dimensional consumption bundle c and also on areference bundle r, combining classical consumption utility with reference dependence utility byassuming people care about both. For instance, they don’t just react to the sensation of gaining orlosing a mug, they also care whether they have a mug to drink from. Thus, this personal Utility(U) is given by:
U(c|r) = m(c) + n(c|r) (3.6)
where, m(c) is an intrinsic “consumption utility” (typically stressed in economics) that cor-responds to the personal outcome-based utility, and n(c|r) is a gain–loss utility, that should be,in accordance with PT, given by:
n(c|r) = µ(m(c) +m(r)) (3.7)
Their model allows for both stochastic outcomes and stochastic reference points and assumesthat a stochastic outcome is evaluated according to its expected utility. For instance, if c is drawnaccording to the probability measure F , the person’s utility is given by:
U(F |r) =∫u(c|r)dF (c) (3.8)
However, considering the gain-loss utility n(c|r), they impose some simplifying assump-tions, like linear utility for gains and losses and no probability weighting, which differs from theproposed gain–loss utility presented in Equation (3.4).
Using a different approach, Abdellaoui and his peers [Abd+16] introduced a method tomeasure loss aversion under ambiguity or risk without making simplifying assumptions aboutprospect theory’s parameters, extended the trade-off method [WD96] in order to measure the
37
utility for gains and losses simultaneously, and thus loss aversion. According to them, underBinary Prospect Theory (BPT), the DM’s preferences over gain and loss risky prospects areevaluated by:
U(x|y) = w+(p)U(x) + w−(1− p)U(y) (3.9)
where, U(x|y) is an overall utility function that includes loss aversion. w is a probability weight-ing function, p is the probability value, x is a gain and y is a loss, thus, −U(y) > U(x).
However, in this thesis, we will explore the Koszegi and Robin approach [KR06], derivingthe personal utility from consumption and the reference bundles, but without making simplifyingassumptions about PT.
3.6 Summary
In this chapter we described situations where a rational DM chooses among several actions (Sec-tion 3.1 – Decision theory (DT)) based on their preferences (Section 3.2 – Utility theory), high-lighting the additive utility. Following, Section 3.3 provided the fundamentals of Expected utilitytheory (EUT), that is addressed to the analysis of choices among decisions under risk. After, wetalked about decisions under uncertainty in Section 3.4 – Subjective expected utility theory (SEU).And, finally, Section 3.5 presented the Prospect theory (PT), that describes how people decidesunder uncertainty in the real life. These theories will pave the way for the following chapters.
Next, we will focus on problems involving multiple DMs, in which the decisions of eachinterfere with the outcome of the other DMs, the Game theory.
38
CHAPTER 4
Shall we play a game?
Contents4.1 What is a game? . . . . . . . . . . . . . . . . . . . . . . . . . . . . . . . . . . . 40
4.2 Normal form games . . . . . . . . . . . . . . . . . . . . . . . . . . . . . . . . . 42
4.2.1 Common-payoff games (CPG) . . . . . . . . . . . . . . . . . . . . . . . . 42
4.2.2 Zero-sum games (ZSG) . . . . . . . . . . . . . . . . . . . . . . . . . . . . 44
4.2.3 Strategies . . . . . . . . . . . . . . . . . . . . . . . . . . . . . . . . . . . 46
4.2.4 Payoffs . . . . . . . . . . . . . . . . . . . . . . . . . . . . . . . . . . . . 47
4.2.5 Game solution . . . . . . . . . . . . . . . . . . . . . . . . . . . . . . . . 48
4.3 Potential games . . . . . . . . . . . . . . . . . . . . . . . . . . . . . . . . . . . 53
4.3.1 Wonderful life utility (WLU) . . . . . . . . . . . . . . . . . . . . . . . . . 54
4.4 Repeated games . . . . . . . . . . . . . . . . . . . . . . . . . . . . . . . . . . . 55
4.5 Stochastic games . . . . . . . . . . . . . . . . . . . . . . . . . . . . . . . . . . . 55
4.6 Extensive-form games (EFG) . . . . . . . . . . . . . . . . . . . . . . . . . . . . 55
4.7 A game against Nature (GAN) . . . . . . . . . . . . . . . . . . . . . . . . . . . 56
4.8 Summary . . . . . . . . . . . . . . . . . . . . . . . . . . . . . . . . . . . . . . . 58
’It is better to have loved and lost thannever to have loved at all.’ In other words,love is a dominant strategy.
Avinash K. Dixit
This chapter describes the game theory (GT ), i.e., how to model problems that involve morethan one decision maker (DM), focusing on making a single decision in the presence of otherDMs that may interfere with the outcome. The objective is to provide the reader with enough GTbackground to understand our approach in this thesis. It may be safely skipped by those familiarwith game theory.
39
It is important to state that this chapter is not intended to be an exhaustive overview ofGT. There are many books that provide a good introduction to GT (e.g. [SLB08]; [LBS08];[VNM07]). In short, GT is a mathematical theory designed to model phenomena that can beobserved when two or more rational DMs interact with each other. A DM is said to be rationalif she chooses her actions in order to maximize her satisfaction, happiness, or a utility function.
Game Theory is an interesting tool for understanding how decisions affect the players [Bar02].[DS] stated three uses for GT:
• Explanation - when the situation involves the interaction of DMs with different aims, GTsupplies the key to understanding the situation and explains why it happened.
• Prediction – when looking ahead to situations where multiple DMs will interact strategi-cally, people can use GT to foresee what actions they will take and what outcomes willresult.
• Advice or Prescription - GT can help one participant in the future interaction, and tell herwhich strategies are likely to yield good results and which ones are liable to lead to disaster.
At its inception, GT attracted little attention (ancient records date back to the 18th cen-tury). But, the mathematician John von Neumann changed this situation, and, in 1944, withthe economist Oscar Morgenstern, published the classic “The Theory of Games and EconomicBehavior” [VNM07]. And with that, GT invaded economics and applied mathematics.
Nowadays, GT is used to study subjects such as auctions, the balance of power, geneticevolution, political science, psychology, linguistics, sociology, etc [LBS08]; [Bar02]. However,GT is studied mainly in its pure mathematical aspects and, in applications, it is used as a tool orallegory that aid in the understanding of more complicated systems (e.g., multi-agent systems,network communication) [SLB08].
4.1 What is a game?
A game could be defined as a choice of optimal decisions under conflict or cooperation condi-tions. The dominant approach to model an agent’s interests is the Utility theory [SLB08] (seeSection 3.2). And the “game” begins when the world contains two or more utility-maximizingagents whose actions can affect each other’s utilities [LBS08]. For instance, consider the follow-ing example.
Example 4.1.1Consider a driver who decides on the route from home to job.
40

Alternatives: (1) take the shortest route through the tunnel or (2) follow the highway alongthe lake.
As the driver wants to minimize the time to arrive at the job, one strategy for her is: If theweather is rainy or if the tunnel is congested, then, she will take the longest route along the lake.Otherwise, she will take the tunnel.
The basic element in a game is the set of players that participate in it. Where each playerhas a set of strategies. A strategy depends on information that is not under the player’s control– it can be deterministic or stochastic. When each player chooses their strategy, then we have asituation (profile) in the space of all possible situations. Each player has their own preferencesfor each situation in the game. In mathematical terms, each player has a utility function thatassigns a real number (the player’s gain or payoff ) to each game situation.
Definition 4.1Game - A N-player finite game Γ is a tuple (N,A, u), where:
• N = 1, · · · , n is the finite set of n players, indexed by i;
• A = A1 × A2 × · · · × An, where Ai is a finite set of all options (or actions) available toplayer i. Each vector a = (a1, · · · , an) ∈ A is called a profile;
• u = (u1, · · · , un) is the payoff function, where ui : A → R for each player i.
In this work we will adhere strictly to the non-cooperative games (NCG) – a.k.a. strategicgames –, i.e., in which self-interested agents interact.
Note that this does not necessarily mean that they want to hurt each other, or that they onlycare about themselves. Instead, it means that each agent has his or her own preferences – whichcan include good things happening to the others – and that he or she acts in accordance withthese preferences.
Definition 4.2Non-cooperative game - A game is non-cooperative or strategic if each player seeks to maximizehis or her own utility. They can not agree among themselves to form coalitions.
It is important to emphasize that it is possible to play a non-cooperative game among team-mates (a team game) without forming coalitions.
RemarkA game with only one player is a classical optimization problem.
41
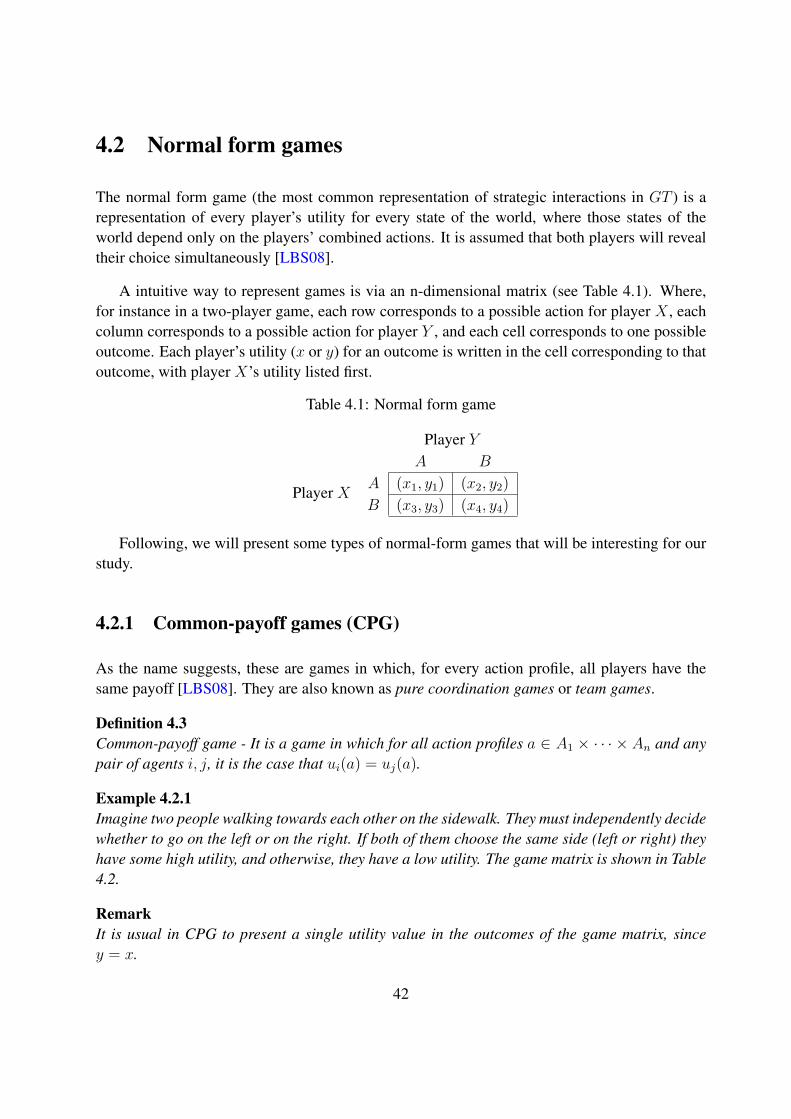
4.2 Normal form games
The normal form game (the most common representation of strategic interactions in GT ) is arepresentation of every player’s utility for every state of the world, where those states of theworld depend only on the players’ combined actions. It is assumed that both players will revealtheir choice simultaneously [LBS08].
A intuitive way to represent games is via an n-dimensional matrix (see Table 4.1). Where,for instance in a two-player game, each row corresponds to a possible action for player X , eachcolumn corresponds to a possible action for player Y , and each cell corresponds to one possibleoutcome. Each player’s utility (x or y) for an outcome is written in the cell corresponding to thatoutcome, with player X’s utility listed first.
Table 4.1: Normal form game
Player YA B
Player XA (x1, y1) (x2, y2)B (x3, y3) (x4, y4)
Following, we will present some types of normal-form games that will be interesting for ourstudy.
4.2.1 Common-payoff games (CPG)
As the name suggests, these are games in which, for every action profile, all players have thesame payoff [LBS08]. They are also known as pure coordination games or team games.
Definition 4.3Common-payoff game - It is a game in which for all action profiles a ∈ A1 × · · · × An and anypair of agents i, j, it is the case that ui(a) = uj(a).
Example 4.2.1Imagine two people walking towards each other on the sidewalk. They must independently decidewhether to go on the left or on the right. If both of them choose the same side (left or right) theyhave some high utility, and otherwise, they have a low utility. The game matrix is shown in Table4.2.
RemarkIt is usual in CPG to present a single utility value in the outcomes of the game matrix, sincey = x.
42
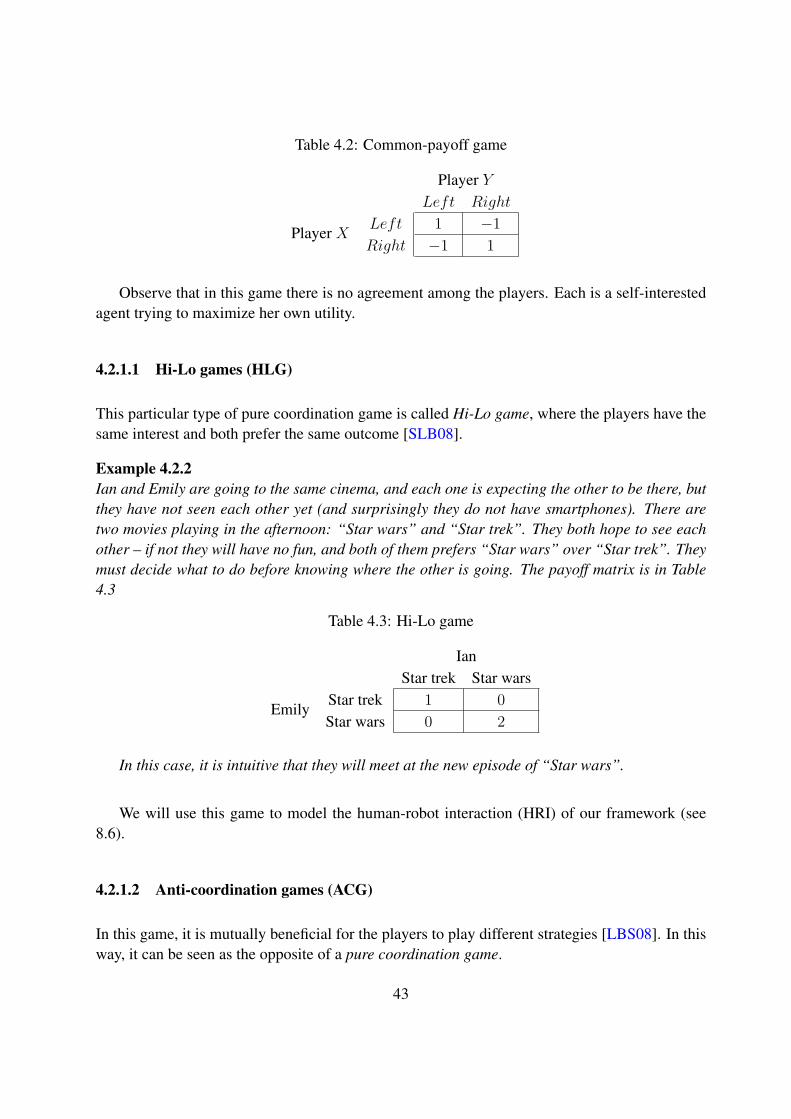
Table 4.2: Common-payoff game
Player YLeft Right
Player XLeft 1 −1Right −1 1
Observe that in this game there is no agreement among the players. Each is a self-interestedagent trying to maximize her own utility.
4.2.1.1 Hi-Lo games (HLG)
This particular type of pure coordination game is called Hi-Lo game, where the players have thesame interest and both prefer the same outcome [SLB08].
Example 4.2.2Ian and Emily are going to the same cinema, and each one is expecting the other to be there, butthey have not seen each other yet (and surprisingly they do not have smartphones). There aretwo movies playing in the afternoon: “Star wars” and “Star trek”. They both hope to see eachother – if not they will have no fun, and both of them prefers “Star wars” over “Star trek”. Theymust decide what to do before knowing where the other is going. The payoff matrix is in Table4.3
Table 4.3: Hi-Lo game
IanStar trek Star wars
EmilyStar trek 1 0Star wars 0 2
In this case, it is intuitive that they will meet at the new episode of “Star wars”.
We will use this game to model the human-robot interaction (HRI) of our framework (see8.6).
4.2.1.2 Anti-coordination games (ACG)
In this game, it is mutually beneficial for the players to play different strategies [LBS08]. In thisway, it can be seen as the opposite of a pure coordination game.
43
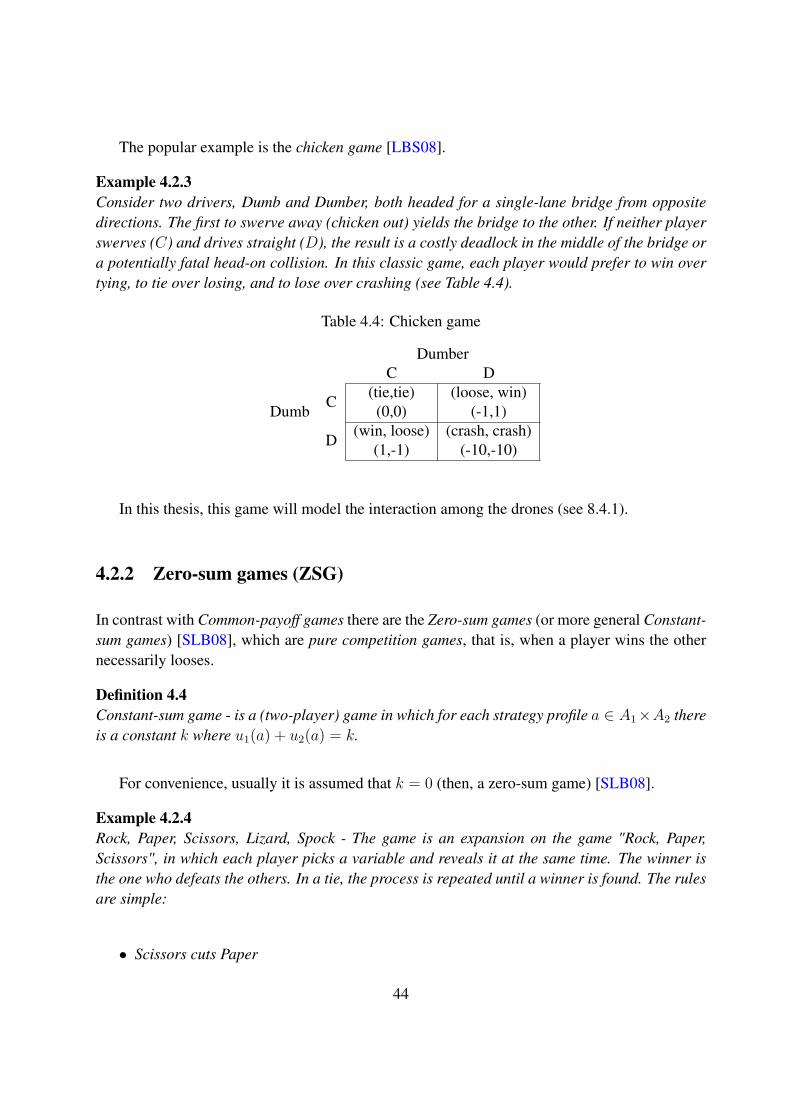
The popular example is the chicken game [LBS08].
Example 4.2.3Consider two drivers, Dumb and Dumber, both headed for a single-lane bridge from oppositedirections. The first to swerve away (chicken out) yields the bridge to the other. If neither playerswerves (C) and drives straight (D), the result is a costly deadlock in the middle of the bridge ora potentially fatal head-on collision. In this classic game, each player would prefer to win overtying, to tie over losing, and to lose over crashing (see Table 4.4).
Table 4.4: Chicken game
DumberC D
DumbC
(tie,tie)(0,0)
(loose, win)(-1,1)
D(win, loose)
(1,-1)(crash, crash)
(-10,-10)
In this thesis, this game will model the interaction among the drones (see 8.4.1).
4.2.2 Zero-sum games (ZSG)
In contrast with Common-payoff games there are the Zero-sum games (or more general Constant-sum games) [SLB08], which are pure competition games, that is, when a player wins the othernecessarily looses.
Definition 4.4Constant-sum game - is a (two-player) game in which for each strategy profile a ∈ A1×A2 thereis a constant k where u1(a) + u2(a) = k.
For convenience, usually it is assumed that k = 0 (then, a zero-sum game) [SLB08].
Example 4.2.4Rock, Paper, Scissors, Lizard, Spock - The game is an expansion on the game "Rock, Paper,Scissors", in which each player picks a variable and reveals it at the same time. The winner isthe one who defeats the others. In a tie, the process is repeated until a winner is found. The rulesare simple:
• Scissors cuts Paper
44
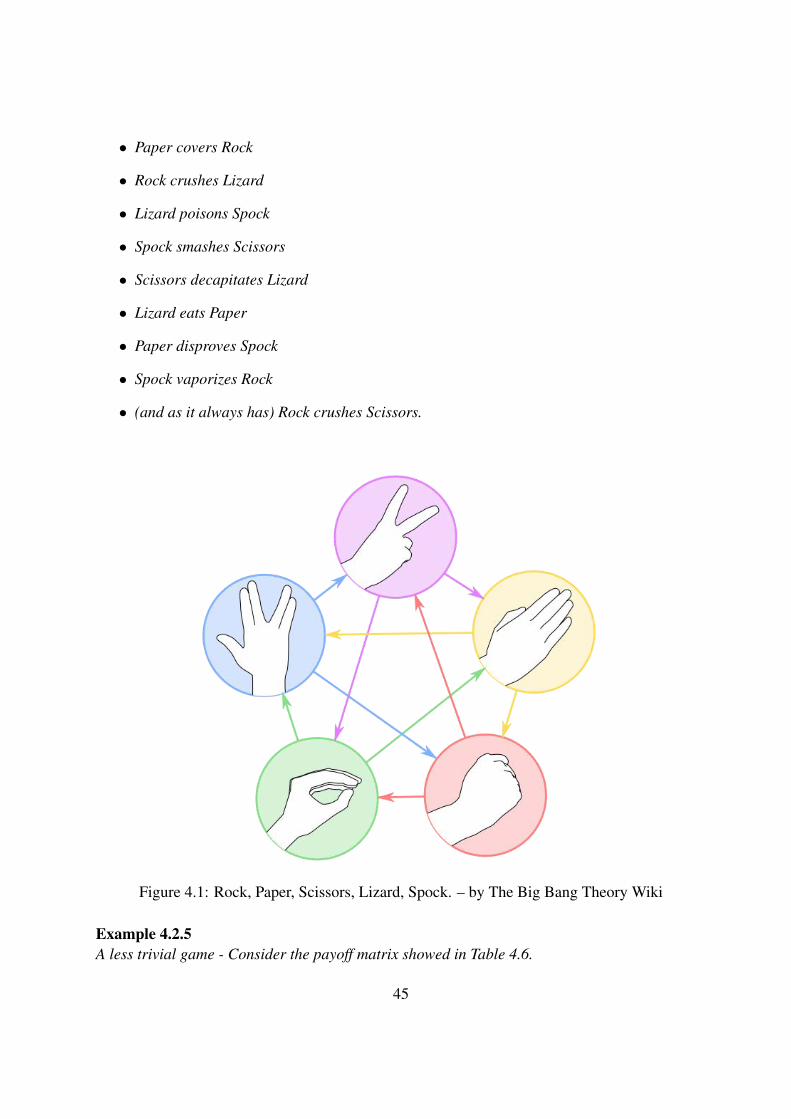
• Paper covers Rock
• Rock crushes Lizard
• Lizard poisons Spock
• Spock smashes Scissors
• Scissors decapitates Lizard
• Lizard eats Paper
• Paper disproves Spock
• Spock vaporizes Rock
• (and as it always has) Rock crushes Scissors.
Figure 4.1: Rock, Paper, Scissors, Lizard, Spock. – by The Big Bang Theory Wiki
Example 4.2.5A less trivial game - Consider the payoff matrix showed in Table 4.6.
45
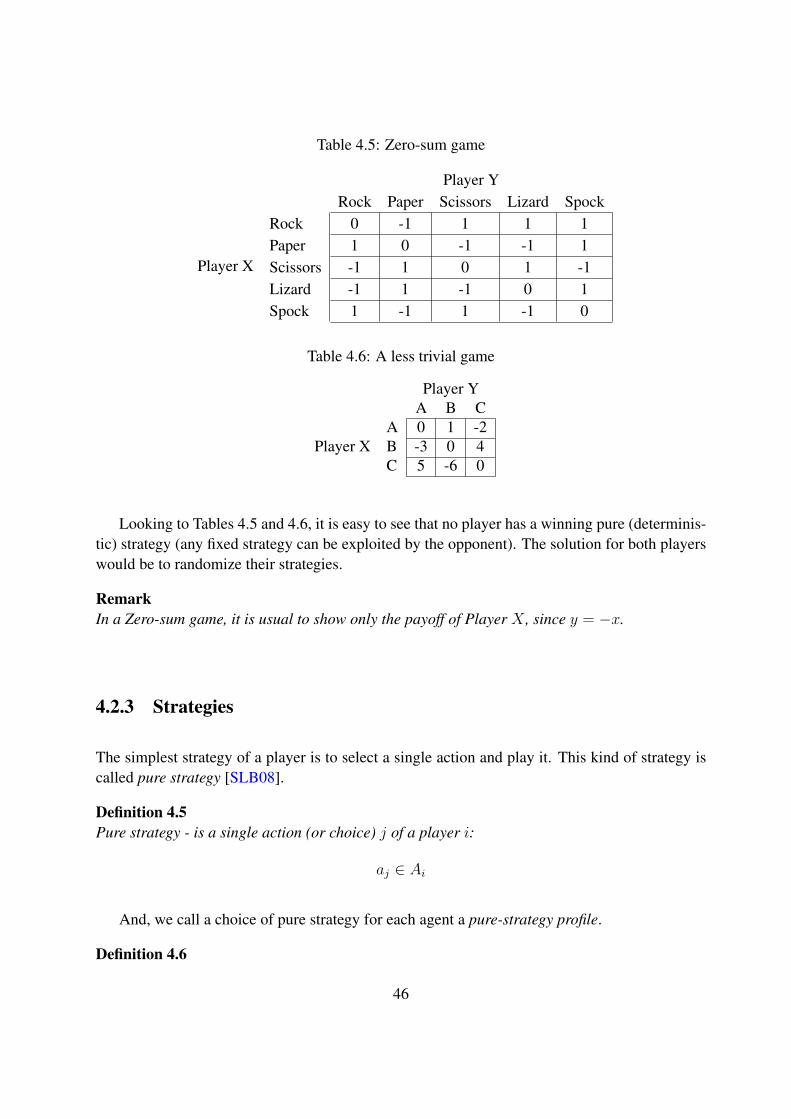
Table 4.5: Zero-sum game
Player YRock Paper Scissors Lizard Spock
Player X
Rock 0 -1 1 1 1Paper 1 0 -1 -1 1Scissors -1 1 0 1 -1Lizard -1 1 -1 0 1Spock 1 -1 1 -1 0
Table 4.6: A less trivial game
Player YA B C
Player XA 0 1 -2B -3 0 4C 5 -6 0
Looking to Tables 4.5 and 4.6, it is easy to see that no player has a winning pure (determinis-tic) strategy (any fixed strategy can be exploited by the opponent). The solution for both playerswould be to randomize their strategies.
RemarkIn a Zero-sum game, it is usual to show only the payoff of Player X , since y = −x.
4.2.3 Strategies
The simplest strategy of a player is to select a single action and play it. This kind of strategy iscalled pure strategy [SLB08].
Definition 4.5Pure strategy - is a single action (or choice) j of a player i:
aj ∈ Ai
And, we call a choice of pure strategy for each agent a pure-strategy profile.
Definition 4.6
46
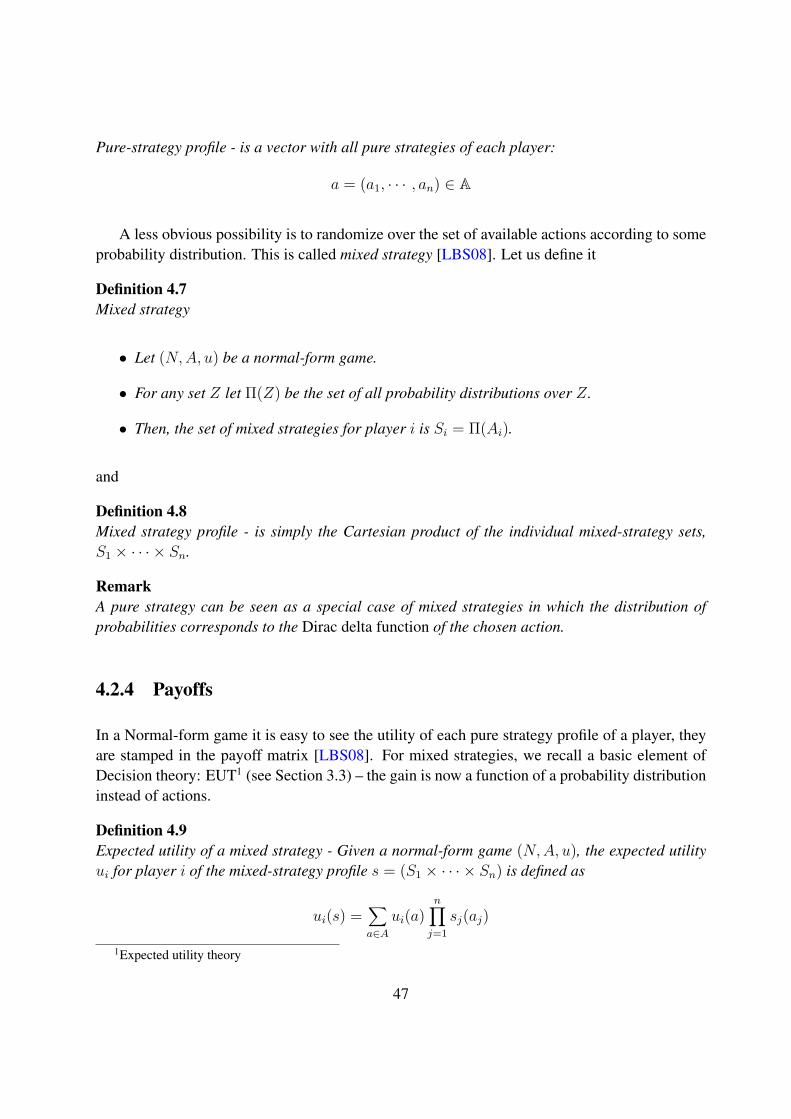
Pure-strategy profile - is a vector with all pure strategies of each player:
a = (a1, · · · , an) ∈ A
A less obvious possibility is to randomize over the set of available actions according to someprobability distribution. This is called mixed strategy [LBS08]. Let us define it
Definition 4.7Mixed strategy
• Let (N,A, u) be a normal-form game.
• For any set Z let Π(Z) be the set of all probability distributions over Z.
• Then, the set of mixed strategies for player i is Si = Π(Ai).
and
Definition 4.8Mixed strategy profile - is simply the Cartesian product of the individual mixed-strategy sets,S1 × · · · × Sn.
RemarkA pure strategy can be seen as a special case of mixed strategies in which the distribution ofprobabilities corresponds to the Dirac delta function of the chosen action.
4.2.4 Payoffs
In a Normal-form game it is easy to see the utility of each pure strategy profile of a player, theyare stamped in the payoff matrix [LBS08]. For mixed strategies, we recall a basic element ofDecision theory: EUT1 (see Section 3.3) – the gain is now a function of a probability distributioninstead of actions.
Definition 4.9Expected utility of a mixed strategy - Given a normal-form game (N,A, u), the expected utilityui for player i of the mixed-strategy profile s = (S1 × · · · × Sn) is defined as
ui(s) =∑a∈A
ui(a)n∏j=1
sj(aj)
1Expected utility theory
47
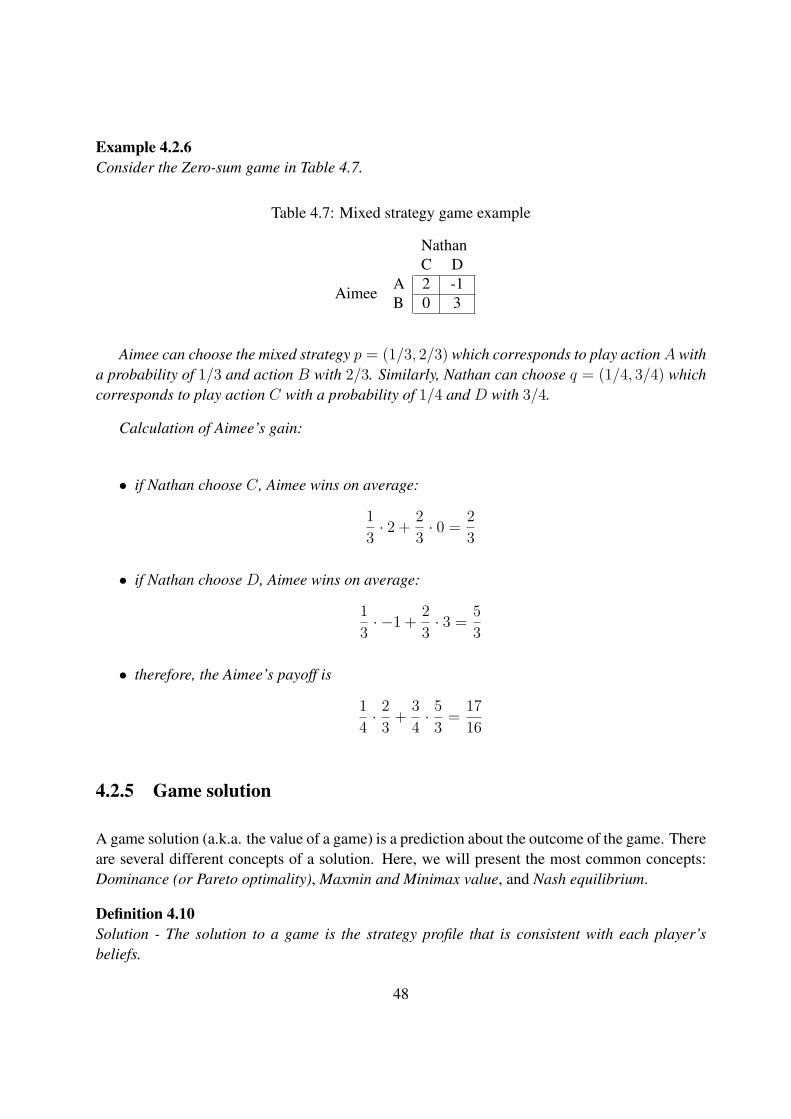
Example 4.2.6Consider the Zero-sum game in Table 4.7.
Table 4.7: Mixed strategy game example
NathanC D
AimeeA 2 -1B 0 3
Aimee can choose the mixed strategy p = (1/3, 2/3) which corresponds to play actionA witha probability of 1/3 and action B with 2/3. Similarly, Nathan can choose q = (1/4, 3/4) whichcorresponds to play action C with a probability of 1/4 and D with 3/4.
Calculation of Aimee’s gain:
• if Nathan choose C, Aimee wins on average:
13 · 2 + 2
3 · 0 = 23
• if Nathan choose D, Aimee wins on average:
13 · −1 + 2
3 · 3 = 53
• therefore, the Aimee’s payoff is
14 ·
23 + 3
4 ·53 = 17
16
4.2.5 Game solution
A game solution (a.k.a. the value of a game) is a prediction about the outcome of the game. Thereare several different concepts of a solution. Here, we will present the most common concepts:Dominance (or Pareto optimality), Maxmin and Minimax value, and Nash equilibrium.
Definition 4.10Solution - The solution to a game is the strategy profile that is consistent with each player’sbeliefs.
48
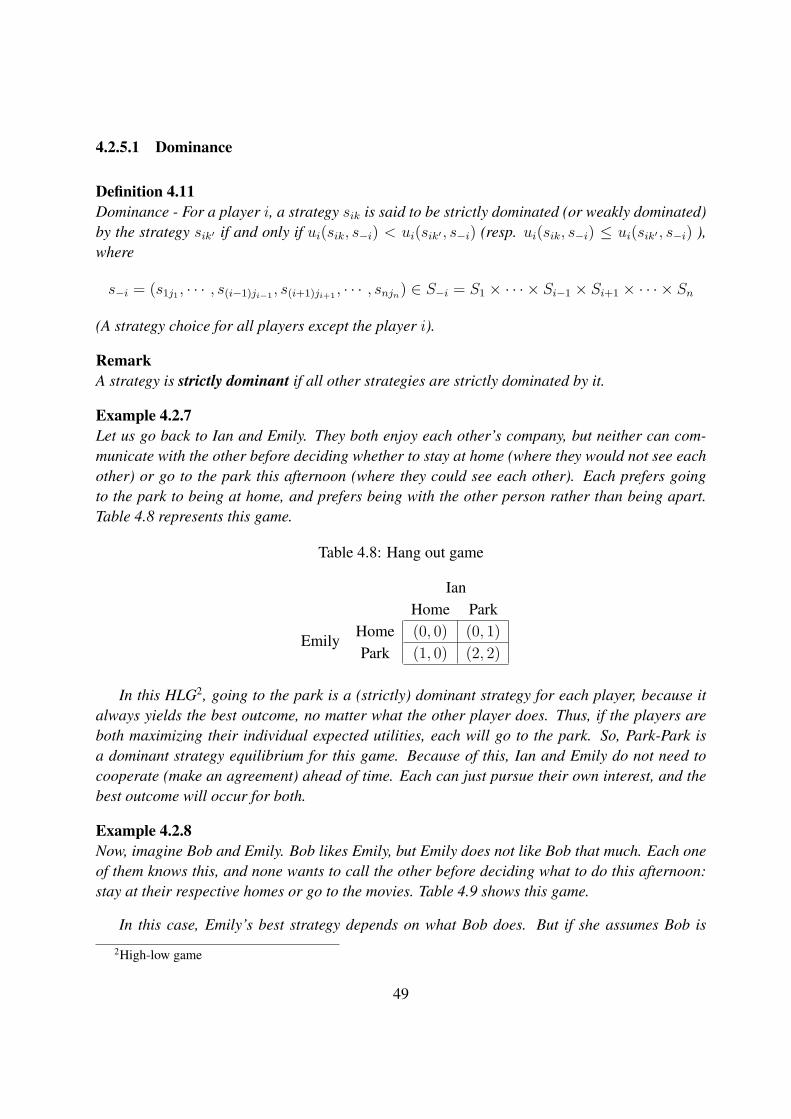
4.2.5.1 Dominance
Definition 4.11Dominance - For a player i, a strategy sik is said to be strictly dominated (or weakly dominated)by the strategy sik′ if and only if ui(sik, s−i) < ui(sik′ , s−i) (resp. ui(sik, s−i) ≤ ui(sik′ , s−i) ),where
s−i = (s1j1 , · · · , s(i−1)ji−1 , s(i+1)ji+1 , · · · , snjn) ∈ S−i = S1 × · · · × Si−1 × Si+1 × · · · × Sn
(A strategy choice for all players except the player i).
RemarkA strategy is strictly dominant if all other strategies are strictly dominated by it.
Example 4.2.7Let us go back to Ian and Emily. They both enjoy each other’s company, but neither can com-municate with the other before deciding whether to stay at home (where they would not see eachother) or go to the park this afternoon (where they could see each other). Each prefers goingto the park to being at home, and prefers being with the other person rather than being apart.Table 4.8 represents this game.
Table 4.8: Hang out game
IanHome Park
EmilyHome (0, 0) (0, 1)Park (1, 0) (2, 2)
In this HLG2, going to the park is a (strictly) dominant strategy for each player, because italways yields the best outcome, no matter what the other player does. Thus, if the players areboth maximizing their individual expected utilities, each will go to the park. So, Park-Park isa dominant strategy equilibrium for this game. Because of this, Ian and Emily do not need tocooperate (make an agreement) ahead of time. Each can just pursue their own interest, and thebest outcome will occur for both.
Example 4.2.8Now, imagine Bob and Emily. Bob likes Emily, but Emily does not like Bob that much. Each oneof them knows this, and none wants to call the other before deciding what to do this afternoon:stay at their respective homes or go to the movies. Table 4.9 shows this game.
In this case, Emily’s best strategy depends on what Bob does. But if she assumes Bob is
2High-low game
49
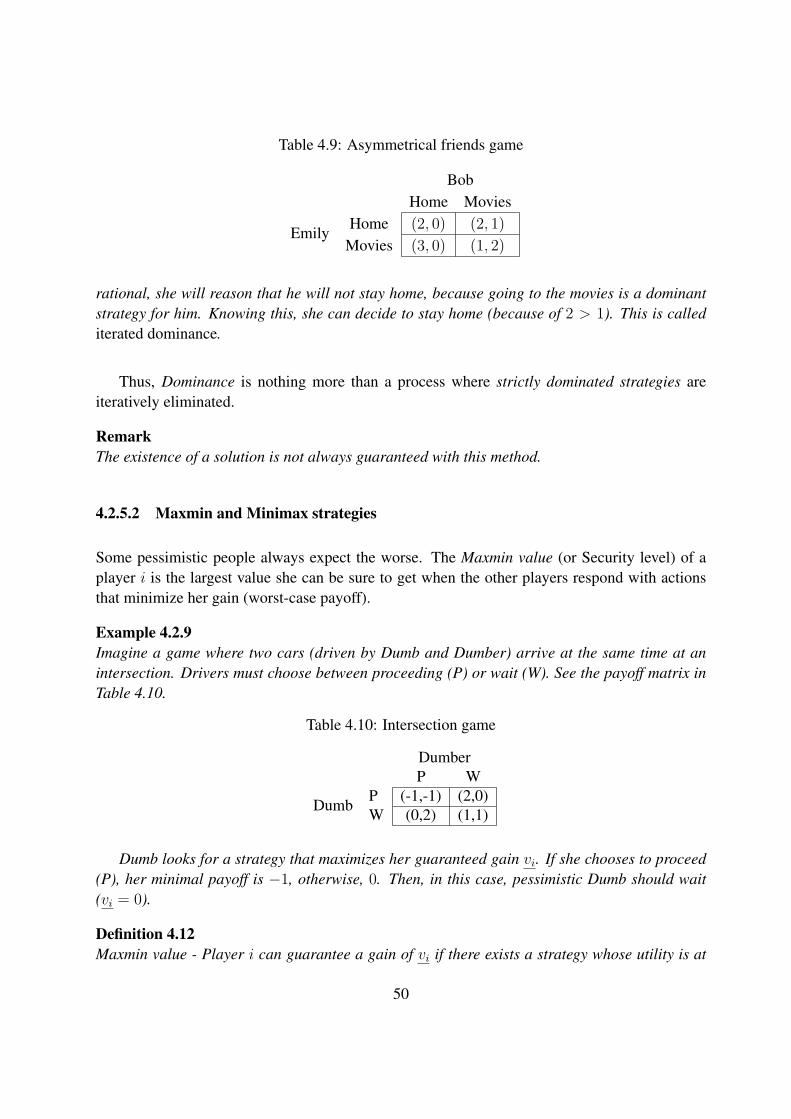
Table 4.9: Asymmetrical friends game
BobHome Movies
EmilyHome (2, 0) (2, 1)
Movies (3, 0) (1, 2)
rational, she will reason that he will not stay home, because going to the movies is a dominantstrategy for him. Knowing this, she can decide to stay home (because of 2 > 1). This is callediterated dominance.
Thus, Dominance is nothing more than a process where strictly dominated strategies areiteratively eliminated.
RemarkThe existence of a solution is not always guaranteed with this method.
4.2.5.2 Maxmin and Minimax strategies
Some pessimistic people always expect the worse. The Maxmin value (or Security level) of aplayer i is the largest value she can be sure to get when the other players respond with actionsthat minimize her gain (worst-case payoff).
Example 4.2.9Imagine a game where two cars (driven by Dumb and Dumber) arrive at the same time at anintersection. Drivers must choose between proceeding (P) or wait (W). See the payoff matrix inTable 4.10.
Table 4.10: Intersection game
DumberP W
DumbP (-1,-1) (2,0)W (0,2) (1,1)
Dumb looks for a strategy that maximizes her guaranteed gain vi. If she chooses to proceed(P), her minimal payoff is −1, otherwise, 0. Then, in this case, pessimistic Dumb should wait(vi = 0).
Definition 4.12Maxmin value - Player i can guarantee a gain of vi if there exists a strategy whose utility is at
50
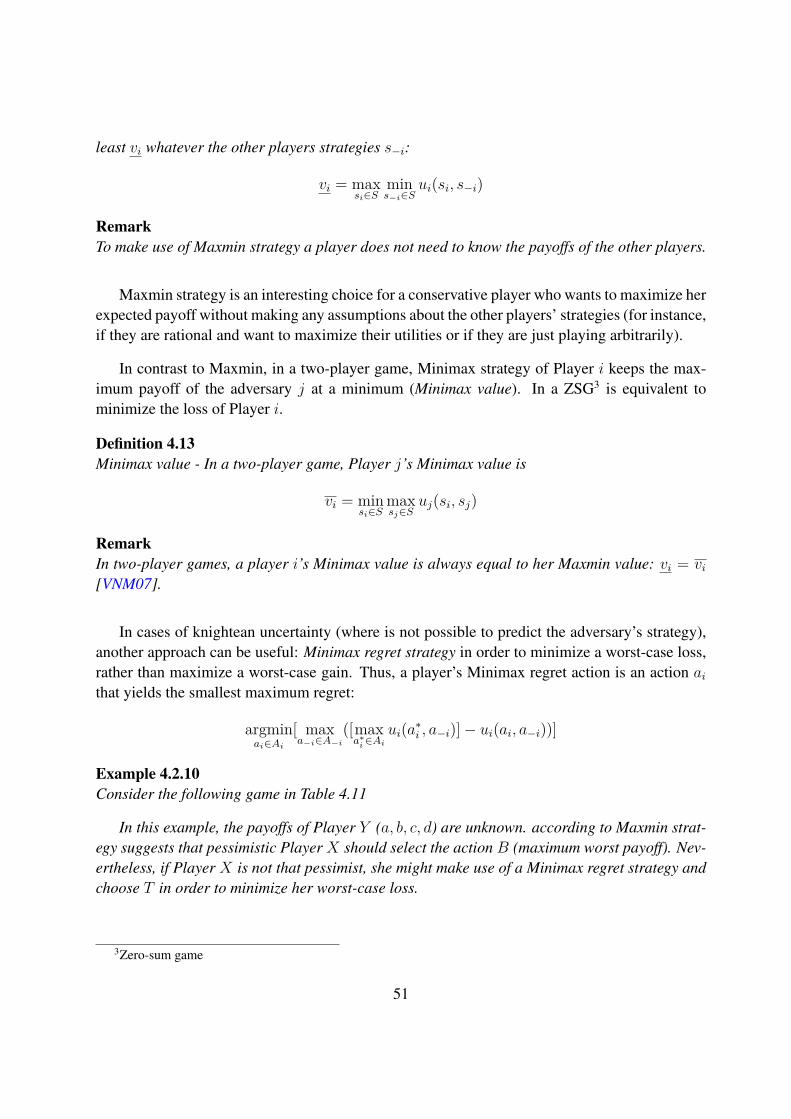
least vi whatever the other players strategies s−i:
vi = maxsi∈S
mins−i∈S
ui(si, s−i)
RemarkTo make use of Maxmin strategy a player does not need to know the payoffs of the other players.
Maxmin strategy is an interesting choice for a conservative player who wants to maximize herexpected payoff without making any assumptions about the other players’ strategies (for instance,if they are rational and want to maximize their utilities or if they are just playing arbitrarily).
In contrast to Maxmin, in a two-player game, Minimax strategy of Player i keeps the max-imum payoff of the adversary j at a minimum (Minimax value). In a ZSG3 is equivalent tominimize the loss of Player i.
Definition 4.13Minimax value - In a two-player game, Player j’s Minimax value is
vi = minsi∈S
maxsj∈S
uj(si, sj)
RemarkIn two-player games, a player i’s Minimax value is always equal to her Maxmin value: vi = vi[VNM07].
In cases of knightean uncertainty (where is not possible to predict the adversary’s strategy),another approach can be useful: Minimax regret strategy in order to minimize a worst-case loss,rather than maximize a worst-case gain. Thus, a player’s Minimax regret action is an action aithat yields the smallest maximum regret:
argminai∈Ai
[ maxa−i∈A−i
([maxa∗i∈Ai
ui(a∗i , a−i)]− ui(ai, a−i))]
Example 4.2.10Consider the following game in Table 4.11
In this example, the payoffs of Player Y (a, b, c, d) are unknown. according to Maxmin strat-egy suggests that pessimistic Player X should select the action B (maximum worst payoff). Nev-ertheless, if Player X is not that pessimist, she might make use of a Minimax regret strategy andchoose T in order to minimize her worst-case loss.
3Zero-sum game
51
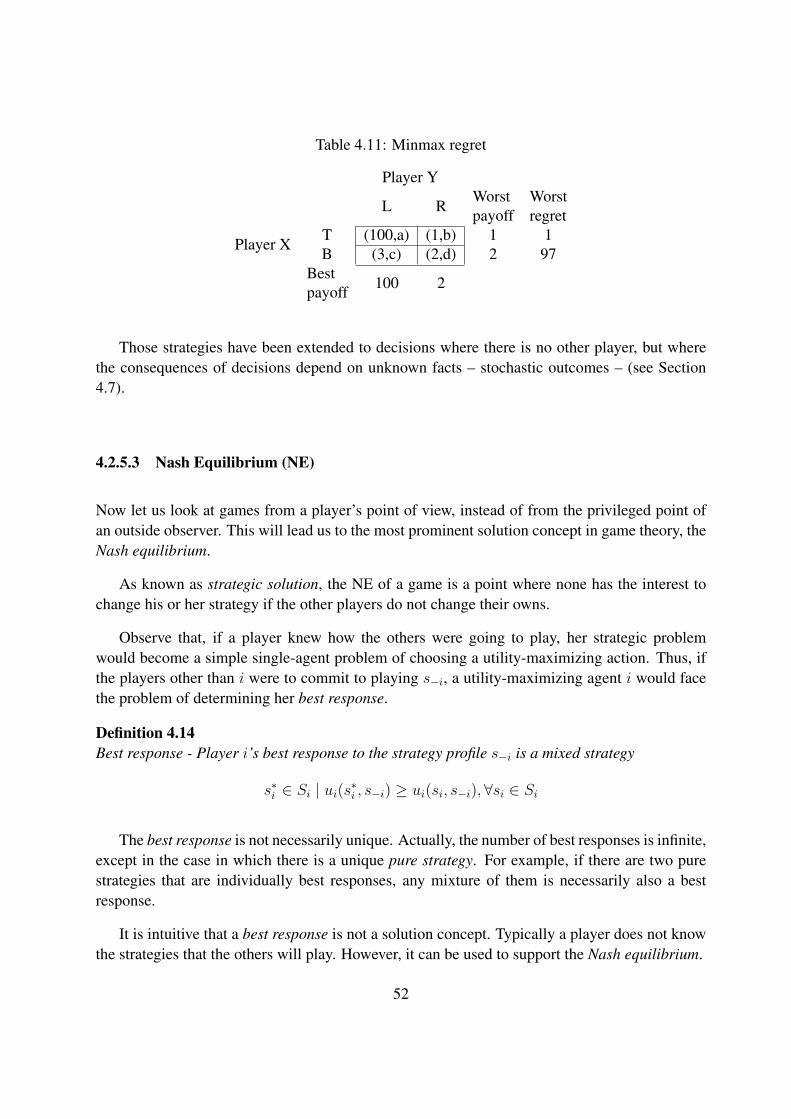
Table 4.11: Minmax regret
Player Y
L RWorstpayoff
Worstregret
Player XT (100,a) (1,b) 1 1B (3,c) (2,d) 2 97
Bestpayoff 100 2
Those strategies have been extended to decisions where there is no other player, but wherethe consequences of decisions depend on unknown facts – stochastic outcomes – (see Section4.7).
4.2.5.3 Nash Equilibrium (NE)
Now let us look at games from a player’s point of view, instead of from the privileged point ofan outside observer. This will lead us to the most prominent solution concept in game theory, theNash equilibrium.
As known as strategic solution, the NE of a game is a point where none has the interest tochange his or her strategy if the other players do not change their owns.
Observe that, if a player knew how the others were going to play, her strategic problemwould become a simple single-agent problem of choosing a utility-maximizing action. Thus, ifthe players other than i were to commit to playing s−i, a utility-maximizing agent i would facethe problem of determining her best response.
Definition 4.14Best response - Player i’s best response to the strategy profile s−i is a mixed strategy
s∗i ∈ Si | ui(s∗i , s−i) ≥ ui(si, s−i),∀si ∈ Si
The best response is not necessarily unique. Actually, the number of best responses is infinite,except in the case in which there is a unique pure strategy. For example, if there are two purestrategies that are individually best responses, any mixture of them is necessarily also a bestresponse.
It is intuitive that a best response is not a solution concept. Typically a player does not knowthe strategies that the others will play. However, it can be used to support the Nash equilibrium.
52
Definition 4.15Nash equilibrium
- A strategy profile s = (s1, · · · , sn) is a Nash equilibrium if and only if, for all agents i, s∗iis a best response to s−i.
Thus, any unilateral deviation of a player lowers her utility and increases the utility of theother players.
Theorem 4.1(Nash, 1958) - Every game with a finite number of players and action profiles has at least oneNash equilibrium.
RemarkIn zero-sum games (ZSG), the Minimax solution is the same as the Nash equilibrium.
4.3 Potential games
A game is a potential game if the incentive of all players to change their strategies can be ex-pressed using a single global Potential function [MS96]. That is, if a player unilaterally changedher action, the change in her objective function would be equal to the change in the potentialfunction.
Definition 4.16A game Γ = (N,A, u) is a potential game if there exists a function
f : A→ R | ∀i ∈ N, ∀a−i ∈ A−i, ai, a′i ∈ Ai,
ui(ai, a−i)− ui(a′i, a−i) = f(ai, a−i)− f(a′i, a−i)
Example 4.3.1Consider the game in Table 4.12.
Table 4.12: Prisoner dilemma - Potential game
Player YL R L R
Player XT (1,1) (9,0) T 4 3B (0,9) (6,6) B 3 0
(Payoffs) (Potentials)
53

In this game, we can observe that
uX(aTX , aLY )− uX(aBX , aLY ) = f(aTX , aLY )− f(aBX , aLY ) = 1
uX(aTX , aRY )− uX(aBX , aRY ) = f(aTX , aRY )− f(aBX , aRY ) = 3
uY (aTX , aLY )− uY (aTX , aRY ) = f(aTX , aLY )− f(aBX , aLY ) = 1
uY (aBX , aLY )− uY (aBX , aRY ) = f(aTX , aLY )− f(aBX , aLY ) = 3
The existence of pure strategy Nash equilibrium is guaranteed in potential games, and multi-ple Nash equilibria may exist.
Theorem 4.2Every finite potential game has a pure-strategy Nash equilibrium [MS96]; [SLB08].
This theorem will be applied to simplify the calculations in the interactions among the dronessince they would have actions aligned with a global utility, thus, they only need to optimize theirown choices.
4.3.1 Wonderful life utility (WLU)
In WLU, the utility of a player is the marginal contribution to the global utility as a result of heraction, meaning that, the player’s utility is the change in the global utility as a result of her actionas opposed to she not act at all.
WLUi = f(Z)− f(Z−i) (4.1)
where Z denotes the set of all players, Z−1 is the collection of all players except player i, f(·)denotes a global utility function. [Wol04]
RemarkWLU leads to a potential game, where the global utility function is the potential function.
Accordingly to [SLB08], in a multi-agent system (MAS) each player’s objective functionshould be appropriately “aligned” with the objective of the global planner. In this sense, inChapter 5 we will invoke the WLU to support our utility choice.
54
4.4 Repeated games
In repeated games, a given game is played multiple times by the same set of players. The gamebeing repeated is called the stage game [LBS08].
Definition 4.17Fictitious play - Sometimes, in a repeated game, a player may guess that the frequency of choicesplayed by her opponent in the last trials might be his current mixed strategy, and play a bestresponse to that (presumed) strategy.
Fictitious play is an important definition to our framework and will be useful for designingthe HRI, in order to a drone estimates the HO’s next action, based on statistical data previouslycollected.
4.5 Stochastic games
A stochastic (or Markov) game is a collection of games. the agents repeatedly play games fromthis collection, and the particular game played at any given iteration depends probabilistically onthe previous game played and on the actions taken by all agents in that game.
Stochastic games generalize both Markov decision processes (MDPs) and repeated games.An MDP is a stochastic game with only one player, while a repeated game is a stochastic gamein which there is only one state (or stage game).
In our approach, stochastic games can appear in any type of interaction, when there areseveral NE4 or the opponent is not a “rational” player.
4.6 Extensive-form games (EFG)
Some games are not necessarily played simultaneously. The normal-form game representationdoes not incorporate any notion of the sequence of the players’ actions. The extensive form is analternative representation that makes the temporal structure explicit [LBS08].
EFGs are sequential games represented by "trees", in which the root represents the first playerto move, the branches are the actions, the nodes are decision points of one of the players (alter-nately) and the outcomes are the leaves, specifying the players’ payoffs. In this type of game, a
4Nash equilibrium
55
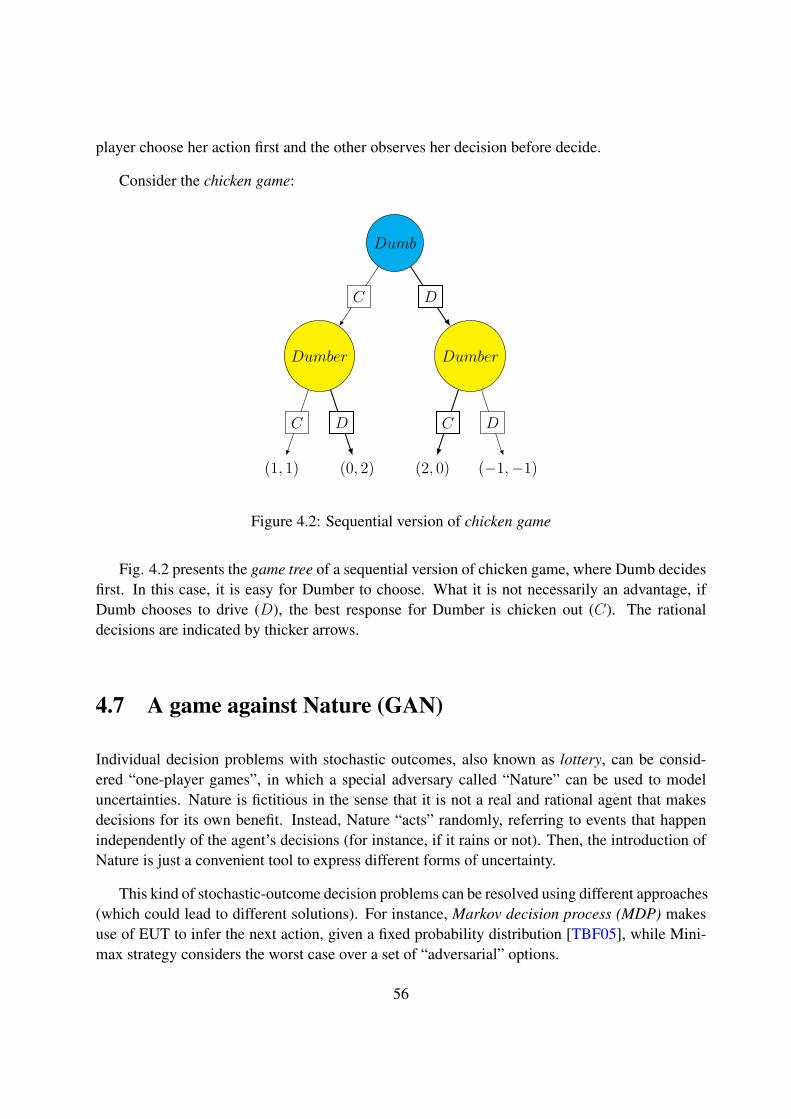
player choose her action first and the other observes her decision before decide.
Consider the chicken game:
Dumb
Dumber
(1, 1) (0, 2)
Dumber
(2, 0) (−1,−1)
C
C D
D
C D
Figure 4.2: Sequential version of chicken game
Fig. 4.2 presents the game tree of a sequential version of chicken game, where Dumb decidesfirst. In this case, it is easy for Dumber to choose. What it is not necessarily an advantage, ifDumb chooses to drive (D), the best response for Dumber is chicken out (C). The rationaldecisions are indicated by thicker arrows.
4.7 A game against Nature (GAN)
Individual decision problems with stochastic outcomes, also known as lottery, can be consid-ered “one-player games”, in which a special adversary called “Nature” can be used to modeluncertainties. Nature is fictitious in the sense that it is not a real and rational agent that makesdecisions for its own benefit. Instead, Nature “acts” randomly, referring to events that happenindependently of the agent’s decisions (for instance, if it rains or not). Then, the introduction ofNature is just a convenient tool to express different forms of uncertainty.
This kind of stochastic-outcome decision problems can be resolved using different approaches(which could lead to different solutions). For instance, Markov decision process (MDP) makesuse of EUT to infer the next action, given a fixed probability distribution [TBF05], while Mini-max strategy considers the worst case over a set of “adversarial” options.
56
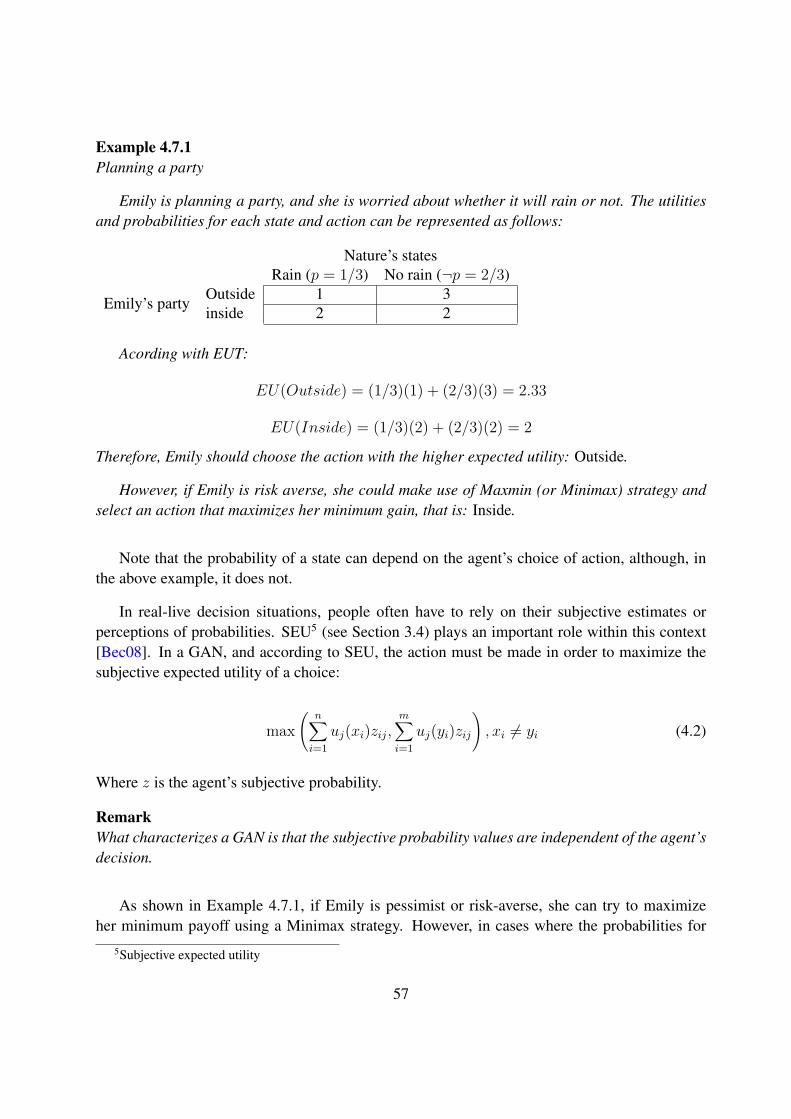
Example 4.7.1Planning a party
Emily is planning a party, and she is worried about whether it will rain or not. The utilitiesand probabilities for each state and action can be represented as follows:
Nature’s statesRain (p = 1/3) No rain (¬p = 2/3)
Emily’s partyOutside 1 3inside 2 2
Acording with EUT:
EU(Outside) = (1/3)(1) + (2/3)(3) = 2.33
EU(Inside) = (1/3)(2) + (2/3)(2) = 2
Therefore, Emily should choose the action with the higher expected utility: Outside.
However, if Emily is risk averse, she could make use of Maxmin (or Minimax) strategy andselect an action that maximizes her minimum gain, that is: Inside.
Note that the probability of a state can depend on the agent’s choice of action, although, inthe above example, it does not.
In real-live decision situations, people often have to rely on their subjective estimates orperceptions of probabilities. SEU5 (see Section 3.4) plays an important role within this context[Bec08]. In a GAN, and according to SEU, the action must be made in order to maximize thesubjective expected utility of a choice:
max(
n∑i=1
uj(xi)zij,m∑i=1
uj(yi)zij), xi 6= yi (4.2)
Where z is the agent’s subjective probability.
RemarkWhat characterizes a GAN is that the subjective probability values are independent of the agent’sdecision.
As shown in Example 4.7.1, if Emily is pessimist or risk-averse, she can try to maximizeher minimum payoff using a Minimax strategy. However, in cases where the probabilities for
5Subjective expected utility
57

different outcomes in Nature are not known (Knightian uncertainty), it may make sense to usemixed strategies, although GANs are not exactly strategic situations [Bec08].
In fact, Minimax approach may be advantageous in these situations, but, selecting the worstcase, may also overestimate extremely unlikely (but costly) events (see The black swan theory in[Tal07]), severely affecting the strategies in such scenarios.
By using the mixed strategy solution in a repeated game (in a single-shot game it is impossibleto tell if a player is using a mixed strategy), the player decides on the presumption that Naturewould attempt to deceive her and would be totally against her. This approach can be seen asa Minimax strategy under total uncertainty, and it leads to an insensitivity about wrong riskestimates. That is, Nature can do what it wants and the actor can be guaranteed not to fall underthe expected value of the mixed strategy (which is greater than the pure strategy Maxmin securitylevel). Note that, this is not true for a single trial, but, it is in an expected long-term outcomeor the case where a decision can be divided simultaneously into many sub-decisions (stochasticgames) [Bec08].
In our framework, we will use GANs in the interactions between a drone and the environment.
4.8 Summary
In this chapter, we described some key concepts from game theory (GT) that we used to modelthe interactions among our players in our framework.
In Chapter 5, the interaction among the drones will be model as a repeated anti-coordinationgame (ACG) in order to spread the drones in a optimal way, then, we will show that they have awonderful-life utility (WLU), thus, we can simplify it to a potential game.
In Chapter 8 we will define a stochastic game, where each stage game is a game againstNature (GAN), in order to select a search pattern in a SAR mission; and for the HO-droneinteraction we will use a fictitious play, based on the human utility proposed and presented inChapter 7, to design a sequential high-low game.
58

Part II
Contributions
59

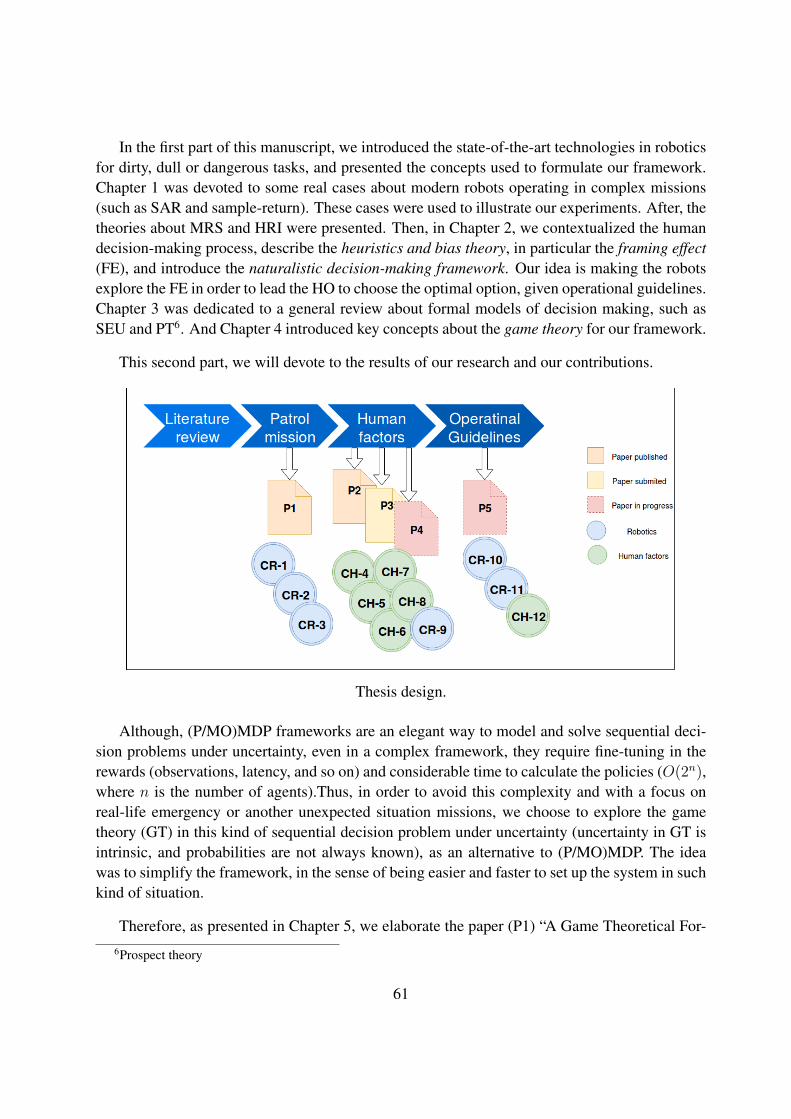
In the first part of this manuscript, we introduced the state-of-the-art technologies in roboticsfor dirty, dull or dangerous tasks, and presented the concepts used to formulate our framework.Chapter 1 was devoted to some real cases about modern robots operating in complex missions(such as SAR and sample-return). These cases were used to illustrate our experiments. After, thetheories about MRS and HRI were presented. Then, in Chapter 2, we contextualized the humandecision-making process, describe the heuristics and bias theory, in particular the framing effect(FE), and introduce the naturalistic decision-making framework. Our idea is making the robotsexplore the FE in order to lead the HO to choose the optimal option, given operational guidelines.Chapter 3 was dedicated to a general review about formal models of decision making, such asSEU and PT6. And Chapter 4 introduced key concepts about the game theory for our framework.
This second part, we will devote to the results of our research and our contributions.
Thesis design.
Although, (P/MO)MDP frameworks are an elegant way to model and solve sequential deci-sion problems under uncertainty, even in a complex framework, they require fine-tuning in therewards (observations, latency, and so on) and considerable time to calculate the policies (O(2n),where n is the number of agents).Thus, in order to avoid this complexity and with a focus onreal-life emergency or another unexpected situation missions, we choose to explore the gametheory (GT) in this kind of sequential decision problem under uncertainty (uncertainty in GT isintrinsic, and probabilities are not always known), as an alternative to (P/MO)MDP. The ideawas to simplify the framework, in the sense of being easier and faster to set up the system in suchkind of situation.
Therefore, as presented in Chapter 5, we elaborate the paper (P1) “A Game Theoretical For-6Prospect theory
61

mulation of a Decentralized Cooperative Multi-Agent Surveillance Mission”, presented at Work-shop on Distributed and Multi-Agent Planning (DMAP 2016), which provided the design of arobotic patrol utility. The main contributions of this work were:
• CR7-1 – the formulation of an original player’s utility function composed by three param-eters that are independent of the action choices of the others players;
• CR-2 – the demonstration that the game solution is a Nash equilibrium, and that this equi-librium can be obtained by optimizing separately and individually the single player’s actionchoice;
• CR-3 – the proposal of a decentralized algorithm used to conduct the mission, which worksconsidering minimum communication among players.
With this, we had a proposition for a team of drones to patrol a known area. We then focusedour work on the integration of the human operator (HO) in the system. In this regard and in orderto better understand the effects of human cognitive biases in operational contexts and to optimize(HRI), we conducted an experiment involving a framing effect (FE) paradigm for two differentrobotic missions: a SAR mission (earthquake) and a Mars sample-return mission, detailed inChapter 6, and reported in paper (P2) entitled “Towards human-robot interaction: a framingeffect experiment” presented at IEEE Systems, Man and Cybernetics conference (SMC 2016).In addition, we are preparing a journal paper more focused to the human-factors related issues(P4). The main contributions of this work are:
• CH8-4 – the observation of the FE in the addressed context;
• CH-5 – the emotional commitment influence on the FE efficiency;
• CH-6 – the time-to-answer influence on the FE efficiency;
• CH-7 – the interference of the use of colors, as a complementary visual framing, in the“power” of the FE.
Hence, in Chapter 7, we used the data collected in this previous experiment to design an“utility function” to the HO in order to enable the drones to decide how to interact with her. Thethird paper (P3) “Applying Prospect Theory for Human Operator’s Utility Function Modeling ina Cooperative Human-Robots Scenario” has been submitted to the Special Issue on AutonomousCognitive Robotics and Systems of IEEE Transactions on Systems, Man, and Cybernetics: Sys-tems. The main contribution of this study is:
7Contribution in robotics8Contribution in Human factors
62

• CH-8 – the HO’s utility function approximation founded on PT.
• CR-9 – a decisional model based on the economics approach of multi-dimensional con-sumption bundle and Prospect Theory.
We have another paper in progress (P5), reporting the results of the last experiment (Chapter8) that will be submitted to IEEE Transactions on Systems, Man, and Cybernetics: Systemswithin the best delay. It will present our last contributions:
• CR-10 – the operational guidelines driving drones utilities.
• CR-11 – the decisional model proposed in CR-9 is explored to align HO decisions withthe operational guidelines, allowing to close the loop in an "optimized" way.
• CH-12 – the FE leading HOs to decide in accordance with the operational guidelines.
63

CHAPTER 5
The patrolling problem
Contents5.1 Motivation . . . . . . . . . . . . . . . . . . . . . . . . . . . . . . . . . . . . . . 66
5.2 Objective . . . . . . . . . . . . . . . . . . . . . . . . . . . . . . . . . . . . . . . 67
5.3 Problem formulation . . . . . . . . . . . . . . . . . . . . . . . . . . . . . . . . 67
5.4 Moving game . . . . . . . . . . . . . . . . . . . . . . . . . . . . . . . . . . . . . 68
5.4.1 Patrol mission . . . . . . . . . . . . . . . . . . . . . . . . . . . . . . . . . 69
5.4.2 Potential game . . . . . . . . . . . . . . . . . . . . . . . . . . . . . . . . 70
5.4.3 Algorithm for communication and coordination . . . . . . . . . . . . . . . 72
5.5 Simulation Experiments . . . . . . . . . . . . . . . . . . . . . . . . . . . . . . . 73
5.5.1 Setup . . . . . . . . . . . . . . . . . . . . . . . . . . . . . . . . . . . . . 73
5.5.2 Metrics . . . . . . . . . . . . . . . . . . . . . . . . . . . . . . . . . . . . 75
5.5.3 Results . . . . . . . . . . . . . . . . . . . . . . . . . . . . . . . . . . . . 76
5.6 Discussion . . . . . . . . . . . . . . . . . . . . . . . . . . . . . . . . . . . . . . 78
5.7 Summary . . . . . . . . . . . . . . . . . . . . . . . . . . . . . . . . . . . . . . . 80
Disobey, and you die.
A.R.I.I.A. - Eagle Eye
This chapter presents the research to design a heuristic utility function for a drone teampatrolling mission. The results of this work were presented in the conference paper P1 (“A GameTheoretical Formulation of a Decentralized Cooperative Multi-Agent Surveillance Mission”) atthe Workshop on Distributed and Multi-Agent Planning (DMAP) 2016.
65
5.1 Motivation
Among MRSs, the robot team autonomous patrolling problem is very challenging: the robotsmust navigate through the environment so different locations that are scattered in the operationalspace, and they have to coordinate their actions in order to optimize the time spent to cover all thedesired points of interest (POI) [PR13a]. One of the critical issues of a surveillance mission for aMRS is how to coordinate their behaviors in order to optimize the global performance [Men08].For example, monitoring an area of interest requires that the robots move repeatedly throughthe environment, and the difficulty is to decide on the paths while optimizing some performancecriteria [PFB10]. Moreover, since surveillance implies the maximization of the number of visitsto each node in a given environment, a good surveillance strategy must reduce the time intervalbetween visits to the same location [Che04].
With the aim of evaluating surveillance strategies, a comparative study using distinct topo-logical environments and different team sizes is presented in [PR13b]. That work analyzes theperformance and scalability of each patrolling approach. For that, [PR13b] proposed as an eval-uation metric the average idleness of the graph (IdlG). In the same point of view, [Che04]demonstrates that minimizing worst idleness will also lead to a smaller average idleness. In anycase, the smallest the idleness, the better is the performance.
Another crucial point argued by some authors is that, for security reasons, it should be suit-able to consider irregular time intervals to perform visits on POIs while optimizing the strategy,in order to avoid that a potential intruder could observe the movement of the patrol members forsome time and derive an accurate belief of their strategies [HCB+13]; [Ami+10]. The key ideais to make it more difficult for an intruder to predict the motion strategy of the team members.
In this kind of surveillance application, it is well known that the minimal refresh time pa-trolling problem is NP-hard [PFB10]; [PR11]; [ZK15]. This means that to update the state ofeach position at each timestep would be computational and memory expensive and impracticalin real-world scenarios [Men08]; [PR11]. This is so because in order to improve the efficiencyof the collective searching strategy, the action of each robot does not only depend on its ownsituation, but also on other robots decisions.
In this sense, recent papers have based their approaches on Game Theory [Ami+10]; [HCB+13];[Men08]; [Pes+00]; [An+12]; [Kha07]. An example of such a Game Theory application ispresented in [HCB+13], where Game Theory models of the multi-robot patrolling problem aresolved with the use of dynamic and decentralized collaborative approach. Another interesting so-lution is proposed by [Ami+10] based on Game Theory, which develops a surveillance strategy todrive mobile robots around a known environment in order to avoid intrusions while implementinga non deterministic strategy for their movements in order to make more difficult the task of in-truders for they do not know a priori the stochastic distribution of such motions. Others examples
66

can be found in [Men08], which proposed an N-agent cooperative nonzero-sum game to achievean optimal overall robots behaviors; [Pes+00] described a gradient-descent policy-search algo-rithm for cooperative multi-agent domains, where they all share a common payoff; and, [An+12]that investigated the use of zero-sum games for the protection of critical infrastructures.
5.2 Objective
With the purpose of evaluating the team coordination performance (without the human operator’sintervention), a cooperative surveillance mission based on Game Theory (GT) was designed, inwhich two metrics were defined: (1) idleness – the time interval expended by the patrols to revisiteach POI1, and (2) predictability – the difficulty in predicting the next move of the drones.
In this sense, this work addresses the problem of monitoring a closed area by a team ofdrones minimizing the POIs idleness while keeping some kind of randomness of motion in orderto render movements less predictable.
Note that, this is neither a coverage problem nor an adversarial problem, but a mix of them.The issue is the development of a dynamic and decentralized approach to multi-aerial-robotcooperation in order to solve the patrolling problem by implementing game theoretical models.
5.3 Problem formulation
This mission can be defined as a frequent visitation problem of all preset points (POI) for a droneteam in the lowest possible time interval without having a cycling behavior in order to make themotion model less predictable.
The idea of this chapter is to present a method of coordination between drones, based onGame Theory, that is capable of carrying out a patrolling mission on a known topological modelrepresented as a graph G = (S,E). In this graph G, S is the set of nodes representing the POIs inthe environment (i.e. positions), and where the edges E ⊆ S × S define adjacency relationshipsbetween the nodes s ∈ S. Each edge e ∈ E has a cost that represents the time required to movefrom one node to another. These costs are fixed.
In order to reduce the computational complexity, the following approach for the solving algo-rithm is proposed: (1) a fixed path between nodes in the graph and its cost are generated offline,considering that the graph does not change during the mission; and (2) the communication be-tween the drones and a new game occur only at the destination of a drone, instead of at every
1Point of interest
67
timestep (i.e. the communication is asynchronous).
To define the game problem, some assumptions were taken:
• For simplicity, time was discretized in turns (timesteps), and a timestep represents the timeto go from a position to another adjacent one;
• Each node s is considered as a POI that should be observed, i.e. looking for an intruder;
• Each destination node is a point where the communication among the drones team occurs;
• Each drone will select, only once it reaches its destination point, the next point to visit,based on the available information of the others. This means that a new action selectionproblem will be considered by a drone only when this one has reached the destinationpoint, instead of each timestep t;
• The drones are defined as "Conscientious Cognitive" agents [PR11], i.e., they choose thenext point to visit in the global graph, instead of in their neighborhood. So, at each timeinterval, each drone can move from one node to another adjacent, without necessarilyselecting a new point of interest;
• All drones have perfect knowledge of the graph model, of their own positions in the graph,the last position informed by the others and their destinations in the graph;
• We assume that each drone can avoid obstacles and collisions;
• The horizon of the mission is considered as infinite.
Therefore, under these assumptions, a Game-theoretic formulation of the problem is pro-posed.
5.4 Moving game
Consider a graph G = (S,E), where S is the set of nodes representing the POIs in the environ-ment and where the edges E ⊆ S × S define adjacency relationships between the nodes S, i.e.,the possible paths between the POIs. Each edge has a cost that represents the time required tomove from one node to another. These costs are fixed.
During a mission, in order to each drone selects the next sector to visit, a dynamic ACGwas designed, where the payoffs at each timestep depend on the minimal distance between POIs(represented as nodes in a graph), the current position (node) of all drones and the last time sinceeach POI was visited. Formally, it can be defined as a N-player finite game Γ = (N,A, u),where:
68
• N = 1, · · · , n is the finite set of n players, indexed by i;
• A = A1 × · · · × An represents all possible actions to be taken by all players;
• u = h(u1, · · · , ui, · · · , un) is the payoff function (which in turn is function of the payoffof each single player), with u : A → R, and ui : Ai → R for each player i.
In conformity with the GT2 formulation, a = [a1, · · · , an] is defined as the vector of actionsfor all n ∈ N drones and Ai = a1
i , · · · , aqi, where q is the number of actions at the disposal of
Dronei. Observe that the sets of actions Ai do not need to be equal for all drones. However, inthe scenario we are modeling, we will consider the possible actions to be all equals since eachdrone can select any destination sk ∈ S as an action. Then, one may conclude that A = An andthe cardinality |A| = q. Thus, the set A is equal to the set of states (nodes of the graph) S.
According to the positions/destinations of the drones at timestep t, σt is defined as the sum-mation of the utilities of all players involved in the game, i.e.,
σt(a, st) =∑a∈A
σti(a, st,m) (5.1)
where a is the vector of actions of all drones and st is the state (position) of the drones at timestept.
5.4.1 Patrol mission
In this type of mission, the drone team has to monitor a closed area, minimizing the time to revisitthe POIs, while keeping some kind of randomness of motion in order to render movements lesspredictable for a potential intruder. Thus,
σt∗i (ai, st) = maxai∈A
(−[δti(ai, sti) + θti(ai, ¯s−it)− ρti(ai)]
)(5.2)
where:
• cost to move: δti(·) is the distance for Dronei to move from its current position sti to all itspossible future locations aki ∈ Ai, with k ∈ 1, · · · , q. Therefore, considering thatf ∗(sti, aki ) is the optimal distance cost that refers to the optimal (or sub-optimal, when theoptimal cannot be calculated) path from node sti to aki , one gets:
δi(aki , sti) = f ∗(sti, aki ) (5.3)2Game theory
69
cost for not moving: infinity. The idea is to force Dronei to move to another place, then
δti(sti, sti) =∞
.
• θti(·) is the cost relative to the proximity of the other drones:
θti(ai, ¯s−it)) =∑n−1j (max(δtj) + min(δtj)− δtj)
n− 1 , i 6= j (5.4)
θti(·) is the weighted sum of all other drones “inverted distance”, where inverted distance isdefined as a value that is equal to the maximum distance for the nearest point and decreaseswith the distance. The idea here is to make the sectors more distant from the other dronesmore attractive for Dronei.
• ρti(aki ) is the expected reward to Dronei reaches the node aki ∈ Ai. These values arecollected (turn into zero) when a drone passes over the position and increase by a factorηn each timestep that they are not visited, where η ∈ [0, 1] is a normalizer constant and nis the number of drones:
ρt+1i (aki ) = ρti(aki ) + (ηn) (5.5)
Note that since all action sets Ai are equal to A, the expected reward is equal for all drones.
In this way, ρ(·) is an attractor to POIs with lower number of visits (greater idleness).
5.4.2 Potential game
A potential game, as defined in Section 4.3, requires perfect alignment between the global goaland the players’ local objective functions, meaning that if a player unilaterally changed her ac-tion, the change in her objective function would be equal to the change in the potential function.
In our case, based on the definition of the utilities, the optimal global utility for this gamewould be:
σt∗(a, st) = maxa∈A
σt(a, st) (5.6)
Observe that the Dronei’s utility (σti(·)) is only directly dependent on ai and only indirectlytakes into consideration the actions of all other drones (through θ−i(·)). So, individual’s utilityfunctions are composed by three parameters that are, by definition, independent from the choices
70

of the others players. In this sense, (5.6) may be rewritten as:
σt∗(a, st) = maxa1∈A1
σt1(a1, st) + · · ·+ max
an∈An
σtn(an, st) (5.7)
Therefore, the maximum global utility strategy solution for Dronei, σti∗, is adopted for the
decoupled game as described in:
σti∗ = argmax
ai∈Ai
σti(ai, st) (5.8)
It means that for this formulation the action choice forDronei is independent from the actionchoices of the others drones. Now, we can enunciate and prove the following theorem:
Theorem 5.1The N-player finite game Γ = (N,A, u) with utility functions defined in (5.1) and (5.2) possessa pure-strategy equilibrium.
Proof. Let us consider a Wonderful Life Utility for Dronei.
WLUi = φ(z)− φ(z−i)
where z is the set of all drones and z−i is the collection of all drones except Dronei. It is clear,that if one considers φ = σt(·), then
WLUi = σi(·)
Therefore, the game Γ becomes a Potential Game, i.e., the drones’ utilities σi(·) are aligned tothe global utility σ(·). Therefore, it is guaranteed to have a pure-strategy equilibrium accordingto Corollary 2.2 of [MS96].
Moreover, it may be verified that this pure-strategy equilibrium is indeed a NE of the game[PGJS14], for:
σt(a∗, st) ≥ σt([a∗1, · · · , a∗j−1, aj , a∗j+1, · · · , a∗n], st), ∀j ∈ N.
Finally, notice that this decentralized approach, where the action selection is formalized asa potential game, allows to drones to take decisions in an asynchronous way, as each droneselects the next action only once it reaches the destination point based only on available (last)information.
71

Algorithm 1 Patrol mission for Dronei1: while True do2: if status == NotBusy then3: report current position4: read messages5: assign infinity to current position cost - f ∗(sti, sti) =∞6: compute the utility vector σti (Eq. (5.2))7: find and select the maximum utility strategy (Eq. (5.8))8: report destination9: assign Busy to its current status
10: start navigation11: else12: if position == destination then13: assign NotBusy to its current status14: else15: continue navigation16: end if17: end if18: end while
5.4.3 Algorithm for communication and coordination
Consider a patrol mission, in which the drone team is monitoring some POIs s ∈ S. Algorithm1 presents the process inside each drone. To better explain this algorithm we introduce twoexecution status on which drones’ action selection relies. Before a Dronei starts to move, itchanges its status to Busy and when it arrives at the destination point it changes to NotBusy.
When Dronei is NotBusy, i.e., when it is ready to leave the current point sti, (line 2 of Alg.1), it broadcasts a message of its current position and updates its knowledge of the position ofthe NotBusy drones and the destination position for the Busy ones (lines 3 and 4). Then, Droneichanges the cost of its current position sti to∞ which forces it to move to somewhere else (line5). After, it proceeds all calculations to compute the utility vector σti , and it selects the strategythat maximizes its utility (lines 6 and 7), applying the proposed approach. As explained before,this is a potential game, then, when Dronei computes its maximum utility, it also computes theparcel of the global maximum utility concerned to it, knowing that the others will do the same.In this way, using a potential game to predict what others will do, coordination arises. Finally, itbroadcasts its next destination to the others, changes its status, and starts to navigate again (lines8-10).
When the drone is Busy, it only continuously verifies if the destination point is reached, if isthe case, it changes its status to NotBusy, if not, it continues to navigate (lines 11-15).
72
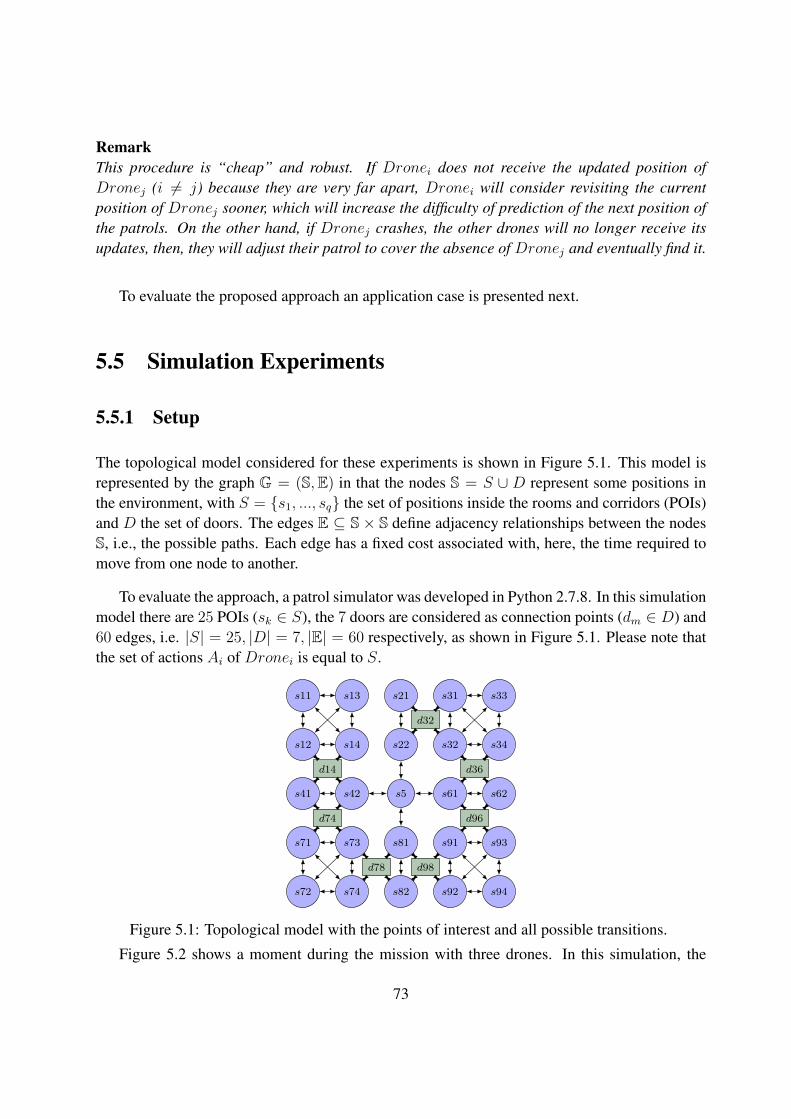
RemarkThis procedure is “cheap” and robust. If Dronei does not receive the updated position ofDronej (i 6= j) because they are very far apart, Dronei will consider revisiting the currentposition of Dronej sooner, which will increase the difficulty of prediction of the next position ofthe patrols. On the other hand, if Dronej crashes, the other drones will no longer receive itsupdates, then, they will adjust their patrol to cover the absence of Dronej and eventually find it.
To evaluate the proposed approach an application case is presented next.
5.5 Simulation Experiments
5.5.1 Setup
The topological model considered for these experiments is shown in Figure 5.1. This model isrepresented by the graph G = (S,E) in that the nodes S = S ∪ D represent some positions inthe environment, with S = s1, ..., sq the set of positions inside the rooms and corridors (POIs)and D the set of doors. The edges E ⊆ S × S define adjacency relationships between the nodesS, i.e., the possible paths. Each edge has a fixed cost associated with, here, the time required tomove from one node to another.
To evaluate the approach, a patrol simulator was developed in Python 2.7.8. In this simulationmodel there are 25 POIs (sk ∈ S), the 7 doors are considered as connection points (dm ∈ D) and60 edges, i.e. |S| = 25, |D| = 7, |E| = 60 respectively, as shown in Figure 5.1. Please note thatthe set of actions Ai of Dronei is equal to S.
s11
s12
s13
s14
s21
s22
s31
s32
s33
s34
s41 s42 s5 s61 s62
s71
s72
s73
s74
s81
s82
s91
s92
s93
s94
d14
d32
d36
d74
d78
d96
d98
Figure 5.1: Topological model with the points of interest and all possible transitions.
Figure 5.2 shows a moment during the mission with three drones. In this simulation, the
73
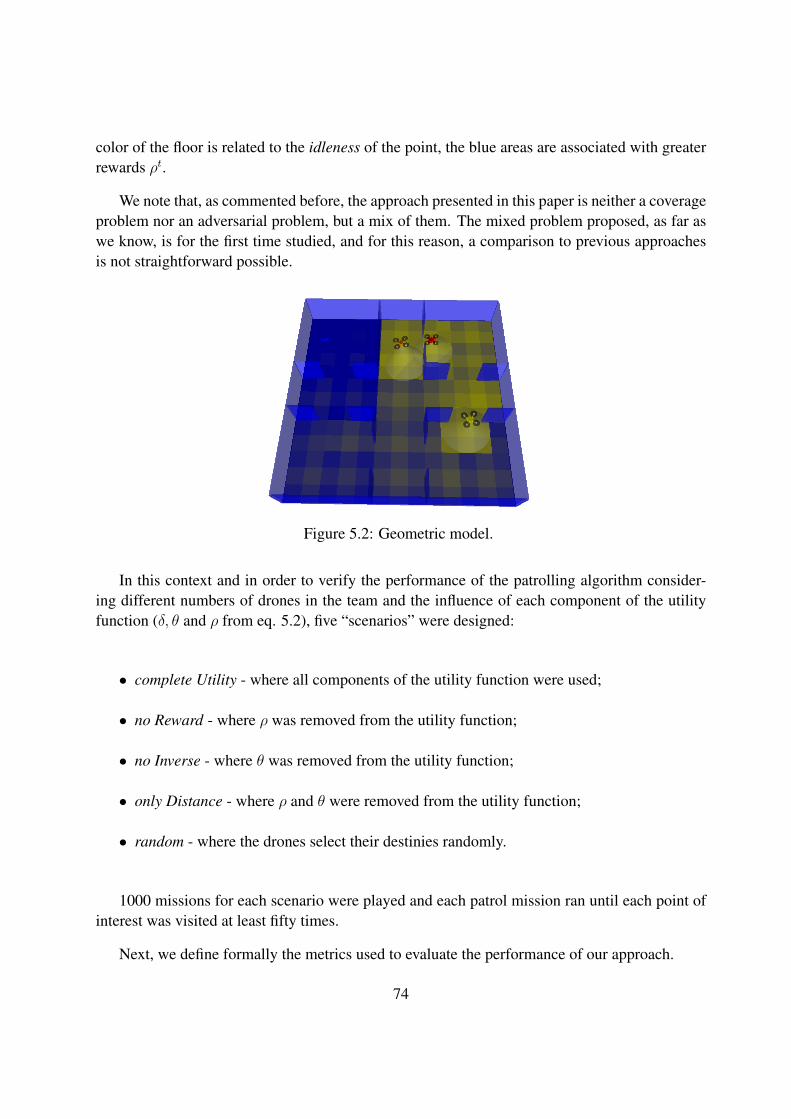
color of the floor is related to the idleness of the point, the blue areas are associated with greaterrewards ρt.
We note that, as commented before, the approach presented in this paper is neither a coverageproblem nor an adversarial problem, but a mix of them. The mixed problem proposed, as far aswe know, is for the first time studied, and for this reason, a comparison to previous approachesis not straightforward possible.
Figure 5.2: Geometric model.
In this context and in order to verify the performance of the patrolling algorithm consider-ing different numbers of drones in the team and the influence of each component of the utilityfunction (δ, θ and ρ from eq. 5.2), five “scenarios” were designed:
• complete Utility - where all components of the utility function were used;
• no Reward - where ρ was removed from the utility function;
• no Inverse - where θ was removed from the utility function;
• only Distance - where ρ and θ were removed from the utility function;
• random - where the drones select their destinies randomly.
1000 missions for each scenario were played and each patrol mission ran until each point ofinterest was visited at least fifty times.
Next, we define formally the metrics used to evaluate the performance of our approach.
74
5.5.2 Metrics
This study has been focused on (1) the interval between visits (idleness) and (2) the difficultyof prediction of the next position of the patrols (predictability). For the first one the averageidleness of the graph IdlG [PR13b] was used as a metric, and for the second one, the Ljung-Boxtest [BJR08] results were considered.
The average idleness of the graph (IdlG) proposed by [PR13b] is defined as:
Starting with the instantaneous idleness (Idltk) of a position si ∈ S in the time step tk:
Idltk(si) = tk − tlastvisit
where tlastvisitcorresponds to the last time step when that point si was visited by a drone. Con-
sequently, the average idleness (Idlm) of a point si in a total time T is defined as:
Idlm(si) =
T∑k=0
Idltk(si)
T
And, finally, the average idleness of the graph (IdlG) is defined as:
IdlG =
|S|∑i=0
Idlm(si)
| S |(5.9)
where | S | represents the cardinality of the set S.
On the other hand, to evaluate how “unpredictable” the drone paths were, the Ljung-Box testwas used. This statistical test allows the measurement of the "overall randomness" based on anumber of lags of a time series by means of a single value Q:
Q = p(p+ 2)m∑l=1
ρ2l
p− l
and:
ρl =
p−l∑k=1
(Yi − Y )(Yi+l − Y )p∑
k=1(Yi − Y )2
(5.10)
where p is the sample size,m is the number of lags being tested, ρl is the autocorrelation function
75
(ACF ) at lag l and Y = (Y1, · · · , Yp) are the measurements. For a significance level α, thecritical region for rejection of the hypothesis of randomness is given by the percentile (1− α) ofthe chi-squared distribution with m degrees of freedom:
Q > χ21−α,m (5.11)
Thus, if Eq. 5.11 is TRUE it is possible to say that exists a linear correlation, in other words,the information of past positions allows an inference of future positions. Moreover, Q weightsthe correlation process, i.e., the higher the value the greater the correlation.
Obviously, all tested scenarios have a high degree of autocorrelation between adjacent andnear-adjacent positions, due to the movement model of the drones. Even though, Q can identifyan appropriate time series model even when the data are not random.
In the end, in order to use this values as a metric of predictability (π) in the present work, Qfor each scenario c was normalized by the worst value (per number of drones n):
πnc = Qnc
max(Qn) (5.12)
In this work, for a specific number of drones, the degrees of freedom m were selected amongall scenarios as the smallest median number of steps necessary to complete a cycle (i.e., to visitall positions at least once) with an α = 0.05.
5.5.3 Results
Figure 5.3 shows that increasing the number of drones implies the convergence of idleness,which, in an unusual and somehow unrealistic situation, will be zero when the number of dronesreaches the number of POIs. Nevertheless, looking to these charts it is possible to infer the min-imal number of drones to achieve the goal of the mission in an efficient way, defined as the ratio|N |IdlG
(best cost-benefit ratio).
Interestingly, in the no Inverse scenario, differently from the others, the idleness seems to bealmost steady with two drones or more. The reason for that must be interpreted with caution, butit seems that when they do not need to coordinate their moves (and that is in essence what θ do),they can reach a local optimum very fast; however, these values will eventually decrease to zero.Also, it can be seen that the variance decreases with the number of drones, except for the noInverse scenario. Together these results provide important insights into the approach presented.It is easy to observe the importance of each cost variable and their contribution to idleness.
76
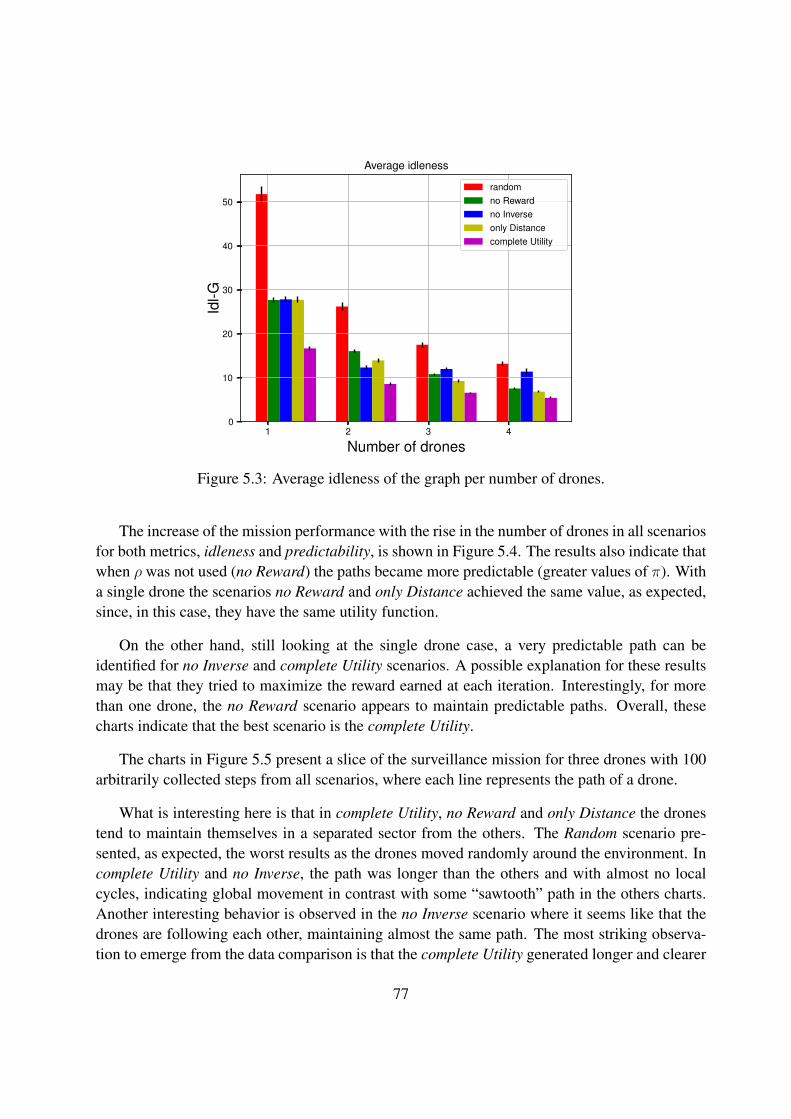
1 2 3 4
Number of drones
0
10
20
30
40
50Id
l-G
Average idleness
randomno Rewardno Inverseonly Distancecomplete Utility
Figure 5.3: Average idleness of the graph per number of drones.
The increase of the mission performance with the rise in the number of drones in all scenariosfor both metrics, idleness and predictability, is shown in Figure 5.4. The results also indicate thatwhen ρ was not used (no Reward) the paths became more predictable (greater values of π). Witha single drone the scenarios no Reward and only Distance achieved the same value, as expected,since, in this case, they have the same utility function.
On the other hand, still looking at the single drone case, a very predictable path can beidentified for no Inverse and complete Utility scenarios. A possible explanation for these resultsmay be that they tried to maximize the reward earned at each iteration. Interestingly, for morethan one drone, the no Reward scenario appears to maintain predictable paths. Overall, thesecharts indicate that the best scenario is the complete Utility.
The charts in Figure 5.5 present a slice of the surveillance mission for three drones with 100arbitrarily collected steps from all scenarios, where each line represents the path of a drone.
What is interesting here is that in complete Utility, no Reward and only Distance the dronestend to maintain themselves in a separated sector from the others. The Random scenario pre-sented, as expected, the worst results as the drones moved randomly around the environment. Incomplete Utility and no Inverse, the path was longer than the others and with almost no localcycles, indicating global movement in contrast with some “sawtooth” path in the others charts.Another interesting behavior is observed in the no Inverse scenario where it seems like that thedrones are following each other, maintaining almost the same path. The most striking observa-tion to emerge from the data comparison is that the complete Utility generated longer and clearer
77
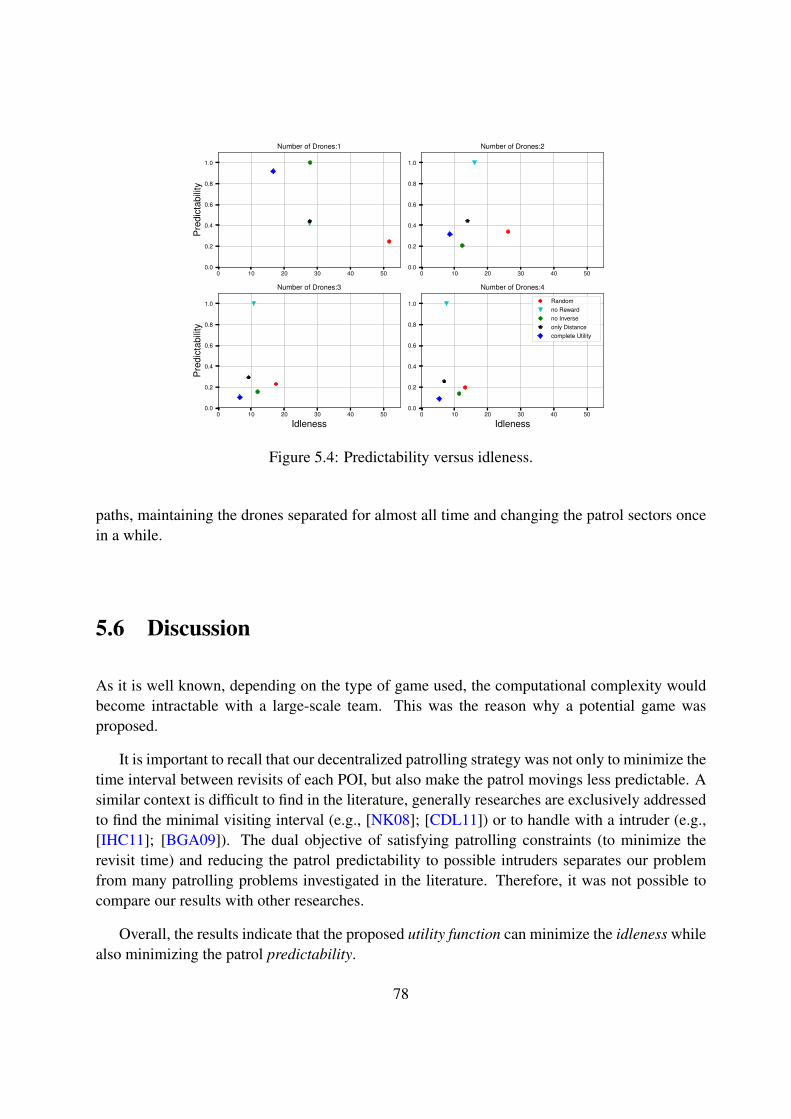
0 10 20 30 40 500.0
0.2
0.4
0.6
0.8
1.0
Pre
dict
abili
ty
Number of Drones:1
0 10 20 30 40 500.0
0.2
0.4
0.6
0.8
1.0
Number of Drones:2
0 10 20 30 40 50
Idleness
0.0
0.2
0.4
0.6
0.8
1.0
Pre
dict
abili
ty
Number of Drones:3
0 10 20 30 40 50
Idleness
0.0
0.2
0.4
0.6
0.8
1.0
Number of Drones:4
Randomno Rewardno Inverseonly Distancecomplete Utility
Figure 5.4: Predictability versus idleness.
paths, maintaining the drones separated for almost all time and changing the patrol sectors oncein a while.
5.6 Discussion
As it is well known, depending on the type of game used, the computational complexity wouldbecome intractable with a large-scale team. This was the reason why a potential game wasproposed.
It is important to recall that our decentralized patrolling strategy was not only to minimize thetime interval between revisits of each POI, but also make the patrol movings less predictable. Asimilar context is difficult to find in the literature, generally researches are exclusively addressedto find the minimal visiting interval (e.g., [NK08]; [CDL11]) or to handle with a intruder (e.g.,[IHC11]; [BGA09]). The dual objective of satisfying patrolling constraints (to minimize therevisit time) and reducing the patrol predictability to possible intruders separates our problemfrom many patrolling problems investigated in the literature. Therefore, it was not possible tocompare our results with other researches.
Overall, the results indicate that the proposed utility function can minimize the idleness whilealso minimizing the patrol predictability.
78
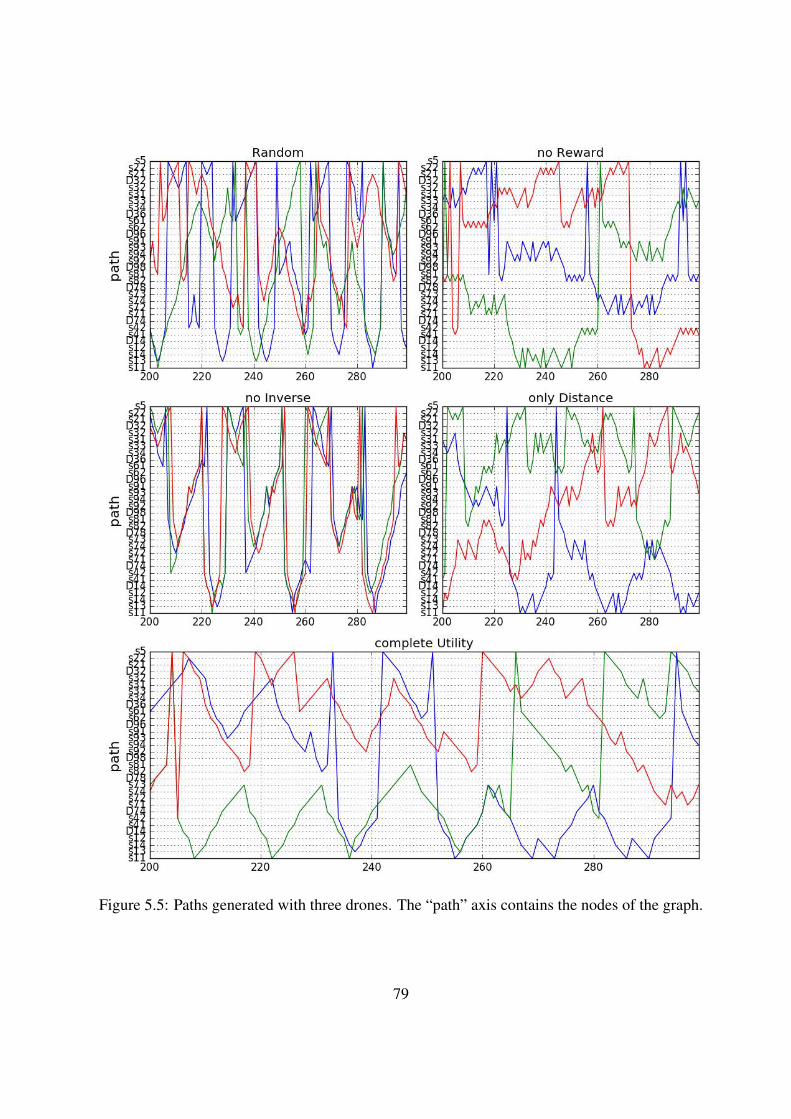
Figure 5.5: Paths generated with three drones. The “path” axis contains the nodes of the graph.
79
5.7 Summary
This chapter presented a multi-aerial-robot coordination game theoretical approach to performinga surveillance mission in a well-structured environment. Such a mission consisted in constantlyvisiting a set of points of interest while minimizing the time interval between successive visits(idleness).
The proposed approach optimized the agents’ action selection based on an N-player ACGframework. The main contributions were:
• CR-1 – the formulation of an original player’s utility function composed by three parame-ters that are independent of the action choices of the others players;
• CR-2 – the demonstration that the game solution is a Nash Equilibrium (NE), and that thisequilibrium can be obtained by optimizing separately and individually the single player’saction choice, i.e., it is a potential game;
• CR-3 – the proposal of a decentralized algorithm used to conduct the mission, which worksconsidering minimum communication among players.
In other words, an original heuristic utility function was presented, where not only the pathtravel cost was considered, but also the current positions of the other players and the last timesince each point of interest was visited. And, based on this utility function, an anti-coordinationgame (ACG) was generated, where the NE solution guides the player’s behavior towards theteam goal.
Simulations evaluated the different policies obtained, which were compared using as metricthe average idleness of all points of interest (POI). The proposed framework allowed the decreaseof the idleness of watched points compared to random action selection while keeping some kindof randomness of motion (measured by a predictability metric), which might be desired to curbthe prediction of the team surveillance strategy by an intruder.
In this way, we concluded this study about the moving game for a patrol mission. In the nextchapter, we will present the first step to put a human operator in the drone team, observing ina carried out experiment how the participants reacted in function of the way the problem waspresented to them and their emotional involvement with the situation in question.
80
CHAPTER 6
The framing effect
Contents6.1 Motivation . . . . . . . . . . . . . . . . . . . . . . . . . . . . . . . . . . . . . . 82
6.2 Experimental design . . . . . . . . . . . . . . . . . . . . . . . . . . . . . . . . . 83
6.2.1 Research questions . . . . . . . . . . . . . . . . . . . . . . . . . . . . . . 83
6.2.2 Drones’ environment and mission simulation . . . . . . . . . . . . . . . . 84
6.3 Experiment I . . . . . . . . . . . . . . . . . . . . . . . . . . . . . . . . . . . . . 84
6.3.1 Participants . . . . . . . . . . . . . . . . . . . . . . . . . . . . . . . . . . 84
6.3.2 Experimental protocol . . . . . . . . . . . . . . . . . . . . . . . . . . . . 85
6.3.3 Statistical analysis . . . . . . . . . . . . . . . . . . . . . . . . . . . . . . 86
6.3.4 Results . . . . . . . . . . . . . . . . . . . . . . . . . . . . . . . . . . . . 87
6.4 Experiment II . . . . . . . . . . . . . . . . . . . . . . . . . . . . . . . . . . . . 91
6.4.1 Participants . . . . . . . . . . . . . . . . . . . . . . . . . . . . . . . . . . 92
6.4.2 Experimental protocol . . . . . . . . . . . . . . . . . . . . . . . . . . . . 92
6.4.3 Statistical analysis . . . . . . . . . . . . . . . . . . . . . . . . . . . . . . 92
6.4.4 Results . . . . . . . . . . . . . . . . . . . . . . . . . . . . . . . . . . . . 92
6.5 Limitations . . . . . . . . . . . . . . . . . . . . . . . . . . . . . . . . . . . . . . 93
6.6 Discussion and Conclusions . . . . . . . . . . . . . . . . . . . . . . . . . . . . . 93
6.7 Summary . . . . . . . . . . . . . . . . . . . . . . . . . . . . . . . . . . . . . . . 94
An evil gain equals a loss.
Syrus
In the Chapter 5 we presented a decentralized algorithm for an autonomous patrolling droneteam. However, there are some kind of missions that, for ethical or operational reasons, it iscompulsory to have a human being in the loop, working side-by-side with the robots.
81
However, decision making is a critical issue for humans cooperate with intelligent robots.Moreover, it is well admitted that many cognitive biases affect human judgments, leading tosuboptimal or irrational decisions. The framing effect is a typical cognitive bias causing people toreact differently depending on the context, the probability of the outcomes and how the problemis presented (loss vs. gain), as explained with more details in Chapter 2.
In this chapter, we present the results of framing effect experiments carried out in order tobetter understand the effects of human cognitive biases in operational contexts and to optimizeHRI. These results were reported in the conference paper P2 “Towards human-robot interaction:a framing effect experiment” presented at the IEEE International Conference on Systems, Man,and Cybernetics (SMC 2016).
6.1 Motivation
Human beings make daily decisions with limited time and incomplete information using a re-stricted cognitive budget. How could one be rational in those circumstances? What about in anemergency situation, when lives are at stake?
While classical models (such as expected utility theory) see human decision makers as un-failing machines with all knowledge needed and the eternity to decide in order to maximizecost-benefit decisions, other models try to avoid all human behavior complexity betting all theirchips in totally autonomy systems using Artificial Intelligence (AI). AI tries to model the waya human should think in perfect conditions in order to create a computer system that can per-form intelligent actions. On the other hand, Human-Computer Interaction (HCI) makes use ofcomputer interfaces to help human users in the execution of intelligent actions [Hea99].
In [Fon+05] it is argued that for humans and robots to work effectively together, they shouldcollaborate as peers instead of a “master-slave” relationship in space mission tasks, where, forseveral reasons (such as risk and cost mitigation) the human team must be kept small. In thisapproach, the robots can make their own decisions autonomously but query humans as needed.
Moreover, research suggests that when human decision-makers have to make critical de-cisions under uncertainty and imperfect information conditions or in situation where they areemotionally involved, like during natural disasters, emergencies, military operations or any otherunpredictable and diffuse environment, people are more susceptible to make predictable errors injudgment caused by cognitive biases [Kah11]. In order to overmatch these situations and remainadaptive and effective amid a complex and ambiguous environment, it is important to understandand deal with these hard-wired human processes [Kle97].
Hence, in order to better understand the framing effect on the human decision-making process
82
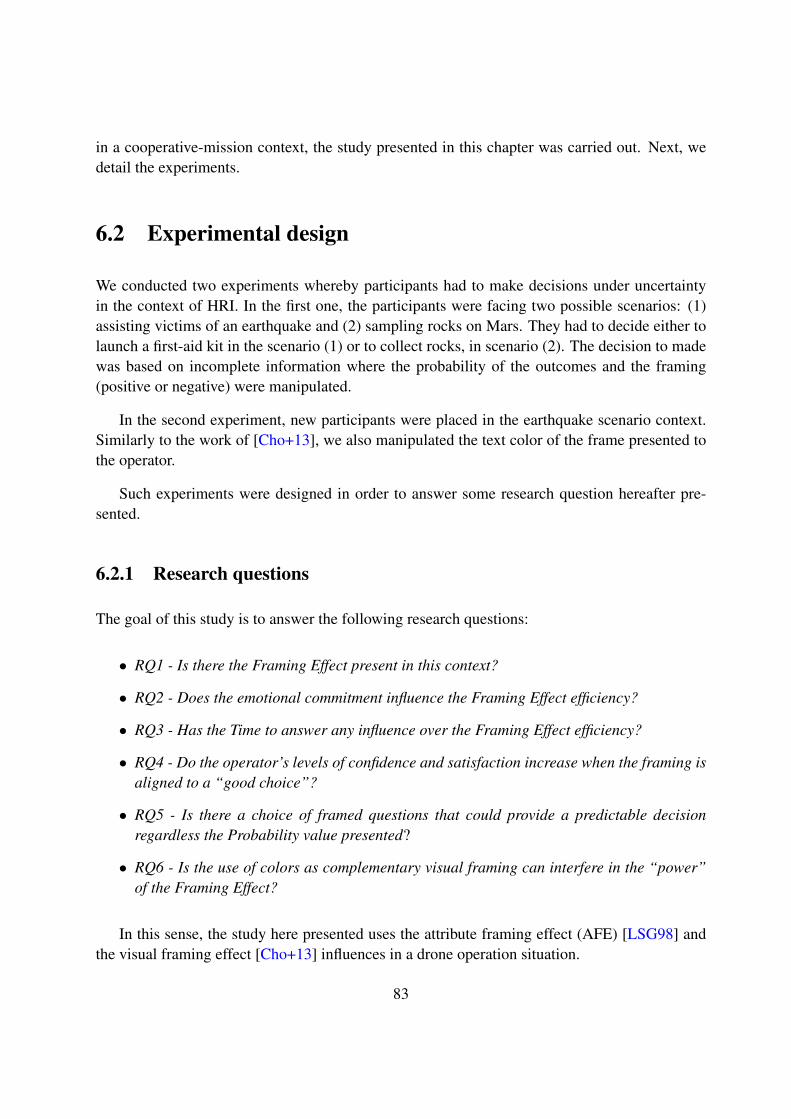
in a cooperative-mission context, the study presented in this chapter was carried out. Next, wedetail the experiments.
6.2 Experimental design
We conducted two experiments whereby participants had to make decisions under uncertaintyin the context of HRI. In the first one, the participants were facing two possible scenarios: (1)assisting victims of an earthquake and (2) sampling rocks on Mars. They had to decide either tolaunch a first-aid kit in the scenario (1) or to collect rocks, in scenario (2). The decision to madewas based on incomplete information where the probability of the outcomes and the framing(positive or negative) were manipulated.
In the second experiment, new participants were placed in the earthquake scenario context.Similarly to the work of [Cho+13], we also manipulated the text color of the frame presented tothe operator.
Such experiments were designed in order to answer some research question hereafter pre-sented.
6.2.1 Research questions
The goal of this study is to answer the following research questions:
• RQ1 - Is there the Framing Effect present in this context?
• RQ2 - Does the emotional commitment influence the Framing Effect efficiency?
• RQ3 - Has the Time to answer any influence over the Framing Effect efficiency?
• RQ4 - Do the operator’s levels of confidence and satisfaction increase when the framing isaligned to a “good choice”?
• RQ5 - Is there a choice of framed questions that could provide a predictable decisionregardless the Probability value presented?
• RQ6 - Is the use of colors as complementary visual framing can interfere in the “power”of the Framing Effect?
In this sense, the study here presented uses the attribute framing effect (AFE) [LSG98] andthe visual framing effect [Cho+13] influences in a drone operation situation.
83
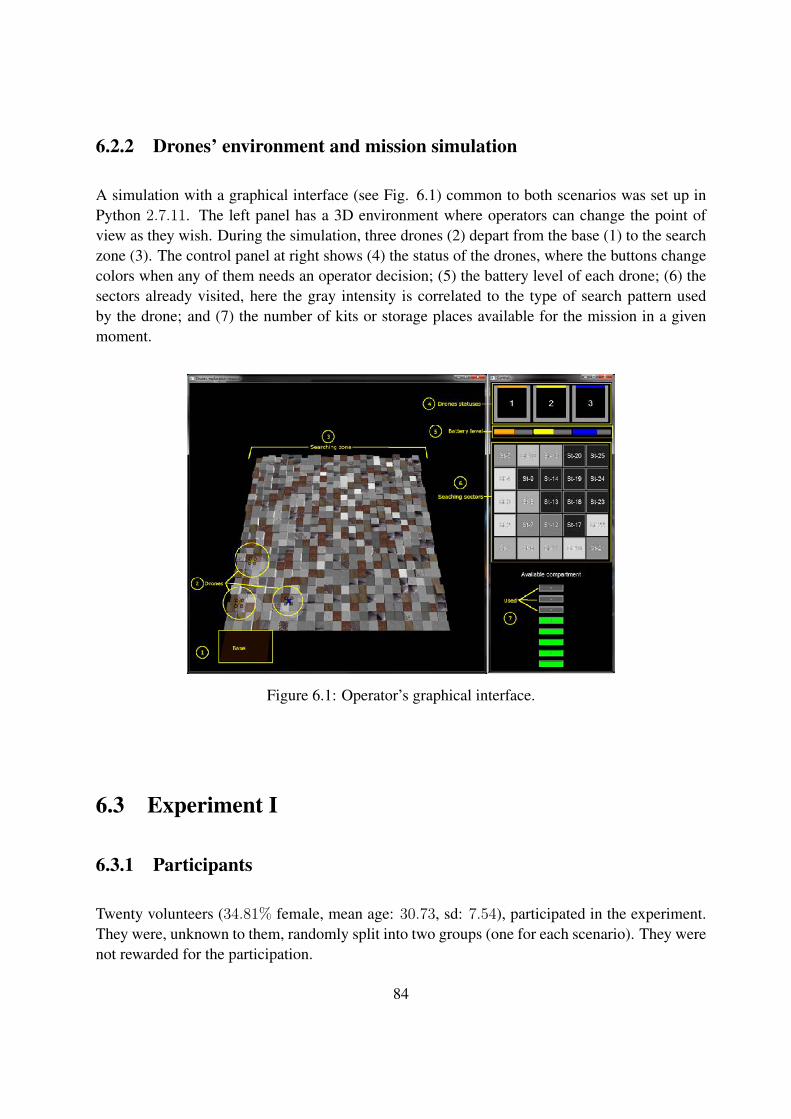
6.2.2 Drones’ environment and mission simulation
A simulation with a graphical interface (see Fig. 6.1) common to both scenarios was set up inPython 2.7.11. The left panel has a 3D environment where operators can change the point ofview as they wish. During the simulation, three drones (2) depart from the base (1) to the searchzone (3). The control panel at right shows (4) the status of the drones, where the buttons changecolors when any of them needs an operator decision; (5) the battery level of each drone; (6) thesectors already visited, here the gray intensity is correlated to the type of search pattern usedby the drone; and (7) the number of kits or storage places available for the mission in a givenmoment.
Figure 6.1: Operator’s graphical interface.
6.3 Experiment I
6.3.1 Participants
Twenty volunteers (34.81% female, mean age: 30.73, sd: 7.54), participated in the experiment.They were, unknown to them, randomly split into two groups (one for each scenario). They werenot rewarded for the participation.
84

6.3.2 Experimental protocol
Each participant randomly executed 10 missions (repetitions) for a given scenario (earthquake orMars rock sampling). Each mission had a duration of around three minutes. During the evolutionof a given mission, when the drones found something, 10 different types of sentences (2 types oftext frames × 5 levels of probabilities) were randomly presented and the operator was requestedto decide. For the probability levels low,middle-low, middle-high and high every two of thesentences had the same level of Probability, one with a positive framing and the other with anegative framing. The extreme levels were used as a “coherence check”: first, one sentence waspresented with a positive framing with an extreme low probability and, next, a negative framingsentence was presented with an extreme high probability, expecting a negative answer for both.The participants had 10 seconds to decide between say YES, i.e, take a positive action (releasea kit or collect a rock), or NO. After this time period, the drone who asked should considerthe operator’s decision as a NO. Thus, the only thing the operator had to do was to answer thequestions made by the drones by clicking in YES or NO on the pop-up window (Fig. 6.2).
Figure 6.2: Operator’s graphical interface.
Notice that, it was not possible to know the real result of every single mission, i.e., theoperator could not know how many victims were helped or “good” rocks were collected duringthe experiment.
85
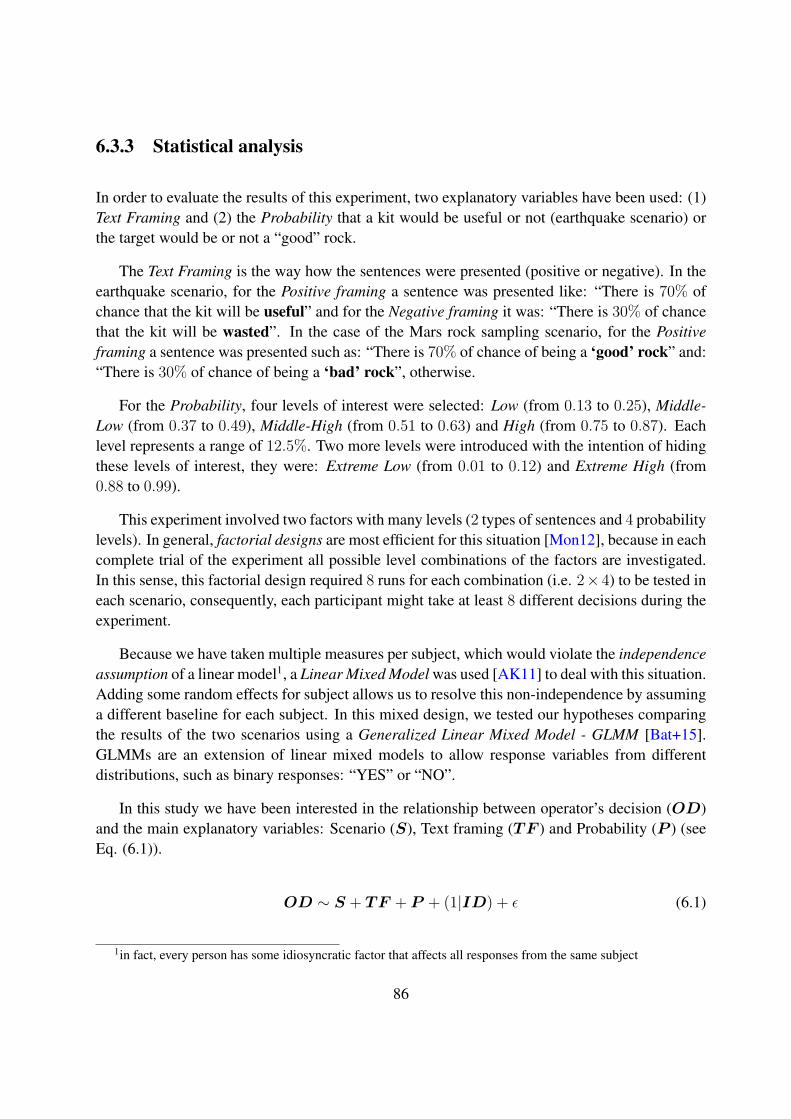
6.3.3 Statistical analysis
In order to evaluate the results of this experiment, two explanatory variables have been used: (1)Text Framing and (2) the Probability that a kit would be useful or not (earthquake scenario) orthe target would be or not a “good” rock.
The Text Framing is the way how the sentences were presented (positive or negative). In theearthquake scenario, for the Positive framing a sentence was presented like: “There is 70% ofchance that the kit will be useful” and for the Negative framing it was: “There is 30% of chancethat the kit will be wasted”. In the case of the Mars rock sampling scenario, for the Positiveframing a sentence was presented such as: “There is 70% of chance of being a ‘good’ rock” and:“There is 30% of chance of being a ‘bad’ rock”, otherwise.
For the Probability, four levels of interest were selected: Low (from 0.13 to 0.25), Middle-Low (from 0.37 to 0.49), Middle-High (from 0.51 to 0.63) and High (from 0.75 to 0.87). Eachlevel represents a range of 12.5%. Two more levels were introduced with the intention of hidingthese levels of interest, they were: Extreme Low (from 0.01 to 0.12) and Extreme High (from0.88 to 0.99).
This experiment involved two factors with many levels (2 types of sentences and 4 probabilitylevels). In general, factorial designs are most efficient for this situation [Mon12], because in eachcomplete trial of the experiment all possible level combinations of the factors are investigated.In this sense, this factorial design required 8 runs for each combination (i.e. 2× 4) to be tested ineach scenario, consequently, each participant might take at least 8 different decisions during theexperiment.
Because we have taken multiple measures per subject, which would violate the independenceassumption of a linear model1, a Linear Mixed Model was used [AK11] to deal with this situation.Adding some random effects for subject allows us to resolve this non-independence by assuminga different baseline for each subject. In this mixed design, we tested our hypotheses comparingthe results of the two scenarios using a Generalized Linear Mixed Model - GLMM [Bat+15].GLMMs are an extension of linear mixed models to allow response variables from differentdistributions, such as binary responses: “YES” or “NO”.
In this study we have been interested in the relationship between operator’s decision (OD)and the main explanatory variables: Scenario (S), Text framing (T F ) and Probability (P ) (seeEq. (6.1)).
OD ∼ S + T F + P + (1|ID) + ε (6.1)
1in fact, every person has some idiosyncratic factor that affects all responses from the same subject
86
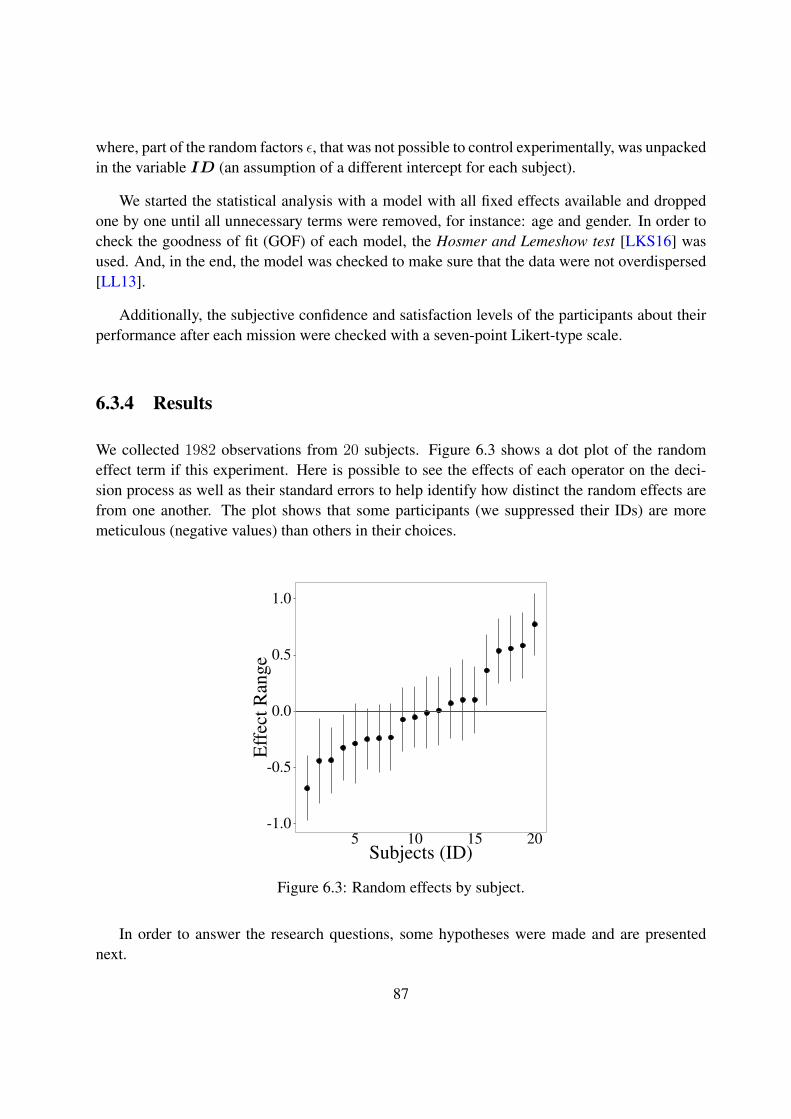
where, part of the random factors ε, that was not possible to control experimentally, was unpackedin the variable ID (an assumption of a different intercept for each subject).
We started the statistical analysis with a model with all fixed effects available and droppedone by one until all unnecessary terms were removed, for instance: age and gender. In order tocheck the goodness of fit (GOF) of each model, the Hosmer and Lemeshow test [LKS16] wasused. And, in the end, the model was checked to make sure that the data were not overdispersed[LL13].
Additionally, the subjective confidence and satisfaction levels of the participants about theirperformance after each mission were checked with a seven-point Likert-type scale.
6.3.4 Results
We collected 1982 observations from 20 subjects. Figure 6.3 shows a dot plot of the randomeffect term if this experiment. Here is possible to see the effects of each operator on the deci-sion process as well as their standard errors to help identify how distinct the random effects arefrom one another. The plot shows that some participants (we suppressed their IDs) are moremeticulous (negative values) than others in their choices.
-1.0
-0.5
0.0
0.5
1.0
5 10 15 20Subjects (ID)
Eff
ectR
ange
Figure 6.3: Random effects by subject.
In order to answer the research questions, some hypotheses were made and are presentednext.
87
6.3.4.1 Hypothesis H1
To answer the first research question (RQ1), which was “Is the Framing Effect present in thiscontext?”, we elaborated the following hypothesis:
• H1A2: The operators’ decision are different, in a similar situation, according to the equiv-alent version of the choice presented, a negative or a positive one.
Here, there is a significant difference (Positive : Estimate = 0.355, sd = 0.098, z =3.621, p = 0.0002) between positive (e.g., “There is 45% of chance that the kit will be useful”)and negative framing (e.g., “There is 55% of chance that the kit will be wasted”) in a GLMM3
analysis. The p value indicates that we would reject the null hypothesis H10 in favor of H1A. Inthis sense, we can confirm the presence of the FE in the experiment.
6.3.4.2 Hypothesis H2
Looking to RQ2: Does the emotional commitment influence the FE efficiency?, another hypoth-esis was defined:
• H2A : The positive frame will be more effective in situations of emotional commitment(first scenario).
Results of the GLMM analysis show that there is a significant difference between the twoscenarios (Mars : Estimate = −0.475, sd = 0.233, z = −2.034, p = 0.042). The negativeestimated value (−0.475) refers to the Mars scenario and suggests that people are willing to takemore risks when they are emotionally involved (Earthquake scenario). Figure 6.4 shows theinfluences of Text framing and Scenario variables in the operators’ decisions. The differenceof behavior between the two scenarios demonstrates that the participants appeared to take morerisks (saying YES even with low probabilities) when they were thinking about saving lives. Thepositive frame, in contrast with the negative one, was more effective in the earthquake scenario,confirming H2A.
6.3.4.3 Hypothesis H3
In relation to the time to answer influence on the framing efficiency (RQ3), the following hy-pothesis was analyzed:
2The subscript “A” represents the alternative hypothesis, in contrast with the null hypothesis “0”.3Generalized linear mixed model
88

Negative Positive
No Yes No Yes21
23
25
27
Operators’ decisions
Mea
n ScenarioMarsEarth
Figure 6.4: Average operators’ decisions in function of the Text framing and the Scenario
• H3A : The more time is devoted to answering a question the less effective is the FE.
In general when the participants answered not in accordance with the framing presented(e.g., saying NO after the sentence “There is 30% of chance that the kit will be useful”) theyexpended more time than otherwise (Estimate = −0.065, sd = 0.030, z = −2.154, p = 0.031),indicating that we should accept H3A. Maybe here they were using the analytical thinking modeinstead of the intuitive one.
6.3.4.4 Hypothesis H4
For the purpose of observing the satisfaction and confidence levels in function of the operators’decisions (RQ4), we defined the following hypothesis:
• H4A : The operators’ subjective levels of Confidence and Satisfaction will increase whenthey believe that they made the best choice possible in a given situation.
Figure 6.5 shows those levels according to the number of positive actions executed (to releasea first aid kit or to collect a rock). This criterion was used because, as already said before, it wasnot possible to know the results of the operators’ actions (if they really helped some victims or
89
collected some “good” rocks, respectively) at the end of every single mission. It is possible tosee a significant correlation between these factors and their actions (Likelihood Ratio Test - LRT:Satisfaction: χ2(2) = 266.47, p < 0.0001 and Confidence: χ2(1) = 196.58, p < 0.0001), whichindicates that we should reject H40 in favor of H4A.
1
2
3
4
5
6
7
1 2 3 4 5 6 7 8Positive actions
Satis
fact
ion
2345median
1
2
3
4
5
6
7
1 2 3 4 5 6 7 8Positive actions
Con
fiden
ce3456median
Figure 6.5: Satisfaction and confidence subjective levels in function of the operator’s positiveactions
6.3.4.5 Hypothesis H5
In order to answer RQ5: “Is there a choice of framed question that could provide a predictabledecision regardless the Probability value presented?", another hypothesis was proposed:
• H5A : The higher the Probability value more the operator will be willing to say “YES” forthe Positive framing and “NO” otherwise.
Looking to Figure 6.6, it is apparent that H5A is corroborated. Moreover, the negative fram-ing could not overcome the emotional effect, that influences participants to be more risky, presentin the earthquake scenario.
As expected, the attribute framing is only effective around the value of 50%, where there is ahigh level of uncertainty. Thus, the answer for the research question is “no”, there is not a choiceof framed questions that could provide a predictable decision regardless of the probability value.
90
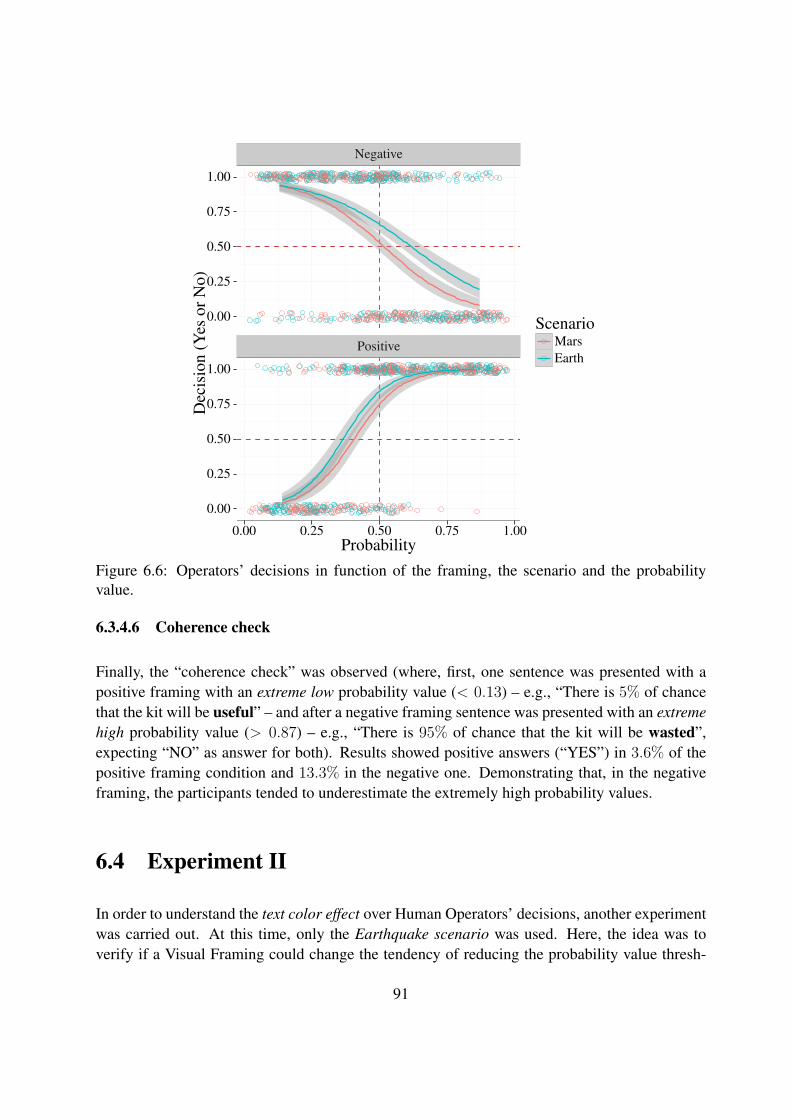
Negative
Positive
0.00
0.25
0.50
0.75
1.00
0.00
0.25
0.50
0.75
1.00
0.00 0.25 0.50 0.75 1.00Probability
Dec
isio
n(Y
esor
No)
ScenarioMarsEarth
Figure 6.6: Operators’ decisions in function of the framing, the scenario and the probabilityvalue.
6.3.4.6 Coherence check
Finally, the “coherence check” was observed (where, first, one sentence was presented with apositive framing with an extreme low probability value (< 0.13) – e.g., “There is 5% of chancethat the kit will be useful” – and after a negative framing sentence was presented with an extremehigh probability value (> 0.87) – e.g., “There is 95% of chance that the kit will be wasted”,expecting “NO” as answer for both). Results showed positive answers (“YES”) in 3.6% of thepositive framing condition and 13.3% in the negative one. Demonstrating that, in the negativeframing, the participants tended to underestimate the extremely high probability values.
6.4 Experiment II
In order to understand the text color effect over Human Operators’ decisions, another experimentwas carried out. At this time, only the Earthquake scenario was used. Here, the idea was toverify if a Visual Framing could change the tendency of reducing the probability value thresh-
91

old, probably caused by the emotional commitment (less than 50% - see Fig. 6.6), observed inExperiment I.
The graphical user interface was the same used in the precedent experiment (cf. Fig. 6.1).
6.4.1 Participants
Twelve individuals (16.67% female, mean age: 24.75, sd: 4.89), all volunteers, participated inthe experiment. The participants were, unknown to them, randomly split into two groups: (1) acontrol group with the texts written in black and (2) an experimental group with colored texts:GREEN - for a POSITIVE Text framing with a probability OVER 60% or for a NEGATIVE Textframing with a probability UNDER 60% and RED, otherwise. They were not rewarded for theparticipation.
6.4.2 Experimental protocol
Each participant randomly executed two missions, each one with 10 different types of sentences(2 types of text frames × 5 levels of probabilities). They were not previously informed about theexistence of different colors in the text presented.
6.4.3 Statistical analysis
Similarly to the first experiment, in order to evaluate the results and to study the Human Opera-tors’ decisions (OD) we used a Generalized Linear Mixed Model - GLMM, where the inherentdifference of each participant (ID) was used as a “random effect” and for the “fixed effect”variables were selected: Text framing (T F ), the Probability (P ) that a kit would be useful or notand Visual framing (V F ) that put colors (red or green) on the text (see Eq. (6.2)).
OD ∼ T F + P + V F + (1|ID) + ε (6.2)
6.4.4 Results
We collected 240 observations from 12 participants. Likewise in Experiment I, one last hypoth-esis was made.
92
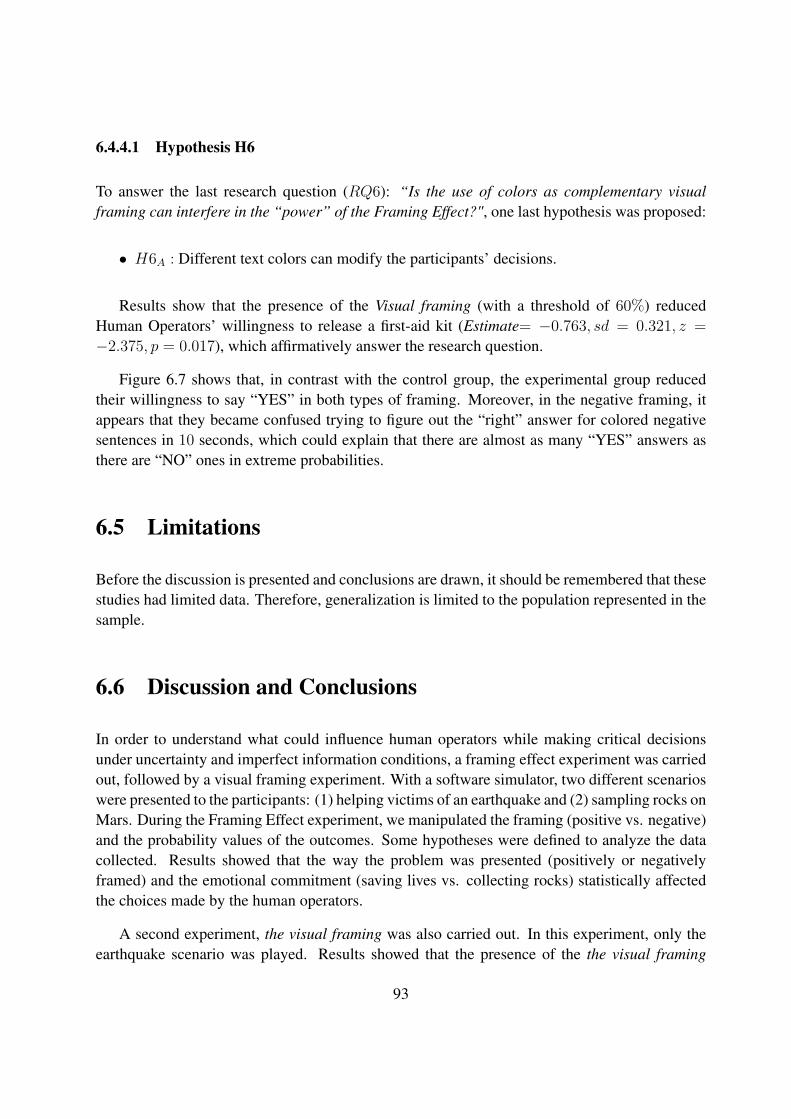
6.4.4.1 Hypothesis H6
To answer the last research question (RQ6): “Is the use of colors as complementary visualframing can interfere in the “power” of the Framing Effect?", one last hypothesis was proposed:
• H6A : Different text colors can modify the participants’ decisions.
Results show that the presence of the Visual framing (with a threshold of 60%) reducedHuman Operators’ willingness to release a first-aid kit (Estimate= −0.763, sd = 0.321, z =−2.375, p = 0.017), which affirmatively answer the research question.
Figure 6.7 shows that, in contrast with the control group, the experimental group reducedtheir willingness to say “YES” in both types of framing. Moreover, in the negative framing, itappears that they became confused trying to figure out the “right” answer for colored negativesentences in 10 seconds, which could explain that there are almost as many “YES” answers asthere are “NO” ones in extreme probabilities.
6.5 Limitations
Before the discussion is presented and conclusions are drawn, it should be remembered that thesestudies had limited data. Therefore, generalization is limited to the population represented in thesample.
6.6 Discussion and Conclusions
In order to understand what could influence human operators while making critical decisionsunder uncertainty and imperfect information conditions, a framing effect experiment was carriedout, followed by a visual framing experiment. With a software simulator, two different scenarioswere presented to the participants: (1) helping victims of an earthquake and (2) sampling rocks onMars. During the Framing Effect experiment, we manipulated the framing (positive vs. negative)and the probability values of the outcomes. Some hypotheses were defined to analyze the datacollected. Results showed that the way the problem was presented (positively or negativelyframed) and the emotional commitment (saving lives vs. collecting rocks) statistically affectedthe choices made by the human operators.
A second experiment, the visual framing was also carried out. In this experiment, only theearthquake scenario was played. Results showed that the presence of the the visual framing
93
Positive
Negative
0.0 0.4 0.8 1.2
0.0
0.4
0.8
0.0
0.4
0.8
Probability
Dec
isio
n(Y
esor
No)
ExperimentalCondition
Black (Control)With colors
Figure 6.7: Operators’ decisions in function of the ‘text’ and ‘visual’ framing
changed the average preference of the participants in say “YES” according to the probabilityvalue presented.
6.7 Summary
Decision making is a critical issue for humans cooperate with intelligent robots. Moreover,it is well admitted that many cognitive biases affect human judgments, leading to suboptimalor irrational decisions. The framing effect is a typical cognitive bias causing people to reactdifferently depending on the context, the probability of the outcomes and how the problem is
94

presented (loss vs. gain).
We recall that the aim of this study is to better understand the influences of the framing effectin operational contexts to optimize human-robot interactions.
Here, we conducted an experiment involving a framing paradigm in a search and rescuemission (earthquake) and in a Mars sample-return mission. We manipulated the framing (positivevs. negative), the probability of the outcomes and the text colors (visual framing). Statisticalanalyses were made.
Our findings revealed that the way the problem was presented (positively or negatively framed),the emotional commitment (saving lives vs. collecting the good rock) and the text colors statis-tically affected the choices made by the human operators.
The main contributions of this study were:
• CH-4 – the observation of the FE in this context;
• CH-5 – the emotional commitment influence in the FE efficiency;
• CH-6 – the time-to-answer influence in the FE efficiency;
• CH-7 – the interference of the use of colors, as complementary visual framing, in the“power” of the FE.
In the next chapters we will take into account these cognitive biases, using PT as a predictorof HO’s decisions, to set the utility functions of the drones and to adapt dynamically HRI byautomatically choosing which framing should be presented to the HO in order to maximize thechance the HO take an aligned decision regarding a mathematical criterion – expected value orcost – when performing the actions.
95

CHAPTER 7
The human utility
Contents7.1 Motivation . . . . . . . . . . . . . . . . . . . . . . . . . . . . . . . . . . . . . . 98
7.2 Personal utility model . . . . . . . . . . . . . . . . . . . . . . . . . . . . . . . . 98
7.2.1 HO’s intrinsic consumption utility . . . . . . . . . . . . . . . . . . . . . . 98
7.2.2 The gain-loss utility . . . . . . . . . . . . . . . . . . . . . . . . . . . . . 99
7.2.3 Proposed personal utility (Ψ) . . . . . . . . . . . . . . . . . . . . . . . . . 99
7.3 Previous Experiment . . . . . . . . . . . . . . . . . . . . . . . . . . . . . . . . 100
7.3.1 Statistical results based on the previous experimental data . . . . . . . . . 100
7.4 Proposed Prospect theory model . . . . . . . . . . . . . . . . . . . . . . . . . . 101
7.4.1 Approximating the gain-loss utility . . . . . . . . . . . . . . . . . . . . . 101
7.4.2 Generating the proposed personal utility (Ψ) . . . . . . . . . . . . . . . . 104
7.4.3 Evaluation of the model . . . . . . . . . . . . . . . . . . . . . . . . . . . 105
7.5 Discussion . . . . . . . . . . . . . . . . . . . . . . . . . . . . . . . . . . . . . . 106
7.6 Conclusion . . . . . . . . . . . . . . . . . . . . . . . . . . . . . . . . . . . . . . 107
7.7 Summary . . . . . . . . . . . . . . . . . . . . . . . . . . . . . . . . . . . . . . . 107
...the rarest of all human qualities isconsistency.
Jeremy Bentham
In this chapter, we will look into ways and means of including the human agent as part ofthe team. In our approach, a drone has to calculate the optimum payoff (for the moment) andframe the information to share with HO in a way that maximizes the probability of HO to take adecision that leads to that common payoff. For that, it has to infer a “human utility” for makinguse of it (see Chap. 8).
97
7.1 Motivation
According to [TK86], the use of prescriptive models to predict and explain the human decision-making process has been defended by several arguments. In general, people attempt to be effec-tive in pursuing their goals. Then, it appears to make sense to describe choice as a maximizationprocess. But, descriptive alternatives have shown violations in those theories. [TK86] arguesthat these deviations are too big to be ignored and suggests that, when people have to make de-cisions under imperfect information conditions, they are more likely to make predictable errorsin judgment caused by cognitive biases. This is true mainly in situations where they are emo-tionally involved, as for instance, during space missions, emergencies, natural disasters, militaryoperations or any other complex situation.
In this sense, rather than idealizing the conditions of the human decision-making process,descriptive theories permit to better understand the internal process people use when makingdecisions. Hence, here we based our research on the Prospect theory (PT) [KT79]; [TK92]to consider human’s cognitive biases, in particular, the framing effect (FE), in order to learn afunction that fit (and help to predict) the HO utility.
7.2 Personal utility model
In order to calculate the utility function for HO, the Prospect Theory (PT) was used. Following,based on Equation 3.6, is presented our estimation for the intrinsic consumption utility, m(c),and the gain-loss function, n(c|r), terms. This step should allow us to define a personal utilityfunction as proposed by Koszegi and Robin [KR06] (see Section 3.5).
7.2.1 HO’s intrinsic consumption utility
According to our hypothesis, HO has two personal goods: the belief that her action could resultin a good job h ∈ 0, 1 (e.g., helping victims or not – earthquake scenario – and collectingor not rocks on Mars) and the perceived ownership value of an asset (pov ∈ R) at a givenmoment. Hence, she has a bidimensional consumption bundle c = (h, pov). Note that, HO hasto face conflicted emotions to decide: if she says YES, she wins the satisfaction (gain) of doinga good action (h+, i.e. h = 1 in our case) against the probability (p) of loosing a precious asset.Otherwise, if she says NO, she can save the asset for a better future opportunity, but with therisk (1 − p) of living behind a victim (in a SAR mission) or a wanted rock (in a sample-returnmission) – h−, i.e. h = 0.
In this cost-benefit dilemma, supposing that HO wanted to do a good work, for instance by
98
doing a positive action (say YES) in function of her consumption bundles, the function m(c)could be defined in this application case as:
m(c) =
(h+ − pov) · p, for a positive action
(pov − h−) · (1− p), for a negative action(7.1)
where p is a given objective probability value, or the presented one, for instance.
7.2.2 The gain-loss utility
Following Equations (3.6) and (3.7) the term n(c|r) = µ(m(c) +m(r)) represents the gain–lossutility, that should be in this study in accordance with PT (cf. Section 3.5). For this propose,we need to define the weighting w(·) and the perceived value pv(·) functions that are necessarilyfollowing Equation (3.4).
n(c|r) =
(h+ − γ · pov) · w+(p), for a positive action
(pov − γ · h−) · w−(1− p), for a negative action(7.2)
7.2.3 Proposed personal utility (Ψ)
Supposing again that HO wanted to do a good work, according to Equation (3.6), her personalutility Ψ(·) will depends on if she made a positive action (say YES) or not. In this sense, one candefine Ψ(·) as follows:
Ψ(c|r) =
ψ+(h+, pov, p), for a positive action, and
ψ−(h−, pov, p), for a negative action(7.3)
with,ψ+(h+, pov, p) = (h+ − pov) · p+ (h+ − λ · pov) · w+(p) (7.4)
and,ψ−(h−, pov, p) = (pov − h−) · (1− p) + (pov − λ · h−) · w−(1− p) (7.5)
where p is the current objective probability,w(·) is a subjective probability weighting functionand λ > 1 is the loss-aversion coefficient (see Sec. 3.5).
Supposing that HO would maximize her personal utility Ψ(·), one can link an HO’s decision
99
to her Ψ(·) by means of a maximization operator, and so predicting HO’s decision, a positive(pos) or a negative (neg) action, as follows:
φ(h, p) = arg maxneg,pos
(ψ−(h−, pov, p), ψ+(h+, pov, p)) (7.6)
Such a decision criterion should select which framing should be shown to HO in order tomaximize the chance of having an appropriated decision, i.e., a decision aligned with the opera-tional guidelines.
7.3 Previous Experiment
Based on data collected the experiment described in Section 6.3, a different statistical study isproposed here, in order to observe the utility function for gains and losses and the FE influenceover the decision taken by the human operator (HO) in two different scenarios: (1) helpingvictims of an earthquake and (2) collecting rocks on Mars.
7.3.1 Statistical results based on the previous experimental data
In this study we have been interested in the relationship between HO’s decision (OD) and themain explanatory variables: Scenario (S), Text framing (T F ), Probability (P ) and used Assets(A) (see Eq. (7.7)). A was introduced in the statistical model to determine the HO Referencepoint (according to PT, see Sec. 7.4) and when she considered the action either as a gain or asa loss. First of all, the random factors ε, that was not possible to control experimentally, wereunpacked in two different variables: ID and Seq. The first one referred to the assumption of adifferent intercept for each subject and the second one referred to the sequence of the missions,which were shuffled for each subject, all the others “stochastic” differences have remained in theerror term ε.
OD ∼ S + T F + P + A + (1|ID) + (1|Seq) + ε (7.7)
Table 7.1 shows the estimated coefficients and errors of the GLMM. Here, the positive valueof an estimated coefficient denotes that the condition increases the preference in saying “YES”and vice-versa.
100

Table 7.1: GLMM summary
Dependent variable:
Decision (OD)
Earthquake (S) 0.323∗
(0.192)
Positive frame (TF) 0.252∗∗
(0.127)
Probability (P) 0.731∗∗∗
(0.279)
Asset (A) 0.311∗∗∗
(0.042)
Intercept −0.938∗∗∗
(0.235)
Log Likelihood −735.662Akaike Inf. Crit. 1,485.324Bayesian Inf. Crit. 1,520.955
Note: ∗p<0.1; ∗∗p<0.05; ∗∗∗p<0.01
7.4 Proposed Prospect theory model
In a first step and based in these previously collected data, PT was explored in order to model theHO’s utility. In a second step, we proposed a model, based in a decisional mathematical criterion,used to decide how to frame a question to HO, which should predict, or at least maximize thechances to induce the desired decision from her in such operational scenario.
7.4.1 Approximating the gain-loss utility
Considering Equations (3.6) and (3.7) the term n(c|r) = µ(m(c) + m(r)) (from [KR06]) repre-sents the gain–loss utility, that should be in this study in accordance with PT (cf. Section 3.5).For this propose, we defined the weighting w(.) and the perceived value pv(·) functions, fittingall parameters to the ones previously presented in Eq. (3.4).
101
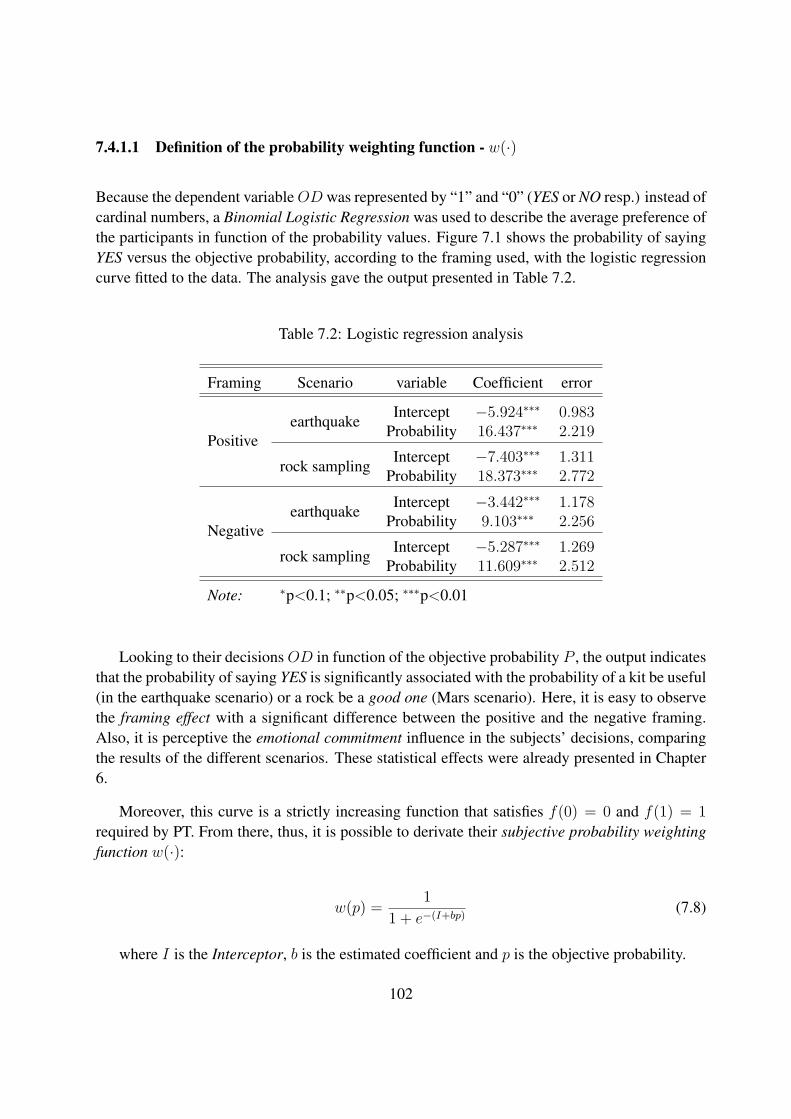
7.4.1.1 Definition of the probability weighting function - w(·)
Because the dependent variableOD was represented by “1” and “0” (YES or NO resp.) instead ofcardinal numbers, a Binomial Logistic Regression was used to describe the average preference ofthe participants in function of the probability values. Figure 7.1 shows the probability of sayingYES versus the objective probability, according to the framing used, with the logistic regressioncurve fitted to the data. The analysis gave the output presented in Table 7.2.
Table 7.2: Logistic regression analysis
Framing Scenario variable Coefficient error
Positiveearthquake
Intercept −5.924∗∗∗ 0.983Probability 16.437∗∗∗ 2.219
rock samplingIntercept −7.403∗∗∗ 1.311
Probability 18.373∗∗∗ 2.772
Negativeearthquake
Intercept −3.442∗∗∗ 1.178Probability 9.103∗∗∗ 2.256
rock samplingIntercept −5.287∗∗∗ 1.269
Probability 11.609∗∗∗ 2.512
Note: ∗p<0.1; ∗∗p<0.05; ∗∗∗p<0.01
Looking to their decisionsOD in function of the objective probability P , the output indicatesthat the probability of saying YES is significantly associated with the probability of a kit be useful(in the earthquake scenario) or a rock be a good one (Mars scenario). Here, it is easy to observethe framing effect with a significant difference between the positive and the negative framing.Also, it is perceptive the emotional commitment influence in the subjects’ decisions, comparingthe results of the different scenarios. These statistical effects were already presented in Chapter6.
Moreover, this curve is a strictly increasing function that satisfies f(0) = 0 and f(1) = 1required by PT. From there, thus, it is possible to derivate their subjective probability weightingfunction w(·):
w(p) = 11 + e−(I+bp) (7.8)
where I is the Interceptor, b is the estimated coefficient and p is the objective probability.
102
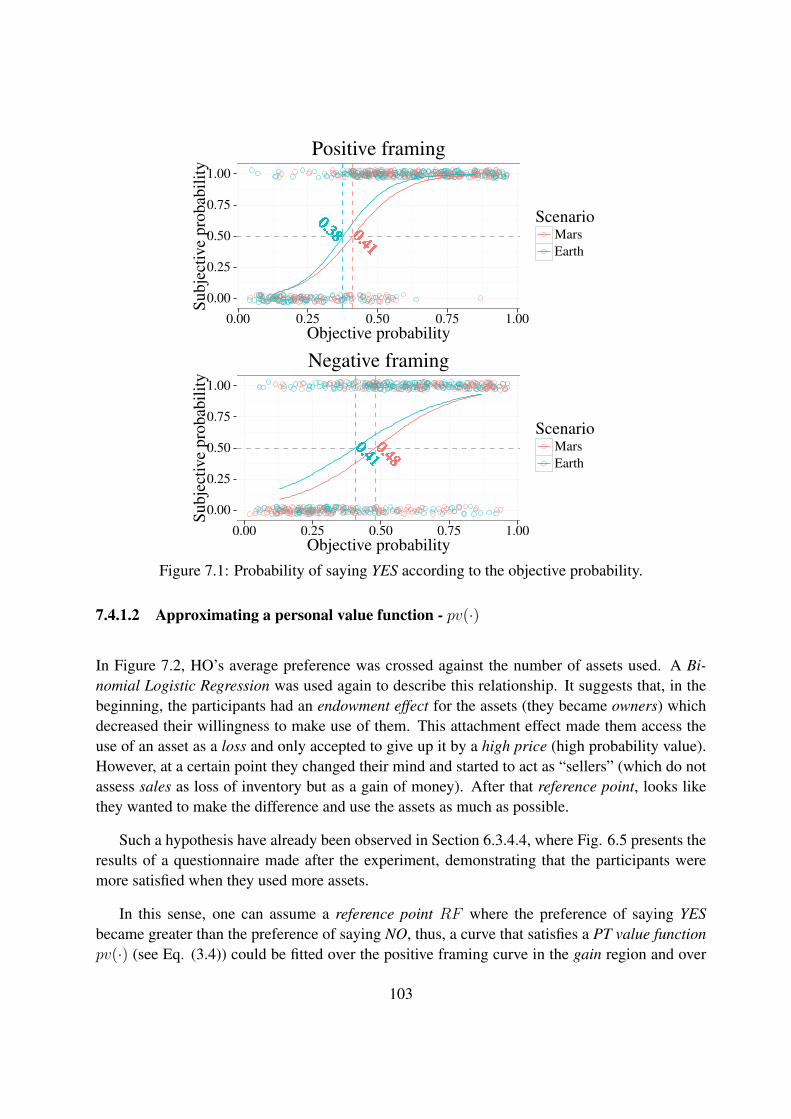
0.380.380.380.380.380.380.380.380.380.380.380.380.380.380.380.380.380.380.380.380.380.380.380.380.380.380.380.380.380.380.380.380.380.380.380.380.380.380.380.380.380.380.380.380.380.380.380.380.380.380.380.380.380.380.380.380.380.380.380.380.380.380.380.380.380.380.380.380.380.380.380.380.380.380.380.380.380.380.380.380.380.380.380.380.380.380.380.380.380.380.380.380.380.380.380.380.380.380.380.380.380.380.380.380.380.380.380.380.380.380.380.380.380.380.380.380.380.380.380.380.380.380.380.380.380.380.380.380.380.380.380.380.380.380.380.380.380.380.380.380.380.380.380.380.380.380.380.380.380.380.380.380.380.380.380.380.380.380.380.380.380.380.380.380.380.380.380.380.380.380.380.380.380.380.380.380.380.380.380.380.380.380.380.380.380.380.380.380.380.380.380.380.380.380.380.380.380.380.380.380.380.380.380.380.380.380.380.380.380.380.380.380.380.380.380.380.380.380.380.380.380.380.380.380.380.380.380.380.380.380.380.380.380.380.380.380.380.380.380.380.380.380.380.380.380.380.380.380.380.380.380.380.380.380.380.380.380.380.380.380.380.380.380.380.380.380.380.380.380.380.380.380.380.380.380.380.380.380.380.380.380.380.380.380.380.380.380.380.380.380.380.380.380.380.380.380.380.380.380.380.380.380.380.380.380.380.380.380.380.380.380.380.380.380.380.380.380.380.380.380.380.380.380.380.380.380.380.380.380.380.380.380.380.380.380.380.380.380.380.380.380.380.380.380.380.380.380.380.380.380.380.380.380.380.380.380.380.380.380.380.380.380.380.380.380.380.380.380.380.380.380.380.380.380.380.380.380.380.380.380.380.380.380.380.380.380.380.380.380.380.380.380.380.380.380.380.380.380.380.380.380.380.380.380.380.380.380.380.380.380.380.380.380.380.380.380.380.380.380.380.380.380.380.380.380.380.380.380.380.380.380.380.380.380.380.380.380.380.380.380.380.380.380.380.380.380.380.380.380.380.380.380.380.380.380.380.380.380.380.380.380.380.380.380.380.380.380.380.380.380.380.380.380.380.380.380.380.380.380.380.380.380.380.380.380.380.380.380.380.380.380.380.380.380.380.380.380.380.380.380.380.380.380.380.380.380.380.380.380.380.380.380.380.380.380.380.380.380.380.380.380.380.380.380.380.380.380.380.380.380.380.380.380.380.380.380.380.380.380.380.380.380.380.380.380.380.380.380.380.380.380.380.380.380.380.380.380.380.380.380.380.380.380.380.380.380.380.380.380.380.380.380.380.380.380.380.380.380.380.380.380.380.380.380.380.380.380.380.380.380.380.380.380.380.380.380.380.380.380.38 0.41
0.410.410.410.410.410.410.410.410.410.410.410.410.410.410.410.410.410.410.410.410.410.410.410.410.410.410.410.410.410.410.410.410.410.410.410.410.410.410.410.410.410.410.410.410.410.410.410.410.410.410.410.410.410.410.410.410.410.410.410.410.410.410.410.410.410.410.410.410.410.410.410.410.410.410.410.410.410.410.410.410.410.410.410.410.410.410.410.410.410.410.410.410.410.410.410.410.410.410.410.410.410.410.410.410.410.410.410.410.410.410.410.410.410.410.410.410.410.410.410.410.410.410.410.410.410.410.410.410.410.410.410.410.410.410.410.410.410.410.410.410.410.410.410.410.410.410.410.410.410.410.410.410.410.410.410.410.410.410.410.410.410.410.410.410.410.410.410.410.410.410.410.410.410.410.410.410.410.410.410.410.410.410.410.410.410.410.410.410.410.410.410.410.410.410.410.410.410.410.410.410.410.410.410.410.410.410.410.410.410.410.410.410.410.410.410.410.410.410.410.410.410.410.410.410.410.410.410.410.410.410.410.410.410.410.410.410.410.410.410.410.410.410.410.410.410.410.410.410.410.410.410.410.410.410.410.410.410.410.410.410.410.410.410.410.410.410.410.410.410.410.410.410.410.410.410.410.410.410.410.410.410.410.410.410.410.410.410.410.410.410.410.410.410.410.410.410.410.410.410.410.410.410.410.410.410.410.410.410.410.410.410.410.410.410.410.410.410.410.410.410.410.410.410.410.410.410.410.410.410.410.410.410.410.410.410.410.410.410.410.410.410.410.410.410.410.410.410.410.410.410.410.410.410.410.410.410.410.410.410.410.410.410.410.410.410.410.410.410.410.410.410.410.410.410.410.410.410.410.410.410.410.410.410.410.410.410.410.410.410.410.410.410.410.410.410.410.410.410.410.410.410.410.410.410.410.410.410.410.410.410.410.410.410.410.410.410.410.410.410.410.410.410.410.410.410.410.410.410.410.410.410.410.410.410.410.410.410.410.410.410.410.410.410.410.410.410.410.410.410.410.410.410.410.410.410.410.410.410.410.410.410.410.410.410.410.410.410.410.410.410.410.410.410.410.410.410.410.410.410.410.410.410.410.410.410.410.410.410.410.410.410.410.410.410.410.410.410.410.410.410.410.410.410.410.410.410.410.410.410.410.410.410.410.410.410.410.410.410.410.410.410.410.410.410.410.410.410.410.410.410.410.410.410.410.410.410.410.410.410.410.410.410.410.410.410.410.410.410.410.410.410.410.410.410.410.410.410.410.410.410.410.410.410.410.410.410.410.410.410.410.410.410.410.410.410.410.410.410.410.410.410.410.410.410.410.410.410.410.410.410.410.410.410.410.410.410.410.410.41
0.00
0.25
0.50
0.75
1.00
0.00 0.25 0.50 0.75 1.00Objective probability
Subj
ectiv
epr
obab
ility
ScenarioMarsEarth
Positive framing
0.410.410.410.410.410.410.410.410.410.410.410.410.410.410.410.410.410.410.410.410.410.410.410.410.410.410.410.410.410.410.410.410.410.410.410.410.410.410.410.410.410.410.410.410.410.410.410.410.410.410.410.410.410.410.410.410.410.410.410.410.410.410.410.410.410.410.410.410.410.410.410.410.410.410.410.410.410.410.410.410.410.410.410.410.410.410.410.410.410.410.410.410.410.410.410.410.410.410.410.410.410.410.410.410.410.410.410.410.410.410.410.410.410.410.410.410.410.410.410.410.410.410.410.410.410.410.410.410.410.410.410.410.410.410.410.410.410.410.410.410.410.410.410.410.410.410.410.410.410.410.410.410.410.410.410.410.410.410.410.410.410.410.410.410.410.410.410.410.410.410.410.410.410.410.410.410.410.410.410.410.410.410.410.410.410.410.410.410.410.410.410.410.410.410.410.410.410.410.410.410.410.410.410.410.410.410.410.410.410.410.410.410.410.410.410.410.410.410.410.410.410.410.410.410.410.410.410.410.410.410.410.410.410.410.410.410.410.410.410.410.410.410.410.410.410.410.410.410.410.410.410.410.410.410.410.410.410.410.410.410.410.410.410.410.410.410.410.410.410.410.410.410.410.410.410.410.410.410.410.410.410.410.410.410.410.410.410.410.410.410.410.410.410.410.410.410.410.410.410.410.410.410.410.410.410.410.410.410.410.410.410.410.410.410.410.410.410.410.410.410.410.410.410.410.410.410.410.410.410.410.410.410.410.410.410.410.410.410.410.410.410.410.410.410.410.410.410.410.410.410.410.410.410.410.410.410.410.410.410.410.410.410.410.410.410.410.410.410.410.410.410.410.410.410.410.410.410.410.410.410.410.410.410.410.410.410.410.410.410.410.410.410.410.410.410.410.410.410.410.410.410.410.410.410.410.410.410.410.410.410.410.410.410.410.410.410.410.410.410.410.410.410.410.410.410.410.410.410.410.410.410.410.410.410.410.410.410.410.410.410.410.410.410.410.410.410.410.410.410.410.410.410.410.410.410.410.410.410.410.410.410.410.410.410.410.410.410.410.410.410.410.410.410.410.410.410.410.410.410.410.410.410.410.410.410.410.410.410.410.410.410.410.410.410.410.410.410.410.410.410.410.410.410.410.410.410.410.410.410.410.410.410.410.410.410.410.410.410.410.410.410.410.410.410.410.410.410.410.410.410.410.410.410.410.410.410.410.410.410.410.410.410.410.410.410.410.410.410.410.410.410.410.410.410.410.410.410.410.410.410.410.410.410.410.410.410.410.410.410.410.410.410.410.410.410.410.410.410.410.410.410.410.410.410.410.410.410.410.410.410.410.410.410.410.410.410.410.410.410.41
0.480.480.480.480.480.480.480.480.480.480.480.480.480.480.480.480.480.480.480.480.480.480.480.480.480.480.480.480.480.480.480.480.480.480.480.480.480.480.480.480.480.480.480.480.480.480.480.480.480.480.480.480.480.480.480.480.480.480.480.480.480.480.480.480.480.480.480.480.480.480.480.480.480.480.480.480.480.480.480.480.480.480.480.480.480.480.480.480.480.480.480.480.480.480.480.480.480.480.480.480.480.480.480.480.480.480.480.480.480.480.480.480.480.480.480.480.480.480.480.480.480.480.480.480.480.480.480.480.480.480.480.480.480.480.480.480.480.480.480.480.480.480.480.480.480.480.480.480.480.480.480.480.480.480.480.480.480.480.480.480.480.480.480.480.480.480.480.480.480.480.480.480.480.480.480.480.480.480.480.480.480.480.480.480.480.480.480.480.480.480.480.480.480.480.480.480.480.480.480.480.480.480.480.480.480.480.480.480.480.480.480.480.480.480.480.480.480.480.480.480.480.480.480.480.480.480.480.480.480.480.480.480.480.480.480.480.480.480.480.480.480.480.480.480.480.480.480.480.480.480.480.480.480.480.480.480.480.480.480.480.480.480.480.480.480.480.480.480.480.480.480.480.480.480.480.480.480.480.480.480.480.480.480.480.480.480.480.480.480.480.480.480.480.480.480.480.480.480.480.480.480.480.480.480.480.480.480.480.480.480.480.480.480.480.480.480.480.480.480.480.480.480.480.480.480.480.480.480.480.480.480.480.480.480.480.480.480.480.480.480.480.480.480.480.480.480.480.480.480.480.480.480.480.480.480.480.480.480.480.480.480.480.480.480.480.480.480.480.480.480.480.480.480.480.480.480.480.480.480.480.480.480.480.480.480.480.480.480.480.480.480.480.480.480.480.480.480.480.480.480.480.480.480.480.480.480.480.480.480.480.480.480.480.480.480.480.480.480.480.480.480.480.480.480.480.480.480.480.480.480.480.480.480.480.480.480.480.480.480.480.480.480.480.480.480.480.480.480.480.480.480.480.480.480.480.480.480.480.480.480.480.480.480.480.480.480.480.480.480.480.480.480.480.480.480.480.480.480.480.480.480.480.480.480.480.480.480.480.480.480.480.480.480.480.480.480.480.480.480.480.480.480.480.480.480.480.480.480.480.480.480.480.480.480.480.480.480.480.480.480.480.480.480.480.480.480.480.480.480.480.480.480.480.480.480.480.480.480.480.480.480.480.480.480.480.480.480.480.480.480.480.480.480.480.480.480.480.480.480.480.480.480.480.480.480.480.480.480.480.480.480.480.480.480.480.480.480.480.480.480.480.480.480.480.480.480.480.480.480.480.480.480.480.480.480.480.480.480.480.48
0.00
0.25
0.50
0.75
1.00
0.00 0.25 0.50 0.75 1.00Objective probability
Subj
ectiv
epr
obab
ility
ScenarioMarsEarth
Negative framing
Figure 7.1: Probability of saying YES according to the objective probability.
7.4.1.2 Approximating a personal value function - pv(·)
In Figure 7.2, HO’s average preference was crossed against the number of assets used. A Bi-nomial Logistic Regression was used again to describe this relationship. It suggests that, in thebeginning, the participants had an endowment effect for the assets (they became owners) whichdecreased their willingness to make use of them. This attachment effect made them access theuse of an asset as a loss and only accepted to give up it by a high price (high probability value).However, at a certain point they changed their mind and started to act as “sellers” (which do notassess sales as loss of inventory but as a gain of money). After that reference point, looks likethey wanted to make the difference and use the assets as much as possible.
Such a hypothesis have already been observed in Section 6.3.4.4, where Fig. 6.5 presents theresults of a questionnaire made after the experiment, demonstrating that the participants weremore satisfied when they used more assets.
In this sense, one can assume a reference point RF where the preference of saying YESbecame greater than the preference of saying NO, thus, a curve that satisfies a PT value functionpv(·) (see Eq. (3.4)) could be fitted over the positive framing curve in the gain region and over
103
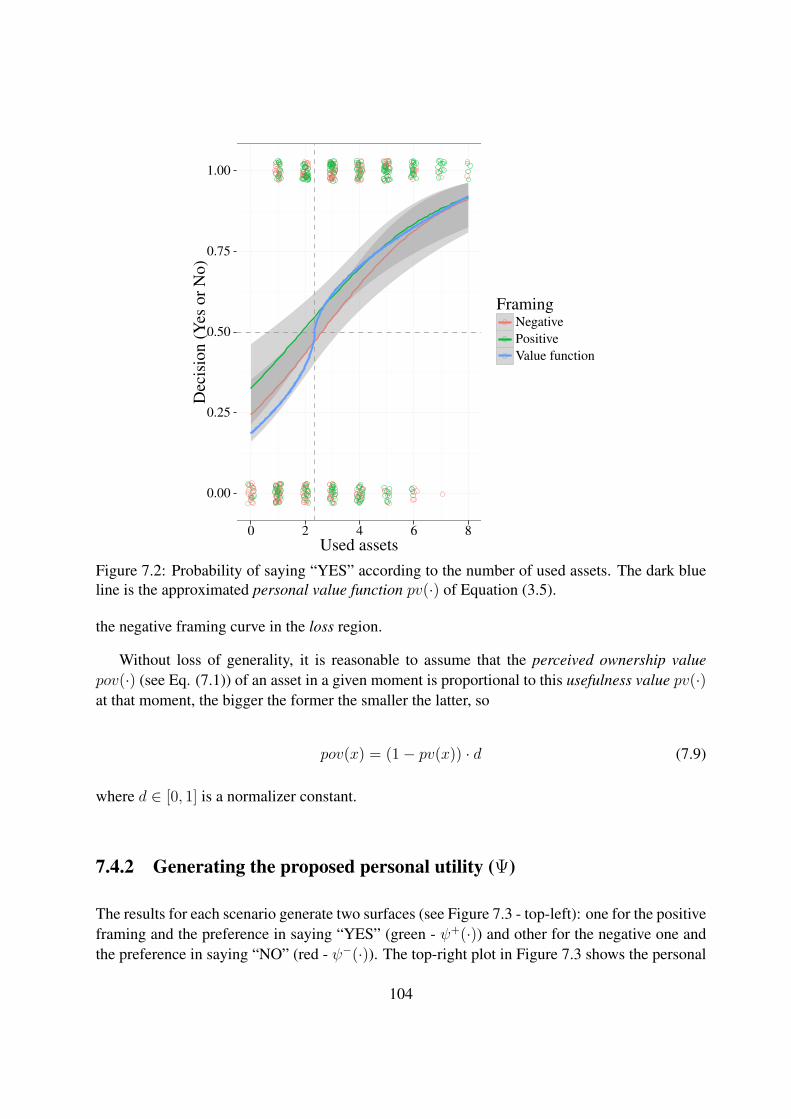
0.00
0.25
0.50
0.75
1.00
0 2 4 6 8Used assets
Dec
isio
n(Y
esor
No)
FramingNegativePositiveValue function
Figure 7.2: Probability of saying “YES” according to the number of used assets. The dark blueline is the approximated personal value function pv(·) of Equation (3.5).
the negative framing curve in the loss region.
Without loss of generality, it is reasonable to assume that the perceived ownership valuepov(·) (see Eq. (7.1)) of an asset in a given moment is proportional to this usefulness value pv(·)at that moment, the bigger the former the smaller the latter, so
pov(x) = (1− pv(x)) · d (7.9)
where d ∈ [0, 1] is a normalizer constant.
7.4.2 Generating the proposed personal utility (Ψ)
The results for each scenario generate two surfaces (see Figure 7.3 - top-left): one for the positiveframing and the preference in saying “YES” (green - ψ+(·)) and other for the negative one andthe preference in saying “NO” (red - ψ−(·)). The top-right plot in Figure 7.3 shows the personal
104
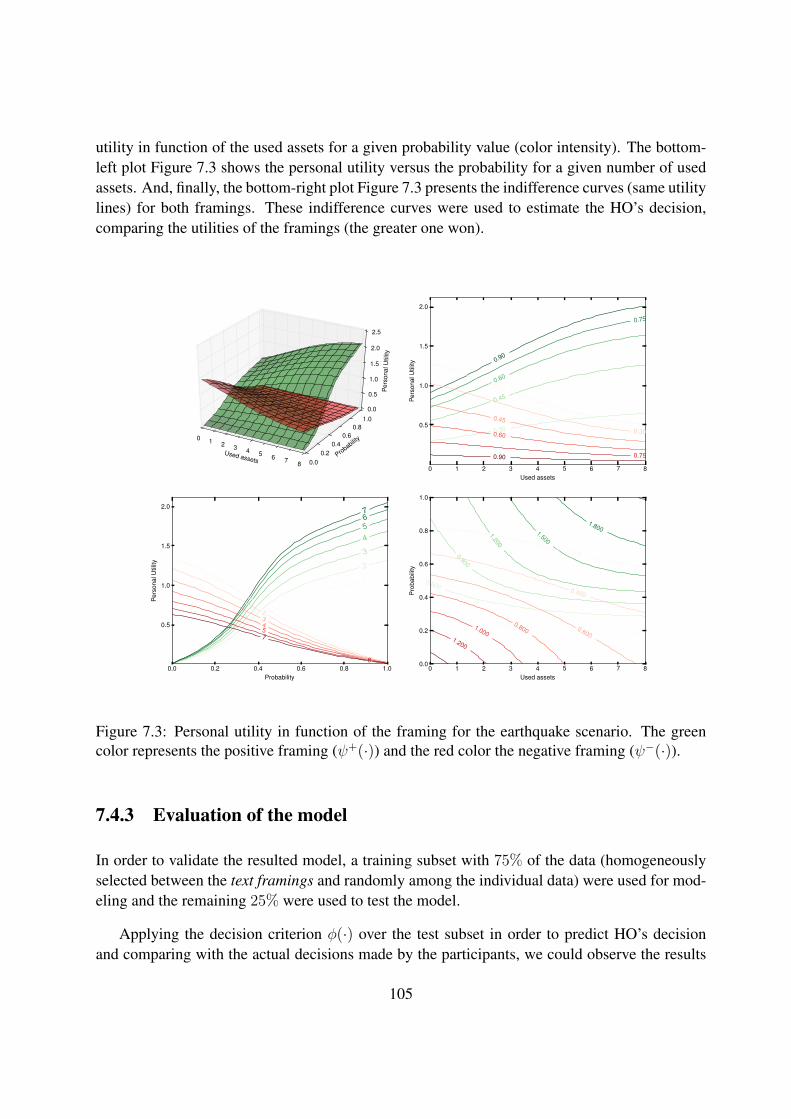
utility in function of the used assets for a given probability value (color intensity). The bottom-left plot Figure 7.3 shows the personal utility versus the probability for a given number of usedassets. And, finally, the bottom-right plot Figure 7.3 presents the indifference curves (same utilitylines) for both framings. These indifference curves were used to estimate the HO’s decision,comparing the utilities of the framings (the greater one won).
Used assets
0 1 2 3 4 5 6 7 8Probability
0.00.2
0.40.6
0.81.0
Per
sona
l Util
ity
0.0
0.5
1.0
1.5
2.0
2.5
0 1 2 3 4 5 6 7 8Used assets
0.5
1.0
1.5
2.0
Pers
onal
Util
ity
0.15
0.30
0.45
0.60
0.75
0.90
0.15
0.30
0.45
0.60
0.750.90
0.0 0.2 0.4 0.6 0.8 1.0Probability
0.5
1.0
1.5
2.0
Pers
onal
Util
ity
1
2
3
4567
12345
6
7
0 1 2 3 4 5 6 7 8Used assets
0.0
0.2
0.4
0.6
0.8
1.0
Pro
babi
lity
0.300
0.600
0.900
1.200
1.500
1.800
0.200
0.400
0.600
0.8001.0001.200
Figure 7.3: Personal utility in function of the framing for the earthquake scenario. The greencolor represents the positive framing (ψ+(·)) and the red color the negative framing (ψ−(·)).
7.4.3 Evaluation of the model
In order to validate the resulted model, a training subset with 75% of the data (homogeneouslyselected between the text framings and randomly among the individual data) were used for mod-eling and the remaining 25% were used to test the model.
Applying the decision criterion φ(·) over the test subset in order to predict HO’s decisionand comparing with the actual decisions made by the participants, we could observe the results
105
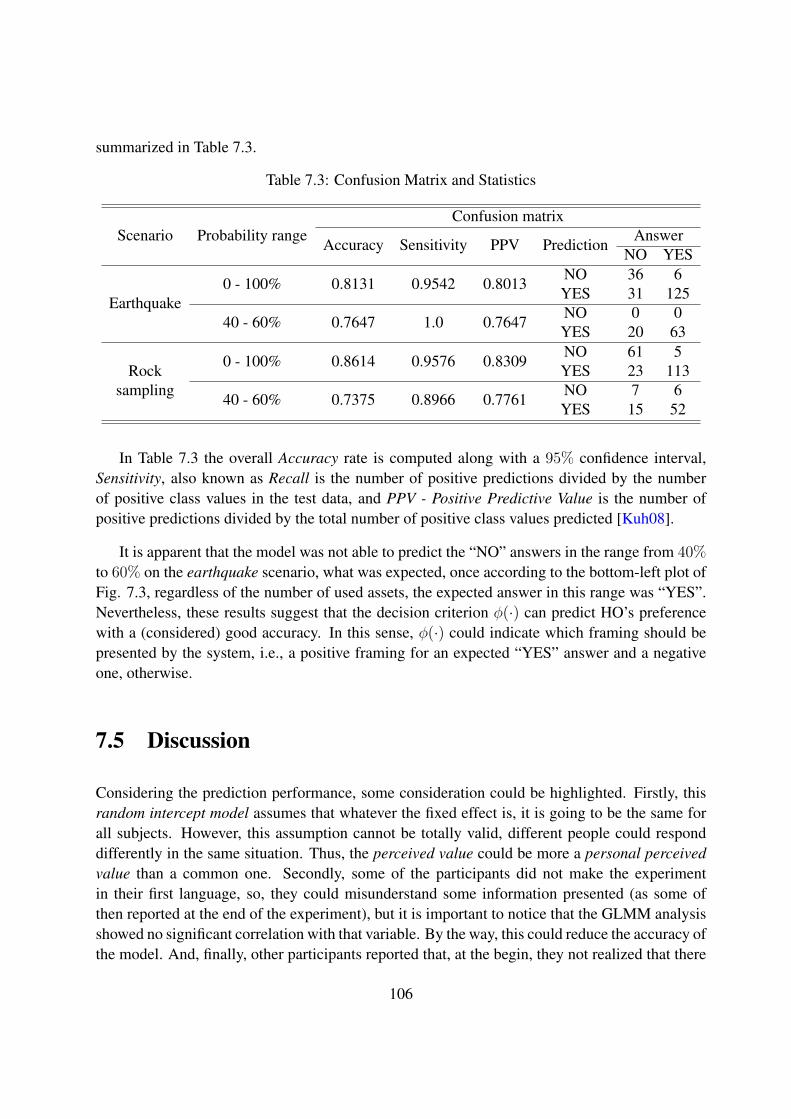
summarized in Table 7.3.
Table 7.3: Confusion Matrix and Statistics
Scenario Probability rangeConfusion matrix
Accuracy Sensitivity PPV PredictionAnswer
NO YES
Earthquake0 - 100% 0.8131 0.9542 0.8013
NO 36 6YES 31 125
40 - 60% 0.7647 1.0 0.7647NO 0 0YES 20 63
Rocksampling
0 - 100% 0.8614 0.9576 0.8309NO 61 5YES 23 113
40 - 60% 0.7375 0.8966 0.7761NO 7 6YES 15 52
In Table 7.3 the overall Accuracy rate is computed along with a 95% confidence interval,Sensitivity, also known as Recall is the number of positive predictions divided by the numberof positive class values in the test data, and PPV - Positive Predictive Value is the number ofpositive predictions divided by the total number of positive class values predicted [Kuh08].
It is apparent that the model was not able to predict the “NO” answers in the range from 40%to 60% on the earthquake scenario, what was expected, once according to the bottom-left plot ofFig. 7.3, regardless of the number of used assets, the expected answer in this range was “YES”.Nevertheless, these results suggest that the decision criterion φ(·) can predict HO’s preferencewith a (considered) good accuracy. In this sense, φ(·) could indicate which framing should bepresented by the system, i.e., a positive framing for an expected “YES” answer and a negativeone, otherwise.
7.5 Discussion
Considering the prediction performance, some consideration could be highlighted. Firstly, thisrandom intercept model assumes that whatever the fixed effect is, it is going to be the same forall subjects. However, this assumption cannot be totally valid, different people could responddifferently in the same situation. Thus, the perceived value could be more a personal perceivedvalue than a common one. Secondly, some of the participants did not make the experimentin their first language, so, they could misunderstand some information presented (as some ofthen reported at the end of the experiment), but it is important to notice that the GLMM analysisshowed no significant correlation with that variable. By the way, this could reduce the accuracy ofthe model. And, finally, other participants reported that, at the begin, they not realized that there
106

were different types of sentences and paid attention only in the probability value (attentionaltunneling), leading to a incorrect situation awareness and, because of that, they took a “wrong”decision.
7.6 Conclusion
As far as we know, this work is the first study where a utility function based on the PT and adecisional model are proposed to approach HOs’ utility function and predict human decisions insuch operational context. Our model is based on the approach of multiple dimensions proposedby Koszegi and Robin [KR06] in another context. But, contrary to them, any simplificationassumption (as a linear utility for gains and losses and no probability weighting function) are hereused. To consider a more general gain-loss function, we have considered a nonlinear probabilityweighting function w(·) that respects the mathematical conditions of PT (as strictly increasingfunction), and have identified different coefficients from collected data to approach a personalperceived value function. The contribution here presented, should allow to make the systemchose, which framing could be presented to the operator in order to induce the required HOdecision which should be aligned with the operational guidelines.
7.7 Summary
The aim of this work was to approach HOs’ utility function and predict their decisions in aspecific operational context, such as a cooperative human-robots mission.
The study in this chapter proposed: based on previous experimental collected data (see Chap-ter 6), (CH-8) the human operator’s utility function approximation founded on the Prospect the-ory (PT), and as far as we know, (CR-9) the first decisional model based on the economics ap-proach of multi-dimensional consumption bundle and PT without any simplifying assumption.The results here presented, in terms of utility function fit and prediction accuracy, are promisingand shown that this kind of modeling and prediction should be taken into account when an in-telligent cybernetic system drives human-robot interactions (HRI). The advantage in predictingthe human’s decision, in this operational context, is to anticipate, given the way a question isframed to the human operator, her decision. And so, in this sense, chose how to present thecurrent information to the operator while expecting to align her non-deterministic decision withthe operational guidelines of a given cooperative human-robots mission.
Finally, in the next chapter, we present our formal proposition of the whole system, where weclose the loop, making use of everything presented until now. We also present the results of an
107

experiment conducted to observe the system in action and the operational guidelines influenceover the HO decisions.
108
CHAPTER 8
Closing the loop
Contents8.1 Motivation . . . . . . . . . . . . . . . . . . . . . . . . . . . . . . . . . . . . . . 110
8.2 System description . . . . . . . . . . . . . . . . . . . . . . . . . . . . . . . . . . 111
8.3 Overall utility . . . . . . . . . . . . . . . . . . . . . . . . . . . . . . . . . . . . 111
8.4 Guideline . . . . . . . . . . . . . . . . . . . . . . . . . . . . . . . . . . . . . . . 113
8.4.1 Moving game in a search mission . . . . . . . . . . . . . . . . . . . . . . 113
8.5 Search game . . . . . . . . . . . . . . . . . . . . . . . . . . . . . . . . . . . . . 115
8.5.1 Guideline adjustment . . . . . . . . . . . . . . . . . . . . . . . . . . . . . 119
8.6 HRI game . . . . . . . . . . . . . . . . . . . . . . . . . . . . . . . . . . . . . . . 120
8.6.1 Guidelines alignment . . . . . . . . . . . . . . . . . . . . . . . . . . . . . 122
8.7 Evaluation . . . . . . . . . . . . . . . . . . . . . . . . . . . . . . . . . . . . . . 123
8.8 Drone simulation . . . . . . . . . . . . . . . . . . . . . . . . . . . . . . . . . . . 124
8.9 Experiment III . . . . . . . . . . . . . . . . . . . . . . . . . . . . . . . . . . . . 125
8.9.1 Objectives . . . . . . . . . . . . . . . . . . . . . . . . . . . . . . . . . . . 126
8.9.2 Hypotheses . . . . . . . . . . . . . . . . . . . . . . . . . . . . . . . . . . 126
8.9.3 Participants . . . . . . . . . . . . . . . . . . . . . . . . . . . . . . . . . . 126
8.9.4 Design . . . . . . . . . . . . . . . . . . . . . . . . . . . . . . . . . . . . 126
8.9.5 Procedure . . . . . . . . . . . . . . . . . . . . . . . . . . . . . . . . . . . 127
8.9.6 Results . . . . . . . . . . . . . . . . . . . . . . . . . . . . . . . . . . . . 130
8.9.7 Discussions . . . . . . . . . . . . . . . . . . . . . . . . . . . . . . . . . . 135
8.9.8 Limitations . . . . . . . . . . . . . . . . . . . . . . . . . . . . . . . . . . 137
8.10 Considerations for a Real-World operation . . . . . . . . . . . . . . . . . . . . 137
8.10.1 Communication and coordination . . . . . . . . . . . . . . . . . . . . . . 137
8.10.2 Robustness to uncertainty . . . . . . . . . . . . . . . . . . . . . . . . . . 138
8.10.3 Robustness to failure . . . . . . . . . . . . . . . . . . . . . . . . . . . . . 138
8.10.4 Computational feasibility . . . . . . . . . . . . . . . . . . . . . . . . . . . 138
109
8.10.5 Scalability . . . . . . . . . . . . . . . . . . . . . . . . . . . . . . . . . . 139
8.11 Summary . . . . . . . . . . . . . . . . . . . . . . . . . . . . . . . . . . . . . . . 139
Whether we are based on carbon or onsilicon makes no fundamental difference;we should each be treated withappropriate respect.
Arthur C. Clarke
In this chapter we present our formal proposition of the whole system, where we close theloop, making use of a decentralized coordination game theoretical framework (Chapter 5), pre-vious experimental data got in FE experiments (Chapter 6) and the proposed PT HO’s decisionprediction model (Chapter 7). This last one should allow us to decide how to present the informa-tion, expecting that the HO would decide in accordance with the mission guidelines. To evaluatethe closed-loop system, we conducted an experiment with a large number of participants whichallowed us to test the efficiency of our approach.
8.1 Motivation
To make our system efficient it is important to optimize each phase of the whole process. For thedrones, they have to choose the best alternative available at the decision moment.
And, in order to improve the quality of decision-making, the expertise level of the DM shouldbe improved, particularly in stressful or boring situations [KH08]. One way to boost expertiseis by making novices repeat patterns used by experts. For example, we can see this type oflearning system in flight lessons, in which a very detailed and logical explanation is not enoughto a student has those skills mastered; in this case, the best practice is repeating standard patternsuntil the pilot student get used to them. This learning procedure reduces the cognitive charge[VMK12], transferring the mental effort from the analytical to the intuitive thinking. Thereby,using the framing effect we could try to transfer the patterns and strategies acquired by experts,instead of using analytical methods; and teach novices to see the world in the way experts do.
Note that, for our Experiment III, described later in Section 8.9, we used coefficients derivedfrom the data collected in Experiments I and II (see sections 6.3 and 6.4) in order to infer theHO utility (as described in Chapter 7). Consequently, these coefficients are “biased” by thosedata, which created an “alignment” between the average preferences of the participants in that
110

previous experiment and the framing selected by the system in Experiment III. Because of that,we considered those earlier participants as “experts” in order to persuade the new participants(“novices”) to mimic them, the “experts”.
8.2 System description
For this study, we defined a SAR mission in a bounded area (subdivided into small sectors) andassumed the following phases for this mission: (1) selection and moving to a destination sector,(2) selection and execution of a search pattern, and (3) interaction with the operator if a possiblevictim is found.
In this framework, each drone obtains its movement strategies and interacts with HO by usinga game-theoretical approach. In this sense, they are self-centric agents trying to maximize theirown payoffs, playing “against” each other, the environment and the operator. In the game amongthem, they have to coordinate their actions to avoid collisions, spread themselves along the areaof interest and visit all predetermined points in a non-deterministic way. The interaction withthe environment occurs when they have to “decide” how they will search for targets. With theoperator, they adapt the human-robot interaction (HRI), via a graphical user interface (GUI), inorder to improve the HO’s decision-making process and then optimize the overall system utility.Fig. 8.1 shows the flowchart of a typical mission.
Finally, each payoff is influenced by the guidelines for the mission. These operational guide-lines are statements and recommendations that determine a course of action in consonance withthe decisions of the authority in charge of the mission. In this thesis, we will focus on what ismore important in a specific mission: speed or accuracy. For instance, the sunset is coming (so,it is important to be fast) or not helped victims can freeze to death (then, be accurate).
8.3 Overall utility
The overall mission utility µt at timestep t is defined as an additive utility, i.e., the utility of a setof items is the sum of the utilities of each item separately (see Section 3.2.1), as shown in Eq.(8.1).
µt =∑a∈A
µti(·) (8.1)
where i represents the index of a given drone in the team. So, we define the Dronei’s utility as:
111
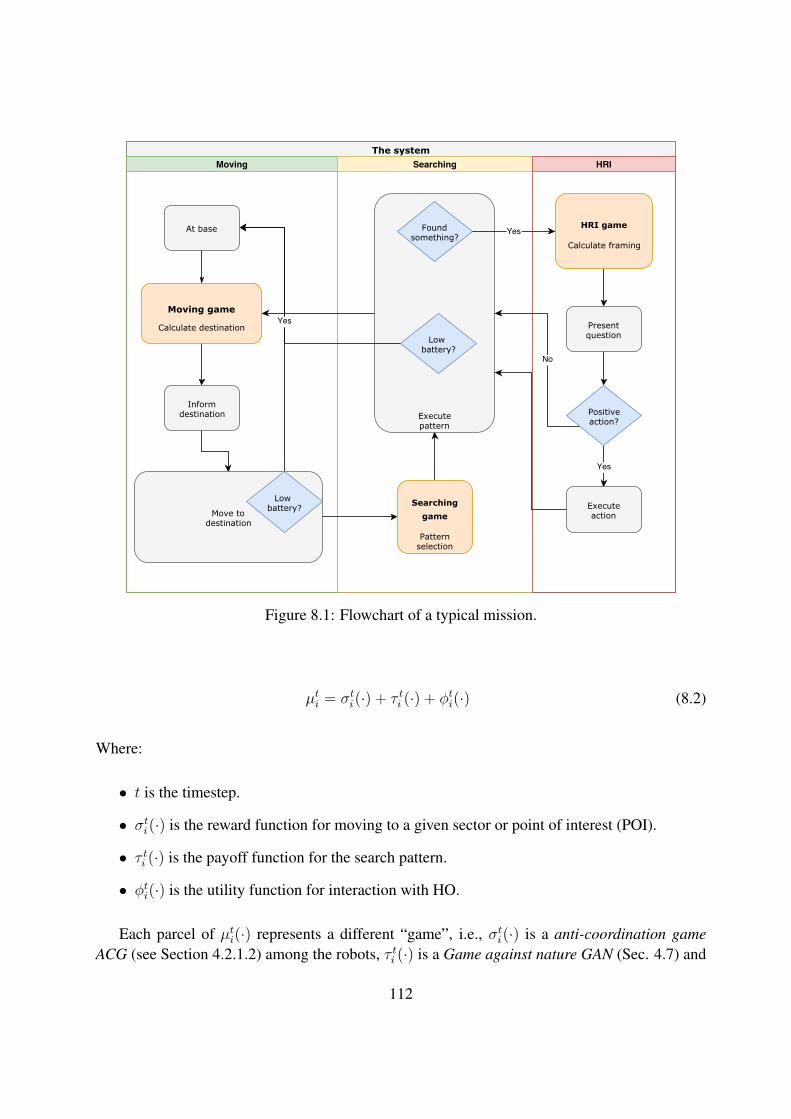
Figure 8.1: Flowchart of a typical mission.
µti = σti(·) + τ ti (·) + φti(·) (8.2)
Where:
• t is the timestep.
• σti(·) is the reward function for moving to a given sector or point of interest (POI).
• τ ti (·) is the payoff function for the search pattern.
• φti(·) is the utility function for interaction with HO.
Each parcel of µti(·) represents a different “game”, i.e., σti(·) is a anti-coordination gameACG (see Section 4.2.1.2) among the robots, τ ti (·) is a Game against nature GAN (Sec. 4.7) and
112

φti(·) is a sequential High-low game HLG or a team game (Sec. 4.2.1.1) where one of the players(HO) is not “totally rational”.
RemarkThe three games are orthogonal to each other, thus, the result of a particular game have noinfluence in the other games.
The form of each function will be presented in the next sections. But before, we would liketo explain how the guideline for a given mission is defined in terms of a weighting function.
8.4 Guideline
The guidelines of a given mission would suggest the tradeoff criteria for deciding during theexecution time. In this study, we will focus on what is more important in a specific mission:speed or accuracy. For instance, in a SAR mission, the authorities could prefer to push theHuman-robots team to be fast, in a case where the sunset is coming and no much more time reststo find possible victims. Or to be accurate in a case where not-helped victims can freeze to death.
We define two constants g and G > 1 and a function γ(·) which depends on these constants.g that can take two different values:
g =
0 fast
1 accurate(8.3)
so, we can define γ(·) as:γ(g,G) = G · (1− g) + g/G (8.4)
Following, γ(·) will be used to adjust each utility (cf. eq. (8.2)) accordingly with the givenguideline.
8.4.1 Moving game in a search mission
In a multi-robot SAR or sample-return mission, it is important to spread the drones out along thesearch area, taking into account the likelihood of the existence of a target in the destination POI.So, based on previous utility function, presented in Chap. 5, we propose the best strategy forDronei (σt∗i (·)) as
113

σt∗i (ai, st) = maxai∈A
([−(γ · δti(ai, sti) + θti(ai, ¯s−it))] · ρt
)(8.5)
where,
• cost to move: δti(·) is the distance for Dronei to move from its current position sti to all itspossible future locations aki ∈ Ai, with k ∈ 1, · · · , q. Therefore, considering thatf ∗(sti, aki ) is the optimal distance cost that refers to the optimal (or sub-optimal, when theoptimal cannot be calculated) path from node sti to aki , one gets:
δi(aki , sti) = f ∗(sti, aki ) (8.6)
Here, γ(·) adjusts the value of δ(·) in function of the selected guideline. When it is adjustedto “be fast” γ(·) increases the cost of moving, which ensures that the drones will not wanderaround the search zone. On the other hand, when the guideline says “be accurate”, γ(·)reduces the cost of moving, making distant places more attractive.
cost for not moving: infinity. The idea is to force Dronei to move to another place, then
δti(sti, sti) =∞
.
• θti(·) is the cost relative to the proximity of the other drones:
θti(ai, ¯s−it)) =∑n−1j (max(δtj) + min(δtj)− δtj)
n− 1 , i 6= j (8.7)
θti(·) is the weighted sum of all other drones “inverted distance”, where inverted distance isdefined as a value that is equal to the maximum distance for the nearest point and decreaseswith the distance. The idea here is to make the sectors more distant from the other dronesmore attractive for Dronei.
• finally, different from Chap. 5, ρ(·) is a “common belief” that make use of Bayesianprobabilities to infer about the “reward” to be collected when a sector is visited.
In the case of a SAR mission, ρ(·) infers the existence of a victim in each sector before andafter this sector has been visited. It works like an attractor to destinations not visited yet:
ρt = 1−
ρtvis = P (v|¬a) when visited
ρt¬vis = (1−∑k
i=1 ρt,ivis)
|S|−k when not visited(8.8)
114
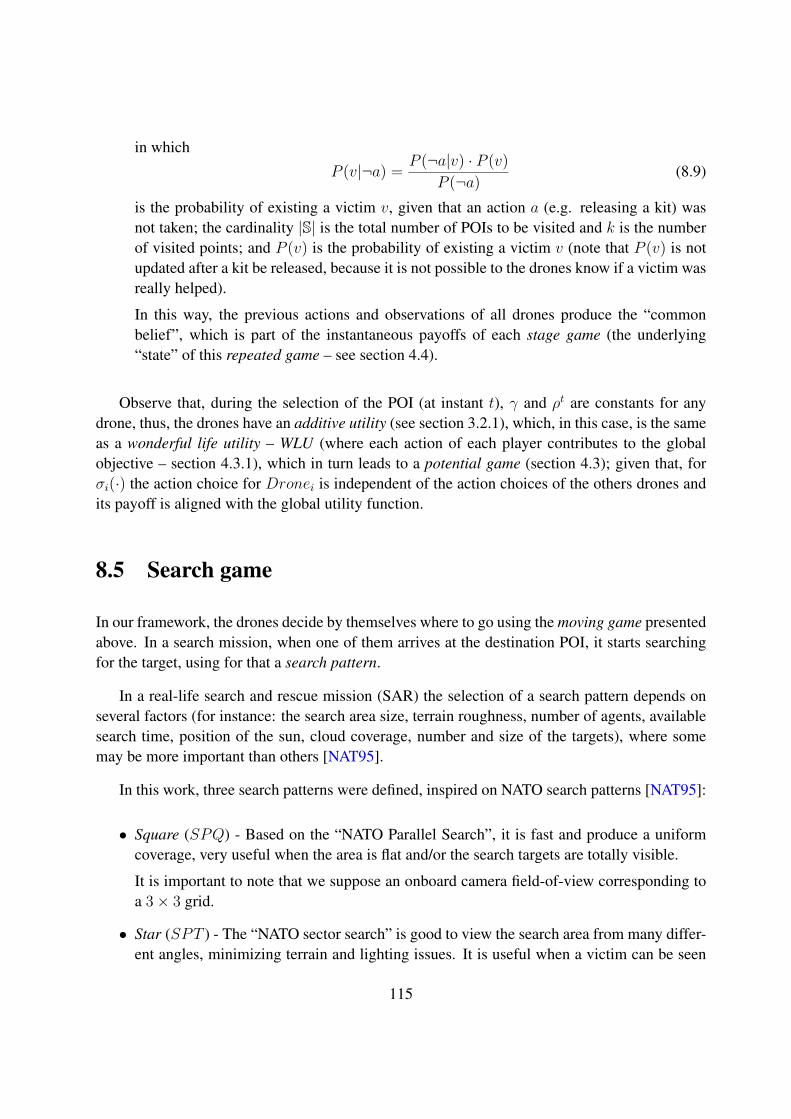
in which
P (v|¬a) = P (¬a|v) · P (v)P (¬a) (8.9)
is the probability of existing a victim v, given that an action a (e.g. releasing a kit) wasnot taken; the cardinality |S| is the total number of POIs to be visited and k is the numberof visited points; and P (v) is the probability of existing a victim v (note that P (v) is notupdated after a kit be released, because it is not possible to the drones know if a victim wasreally helped).
In this way, the previous actions and observations of all drones produce the “commonbelief”, which is part of the instantaneous payoffs of each stage game (the underlying“state” of this repeated game – see section 4.4).
Observe that, during the selection of the POI (at instant t), γ and ρt are constants for anydrone, thus, the drones have an additive utility (see section 3.2.1), which, in this case, is the sameas a wonderful life utility – WLU (where each action of each player contributes to the globalobjective – section 4.3.1), which in turn leads to a potential game (section 4.3); given that, forσi(·) the action choice for Dronei is independent of the action choices of the others drones andits payoff is aligned with the global utility function.
8.5 Search game
In our framework, the drones decide by themselves where to go using the moving game presentedabove. In a search mission, when one of them arrives at the destination POI, it starts searchingfor the target, using for that a search pattern.
In a real-life search and rescue mission (SAR) the selection of a search pattern depends onseveral factors (for instance: the search area size, terrain roughness, number of agents, availablesearch time, position of the sun, cloud coverage, number and size of the targets), where somemay be more important than others [NAT95].
In this work, three search patterns were defined, inspired on NATO search patterns [NAT95]:
• Square (SPQ) - Based on the “NATO Parallel Search”, it is fast and produce a uniformcoverage, very useful when the area is flat and/or the search targets are totally visible.
It is important to note that we suppose an onboard camera field-of-view corresponding toa 3× 3 grid.
• Star (SPT ) - The “NATO sector search” is good to view the search area from many differ-ent angles, minimizing terrain and lighting issues. It is useful when a victim can be seen
115
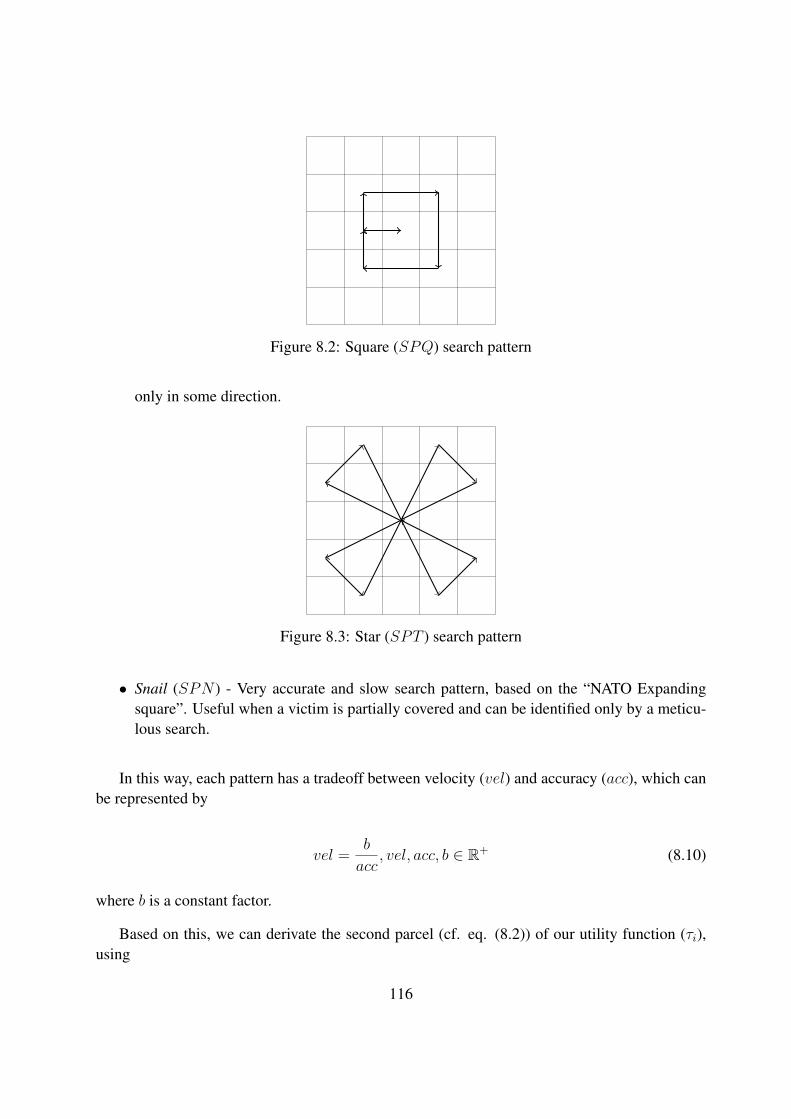
Figure 8.2: Square (SPQ) search pattern
only in some direction.
Figure 8.3: Star (SPT ) search pattern
• Snail (SPN ) - Very accurate and slow search pattern, based on the “NATO Expandingsquare”. Useful when a victim is partially covered and can be identified only by a meticu-lous search.
In this way, each pattern has a tradeoff between velocity (vel) and accuracy (acc), which canbe represented by
vel = b
acc, vel, acc, b ∈ R+ (8.10)
where b is a constant factor.
Based on this, we can derivate the second parcel (cf. eq. (8.2)) of our utility function (τi),using
116
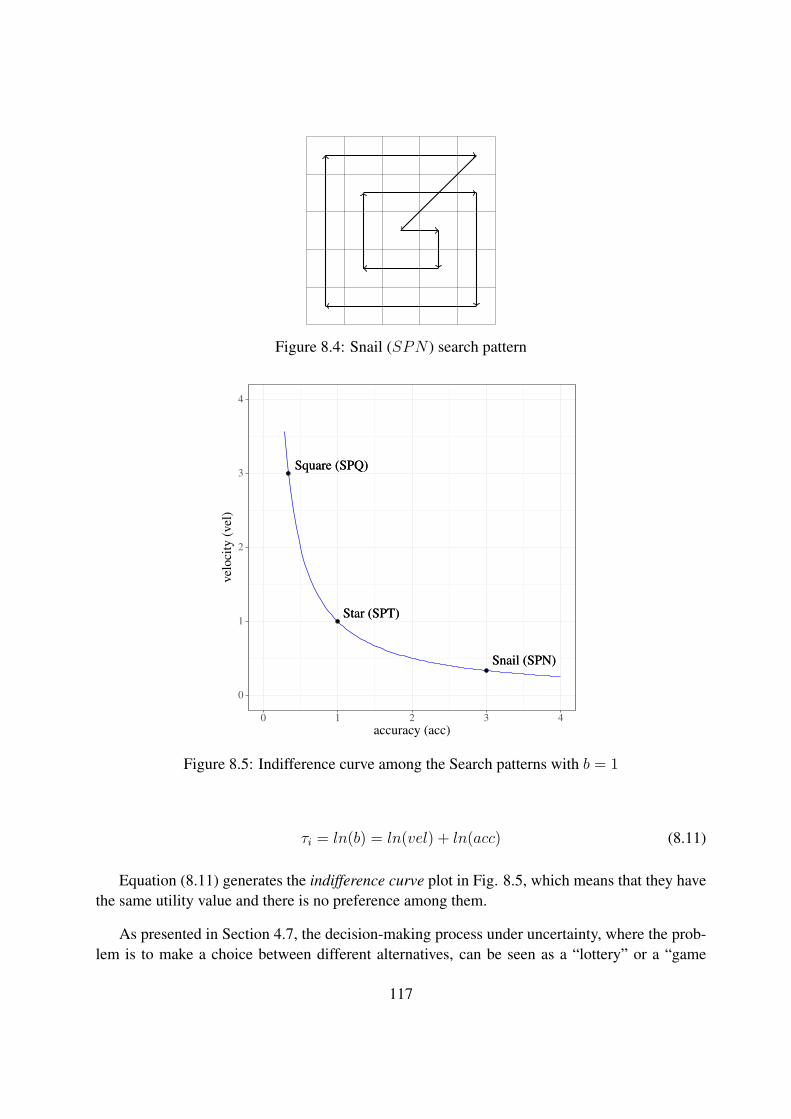
Figure 8.4: Snail (SPN ) search pattern
Square (SPQ)Square (SPQ)
Star (SPT)Star (SPT)
Snail (SPN)Snail (SPN)
0
1
2
3
4
0 1 2 3 4accuracy (acc)
velo
city
(vel
)
Figure 8.5: Indifference curve among the Search patterns with b = 1
τi = ln(b) = ln(vel) + ln(acc) (8.11)
Equation (8.11) generates the indifference curve plot in Fig. 8.5, which means that they havethe same utility value and there is no preference among them.
As presented in Section 4.7, the decision-making process under uncertainty, where the prob-lem is to make a choice between different alternatives, can be seen as a “lottery” or a “game
117
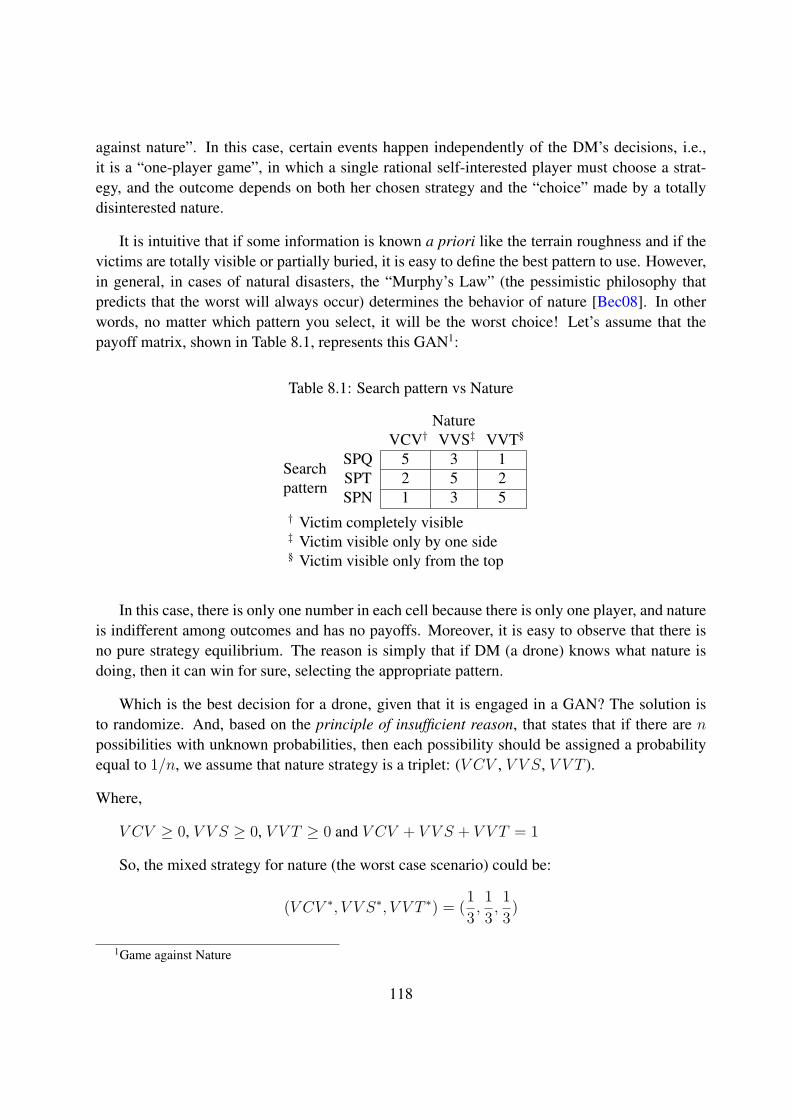
against nature”. In this case, certain events happen independently of the DM’s decisions, i.e.,it is a “one-player game”, in which a single rational self-interested player must choose a strat-egy, and the outcome depends on both her chosen strategy and the “choice” made by a totallydisinterested nature.
It is intuitive that if some information is known a priori like the terrain roughness and if thevictims are totally visible or partially buried, it is easy to define the best pattern to use. However,in general, in cases of natural disasters, the “Murphy’s Law” (the pessimistic philosophy thatpredicts that the worst will always occur) determines the behavior of nature [Bec08]. In otherwords, no matter which pattern you select, it will be the worst choice! Let’s assume that thepayoff matrix, shown in Table 8.1, represents this GAN1:
Table 8.1: Search pattern vs Nature
NatureVCV† VVS‡ VVT§
Searchpattern
SPQ 5 3 1SPT 2 5 2SPN 1 3 5
† Victim completely visible‡ Victim visible only by one side§ Victim visible only from the top
In this case, there is only one number in each cell because there is only one player, and natureis indifferent among outcomes and has no payoffs. Moreover, it is easy to observe that there isno pure strategy equilibrium. The reason is simply that if DM (a drone) knows what nature isdoing, then it can win for sure, selecting the appropriate pattern.
Which is the best decision for a drone, given that it is engaged in a GAN? The solution isto randomize. And, based on the principle of insufficient reason, that states that if there are npossibilities with unknown probabilities, then each possibility should be assigned a probabilityequal to 1/n, we assume that nature strategy is a triplet: (V CV , V V S, V V T ).
Where,
V CV ≥ 0, V V S ≥ 0, V V T ≥ 0 and V CV + V V S + V V T = 1
So, the mixed strategy for nature (the worst case scenario) could be:
(V CV ∗, V V S∗, V V T ∗) = (13 ,
13 ,
13)
1Game against Nature
118
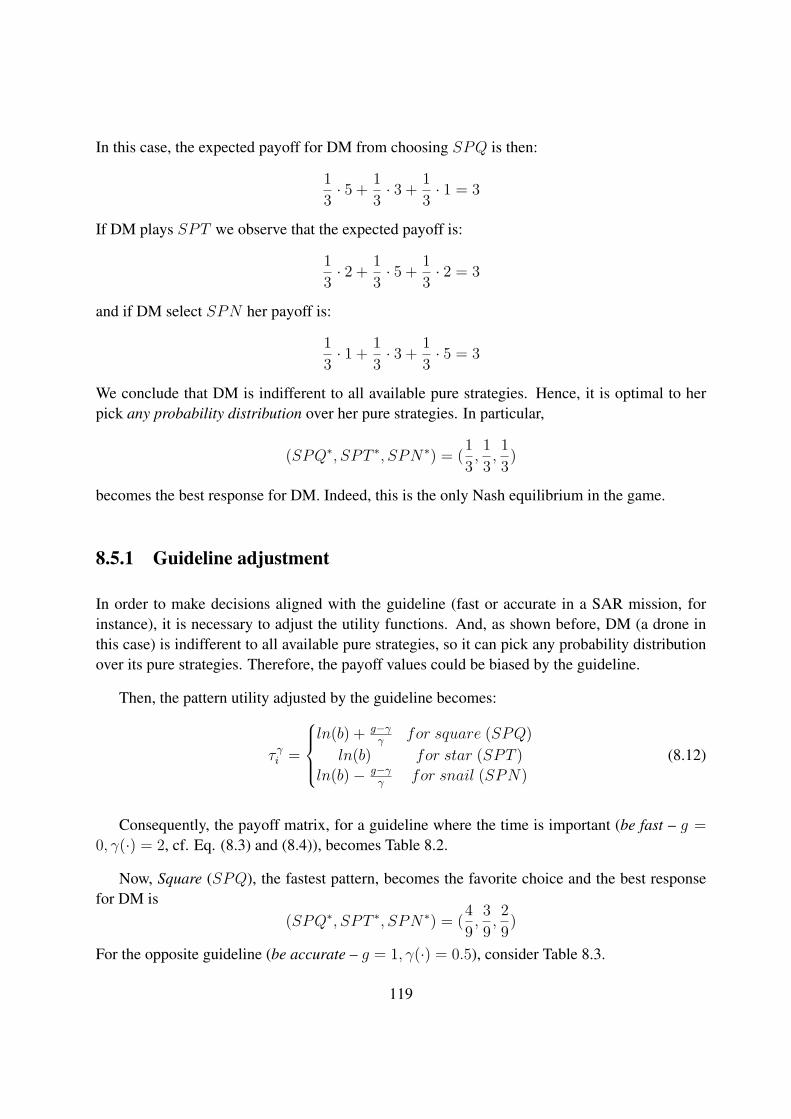
In this case, the expected payoff for DM from choosing SPQ is then:
13 · 5 + 1
3 · 3 + 13 · 1 = 3
If DM plays SPT we observe that the expected payoff is:
13 · 2 + 1
3 · 5 + 13 · 2 = 3
and if DM select SPN her payoff is:
13 · 1 + 1
3 · 3 + 13 · 5 = 3
We conclude that DM is indifferent to all available pure strategies. Hence, it is optimal to herpick any probability distribution over her pure strategies. In particular,
(SPQ∗, SPT ∗, SPN∗) = (13 ,
13 ,
13)
becomes the best response for DM. Indeed, this is the only Nash equilibrium in the game.
8.5.1 Guideline adjustment
In order to make decisions aligned with the guideline (fast or accurate in a SAR mission, forinstance), it is necessary to adjust the utility functions. And, as shown before, DM (a drone inthis case) is indifferent to all available pure strategies, so it can pick any probability distributionover its pure strategies. Therefore, the payoff values could be biased by the guideline.
Then, the pattern utility adjusted by the guideline becomes:
τ γi =
ln(b) + g−γ
γfor square (SPQ)
ln(b) for star (SPT )ln(b)− g−γ
γfor snail (SPN)
(8.12)
Consequently, the payoff matrix, for a guideline where the time is important (be fast – g =0, γ(·) = 2, cf. Eq. (8.3) and (8.4)), becomes Table 8.2.
Now, Square (SPQ), the fastest pattern, becomes the favorite choice and the best responsefor DM is
(SPQ∗, SPT ∗, SPN∗) = (49 ,
39 ,
29)
For the opposite guideline (be accurate – g = 1, γ(·) = 0.5), consider Table 8.3.
119
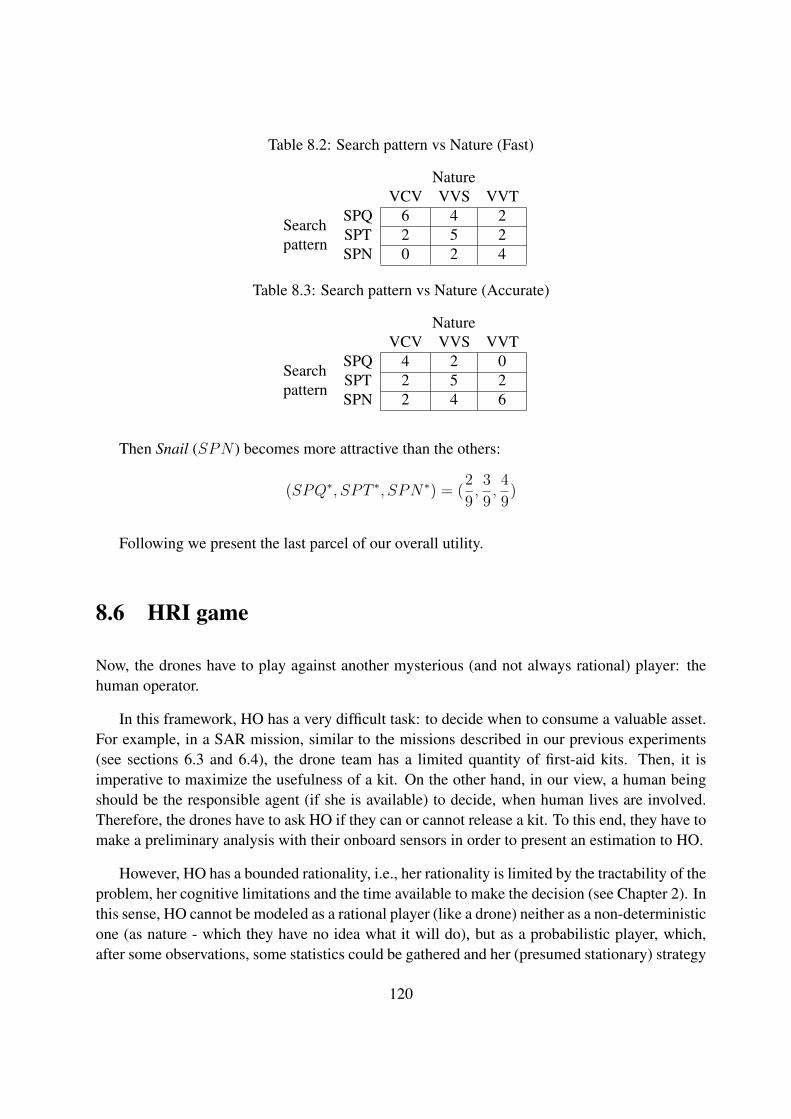
Table 8.2: Search pattern vs Nature (Fast)
NatureVCV VVS VVT
Searchpattern
SPQ 6 4 2SPT 2 5 2SPN 0 2 4
Table 8.3: Search pattern vs Nature (Accurate)
NatureVCV VVS VVT
Searchpattern
SPQ 4 2 0SPT 2 5 2SPN 2 4 6
Then Snail (SPN ) becomes more attractive than the others:
(SPQ∗, SPT ∗, SPN∗) = (29 ,
39 ,
49)
Following we present the last parcel of our overall utility.
8.6 HRI game
Now, the drones have to play against another mysterious (and not always rational) player: thehuman operator.
In this framework, HO has a very difficult task: to decide when to consume a valuable asset.For example, in a SAR mission, similar to the missions described in our previous experiments(see sections 6.3 and 6.4), the drone team has a limited quantity of first-aid kits. Then, it isimperative to maximize the usefulness of a kit. On the other hand, in our view, a human beingshould be the responsible agent (if she is available) to decide, when human lives are involved.Therefore, the drones have to ask HO if they can or cannot release a kit. To this end, they have tomake a preliminary analysis with their onboard sensors in order to present an estimation to HO.
However, HO has a bounded rationality, i.e., her rationality is limited by the tractability of theproblem, her cognitive limitations and the time available to make the decision (see Chapter 2). Inthis sense, HO cannot be modeled as a rational player (like a drone) neither as a non-deterministicone (as nature - which they have no idea what it will do), but as a probabilistic player, which,after some observations, some statistics could be gathered and her (presumed stationary) strategy
120
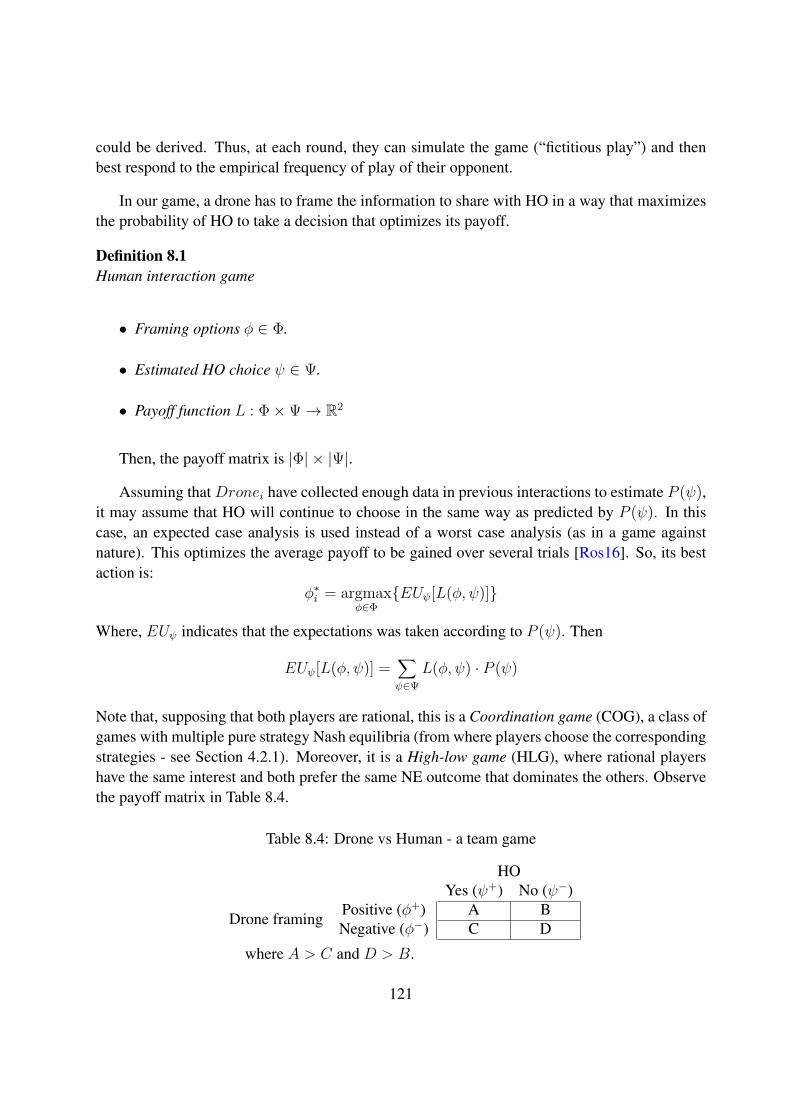
could be derived. Thus, at each round, they can simulate the game (“fictitious play”) and thenbest respond to the empirical frequency of play of their opponent.
In our game, a drone has to frame the information to share with HO in a way that maximizesthe probability of HO to take a decision that optimizes its payoff.
Definition 8.1Human interaction game
• Framing options φ ∈ Φ.
• Estimated HO choice ψ ∈ Ψ.
• Payoff function L : Φ×Ψ→ R2
Then, the payoff matrix is |Φ| × |Ψ|.
Assuming that Dronei have collected enough data in previous interactions to estimate P (ψ),it may assume that HO will continue to choose in the same way as predicted by P (ψ). In thiscase, an expected case analysis is used instead of a worst case analysis (as in a game againstnature). This optimizes the average payoff to be gained over several trials [Ros16]. So, its bestaction is:
φ∗i = argmaxφ∈Φ
EUψ[L(φ, ψ)]
Where, EUψ indicates that the expectations was taken according to P (ψ). Then
EUψ[L(φ, ψ)] =∑ψ∈Ψ
L(φ, ψ) · P (ψ)
Note that, supposing that both players are rational, this is a Coordination game (COG), a class ofgames with multiple pure strategy Nash equilibria (from where players choose the correspondingstrategies - see Section 4.2.1). Moreover, it is a High-low game (HLG), where rational playershave the same interest and both prefer the same NE outcome that dominates the others. Observethe payoff matrix in Table 8.4.
Table 8.4: Drone vs Human - a team game
HOYes (ψ+) No (ψ−)
Drone framing Positive (φ+) A BNegative (φ−) C D
where A > C and D > B.
121
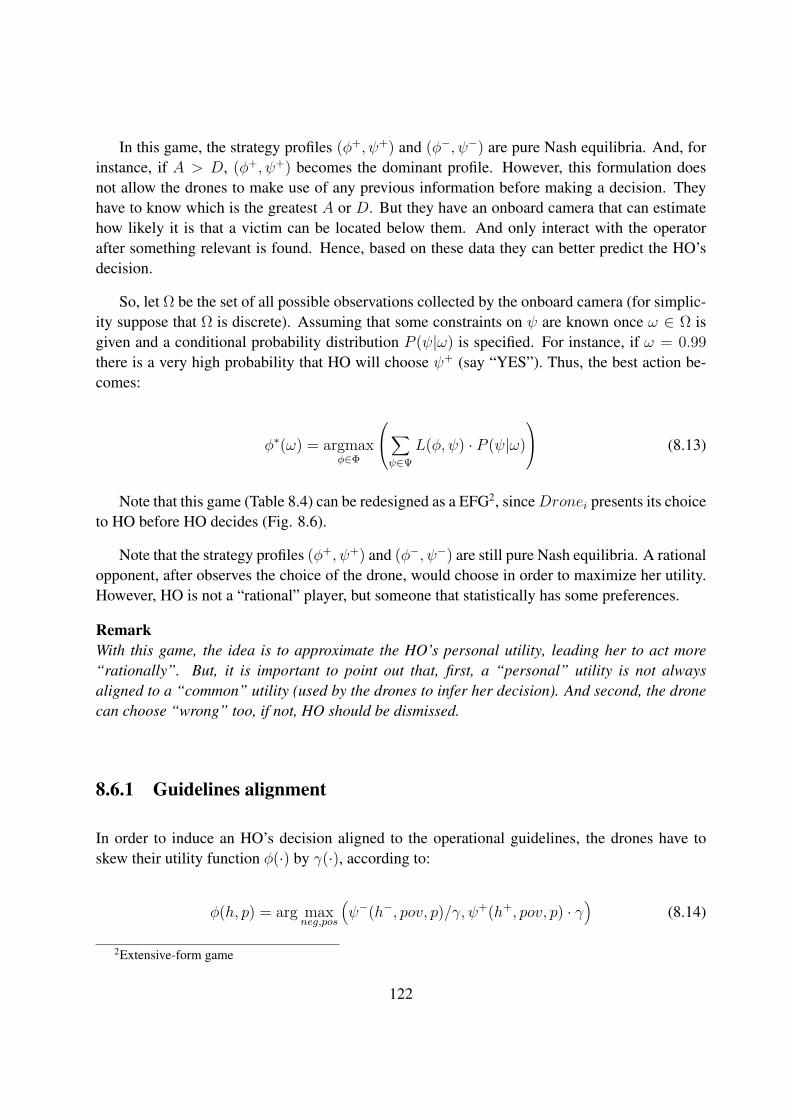
In this game, the strategy profiles (φ+, ψ+) and (φ−, ψ−) are pure Nash equilibria. And, forinstance, if A > D, (φ+, ψ+) becomes the dominant profile. However, this formulation doesnot allow the drones to make use of any previous information before making a decision. Theyhave to know which is the greatest A or D. But they have an onboard camera that can estimatehow likely it is that a victim can be located below them. And only interact with the operatorafter something relevant is found. Hence, based on these data they can better predict the HO’sdecision.
So, let Ω be the set of all possible observations collected by the onboard camera (for simplic-ity suppose that Ω is discrete). Assuming that some constraints on ψ are known once ω ∈ Ω isgiven and a conditional probability distribution P (ψ|ω) is specified. For instance, if ω = 0.99there is a very high probability that HO will choose ψ+ (say “YES”). Thus, the best action be-comes:
φ∗(ω) = argmaxφ∈Φ
∑ψ∈Ψ
L(φ, ψ) · P (ψ|ω) (8.13)
Note that this game (Table 8.4) can be redesigned as a EFG2, sinceDronei presents its choiceto HO before HO decides (Fig. 8.6).
Note that the strategy profiles (φ+, ψ+) and (φ−, ψ−) are still pure Nash equilibria. A rationalopponent, after observes the choice of the drone, would choose in order to maximize her utility.However, HO is not a “rational” player, but someone that statistically has some preferences.
RemarkWith this game, the idea is to approximate the HO’s personal utility, leading her to act more“rationally”. But, it is important to point out that, first, a “personal” utility is not alwaysaligned to a “common” utility (used by the drones to infer her decision). And second, the dronecan choose “wrong” too, if not, HO should be dismissed.
8.6.1 Guidelines alignment
In order to induce an HO’s decision aligned to the operational guidelines, the drones have toskew their utility function φ(·) by γ(·), according to:
φ(h, p) = arg maxneg,pos
(ψ−(h−, pov, p)/γ, ψ+(h+, pov, p) · γ
)(8.14)
2Extensive-form game
122

Drone
HO
A B
HO
C D
Fr. positive φ+
Yes ψ+ No ψ−
Fr. negative φ−
Yes ψ+ No ψ−
Figure 8.6: Sequential form for the Drone vs HO game, in which A > C and D > B.
8.7 Evaluation
In order to evaluate our framework, we developed a computer simulation using Python 3.5 andMORSE3 (Fig. 8.7), based on the earthquake scenario designed for the previous experiments.MORSE is an open-source 3D robot simulator designed to handle the simulation of several robotssimultaneously. It can be used in several contexts for testing and verification of robotics systemsas a whole, from a medium to a high level of abstraction [Ech+11].
MORSE is a known robotic simulator. The drawback is that it is a single-user application inthe sense that it is not possible to run several simulations at the same time. Thus, it is good forcollecting realistic data from the robots, but too costly for gathering information from the HOs.
Therefore, in order to optimize the drones’ behavior, we collected all simulation data, with-out the interaction with the HO, from MORSE, and developed an HTML5 Canvas web-basedexperiment with a view to increasing the number of participants and, with that, boost the amount
3Modular open robots simulation engine
123
Figure 8.7: System developed in MORSE
of statistical data from the human resources.
8.8 Drone simulation
For the moving game, the topological model of the search area, homogeneously subdivided into25 sectors (a 5 × 5 grid), was defined as a fully connected graph. Since the drones could flyfrom one sector to any other as the crow flies (i.e. in straight line). This graph had a specialzeroth sector called “base” (the red boat in Fig. 8.7) used by the drones as the point of depart andreloading point.
For the search game, each sector was subdivided into another 5 × 5 grid and the onboardcamera field-of-view was considered to be a 3× 3 grid.
Each time a drone found something during the search, it had to stop, calculate the probabilityof a first-aid kit be useful, and request a decision to HO. With a “YES” answer, it should releasethe kit, return to base to get a new one and go back to the point where it stopped to resume thesearch. Otherwise (with a “No”), it should just continue the search.
When the battery level reached a critical level, they should return definitively to the base.
124
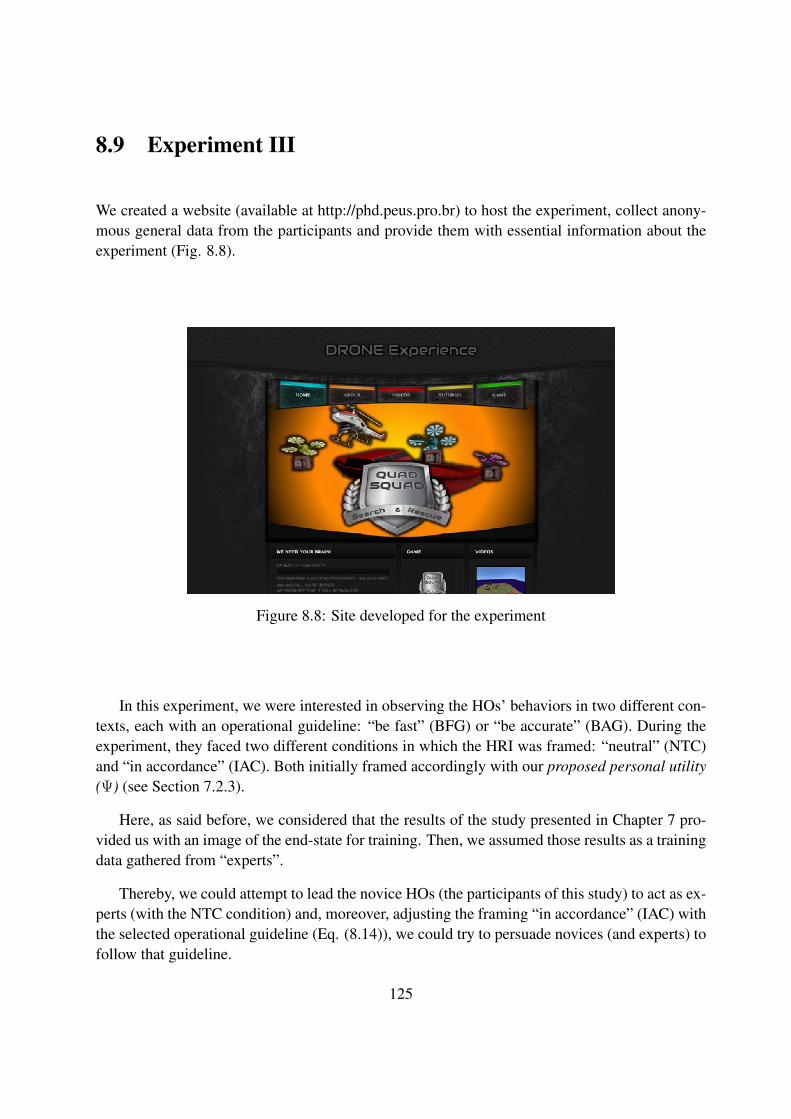
8.9 Experiment III
We created a website (available at http://phd.peus.pro.br) to host the experiment, collect anony-mous general data from the participants and provide them with essential information about theexperiment (Fig. 8.8).
Figure 8.8: Site developed for the experiment
In this experiment, we were interested in observing the HOs’ behaviors in two different con-texts, each with an operational guideline: “be fast” (BFG) or “be accurate” (BAG). During theexperiment, they faced two different conditions in which the HRI was framed: “neutral” (NTC)and “in accordance” (IAC). Both initially framed accordingly with our proposed personal utility(Ψ) (see Section 7.2.3).
Here, as said before, we considered that the results of the study presented in Chapter 7 pro-vided us with an image of the end-state for training. Then, we assumed those results as a trainingdata gathered from “experts”.
Thereby, we could attempt to lead the novice HOs (the participants of this study) to act as ex-perts (with the NTC condition) and, moreover, adjusting the framing “in accordance” (IAC) withthe selected operational guideline (Eq. (8.14)), we could try to persuade novices (and experts) tofollow that guideline.
125

8.9.1 Objectives
With this experimental design, we expected that, firstly, the participants acted in accordancewith the framing presented, making them mimic the participants from the previous experiments(“experts”) behavior (NTC). Secondly, the operational guideline would modify this behavior(IAC).
In this way, the prime objectives of this experiment were: (1) to verify if the HRI, framed ac-cordingly with the operational guidelines, could optimize the HOs’ behaviors (“in accordance”condition (IAC)); and (2) to verify if just presenting the guideline, without adjusting the framingof the interaction might change their behaviors (“neutral” condition (NTC)).
8.9.2 Hypotheses
Our hypotheses were: for the first objective, (H1) the BFG guideline would produce a preferenceof saying “YES” greater than BAG, i.e., participants with the BFG guideline should accept to re-lease a kit with lower probability levels, attempting to be faster; and for the second, (H2) NTCwould have a smaller effect (but still significant) when compared with IAC. In other words, al-though NTC condition did not adjust the HRI in function of the guideline (but just presented thisguideline to the HO), it was expected that the participants biased themselves to fit the guideline.However, with less efficiency than with IAC.
8.9.3 Participants
Participants were recruited by mailing lists in universities of France, Brazil, and Canada, and theywere encouraged to invite their friends. One hundred and one anonymous volunteers (22.69%female, mean age: 28.9, sd: 8.78) from 13 different nationalities, participated in the experiment.
8.9.4 Design
The experiment followed a 2 × 2 mixed design, which manipulated the operational Guideline(a two-level between-subject factor: BFG and BAG), and the Condition used to present the textmessage to the HO (constructed with a two-level within-subject factor: NTC and IAC).
In this way, participants were, unknown to them, randomly sorted into one of two contextswith different operational guidelines (BFG or BAG), and within that context, they had to exe-cute one training mission and four randomly presented valid missions (two repetitions of each
126
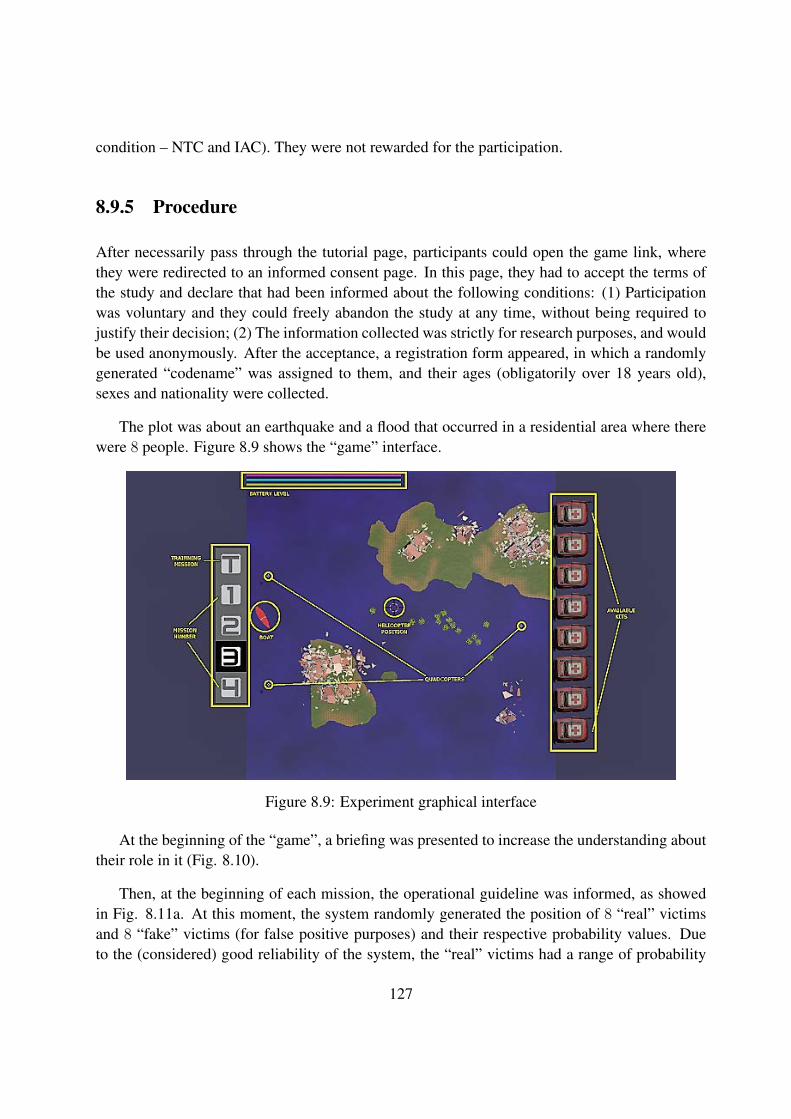
condition – NTC and IAC). They were not rewarded for the participation.
8.9.5 Procedure
After necessarily pass through the tutorial page, participants could open the game link, wherethey were redirected to an informed consent page. In this page, they had to accept the terms ofthe study and declare that had been informed about the following conditions: (1) Participationwas voluntary and they could freely abandon the study at any time, without being required tojustify their decision; (2) The information collected was strictly for research purposes, and wouldbe used anonymously. After the acceptance, a registration form appeared, in which a randomlygenerated “codename” was assigned to them, and their ages (obligatorily over 18 years old),sexes and nationality were collected.
The plot was about an earthquake and a flood that occurred in a residential area where therewere 8 people. Figure 8.9 shows the “game” interface.
Figure 8.9: Experiment graphical interface
At the beginning of the “game”, a briefing was presented to increase the understanding abouttheir role in it (Fig. 8.10).
Then, at the beginning of each mission, the operational guideline was informed, as showedin Fig. 8.11a. At this moment, the system randomly generated the position of 8 “real” victimsand 8 “fake” victims (for false positive purposes) and their respective probability values. Dueto the (considered) good reliability of the system, the “real” victims had a range of probability
127
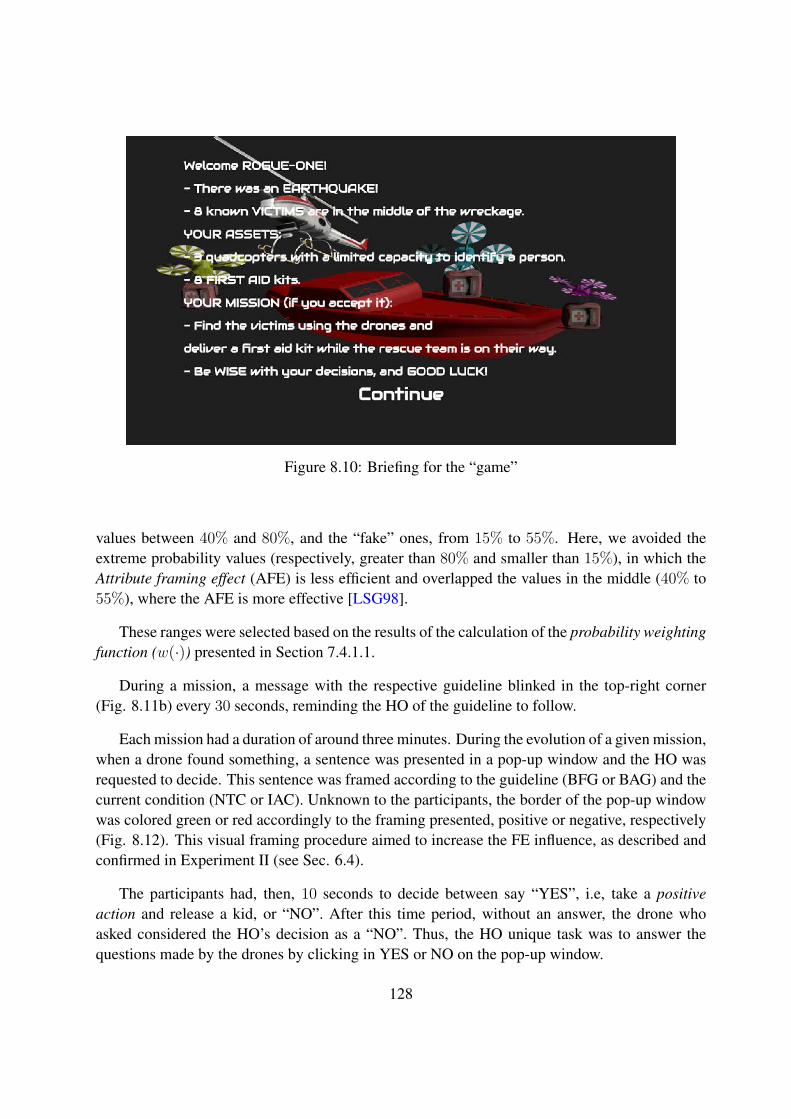
Figure 8.10: Briefing for the “game”
values between 40% and 80%, and the “fake” ones, from 15% to 55%. Here, we avoided theextreme probability values (respectively, greater than 80% and smaller than 15%), in which theAttribute framing effect (AFE) is less efficient and overlapped the values in the middle (40% to55%), where the AFE is more effective [LSG98].
These ranges were selected based on the results of the calculation of the probability weightingfunction (w(·)) presented in Section 7.4.1.1.
During a mission, a message with the respective guideline blinked in the top-right corner(Fig. 8.11b) every 30 seconds, reminding the HO of the guideline to follow.
Each mission had a duration of around three minutes. During the evolution of a given mission,when a drone found something, a sentence was presented in a pop-up window and the HO wasrequested to decide. This sentence was framed according to the guideline (BFG or BAG) and thecurrent condition (NTC or IAC). Unknown to the participants, the border of the pop-up windowwas colored green or red accordingly to the framing presented, positive or negative, respectively(Fig. 8.12). This visual framing procedure aimed to increase the FE influence, as described andconfirmed in Experiment II (see Sec. 6.4).
The participants had, then, 10 seconds to decide between say “YES”, i.e, take a positiveaction and release a kid, or “NO”. After this time period, without an answer, the drone whoasked considered the HO’s decision as a “NO”. Thus, the HO unique task was to answer thequestions made by the drones by clicking in YES or NO on the pop-up window.
128
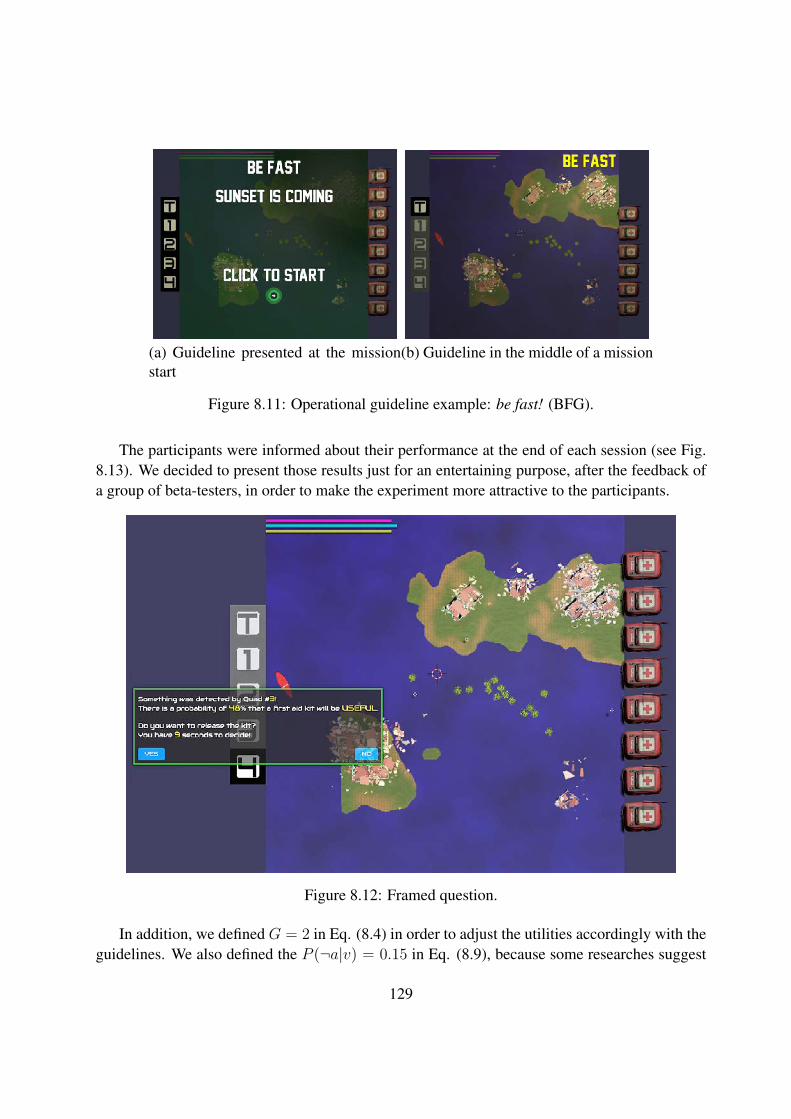
(a) Guideline presented at the missionstart
(b) Guideline in the middle of a mission
Figure 8.11: Operational guideline example: be fast! (BFG).
The participants were informed about their performance at the end of each session (see Fig.8.13). We decided to present those results just for an entertaining purpose, after the feedback ofa group of beta-testers, in order to make the experiment more attractive to the participants.
Figure 8.12: Framed question.
In addition, we defined G = 2 in Eq. (8.4) in order to adjust the utilities accordingly with theguidelines. We also defined the P (¬a|v) = 0.15 in Eq. (8.9), because some researches suggest
129
Figure 8.13: Total helped people at the end of a mission.
that the average people detection accuracy is around 0.85 [AS14]; [DT05]; [LWN08].
8.9.6 Results
We collected 5026 observations of 101 participants, from which 89% with completed data (3705observations), so, 11.88% of the data were dropped.
Due to this incomplete data and the randomization procedure the experiment ended with anunbalanced sample as shown in Table 8.5.
Table 8.5: Sample distribution
In_accordance (IAC) Neutral (NTC) Total
Accurate (BAG) 866 810 1676Fast (BFG) 1022 1007 2029
Total 1888 1817 3705
One alternative might be to balance the data by under-sampling the dataset, randomly throw-ing away some from the larger classes. This could enhance the discriminatory power of themodel, however, with the shortcoming that potentially important cases from the majority class ofthe sample could be discarded in the process. Moreover, [CF12] argues, in their empirical study
130
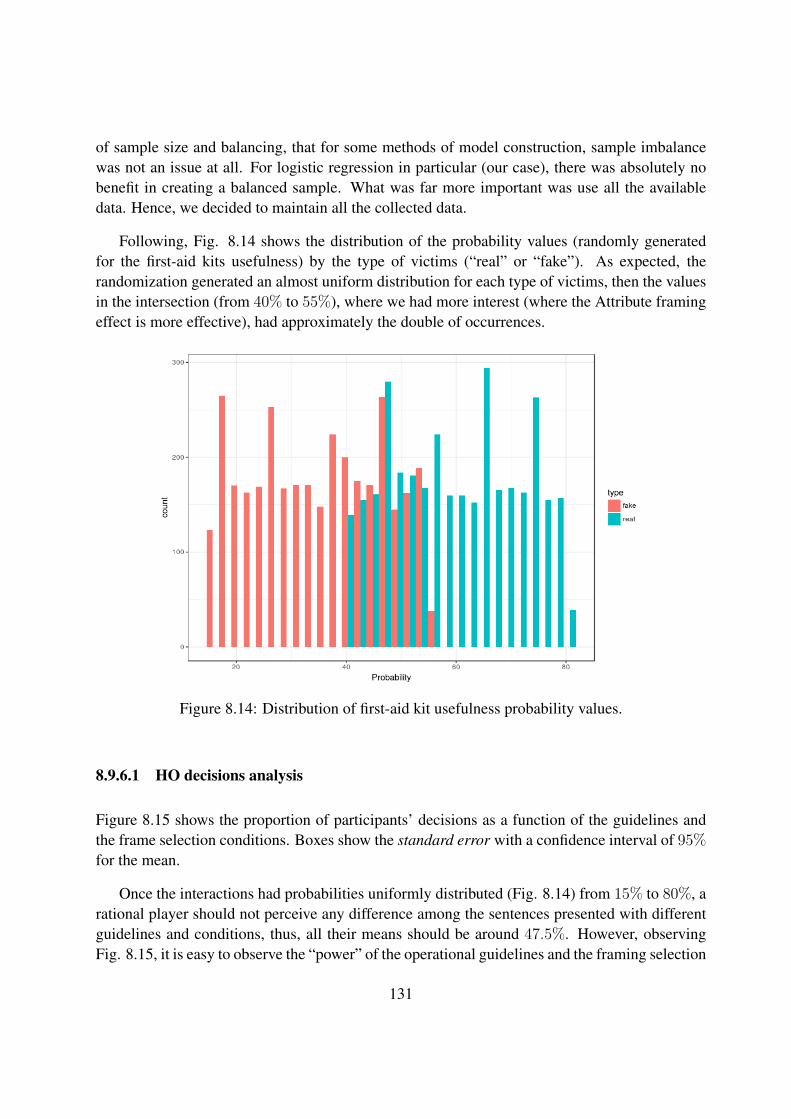
of sample size and balancing, that for some methods of model construction, sample imbalancewas not an issue at all. For logistic regression in particular (our case), there was absolutely nobenefit in creating a balanced sample. What was far more important was use all the availabledata. Hence, we decided to maintain all the collected data.
Following, Fig. 8.14 shows the distribution of the probability values (randomly generatedfor the first-aid kits usefulness) by the type of victims (“real” or “fake”). As expected, therandomization generated an almost uniform distribution for each type of victims, then the valuesin the intersection (from 40% to 55%), where we had more interest (where the Attribute framingeffect is more effective), had approximately the double of occurrences.
Figure 8.14: Distribution of first-aid kit usefulness probability values.
8.9.6.1 HO decisions analysis
Figure 8.15 shows the proportion of participants’ decisions as a function of the guidelines andthe frame selection conditions. Boxes show the standard error with a confidence interval of 95%for the mean.
Once the interactions had probabilities uniformly distributed (Fig. 8.14) from 15% to 80%, arational player should not perceive any difference among the sentences presented with differentguidelines and conditions, thus, all their means should be around 47.5%. However, observingFig. 8.15, it is easy to observe the “power” of the operational guidelines and the framing selection
131
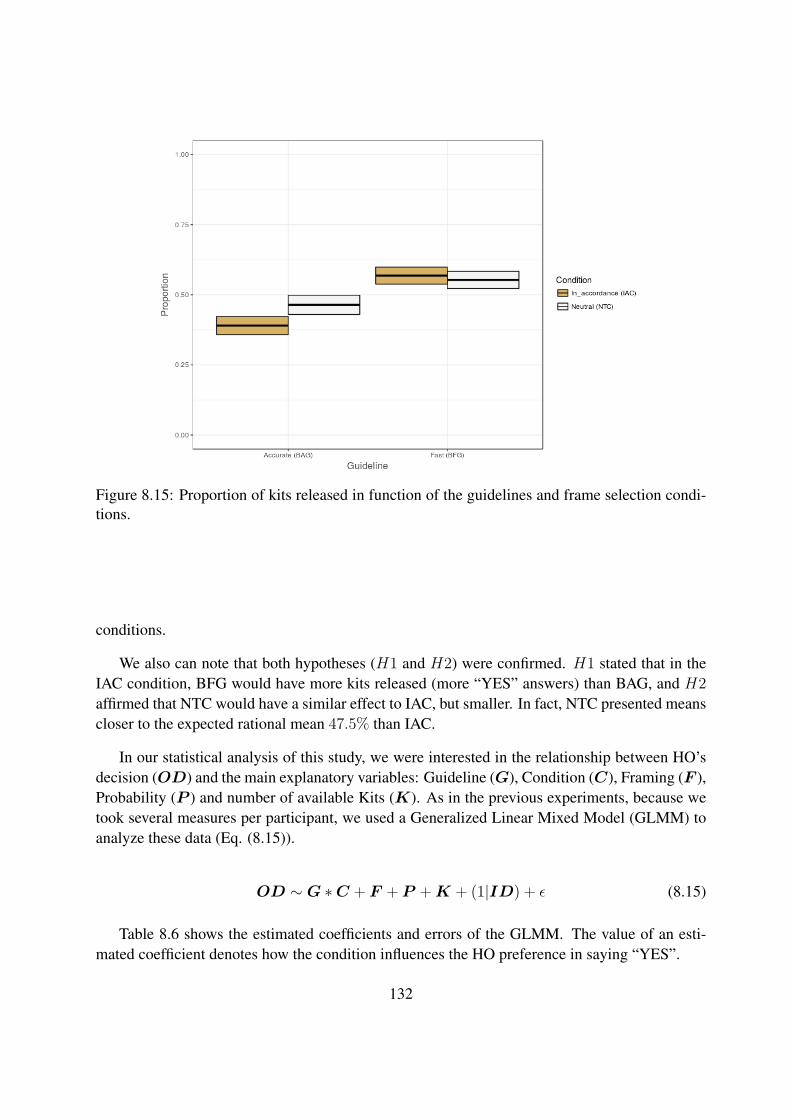
Figure 8.15: Proportion of kits released in function of the guidelines and frame selection condi-tions.
conditions.
We also can note that both hypotheses (H1 and H2) were confirmed. H1 stated that in theIAC condition, BFG would have more kits released (more “YES” answers) than BAG, and H2affirmed that NTC would have a similar effect to IAC, but smaller. In fact, NTC presented meanscloser to the expected rational mean 47.5% than IAC.
In our statistical analysis of this study, we were interested in the relationship between HO’sdecision (OD) and the main explanatory variables: Guideline (G), Condition (C), Framing (F ),Probability (P ) and number of available Kits (K). As in the previous experiments, because wetook several measures per participant, we used a Generalized Linear Mixed Model (GLMM) toanalyze these data (Eq. (8.15)).
OD ∼ G ∗C + F + P + K + (1|ID) + ε (8.15)
Table 8.6 shows the estimated coefficients and errors of the GLMM. The value of an esti-mated coefficient denotes how the condition influences the HO preference in saying “YES”.
132

Table 8.6: Experiment III - GLMM summary
Dependent variable:
answer
Guideline-Fast (BFG) 1.736∗∗∗
(0.220)
Condition-Neutral (NTC) 0.912∗∗∗
(0.150)
Framing −0.817∗∗∗
(0.140)
Probability 9.045∗∗∗
(0.404)
Available Kits −0.459∗∗∗
(0.023)
Guideline-Fast (BFG):Condition-In accordance (IAC) 0.264∗
(0.124)
Guideline-Accurate (BAG):Condition-Neutral (NTC) −0.556∗∗
(0.176)
Guideline-Accurate (BAG):Condition-In accordance (IAC) −1.468∗∗∗
(0.193)
Intercept −2.570∗∗∗
(0.200)
Note: ∗p<0.05; ∗∗p<0.01; ∗∗∗p<0.001
Hypothesis H1 Looking to the first line of Table 8.6 we can observe that, as expected, theparticipants tended to say more “Yes” with the guideline “be fast” (BFG) than with “be accurate”(BAG), confirming H1. The reason for that should be because, with the intention to be fast, they“sold” their kits cheap (with a low probability value), believing that they were still doing a goodjob with that decision.
133
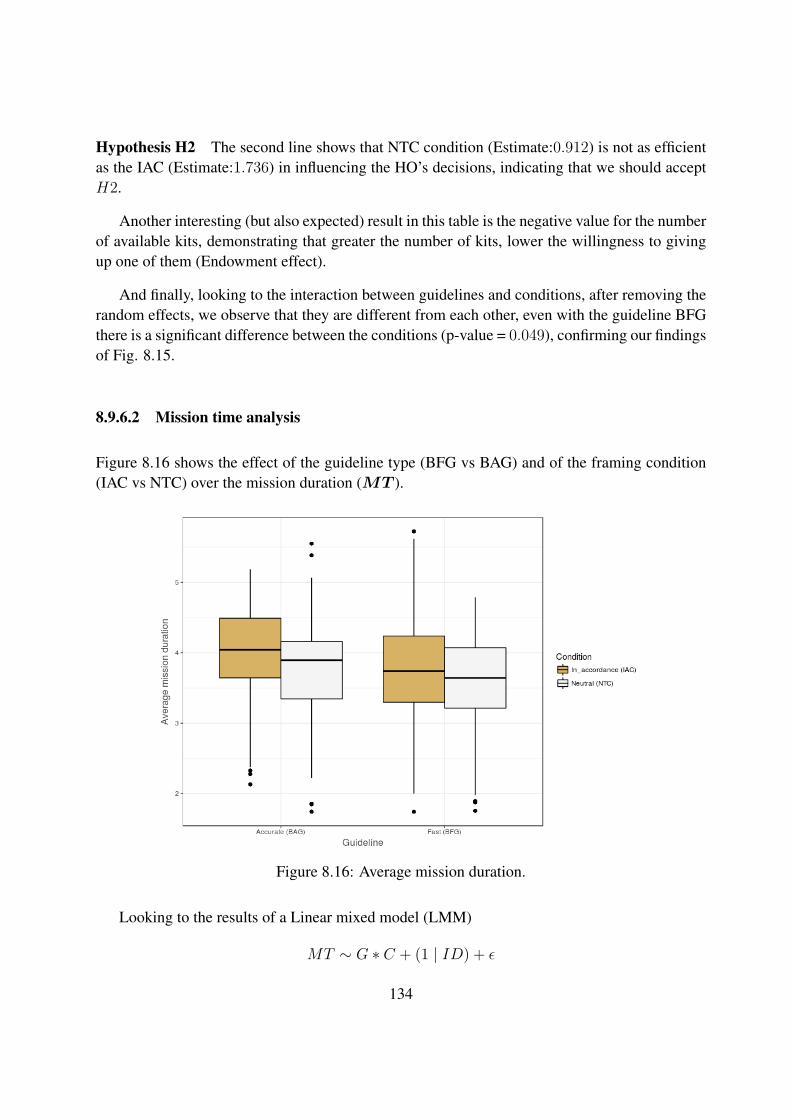
Hypothesis H2 The second line shows that NTC condition (Estimate:0.912) is not as efficientas the IAC (Estimate:1.736) in influencing the HO’s decisions, indicating that we should acceptH2.
Another interesting (but also expected) result in this table is the negative value for the numberof available kits, demonstrating that greater the number of kits, lower the willingness to givingup one of them (Endowment effect).
And finally, looking to the interaction between guidelines and conditions, after removing therandom effects, we observe that they are different from each other, even with the guideline BFGthere is a significant difference between the conditions (p-value = 0.049), confirming our findingsof Fig. 8.15.
8.9.6.2 Mission time analysis
Figure 8.16 shows the effect of the guideline type (BFG vs BAG) and of the framing condition(IAC vs NTC) over the mission duration (MT ).
Figure 8.16: Average mission duration.
Looking to the results of a Linear mixed model (LMM)
MT ∼ G ∗ C + (1 | ID) + ε
134
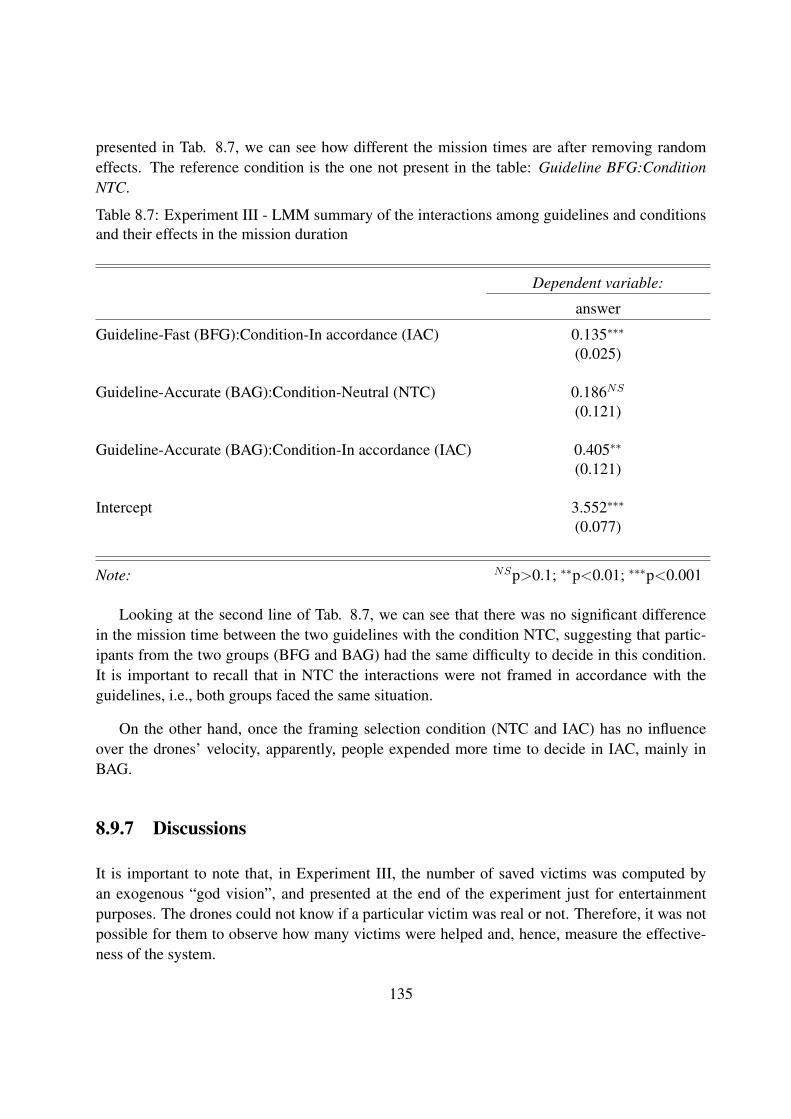
presented in Tab. 8.7, we can see how different the mission times are after removing randomeffects. The reference condition is the one not present in the table: Guideline BFG:ConditionNTC.
Table 8.7: Experiment III - LMM summary of the interactions among guidelines and conditionsand their effects in the mission duration
Dependent variable:
answer
Guideline-Fast (BFG):Condition-In accordance (IAC) 0.135∗∗∗
(0.025)
Guideline-Accurate (BAG):Condition-Neutral (NTC) 0.186NS
(0.121)
Guideline-Accurate (BAG):Condition-In accordance (IAC) 0.405∗∗
(0.121)
Intercept 3.552∗∗∗
(0.077)
Note: NSp>0.1; ∗∗p<0.01; ∗∗∗p<0.001
Looking at the second line of Tab. 8.7, we can see that there was no significant differencein the mission time between the two guidelines with the condition NTC, suggesting that partic-ipants from the two groups (BFG and BAG) had the same difficulty to decide in this condition.It is important to recall that in NTC the interactions were not framed in accordance with theguidelines, i.e., both groups faced the same situation.
On the other hand, once the framing selection condition (NTC and IAC) has no influenceover the drones’ velocity, apparently, people expended more time to decide in IAC, mainly inBAG.
8.9.7 Discussions
It is important to note that, in Experiment III, the number of saved victims was computed byan exogenous “god vision”, and presented at the end of the experiment just for entertainmentpurposes. The drones could not know if a particular victim was real or not. Therefore, it was notpossible for them to observe how many victims were helped and, hence, measure the effective-ness of the system.
135
Conversely, we can define a different measure of efficiency for our framework with the over-all utility (Eq. (8.1)), the sum of all drones’ utilities. Game-theoretical models, in which theplayers are self-centric (like ours), have a predictable degradation in their efficiency called Priceof anarchy (POA) [KP09]. In a centralized system, a central authority tells each agent what todo in order to maximize the global utility. On the other hand, in a decentralized version, eachagent chooses its own action, in accordance with some equilibrium with the opponents. In thissense, POA can be defined as the ratio between the optimal centralized solution and the “worst”equilibrium. Fortunately, in our framework the moving game is a potential game (see Sec. 4.3),in which the utilities of the players are aligned with the global utility, and the search game andHRI game involve respectively non-deterministic (nature) and stochastic (HO) opponents, thus,even a centralized system could not improve these utilities. Moreover, the utilities are orthogonalto each other (additive utilities – see Sec. 3.2.1). In other words, our system generates the samevalue for the global utility that a centralized system would produce (POA = 1).
Although we had not implemented a “control group”, in order to define the “normal behav-ior” of the participants, our results suggest that they mimicked the participants from the previousexperiments, since, they generally acted in accordance with the framing presented. Here, wemay recall that the neutral conditions (NTC) of both groups (BFG and BAG) had the same co-efficients to generate the framing, thus, without the guidelines influence they would be equal toeach other and aligned to the behavior presented by the participants from the previous experi-ments (the “experts”). Our findings also suggest that the NTC should be enough to produce theexpected average HO’s conduct, although the in accordance condition (IAC) was more efficientand presented better results. However, as shown in Experiment I (Sec. 5.5), every person hassome idiosyncratic factor that affects all decisions from the same subject, therefore, an averagepreference may not represent the preference of a particular HO.
We also believe that the blinking message at the top-right corner (Fig. 8.11b) enhanced theinfluence of the operational guidelines, reminding the participants how to proceed along themission.
About the mission duration, the results showed that the participants expended more timeto decide in IAC than in NTC. A possible explanation for this might be that the framing inaccordance with the guidelines (IAC) was not always aligned with the personal preference ofthe participants. For instance, in a BFG situation, a positive frame could be presented with aso low probability value that was not easy to the participant to say “YES”, making her or himexpend more time to decide. This hypothesis can be supported by the non-significance betweenthe results in NTC, in which the interactions were not framed in accordance with the operationalguidelines.
To sum up, our findings suggest that it is possible to optimize the HO’s decision-makingprocess, framing the HRI in accordance with the operational guidelines and strategies collectedfrom previous situations. In this sense, in a real-life context, it would be possible to lead novice
136
operators to act as experts.
8.9.8 Limitations
While in a web-based experiment it is easier to recruit participants, in comparison to a laboratory-based experiment. They can participate at any time, from their homes or offices, or even on abus, in any part of the world. It is hard to verify some experimental controls like for instance:comprehension of the experiment and the English language, attention and seriousness, networkspeed and reliability, browser type (the experiment was not designed for smartphones), and soon.
Due to the experimental manipulation it was necessary to reduce the number of variables,thus, this experiment was not a true MI-HRI, in the sense that only the drones had the initiativeduring the mission (adaptive autonomy). In a real scenario, the HO could also suggest a patternor prioritize some sectors, according to her expertise and the drones could decide to release (ornot) a kit if the HO was not available (or out of the communication range, for instance).
8.10 Considerations for a Real-World operation
Real-word operation of an air-robot requires several criteria that do not appear in abstract and the-oretical situations (e.g., the operation of a Global Hawk high-altitude UAV or an armed Reapermedium-altitude UAV). In case of a team of them, the system must demonstrate inter-robot co-ordination, robustness to uncertainty and robustness to failures, computational feasibility andscalability [Dia+04]. This section discusses how the proposed framework could be able to meetthese criteria.
8.10.1 Communication and coordination
In our model, the drones have a decentralized additive global utility and do not need a centralcoordination, neither have to select the best joint action for the team at each timestep, but ratherplay their lonely games and broadcast (in a limited range) their destination, and coordinationrises.
Each can guest were the others are, based on the last information received. Moreover, theycan not say if someone received their last report. In this sense, the range limitation make thedrone team works like an ant colony, in which when they are close to each other, they “want to
137
spread out” and explore the world, but if someone is too far, it “misses the others” and starts toinclude POIs in its path closer to them.
8.10.2 Robustness to uncertainty
Reasoning about uncertainty is intrinsic to GT. In our approach, the drones are able to select theiraction based on the available information at the moment. In this way, it is robust to incompleteinformation about teammates (HO included) and the environment.
Moreover, the framing effect approach can influence the novice operators and make them actas experts.
8.10.3 Robustness to failure
According to [Dia+04], there are three major types of failure in a robotic system: (1) communi-cation failure, (2) a partial robot malfunction in which the robot is still operable but in a reducedcapacity, and (3) complete robot failure in which the robot ceases to operate.
As shown in the Subsection 8.10.1, communication failure is not a big problem. If a droneloses its radio, it will work as if none else was in the mission.
One of the main advantages of providing the drones with the means for deciding their actionsis the absence of a centralized coordinator, which would represent a critical point of failure. Adistributed autonomous robotic system, enables redundancy, remaining functional if some of theagents fail. In the case of a complete failure of a drone, in function of the lack of informationthe idleness of the last point visited will start to increase, and the other teammates will considerpaying a visit to that spot and eventually find the crashed drone. Note that, it is not in the scopeof this work to define procedures to locate and rescue a team member.
In a partial malfunction, the mission efficiency is compromised, but nothing changes for thedrones.
8.10.4 Computational feasibility
The size of the search/patrol area is not a limitation issue for our approach, because the POIs,distance costs, and all possible path are calculated offline (outside of the drones), before themission, and a bank of optimal trajectories is registered in a lookup table inside the drones.Hence, the online process to select a path (δti(·) – Eq. (5.1)) is O(logPOI). Nevertheless, this
138
calculation can be more or less complex according to the algorithm used, for instance, O(POI2)for a straight line among POIs and O(POI · ELogPOI) for a Dykstra Algorithm.
The communication process has a constant complexity O(1), since the information is broad-cast regardless the number of drones that is in range.
The most expensive online operation in our algorithm is σti(·) (see Eq. (5.1) and (5.2)) whichhas a linear complexity O(n).
Finally, increasing the team size causes a linear increase in the computational time (O(n)).
8.10.5 Scalability
In a real-world mission, the maximum available number of agents must be considered, so thenumber of robots to be used is limited to the available robots. The proposed system have no bigissues with increasing the size of the team (O(n)) and, thus, supports an arbitrary real-life teamsize, as explained before.
8.11 Summary
In this chapter, it is shown our dynamic and decentralized framework to handle a human-dronesteam by implementing game-theoretical models. In this way, a heuristic utility function, whichconsiders three different games: (1) where to go, (2) how to search and (3) how to interact withHO, and the operational guidelines for the mission, was presented.
In the moving game (an anti-coordination potential game) not only the travel cost was con-sidered, but also the current positions of the other team members as well as the likelihood ofthe existence of a target in a given POI (e.g., in a SAR mission). To improve the real-timeperformance, the game was played only in the destination POI of each drone (macro-actions).
In order to choose a search pattern, a GAN was designed taking into account the worst casescenario (“Murphy’s law”), for which, we demonstrated that a mixed strategy might be the bestresponse to play.
The HRI game (designed as a sequential team game) took into account the human cognitivebiases (the framing and the endowment effects) to set the utility functions of the drones and toadapt dynamically HRIs, in order to increase the probability that HO selected the choice thatmaximizes the global utility.
Moreover, all games were adjusted by the operational guidelines of the mission (to be fast or
139

accurate – in our context). These games were played inside each drone, wherein NE is appliedto them in order to make their decisions.
In order to close the loop, we conducted an online experiment with a SAR context. Ourfindings denoted that participants could be led to mimic the behavior of the participants of ourprevious experiments, and the operational guidelines could influence the HO decision and in thedrones utilities when the HRI is framed accordingly. The main contributions of this study were:
• CR-10 – the operational guidelines driving drones utilities.
• CR-11 – the decisional model proposed in CR-9 is explored to align HO decisions withthe operational guidelines, allowing to close the loop in a "optimized" way.
• CH-12 – the FE leading HOs to decide in accordance with the operational guidelines.
Robust control of a drone team in the real world requires that a framework demonstrates inter-robot coordination, robustness to failures, computational feasibility and scalability. As discussedin this chapter our proposition should meet all these requirements.
140
Conclusion et perspectives
Good decisions come from experience.Experience comes from making baddecisions.
Mark Twain
Conclusion
Nowadays, research and design in HRI demand much greater attention from the Human Factorscommunity. For instance, in a military context, should robots decide whether to kill someone?Or must humans always be in the decision loop [GTP+12]? And the current big question: whata self-driving car should do if a person falls onto the road in front of it, when it can either swerveinto a barrier, potentially killing the passenger, or go straight, potentially killing the pedestrian[BSR16]?
There is no easy answer to those questions. Maybe the answer lies in the MI-HRI. Humanscan respond to ethical questions using intuition, but it’s not that simple for artificial intelligentsystems, the robot decision may emerge from the interaction of several sensors in order to cal-culate the moral tradeoff, or it can have a preset collection of moral rules [Bel+14].On the otherhand, the “fallible and emotional” human beings might improve their performances with a robotichelping hand.
With this in mind, this thesis was undertaken to design an MI-HRI framework made up of aHO and a team of drones, in which the HO and the drones have complementary skills and act syn-ergistically as peers to improve the system overall performance. In this sense, this work fulfillsa twofold objective: (1) taking care of the effectiveness of the human-robot team (robotic per-spective), and (2) improving the human-decision process in such an operational context (humanperspective).
Hence, we started the research with a literature review about dirty, dull and dangerous mis-sions suitable for our framework, such as military, SAR, and space missions. Then, we studiedthe human decision-making process and some of its theories (e.g., Prospect theory). Meanwhile,in the robotic perspective we focused on decentralized decision processes such as the Gametheory.
With those concepts, we designed our proposition step-by-step. Firstly, we developed agame-theoretical utility function to coordinate the drone team moves in an autonomous patrolling
141
mission. Here, besides the path travel cost, we also considered the current position of all dronesand the last time each point of interest (POI) was visited. With that information, we created anadditive payoff function of an anti-coordination game (ACG), in which a pure NE solution alignsthe self-centered objectives of the drones with a global objective.
Secondly, in order to observe if we could influence the HO’s decisions under uncertainty, timepressure and imperfect information, we conducted two framing effect (FE) experiments, using aSAR and a Sample-return mission as back-stories. Our findings demonstrated the existence ofthe FE and the influence of the emotional commitment in such context, and that the use of colorsas a complementary visual framing can enhance the influence of the text framing.
Thirdly, with the data collected in those experiments, we estimated a human utility functionand proposed a decisional model for the robots frame the interaction with the operator (HO), inorder to increase the probability of the HO choose an action that optimizes the global utility.
Thus, we close the loop, formalizing our dynamic decentralized game-theoretical propositionto drive the interactions of a human-drone team. For the interaction among the drones, we createdan ACG4, inspired in our patrolling mission approach. For the drone-environment interaction,when the drones had to select a search pattern, we designed a GAN and demonstrated that amixed strategy might be the best response to play. For the HRI, we created a sequential teamgame, where the drones make use of a fictitious play, based in the estimated HO’s utility to choosehow to interact with the HO. And, then, we biased these three games to follow the operationalguidelines (to be fast or accurate, in our last experiment). We also suggested that the overallutility may be used as an efficiency measure of the system.
At last, to evaluate our proposition, Experiment III was carried out. Our findings suggest thatit is possible to lead the HO to act in accordance with the operational guidelines and the “experts”strategies, regardless their previous experience, framing the HRI accordingly.
Limitations
The current investigation was limited by the data collected in Experiments I and II, in whichthe numbers of participants were relatively small. And, moreover, despite those participants hadexecuted ten missions each (in Experiment I), their data might not necessarily represent “experts’behaviors” as considered in Experiment III.
Another limitation is that Experiment III was not a true MI-HRI, in the sense that only thedrones had the initiative during the mission (adaptive autonomy).
4Anti-coordination game
142
Finally, it is unfortunate that this study did not include a real manner set-up with real dronesand human participants.
Contributions
This thesis provides authentic methods that can be replicated to evaluate the implementation ofgame-theoretical models and human-factors principles in an operational context. In this sense,this work brought together two different disciplines, engineering (robotics) and psychology (hu-man factors). Hence, the main contributions are:
• CR-1 – the formulation of an original player’s additive utility function composed by threeparameters that are independent from the action choices of the others players;
• CR-2 – the demonstration that the game solution is a NE, and that this equilibrium can beobtained by optimizing separately and individually the single player’s action choice;
• CR-3 – the proposal of a decentralized algorithm used to conduct a patrolling mission,which works considering minimum communication among agents.
• CH-4 – the observation of the FE in a operational context;
• CH-5 – the emotional commitment influence in the FE efficiency;
• CH-6 – the time-to-answer influence in the FE efficiency;
• CH-7 – the interference of the use of colors, as complementary visual framing, in the“power” of the FE;
• CH-8 – the HO’s utility function approximation founded on PT;
• CR-9 – a decisional model based on the economics approach of multi-dimensional con-sumption bundle and Prospect theory;
• CR-10 – the operational guidelines driving drones utilities.
• CR-11 – the decisional model proposed in CR-9 was explored to align HO decisions withthe operational guidelines, allowing to close the loop in a "optimized" way.
• CH-12 – the FE leading HOs to decide in accordance with the operational guidelines.
143
Future works
There is abundant room for further progress in this proposed framework. In the robotic per-spective, future studies should consider uncertainties in the drone movements and in the HOavailability, using online M/POMDP solvers. Offline solvers tend to be applicable only whendealing with small to mid-size domains, since the policy construction step takes significant time,because the algorithm returns a policy defining which action to execute in every possible beliefstate [Ros+08]. On the other hand, online solvers attempt to find a good local policy for thecurrent belief state of the agent only, which is nothing else than an one-shot stochastic game.One advantage is that it only needs to consider belief states that are reachable from the currentbelief state. However, in order to enhance the local policy optimality, should be interesting toincrease the horizon to a small number of timesteps (online planning), according to the onboardcomputational capacity (to avoid loss in performance). And, instead of re-planning at every step,make use of “macro-actions” (sets of atomic actions) to reduce the domain size.
Should be interesting as well to investigate an online reinforcement learning algorithm totune the HRI on-the-fly, based on the previous decisions made by the current HO. This mightadjust the system behavior in function of the HO performance.
In the human perspective, further research might explore tools from the transfer learningliterature [PY10] to: (1) in a first step clustering people that have a similar personal perceivedvalue; (2) applying in this case the appropriate perceived value function in accordance of thiscommon behavior.
Future research should also take into account HO’s cognitive states as, for instance, the op-erator’s workload or stress level. In general, the HO has some level of situation awareness, thatallow her to know the capacities of the artificial agent and its state. On the other side, whenadaptive autonomy or mixed initiative are considered, the artificial agent should have a model ofthe HO’s “capacities” and her current “state” [TD12]; [Dur+15]; [Gat+16]; [Roy+16] (see also[SCD15] in Appendix A). This might enhance the artificial agent decision process in order todecide if it takeover the initiative or not.
And, finally, a natural progression of this work is a real MI-HRI system, with more drones andmore HOs, in which all the agents can have the authority to control the initiative and, moreover,to opportunistically seize the initiative from the other when necessary.
144
APPENDIX A
MOMDP-based target search missiontaking into account
the human operator’s cognitive state
This study discusses the application of sequential decision making under uncer-tainty and mixed observability in a mixed-initiative robotic target search applica-tion. In such a robotic mission, two agents, a ground robot and a human opera-tor, must collaborate to reach a common goal using, each in turn, their recognizedskills. The originality of the work relies in considering that the human operatoris not a providential agent when the robot fails. Using the data from previous ex-periments, a Mixed Observability Markov Decision Process (MOMDP) model wasdesigned, which allows to consider aleatory failure events and the partial observablehuman operator’s state while planning for a long-term horizon. Results show thatthe collaborative system was in general able to successfully complete or terminatethe mission, even when many simultaneous sensors, devices and operators failureshappened. So, the mixed-initiative framework highlighted in this study shows therelevancy of taking into account the cognitive state of the operator, which permits tocompute a policy for the sequential decision problem which prevents to re-planningwhen unexpected (but known) events occurs.
A.1 Introduction
Unmanned Vehicles (UVs) are becoming increasingly present in a wide variety of operationalcontexts such as military operation, border security, inspection of contaminated area for preventhuman from hazard exposure. Most of scientific and technical efforts have focused on the imple-mentation of smart sensors, complex embedded systems and autonomy to enhance the efficiencyof the UVs [Thr+04], especially when the human operator can not analyze or access visual data[Thr+04]; [SMT09]; [FO05]; [CM03]. However these developments were generally achievedwithout questioning the integration of the human operators in the control loop [SST03]: the hu-man operator is considered as a providential agent that will be able to take over when sensors or
145
automations fail [CM03]; [FO05]; [SMT09]. Yet, poor user interface design, complexity of au-tomation and high operational pressure can leave the human operator ill-equipped when mentalworkload exceeds human capacity [Dur+14]. For instance, careless design of authority sharingcan lead to human-automation conflicts when the human operator misunderstand the automationbehavior [Deh+05]; [Deh+15]. The occurrence of such situation is critical as long as it maycause "mental confusion" (i.e. the human operator is unable to glance and process the relevantparameters) [Deh+15] or attentional tunneling (i.e. the human operator is excessively focused ona single display) [DCT11] yielding to irrational behavior [Deh+12]. Not surprisingly, a safetyanalysis report [Wil04] revealed that human factors issues were involved in 80% of accidents.This trend has led Cummings and Mitchell (2008) to state: "Because of the increased number ofsensors, the volume of information, and the operational demands that will naturally occur in amultiple-vehicle control environment, excessive cognitive demands will likely be placed on oper-ators. As a result, efficiently allocating attention between a set of dynamic tasks will be criticalto both human and system performance. - p. 451".
A promising avenue to deal with these issues is to consider that robot and human abilitiesare complementary and are likely to provide better performance when joined efficiently thanwhen used separately. This approach, known as mixed-initiative [AGH99]; [AC+04] defines therole of the human and artificial agents according to their recognized skills. It allows the humanand the robot to set the appropriate level of autonomy of the robot [HG09]. An interestingmixed-initiative proposition, presented by [Sel+06], relies on a statistical approach to determinewhich entity (i.e human or UVs) is the most efficient for a given task. Interestingly enough,this approach paves the way for allocating roles and sharing authority between the human andartificial agents. In [FO05], a mixed-initiative planning approach is proposed to monitoring thesystem and to coordinate operator’s interventions in a rescue scenario. In this work, the mixed-initiative planning continuously coordinates, integrates and monitors the operator’s interventionsand decisions. Another example can be found in [Gia+11], in which a robot and an humanoperator collaborate for an urban search and rescue mission in order to detect and report objectsof interest.
A key issue to design a mixed-initiative system is to implement a decision system. This latterdefines the role and the authority of human and artificial agents, while estimating capabilitiesof evolved human (intention, situation awareness, sensor’s failure perception) and robotic agent(sensor’s status, mission task, etc). Such decision-making system can be governed by a policyresulting from the resolution of a Partially Observable Markov Decision Process (POMDP), asproposed by [TMD11], which is able to adapt itself to the user’s intention getting feedback fromthe user in terms of satisfaction. A different way to drive interaction using POMDPs is studied in[Hoe+07] for assisting persons with dementia during hand-washing. Note that, the state vectorof the robot can be often considered as fully observable while the operator’s cognitive state is, bydefinition, partial observable. Such decomposition can be addressed using a Mixed Observabil-ity Markov Decision Process (MOMDP) [Ong+10], which is a stochastic model derived from
146
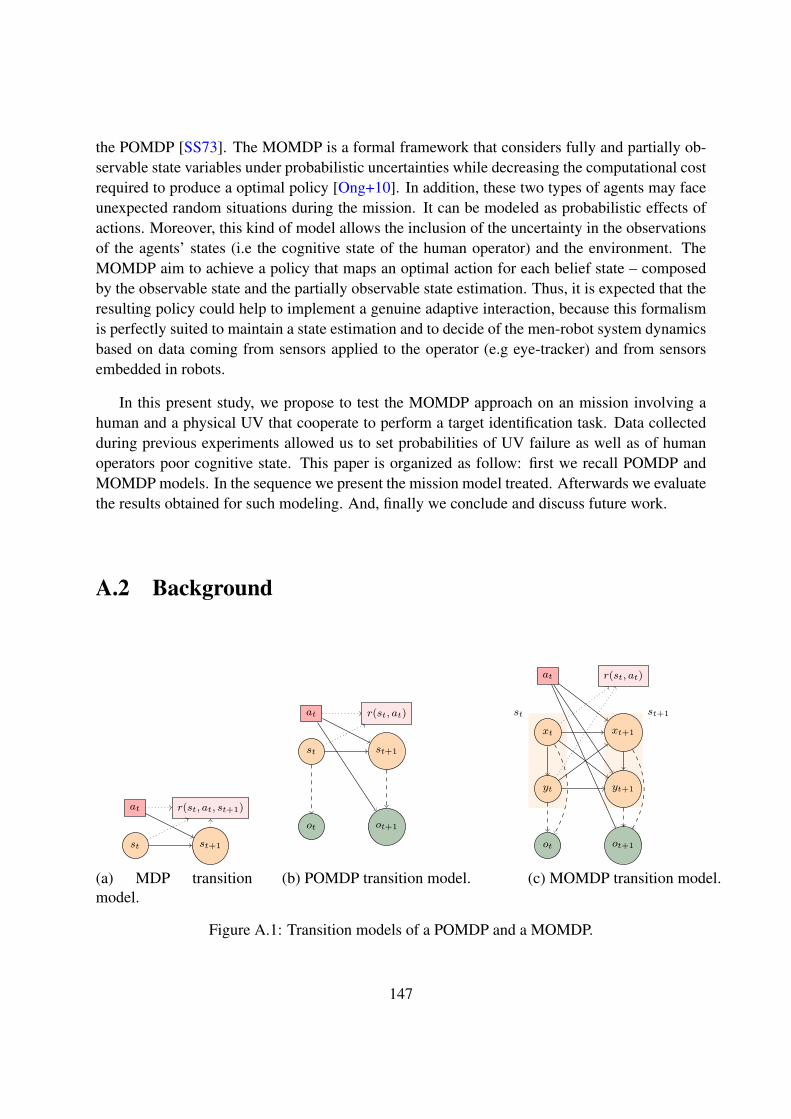
the POMDP [SS73]. The MOMDP is a formal framework that considers fully and partially ob-servable state variables under probabilistic uncertainties while decreasing the computational costrequired to produce a optimal policy [Ong+10]. In addition, these two types of agents may faceunexpected random situations during the mission. It can be modeled as probabilistic effects ofactions. Moreover, this kind of model allows the inclusion of the uncertainty in the observationsof the agents’ states (i.e the cognitive state of the human operator) and the environment. TheMOMDP aim to achieve a policy that maps an optimal action for each belief state – composedby the observable state and the partially observable state estimation. Thus, it is expected that theresulting policy could help to implement a genuine adaptive interaction, because this formalismis perfectly suited to maintain a state estimation and to decide of the men-robot system dynamicsbased on data coming from sensors applied to the operator (e.g eye-tracker) and from sensorsembedded in robots.
In this present study, we propose to test the MOMDP approach on an mission involving ahuman and a physical UV that cooperate to perform a target identification task. Data collectedduring previous experiments allowed us to set probabilities of UV failure as well as of humanoperators poor cognitive state. This paper is organized as follow: first we recall POMDP andMOMDP models. In the sequence we present the mission model treated. Afterwards we evaluatethe results obtained for such modeling. And, finally we conclude and discuss future work.
A.2 Background
at r(st, at, st+1)
st st+1
(a) MDP transitionmodel.
at r(st, at)
st st+1
ot ot+1
(b) POMDP transition model.
at r(st, at)
st
xt
yt
st+1
xt+1
yt+1
ot ot+1
(c) MOMDP transition model.
Figure A.1: Transition models of a POMDP and a MOMDP.
147
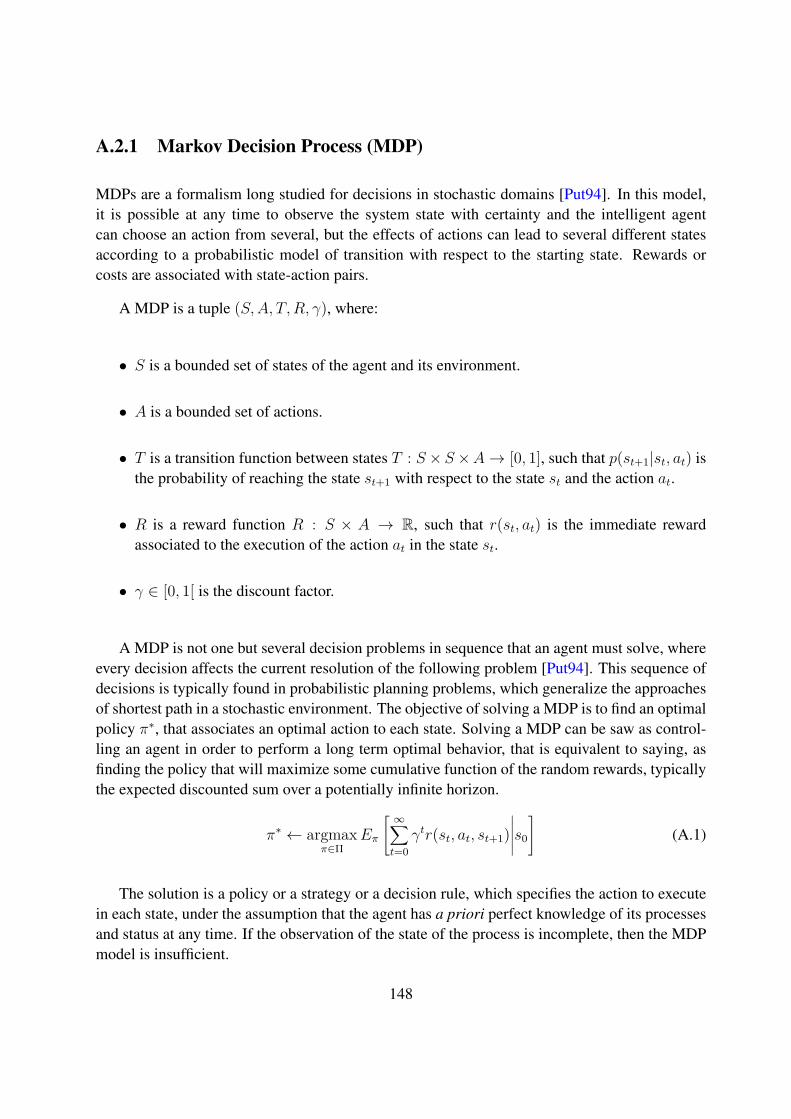
A.2.1 Markov Decision Process (MDP)
MDPs are a formalism long studied for decisions in stochastic domains [Put94]. In this model,it is possible at any time to observe the system state with certainty and the intelligent agentcan choose an action from several, but the effects of actions can lead to several different statesaccording to a probabilistic model of transition with respect to the starting state. Rewards orcosts are associated with state-action pairs.
A MDP is a tuple (S,A, T,R, γ), where:
• S is a bounded set of states of the agent and its environment.
• A is a bounded set of actions.
• T is a transition function between states T : S ×S ×A→ [0, 1], such that p(st+1|st, at) isthe probability of reaching the state st+1 with respect to the state st and the action at.
• R is a reward function R : S × A → R, such that r(st, at) is the immediate rewardassociated to the execution of the action at in the state st.
• γ ∈ [0, 1[ is the discount factor.
A MDP is not one but several decision problems in sequence that an agent must solve, whereevery decision affects the current resolution of the following problem [Put94]. This sequence ofdecisions is typically found in probabilistic planning problems, which generalize the approachesof shortest path in a stochastic environment. The objective of solving a MDP is to find an optimalpolicy π∗, that associates an optimal action to each state. Solving a MDP can be saw as control-ling an agent in order to perform a long term optimal behavior, that is equivalent to saying, asfinding the policy that will maximize some cumulative function of the random rewards, typicallythe expected discounted sum over a potentially infinite horizon.
π∗ ← argmaxπ∈Π
Eπ
[ ∞∑t=0
γtr(st, at, st+1)∣∣∣∣∣s0
](A.1)
The solution is a policy or a strategy or a decision rule, which specifies the action to executein each state, under the assumption that the agent has a priori perfect knowledge of its processesand status at any time. If the observation of the state of the process is incomplete, then the MDPmodel is insufficient.
148

A.2.2 POMDP overview
POMDPs model situations where the agent only has access to partial information about the stateof the system. A POMDP is a Markov Decision Process where the agent does not have access tothe state of the system: it has only a partial and imprecise observation [SS73]. In this context, theagent maintains a probability distribution over states, i.e. a belief state, which is updated aftereach action executed and observation perceived.
A POMDP is a tuple (S,A,Ω, T, O,R, b0, γ) where:
• S is a bounded set of states;
• A is a bounded set of actions;
• Ω is a bounded set of observations;
• T : S × A× S → [0; 1] is a transition function such that T (st+1, a, st) = p(st+1 | a, st);
• O : Ω× S → [0; 1] is an observation function such that O(ot, st) = p(ot|st);
• R : S × A→ R is a reward function associated with a state-action pair, and;
• b0 is the initial probability distribution over states.
• γ ∈ [0, 1[ is the discount factor
We note ∆ the belief state space. At each time step t, the agent updates its belief state defined asan element bt ∈ ∆ using the Bayes’ rule [SS73].
boa(s′) = p(o|s′, a)∑s p(s′|s, a)b(s)∑s′ p(o|s′, a)∑s p(s′|s, a)b(s) (A.2)
Solving a POMDP consists in finding a policy function π : ∆ → A that maps to each beliefstate an optimal action that maximizes a performance criterion. The expected discounted rewardfrom any initial belief V π(b) = Eπ [∑∞t=0 γ
tr(bt, π(bt)) | b0 = b] is usually optimized. The valueof an optimal policy π∗ is defined by the optimal value function V ∗ that satisfies the Bellmanoptimality equation:
V ∗(b) = maxa∈A
r(b, a) + γ∑o∈Ω
p(o|a, b)V ∗(boa) (A.3)
where, γ is the discount factor. When r(b, a), can be computed as an average gain r(b, a) =∑s r(s, a)b(s), the optimal value of belief states is proven to be piecewise linear and convex and
149
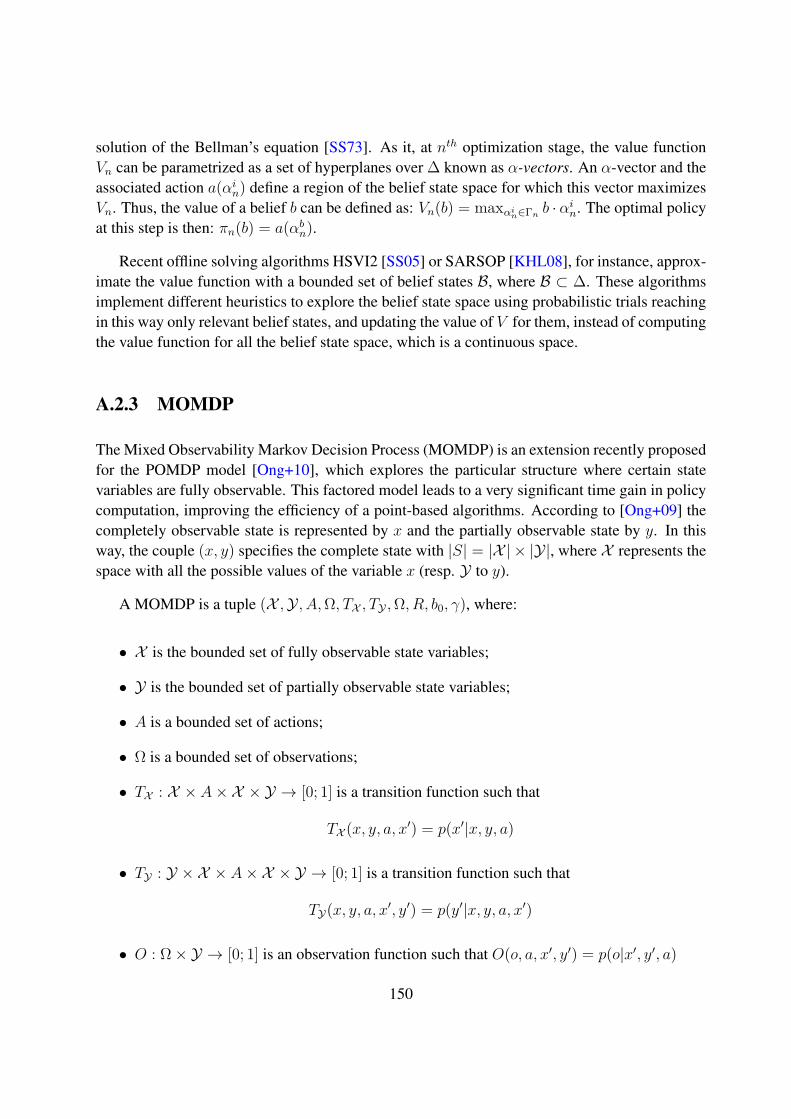
solution of the Bellman’s equation [SS73]. As it, at nth optimization stage, the value functionVn can be parametrized as a set of hyperplanes over ∆ known as α-vectors. An α-vector and theassociated action a(αin) define a region of the belief state space for which this vector maximizesVn. Thus, the value of a belief b can be defined as: Vn(b) = maxαi
n∈Γnb · αin. The optimal policy
at this step is then: πn(b) = a(αbn).
Recent offline solving algorithms HSVI2 [SS05] or SARSOP [KHL08], for instance, approx-imate the value function with a bounded set of belief states B, where B ⊂ ∆. These algorithmsimplement different heuristics to explore the belief state space using probabilistic trials reachingin this way only relevant belief states, and updating the value of V for them, instead of computingthe value function for all the belief state space, which is a continuous space.
A.2.3 MOMDP
The Mixed Observability Markov Decision Process (MOMDP) is an extension recently proposedfor the POMDP model [Ong+10], which explores the particular structure where certain statevariables are fully observable. This factored model leads to a very significant time gain in policycomputation, improving the efficiency of a point-based algorithms. According to [Ong+09] thecompletely observable state is represented by x and the partially observable state by y. In thisway, the couple (x, y) specifies the complete state with |S| = |X | × |Y|, where X represents thespace with all the possible values of the variable x (resp. Y to y).
A MOMDP is a tuple (X ,Y , A,Ω, TX , TY ,Ω, R, b0, γ), where:
• X is the bounded set of fully observable state variables;
• Y is the bounded set of partially observable state variables;
• A is a bounded set of actions;
• Ω is a bounded set of observations;
• TX : X × A×X × Y → [0; 1] is a transition function such that
TX (x, y, a, x′) = p(x′|x, y, a)
• TY : Y × X × A×X × Y → [0; 1] is a transition function such that
TY(x, y, a, x′, y′) = p(y′|x, y, a, x′)
• O : Ω× Y → [0; 1] is an observation function such that O(o, a, x′, y′) = p(o|x′, y′, a)
150
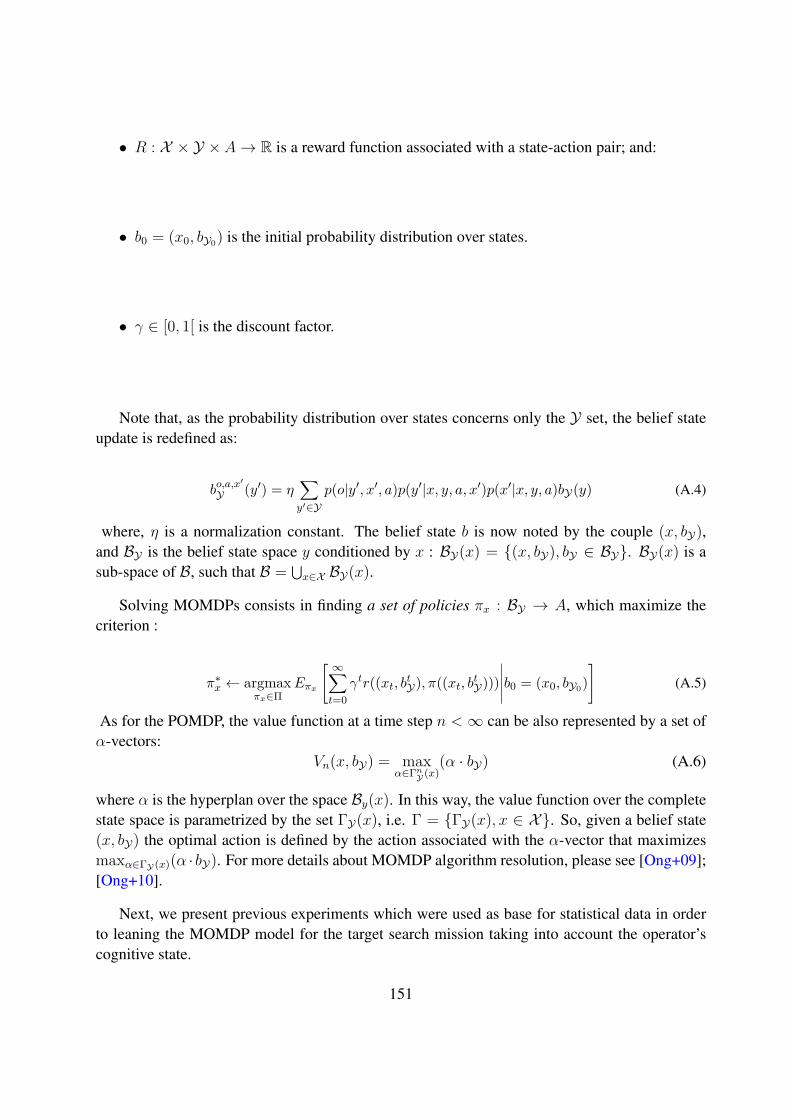
• R : X × Y × A→ R is a reward function associated with a state-action pair; and:
• b0 = (x0, bY0) is the initial probability distribution over states.
• γ ∈ [0, 1[ is the discount factor.
Note that, as the probability distribution over states concerns only the Y set, the belief stateupdate is redefined as:
bo,a,x′
Y (y′) = η∑y′∈Y
p(o|y′, x′, a)p(y′|x, y, a, x′)p(x′|x, y, a)bY(y) (A.4)
where, η is a normalization constant. The belief state b is now noted by the couple (x, bY),and BY is the belief state space y conditioned by x : BY(x) = (x, bY), bY ∈ BY. BY(x) is asub-space of B, such that B = ⋃
x∈X BY(x).
Solving MOMDPs consists in finding a set of policies πx : BY → A, which maximize thecriterion :
π∗x ← argmaxπx∈Π
Eπx
[ ∞∑t=0
γtr((xt, btY), π((xt, btY)))∣∣∣∣∣b0 = (x0, bY0)
](A.5)
As for the POMDP, the value function at a time step n <∞ can be also represented by a set ofα-vectors:
Vn(x, bY) = maxα∈Γn
Y (x)(α · bY) (A.6)
where α is the hyperplan over the space By(x). In this way, the value function over the completestate space is parametrized by the set ΓY(x), i.e. Γ = ΓY(x), x ∈ X. So, given a belief state(x, bY) the optimal action is defined by the action associated with the α-vector that maximizesmaxα∈ΓY (x)(α · bY). For more details about MOMDP algorithm resolution, please see [Ong+09];[Ong+10].
Next, we present previous experiments which were used as base for statistical data in orderto leaning the MOMDP model for the target search mission taking into account the operator’scognitive state.
151

A.3 Previous Experiments
A.3.1 Material
The experimental set-up was developed at ISAE-SUPAERO. It was composed of a robot and aground station. The robot was equipped with different sensors such as a GPS for autonomousnavigation, an Ultrasound sensor to detect and avoid obstacle, a video camera and an Xbee trans-mitter to communicate with the ground station. It had a 15 minutes autonomy thanks to electricalbattery. The robot could be operated in manual mode or in supervised mode. In manual mode,the robot was operated with a joystick. In supervised mode, the robot performed waypoint navi-gation autonomously, but any action of the operator with the joystick let her/him take over untilthe joystick was released. The ground station was displayed on a 24-inch screen showing differ-ent kinds of information to control and supervise the robot such as a tactical map, a panoramicvideo scene screen; a mission synoptic ; an interactive panel sending the requests to the humanoperator; a status panel panel indicating the state of the GPS, the ultrasound sensor and the bat-tery; and a guidance mode state (i.e. supervised or manual). Note that the operator could not seethe robot and only gathered information through the screen. Fig. A.2 shows the interface of theground station to operate the robot during the mission.
Figure A.2: Operator’s interface and areas of interest [Rég+14].
A.3.2 Assessing probability of failures of the robot
A first experiment was conducted to assess the probability of failure of the different sensors anddevices embedded in the robot. Thirty tests were run and consisted of a 10 minutes navigation
152
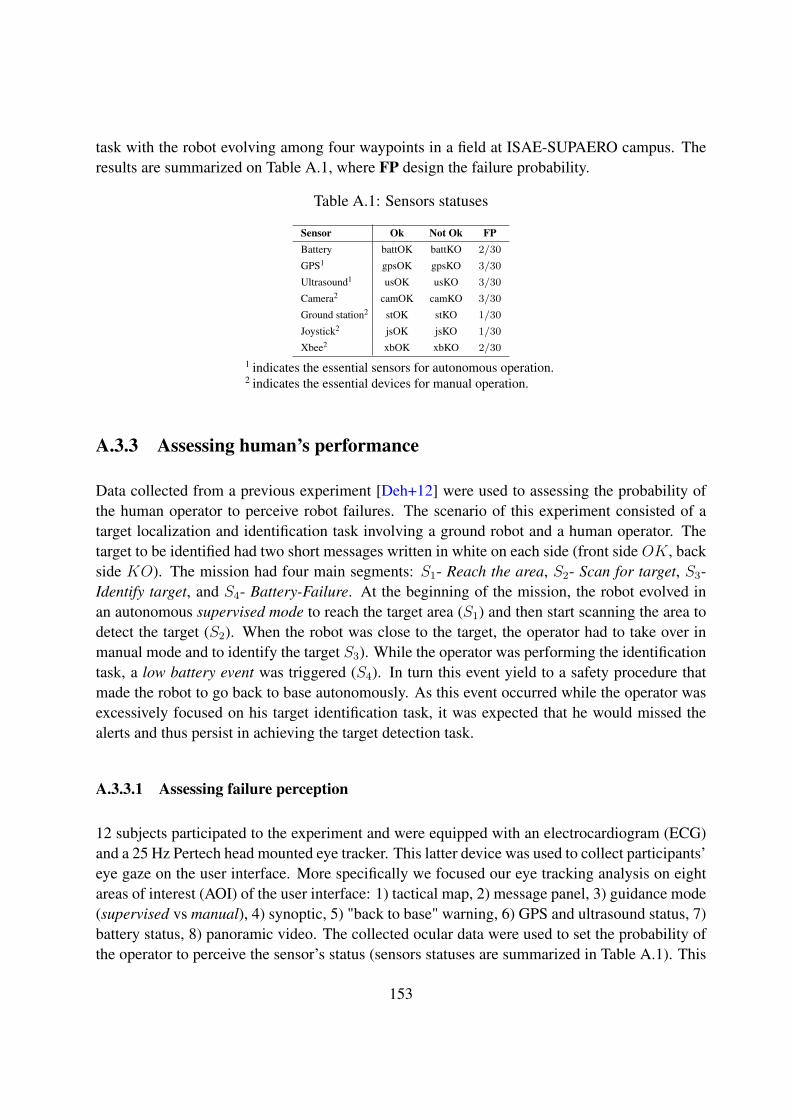
task with the robot evolving among four waypoints in a field at ISAE-SUPAERO campus. Theresults are summarized on Table A.1, where FP design the failure probability.
Table A.1: Sensors statuses
Sensor Ok Not Ok FPBattery battOK battKO 2/30GPS1 gpsOK gpsKO 3/30Ultrasound1 usOK usKO 3/30Camera2 camOK camKO 3/30Ground station2 stOK stKO 1/30Joystick2 jsOK jsKO 1/30Xbee2 xbOK xbKO 2/30
1 indicates the essential sensors for autonomous operation.2 indicates the essential devices for manual operation.
A.3.3 Assessing human’s performance
Data collected from a previous experiment [Deh+12] were used to assessing the probability ofthe human operator to perceive robot failures. The scenario of this experiment consisted of atarget localization and identification task involving a ground robot and a human operator. Thetarget to be identified had two short messages written in white on each side (front side OK, backside KO). The mission had four main segments: S1- Reach the area, S2- Scan for target, S3-Identify target, and S4- Battery-Failure. At the beginning of the mission, the robot evolved inan autonomous supervised mode to reach the target area (S1) and then start scanning the area todetect the target (S2). When the robot was close to the target, the operator had to take over inmanual mode and to identify the target S3). While the operator was performing the identificationtask, a low battery event was triggered (S4). In turn this event yield to a safety procedure thatmade the robot to go back to base autonomously. As this event occurred while the operator wasexcessively focused on his target identification task, it was expected that he would missed thealerts and thus persist in achieving the target detection task.
A.3.3.1 Assessing failure perception
12 subjects participated to the experiment and were equipped with an electrocardiogram (ECG)and a 25 Hz Pertech head mounted eye tracker. This latter device was used to collect participants’eye gaze on the user interface. More specifically we focused our eye tracking analysis on eightareas of interest (AOI) of the user interface: 1) tactical map, 2) message panel, 3) guidance mode(supervised vs manual), 4) synoptic, 5) "back to base" warning, 6) GPS and ultrasound status, 7)battery status, 8) panoramic video. The collected ocular data were used to set the probability ofthe operator to perceive the sensor’s status (sensors statuses are summarized in Table A.1). This
153

sensor status perception probability is based on the normalized sum of the averaged fixation time(∆T ) on the related AOIs. For instance, when the GPS or the ultrasound are lost, the icons turnsto red (area 6) and the robot is stopped (i.e it can be seen through the panoramic video - area8). When the low-battery event occurs, three changes can be observed in the user interface: (i)the battery icon (area 7) turns to orange with the associated low battery message, (ii) the modechanges automatically from manual to supervised, and area 3 blinks twice and (iii) the segmentstatus became back to base (area 5).
Thus we introduced the spGpsUs boolean state variable that can be used to model perceptionabout a GPS or ultrasound status by the operator:
p(spGpsUs = Y | auto && (gpsKO || usKO)) = ∆TArea 6 + ∆TArea 8
∆T all areas= 0.70
p(spGpsUs = Y |manual && (gpsKO || usKO)) = 0.86
With the same reasoning, for the spBatt (Battery status perception) boolean state variable,the transition probability was defined by the normalized sum of the averaged time that the par-ticipants expended looking to areas 3, 5 and 7 during the manual and autonomous operations:
p(spBatt = Y |manual && battKO) = ∆TArea 3 + ∆TArea 5 + ∆TArea 7
∆T all areas= 0.021
p(spBatt = Y | auto && battKO) = 0.033
A.3.3.2 Assessing cognitive availability
the result of the experiment revealed that 8 participants out of 12 did not understand the robotbehavior, though some of them glanced at the battery failure indicator. These 8 participant per-severed to achieve the no-longer-relevant identification task [Deh+12]. This typical behavior isknown as "attentional tunneling" and is defined as "the allocation of attention to a particularchannel of information, diagnostic hypothesis or task goal, for a duration that is longer than op-timal, given the expected costs of neglecting events on other channels, failing to consider otherhypotheses, or failing to perform other tasks" [TW04]. Therefore, the inference of such impairedattentional state is of great importance to design a mixed initiative system. We implemented anAdaptive Neuro-Fuzzy Inference System (ANFIS) to detect attentional tunneling that is associ-ated with higher cardiac activity, decreased saccadic activity and long concentrated eye fixations[Rég+14]. The ANFIS classifier had a probability of 91.1% to detect Attention Tunneling (pleasereport to [Rég+14] for more details). This detection probability was used in this study to define
154
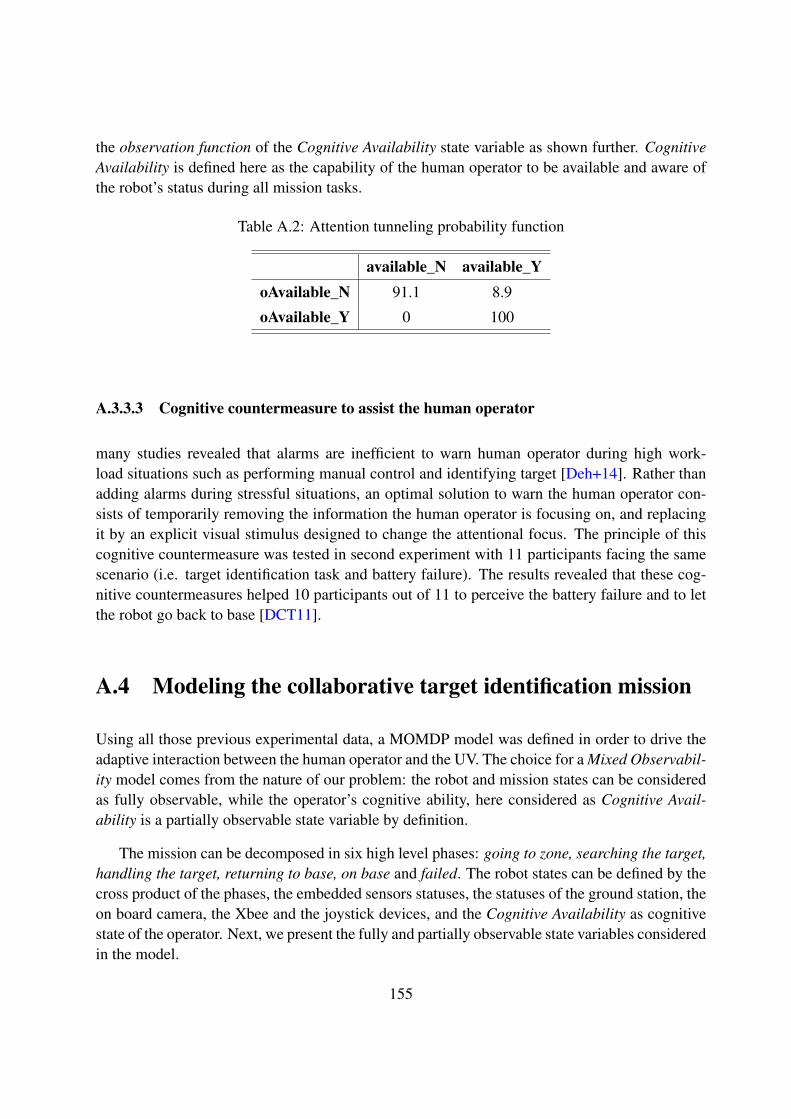
the observation function of the Cognitive Availability state variable as shown further. CognitiveAvailability is defined here as the capability of the human operator to be available and aware ofthe robot’s status during all mission tasks.
Table A.2: Attention tunneling probability function
available_N available_YoAvailable_N 91.1 8.9
oAvailable_Y 0 100
A.3.3.3 Cognitive countermeasure to assist the human operator
many studies revealed that alarms are inefficient to warn human operator during high work-load situations such as performing manual control and identifying target [Deh+14]. Rather thanadding alarms during stressful situations, an optimal solution to warn the human operator con-sists of temporarily removing the information the human operator is focusing on, and replacingit by an explicit visual stimulus designed to change the attentional focus. The principle of thiscognitive countermeasure was tested in second experiment with 11 participants facing the samescenario (i.e. target identification task and battery failure). The results revealed that these cog-nitive countermeasures helped 10 participants out of 11 to perceive the battery failure and to letthe robot go back to base [DCT11].
A.4 Modeling the collaborative target identification mission
Using all those previous experimental data, a MOMDP model was defined in order to drive theadaptive interaction between the human operator and the UV. The choice for a Mixed Observabil-ity model comes from the nature of our problem: the robot and mission states can be consideredas fully observable, while the operator’s cognitive ability, here considered as Cognitive Avail-ability is a partially observable state variable by definition.
The mission can be decomposed in six high level phases: going to zone, searching the target,handling the target, returning to base, on base and failed. The robot states can be defined by thecross product of the phases, the embedded sensors statuses, the statuses of the ground station, theon board camera, the Xbee and the joystick devices, and the Cognitive Availability as cognitivestate of the operator. Next, we present the fully and partially observable state variables consideredin the model.
155
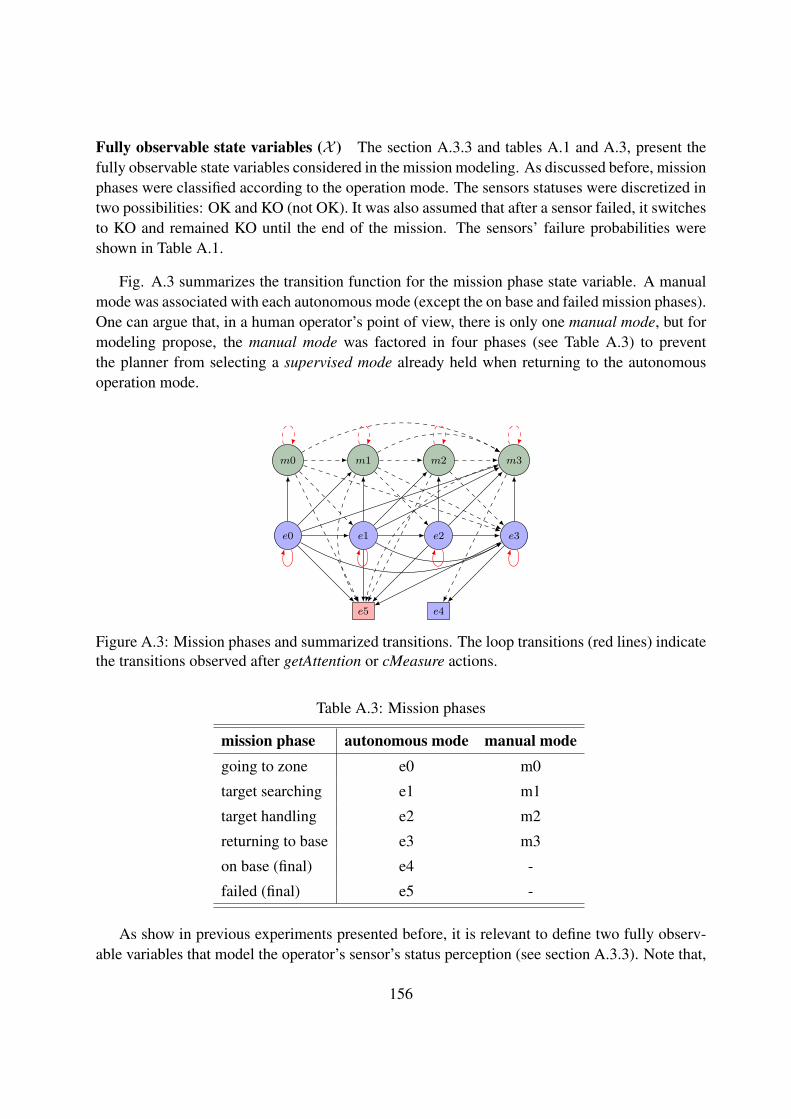
Fully observable state variables (X ) The section A.3.3 and tables A.1 and A.3, present thefully observable state variables considered in the mission modeling. As discussed before, missionphases were classified according to the operation mode. The sensors statuses were discretized intwo possibilities: OK and KO (not OK). It was also assumed that after a sensor failed, it switchesto KO and remained KO until the end of the mission. The sensors’ failure probabilities wereshown in Table A.1.
Fig. A.3 summarizes the transition function for the mission phase state variable. A manualmode was associated with each autonomous mode (except the on base and failed mission phases).One can argue that, in a human operator’s point of view, there is only one manual mode, but formodeling propose, the manual mode was factored in four phases (see Table A.3) to preventthe planner from selecting a supervised mode already held when returning to the autonomousoperation mode.
e0 e1 e2 e3
e4e5
m0 m1 m2 m3
Figure A.3: Mission phases and summarized transitions. The loop transitions (red lines) indicatethe transitions observed after getAttention or cMeasure actions.
Table A.3: Mission phases
mission phase autonomous mode manual modegoing to zone e0 m0
target searching e1 m1
target handling e2 m2
returning to base e3 m3
on base (final) e4 -
failed (final) e5 -
As show in previous experiments presented before, it is relevant to define two fully observ-able variables that model the operator’s sensor’s status perception (see section A.3.3). Note that,
156
operator’s perception about sensor’s status (GPS/ultrasound and battery) state variables are as-sumed as fully observable, because it is not possible to observe if the human operator perceived(i.e. his cognitive process) only with the eye-tracker device. In this case, for example, if theoperator looked to the areas (6 and 8) between two decision time steps, he should detect, witha probability of 0.70, for supervised mode, or 0.86, for manual mode, if there was a GPS or aultrasound breakdown because the related icon turns to orange (see Fig. A.2 and Section A.3.3).
Partially observable state variable (Y) The operator’s Cognitive Availability is considered inthis study as the opposite of Attentional Tunneling [DCT11]; [PDT11]; [Rég+14]. The measureof the allocation of attention if not a straightforward task [Rég+14]. Therefore, we consider theCognitive Availability of the human operator as a partially observable variable. Hence: avail-able_Y models that the human operator is cognitively available (resp. available_N, not cogni-tively available). Associated with this partially observable state variable we have two possibleobservations: oAvailable_Y meaning that the operator is observed as cognitively available andpotentially aware of the situation and oAvailable_N modeling that he is observed as not cogni-tively available. Table A.2 summarizes the observation probability function for this observationvariable.
Actions Discrete actions were defined as: goToZone, tgtSearch, tgtHandle, retBase, onBase,getAttention and cMeasure. Action result depends on the aleatory sensors behavior (cf. Ta-ble A.1). For instance, in a nominal case and based on previous works [DCT11]; [PDT11];[Rég+14], the robot is able to autonomously navigate and avoid obstacles, but if the robot cho-sen goToZone and the ultrasound sensor fails, the mission phase turns to manual mode (m0) (seeFig. A.3) because the robot is no more able to avoid obstacles autonomously. If a low batteryevent arrives, the robot can return to the base automatically if it was in a supervised mode. Whenit was in a manual mode, it can switch to returning to base (with any action) automatically only ifthe human operator is aware of the failure, i.e. if he was observed as cognitively available beingaware of the situation and by consequence leaving the joystick.
The getAttention is considered as a non deterministic action, since it should be used whenthe robot needed help and the operator’s Cognitive Availability was estimated as "not available"(oAvailable_N). The same occurs with the action cMeasure (countermeasure), which should beexecuted when a low battery event arrives during a manual operation and the operator was con-sidered as "not available" (e.g his attention was focused on handling the robot and he would notnotice the alerts on the user interface). In such case, when a cMeasure action is launched therobot wait the human operator leaves the joystick (see Fig. A.3).
Rewards The reward function (R) was designed in order to payoff suitable actions, for in-stance, goToZone in the phase e0 when the navigation sensors are OK, and to punish otherwise.
157
The same occurs with the manual modes and its essential devices (cf. Table A.1). Note that, wehave chosen to associate a increasing reward with sequential phases, i.e. reward associated withthe action tgtSearch in e1 considering essential sensors are OK (R=15) is more important thanthe action goToZone in the e0 phase (R=10). We have considered that processing the target inmanual mode is more dependable than in autonomous mode, since the interpretation done by thehuman operator is more reliable. In this case, the reward for the choice of tgtHandle in manualmode (R=30) is more important than tgtHandle in supervised mode (R=20).
The action getAttention only has a positive payoff (R=30) if the operator’s Cognitive Avail-ability is estimated as "not available" (oAvailable_N) considering that at least one of the essentialdevices are KO and that the human operator did not see the alert, otherwise the reward is nega-tive (−500). Similarly, the action cMeasure has a positive payoff (R=50) only if the operator isperceived as "not available" in a manual mode when a low battery event arrives.
A mission is considered as fully accomplished if the robot had passed through the phases e2or m2 (resp. processed the target autonomously or manually) and arrived at base e4. When therobot returns to the base (autonomously or manually) before processing the target, the mission isconsidered as aborted and when the robot is unable to reach the base, the mission is consideredas failed.
A.5 Simulation Results
The APPL_0.96win SARSOP1 [Ong+09] was used as solver. The grammar of this solver hasa special format that differs from the classical input POMDP file format2. Therefore, we havedeveloped a script written in Python 2.7.8 to produce the MOMDP input file. For the MOMDPresolution, we have set the precision ε to 0.01. We recall that this precision is related to thedifference between the upper and lower bound of the value function for the initial belief state,which is considered as a stop optimization criterion.
Statistical analysis was performed to process the results over 5000 policy simulations. Fig.A.4a provides an overview of how many times the robot passed by each mission phase. Notethat, the robot passed through phase e1 exactly 5000 times and never crossed the phase m0, thiscan be explained by the fact that the initial state, when all fully observable state variable valuesare known, caused a deterministic cycle in the first time stamp.
To sum up, the mission was fully accomplished 2998 times (59.96%) (cf. Fig. A.4b), mean-ing that the robot has passed through the phases e2 or m2, respectively processing the targetautonomously or manually, and arrived at base e4. In such cases, the target was handled in
1http://bigbird.comp.nus.edu.sg/pmwiki/farm/appl/2http://www.pomdp.org/code/pomdp-file-spec.shtml
158

0
1000
2000
3000
4000
5000
6000
e0/m0 e1/m1 e2/m2 e3/m3 e4 e5
autonomous
manual
failed/aborted
(a) Number of visits per mission phase. (b) Percentages.
autonomous mode (e2) 1228 times, which represents 41% of successful missions, and it washandled in manual mode (m2) 1770 times (resp. 59% of successful missions). Fig. A.4b alsoshows that the robot returned to the base in 68.72% of times (including aborted missions). Themission completely failed, i.e. it reached e5, 1564 times (31.28%).
The Table A.4 presents an example of a Fully accomplished mission where the robot changedits mode to manual (m2) for the operator process the target (bigger reward), then the GPS failed.This was not a problem at that moment because the operator did not need the GPS to handle thetarget. Next, the robot remained in manual (m3) but the operator seemed not to be aware, so, therobot ask for his attention (action getAttention), and the operator led the robot to the base.
Table A.4: Fully accomplished mission example
O X Y
Step oAvailable Batt GPS US Cam Joystick Station Xbee Phase spBatt spGpsUs available Action Reward
1 - OK OK OK OK OK OK OK e0 Y Y N goToZone 10
2 Y OK OK OK OK OK OK OK e1 N N Y tgtSearch 15
3 Y OK KO OK OK OK OK OK m2 N N Y tgtHandle 30
4 N OK KO OK OK OK OK OK m3 N Y N getAttention 30
5 Y OK KO OK OK OK OK OK m3 N Y Y retBase 35
6 N OK KO OK OK OK OK OK e4 N Y N onBase 35
Finally, a aborted mission is shown in the table A.5. In this aborted mission a low batteryevent occurred while the operator was processing the target and the robot observed him or heras "not available" (not aware) of the failure. Consequently, the robot executed a countermeasure
159
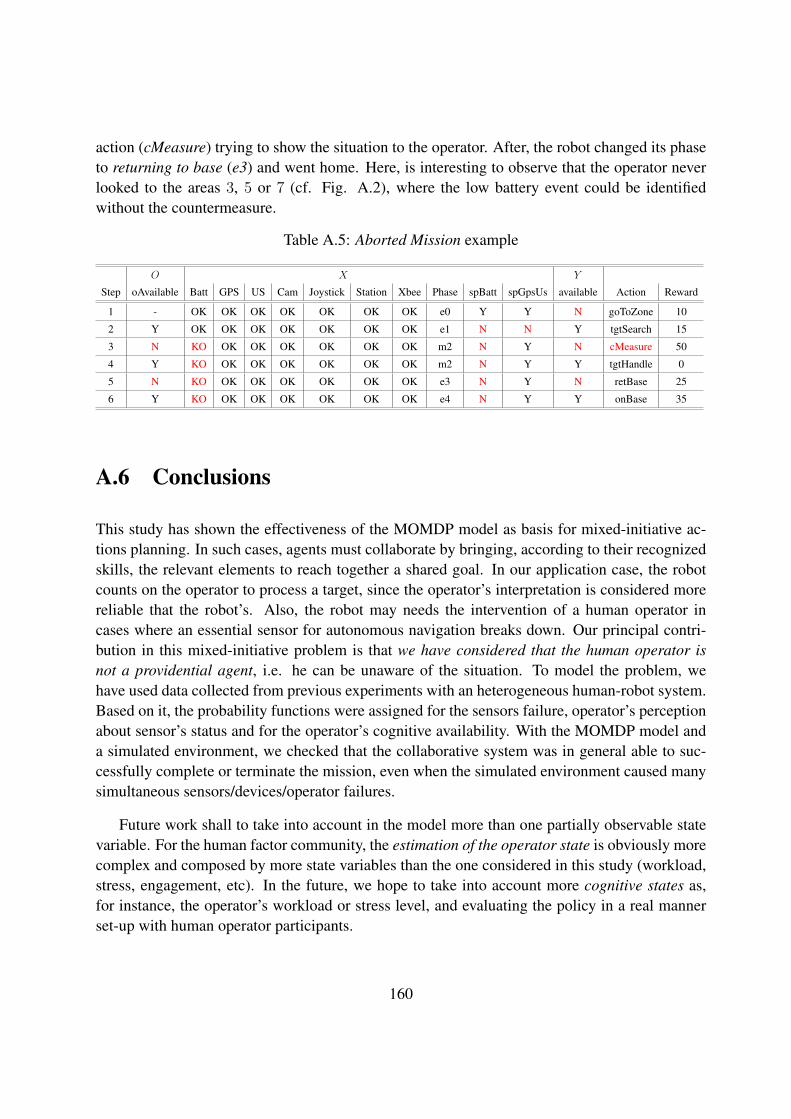
action (cMeasure) trying to show the situation to the operator. After, the robot changed its phaseto returning to base (e3) and went home. Here, is interesting to observe that the operator neverlooked to the areas 3, 5 or 7 (cf. Fig. A.2), where the low battery event could be identifiedwithout the countermeasure.
Table A.5: Aborted Mission example
O X Y
Step oAvailable Batt GPS US Cam Joystick Station Xbee Phase spBatt spGpsUs available Action Reward
1 - OK OK OK OK OK OK OK e0 Y Y N goToZone 10
2 Y OK OK OK OK OK OK OK e1 N N Y tgtSearch 15
3 N KO OK OK OK OK OK OK m2 N Y N cMeasure 50
4 Y KO OK OK OK OK OK OK m2 N Y Y tgtHandle 0
5 N KO OK OK OK OK OK OK e3 N Y N retBase 25
6 Y KO OK OK OK OK OK OK e4 N Y Y onBase 35
A.6 Conclusions
This study has shown the effectiveness of the MOMDP model as basis for mixed-initiative ac-tions planning. In such cases, agents must collaborate by bringing, according to their recognizedskills, the relevant elements to reach together a shared goal. In our application case, the robotcounts on the operator to process a target, since the operator’s interpretation is considered morereliable that the robot’s. Also, the robot may needs the intervention of a human operator incases where an essential sensor for autonomous navigation breaks down. Our principal contri-bution in this mixed-initiative problem is that we have considered that the human operator isnot a providential agent, i.e. he can be unaware of the situation. To model the problem, wehave used data collected from previous experiments with an heterogeneous human-robot system.Based on it, the probability functions were assigned for the sensors failure, operator’s perceptionabout sensor’s status and for the operator’s cognitive availability. With the MOMDP model anda simulated environment, we checked that the collaborative system was in general able to suc-cessfully complete or terminate the mission, even when the simulated environment caused manysimultaneous sensors/devices/operator failures.
Future work shall to take into account in the model more than one partially observable statevariable. For the human factor community, the estimation of the operator state is obviously morecomplex and composed by more state variables than the one considered in this study (workload,stress, engagement, etc). In the future, we hope to take into account more cognitive states as,for instance, the operator’s workload or stress level, and evaluating the policy in a real mannerset-up with human operator participants.
160
Bibliography
[Abd+16] Mohammed Abdellaoui et al. “Measuring loss aversion under ambiguity: a methodto make prospect theory completely observable”. In: Journal of Risk and Uncer-tainty 52.1 (2016), pp. 1–20 (cit. on p. 37).
[ABG09] Francesco Amigoni, Nicola Basilico, and Nicola Gatti. “Finding the optimal strate-gies for robotic patrolling with adversaries in topologically-represented environ-ments”. In: Robotics and Automation, 2009. ICRA’09. IEEE International Confer-ence on. IEEE. 2009, pp. 819–824 (cit. on p. 10).
[AC+04] Mitchell Ai-Chang et al. “Mapgen: mixed-initiative planning and scheduling for themars exploration rover mission”. In: Intelligent Systems, IEEE 19.1 (2004), pp. 8–12 (cit. on pp. 2, 146, 178).
[AGH99] JE Allen, Curry I Guinn, and E Horvtz. “Mixed-initiative interaction”. In: IEEETransactions on Intelligent Systems and their Applications 14.5 (1999), pp. 14–23(cit. on pp. 2, 15, 146, 178).
[AK11] Alan Agresti and Maria Kateri. Categorical data analysis. Springer, 2011 (cit. onp. 86).
[AKK14] Christopher Amato, George D Konidaris, and Leslie P Kaelbling. “Planning withmacro-actions in decentralized POMDPs”. In: Proceedings of the 2014 interna-tional conference on Autonomous agents and multi-agent systems. InternationalFoundation for Autonomous Agents and Multiagent Systems. 2014, pp. 1273–1280(cit. on pp. 3, 179).
[Ama+13] Christopher Amato et al. “Decentralized control of partially observable Markovdecision processes”. In: Decision and Control (CDC), 2013 IEEE 52nd AnnualConference on. IEEE. 2013, pp. 2398–2405 (cit. on pp. 3, 179).
[Ama+14] Christopher Amato et al. “Decentralized Decision-Making Under Uncertainty forMulti-Robot Teams”. In: the Workshop on Future of Multiple Robot Research andits Multiple Identitie at IROS. IEEE. 2014 (cit. on pp. 3, 179).
[Ami+10] Francesco Amigoni et al. “Moving game theoretical patrolling strategies from the-ory to practice: An usarsim simulation”. In: Robotics and Automation (ICRA), 2010IEEE International Conference on. IEEE. 2010, pp. 426–431 (cit. on p. 66).
[An+12] Bo An et al. “Security games with limited surveillance”. In: Ann Arbor 1001 (2012),p. 48109 (cit. on pp. 66, 67).
[AS14] Fahed Awad and Rufaida Shamroukh. “Human Detection by Robotic Urban Searchand Rescue Using Image Processing and Neural Networks”. In: International Jour-nal of Intelligence Science 4.02 (2014), p. 39 (cit. on p. 130).
161

[AT+15] Hend Al Tair et al. “Decentralized multi-agent POMDPs framework for humans-robots teamwork coordination in search and rescue”. In: Information and Commu-nication Technology Research (ICTRC), 2015 International Conference on. IEEE.2015, pp. 210–213 (cit. on p. 9).
[Bar02] Luiz Fernando Barrichelo. “Game Theory for Managers”. In: (2002) (cit. on pp. 40,183).
[Bar07] J. Baron. Thinking and Deciding. Cambridge University Press, 2007 (cit. on pp. 20,22, 25, 29, 30, 32).
[Bar13] Nicholas C Barberis. “Thirty years of prospect theory in economics: A review andassessment”. In: The Journal of Economic Perspectives 27.1 (2013), pp. 173–195(cit. on p. 35).
[Bat+15] Douglas Bates et al. “Fitting Linear Mixed-Effects Models Using lme4”. In: Jour-nal of Statistical Software 67.1 (2015), pp. 1–48 (cit. on p. 86).
[BCJ15] Michael J Barnes, Jessie YC Chen, and Florian Jentsch. “Designing for Mixed-Initiative Interactions between Human and Autonomous Systems in Complex En-vironments”. In: Systems, Man, and Cybernetics (SMC), 2015 IEEE InternationalConference on. IEEE. 2015, pp. 1386–1390 (cit. on p. 16).
[BE01] Brian H Bornstein and A Christine Emler. “Rationality in medical decision mak-ing: a review of the literature on doctors’ decision-making biases”. In: Journal ofevaluation in clinical practice 7.2 (2001), pp. 97–107 (cit. on p. 23).
[Bec08] Martin Beckenkamp. “Playing strategically against nature? Decisions viewed froma game-theoretic frame”. In: (2008) (cit. on pp. 57, 58, 118).
[Bel+14] Aline Belloni et al. “Towards A Framework To Deal With Ethical Conflicts In Au-tonomous Agents And Multi-Agent Systems”. In: CEPE 2014 Well-Being, Flour-ishing, and ICTs. 2014, paper–8 (cit. on pp. 141, 192).
[Ber+02] Daniel S Bernstein et al. “The complexity of decentralized control of Markov deci-sion processes”. In: Mathematics of operations research 27.4 (2002), pp. 819–840(cit. on pp. 3, 179).
[Bev+15] Giuseppe Bevacqua et al. “Mixed-Initiative Planning and Execution for MultipleDrones in Search and Rescue Missions.” In: ICAPS. 2015, pp. 315–323 (cit. onp. 16).
[BGA09] Nicola Basilico, Nicola Gatti, and Francesco Amigoni. “Developing a deterministicpatrolling strategy for security agents”. In: Web Intelligence and Intelligent AgentTechnologies, 2009. WI-IAT’09. IEEE/WIC/ACM International Joint Conferenceson. Vol. 2. IEEE. 2009, pp. 565–572 (cit. on p. 78).
[BJR08] G.E.P. Box, G.M. Jenkins, and G.C. Reinsel. Time Series Analysis: Forecasting andControl. Wiley Series in Probability and Statistics. Wiley, 2008 (cit. on p. 75).
162
[BM04] JL Burke and RR Murphy. “Human-robot interaction in USAR technical search:Two heads are better than one”. In: Robot and Human Interactive Communication,2004. ROMAN 2004. 13th IEEE International Workshop on. IEEE. 2004, pp. 307–312 (cit. on pp. 9, 11).
[BSR16] Jean-François Bonnefon, Azim Shariff, and Iyad Rahwan. “The social dilemmaof autonomous vehicles”. In: Science 352.6293 (2016), pp. 1573–1576 (cit. onpp. 141, 192).
[Bur+00] Wolfram Burgard et al. “Collaborative multi-robot exploration”. In: Robotics andAutomation, 2000. Proceedings. ICRA’00. IEEE International Conference on. Vol. 1.IEEE. 2000, pp. 476–481 (cit. on pp. 1, 10, 177).
[Bur+05] Wolfram Burgard et al. “Coordinated multi-robot exploration”. In: IEEE Transac-tions on robotics 21.3 (2005), pp. 376–386 (cit. on pp. 1, 10, 177).
[Cal+16] Gloria L Calhoun et al. “Human-autonomy collaboration and coordination towardmulti-RPA missions”. In: Remotely piloted aircraft systems: A human systems inte-gration perspective (2016), p. 109 (cit. on p. 13).
[Car70] Jaime R Carbonell. “AI in CAI: An artificial-intelligence approach to computer-assisted instruction”. In: IEEE transactions on man-machine systems 11.4 (1970),pp. 190–202 (cit. on p. 15).
[CDL11] Christos G Cassandras, Xu Chu Ding, and Xuchao Lin. “An optimal control ap-proach for the persistent monitoring problem”. In: Decision and Control and Eu-ropean Control Conference (CDC-ECC), 2011 50th IEEE Conference on. IEEE.2011, pp. 2907–2912 (cit. on p. 78).
[CF12] Sven F Crone and Steven Finlay. “Instance sampling in credit scoring: An empiricalstudy of sample size and balancing”. In: International Journal of Forecasting 28.1(2012), pp. 224–238 (cit. on p. 130).
[Che+13] Ting Brendan Chen et al. “Management of heterogeneous UAVs through a capabil-ity framework of UAV’s functional autonomy”. In: (2013) (cit. on p. 11).
[Che04] Y. Chevaleyre. “Theoretical analysis of the multi-agent patrolling problem”. In:Intelligent Agent Technology, 2004. (IAT 2004). Proceedings. IEEE/WIC/ACM In-ternational Conference on. 2004, pp. 302–308 (cit. on p. 66).
[Cho+13] Eun Kyoung Choe et al. “Nudging people away from privacy-invasive mobile appsthrough visual framing”. In: IFIP Conference on Human-Computer Interaction.Springer. 2013, pp. 74–91 (cit. on p. 83).
[CM03] Jennifer Casper and Robin R. Murphy. “Human-robot interactions during the robot-assisted urban search and rescue response at the World Trade Center”. In: IEEETransactions on Systems, Man, and Cybernetics, Part B: Cybernetics 33.3 (2003),pp. 367–385 (cit. on pp. 1, 145, 146, 177).
163
[CM08] Mary L Cummings and Paul J Mitchell. “Predicting controller capacity in supervi-sory control of multiple UAVs”. In: Systems, Man and Cybernetics, Part A: Systemsand Humans, IEEE Transactions on 38.2 (2008), pp. 451–460 (cit. on pp. 2, 178).
[Col04] Frank Colucci. “Air Force refines training programs for UAV (unmanned aerialvehicle) operators”. In: National Defense 88.606 (2004), pp. 36–39 (cit. on pp. 8,11).
[DCT11] Frédéric Dehais, Mickaël Causse, and Sébastien Tremblay. “Mitigation of Con-flicts with Automation Use of Cognitive Countermeasures”. In: Human Factors:The Journal of the Human Factors and Ergonomics Society 53.5 (2011), pp. 448–460 (cit. on pp. 2, 25, 146, 155, 157, 178).
[Deh+05] Frédéric Dehais et al. “Towards an anticipatory agent to help pilots”. In: AAAI 2005Fall Symposium" From Reactive to Anticipatory Cognitive Embodied Systems", Ar-lington, Virginia. 2005 (cit. on pp. 2, 146, 178).
[Deh+12] Frédéric Dehais et al. “Cognitive conflict in human–automation interactions: a psy-chophysiological study”. In: Applied ergonomics 43.3 (2012), pp. 588–595 (cit. onpp. 2, 146, 153, 154, 178).
[Deh+14] Frédéric Dehais et al. “Failure to Detect Critical Auditory Alerts in the Cockpit Ev-idence for Inattentional Deafness”. In: Human Factors: The Journal of the HumanFactors and Ergonomics Society 56.4 (2014), pp. 631–644 (cit. on p. 155).
[Deh+15] Frederic Dehais et al. “Automation Surprise in Aviation: Real-Time Solutions”. In:Proceedings of the 33rd Annual ACM Conference on Human Factors in ComputingSystems. ACM. 2015, pp. 2525–2534 (cit. on pp. 2, 146, 178).
[Dia+04] M Bernardine Dias et al. “Robust multirobot coordination in dynamic environ-ments”. In: Robotics and Automation, 2004. Proceedings. ICRA’04. 2004 IEEEInternational Conference on. Vol. 4. IEEE. 2004, pp. 3435–3442 (cit. on pp. 137,138).
[DM+06] Benedetto De Martino et al. “Frames, biases, and rational decision-making in thehuman brain”. In: Science 313.5787 (2006), pp. 684–687 (cit. on pp. 19, 25, 182).
[DS] Avinash Dixit and Susan Skeath. “Games of Strategy. 1999”. In: Duncan Luce & ()(cit. on pp. 40, 183).
[DT05] Navneet Dalal and Bill Triggs. “Histograms of oriented gradients for human de-tection”. In: Computer Vision and Pattern Recognition, 2005. CVPR 2005. IEEEComputer Society Conference on. Vol. 1. IEEE. 2005, pp. 886–893 (cit. on p. 130).
[Dur+14] Gautier Durantin et al. “Using near infrared spectroscopy and heart rate variabilityto detect mental overload”. In: Behavioural brain research 259 (2014), pp. 16–23(cit. on pp. 1, 146, 178).
164
[Dur+15] Gautier Durantin et al. “Processing functional near infrared spectroscopy signalwith a Kalman filter to assess working memory during simulated flight”. In: Fron-tiers in human neuroscience 9 (2015) (cit. on pp. 144, 196).
[EAS17] EASA. unmanned aircraft systems uas and remotely piloted aircraft systems. 2017.URL: https://www.easa.europa.eu/unmanned-aircraft-systems-uas-and-remotely-piloted-aircraft-systems-rpas#group-easa-downloads (cit. on pp. 8, 12).
[Ech+11] Gilberto Echeverria et al. “Modular open robots simulation engine: Morse”. In:Robotics and Automation (ICRA), 2011 IEEE International Conference on. IEEE.2011, pp. 46–51 (cit. on pp. 123, 189).
[ESA16] ESA. ESA - Robotic exploration of Mars: Mars sample return. 2016. URL: http://exploration.esa.int/mars/44995-mars-sample-return/(cit. on pp. 9, 10).
[FO05] Alberto Finzi and Andrea Orlandini. “A mixed-initiative approach to human-robotinteraction in rescue scenarios”. In: American Association for Artificial Intelligence(www. aaai. org) (2005) (cit. on pp. 1, 145, 146, 177).
[Fon+05] Terrence Fong et al. “The peer-to-peer human-robot interaction project”. In: 2005(cit. on p. 82).
[Gat+16] Thibault Gateau et al. “Considering human’s non-deterministic behavior and hisavailability state when designing a collaborative human-robots system”. In: Intel-ligent Robots and Systems (IROS), 2016 IEEE/RSJ International Conference on.IEEE. 2016, pp. 4391–4397 (cit. on pp. 144, 196).
[GGK02] Thomas Gilovich, Dale Griffin, and Daniel Kahneman. Heuristics and biases: Thepsychology of intuitive judgment. Cambridge university press, 2002 (cit. on p. 26).
[Gia+11] Mario Gianni et al. “Awareness in Mixed Initiative Planning.” In: AAAI Fall Sym-posium: Robot-Human Teamwork in Dynamic Adverse Environment. 2011 (cit. onp. 146).
[Gon+05] Cleotilde Gonzalez et al. “The framing effect and risky decisions: Examining cogni-tive functions with fMRI”. In: Journal of economic psychology 26.1 (2005), pp. 1–20 (cit. on p. 25).
[Gon07] Cristophe Gonzales. A tutorial on additive utility functions. 2007. URL: http://webia.lip6.fr/~gonzales/research/tutoriel_utilite.php(cit. on pp. 30, 31).
[GT99] Gerd Gigerenzer and Peter M Todd. “Fast and frugal heuristics: The adaptive tool-box”. In: Simple heuristics that make us smart. Oxford University Press, 1999,pp. 3–34 (cit. on p. 26).
165
[GTP+12] Florian Gros, Catherine Tessier, Thierry Pichevin, et al. “Ethics and authority shar-ing for autonomous armed robots”. In: Autonomous Agents (RDA2) 2012 7 (2012)(cit. on pp. 141, 192).
[HCB+13] Erik Hernández, Jaime del Cerro, Antonio Barrientos, et al. “Game theory modelsfor multi-robot patrolling of infrastructures”. In: International Journal of AdvancedRobotic Systems 10.181 (2013) (cit. on pp. 10, 66).
[Hea99] Marti A. Hearst. “Trends & Controversies: Mixed-initiative interaction.” In: IEEEIntelligent Systems 14.5 (1999), pp. 14–23 (cit. on pp. 13, 82).
[HG09] Benjamin Hardin and Michael A Goodrich. “On using mixed-initiative control: aperspective for managing large-scale robotic teams”. In: Proceedings of the 4thACM/IEEE international conference on Human robot interaction. ACM. 2009,pp. 165–172 (cit. on pp. 15, 146).
[Hoe+07] Jesse Hoey et al. “Assisting persons with dementia during handwashing using a par-tially observable Markov decision process”. In: Proc. Int. Conf. on Vision Systems.Vol. 65. 2007, p. 66 (cit. on p. 146).
[Hua+04] Hui-Min Huang et al. “Autonomy measures for robots”. In: Proceedings of the 2004ASME International Mechanical Engineering Congress & Exposition, Anaheim,California. 2004, pp. 1–7 (cit. on p. 14).
[Hua+05] Hui-Min Huang et al. “A framework for autonomy levels for unmanned systems(ALFUS)”. In: Proceedings of AUVSI Unmanned Systems 2005 (2005) (cit. onp. 13).
[Hua07] Hui-Min Huang. “Autonomy levels for unmanned systems (ALFUS) framework:safety and application issues”. In: Proceedings of the 2007 Workshop on Perfor-mance Metrics for Intelligent Systems. ACM. 2007, pp. 48–53 (cit. on p. 13).
[IHC11] Volkan Isler, Geoffrey A Hollinger, and Timothy H Chung. “Search and Pursuit-Evasion in Mobile Robotics, A survey”. In: (2011) (cit. on p. 78).
[JA15] Shu Jiang and Ronald C Arkin. “Mixed-Initiative Human-Robot Interaction: Def-inition, Taxonomy, and Survey”. In: Systems, Man, and Cybernetics (SMC), 2015IEEE International Conference on. IEEE. 2015, pp. 954–961 (cit. on pp. 8, 15, 16).
[Jea10] Abdel-Illah Mouaddib Shlomo Zilberstein Aurélie Beynier Laurent Jeanpierre. “ADecision-Theoretic Approach to Cooperative Control and Adjustable Autonomy”.In: European Conference on Artificial Intelligence (ECAI). 2010 (cit. on p. 15).
[JPL17] JPL. Mars sample return. June 2017. URL: https://www.jpl.nasa.gov/missions/mars-sample-return-msr/ (cit. on pp. 8, 10, 11).
[Kah11] Daniel Kahneman. Thinking, fast and slow. Macmillan, 2011 (cit. on pp. 20–22,24, 25, 82).
166
[KH08] Derek J Koehler and Nigel Harvey. Blackwell handbook of judgment and decisionmaking. John Wiley & Sons, 2008 (cit. on p. 110).
[KH93] Gary A Klein and Robert R Hoffman. “Perceptual-cognitive aspects of expertise”.In: Cognitive science foundations of instruction (1993), pp. 203–226 (cit. on p. 27).
[Kha07] Mohammad Emtiyaz Khan. Game theory models for pursuit evasion games. Tech.rep. Technical report, University of British Columbia, Vancouver, 2007 (cit. onp. 66).
[KHL08] H. Kurniawati, D. Hsu, and W.S. Lee. “SARSOP: Efficient point-based POMDPplanning by approximating optimally reachable belief spaces”. In: Proc. RSS. 2008(cit. on p. 150).
[Kle89] Gary A Klein. Strategies of decision making. Tech. rep. KLEIN ASSOCIATES INCYELLOW SPRINGS OH, 1989 (cit. on p. 26).
[Kle97] Gary Klein. “Developing expertise in decision making”. In: Thinking & Reasoning3.4 (1997), pp. 337–352 (cit. on pp. 27, 82).
[Kle99] Gary A Klein. Sources of power: How people make decisions. MIT press, 1999(cit. on pp. 4, 27, 180).
[Kni12] Frank H Knight. Risk, uncertainty and profit. Courier Corporation, 2012 (cit. onp. 34).
[KP09] Elias Koutsoupias and Christos Papadimitriou. “Worst-case equilibria”. In: Com-puter science review 3.2 (2009), pp. 65–69 (cit. on p. 136).
[KR06] Botond Koszegi and Matthew Rabin. “A model of reference-dependent prefer-ences”. In: The Quarterly Journal of Economics (2006), pp. 1133–1165 (cit. onpp. 35, 37, 38, 98, 101, 107).
[KT79] Daniel Kahneman and Amos Tversky. “Prospect theory: An analysis of decisionunder risk”. In: Econometrica: Journal of the econometric society (1979), pp. 263–291 (cit. on pp. 4, 33, 35, 98, 180).
[Kuh08] Max Kuhn. “Building Predictive Models in R Using the caret Package”. In: Journalof Statistical Software, Articles 28.5 (2008), pp. 1–26 (cit. on p. 106).
[LaV06] Steven M LaValle. Planning algorithms. Cambridge university press, 2006 (cit. onpp. 32, 33).
[LBS08] K. Leyton-Brown and Y. Shoham. Essentials of Game Theory:A Concise Multidis-ciplinary Introduction. Morgan and Claypool, 2008, p. 88 (cit. on pp. 40, 42–44,47, 55, 183).
[Lev+02] Irwin P Levin et al. “A new look at framing effects: Distribution of effect sizes,individual differences, and independence of types of effects”. In: Organizationalbehavior and human decision processes 88.1 (2002), pp. 411–429 (cit. on p. 26).
167
[LKS16] Subhash R. Lele, Jonah L. Keim, and Peter Solymos. ResourceSelection: ResourceSelection (Probability) Functions for Use-Availability Data. R package version 0.2-6. 2016 (cit. on p. 87).
[LL13] Matthieu Lesnoff and Renaud Lancelot. aods3: analysis of overdispersed data us-ing S3 methods. aods3 package version 0.4-1. 2013 (cit. on p. 87).
[LSG98] I. P. Levin, S. L. Schneider, and G. J. Gaeth. “All frames are not created equal: Atypology and critical analysis of framing effects”. In: Organizational behavior andhuman decision processes 76.2 (1998), pp. 149–188 (cit. on pp. 25, 26, 83, 128).
[LWN08] Yuan Li, Bo Wu, and Ram Nevatia. “Human detection by searching in 3D spaceusing camera and scene knowledge”. In: Pattern Recognition, 2008. ICPR 2008.19th International Conference on. IEEE. 2008, pp. 1–5 (cit. on p. 130).
[MBJ15] Olivier Masson, Jean Baratgin, and Frank Jamet. “NAO robot and the “endowmenteffect””. In: Advanced Robotics and its Social Impacts (ARSO), 2015 IEEE Inter-national Workshop on. IEEE. 2015, pp. 1–6 (cit. on p. 24).
[MCB09] Katherine L Milkman, Dolly Chugh, and Max H Bazerman. “How can decisionmaking be improved?” In: Perspectives on psychological science 4.4 (2009), pp. 379–383 (cit. on p. 26).
[Men08] Yan Meng. “Multi-robot searching using game-theory based approach”. In: Inter-national Journal of Advanced Robotic Systems 5.4 (2008), pp. 341–350 (cit. onpp. 3, 10, 66, 67, 179).
[MG92] John McMillan and Strategies Games. Managers: How Managers Can Use GameTheory to Make better Business Decisions. 1992 (cit. on pp. 3, 179).
[MJM+12] Laëtitia Matignon, Laurent Jeanpierre, Abdel-Illah Mouaddib, et al. “CoordinatedMulti-Robot Exploration Under Communication Constraints Using DecentralizedMarkov Decision Processes.” In: AAAI. 2012 (cit. on p. 3).
[MJM12] Laëtitia Matignon, Laurent Jeanpierre, and Abdel-Illah Mouaddib. “Distributedvalue functions for multi-robot exploration: a position paper”. In: Multi-Agent Se-quential Decision Making in Uncertain Multi-Agent Domain (MSDM)(workshop ofAAMAS). 2012 (cit. on p. 10).
[MM11] Richard Mattingly and Lisa May. “Mars sample return as a campaign”. In: AerospaceConference, 2011 IEEE. IEEE. 2011, pp. 1–13 (cit. on p. 10).
[Mon12] D.C. Montgomery. Design and Analysis of Experiments, 8th Edition. John Wiley& Sons, Incorporated, 2012 (cit. on p. 86).
[Mor+09] Carey K Morewedge et al. “Bad riddance or good rubbish? Ownership and notloss aversion causes the endowment effect”. In: Journal of Experimental SocialPsychology 45.4 (2009), pp. 947–951 (cit. on p. 24).
168
[Mor+15] Carey K Morewedge et al. “Debiasing decisions: Improved decision making witha single training intervention”. In: Policy Insights from the Behavioral and BrainSciences 2.1 (2015), pp. 129–140 (cit. on p. 26).
[MPR09] MPRNews. Uav pilots. 2009. URL: https://www.mprnews.org/story/2009/09/14/uav-pilots-grandforks (cit. on p. 13).
[MS96] Dov Monderer and Lloyd S. Shapley. “Potential Games”. In: Games and EconomicBehavior 14.1 (1996), pp. 124 –143 (cit. on pp. 53, 54, 71).
[MSØ03] Maja J Mataric, Gaurav S Sukhatme, and Esben H Østergaard. “Multi-robot task al-location in uncertain environments”. In: Autonomous Robots 14.2-3 (2003), pp. 255–263 (cit. on p. 8).
[Mur+08] Robin R Murphy et al. “Search and rescue robotics”. In: Springer Handbook ofRobotics. Springer, 2008, pp. 1151–1173 (cit. on pp. 10, 13).
[Nag+08] Amir M Naghsh et al. “Analysis and design of human-robot swarm interactionin firefighting”. In: Robot and human interactive communication, 2008. RO-MAN2008. the 17th IEEE international symposium on. IEEE. 2008, pp. 255–260 (cit. onpp. 8, 13).
[NAT95] NATO. ATP-10(D) Manual on Search and Rescue. North Atlantic Treaty Organi-zation. 1995 (cit. on p. 115).
[NBV16] V Sriram Siddhardh Nadendla, Swastik Brahma, and Pramod K Varshney. “To-wards the design of prospect-theory based human decision rules for hypothesistesting”. In: Communication, Control, and Computing (Allerton), 2016 54th An-nual Allerton Conference on. IEEE. 2016, pp. 766–773 (cit. on p. 36).
[NK08] Nikhil Nigam and Ilan Kroo. “Persistent surveillance using multiple unmanned airvehicles”. In: Aerospace Conference, 2008 IEEE. IEEE. 2008, pp. 1–14 (cit. onp. 78).
[Ong+09] Sylvie C.W. Ong et al. “POMDPs for Robotic Tasks with Mixed Observability”. In:Proceedings of Robotics: Science and Systems (RSS). 2009 (cit. on pp. 150, 151,158).
[Ong+10] Sylvie CW Ong et al. “Planning under uncertainty for robotic tasks with mixedobservability”. In: The International Journal of Robotics Research 29.8 (2010),pp. 1053–1068 (cit. on pp. 146, 147, 150, 151).
[Ong14] Chee S Ong. Logistics supply of the distributed air wing. Tech. rep. NAVAL POST-GRADUATE SCHOOL MONTEREY CA, 2014 (cit. on pp. 14, 15).
[Par08] Lynne E Parker. “Distributed intelligence: Overview of the field and its applicationin multi-robot systems”. In: Journal of Physical Agents 2.1 (2008), pp. 5–14 (cit. onpp. 10, 11).
169
[PDT11] Sergio Pizziol, Frédéric Dehais, and Catherine Tessier. “Towards human operatorstate assessment”. In: Proceedings of the 1st International Conference on Appli-cation and Theory of Automation in Command and Control Systems. IRIT Press.2011, pp. 99–106 (cit. on p. 157).
[Pes+00] Leonid Peshkin et al. “Learning to cooperate via policy search”. In: Proceedingsof the Sixteenth conference on Uncertainty in artificial intelligence. Morgan Kauf-mann Publishers Inc. 2000, pp. 489–496 (cit. on pp. 66, 67).
[PFB10] Fabio Pasqualetti, Antonio Franchi, and Francesco Bullo. “On optimal coopera-tive patrolling”. In: Decision and Control (CDC), 2010 49th IEEE Conference on.IEEE. 2010, pp. 7153–7158 (cit. on p. 66).
[PGJS14] George Philip, Sidney N Givigi Jr, and Howard M Schwartz. “Cooperative naviga-tion of unknown environments using potential games”. In: International Journal ofMechatronics and Automation 4.3 (2014), pp. 173–187 (cit. on p. 71).
[PR11] David Portugal and Rui Rocha. “A survey on multi-robot patrolling algorithms”.In: Technological Innovation for Sustainability. Springer, 2011, pp. 139–146 (cit.on pp. 3, 10, 66, 68, 179).
[PR13a] David Portugal and Rui P Rocha. “Distributed multi-robot patrol: A scalable andfault-tolerant framework”. In: Robotics and Autonomous Systems 61.12 (2013),pp. 1572–1587 (cit. on p. 66).
[PR13b] David Portugal and Rui P Rocha. “Multi-robot patrolling algorithms: examiningperformance and scalability”. In: (2013) (cit. on pp. 66, 75).
[Put94] M.L. Puterman. Markov decision processes: discrete stochastic dynamic program-ming. John Wiley & Sons, Inc. New York, NY, USA, 1994 (cit. on p. 148).
[PY10] Sinno Jialin Pan and Qiang Yang. “A survey on transfer learning”. In: IEEE Trans-actions on knowledge and data engineering 22.10 (2010), pp. 1345–1359 (cit. onpp. 144, 195).
[RN09] Stuart Jonathan Russell and Peter Norvig. Artificial intelligence: a modern ap-proach (3rd edition). 2009 (cit. on p. 30).
[Ros+08] Stéphane Ross et al. “Online planning algorithms for POMDPs”. In: Journal ofArtificial Intelligence Research 32 (2008), pp. 663–704 (cit. on pp. 144, 195).
[Ros16] Don Ross. “Game Theory”. In: The Stanford Encyclopedia of Philosophy. Ed. byEdward N. Zalta. Winter 2016. Metaphysics Research Lab, Stanford University,2016 (cit. on p. 121).
[Roy+16] Raphaëlle N Roy et al. “Operator Engagement During Prolonged Simulated UAVOperation”. In: IFAC-PapersOnLine 49.32 (2016), pp. 171–176 (cit. on pp. 144,196).
170
[RXH16] Peijia Ren, Zeshui Xu, and Zhinan Hao. “Hesitant Fuzzy Thermodynamic Methodfor Emergency Decision Making Based on Prospect Theory”. In: IEEE Transac-tions on Cybernetics (2016) (cit. on p. 36).
[Rég+14] Nicolas Régis et al. “Formal Detection of Attentional Tunneling in Human Operator–Automation Interactions”. In: IEEE Transactions on Human-Machine Systems 44.3(2014), pp. 326–336 (cit. on pp. 25, 152, 154, 157).
[Sca+14] Davide Scaramuzza et al. “Vision-controlled micro flying robots: from system de-sign to autonomous navigation and mapping in GPS-denied environments”. In:Robotics & Automation Magazine, IEEE 21.3 (2014), pp. 26–40 (cit. on p. 10).
[SCD15] Paulo Eduardo Ubaldino Souza, Caroline Ponzoni Carvalho Chanel, and FrédéricDehais. “MOMDP-based target search mission taking into account the human op-erator’s cognitive state”. In: Tools with Artificial Intelligence (ICTAI), 2015 IEEE27th International Conference on. IEEE. 2015, pp. 729–736 (cit. on pp. 15, 144,196).
[Sch+04] Jean Scholtz et al. “Evaluation of human-robot interaction awareness in search andrescue”. In: Robotics and Automation, 2004. Proceedings. ICRA’04. 2004 IEEEInternational Conference on. Vol. 3. IEEE. 2004, pp. 2327–2332 (cit. on pp. 9, 13).
[Sel+06] Brennan Sellner et al. “Coordinated multiagent teams and sliding autonomy forlarge-scale assembly”. In: Proceedings of the IEEE 94.7 (2006), pp. 1425–1444(cit. on p. 146).
[Sim55] Herbert A Simon. “A behavioral model of rational choice”. In: The quarterly jour-nal of economics 69.1 (1955), pp. 99–118 (cit. on p. 20).
[Sim57] HA Simon. “Models of man Wiley”. In: New York (1957) (cit. on p. 20).
[SLB08] Yoav Shoham and Kevin Leyton-Brown. Multiagent systems: Algorithmic, game-theoretic, and logical foundations. Cambridge University Press, 2008 (cit. on pp. 3,40, 43, 44, 46, 54, 180, 183, 184).
[SM11] Jesus Suarez and Robin Murphy. “A survey of animal foraging for directed, persis-tent search by rescue robotics”. In: Safety, Security, and Rescue Robotics (SSRR),2011 IEEE International Symposium on. IEEE. 2011, pp. 314–320 (cit. on pp. 10,13).
[SMT09] Nathan Schurr, Janusz Marecki, and Milind Tambe. “Improving adjustable auton-omy strategies for time-critical domains”. In: Proceedings of The 8th InternationalConference on Autonomous Agents and Multiagent Systems-Volume 1. InternationalFoundation for Autonomous Agents and Multiagent Systems. 2009, pp. 353–360(cit. on pp. 1, 145, 146, 177).
[SS05] T. Smith and R.G. Simmons. “Point-Based POMDP Algorithms: Improved Analy-sis and Implementation”. In: Proc. UAI. 2005 (cit. on p. 150).
171
[SS16] Katie Steele and H. Orri Stefánsson. “Decision Theory”. In: The Stanford Encyclo-pedia of Philosophy. Ed. by Edward N. Zalta. Winter 2016. Metaphysics ResearchLab, Stanford University, 2016 (cit. on pp. 30, 31).
[SS73] R.D. Smallwood and E.J. Sondik. “The optimal control of partially observableMarkov processes over a finite horizon”. In: Operations Research (1973), pp. 1071–1088 (cit. on pp. 147, 149, 150).
[SST03] Nathan Schurr, Paul Scerri, and Milind Tambe. “Impact of human advice on agentteams: A preliminary report”. In: Workshop on Humans and Multi-Agent Systemsat AAMAS. 2003 (cit. on pp. 1, 145, 177).
[Suh07] Niko Suhonen. “Normative and descriptive theories of decision making under risk:A short review”. In: Joensuu, Finland: University of Eastern Finland (2007) (cit.on p. 20).
[Tal07] Nassim Nicholas Taleb. The black swan: The impact of the highly improbable.Vol. 2. Random house, 2007 (cit. on p. 58).
[TBF05] Sebastian Thrun, Wolfram Burgard, and Dieter Fox. Probabilistic robotics. MITpress, 2005 (cit. on p. 56).
[TD12] Catherine Tessier and Frédéric Dehais. “Authority Management and Conflict Solv-ing in Human-Machine Systems.” In: AerospaceLab 4 (2012), p–1 (cit. on pp. 15,144, 196).
[TG00] Peter M Todd and Gerd Gigerenzer. “Précis of simple heuristics that make ussmart”. In: Behavioral and brain sciences 23.05 (2000), pp. 727–741 (cit. on pp. 20,26).
[Thr+04] Sebastian Thrun et al. “Autonomous exploration and mapping of abandoned mines”.In: Robotics & Automation Magazine, IEEE 11.4 (2004), pp. 79–91 (cit. on pp. 1,145, 177).
[TK75] Amos Tversky and Daniel Kahneman. “Judgment under uncertainty: Heuristicsand biases”. In: Utility, probability, and human decision making. Springer, 1975,pp. 141–162 (cit. on pp. 22–24).
[TK81] Amos Tversky and Daniel Kahneman. “The framing of decisions and the psychol-ogy of choice”. In: Science 211.4481 (1981), pp. 453–458 (cit. on pp. 24, 25).
[TK86] Amos Tversky and Daniel Kahneman. “Rational choice and the framing of deci-sions”. In: Journal of business (1986), S251–S278 (cit. on p. 98).
[TK92] Amos Tversky and Daniel Kahneman. “Advances in prospect theory: Cumula-tive representation of uncertainty”. In: Journal of Risk and uncertainty 5.4 (1992),pp. 297–323 (cit. on pp. 4, 24, 35, 36, 98, 180).
172
[TL09] Stelios Timotheou and Georgios Loukas. “Autonomous networked robots for theestablishment of wireless communication in uncertain emergency response scenar-ios”. In: Proceedings of the 2009 ACM symposium on Applied Computing. ACM.2009, pp. 1171–1175 (cit. on p. 8).
[TMD11] Tarek Taha, Jaime Valls Miró, and Gamini Dissanayake. “A POMDP framework formodelling human interaction with assistive robots”. In: Robotics and Automation(ICRA), 2011 IEEE International Conference on. IEEE. 2011, pp. 544–549 (cit. onp. 146).
[Tsu+11] Akira Tsuchiyama et al. “Three-dimensional structure of Hayabusa samples: originand evolution of Itokawa regolith”. In: Science 333.6046 (2011), pp. 1125–1128(cit. on p. 9).
[TW04] Lisa C Thomas and Christopher D Wickens. “Eye-tracking and individual differ-ences in off-normal event detection when flying with a synthetic vision systemdisplay”. In: Proceedings of the Human Factors and Ergonomics Society AnnualMeeting. Vol. 48. 1. SAGE Publications. 2004, pp. 223–227 (cit. on p. 154).
[USA17] USAF. MQ-9 reaper. 2017. URL: http://www.af.mil/About-Us/Fact-Sheets/Display/Article/104470/mq-9-reaper/ (cit. on pp. 12, 13).
[Van14] Frédéric Vanderhaegen. “Dissonance engineering: a new challenge to analyse riskyknowledge when using a system”. In: International Journal of Computers Commu-nications & Control 9.6 (2014), pp. 776–785 (cit. on pp. 2, 178).
[Vin+08] Regis Vincent et al. “Distributed multirobot exploration, mapping, and task alloca-tion”. In: Annals of Mathematics and Artificial Intelligence 52.2 (2008), pp. 229–255 (cit. on pp. 1, 10, 177).
[VMK12] Jeroen JG Van Merriënboer and Paul A Kirschner. Ten steps to complex learning: Asystematic approach to four-component instructional design. Routledge, 2012 (cit.on p. 110).
[VNM07] John Von Neumann and Oskar Morgenstern. Theory of games and economic be-havior. Princeton university press, 2007 (cit. on pp. 32, 33, 40, 51, 183).
[WD96] Peter Wakker and Daniel Deneffe. “Eliciting von Neumann-Morgenstern utilitieswhen probabilities are distorted or unknown”. In: Management science 42.8 (1996),pp. 1131–1150 (cit. on p. 37).
[Wil04] Kevin W Williams. A summary of unmanned aircraft accident/incident data: Hu-man factors implications. Tech. rep. DTIC Document, 2004, p. 18 (cit. on pp. 2,146, 178).
[Wol04] David Wolpert. “Theory of collective intelligence”. In: Collectives and the designof complex systems. Springer, 2004, pp. 43–106 (cit. on p. 54).
173
[WVO12] Marco Wiering and Martijn Van Otterlo. “Reinforcement learning”. In: Adaptation,Learning, and Optimization 12 (2012) (cit. on pp. 3, 179).
[XZZ11] Songdong Xue, Jianchao Zeng, and Guoyou Zhang. “A review of autonomousrobotic search”. In: Electrical and Control Engineering (ICECE), 2011 Interna-tional Conference on. IEEE. 2011, pp. 3792–3795 (cit. on pp. 10, 13).
[Zha16] Guofeng Zhang. “Comparison of Decision-Making Mechanism between EmotionBehavior Selection and Prospect Theory”. In: Intelligent Human-Machine Systemsand Cybernetics (IHMSC), 2016 8th International Conference on. Vol. 1. IEEE.2016, pp. 538–540 (cit. on p. 36).
[ZK15] Muhong Zhang and Derek Kingston. “Time-space network based exact models forperiodical monitoring routing problem”. In: American Control Conference (ACC),2015. IEEE. 2015, pp. 5264–5269 (cit. on p. 66).
[ZPV11] Stéphane Zieba, Philippe Polet, and Frédéric Vanderhaegen. “Using adjustable au-tonomy and human–machine cooperation to make a human–machine system resilient–Application to a ground robotic system”. In: Information Sciences 181.3 (2011),pp. 379–397 (cit. on p. 15).
174
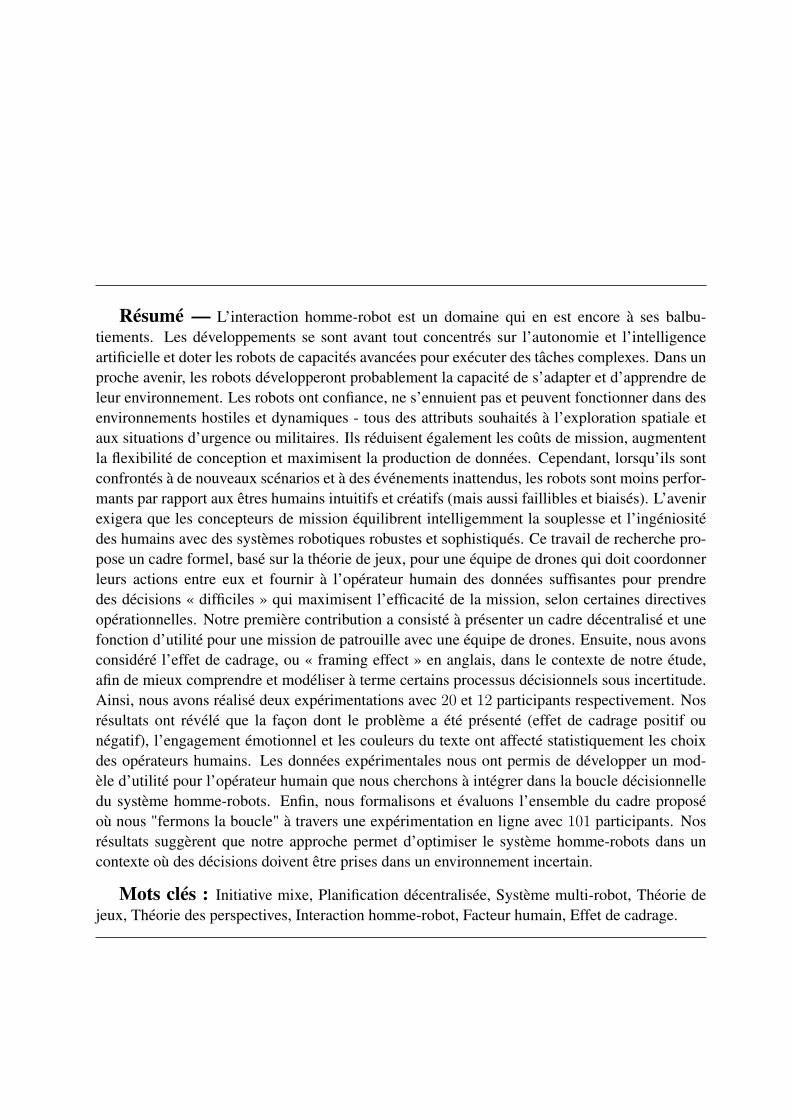
Résumé — L’interaction homme-robot est un domaine qui en est encore à ses balbu-tiements. Les développements se sont avant tout concentrés sur l’autonomie et l’intelligenceartificielle et doter les robots de capacités avancées pour exécuter des tâches complexes. Dans unproche avenir, les robots développeront probablement la capacité de s’adapter et d’apprendre deleur environnement. Les robots ont confiance, ne s’ennuient pas et peuvent fonctionner dans desenvironnements hostiles et dynamiques - tous des attributs souhaités à l’exploration spatiale etaux situations d’urgence ou militaires. Ils réduisent également les coûts de mission, augmententla flexibilité de conception et maximisent la production de données. Cependant, lorsqu’ils sontconfrontés à de nouveaux scénarios et à des événements inattendus, les robots sont moins perfor-mants par rapport aux êtres humains intuitifs et créatifs (mais aussi faillibles et biaisés). L’avenirexigera que les concepteurs de mission équilibrent intelligemment la souplesse et l’ingéniositédes humains avec des systèmes robotiques robustes et sophistiqués. Ce travail de recherche pro-pose un cadre formel, basé sur la théorie de jeux, pour une équipe de drones qui doit coordonnerleurs actions entre eux et fournir à l’opérateur humain des données suffisantes pour prendredes décisions « difficiles » qui maximisent l’efficacité de la mission, selon certaines directivesopérationnelles. Notre première contribution a consisté à présenter un cadre décentralisé et unefonction d’utilité pour une mission de patrouille avec une équipe de drones. Ensuite, nous avonsconsidéré l’effet de cadrage, ou « framing effect » en anglais, dans le contexte de notre étude,afin de mieux comprendre et modéliser à terme certains processus décisionnels sous incertitude.Ainsi, nous avons réalisé deux expérimentations avec 20 et 12 participants respectivement. Nosrésultats ont révélé que la façon dont le problème a été présenté (effet de cadrage positif ounégatif), l’engagement émotionnel et les couleurs du texte ont affecté statistiquement les choixdes opérateurs humains. Les données expérimentales nous ont permis de développer un mod-èle d’utilité pour l’opérateur humain que nous cherchons à intégrer dans la boucle décisionnelledu système homme-robots. Enfin, nous formalisons et évaluons l’ensemble du cadre proposéoù nous "fermons la boucle" à travers une expérimentation en ligne avec 101 participants. Nosrésultats suggèrent que notre approche permet d’optimiser le système homme-robots dans uncontexte où des décisions doivent être prises dans un environnement incertain.
Mots clés : Initiative mixe, Planification décentralisée, Système multi-robot, Théorie dejeux, Théorie des perspectives, Interaction homme-robot, Facteur humain, Effet de cadrage.
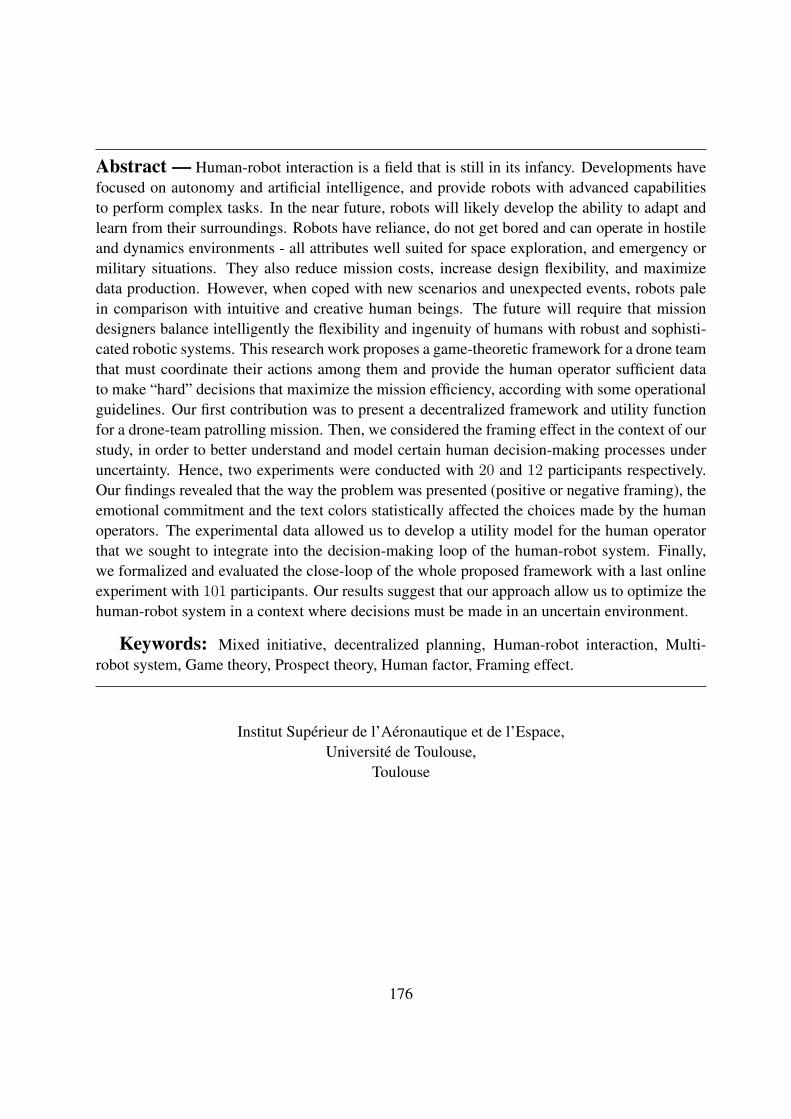
Abstract — Human-robot interaction is a field that is still in its infancy. Developments havefocused on autonomy and artificial intelligence, and provide robots with advanced capabilitiesto perform complex tasks. In the near future, robots will likely develop the ability to adapt andlearn from their surroundings. Robots have reliance, do not get bored and can operate in hostileand dynamics environments - all attributes well suited for space exploration, and emergency ormilitary situations. They also reduce mission costs, increase design flexibility, and maximizedata production. However, when coped with new scenarios and unexpected events, robots palein comparison with intuitive and creative human beings. The future will require that missiondesigners balance intelligently the flexibility and ingenuity of humans with robust and sophisti-cated robotic systems. This research work proposes a game-theoretic framework for a drone teamthat must coordinate their actions among them and provide the human operator sufficient datato make “hard” decisions that maximize the mission efficiency, according with some operationalguidelines. Our first contribution was to present a decentralized framework and utility functionfor a drone-team patrolling mission. Then, we considered the framing effect in the context of ourstudy, in order to better understand and model certain human decision-making processes underuncertainty. Hence, two experiments were conducted with 20 and 12 participants respectively.Our findings revealed that the way the problem was presented (positive or negative framing), theemotional commitment and the text colors statistically affected the choices made by the humanoperators. The experimental data allowed us to develop a utility model for the human operatorthat we sought to integrate into the decision-making loop of the human-robot system. Finally,we formalized and evaluated the close-loop of the whole proposed framework with a last onlineexperiment with 101 participants. Our results suggest that our approach allow us to optimize thehuman-robot system in a context where decisions must be made in an uncertain environment.
Keywords: Mixed initiative, decentralized planning, Human-robot interaction, Multi-robot system, Game theory, Prospect theory, Human factor, Framing effect.
Institut Supérieur de l’Aéronautique et de l’Espace,Université de Toulouse,
Toulouse
176
Résumé en français
Introduction
Le champ de l’interaction humain-robot (HRI) est encore à ses débuts. Dans le passé récent,nous avons vu la transformation des robots en agents artificiels autonomes capables d’exécuterdes tâches de plus en plus complexes. Dans le futur, les robots probablement développeront lacapacité d’apprentissage et d’adaptation vis-à-vis de leur environnement.
Les robots peuvent réaliser des tâches dangereuses, ennuyeuses et/ou en environement con-taniné. Ils sont fiables, ne s’ennuient pas et peuvent fonctionner dans des environnements hos-tiles et dynamiques - tous attributs souhaités et bien adaptés pour l’exploration spatiale et pourles situations d’urgence ou militaires. Ils permettent également de réduire les coûts de mission,d’accroître la flexibilité de conception, et de maximiser la production de données. En outre, lessystèmes multi-robots (MRS) peuvent potentiellement offrir plusieurs avantages par rapport auxsystèmes avec un seul robot, à savoir la vitesse, la précision et la robustesse [Bur+00]; [Bur+05];[Vin+08].
D’autre part, face à des événements imprévus, les robots ne peuvent pas être comparés auxêtres humains qui sont intuitifs et créatifs. Par exemple, les commandants militaires et les pre-miers intervenants sont souvent tenus de prendre de décisions dans des conditions où les in-formations sont limitées, incomplètes ou ambiguës, et sous pression temporelle. Ces expertspeuvent prendre en charge des situations qui menacent la vie d’autres humains et décider com-ment utiliser leurs équipages et actifs d’une manière très efficace. Toutefois, dans ces situations,ils doivent travailler dans des conditions très difficiles, et sont soumis à la fatigue cognitive etphysique, qui peut conduire à une réduction de la conscience de la situation et de la qualité deleurs décisions. Ainsi, l’avenir requerra un équilibre intelligent entre la flexibilité et la créativitéhumaine, et les systèmes robotiques robustes et sophistiqués.
Néanmoins, en ce qui concerne l’interactions humain-robot, il n’est pas facile de concevoirun cadre robuste et efficace. Récemment, la plupart des efforts scientifiques et techniques ontmis l’accent sur la mise en œuvre des capteurs intelligents, sur les systèmes embarqués com-plexes et sur l’autonomie décisionnelle pour améliorer l’efficacité des robots [Thr+04], parti-culièrement lorsque l’opérateur humain ne peut pas analyser ou accéder les données visuelles[Thr+04]; [SMT09]; [FO05]; [CM03]. Cependant, ces développements ont été généralementconcretisés sans remettre en question l’intégration des opérateurs humains dans la boucle dedécision ou contrôle [SST03]: l’opérateur humain est considéré comme un agent providentielqui sera en mesure de prendre en charge le système lorsque les capteurs ou les automatismeséchouent [CM03]; [FO05]; [SMT09]. En outre, la mauvaise conception de l’interface utilisateur,
177
la complexité de l’automatisme et l’haute pression de la tâche peuvent dégrader la performancede l’opérateur humain si la charge mentale dépasse sa capacité cognitive [Dur+14]. Par exemple,une conception négligente du partage du pouvoir décisionnel dans tels systèmes peut conduire àdes conflits entre l’humain et l’automatisme lorsque l’opérateur humain ne comprends pas bien lecomportement de l’automatisme [Deh+05]; [Deh+15]. L’apparition d’une telle situation est cri-tique tant qu’elle peut provoquer: une dissonance cognitive (une information contradictoire peutproduire un inconfort, causé par les cognitions ou connaissances conflictuelles qui contrôlent ouaffectent les comportements et les attitudes) [Van14]; une « confusion mentale » (i.e. l’opérateurhumain est incapable de localiser et de traiter les paramètres pertinents) [Deh+15]; ou encore, la« tunnelisation attentional » (i.e. l’opérateur humain est excessivement concentrée sur un seulécran) [DCT11] cédant aux comportements irrationnels [Deh+12]. Sans surprise, un rapportd’analyse de sécurité [Wil04] a révélé que des problèmes de facteurs humains ont été impliquésdans 80% des accidents. Cette tendance a conduit Cummings et Mitchell à déclarer: à causedu croissant nombre de capteurs, du volume d’information et des exigences opérationnelles quise produiront naturellement dans un environnement de contrôle des véhicules multiples, des de-mandes cognitives excessives seront probablement imposées aux opérateurs. En conséquence,l’allocation efficace de l’attention entre un ensemble de tâches dynamiques sera essentielle, à lafois pour la performance humaine, et pour la performance du système [CM08].
Une voie prometteuse pour traiter ces questions est de considérer que les capacités des robotset la capacité des humains sont complémentaires, et sont susceptibles d’offrir une meilleureperformance lorsqu’ils collaborent efficacement que lorsqu’ils sont utilisés séparément. Cetteapproche, connue sous le nom d’interaction à initiative mixte (MII) [AGH99]; [AC+04] est aucœur de cette thèse de doctorat. Précisément, nous allons concentrer notre intérêt sur la prise dedécision pour les robots et pour les humains.
Description du problème
Cette thèse porte sur le problème de la proposition d’un cadre robuste pour une équipe de robotsaériens (aussi connus comme drones) qui doivent coordonner leurs actions entre eux, et fournirdes données suffisantes à l’opérateur humain (HO) qui devra prendre de décisions critiques. Cesdécisions (robotique et/ou humaines) doivent maximiser l’efficacité de la mission, le tout enrespectant les consignes opérationnelles (voir Fig. R.1).
.
A ce titre, cette thèse répond à un double objectif: prendre soin de l’efficacité de l’équipehumain-robot (nous l’appellerons perspective robotique), et améliorer le processus de décisionhumaine dans ce contexte opérationnel (perspective humaine).
178
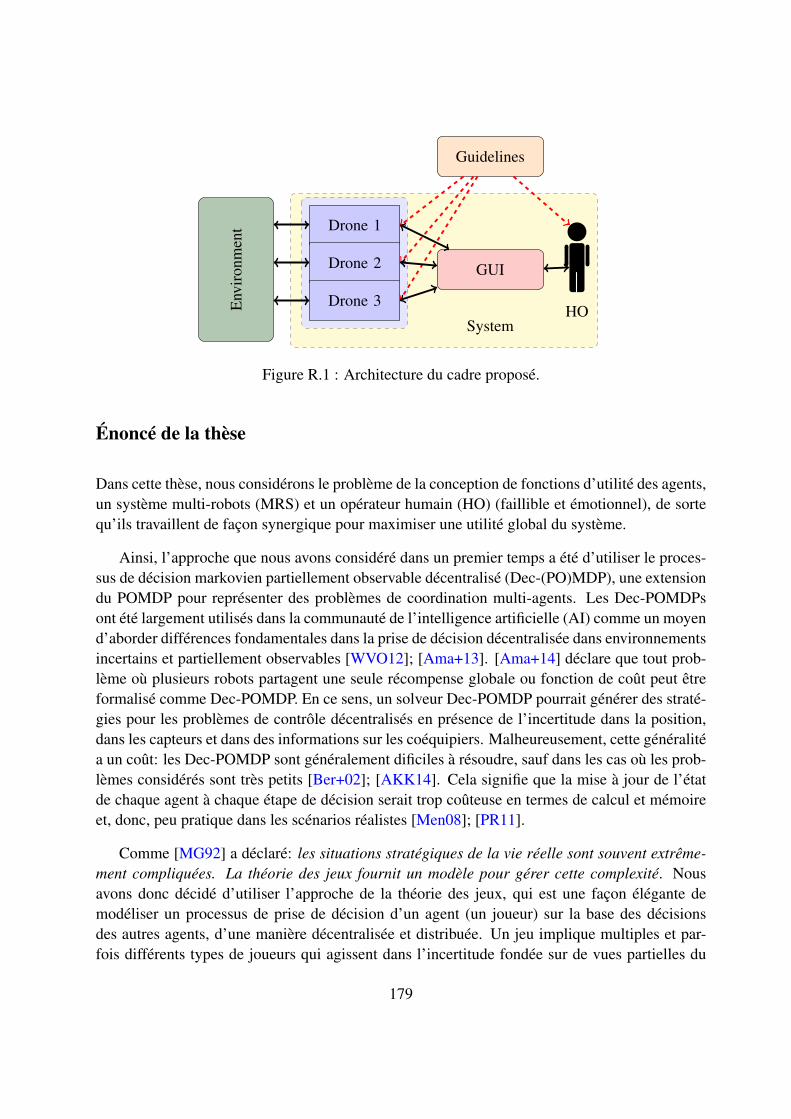
Env
iron
men
t Drone 1
Drone 2
Drone 3
Guidelines
GUI
SystemHO
Figure R.1 : Architecture du cadre proposé.
Énoncé de la thèse
Dans cette thèse, nous considérons le problème de la conception de fonctions d’utilité des agents,un système multi-robots (MRS) et un opérateur humain (HO) (faillible et émotionnel), de sortequ’ils travaillent de façon synergique pour maximiser une utilité global du système.
Ainsi, l’approche que nous avons considéré dans un premier temps a été d’utiliser le proces-sus de décision markovien partiellement observable décentralisé (Dec-(PO)MDP), une extensiondu POMDP pour représenter des problèmes de coordination multi-agents. Les Dec-POMDPsont été largement utilisés dans la communauté de l’intelligence artificielle (AI) comme un moyend’aborder différences fondamentales dans la prise de décision décentralisée dans environnementsincertains et partiellement observables [WVO12]; [Ama+13]. [Ama+14] déclare que tout prob-lème où plusieurs robots partagent une seule récompense globale ou fonction de coût peut êtreformalisé comme Dec-POMDP. En ce sens, un solveur Dec-POMDP pourrait générer des straté-gies pour les problèmes de contrôle décentralisés en présence de l’incertitude dans la position,dans les capteurs et dans des informations sur les coéquipiers. Malheureusement, cette généralitéa un coût: les Dec-POMDP sont généralement dificiles à résoudre, sauf dans les cas où les prob-lèmes considérés sont très petits [Ber+02]; [AKK14]. Cela signifie que la mise à jour de l’étatde chaque agent à chaque étape de décision serait trop coûteuse en termes de calcul et mémoireet, donc, peu pratique dans les scénarios réalistes [Men08]; [PR11].
Comme [MG92] a déclaré: les situations stratégiques de la vie réelle sont souvent extrême-ment compliquées. La théorie des jeux fournit un modèle pour gérer cette complexité. Nousavons donc décidé d’utiliser l’approche de la théorie des jeux, qui est une façon élégante demodéliser un processus de prise de décision d’un agent (un joueur) sur la base des décisionsdes autres agents, d’une manière décentralisée et distribuée. Un jeu implique multiples et par-fois différents types de joueurs qui agissent dans l’incertitude fondée sur de vues partielles du
179
monde. Dans un jeu, chaque joueur choisit une option (en parallèle ou séquentiellement) baséeuniquement sur des informations observables au niveau local, ce qui résulte en un gain en tempsde calcul immédiat [SLB08].
Dans la perspective robotique, afin d’améliorer la performance globale, d’abord nous avonsconçu des jeux asynchrones, dans lesquels le jeu se produit lorsqu’un drone est disponible pourjouer, indépendamment de la situation des autres joueurs; ensuite, au lieu de jouer un jeu à chaquestade temporel, notre approche utilise des macro-actions (i.e. le jeu se produit lorsqu’un droneconclut sa tâche en cours), ce qui peut être considéré comme une modélisation simple et efficacepour les systèmes réels.
L’interaction entre les drones et l’HO est aussi un jeu, dans lequel la fonction de gain (oud’utilité) de l’agent humain est estimée par les drones. Cependant, la nature de la prise dedécision humaine est extrêmement complexe, donc, notre approche, dans la perspective humaine,est fondée sur la théorie des perspectives (PT) [KT79]; [TK92], et sur le cadre de la prise dedécision Naturaliste (NDM3) [Kle99]. En ce sens, nous ne considérons pas l’HO comme undécideur (DM) sans faille et rationnel qui peut décider avec cohérence logique, quelle que soitla manière dont les options sont présentées. Toutefois, au lieu de tenter de guérir l’HO enlui permettant d’avoir une pensée logique et claire, ce qui consomme du temps et requiert desinformations complètes (qui ne sont pas toujours disponibles), nous nous reposons sur la façonintuitive (et émotionnelle) humaine de penser, pour amener l’HO à agir en tant qu’expert etprendre la meilleure décision possible sous incertitude et sous la pression du temps.
Présentation de thèse
Cette thèse est divisée en deux parties. Dans la première partie, nous présentons une revuede la littérature pour modéliser notre système proposé: le chapitre 1 présente les théories surl’interaction humain-robot, et certains cas réels où les robots fonctionnent en situations dan-gereuses, ennuyeuses ou en environement contaminés. Ensuite, dans le chapitre 2 nous presen-tons le processus de prise de décision humaine, en décrivant la théorie des heuristiques et biais,en particulier l’effet de cadrage, ainsi que le cadre décisionnel naturaliste. Le chapitre 3 est con-sacré à une révision générale, notamment à propos de la théorie de l’utilité et de la théorie desperspectives, ce qui aidera à comprendre et à corréler des concepts présentés plus loin dans cemanuscrit. Finalement, le chapitre 4 présente les définitions essentielles sur la théorie des jeuxutilisées dans cette thèse.
La deuxième partie présente les contributions de cette thèse: au chapitre 5 nous présentonsune fonction d’utilité décentralisée pour coordonner une équipe de drones; Dans le chapitre 6,nous présentons le rôle de l’opérateur humain dans l’équipe, et une expérience portant sur l’effet
3Naturalistic decision making
180
de cadrage dans le contexte de mission étudié; les données produites dans cette expérience sontutilisées pour estimer une function d’utilité de l’opérateur humain au chapitre 7; et enfin, dans lechapitre 8, nous mettons le tout ensemble (nous fermons la boucle), en formalisant et en évaluantle système complet.
PARTIE I - Etat de l’art
CHAPITRE 1 – Les robots « 3D »
La sécurité humaine est une des plus grandes préoccupations dans la société moderne, ainsi,les tâches ennuyeuses, dangereuses et celles réalisés en environment contaminé (3D4) ont étéprogressivement transférées aux robots. Ce chapitre a été consacré à décrire notre vision desrobots « 3D » et à présenter certaines missions de MRS qui ont motivé nos expériences. Ceciillustre la proposition qui ressort de cette thèse.
D’abord, nous avons énoncé des recherches et des initiatives impliquant des robots en mis-sions SAR et en missions de retour d’échantillons. Ensuite, nous avons introduit les MRS,les différents types d’interactions entre les coéquipiers robotiques et les défis pour changer leparadigme traditionnel des n opérateurs pour 1 robot à un nouveau paradigme de 1 opérateur(ou peu d’opérateurs) pour n robots. En ce sens, nous avons brièvement décrit l’opération dudrone RPAS MQ-9 Reaper en cours à l’USAF5. Ensuite, nous avons présenté l’ ALFUS, uncadre pour ajustements dynamiques des niveaux d’autonomie, et la catégorisation des modesd’initiative. Enfin, nous avons défini l’intéraction à initiative-mixte (MII6) et l’initiative-mixtepour l’interaction homme-robot (MI-HRI), cadres où les humains et les agents artificiels peu-vent collaborer en tant que pairs dans une équipe efficace. Ces concepts ont été utilisés dansnos études comme des objectifs principaux à poursuivre. Dans la suite de ce document, nousaborderons les théories sur le processus de prise de décision humaine.
CHAPITRE 2 – Le facteur « H »
La prise de décision est une question cruciale pour la coopération entre humains et robots ditsintelligents. D’une part, certaines théories de prise de décision affirment que nombreux biaiscognitifs affectent les jugements humains, ce qui donne lieu à des décisions non optimales ouirrationnelles, et ont la tendance de mettre l’accent sur l’utilisation des processus analytiques
4Dirty, dull, or dangerous5United States Air Force6Mixed-initiative interaction
181
pour guider les décisions humaines. D’autre part, d’autres théories font valoir que les réponsesintuitives et émotionnelles peuvent jouer un rôle décisif dans le processus de prise de décisionhumain dans les conditions d’information limitées et de contraintes de temps [DM+06].
Dans ce context, ce chapitre décrit comment le processus de prise de décision humaine estthéorisé. Ensuite, nous nous sommes concentrés sur les théories descriptives, la théorie de dou-ble processus et la théorie des heuristiques et biais. Dans le cadre de cette dernière théorie,nous avons présenté deux biais cognitifs explorés dans notre étude: l’aversion à la déposses-sion et l’effet de cadrage. Enfin, nous avons décrit le cadre decisionel naturaliste (NDM) et seshypothèses.
Dans cette thèse, au lieu de tenter d’enlever les biais naturels du comportement humain lorsde décisions, notre approche explore l’effet de cadrage afin de permettre aux novices d’agir etde décider comme les experts, en conduisant les premiers à répéter les modèles et les stratégiesutilisées par les derniers, grâce à la manipulation de la façon dont l’information est présentée.
Nous aborderons dans le chapitre 3 les modèles normatifs formels dans la théorie de décision,comme la théorie de l’utilité espérée (EUT), et à la fin, la théorie des perspectives (PT), unmodèle descriptif proposant une alternative à l’EUT.
CHAPITRE 3 – Les décisions et les utilités
Dans cette thèse, nous avons considéré les situations où les robots et les humains doivent prendredes décisions critiques dans des conditions incertaines. Comme montrent les chapitres précé-dents, les robots peuvent ne pas s’adapter aux nouvelles situations (n’ayant pas été modéliséesou connues a priori) et les HO peuvent éprouver biais de décision. Nous avons donc identifié lebesoin de définir un cadre formel pour optimiser la prise de décision de l’équipe humain-robotdans de telles circonstances. Le but de ce chapitre est de présenter le champ des théories dedécision qui pourraient être appliquées à un tel problème.
Ainsi, ce chapitre décrit les situations où un décideur DM rationnel choisit parmi plusieursoptions (théorie de décision – DT7) en fonction de leurs préférences (théorie de l’utilité), mettanten évidence l’utilité additive séparable. Ensuite, nous avons fourni les fondements de la théoriede l’utilité espérée (EUT), qui est adressée à l’analyse des choix en situations de risque. Après,nous avons parlé des décisions en situations d’incertitude (théorie de l’utilité subjective – SEU).Et, enfin, nous avons présenté la théorie des perspectives (PT), qui décrit comment les gensdécident en situation d’incertitude dans la vie réelle. Ces théories ouvriront la voie aux chapitressuivants.
Dans la suite de ce document, nous nous concentrerons dans les problèmes qui impliquent
7Decision theory
182
plusieurs décideurs (DM), dans lesquels les décisions de chaque membre incident sur le résultatdes décisions des autres, c’est-à-dire, la théorie des jeux.
CHAPITRE 4 – Je veux jouer à un jeu...
Ce chapitre décrit la théorie des jeux (GT), c’est-à-dire comment modéliser les problèmes quiimpliquent plus qu’un décideur (DM), en se concentrant sur la prise d’une seule décision enprésence d’autres décideurs qui influencent le résultat. L’objectif est de fournir, au lecteur nonfamiliarisé, une base de connaissances sufficante sur la GT, afin que celui-ci puisse comprendrenotre approche.
Il est important de préciser que ce chapitre ne vise pas à être un aperçu exhaustif de la GT. Ilexiste une énorme literature qui offre une excellente introduction à la GT (par exemple [SLB08];[LBS08]; [VNM07]). En bref, la GT est une théorie mathématique conçue pour modéliser lesphénomènes qui peuvent être observés lorsque deux ou plusieurs décideurs rationnels interagis-sent les uns avec les autres. Un DM est considéré comme rationnel s’il choisit ses actions afinde maximiser sa satisfaction, son bonheur, modélisées par une fonction d’utilité. La théoriedes jeux est un outil intéressant pour comprendre comment les décisions affectent les joueurs[Bar02]. [DS] a déclaré trois types d’usage pour la GT:
• Explication - lorsque la situation implique l’interaction de décideurs ayant des objectifsdifférents, la GT fournit la clé pour comprendre la situation et explique pourquoi cela estarrivé.
• Prévision - quand on regarde des situations à l’avenir où plusieurs décideurs interagirontstratégiquement, il est possible d’utiliser la GT pour prévoir quelles sont les décisionsqu’ils prendront et quels résultats seront obtenus.
• conseils ou ordonnance - la GT peut aider un participant d’une interaction future et luiindiquer quelles stratégies sont susceptibles de donner de bons résultats et quelles sontcelles susceptibles de conduire à une catastrophe. Lors de sa création, la GT a attiré peud’attention (documents anciens remontent au 18ème siècle). Cependant, le mathématicienJohn von Neumann a changé cette situation, et, en 1944, avec l’économiste Oscar Morgen-stern, a publié le classique « La théorie des jeux et comportement économique » [VNM07].Ainsi, la GT a envahi l’économie et les mathématiques appliquées.
Actuellement, la GT est utilisée pour étudier des sujets tels que les ventes aux enchères,l’équilibre du pouvoir, l’évolution génétique, la science politique, la psychologie, des étudeslinguistiques, la sociologie, etc. [LBS08]; [Bar02]. Cependant, GT est étudiée principalementdans ses aspects mathématiques purs. Dans des applications, elle est utilisée comme un outil qui
183
aide à la compréhension des systèmes plus complexes (par exemple, les systèmes multi-agents,la communication réseau) [SLB08].
Dans ce chapitre nous avons décrit quelques concepts clés de théorie des jeux (GT) quenous avons utilisé pour modéliser les interactions entre nos agents (joueurs) dans notre cadred’application.
Dans le chapitre 5, l’interaction entre les drones est modélisée comme un jeu non-coordonnérépété (ACG). Nous avons montré que le choix de modélisation nous permet de définir une utilitédite « wonderful life utility » (WLU8). Ceci, nous permet de traiter l’intéraction entre les dronesen tant qu’un jeu potentiel.
Dans le chapitre 8 nous avons défini un jeu stochastique, dans lequel chaque jeu (chaqueinstant de décision) est considéré comme un jeu contre nature (GAN). Ceci est l’approche choisipour la séléction d’un modèle (d’un pattern) de recherche; et pour l’interaction homm-dronesnous avons utilisé un jeu fictif, basé sur la fontion d’utilité humaine proposée au chapitre 7, etapprise à partir de données colléctées dans l’étude présentée dans le chaptitre 6, pour concevoirun jeu séquentiel de type haut vers le bas « high-low » (HLG).
PARTIE II - Contributions
Dans la première partie de ce manuscrit, nous avons introduit les technologies de l’état de l’arten robotique pour des tâches « 3D » (ennuyeuses ou dangereuses, en environement contaminé),et nous avons présenté les concepts utilisés pour formuler notre approche. Ainsi, cette deuxièmepartie, est consacrée aux résultats de nos recherches et nos contributions.
CHAPITRE 5 – Le problème de la patrouille
Ce chapitre présente l’étude réalisée pour concevoir une fonction d’utilité heuristique utilisée parune équipe de drones dans une mission de patrouille. Les résultats de ce travail ont été présentésdans un papier de conférence intitulé ( « A Game Theoretical Formulation of a DecentralizedCooperative Multi-Agent Surveillance Mission ») dans le Workshop on Distributed and Multi-Agent Planning (DMAP) 2016.
L’étude présentée s’agit de la coordination de plusieurs robots volants (drones) basée sur lathéorie des jeux, pour effectuer une mission de surveillance dans un environnement bien structuré(Fig. R.2). Cette mission consistait à visiter périodiquement un ensemble de points d’intérêt touten minimisant l’intervalle de temps entre les visites successives (oisiveté).
8Wonderful life utility
184
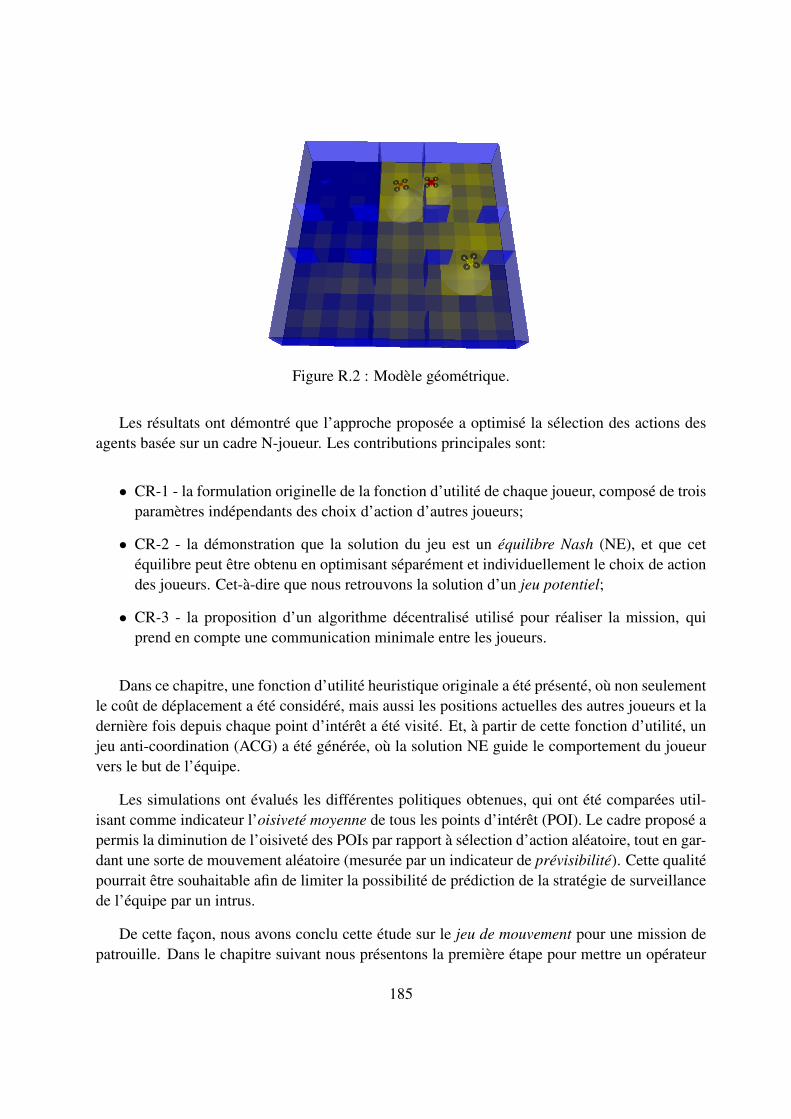
Figure R.2 : Modèle géométrique.
Les résultats ont démontré que l’approche proposée a optimisé la sélection des actions desagents basée sur un cadre N-joueur. Les contributions principales sont:
• CR-1 - la formulation originelle de la fonction d’utilité de chaque joueur, composé de troisparamètres indépendants des choix d’action d’autres joueurs;
• CR-2 - la démonstration que la solution du jeu est un équilibre Nash (NE), et que cetéquilibre peut être obtenu en optimisant séparément et individuellement le choix de actiondes joueurs. Cet-à-dire que nous retrouvons la solution d’un jeu potentiel;
• CR-3 - la proposition d’un algorithme décentralisé utilisé pour réaliser la mission, quiprend en compte une communication minimale entre les joueurs.
Dans ce chapitre, une fonction d’utilité heuristique originale a été présenté, où non seulementle coût de déplacement a été considéré, mais aussi les positions actuelles des autres joueurs et ladernière fois depuis chaque point d’intérêt a été visité. Et, à partir de cette fonction d’utilité, unjeu anti-coordination (ACG) a été générée, où la solution NE guide le comportement du joueurvers le but de l’équipe.
Les simulations ont évalués les différentes politiques obtenues, qui ont été comparées util-isant comme indicateur l’oisiveté moyenne de tous les points d’intérêt (POI). Le cadre proposé apermis la diminution de l’oisiveté des POIs par rapport à sélection d’action aléatoire, tout en gar-dant une sorte de mouvement aléatoire (mesurée par un indicateur de prévisibilité). Cette qualitépourrait être souhaitable afin de limiter la possibilité de prédiction de la stratégie de surveillancede l’équipe par un intrus.
De cette façon, nous avons conclu cette étude sur le jeu de mouvement pour une mission depatrouille. Dans le chapitre suivant nous présentons la première étape pour mettre un opérateur
185

humain dans l’équipe de drone. Nous avons observé comment les participants, d’une expériencemenée dans notre laboratoire, ont réagi (ont décidé) en fonction de la façon dont le problème aété présenté, et en particulier, leur implication émotionnelle dans la situation qui a été décrite.
CHAPITRE 6 – L’effet de cadrage
Dans le Chapitre 5 nous avons présenté un algorithme décentralisé pour une équipe de drone depatrouille autonome. Cependant, il y a des missions qui, pour des raisons éthiques ou opéra-tionnelles, il est obligatoire d’avoir un être humain dans la boucle, travaillant en équipe avec lesrobots.
Cependant, la prise de décision est une question cruciale pour les humains qui coopèrentavec les robots intelligents. En plus, il est bien admis que nombreux biais cognitifs affectentles jugements humains, conduisant à des décisions irrationnelles ou non optimales. L’effet decadrage (FE9) est un biais cognitif typique qui amène les gens à réagir différemment en fonctiondu contexte, la probabilité des résultats et la façon dont le problème est présenté (perte ou gain)(ceci a été décrit plus en détail dans le Chapitre 2).
Dans ce chapitre nous présentons les résultats des expériences menées en laboratoire sur leeffet de cadrage. Ces expériences ont été réalisées afin de mieux comprendre les effets de cebiais cognitif dans le contexte opérationnel étudié. Cette étape est essentielle pour optimiserles interactions humain-robot (HRI). Les résultats obtenus ont été présentés dans le papier deconférence « Vers l’interaction homme-robot: une expérience d’effet de cadrage » présenté à laConférence internationale IEEE sur Systèmes, Homme et Cybernétique (SMC 2016).
Nous avons mené l’expérience sur l’effet de cadrage dans le contexte d’une mission derecherche et sauvetage (lors d’un tremblement terre) et dans le contexte d’une mission de re-tour des échantillons de Mars. L’interface graphique (voir Fig. R.3) été commune aux deuxscénarios. Nous avons manipulé le cadrage (positif ou négatif), la probabilité des résultats dansune première expérience, et les couleurs de texte (cadrage visuel) dans une deuxième expérience.
Nous avons recueilli 1982 observations de 20 sujets dans la première expérience et 240 ob-servations de 12 participants dans la deuxième expérience. Nos résultats ont révélé que la façondont le problème a été présenté (positivement ou négativement encadré), l’engagement émotion-nel (sauver des vies par rapport collecter le bon échantillon), et les couleurs de texte ont affectéstatistiquement les choix effectués par les opérateurs humains.
Les principales contributions de cette étude étaient:
• CH-4 - l’observation de l’effet de cadrage dans ce contexte;9Framing effect
186
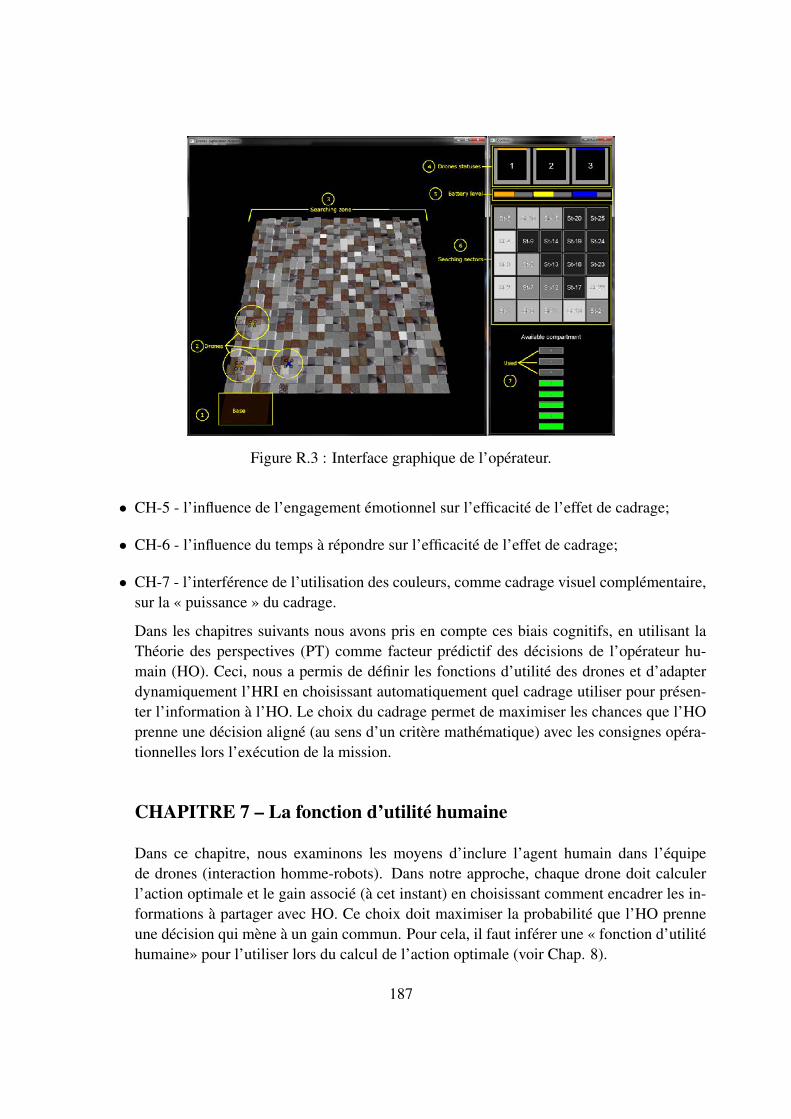
Figure R.3 : Interface graphique de l’opérateur.
• CH-5 - l’influence de l’engagement émotionnel sur l’efficacité de l’effet de cadrage;
• CH-6 - l’influence du temps à répondre sur l’efficacité de l’effet de cadrage;
• CH-7 - l’interférence de l’utilisation des couleurs, comme cadrage visuel complémentaire,sur la « puissance » du cadrage.
Dans les chapitres suivants nous avons pris en compte ces biais cognitifs, en utilisant laThéorie des perspectives (PT) comme facteur prédictif des décisions de l’opérateur hu-main (HO). Ceci, nous a permis de définir les fonctions d’utilité des drones et d’adapterdynamiquement l’HRI en choisissant automatiquement quel cadrage utiliser pour présen-ter l’information à l’HO. Le choix du cadrage permet de maximiser les chances que l’HOprenne une décision aligné (au sens d’un critère mathématique) avec les consignes opéra-tionnelles lors l’exécution de la mission.
CHAPITRE 7 – La fonction d’utilité humaine
Dans ce chapitre, nous examinons les moyens d’inclure l’agent humain dans l’équipede drones (interaction homme-robots). Dans notre approche, chaque drone doit calculerl’action optimale et le gain associé (à cet instant) en choisissant comment encadrer les in-formations à partager avec HO. Ce choix doit maximiser la probabilité que l’HO prenneune décision qui mène à un gain commun. Pour cela, il faut inférer une « fonction d’utilitéhumaine» pour l’utiliser lors du calcul de l’action optimale (voir Chap. 8).
187
Donc, le but de ce travail était d’aborder la fonction d’utilité des HO et de prédire leursdécisions dans un contexte opérationnel spécifique, comme une mission coopérative entreles robots et les humains.
L’étude de ce chapitre a proposé : sur la base des données expérimentales collectéesprécédemment (voir Chapitre 6), (CH-8) l’approximation de la fonction d’utilité de l’opérateurhumain fondée sur la PT et, pour autant que nous le sachions, (CR-9) le premier modèledécisionnel basé sur l’approche économique de consommation multi-dimensionnel et laPT. Les résultats présentés, en ce qui concerne l’ajustement de la fonction d’utilité, et laprécision de la prédiction, sont prometteurs et montrent que ce type de modélisation et deprédiction peuvent être pris en compte lorsqu’un système cybernétique intelligent dirigel’interaction homme-robot (HRI). L’avantage de prédire la décision de l’opérateur, dans cecontexte opérationnel, est d’anticiper sa décision, compte tenu de la façon dont une ques-tion est presentée (cadrage) à l’opérateur humain. Et ainsi, réaliser le choix de commentprésenter l’information courante à l’opérateur, le tout en maximisant les chances d’alignersa décision, par nature non-déterministe, avec les directrives opérationnelles de la mission.
Enfin, le prochain chapitre, presente notre proposition formelle du système dans son en-semble, en utilisant tout ce qui a été présenté jusqu’ici. Nous présentons également lesrésultats d’une expérience menée pour observer le système en action et les lignes directri-ces opérationnelles qui ont été utiliser pour influencer les décisions de l’HO.
CHAPITRE 8 – Le système en boucle fermée
Dans ce chapitre, nous présentons notre proposition formelle du système, où nous fermonsla boucle, en utilisant: (i) le cadre théorique du jeu de coordination décentralisé (Chapitre5); (ii) le modèle de prédition de décision de l’opérateur humain proposé (Chapitre 7),basée sur les données expérimentales obtenues dans les expériences FE (Chapitre 6). Cedernier devrait nous permettre de décider comment présenter l’information, en attendantque l’HO décide conformément aux lignes directrices de la mission. Enfin, pour éval-uer le système en boucle fermée, nous menons une expérience avec un grand nombre departicipants, ce qui nous a permis l’évaluer l’efficacité de notre approche.
Description du système
Pour cette étude, nous avons défini une mission SAR dans une zone délimitée (subdiviséeen petits secteurs) et avons assumé les phases suivantes pour cette mission: (1) sélec-tion et déplacement vers un secteur de destination, (2) sélection et exécution d’un type derecherche, et (3) l’interaction avec l’opérateur si une possible victime est trouvée.
Dans ce cadre, chaque drone calcule et choix ses stratégies de mouvement, de rechercheet d’intéraction avec l’HO en utilisant une approche basée sur la théorie des jeux. En ce
188
sens, ils sont des agents auto-centrés essayant de maximiser leurs propres gains, en jouant« contre » les autres, l’environnement et l’opérateur humain.
Dans le jeu entre eux, les drones doivent coordonner leurs actions pour éviter les collisions,se disperser dans les zones d’intérêt et visiter tous les points prédéterminés de manière nondéterministe, ceci dépend des information qu’ils acuièrent au fur et à mesure de la mission.Dans ce jeu non-coordonné (ACG), qui est aussi un jeu potentiel, non seulement le coûtde déplacement a été considéré, mais aussi les positions courantes des autres membres del’équipe, ainsi que la probabilité de l’existence d’une victime dans un POI donnée. Pouraméliorer les performances de calcul en temps réel, ce jeu a été joué uniquement pour lesPOI de chaque drone (macro-actions).
L’interaction avec l’environnement se produit quand ils doivent choisir comment ils chercherontdes cibles, c’est-à-dire, quel pattern de recherche ils utiliseront. Pour cela, un jeu contrela nature GAN a été conçu en tenant compte du pire scénario (« loi de Murphy »), pourlequel, nous avons démontré qu’une stratégie mixte pourrait être la meilleure alternative àmettre en oeuvre.
L’intéraction avec l’opérateur a été conçue comme un jeu d’équipe séquentiel, qui prendsen compte les biais cognitifs humains tels que l’effet de cadrage, via une interface util-isateur graphique (GUI), afin d’améliorer le processus de prise de décision de l’HO etd’optimiser l’utilité globale du système. Ce jeu permet aux drones d’adapter l’interactionavec les opérateurs en fonction des ressources disponibles et de l’état courant de la recherche.
Ces jeux ont été joués à l’intérieur de chaque drone, où le NE est appliqué pour définierl’action optimale à réaliser à chaque étape. La Fig. R.4 montre l’organigramme d’unemission typique.
Enfin, chaque gain (chaque function d’utilité de differents jeux) est influencé par la con-signe directive de la mission. Les consignes directives opérationnelles sont des déclara-tions et des recommandations qui déterminent une ligne de conduite en accord avec lesdécisions de l’autorité chargée de la mission. Dans cette thèse, nous nous concentreronssur ce qui est plus important dans une mission spécifique : la vitesse ou l’exactitude. Parexemple, le coucher du soleil arrive (alors, il est important d’être rapide), ou les victimesqui n’obtient pas d’aide peuvent geler jusqu’à la mort (alors, soyez précis).
Évaluation
Afin d’évaluer notre cadre, nous avons développé une simulation par ordinateur en util-isant Python 3.5 et MORSE (Fig. R.5), basée sur un scénario d’un tremblement de terre,conçu pour les expériences précédentes. MORSE est un simulateur robotique open sourceconçu pour gérer la simulation de plusieurs robots simultanément. Il peut être utilisé dansplusieurs contextes pour le test et la vérification des systèmes robotiques dans leur ensem-ble, d’un niveau moyen à un haut niveau d’abstraction [Ech+11].
189
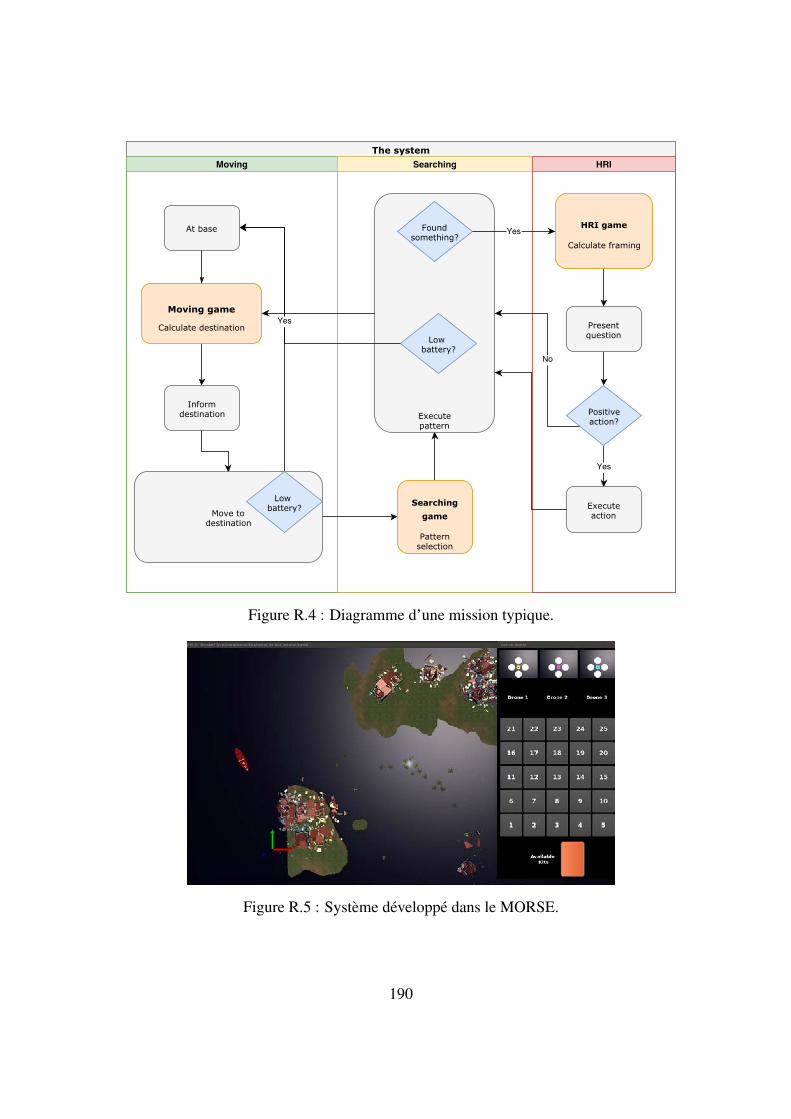
Figure R.4 : Diagramme d’une mission typique.
Figure R.5 : Système développé dans le MORSE.
190
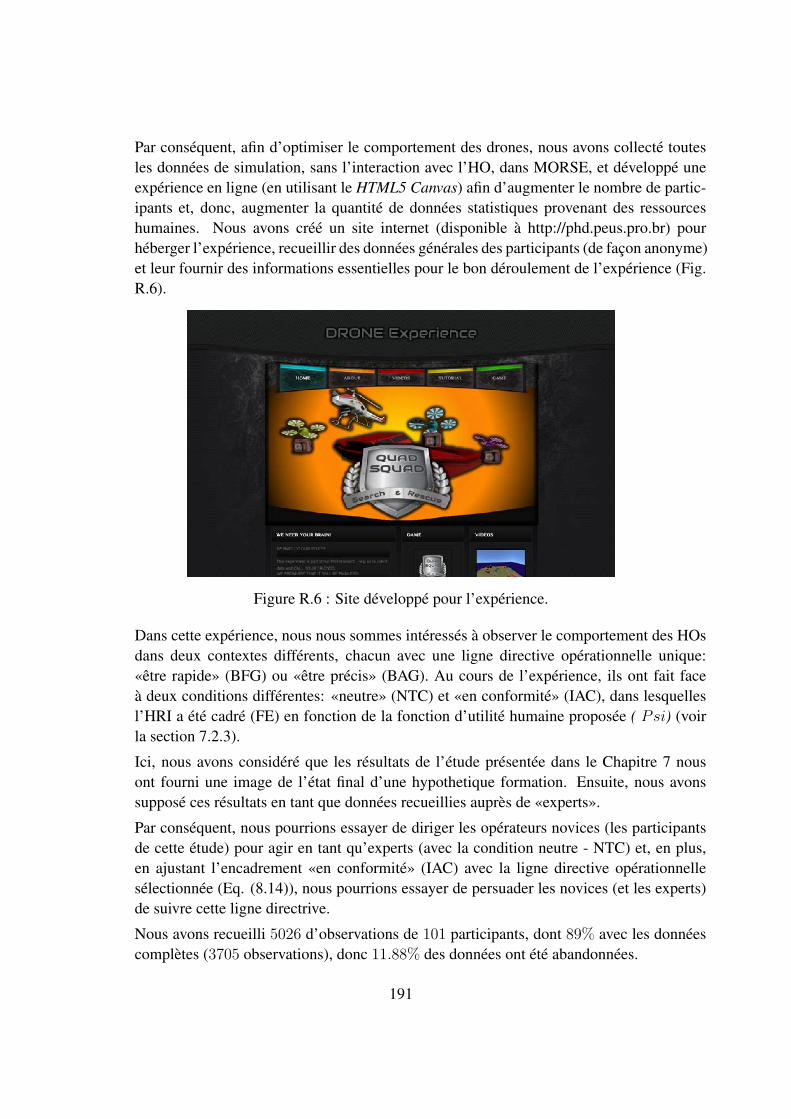
Par conséquent, afin d’optimiser le comportement des drones, nous avons collecté toutesles données de simulation, sans l’interaction avec l’HO, dans MORSE, et développé uneexpérience en ligne (en utilisant le HTML5 Canvas) afin d’augmenter le nombre de partic-ipants et, donc, augmenter la quantité de données statistiques provenant des ressourceshumaines. Nous avons créé un site internet (disponible à http://phd.peus.pro.br) pourhéberger l’expérience, recueillir des données générales des participants (de façon anonyme)et leur fournir des informations essentielles pour le bon déroulement de l’expérience (Fig.R.6).
Figure R.6 : Site développé pour l’expérience.
Dans cette expérience, nous nous sommes intéressés à observer le comportement des HOsdans deux contextes différents, chacun avec une ligne directive opérationnelle unique:«être rapide» (BFG) ou «être précis» (BAG). Au cours de l’expérience, ils ont fait faceà deux conditions différentes: «neutre» (NTC) et «en conformité» (IAC), dans lesquellesl’HRI a été cadré (FE) en fonction de la fonction d’utilité humaine proposée ( Psi) (voirla section 7.2.3).
Ici, nous avons considéré que les résultats de l’étude présentée dans le Chapitre 7 nousont fourni une image de l’état final d’une hypothetique formation. Ensuite, nous avonssupposé ces résultats en tant que données recueillies auprès de «experts».
Par conséquent, nous pourrions essayer de diriger les opérateurs novices (les participantsde cette étude) pour agir en tant qu’experts (avec la condition neutre - NTC) et, en plus,en ajustant l’encadrement «en conformité» (IAC) avec la ligne directive opérationnellesélectionnée (Eq. (8.14)), nous pourrions essayer de persuader les novices (et les experts)de suivre cette ligne directrive.
Nous avons recueilli 5026 d’observations de 101 participants, dont 89% avec les donnéescomplètes (3705 observations), donc 11.88% des données ont été abandonnées.
191
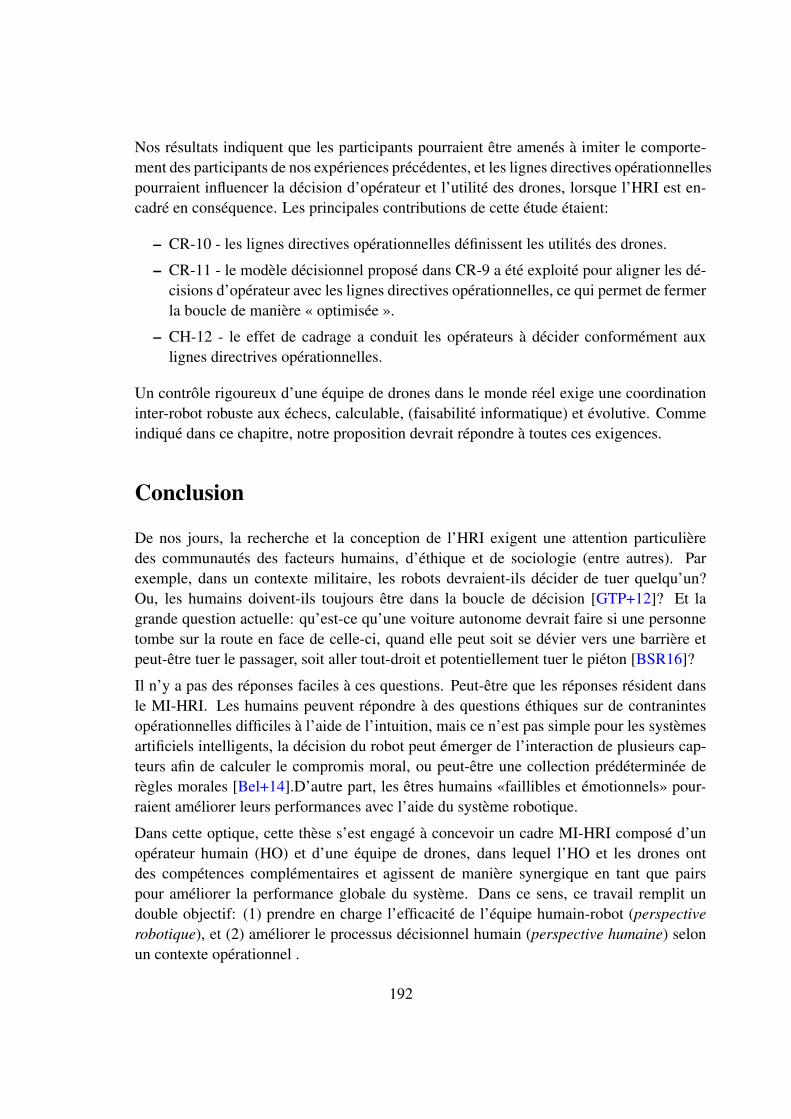
Nos résultats indiquent que les participants pourraient être amenés à imiter le comporte-ment des participants de nos expériences précédentes, et les lignes directives opérationnellespourraient influencer la décision d’opérateur et l’utilité des drones, lorsque l’HRI est en-cadré en conséquence. Les principales contributions de cette étude étaient:
– CR-10 - les lignes directives opérationnelles définissent les utilités des drones.
– CR-11 - le modèle décisionnel proposé dans CR-9 a été exploité pour aligner les dé-cisions d’opérateur avec les lignes directives opérationnelles, ce qui permet de fermerla boucle de manière « optimisée ».
– CH-12 - le effet de cadrage a conduit les opérateurs à décider conformément auxlignes directrives opérationnelles.
Un contrôle rigoureux d’une équipe de drones dans le monde réel exige une coordinationinter-robot robuste aux échecs, calculable, (faisabilité informatique) et évolutive. Commeindiqué dans ce chapitre, notre proposition devrait répondre à toutes ces exigences.
Conclusion
De nos jours, la recherche et la conception de l’HRI exigent une attention particulièredes communautés des facteurs humains, d’éthique et de sociologie (entre autres). Parexemple, dans un contexte militaire, les robots devraient-ils décider de tuer quelqu’un?Ou, les humains doivent-ils toujours être dans la boucle de décision [GTP+12]? Et lagrande question actuelle: qu’est-ce qu’une voiture autonome devrait faire si une personnetombe sur la route en face de celle-ci, quand elle peut soit se dévier vers une barrière etpeut-être tuer le passager, soit aller tout-droit et potentiellement tuer le piéton [BSR16]?
Il n’y a pas des réponses faciles à ces questions. Peut-être que les réponses résident dansle MI-HRI. Les humains peuvent répondre à des questions éthiques sur de contranintesopérationnelles difficiles à l’aide de l’intuition, mais ce n’est pas simple pour les systèmesartificiels intelligents, la décision du robot peut émerger de l’interaction de plusieurs cap-teurs afin de calculer le compromis moral, ou peut-être une collection prédéterminée derègles morales [Bel+14].D’autre part, les êtres humains «faillibles et émotionnels» pour-raient améliorer leurs performances avec l’aide du système robotique.
Dans cette optique, cette thèse s’est engagé à concevoir un cadre MI-HRI composé d’unopérateur humain (HO) et d’une équipe de drones, dans lequel l’HO et les drones ontdes compétences complémentaires et agissent de manière synergique en tant que pairspour améliorer la performance globale du système. Dans ce sens, ce travail remplit undouble objectif: (1) prendre en charge l’efficacité de l’équipe humain-robot (perspectiverobotique), et (2) améliorer le processus décisionnel humain (perspective humaine) selonun contexte opérationnel .
192
Par conséquent, nous avons commencé la recherche avec une revue de la littérature surles missions 3D adaptées à notre cadre, telles que les missions militaires, SAR et spatiales.Ensuite, nous avons étudié le processus décisionnel humain et certaines de ses théories (parexemple, la théorie des perspectives). Pendant ce temps, dans la perspective robotique nousnous sommes concentrés sur les processus de décision décentralisés tels que la théorie desjeux.
Avec ces concepts, nous avons conçu notre proposition étape par étape. Tout d’abord,nous avons développé une fonction d’utilité théorique pour coordonner l’équipe du dronedans une mission autonome de patrouille. Ici, en plus du coût du trajet, nous avons égale-ment considéré la position actuelle de tous les drones et la dernière fois que chaque pointd’intérêt a été visité. Avec ces informations, nous avons créé une fonction de utilité addi-tive d’un jeu anti-coordination (ACG), dans lequel une solution NE pure aligne les objectifségocentriques des drones avec un objectif global.
Deuxièmement, afin d’observer si nous pouvions influencer les décisions de l’HO en raisonde l’incertitude, de la pression temporelle et de l’information imparfaite, nous avons menédeux expériences sur l’effet de cadrage (FE), en utilisant une mission SAR et une missionde retourd’échantillon comme contextes. Nos résultats ont démontré l’existence du FE etla difference de l’engagement émotionnel dans des tels contextes, et que l’utilisation descouleurs effet de cadrage visuel peut améliorer l’influence du effet de cadrage du texte.
Troisièmement, avec les données recueillies dans ces expériences, nous avons estimé lafonction d’utilité de l’opérateur humain et proposé un modèle décisionnel pour que lesrobots choisissent le cadrage (présentation de l’information) lors de l’interaction avecl’opérateur, afin d’augmenter la probabilité que l’HO choisisse, lui, une action qui opti-mise l’utilité globale.
Ainsi, nous fermons la boucle, en formalisant notre proposition dynamique théorique dé-centralisée pour générer les interactions d’une équipe humain-drones. Pour l’interactionentre les drones, nous avons créé un ACG, inspiré de l’approche de mission de patrouille(cf. Chapitre 5). Pour l’interaction drone-environnement, lorsque les drones devaientsélectionner un modèle de recherche, nous avons conçu un GAN et nous avons démontréqu’une stratégie mixte pourrait être la meilleure réponse à ce jeux. Pour le HRI, nous avonscréé un jeu d’équipe séquentiel, où les drones utilisent un jeu fictif, basé sur l’estimationde la fonction d’utilité du opérateur pour choisir comment interagir avec l’HO. Et, ensuite,nous avons biaisé ces trois jeux pour suivre les directives opérationnelles (pour être rapideou précis, dans notre dernière expérience). Nous avons également suggéré que l’utilitéglobale soit utilisé comme mesure d’efficacité du système.
Enfin, pour évaluer notre proposition, l’expérience III a été réalisée. Nos résultats sug-gèrent qu’il est possible de conduire l’HO à agir conformément aux consignes directivesopérationnelles et aux stratégies des «experts», quelque soit leur expérience antérieure,explorant l’effet de cadrage lors de l’interaction humain-robots.
193
Limitations
L’approche actuelle est limitée par les données recueillies dans les expériences I et II, danslesquelles le nombre de participants était relativement faible. De plus, malgré que cesparticipants aient exécuté dix missions chacun (dans l’expérience I), leurs données pour-raient ne pas représenter nécessairement le «comportement d’experts», ainsi considérésdans l’expérience III.
Une autre limitation est que l’expérience III n’était pas une vrai mission à initiative-mixte(MI-HRI). Seuls les drones avaient l’initiative pendant la mission (autonomie adaptativeen ce qui concerne la décision prise par l’humain). Dans un scénario à initiative-mixte, enparticulier dans le cadre de la mission SAR, le HO pourrait également suggérer un patternde recherche ou donner la priorité à certains secteurs, selon son expertise, et les dronespourraient décider de libérer (ou pas) un kit si l’HO n’était pas disponible (ou hors dudomaine de communication).
Contributions
Cette thèse fournit des méthodes authentiques qui peuvent être reproduites pour évaluerle mise en œuvre de modèles de la théorie des jeux et de principes de facteurs humainsdans un contexte opérationnel. En ce sens, ce travail a réuni deux disciplines différentes,l’ingénierie (la robotique) et la psychologie (facteurs humains). Par conséquent, les prin-cipales contributions sont:
– CR-1 - la formulation originale d’une fonction d’utilité additive, pour un joueur (undrone de l’équipe), composée de trois paramètres indépendants des choix d’actiondes autres joueurs;
– CR-2 - la démonstration que la solution de ce jeu est un NE, et que cet équilibrepeut être obtenu en optimisant séparément et individuellement le choix d’action d’unjoueur unique;
– CR-3 - la proposition d’un algorithme décentralisé utilisé pour mener une mission depatrouille, ce qui implique une communication minimale entre les agents.
– CH-4 - l’observation de l’effet de cadrage (FE) dans un contexte opérationnel;
– CH-5 - l’influence de l’engagement émotionnel dans l’efficacité du FE;
– CH-6 - l’influence du temps de réponse dans l’efficacité du FE;
– CH-7 - l’interférence de l’utilisation des couleurs, en tant que cadrage visuel complé-mentaire, dans la «puissance» du FE;
– CH-8 - l’approximation de la fonction d’utilité de l’opérateur humain fondée sur lathéorie des perspectives (PT);
194
– CR-9 - un modèle décisionnel basé sur l’approche économique de consommationmulti-dimensionnelle et la PT;
– CR-10 - les consignes directives opérationnelles qui conduisaient les fonctions d’utilitédes drones.
– CR-11 - le modèle décisionnel proposé dans CR-9 a été exploité pour aligner lesdécisions de l’HO avec les consignes directives opérationnelles, ce qui a permis defermer la boucle de manière « optimisée ».
– CH-12 - les FE a mené les opérateurs à décider conformément aux directives opéra-tionnelles.
Travaux futurs
Il y a plusieurs voies de progrès pour le travail proposé dans cette thèse.
Concernant la perspective robotique, les études futures devraient tenir compte des incer-titudes dans le mouvement des drone et dans la disponibilité de l’HO, en utilisant lessolveurs M/POMDP en ligne. Les solveurs hors ligne sont souvent appliqués dans dedomaines de petite à moyenne taille, car la phase de construction de la politique prendsun temps significatif pour que l’algorithme puisse approcher une politique (via une fonc-tion de valeur), qui définit des actions à exécuter dans tous les états de croyance possibles[Ros+08]. D’autre part, les solveurs en ligne tentent de trouver une bonne politique lo-cale pour seulement l’état de croyance actuel de l’agent, ce qui n’est rien d’autre qu’un jeustochastique. Un avantage est qu’il faut seulement considérer les états de croyance qui sontaccessibles à partir de l’état de croyance actuel. Cependant, afin d’améliorer l’optimisationde la politique locale, il pourrait être intéressant d’augmenter l’horizon à un petit nombrede d’étapes (planification en ligne), selon la capacité de calcul embarquée (pour éviter uneperte de performance). Et, au lieu d’une re-planification à chaque étape, utiliser des «macro-actions » (ensembles d’actions atomiques) pour réduire la taille du domaine.
Il pourrait également être intéressant d’étudier un algorithme d’apprentissage par renforce-ment en ligne pour améliorer l’interaction humain-robots en fonction des décisions précé-dentes prises par le HO actuel. Cela pourrait ajuster le comportement du système en fonc-tion de la performance de l’opérateur.
Concernant la perspective humaine, d’autres recherches pourraient explorer des outils dutransfert learning [PY10] pour: (1) dans une première étape, pour regrouper des personnesayant une valeur perçue personnelle semblable; (2) en appliquant, dans ce cas, la fonctionde valeur perçue appropriée en fonction de ce comportement commun.
Les recherches futures devraient également prendre en compte les états cognitifs de l’opérateurhumain, par exemple, la charge de travail ou le niveau de stress de l’opérateur. D’une part,
195

l’opérateur a un certain niveau de conscience de la situation, ce qui lui permettrait de con-naître les capacités de l’agent artificiel et de son état. De l’autre côté, lorsque l’autonomieadaptative ou l’initiative mixte sont considérées, l’agent artificiel devrait avoir un modèlede «capacités» de l’HO et son «état» actuel [TD12]; [Dur+15]; [Gat+16]; [Roy+16] (voiraussi [SCD15] dans l’Annexe A). Cela pourrait améliorer le processus de décision desagents artificiels afin de décider s’ils prennent ou non l’initiative.
Et, enfin, une progression naturelle de ce travail est un véritable système MI-HRI, avec,plus de drones et plus d’opérateurs, dans lequel, tous les agents peuvent avoir l’initiative(pouvoir de contrôler) et, en particulier, pouvoir saisir de façon opportuniste l’initiative del’autre quand il s’avère nécessaire.
196

197