Titre du projet : Améliorer l’efficacité agro ... · potentielle offerte par un projet...
60
Mission DAR 2ème année de réalisation du projet (2010) N° du projet : Convention 08 AAP n° 8095 Titre du projet : Améliorer l’efficacité agro-environnementale des systèmes agroforestiers en grandes cultures Organisme chef de file : Chambre d’Agriculture des Deux-Sèvres Nom et organisme du chef de projet : Patrick BOUCHENY, Chambre d’Agriculture des Deux- Sèvres COMPTE RENDU FINAL Action 4 : Etude des potentialités offertes par l’agroforesterie pour la production d’agrocarburant de 2 nde génération LIVRABLE R 4.2 Nom du partenaire : Institut Polytechnique Lasalle Beauvais Période de référence pour le compte-rendu : La période de référence correspondante coure du 01/01/2010 au 31/12/2010
-
Upload
hoanghuong -
Category
Documents
-
view
213 -
download
0
Transcript of Titre du projet : Améliorer l’efficacité agro ... · potentielle offerte par un projet...

Mission DAR 2ème année de réalisation du projet (2010)
N° du projet : Convention 08 AAP n° 8095
Titre du projet : Améliorer l’efficacité agro-environnementale des systèmes agroforestiers en
grandes cultures
Organisme chef de file : Chambre d’Agriculture des Deux-Sèvres
Nom et organisme du chef de projet : Patrick BOUCHENY, Chambre d’Agriculture des Deux-
Sèvres
COMPTE RENDU FINAL
Action 4 : Etude des potentialités offertes par l’agroforesterie pour la production
d’agrocarburant de 2nde génération
LIVRABLE R 4.2
Nom du partenaire : Institut Polytechnique Lasalle Beauvais
Période de référence pour le compte-rendu : La période de référence correspondante coure du
01/01/2010 au 31/12/2010

_______________ Synthèse du Livrable 4.2 _______________
Rappels des objectifs attendus « Action 4 » (Dossier finalisé 08 AAP n° 8095 Agroforesterie):
Les hypothèses de développement de la demande en biomasse sont estimées à plusieurs centaines de milliers de tonnes (voir synthèse RMT Biomasse). La diversification des ressources en biomasse est donc une question essentielle et les ressources forestières sont régulièrement citées comme gisement potentiel. Avec une production de biomasse unitaire élevée, les arbres agroforestiers pourraient à terme compléter ces ressources. L’objectif de cette action est d’estimer la production de biomasse potentielle offerte par un projet agroforestier. Il sera étudié dans quelle mesure les productions agroforestières pourraient répondre à la demande croissante en biomasse. L’étude bibliographique permettra de souligner les manques de connaissances actuels et d’identifier les thèmes de recherche pour répondre à cette demande. En fonction des aménagements existants et des études menées, il sera proposé des aménagements expérimentaux pour étudier la productivité des lignes d’arbres. Enfin, une première étude de faisabilité économique sera réalisée.
Cette étude sera menée en partenariat avec les partenaires du RMT Biomasse, coordonnée par la Chambre Régionale de Picardie. L’agroforesterie ne faisant pas partie des actions possible de ce RMT.
Synthèse de l'action 4.2 : Estimation de la productivité agroforestière
1. De l’évaluation de la productivité des parcelles agroforestières
De prime abord, il apparaît relativement complexe de recenser des références « biomasse ligneuse en parcelles agroforestières » ; la faute à (i) la toute jeunesse des parcelles implantées et gérées au sein du réseau Agroforesterie issu du projet CasDAR 2007/2009, donc (ii) à la rareté des parcelles d’âge mûr (au moins 5-10 ans) ou quand celles-ci existent depuis un certain temps (Restinclières par exemple) (iii) au fait qu’elles ont été ou seront récoltées à une autre époque et que rarement des prélèvements destructifs ont été programmés tout au long du cycle de production. De fait, aujourd’hui, trouver des références biomasse ligneuse en parcelle agroforestière est chose quasiment impossible. Bien entendu, le recours à des données d’origine variée, issues par exemple d’expérimentations conduites en milieu tempéré par des instituts de recherche étrangers tels les Universités de Laval (CA), de Wageningen (NL) ou encore de Cranfield (UK) sont d’intérêt. Le problème étant alors que les essences produites ou les conditions d’implantation et d’entretien sont très rarement communiquées ; de fait, la validité des données obtenues pourrait s’avérer questionnable, pis encore, leur transferabilité aux situations françaises pourrait être inenvisageable.
En tout état de cause, les arguments présentés ci-avant militent-ils pour le développement et la mise au point d’une méthodologie d’évaluation de la production de la biomasse ligneuse en parcelles agroforestière qui prendrait en compte l’ensemble des contraintes et des impératifs de production et techniques listés ci-dessous :
- Etre à même de décrire les conditions pédologiques et climatiques des parcelles agroforestières
- Connaître l’itinéraire technique (implantation, entretien, opération de fertilisation voire de protection contre des ravageurs)
- Etre capable de produire des références distinguables selon les espèces en présence sur les parcelles agroforestières
- Ne pas être destructive du fait que le nombre d’arbres agroforestiers est souvent fixé pour un optimum de production et de plus value à long terme et n’a pas été envisagé pour en permettre un suivi longitudinal par prélèvement destructeur en cours de cycle

- Etre simple pour s’assurer de l’adhésion du plus grand nombre, applicable à tous les types d’agroforesterie rencontrés (essences, conformation, dispositif…) comme pour tous autres types de production de biomasse ligneuse (haies, arbres têtards …) et répétable dans le temps
- Limitant les mesures réalisées in situ comme les analyses successives aux observations.
D’autre part, la méthodologie se doit de répondre à la diversité des attentes formulées : quand l’exploitant agricole possesseur de parcelle agroforestière, le forestier ou encore le simple citoyen va s’intéresser à une valeur de production (t MS/ha récoltée par exemple), un public technique et scientifique peut s’intéresser en sus à des mesures de productivité (tMS/ha/an). La différence majeure réside en ce que la productivité concerne l’incrément annuel (par exemple) de biomasse au sein du couvert ligneux alors que la production concerne quant à elle le résultat de la productivité observé à la récolte. Cette distinction est nécessaire du fait qu’elle rappelle l’importance et la complémentarité des observations destructives et non destructives dans le cas du suivi de la productivité, alors que seules des observations destructives finales suffisent à exprimer la production; elle pointe aussi le fait que la fréquence à laquelle les observations et mesures doivent être faites (c'est-à-dire l’effort d’échantillonnage à concéder) diffère grandement.
Afin de répondre à l’ensemble des attentes formulées au sein du projet CasDAR 08 AAP n° 8095 Agroforesterie 2008/2011, production et productivité se doivent d’être envisagées. Bien entendu, la gestion et le coût imputables à l’effort d’échantillonnage imposent d’imaginer une méthodologie différentielle selon les résultats attendus.
2. Diversité méthodologique pour le suivi de la production et de la productivité de biomasse ligneuse agroforestière
Les méthodes potentielles recensées sont présentées au sein de la figure 1 suivante.
Figure 1 : méthodes pressenties pour le suivi de la productivité et/ou de la production biomasse ligneuse agroforestière
Quatre « méthodes » sont envisageables selon que l’on vise le suivi de la productivité / production et que l’on peut avoir recours à des mesures destructives / non destructives (Remarque : des méthodes de marquage isotopique 13C ou 15N n’ont pas été envisagées du fait du coût financier qu’elles induisent). Cependant toutes n’ont pas les mêmes conséquences en termes de coût (temps d’acquisition, monétaire, niveau d’expertise, matériels nécessaires…) et ne peuvent donc répondre intégralement à la liste des contraintes listées. Si le prélèvement destructeur de la totalité de la biomasse ligneuse (méthode « Récolte ») ne peut être fait qu’une fois au cours du cycle de vie, il impose cependant de gérer des volumes importants de biomasse par arbre abattu ; en outre, pour prétendre à une certaine prise en compte de la variabilité intraparcellaire, des répétitions sont à prévoir ce qui augmente d’autant les volumes biomasse à mesurer. Cela peut s’avérer fastidieux (transport, découpe…) et à l’origine d’approximations du fait qu’il est irréaliste de mesurer en frais et en sec l’ensemble de la biomasse récoltée et de ne mesurer que par compartiment pouvant mener à l’accumulation des biais imputables aux modes de mesure.
A l’inverse la méthode dite « écophysiologie du fonctionnement » fait appel à des matériels spécifiques de suivi des activités photosynthèse/respiration foliaire, de rayonnement actif ou encore des analyses C et N des compartiments d’intérêt. Du fait qu’elle concerne des compartiments ciblés (feuilles, tiges, …) elles nécessitent de répéter un grand nombre de fois les mesures et donc ne peuvent être mises en place au sein de tout un réseau de parcelles expérimentales sans nécessiter un investissement temps et argent énorme, et devront concerner chaque essence voire chaque microclimat rencontré. Elles sont d’ailleurs généralement mises en place dans le cas de la constitution de modèle de fonctionnement des peuplements, phase amont à la constitution de modèles écophysiologique ou de calibration/validation de modèles préexistants.
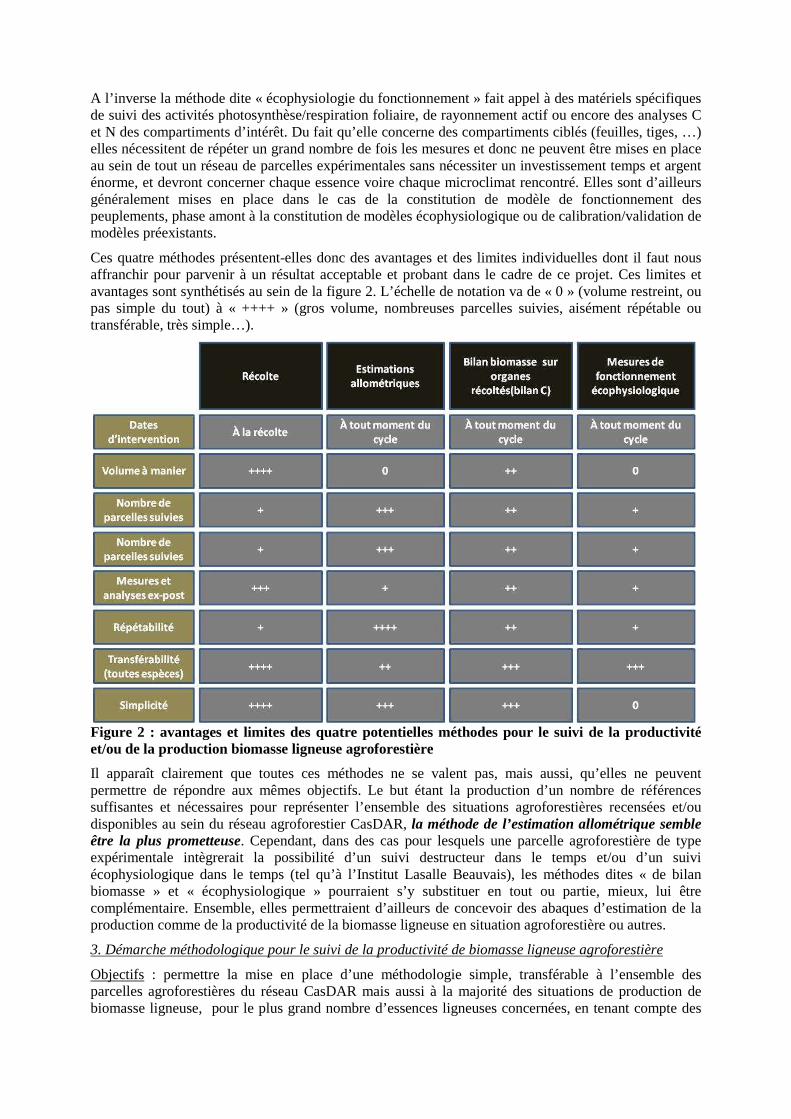
Ces quatre méthodes présentent-elles donc des avantages et des limites individuelles dont il faut nous affranchir pour parvenir à un résultat acceptable et probant dans le cadre de ce projet. Ces limites et avantages sont synthétisés au sein de la figure 2. L’échelle de notation va de « 0 » (volume restreint, ou pas simple du tout) à « ++++ » (gros volume, nombreuses parcelles suivies, aisément répétable ou transférable, très simple…).
Figure 2 : avantages et limites des quatre potentielles méthodes pour le suivi de la productivité et/ou de la production biomasse ligneuse agroforestière
Il apparaît clairement que toutes ces méthodes ne se valent pas, mais aussi, qu’elles ne peuvent permettre de répondre aux mêmes objectifs. Le but étant la production d’un nombre de références suffisantes et nécessaires pour représenter l’ensemble des situations agroforestières recensées et/ou disponibles au sein du réseau agroforestier CasDAR, la méthode de l’estimation allométrique semble être la plus prometteuse. Cependant, dans des cas pour lesquels une parcelle agroforestière de type expérimentale intègrerait la possibilité d’un suivi destructeur dans le temps et/ou d’un suivi écophysiologique dans le temps (tel qu’à l’Institut Lasalle Beauvais), les méthodes dites « de bilan biomasse » et « écophysiologique » pourraient s’y substituer en tout ou partie, mieux, lui être complémentaire. Ensemble, elles permettraient d’ailleurs de concevoir des abaques d’estimation de la production comme de la productivité de la biomasse ligneuse en situation agroforestière ou autres.
3. Démarche méthodologique pour le suivi de la productivité de biomasse ligneuse agroforestière
Objectifs : permettre la mise en place d’une méthodologie simple, transférable à l’ensemble des parcelles agroforestières du réseau CasDAR mais aussi à la majorité des situations de production de biomasse ligneuse, pour le plus grand nombre d’essences ligneuses concernées, en tenant compte des

particularités d’implantation et d’entretien prévues et/ou réalisées, des configurations parcellaires rencontrées et du niveau d’expertise des personnes qui devront la mettre en place et rendre compte de leurs observations.
Démarche : le développement d’une méthode d’estimation allométrique de la productivité de la biomasse agroforestière à partir (i) du recensement des sites agroforestiers français à même de disposer de données de toutes sortes de productivité, (ii) d’un travail de recensement des méthodes allométriques existantes (littérature technique et scientifique) comme déjà réalisées (auprès des acteurs principaux en charge de la production forestière, de la gestion des haies et bocages et bien entendu du réseau agroforestier) puis (iii) d’adaptation de ces méthodes au cas d’étude nous concernant.
Critères évalués : estimation de la production et de la productivité seront envisagées du fait qu’au moins deux années de R&D sont encore à notre disposition au sein du projet CasDAR. L’application de la méthode sur un réseau de parcelles d’âge différent pourrait nous permettre de nous affranchir du problème de la durée du cycle de production en permettant l’extrapolation des résultats de productivité à l’obtention des estimations de la production (connaître la vitesse de croissance de la biomasse par an, à des âges différents, permettant une estimation du potentiel de production à la date de la récolte).
La méthode allométrique devra s’inspirer très fortement des diverses références scientifiques et forestières développer pour l’estimation non destructive des volumes et biomasse des essences sur pied. Dans certains cas, (fin de cycle de production, récolte haies et arbres têtards…) il sera possible de pratiquer des mesures destructives en complément des mesures non destructives à la base de la méthodologie (voir Gruenewald et al., 2007). Les mesures non-destructives devront prendre en compte un certain nombre de paramètres tels que la mesure du DBH (Diameter at Breast height ; Bylin, 1982 ; Heineman et al., 1997 ; ) ou encore la hauteur totale de la biomasse aérienne (Heineman et al., 1997), la hauteur jusqu’à la base de la canopée (Lott et al., 2000), le diamètre de la couronne foliaire (Peper et al. 2001 ; Arevalo et al., 2007) ou encore une estimation réaliste de la surface foliaire totale et de son SLW (Specific leaf weight, g.m-2). D’autres informations seront nécessaires telles que le nombre de tiges, leur diamètre respectif à mi-hauteur et leur longueur.
Bien entendu, des ajustements sont à entreprendre du fait des situations très diverses, surtout en ce qui concerne les arbres têtards et une collaboration active avec les acteurs privilégiés de l’entité Arbre et Paysage du Gers est primordiale. En outre, cette collaboration nécessitera le bon-vouloir et la collaboration de l’ensemble des acteurs du projet CasDAR 2008/2011 pour évaluer, corriger et utiliser cette méthodologie. Elle devrait être élaborée au printemps 2010, évaluer et corriger pour utilisation été 2010. Un stage de mémoire de fin d’étude (MFE) en ce sens a été réalisé en 2010. Les principaux résultats méthodologiques et expérimentaux sont présentés ci-après. Le document global est cependant disponible sur demande auprès de [email protected] et sera consultable sur le site AFAF (Association Française d’AgroForesterie) relatif au projet Casdar 2008-2011.
4. Identification et choix des sites agroforestiers expérimentaux
Objectifs : Déterminer la nature et la diversité des sites agroforestiers existant en France, en date du projet Casdar, dans le but de recenser les sites expérimentaux susceptibles de présenter des caractéristiques/conditions favorables au développement de la méthode allométrique d’estimation de la productivité de biomasse agroforestière. Disposer d’une première base de données nationale recensant les sites agroforestiers existant sur le territoire.
Démarche : Pour ce faire, et parce qu’aucune base de données relative à la mission n’était mise à disposition, un questionnaire d’identification et de description des sites agroforestiers a été constitué ; élaboré sous système SPHINXTM, il a été envoyé à l’ensemble des protagonistes identifiés comme ayant un rapport étroit avec la production agroforestière, soit approximativement 46 adresses (le questionnaire envoyé ainsi que sa lettre d’accompagnement) sont joints en annexe (Annexes 1 et 2).
Ce questionnaire s’inspirait de ceux réalisés lors du projet SAFE et du projet CasDAR Agroforesterie 2006/2008; il a été adressé aux agriculteurs, propriétaires terriens, centres de recherche et organisations agricoles professionnelles susceptibles de posséder et/ou d’exploiter des sites agroforestiers. Le taux de retour était de l’ordre de 45% (n = 20) ; l’ensemble des questionnaires retournés constituait la base de données initiale pour le choix des sites agroforestiers expérimentaux. En complément des questions

posées, des entretiens téléphoniques individuels ont permis de compléter les questionnaires et d’obtenir des informations spécifiques relatives à chacun des sites comme aux personnes en charge de ces sites.
Parmi les réponses obtenues, une sélection a été opérée. Elle prenait en compte d’une part les caractéristiques de la parcelle agroforestière (essences, âge, type de pédoclimat, type d’agroforesterie…) mais aussi des critères techniques permettant d’évaluer la mise à disposition potentielle de matériel végétal pour mesures et/ou prélèvements de la biomasse ligneuse comme la possibilité d’assistance sur place lors des comptage et mesures.
Les critères de sélection des sites sont énumérés ci-après :
- L’opportunité de mesurer et de collecter des échantillons représentatifs – la limite principale identifiée au sein du questionnaire étant la possibilité de prélever des échantillons de biomasse pour estimation de la productivité, ce critère a été prépondérant pour le choix des parcelles agroforestières.
- Les essences en place au sein de la parcelle agroforestière : l’idée initiale étant de disposer d’une gamme d’âges et d’essences afin de permettre d’établir des courbes allométriques de productivité par essence – cependant, aux vues des retours faits, il apparaissait illusoire de disposer de cette gamme. De fait, nous avons restreint nos attentes et avons fait le choix de retenir l’essence la plus représentée, à savoir les noyers (hybride et commun).
- La nature de systèmes agroforestiers (sylvopastoralisme vs. agroforesterie) : du fait que les anciennes parcelles (i.e. 25 ans) soient de type sylvopastorales alors que les plus récentes soient de type agroforestière, notre idée première de ne pas confondre les deux types de système s’est avérée irréaliste. Nous avons donc considéré l’âge des parcelles comme important, indépendamment de la nature du système en place.
- L’âge comme la densité d’implantation ont été scrutées avec attention : le choix des sites agroforestiers a porté sur des parcelles d’âge le plus diversifié possible (entre 5 et 30 ans d’âge) et présentant une densité d’implantation d’au moins 140 arbres/hectares.
Principaux résultats : De fait, après tri et sélection, 6 sites ont été retenus. Les systèmes concernés étaient sylvopastoraux comme sylvoarables, d’âge compris entre 5 et 32 ans, de densité comprise entre 70 et 140 arbres/ha (Table 1). Sur certains de ces sites, les propriétaires/gestionnaires nous ont permis de prélever des arbres entiers, des branches primaires voire seulement des feuilles (…). Dans une grande partie des sites agroforestiers (AF), aucun témoin forestier n’était disponible ; nous avons donc recherchées des parcelles reboisées, proches, portant des densités suffisamment élevées pour nous servir de témoins « forestiers (F) ». Seul le Puy de Dôme (Theix) ne nous a pas permis d’en disposer.

Table 1: Description des sites de mesures et de prélèvements
Charactéristiques système
Charactéristiques site
Mesures destructives
Département Commune Type
Âge (ans)
Densité (nb/ha)
Altitude (m)
Pluvio. (mm)
AF
Pas de Calais Cormont Sylvopastoral 16 100 30 1053 Branches
Pas de Calais Lebiez Sylvopastoral 16 80 50 1053 Branches
Vienne Béthines Silvoarable 5 100 110 737 Branches
Charente Maritime
Tonnay-Charente
Silvoarable 11 140 5 763 Arbres
Charente Maritime
Les Éduts Silvoarable 32 130 150 777 Non
Puy de Dôme Theix Sylvopastoral 20 70 810 795 Arbres
F
Pas de Calais Crémarest
8 830 30 1053 Non
Pas de Calais Wismes
15 180 180 1053 Non
Vienne Béthines
5 210 110 737 Non
Charente Maritime
Tonnay-Charente
11 420 5 763 Non
Les résultats présentés ci-après relatifs à l’estimation de la productivité de biomasse ligneuse aérienne de système agroforestier (noyers) proviennent des protocoles de mesures conduits sur ces sites.
Les difficultés rencontrées lors de l’établissement de cette base de données « productivité ligneuse » démontre de l’impossibilité de bénéficier ce jour d’un réseau agroforestier (i) correctement géolocalisé et décrit, (ii) expérimental et destiné aux suivis longitudinaux espérés. Cette retour d’expérience suggère aussi qu’il est parfois difficile voire illusoire, à de rares exceptions près, d’attendre des personnes propriétaires / gestionnaires des sites une pleine et entière collaboration sans prévoir au préalable une rétribution et/ou un remboursement relatif aux pertes de production engendrées par le prélèvement d’individus sur site et aux coûts engendrés par leur disponibilité. Ceci souligne aussi le fait que de nombreuses parcelles agroforestières ne sont pas ce jour à même de permettre un réel et complet travail scientifique et technique de suivi et de mesures destructifs pour calibration de modèles de productivité. L’accroissement du réseau agroforestier et son adaptation pour l’expérimentation semblent demeurer essentiels.
5. Choix et calibration de modèles allométriques d’estimation de la biomasse aérienne ligneuse en agroforesterie sur noyer (Regia juglans×nigra)
Objectifs : Déterminer le modèle allométrique mettant en lien la biomasse ligneuse aérienne et une ou des variables descriptives de la morphologie des arbres agroforestiers est le plus à même de permettre une estimation la plus précise possible ; donc, déterminer quelle(s) variable(s) morphologique(s) des arbres agroforestiers sont les plus réalistes et robustes pour permettre la quantification (avec une marge d’incertitude quantifiable) du potentiel de séquestration carbone aérienne et donc de production de biomasse ligneuse à des fins énergétiques. Les modèles couramment rencontrés dans la littérature sont
ceux mettant en relation la biomasse aérienne sèche des arbres (DM, kg) avec (i) le diamètre de la grume à hauteur de poitrine (DBH) i.e. à 1.35m [DM = a * DBHb] ou encore (ii) le DBH et la hauteur aérienne totale de l’arbre (H,m) [DM = a * DBHb * Hc].
Démarche : Pour cela, l’opportunité de prélever (échantillonnage destructif) des individus sur sites était primordiale. De par sa variabilité elle nous a obligés à pratiquer :
(i) Des coupes d’arbres permettant de confronter directement la biomasse ou matière sèche aérienne (MSA) et des variables morphologiques mesurées.
(ii) Dans le cas où les prélèvements destructifs n’étaient pas possibles (ou partiels i.e. une ou des branches majeures), un grand nombre de mesures de diamètres, longueurs, dénombrement de feuilles pour le maximum de branches majeures était entrepris. L’idée étant d’appliquer le modèle FBA (Functional Branch Analysis model, Van Noordwijk and Mulia, 2002), qui en l’absence de prélèvement permet d’obtenir une estimation du volume total de l’arbre, donc de sa biomasse aérienne quand on connaît la densité volumique des bois (Remarque : ce modèle développé sur des essences tropicales nécessita une recalibration des paramètres – en outre, son degré de prédiction reste parfois peu satisfaisant en l’absence d’un nombre exhaustif de mesures, au moins 150 mesures par variable).
(iii)
Les deux méthodes seront bien évidemment testées pour évaluer la précision de prédiction sur les données MSA obtenues des prélèvements destructeurs totaux. En outre, des données destructives sur noyers hybrides (INRA Montpellier, Restrinclière) fournies a posteriori à la période de terrain nous permettront d’opposer le modèle allométrique obtenu à ceux utilisés par ailleurs et de vérifier la robustesse de prédiction de la MSA.
Résultats : L’estimation de la biomasse aérienne totale d’un arbre passe par l’estimation de son volume total lequel est multiplié par une densité volumique moyenne issue de mesures multiples. L’arbre dont on estime la biomasse aérienne est décomposé en parties distinctes, analysée sde manière plus ou moins directe selon que l’on travaille sur la grume (mesure directe) ou sur la surface foliaire totale (mesure partielle puis extrapolation).
Une contrainte a été appliquée à ce mode d’estimation de la biomasse totale d’un arbre, à savoir, permettre que la plus grande partie des modèles de calcul des volumes soit dépendante d’une variable aisément mesurable et facilement reproductible par la suite ; la mesure choisie est le diamètre de la tige principale à hauteur de poitrine i.e. DBH (Diameter at breast height, cm).
Les différentes étapes de détermination du volume et donc de la biomasse des parties constitutives d’un arbre sont les suivantes :
1. Détermination du volume de l’axe principal (de 5 cm au dessus du sol à l’apex terminal).
L’axe principal est alors considéré en trois parties distinctes dont on établit les volumes : de la base jusqu’à hauteur de poitrine (Vinf DBH), de la hauteur de poitrine jusqu’à la première fourche dû à la première branche d’ordre 1 (Vsup DBH) puis le volume supérieur de l’axe principal dans la couronne (VCOUR) (Figure 1). Chacun de ces trois volumes est fonction du diamètre à hauteur de poitrine (DBH) ; la somme des trois volumes permettant l’obtention du volume total de l’axe principal (VAP).
Un unique modèle allométrique permet une estimation du volume total de l’axe principal (Main Stem) :
VMS = 135.27*DBH2.3355

Figure 1 : principales mesures pour la détermination du volume de l’axe principal (le tronc)
2. Détermination du volume des branches d’ordre 1 (directement connectées à la tige principale)
Seuls leurs axes sont considérés jusqu’à un diamètre de 2cm. Les extrémités des branches d’ordre 1, les branches d’ordre 1+n et le feuillage étant regroupés au sein d’un échantillon distinct appelé « BPF », présenté ci-après. De même que précédemment, un volume total « branches d’ordre 1 » est attendu. Il est obtenu à partir de variables facilement accessibles telles le nombre de branches d’ordre 1, la somme des diamètres basaux des branches d’ordre 1 et la longueur (jusqu’à 2cm de diamètre) d’une branche d’ordre 1. Le calcul du volume des branches d’ordre 1 considère que toutes les branches d’ordre 1 sont identiques, c’est à dire à diamètre basal et longueur identiques – il s’agit ici de considérer une branche d’ordre 1 moyenne et de s’affranchir de la variabilité de ces dernières. Afin de faciliter le calcul du volume total que ces branches d’ordre 1 représentent, trois modèles relatifs au diamètre à hauteur de poitrine (DBH) ont été établis. Ils permettent d’estimer le nombre de branches d’ordre 1 et, un diamètre basal et une longueur (jusqu’à diamètre = 2cm) moyens de ces n branches d’ordre 1 moyennes. A partir de la formule du cône tronqué, le volume total des branches d’ordre 1 est obtenu.
Figure 2 : principales mesures pour la détermination du volume des branches d’ordre 1

Pour chacun des trois modèles obtenus, constitutifs du volume des branches d’ordre 1, les résultats sont les suivants :
Nbrch_O1 = (10.040 * ln DBH) – 6.020 R² ajusté = 0.797
Σ1n (Dbasal_brch O1) = (5.406 * DBH) – 12.853 R² ajusté = 0.968
Long brch O1 = (exp(5.701 + 0.031 Dbasal brch O1) ) /
(1+ exp(2.816 - 0.718 Dbasal brch O1))
Pour lequel Dbasal brch O1 est obtenu en divisant le deuxième modèle par le premier afin de considérer une branche d’ordre 1
moyenne
R² ajusté = 0.829
Un modèle allométrique unique permet une estimation du volume total des branches d’ordre 1 (First Order) :
VFO = 140.926*DBH1.990
3. Détermination d’un volume unique BPF « extrémités branches ordre 1, branches d’ordre 1+n, pétioles et feuillage »
Enfin, pour l’obtention de la biomasse restante, c'est-à-dire l’extrémité des branches d’ordre 1, les branches d’ordre 1+n, les pétioles et feuilles, un jeu de données indépendants a été utilisé et a permis de relier la biomasse BPF d’une branche d’ordre 1 donnée au diamètre basal de cette dernière (Figure 3). Le choix a été fait de ne pas déterminer le volume de ce compartiment du fait de sa moindre valorisation volumique – en effet, on émet l’hypothèse que le compartiment BPF sera plus aisément destiné à la production de BRF (Bois Fragmenté Raméal) et de fait ne nécessite qu’une estimation de la biomasse en frais qu’il représente.
Figure 3 : compartiments considérés pour l’obtention de la biomasse BPF

Un modèle allométrique unique permet une estimation de la biomasse BPF :
WBPF = 0.0125*Dbasal bch O13.3703 (r² ajusté = 0.951)
4. A partir des trois modèles globaux précédents, la biomasse aérienne totale (kg) peut être estimée à partir de la seule mesure du diamètre du tronc à hauteur de poitrine (DBH, cm). Elle est calculée comme suit :
MFtot = [[(VMS * d) + (VFO * d)] / 1000] + [FWBPF* Nbrch O1]
Les volumes obtenus sont en cm3 et nécessite alors d’appliquer une densité volumique de conversion des volumes en biomasse. Pour cela, la valeur retenue est de 1.17 (Dupraz, 2010 - communication personnelle) ou 0.65g.cm-3 pour obtenir, respectivement, une biomasse aérienne totale fraîche ou sèche.
A partir de ces différents modèles allométriques, les biomasses aériennes totales pour 12 individus agroforestiers indépendants de ceux ayant servi à bâtir les modèles allométriques et provenant de 4 sites différents en France ont été estimées puis opposées aux valeurs mesurées (cas des données CasDAR 2010 effectuées par Lasalle Beauvais, exprimées en sec) ou simulées (cas des données INRA Montpellier 2010, exprimées en frais). Le résultat est présenté en figure 4.
Figure 4 : Comparaison biomasse totale aérienne (en frais) observée (x) vs. prédite (y) – les lignes discontinues symbolisent le domaine de validité (y = x) à ±±±± 10%
Les résultats de la comparaison indiquent une légère surestimation moyenne des biomasses aériennes des arbres agroforestiers, d’approximativement 6%. La surestimation moyenne est négligeable (<1%) pour les individus détruits lors du projet CasDAR 2010 alors qu’elle est proche +12% lorsque comparée aux résultats simulés par l’INRA.
La gamme de DBH CasDAR (de 8 à 21cm) concerne essentiellement des arbres jeunes alors que la gamme INRA était comprise entre 18 et 25cm, pour des arbres âgés de 20-25 ans. Cela suggère que le modèle pourrait être correct pour l’estimation de la biomasse aérienne totale en phase précoce du cycle de vie de noyers hybrides agroforestiers. On peut cependant s’interroger quant à la validité d’estimations obtenues sur des individus (beaucoup) plus âgés.

On gardera néanmoins en tête que les arbres coupés l’ont été lorsque les propriétaires l’autorisaient ; nombre d’entre eux l’ont permis sur des arbres mal conformés, alors que les arbres coupés pour les modèles présentaient moins souvent ce problème du fait qu’ils provenaient de plateformes expérimentales réservées à cet usage. De fait le processus de validation du modèle mériterait l’abatage prochain, sur divers sites, d’individus correctement conformés appartenant à des parcelles plus ou moins âgées pour s’en assurer.
En outre, la variabilité des modalités d’entretien (élagage plus ou moins haut le long de la grume (Hauteur de couronne) et donc réduction plus ou moins importante du nombre de branches d’ordre 1- NBrch O1) peut conduire à des mesures de biomasse aérienne totale plus faible que celles estimées à partir du seul DBH, ce qui conduirait logiquement à une surestimation de la biomasse aérienne estimée par rapport à l’observée. Intégrer les modalités d’entretien par l’intégration de coefficient correcteur (sur le nombre de branches d’ordre 1 et/ou sur la biomasse aérienne totale) devrait être envisagé à moyen terme.
Perspectives : Le modèle « noyer » obtenu nécessitera sous peu (i) la comparaison à d’autres modèles allométriques spécifiques tel celui disponible à l’INRA, (ii) la consolidation de certains de ses sous-modèles tels celui de l’insertion de la première branche sur le tronc et celui de la biomasse restante (BPF), (iii) la mise à disposition d’un jeu de validation d’individus représentatifs de l’interaction sites*âges, enfin et surtout (iv) son transfert vers d’autres essences agroforestières d’intérêt (merisier, alisier, érables, fruitiers…).
Pour ce faire, il est nécessaire de constituer sous peu une fiche méthodologique de mesures et d’enregistrement aisément transposable à de nombreuses essences, comme aisément appréhendable et utilisable par les opérateurs. Elle devra permettre de revenir aisément à une détermination de la biomasse aérienne totale à partir de très peu de variables de départ (le DBH seul si possible voire la hauteur totale et/ou un coefficient correcteur de la pression d’élagage). Y parvenir nécessitera cependant de nombreuses mesures, standardisées, sur un grand nombre de sites et d’essences agroforestières plus ou moins âgées, appelant à la mobilisation du plus grand nombre. Ici, le panel de sites expérimentaux comme de production disponible pourrait à nouveau constituer une limite importante et dommageable.
_______________ Fin de la Synthèse du Livrable 4.2 _______________

_______________ Livrable 4.2 dans sa version complète _______________
INSTITUT POLYTECHNIQUE
LASALLE BEAUVAIS
19 Rue Pierre Waguet
BP 30313
60026 BEAUVAIS CEDEX
ECOLE SUPERIEURE
D'AGRICULTURE
55, rue Rabelais - B.P. 748
49007 ANGERS CEDEX 01
WAGENINGEN UNIVERSITY
Forest Ecology and
Management Group
Lumen, no.100
Droevendaalsesteeg 3
6708 PB WAGENINGEN
Wood production in walnut agroforestry systems in France
Maxime HAVAS and David GRANDGIRARD
[ 2010 ]
Keywords: agroforestery system, biomass estimation, allometry, modeling

This report is distinct from the one that will be presented as Master thesis piece for the obtaining of MSc at the
Forest Ecology and Management group at Wageningen University. Its content therefore does not engage the
supervisor's responsibility more than how agreed in the internship convention.
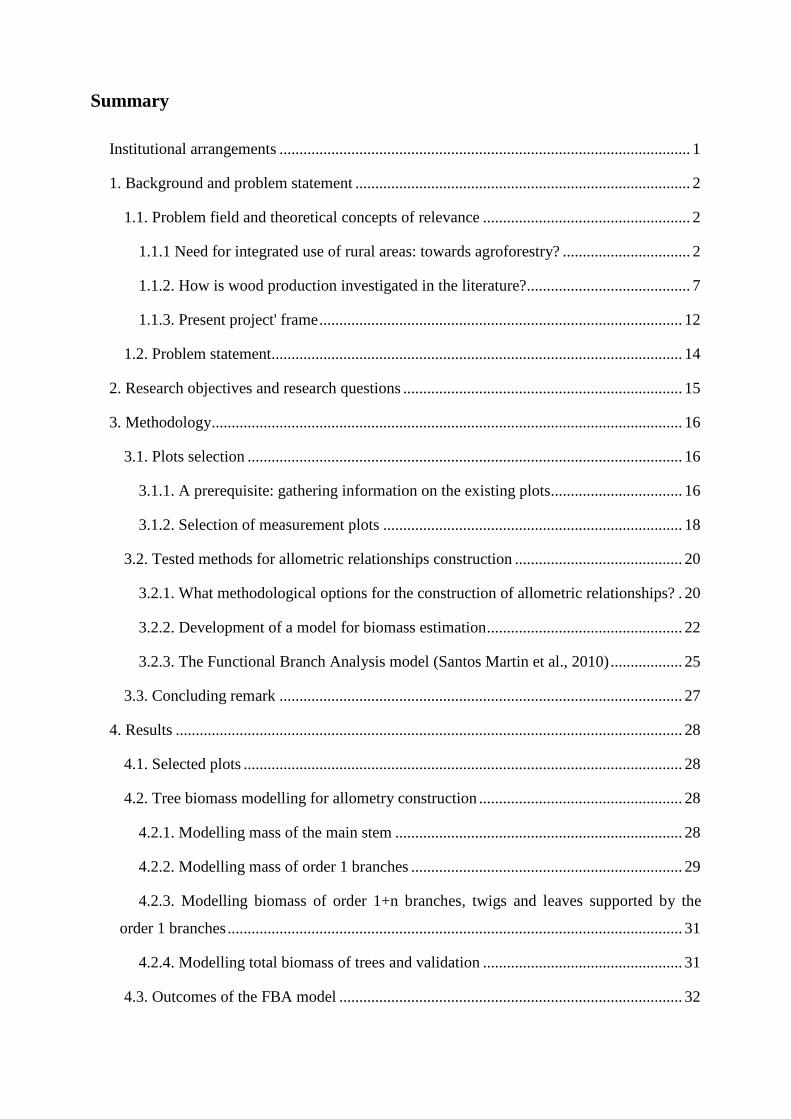
Summary
Institutional arrangements ....................................................................................................... 1
1. Background and problem statement .................................................................................... 2
1.1. Problem field and theoretical concepts of relevance .................................................... 2
1.1.1 Need for integrated use of rural areas: towards agroforestry? ................................ 2
1.1.2. How is wood production investigated in the literature? ......................................... 7
1.1.3. Present project' frame ........................................................................................... 12
1.2. Problem statement ....................................................................................................... 14
2. Research objectives and research questions ...................................................................... 15
3. Methodology ...................................................................................................................... 16
3.1. Plots selection ............................................................................................................. 16
3.1.1. A prerequisite: gathering information on the existing plots ................................. 16
3.1.2. Selection of measurement plots ........................................................................... 18
3.2. Tested methods for allometric relationships construction .......................................... 20
3.2.1. What methodological options for the construction of allometric relationships? . 20
3.2.2. Development of a model for biomass estimation ................................................. 22
3.2.3. The Functional Branch Analysis model (Santos Martin et al., 2010) .................. 25
3.3. Concluding remark ..................................................................................................... 27
4. Results ............................................................................................................................... 28
4.1. Selected plots .............................................................................................................. 28
4.2. Tree biomass modelling for allometry construction ................................................... 28
4.2.1. Modelling mass of the main stem ........................................................................ 28
4.2.2. Modelling mass of order 1 branches .................................................................... 29
4.2.3. Modelling biomass of order 1+n branches, twigs and leaves supported by the
order 1 branches .................................................................................................................. 31
4.2.4. Modelling total biomass of trees and validation .................................................. 31
4.3. Outcomes of the FBA model ...................................................................................... 32

5. Analysis ............................................................................................................................. 33
5.1. Advantages and limits of the models .......................................................................... 33
5.1.1. Advantages and limits for the model developed .................................................. 33
5.1.2. Advantages and limits of the FBA model ............................................................ 34
5.2. Comparison between the two models ......................................................................... 35
List of tables and figures ....................................................................................................... 36
Appendices ............................................................................................................................ 37

1
Institutional arrangements
The present report is a part of a master thesis carried out at the Forest Ecology and
Management (FEM) research group at Wageningen University. This thesis project was
embedded in a CasDAR research program, funded by the French ministry of agriculture
(entitled "To improve the agro-environmental efficiency of agroforestry systems on crop
farms"), and more specifically of the fourth action of the program, "Study of agroforestry's
second generation biofuel production potentialities." Within that action, the Institut Lasalle
Beauvais, represented by David Grandgirard, is responsible for the sub-action 4.2.
"Productivity estimation of already existing agroforestry systems." The MSc thesis project
originates from and was part of this sub-action.
The thesis project was co-supervised by the FEM group of Wageningen University and the
Département de Sciences Agronomiques et Animales (SAGA) of the Institut Lasalle
Beauvais, France. Supervisors of the two universities respectively were Professor Frits
Mohren and David Grandgirard. The terms of agreements between the student and FEM, as
well as between the two universities and co-supervisors, were stated in the Thesis Contract.
Additionally, an agreement (referred as convention de stage) was set up between the Institut
Lasalle Beauvais and the École Supérieure d'Agriculture d'Angers (E.S.A.) to fulfill legal
requirements for carrying out a student research project in France1. Prof. Mohren features on
this document as Wageningen University' supervisor.
1 The student, Maxime Havas, is registered at WUR as a double-degree master student, and therefore still partly belongs to its home university, the E.S.A. of Angers.

2
1. Background and problem statement
1.1. Problem field and theoretical concepts of relevance
1.1.1 Need for integrated use of rural areas: towards agroforestry?
General context
European societies nowadays expect a shift in the management paradigm of rural areas,
mainly constituted of agricultural and wood lands. These areas should now both keep on
producing food and wood, and at the same time preserve the environment and create positive
externalities. Additionally, this melioration in terms of quality and quantity of outputs should
be dependent on a reduced use of inputs. Putting strict food production matters aside, we can
draw some politico-institutional and socio-economic major trends that fuel and drive these
changes.
First, the Water Framework Directive established by the European Union, the projected
Soil Framework Directive and hypothetic Biodiversity directive call for a better management
of surface waters, soils and biodiversity within the E.U.
The water framework directive targets “good ecological and chemical status” for all
Community waters by 2015. As agricultural lands represent the main land use, important
efforts are expected to be made by European farmers to protect quality and quantity of surface
waters. This could be achieved by reducing chemical pollution sources (mainly reduced use of
fertilizers and pesticides), keeping these contaminants away from surface waters, and bio-
filtering of rain water, e.g. by maintaining buffer strips between crop fields and streams.
The soil framework directive will set up the legal framework for the protection of soils
within the E.U. Agricultural and forestry practices improving soil's water filtering and holding
capacity in the one hand, and soil's carbon stocking capacity in the other hand, will be
supported. Soil organic matter content and soil erosion are two other identified stakes.
A hypothetic but likely emergence of a European directive specifically orientated towards
biodiversity would encourage or make compulsory measures with acknowledged efficiency
for preserving biodiversity in agricultural and forest areas. The so-called Bird and Habitat
directives already aim at protecting patrimonial and specific "biodiversities".

3
Second, the Grenelle Environnement discussions in France guide new policies relative to
the environment and sustainable development. Among others, recommendations of the
Grenelle Environment participants are:
- the "creation of a green belt network (green corridors) and a blue belt network
(waterways and bodies of water, together with surrounding areas of vegetation)"
aiming at re-connecting elements of the landscape, such as wood patches ;
- the (re-)introduction of trees in agriculture lands ;
- the development of organic agriculture ;
- the promotion of renewable sources of energy.
In the latter, biomass is expected to furnish most of our future renewable energy (69.5 %).
This biomass would not only come from agriculture and forests products, but also from on-
farm produced woody biomass.
So, it is clear that the Grenelle Environnement consciously places rural areas at the center
of a sustainable development of the French society, by putting their mangers in charge of its
preservation and of green energy supply.
Third, the use of woody biomass for energy is a growing industry. Indeed, wood demand
by modern energy production units, mainly heating systems, has considerably increased for
the past 20 years. Moreover, public policies now actively support its development.
At first, its cheapness compared to other energy sources in certain regions was the reason
for a renewed interest. But today, in a climate change mitigation context, its main interest is
that it is an abundant renewable energy. Most of the wood in France is in forests, but a non
negligible and easily available alternative source occurs on farmlands, would it be on hedges
or woody patches owned by farmers.
In order to help to the development of an economically important industry, to reach the
objectives of the Kyoto protocol and to be phased with a society demand - environment and
ecology – the French State runs dedicated policies. The most recent is the Fond Chaleur,
created following the recommendations of the Grenelle Environnement.
So, more wood for energy production purposes is expected to be furnished by agriculture
in a near future.
Fourth, the global warming mitigation challenge, implying the reduction of GHG
emissions and storage of carbon, requires the emergence of rural areas acting as carbon sinks.
This is so because, apart from reducing the use of chemical fertilizers, agriculture can play a

4
role in climate change mitigation by improving its capacity to store carbon into soils and
woody elements. Thus, future agricultural systems will have to take this dimension into
account.
Today's context and society needs push agriculture and forestry towards an increased
productivity with less environmental impacts and reduced resources consumption. Modern
agroecology is a promising agricultural ensemble that could help solving the above-mentioned
challenges.
Agroecology practices
As defined by M.A. Altieri from UC Berkeley2, "agroecology is a scientific discipline that
uses ecological theory to study, design, manage and evaluate agricultural systems that are
productive but also resource conserving." ; and "is concerned with the maintenance of a
productive agriculture that sustains yields and optimizes the use of local resources while
minimizing the negative environmental and socio-economic impacts of modern technologies."
So far, so good, this definition perfectly fits the new objectives given to agriculture by the
society, as described in the previous section. But what does it encompasses and why is not
widely applied yet?
Following the definition, agroecology is an interdisciplinary science integrating agronomy,
mechanic, social and economy sciences. We only will focus on the agronomic aspect of it.
Agroecology tries to utilise the natural dynamics of an agroecosystem to produce food, the
optimum being when the system mimics the structure and function of local natural
ecosystems. To do so, various techniques can be adopted:
- maintaining vegetative cover as an effective soil and water conserving measure, met
through the use of no-till practices, mulch farming, and use of cover crops and other
appropriate methods;
- providing a regular supply of organic matter through the addition of organic matter
(manure, compost, and promotion of soil biotic activity);
- enhancing nutrient recycling mechanisms through the use of livestock systems based
on legumes, etc.;
2 Definitions and agroecology feature's descriptions of this section are from Altieri, 2000.

5
- promoting pest regulation through enhanced activity of biological control agents
achieved by introducing and/or conserving natural enemies and antagonists.
Agroecologists therefore recommend applying the following general measures:
- Crop rotations: temporal diversity incorporated into cropping systems, providing crop
nutrients and breaking the life cycles of several insect pests, diseases, and weed life
cycle;
- Polycultures: complex cropping systems in which two or more crop species are planted
within sufficient spatial proximity to result in competition or complementation, thus
enhancing yields;
- Agroforestry: an agricultural system where trees are grown together with annual crops
and/or animals, resulting in enhanced complementary relations between components
increasing multiple use of the agroecosystem;
- Cover crops: the use of pure or mixed stands of legumes or other annual plant species
under fruit trees for the purpose of improving soil fertility, enhancing biological control
of pests, and modifying the orchard microclimate;
- Animal integration in agroecosystems aids in achieving high biomass output and
optimal recycling.
All of these agronomic measures are well-known. They simply have been less used or put
aside by post-WWII western farmers. From this abandonment results a lack of research and
technical references on these agronomic systems. As a consequence, their somehow low
performances and technical complexity do not convince conventional farmers. But with the
previously described challenges agriculture should face, they experience a growing interest.
Among the above mentioned agroecosystems, agroforestry promises to be particularly
capable of solving the "producing more from less" problem: one agroforestry hectare so far
shows to be more productive for food and wood than one hectare of pure agriculture or one
hectare of pure forestry, while providing a large range of environmental and ecological
services.
What is agroforestry?
Agroforestry is one of our traditional agronomic systems under temperate climates. The
term encompasses land-uses such as the well-known apple-orchard/pasture in Normandie,
widely-spaced walnut plantations in the Dauphiné, or dehesas (oak wooded pastureland) in
6
the Iberian Peninsula. The World Agroforestry Centre (2010) gives a commonly accepted
definition:
"A land-use system in which woody perennials (trees, shrubs, palms, bamboos) are
deliberately used on the same land management unit as agricultural crops (woody or not),
animals or both, either in some form of spatial arrangement or temporal sequence. In
agroforestry systems there are both ecological and economic interactions between the
different components."
For the last 30 years, the term has evolved in temperate countries and now applies to the
so-called modern agroforestry systems, the best representative being alley-cropping (growing
annual crops in between tree rows). A definition for temperate systems more specifically has
been phrased as follows by the Silvoarable Agroforestry For Europe (SAFE) project:
“Agroforestry systems refer to an agriculture land use system in which high-stem trees are
grown in combination with agricultural commodities on the same plot. The tree component of
agroforestry systems can be isolated trees, tree-hedges, and low-density tree stands. An
agroforestry plot is defined by two characteristics:
- at least 50% of the area of the plot is in crop or pasture production
- tree density is less than 200/ha (of stems greater than 15 cm in diameter at 1.3 meter
height), including boundary trees.”
Research in temperate agroforestry: scarce but in progress
Agroforestry in temperate and Mediterranean climates is a promising agro-system. It
allows production of both wood and crops or fodder on the same area, thus potentially offers a
higher biological productivity per unit of area (Graves et al., 2004; Burgess et al., 2004;
Gruenewald et al, 2007). Additionally, it is expected to provide environmental benefits, such
as reduction of soil erosion and nitrate leaching, C sequestration or biodiversity improvement
in comparison with conventional agro-systems (Palma et al., 2007; Quienkenstein et al.,
2009).
However, basic scientific knowledge on silvoarable and sylvopastoralism agroforestry
systems' is scarce compared to forestry and agriculture (Stamp and Linit, 1999; Dupraz et al.,
2005). Even so, important advances have been made in Europe thanks to the SAFE project
7
(Dupraz et al., 2005), and temperate agroforestry research is steadily going on in the United
States and China (e.g. Wu and Zhu, 1997 or Jordan, 2004).
The science fields involved in agroforestry research can be diverse. They range from
biological, agronomic or technical, to economic and policy agroforestry-related themes. But
to address the general problematic we introduced – how to increase productivity of rural areas
while preserving the environment and resources – we should progress on understanding the
ecology, biology and agronomic design of agroforestry systems. Agroforestry indeed is to be
considered as a new model to be defined and overall evaluated in terms of potential benefits
in ecology, agronomy and climate change.
The first thing scientists, farmers or even politicians want to know is:
how much does it produces?
We will therefore try to answer some aspects of this question, taking into account what
knowledge already exists on that topic, and attempting to give insights on what should be
done to fill the gaps.
1.1.2. How is wood production investigated in the literature?
One of the most important aspects of agro- and forest-ecosystems research is on primary
production. Primary production is the basis for ecosystem's study and characterization. It is
also the main purpose of applied research on agriculture and forestry – yield –, and is the
main preoccupation of land owners and managers, farmers and foresters. In agroforestry,
productivity can be divided between crops/pasture productivity and trees productivity.
To investigate how productivity is or could be investigated in temperate agroforestry
systems, a short overview of existing methods is now given, with emphasis the tree
component.
Productivity estimation of forest ecosystems
In forestry, trees or stands primary production generally is investigated by means of stand-
specific allometric relationships (e.g. Telfer, 1969; Cannell, 1984; Campbell et al., 1985; Ter-
Mikaelian and Korzukhin, 1997; Grote, 2002), by empirical-based modelling for more applied
uses (Porté and Bartelink, 2002), or by mechanistic modelling when the focus is on
ecophysiological processes (Mohren and Burkhart, 1994), although since the late nineties
8
modelling combining the two approaches are increasingly used (Mohren and Burkhart, 1994;
Korzukhin et al., 1996; Mäkelä et al., 2000).
When sylviculture is the main purpose, standing biomass of a forest or of a stand is
estimated with volume/biomass equations coupled to field trees inventory – DBH
measurements –, or remote sensing methods (Zianis et al., 2005). For forestry tree species and
regions that have been studied by foresters for a long time, stand volume tables exist. These
volume tables can be considered as very specific allometric relationships.
Naturally, agroforestry research got inspired by and made use of the existing scientific
knowledge of forest sciences.
Productivity of the tree component in agroforestry
Productivity in agroforestry has been studied in tropical countries mainly (Rao et al., 1991;
Torquebiau, 1992; Kumar et al., 1998; Lott et al., 2000; Ong et al., 2000). But since the mid
1990's, trees growth under agroforestry conditions (Balandier and Dupraz, 1999), and later
trees productivity, started to be studied in western European conditions (Dupraz et al., 2005;
Burgess et al., 2004).
Most of investigations on productivity of tropical or sub-tropical agroforestry attempted to
build allometric relationships or to empirically investigate tree's growth (Nygren et al., 1993;
Kumar et al., 1998; Lott et al., 2000; Ong et al., 2000). This produced references for local
systems and, more interestingly, contributed to develop scientific knowledge on this field.
Furthermore, some researchers worked on the construction of mechanistic models that can be
used to simulate productivity (van Noordwijk and Purnomosidhi, 1995; van Noordwijk and
Lusiana, 1998; van Noordwijk and Mulia, 2002; Santos Martin et al., 2010). If reliable, these
models could be used for a broader range that the conditions under which it has been
calibrated. First attempts in that direction were conducted by Santos Martin et al. (2010).
In temperate climates, and especially in Europe, neither allometry nor volume tables have
been created for tree species grown in agroforestry systems. Reasons are multiple but follow
from agroforestry, in its modern perception, still being in its infancy. As a consequence,
agroforestry plots, on-farm as well as experimental, are young in most cases, i.e. less than 15
to 20 years. In addition, these plots are scarce. Mechanically, study sites for scientific studies
are lacking, and their scarcity restrains hypothesis testing possibilities. Other problems related
to scientific design in temperate agroforestry are discussed by Stamps and Linit (1999).

9
Nevertheless, some empirical data have been collected, on poplar especially, to calibrate
and validate models built during the SAFE project (Burgess et al., 2004; Graves et al., 2010).
During the SAFE project, "a model for growth, resource sharing and productivity in
agroforestry systems has been developed to act as a tool in forecasts of yield, economic
optimization of farming enterprises and exploration of policy options for land use in Europe."
(van der Werf et al., 2006). The model, called Yield-SAFE3, was developed with a limited
number of equations4 and parameters in order to allow model parameterization under
constrained availability of data from long-term agroforestry experiments. Data from empirical
measurements have been used to calibrate the model, but most of it has been estimated (see
Burgess et al., 2006). A more elaborated biophysical model, i.e. using more parameters and
potentially providing more reliable simulations, has also been developed under the direction
of INRA Montpellier. This model, named HiSAFE, additionally allows the simulation of the
rooting system of agroforestry systems.
To conclude, this generalist literature review on trees productivity in agroforestry shows
scarcity of references. Under temperate climates, very little data form empirical experiments
exist, which has been partially compensated by the production of biophysical models. Also, it
is of importance to stress that productivity of agroforestry system is evaluated in comparison
to pure agricultural and forestry productivities, due to its hybrid character, between
agriculture and forestry.
Productivity estimation of agroforestry ecosystems and its comparison to forestry and
agriculture
So, agroforestry is studied as an agro-ecosystem most of the time, and more specifically as
an intercropping system. Therefore, intercropped agriculture-adapted primary production
indicators' are applied to it when attempting measure its productivity (Rao et al., 1991). These
indicators aim at estimating the productivity of each of the system' components and assessing
the amplitude of competition processes taking place between them, while comparing them to
3 Yield-SAFE from “YIeld Estimator for Long term Design of Silvoarable AgroForestry in Europe”. 4 "The model consists of seven state equations expressing the temporal dynamics of: (1) tree biomass; (2) tree leaf area; (3) number of shoots per tree; (4) crop biomass; (5) crop leaf area index; (6) heat sum; and (7) soil water content. The main outputs of the model are the growth dynamics and final yields of trees and crops. Daily inputs are temperature, radiation and precipitation. Planting densities, initial biomasses of tree and crop species, and soil parameters must be specified." (van der Werf et al., 2006).
10
a monoculture control. Using this approach, Mead and Willey (1980) created the Land
Equivalent Ratio (LER), adapted from the Relative Yield Totals (RYT) concept, developed
earlier by de Wit to model crop competition in mixed cropping systems (de Wit, 1960; de Wit
and van der Berg, 1965).
LER is the sum of the relative yields of the mixed crops:
LER = Σ Yi/Ys
with Yi = yield per unit area of intercrop and Ys = yield per unit area of sole crop.
Following Dupraz and Newman (1997), a LER value of 1 indicates no yield advantage due
to intercropping, whereas a value of 1.2 would indicate a 20% yield advantage, meaning that
20% more land would have been required to obtain the same yields from monocultures.
In agroforestry, LER has first been used in tropical systems studies in the 1980's/early
1990's (Rao and Willey, 1983; Rao et al., 1991; Torquebiau, 1992), even if some application
in temperate climate were done in the same period (Newman, 1986). Ranganathan and de Wit
(1996) gave analytic insights in transposing the RYT concept from annual intercropping to
annual-perennial intercropping – which is agroforestry. Since the late 1990's LER became
more widely used in temperate climates (Dupraz, 1994; Dupraz and Newman, 1997; Huang et
al., 1997; Burgess et al., 2004), although the actual number of experiments remains low.
Recent results from these researches shown that these systems can be more productive and
reach higher total yields than sole cropping or forestry systems on the same area (Burgess et
al., 2004; Dupraz et al., 2005).
However, these results have been obtained by modelling, because, as previously pointed
out, field data is lacking. Therefore, data acquisition is necessary to (1) calibrate mechanistic
models ; (2) estimate biomass production by means of yields tables, via allometric
relationships ; (3) improve the general understanding of these systems ; and (4) acquire
arguments for the development of agroforestry as an agricultural practice with expected
improved returns in terms of productivity, land protection and restoration, C storage and
ordinary biodiversity protection.

11
Reminder: In agroforestry, system's productivity can be divided between crops/pastures' productivity and trees' productivity. As we are interested in agroforestry as a potential wood producing system, we will not go into studying the crop component productivity in this report5.
As noted before, a frequently used methodology for trees biomass estimation' besides
modelling is the use of allometric relationships. Therefore, the alternative left for estimating
productivity is building allometric relationships from field measurements.
Before reviewing the rather limited existing literature allometry in agroforestry, a short
overview of allometry in forest ecosystems' science is given.
Allometry in forestry
How to estimate standing tree biomass and its evolution in time with allometry? This has
always been a major concern for foresters and forest scientists.
These allometric relationships relate a morphological feature of the tree, generally diameter
at breast height (DBH), to tree biomass thanks to an equation. Most of the existing equations
to estimate tree biomass are based on DBH or on a combination of DBH and H (Ter-
Mikaelian and Korzukhin, 1999; Ketterings et al., 2001). Most of them are of the form:
M = aDb
where M is the total aboveground tree dry biomass for a specific diameter at breast height,
D; and a and b the allometric coefficients to be determined by empirical data or from
ecophysiological theories (Zianis and Mencuccini, 2004).
Equations including total height and/or specific wood density as predictive variables are
also found, but their beneficial effect on prediction accuracy is debated (see Ter-Mikaelian
and Korzukhin, 1999), especially for wood density (Pili et al., 2006). This weak variance
explanation is hypothesized to be due to the close relationship between D and H for a given
site (Niklas, 1994; West et al., 1999; Zianis and Mencuccini, 2004). However, the inclusion of
total height in the equation significantly improved the DBH-only equation in a number of
studies (Wang, 2006; Ketterings et al., 2001). Tree height is rarely utilized in practice by
forest managers because it is a rather difficult and time consuming measure. Contrarily, is
5 Publications reporting investigations on crops productivity in temperate agroforestry can be found online on the SAFE project website: http://www.ensam.inra.fr/safe/english/index.htm (last access May 2010).

12
easy to measure in agroforestry systems and therefore is likely to be incorporated in
corresponding allometric equations.
Also, most of allometric equations are species-specific and/or site-specific. Other equations
were developed for multispecies stands, mostly in the tropics (Chave, 2004). In any case, it is
assumed that best models are locally stand-specific developed, as they by nature take into
account soil, climate and species characteristics species like specific wood density, tree
architecture, shade tolerance and maximum height (Kohyama et al., 2003; Dietze et al., 2008,
in Ransijn, 2009).
Transposition of the allometric approaches to agroforestry systems are expected to follow
the same trends.
Allometry in agroforestry
While much of allometric equations and corresponding amelioration attempts exist for
forest eco-systems (see reviews of Telfer, 1969; Ter-Mikaelian and Korzukhin, 1997; Zianis
et al., 2005), much less has been done for agroforestry systems. Moreover, most of it applies
to tropical agroforestry (Nygren et al., 1993; Kumar et al., 1998; Lott et al., 2000; Santos
Martin et al., 2010). Literature does not mentions allometric relationships created or tested for
temperate agroforestry systems.
It therefore is of interest to make an attempt to set up allometric equations for temperate
agroforestry systems.
Three main pathways would be available for the development of allometric equations:
� Doing regression analysis on felled sample trees (through destructive sampling);
� Exploiting the Functional Branch Analysis model (van Noordwijk and Mulia, 2002);
� Adapting equations from the forestry literature.
In this study, different allometric equation models using DBH, in combination with height
or not, will be tested in order to find the best predictive model. Even thought not commonly
used in forestry, height can significantly improve biomass predictions. As it is a rather easy
parameter to measure in agroforestry systems, its potential should be investigated.
1.1.3. Present project' frame
The original project proposed by Lasalle Beauvais consisted in creating a non-destructive
monitoring methodology for woody biomass estimation in agroforestry systems. The interest
13
of such a method would be being capable to estimate the aboveground biomass productivity
of an agroforestry system on the field without conducting destructive measurements on the
trees, which generally are of high commercial value. Moreover, as agroforestry experimental
fields are rare and to be monitored in a long run, destructive biomass assessments for research
purposes should be avoided.
Another reason for setting up such a field method was that tools meant for estimating this
biomass productivity are until now models, in particular those created during the SAFE
project. With those, tree's timber biomass productivity is simulated. An estimation method
based on allometric equations could under certain conditions give better estimates than by
modelling, and provide calibration data to improve model's predictions. These equations
would be based on a representative empirical dataset, tested against theoretical data processed
by equations reproducing physiological processes for the mechanistic models.
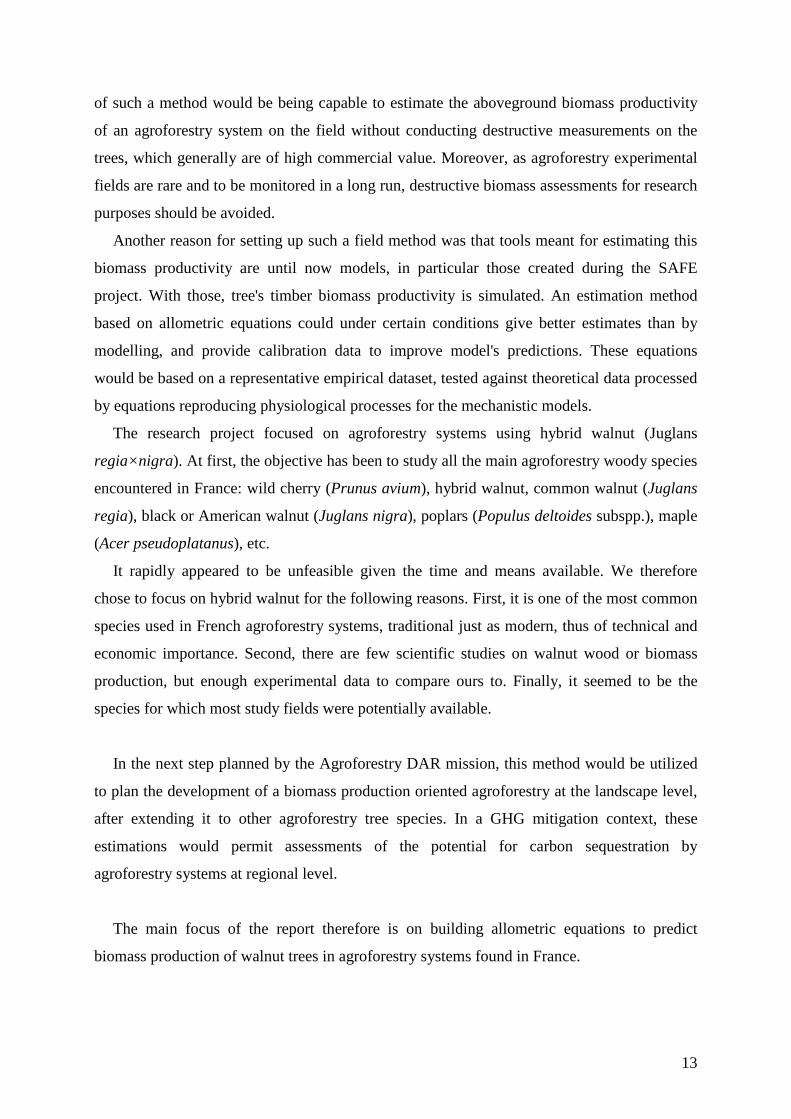
The research project focused on agroforestry systems using hybrid walnut (Juglans
regia×nigra). At first, the objective has been to study all the main agroforestry woody species
encountered in France: wild cherry (Prunus avium), hybrid walnut, common walnut (Juglans
regia), black or American walnut (Juglans nigra), poplars (Populus deltoides subspp.), maple
(Acer pseudoplatanus), etc.
It rapidly appeared to be unfeasible given the time and means available. We therefore
chose to focus on hybrid walnut for the following reasons. First, it is one of the most common
species used in French agroforestry systems, traditional just as modern, thus of technical and
economic importance. Second, there are few scientific studies on walnut wood or biomass
production, but enough experimental data to compare ours to. Finally, it seemed to be the
species for which most study fields were potentially available.
In the next step planned by the Agroforestry DAR mission, this method would be utilized
to plan the development of a biomass production oriented agroforestry at the landscape level,
after extending it to other agroforestry tree species. In a GHG mitigation context, these
estimations would permit assessments of the potential for carbon sequestration by
agroforestry systems at regional level.
The main focus of the report therefore is on building allometric equations to predict
biomass production of walnut trees in agroforestry systems found in France.

14
1.2. Problem statement
The problem statement of this research project is the following:
We aim at solving lack of references for empirically-based calculations of tree biomass
productivity in French agroforestry systems, and of a biomass-production monitoring method.

15
2. Research objectives and research questions
Objectives
The main objective of this project is:
To create empirically-based allometries for wood biomass estimation in French
agroforestry systems using walnut.
Sub-objectives are:
• to elaborate a methodology for setting-up species specific allometric
relationships for woody aboveground biomass' prediction.
• to set up species-specific allometric relationships for woody aboveground
biomass' prediction.
Research questions
RQ1: What exiting methodologies could be used?
RQ2: What is the best morphologic tree feature to predict aboveground biomass of the
tree component in studied systems?
RQ3: What is the best allometric model to predict ABG biomass?
RQ4: What methodology is best adapted to establish allometric relationships in
temperate agroforestry systems?

16
3. Methodology
The objective of the methodology is to plan and organize data collection and analysis so
that the research questions can be answered. It combines practical organization given realities
of the project in the one hand, and use of methods from the literature for data collection in the
other hand.
First step has been to get to know the network of agroforestry plots existing in France,
being part of the CasDAR Agroforestry 2009/2011 or not. Indeed, there is no structured
database gathering information on sites location and characteristics. Second, selection of sites
of interest for this project has been undertaken. Criteria were not only on systems
characteristics (age of trees, rainfall, soil, etc.), but also on measurement opportunities and
conditions (possibility to cut trees or branches, help from the owner, etc.).
Then, a protocol for data collection has been established. It could vary depending on what
measurements were possible. Basically, these can be separated between destructive and non-
destructive measurements.
The approach and methods utilised are depicted in this section.
3.1. Plots selection
3.1.1. A prerequisite: gathering information on the existing plots
What we knew at the beginning of the project was that we wanted to make on-field
measurements on trees of agroforestry systems occurring in France in order to be able to
estimate the woody biomass of these trees. These trees occur in agroforestry fields but not all
of the fields have the same design, age, management regime, soil or climate. So, even before
deciding what species from what type of agroforestry with which characteristics, getting to
know what were the possibilities has been a condition before the formulation of potentially
investigable research questions.
To do so, as many agroforestry French stakeholders addresses' as possible have been
collected. The 2009/2011 CasDAR project network was used as a basis, but contacts given by
two key persons in the small world of French agroforestry very much completed it. Contacts
were from very diverse structures (Chambres départementales et régionales d'agriculture,
research institutes, forest institutes, companies, associations, farmers). Near 40 persons were
listed.

Concomitantly, an electronic questionnaire has been elaborated with the software Sphinx.
This questionnaire has been organized in two sections.
The objective of the first section
ownership, location landscap
arrangement, under-canopy vegetation,
the main information categories to fill.
Figure 1: How plots access and data collection was initially planned
The second part of the questionnaire aimed at determining w
done on the site, and to what extent the contact could help doing the measurements (figure
Indeed, active participation of the CasDAR project partners was expected at first.
A letter accompanied the questionnaire in order
why they were contacted (see
The questionnaire has been inspired from similar works previously made during the SAFE
and "Agroforesterie" CasDAR 2006/2008 projects to help determining what information i
should contain. Also, it has been sent for validation to members of the current DAR mission.
, an electronic questionnaire has been elaborated with the software Sphinx.
This questionnaire has been organized in two sections.
The objective of the first section was to characterize each inventoried site. Location,
ownership, location landscape's, geology, soil, climate, trees species, densities and spac
canopy vegetation, management practices, presence of control plots were
the main information categories to fill.
How plots access and data collection was initially planned
The second part of the questionnaire aimed at determining what type of measures could be
done on the site, and to what extent the contact could help doing the measurements (figure
Indeed, active participation of the CasDAR project partners was expected at first.
A letter accompanied the questionnaire in order to present and explain to the recipients
why they were contacted (see appendix 1).
The questionnaire has been inspired from similar works previously made during the SAFE
and "Agroforesterie" CasDAR 2006/2008 projects to help determining what information i
should contain. Also, it has been sent for validation to members of the current DAR mission.
17
, an electronic questionnaire has been elaborated with the software Sphinx.
was to characterize each inventoried site. Location,
, geology, soil, climate, trees species, densities and space
presence of control plots were
How plots access and data collection was initially planned
hat type of measures could be
done on the site, and to what extent the contact could help doing the measurements (figure 1).
Indeed, active participation of the CasDAR project partners was expected at first.
to present and explain to the recipients
The questionnaire has been inspired from similar works previously made during the SAFE
and "Agroforesterie" CasDAR 2006/2008 projects to help determining what information it
should contain. Also, it has been sent for validation to members of the current DAR mission.

18
Indeed, additional to use for this research, the questionnaire aimed at laying the foundations
of a structured database for agroforestry plots in France.
Once a maximum of answers were received, data has been summarized. This, plus some
information collected by phone or by data transfer from key stakeholders, has been the basis
for the selection of measurement plots.
3.1.2. Selection of measurement plots
Plots were selected so as to collect relevant and representative data for research objectives
and research questions. Several criteria drove this selection:
- Opportunity for biomass data collection: As the sensed bottleneck for data acquisition
was lack of biomass measurements, i.e. data obtained from destructive measurements,
the main criterion for plot selection has been the possibility to carry out destructive
measurements. This information was obtained thanks to answers to the second section
of the questionnaire, and then verified by calling the owner.
- Species: At the beginning, our objective has been to establish allometric equations for
as many tree species as possible. As it quickly appeared unfeasible given material
constraints and chosen methodologies, we chose to focus on walnut. Mechanically, the
number of potential measurement plots got much smaller.
- Age: As we wanted to construct allometric equations linking one or a combination of
morphological features of the trees, or their age, to their biomass, sampling had to go
along an 'age' gradient. Thus, age has been an important criterion for plot selection.
- Silvoarable/silvopastoral: Broadly, two types of agroforestry systems exist in France,
silvoarable and silvopastoral (figure 2). Including silvopastoral systems in our research
was not planned at first, in order to reduce sources of variation. But many of the
systems identified as old were silvopastoral ones, whereas silvoarable sites were rare.
Covering a larger age variation has been preferred over softening variation due to
differences between under-canopy cover of the systems (basically crops vs. grass).
- Density: Density is a very important factor that dramatically influences the growth of
the trees. Unfortunately, very little agroforestry plots were planted at the exact same
density. We therefore chose sites with densities lower than 140 trees/ha, i.e
corresponding to densities of modern agroforestry.

19
- Soil/climate: Originally, studying productivity depending on edaphic variables (soil
fertility, rainfall, and global radiation) was planned. But as it appeared quite
unrealizable to have enough samples to properly investigate on edaphic variables, we
tried to choose sites from a limited number of natural regions. Also, we tried to find
several measurements sites per region.
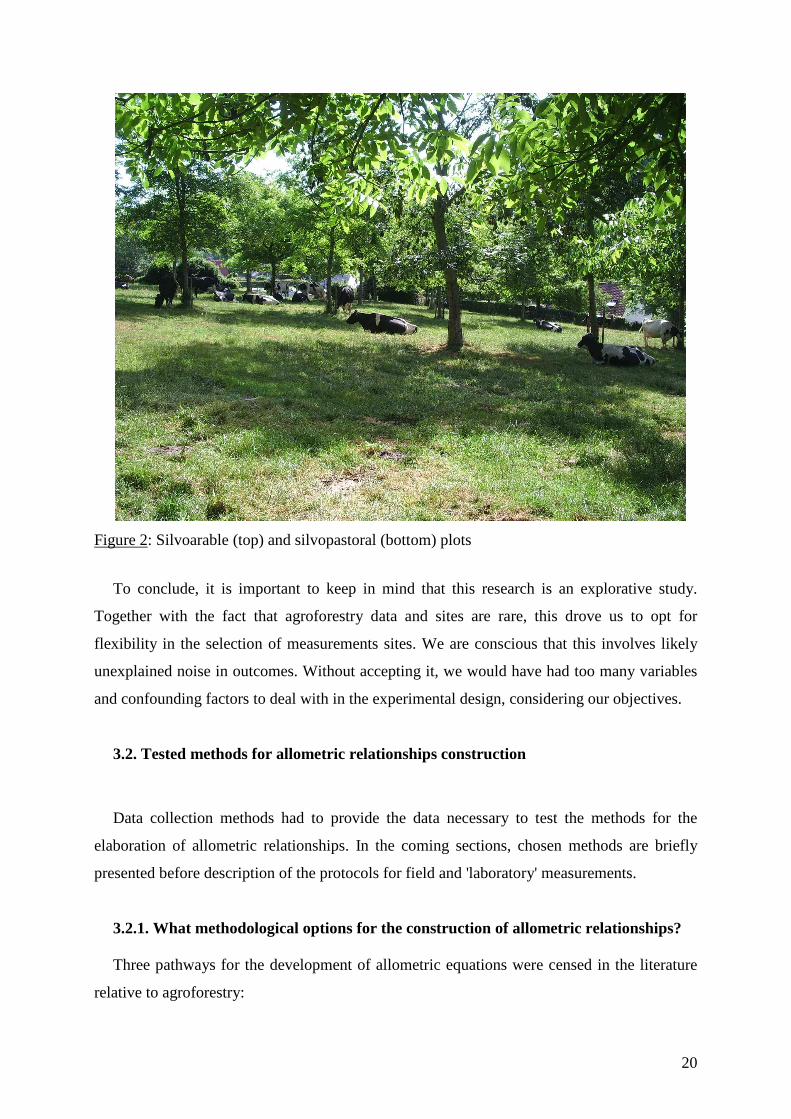
20
Figure 2: Silvoarable (top) and silvopastoral (bottom) plots
To conclude, it is important to keep in mind that this research is an explorative study.
Together with the fact that agroforestry data and sites are rare, this drove us to opt for
flexibility in the selection of measurements sites. We are conscious that this involves likely
unexplained noise in outcomes. Without accepting it, we would have had too many variables
and confounding factors to deal with in the experimental design, considering our objectives.
3.2. Tested methods for allometric relationships construction
Data collection methods had to provide the data necessary to test the methods for the
elaboration of allometric relationships. In the coming sections, chosen methods are briefly
presented before description of the protocols for field and 'laboratory' measurements.
3.2.1. What methodological options for the construction of allometric relationships?
Three pathways for the development of allometric equations were censed in the literature
relative to agroforestry:

� Regress biomass data against some tree morphological features or age. This involves
destructive sampling. It is by far the method
reliable when the sample number is large.
� Make use of the Functional
method. It implies extensive measurements on the whole tree. Not only can the model
predict the total tree biomass, but also the
� Adaptation of existing forestry allometric
can develop allometric equation for a certain species.
We chose to both use the conventional method and the FBA model. However, as a small
number of owners have accepted to cut down their trees, the conventional method had t
adapted. Shortly, this adaptation is that we did measurements of a number of
features' on a number of trees, and then tried to model a mean tree volume before
into biomass. Allometric relationships were calculated from these biom
Concerning field measurements, we had three situations (see figure
was possible to cut down whole trees and do non
only some branches could be cut and non
situation, the owner only allowed non
Figure 3: Outline of the general approach of methods for field and lab measurements
data against some tree morphological features or age. This involves
It is by far the method used most, because results are very
sample number is large.
Functional Branch Analysis (FBA) model. This is
method. It implies extensive measurements on the whole tree. Not only can the model
predict the total tree biomass, but also the weight of the branches and the total leaf area.
forestry allometric equations. Using data from the literature, one
can develop allometric equation for a certain species.
We chose to both use the conventional method and the FBA model. However, as a small
number of owners have accepted to cut down their trees, the conventional method had t
this adaptation is that we did measurements of a number of
on a number of trees, and then tried to model a mean tree volume before
into biomass. Allometric relationships were calculated from these biomass estimations.
Concerning field measurements, we had three situations (see figure 3). In the first one, it
was possible to cut down whole trees and do non-destructive measurements. In the second,
some branches could be cut and non-destructive measurements carried out. In the third
situation, the owner only allowed non-destructive measurements.
: Outline of the general approach of methods for field and lab measurements
21
data against some tree morphological features or age. This involves
used most, because results are very
model. This is a non-destructive
method. It implies extensive measurements on the whole tree. Not only can the model
and the total leaf area.
data from the literature, one
We chose to both use the conventional method and the FBA model. However, as a small
number of owners have accepted to cut down their trees, the conventional method had to be
this adaptation is that we did measurements of a number of structural
on a number of trees, and then tried to model a mean tree volume before turning it
ass estimations.
). In the first one, it
destructive measurements. In the second,
rements carried out. In the third
: Outline of the general approach of methods for field and lab measurements

22
The methodology for development of the allometric relationships and the protocols for
field measurements are now presented.
3.2.2. Development of a model for biomass estimation
At the beginning of the project, it was planned to construct allometric equations using
'traditional' methods, i.e. cutting and weighting a representative sample of trees and regress it
against DBH, total height or a combination of the two, the equation of the regression being
the allometric equation. But it has been far from possible to carry it out on a sufficient number
of trees. Therefore, we had to develop an alternative.
It has been chosen to try to model simplified volume of the trees. Then, this volume
approximation, once tuned into biomass by multiplying it by the wood density, would be
compared to the biomass of the trees actually cut.
How would the volume of the trees be estimated?
Structural elements of the tree should be separated into main stem (the trunk), main
branches directly linked to it (let's name them 'order 1 branches), all branches linked to these
main branches (order 2, 3, etc.), twigs (branches with basal diameter <2cm) and leaves.
Main structural elements being considered separately, we should try to model their volume
or their mass as a function of a characteristic of a higher level element. For instance, the
volume of main branches, of order 1, can be considered as the function of the trunk volume,
or DBH, or of 'total height/DBH' ratio, etc. Or, second example, the weight of leaves of an
order 1 branch can be linked to the length of this branch. Knowing the number of order 1
branches on a tree, we could predict the weight of all leaves on the tree. We proceeded
following this logic.
General measurements
In every plot, an inventory has been done, i.e. DBH of all the trees was measured. Also, the
number of the tree and the line it belonged to has been recorded.
This basic inventory was completed with some other standard measurements: tree diameter
at ground level, total tree height and bole height (see appendix 2 for the form used on the
field). These measurements were taken on a representative sample, as taking it on all the trees
would have been too time-consuming.

23
Data obtained from the inventory have been used to select trees on which more detailed
measurements were undertaken.
Main stem biomass
From measured bole diameters (at the base of the trunk, at breast height and below the first
living branch) and corresponding heights, partial volumes of the bole have been calculated
(those sections being assimilated to truncated cones). Also, the volume of main stem
comprised between bole height and top of the tree has been estimated (knowing bole and total
heights and diameter at bole height). Bole volume and volume of main stem into the crown
were summed up to obtain total main stem volume. Main stem mass has finally been
estimated by multiplying this volume by wood density.
On each measurement plot, 5 to 10 trees with mean DBH and total height were chosen. On
these trees, tree diameter at ground level, DBH, total tree height and bole height (part of the
main stem starting from the ground level to the first living branch) have been recorded to
provide necessary data for volume calculations.
Biomass of the crown
Estimation of crown biomass has been carried out in two methodological steps. First, the
volume of branches of order 1 has been estimated. Second, biomass of subsequent branches,
twigs and leaves has been approached by establishing 'conventional' allometric equations.
These relations linked features of order 1 branches, like basal diameter and length, to the
biomass of subsequent branches, twigs and leaves.
To estimate the volume of order 1 branches on a tree, the number of order 1 branches has
been counted, and their basal diameter and length have been measured. These measures have
been done on 2 trees per measurement plot.
Then, we when possible cut sample branches. This has only been possible when the
owner/manager of the plot agreed, i.e. planned to prune its trees that year. On these branches,
the basal diameter and length have been measured (see appendix 3 for the form used for on-
field data collection). Then, the number of branches attached to the axis of the order 1
branches (thus, 'order 2 branches') has been recorded. The basal diameter and the length of
three of these order 2 branches were recorded, after random selection. If existing, branches of
order 3 were also measured. Branches of any order with a basal diameter inferior to 2
centimetres were considered as a twig.

24
All the branches, being of order 1, 2 or 3, have been weighted. To obtain a fresh-to-dry
ratio, wood slices have been cut and dried in the oven (105°C for 48h). Once dry, these were
weighted and a fresh-to-dry ratio was established. The volume of these slices has been
calculated in order to calculate their density. Additionally, all twigs and leaves supported by
the branch of order 1 were weighted.
Total aboveground biomass calculation through modelling
The main stem and crown weights have been summed to estimate the total aboveground
biomass of the tree. The biomass estimates obtained with volume estimations were compared
to the biomass of the trees we were able to cut down. We tested reliability of models
depending on the independent variable chosen.
Validation data: field protocol for biomass measurement of entire trees
Before cutting the tree, total height and height of the bole (part of the main stem starting
from the ground level to the first living branch) have been measured. Also, diameters at
ground level, breast height (1,3 m), and 20 cm before first leaving branch were recorded.
In order to weight the mass of the different tree compartments', main stem (stem starting
from ground level to the top of the tree; if it forked below 1,3 m, the two corresponding
shoots are both considered as main stem, if it forks above 1,3 m, shoots subsequent to the fork
are considered as branches), branches wood, twigs with leaves were separated.
Main stem: At regular intervals along the stem, wood slices were cut. Their fresh weight
has been recorded on-field, and then put into double-sealed plastic bags for weighting after
being oven-dried (48h at 105°C) at the lab.
From these sub-samples, fresh-to-dry matter ratios for each section were calculated. From
these ratios, the dry weights of bole and following stem have been estimated. These
estimations were then added up to obtain an estimate of the entire main stem. Note that no
difference was made between wood and bark for practical reasons.
Finally, the mathematic model explaining best the relationship between total main stem
biomass and DBH was established.
Branches: All the branches were weighted in the field. Wood slices were cut and dried the
same way as described for main stem. Fresh weight and fresh-to-dry matter ratio of all the
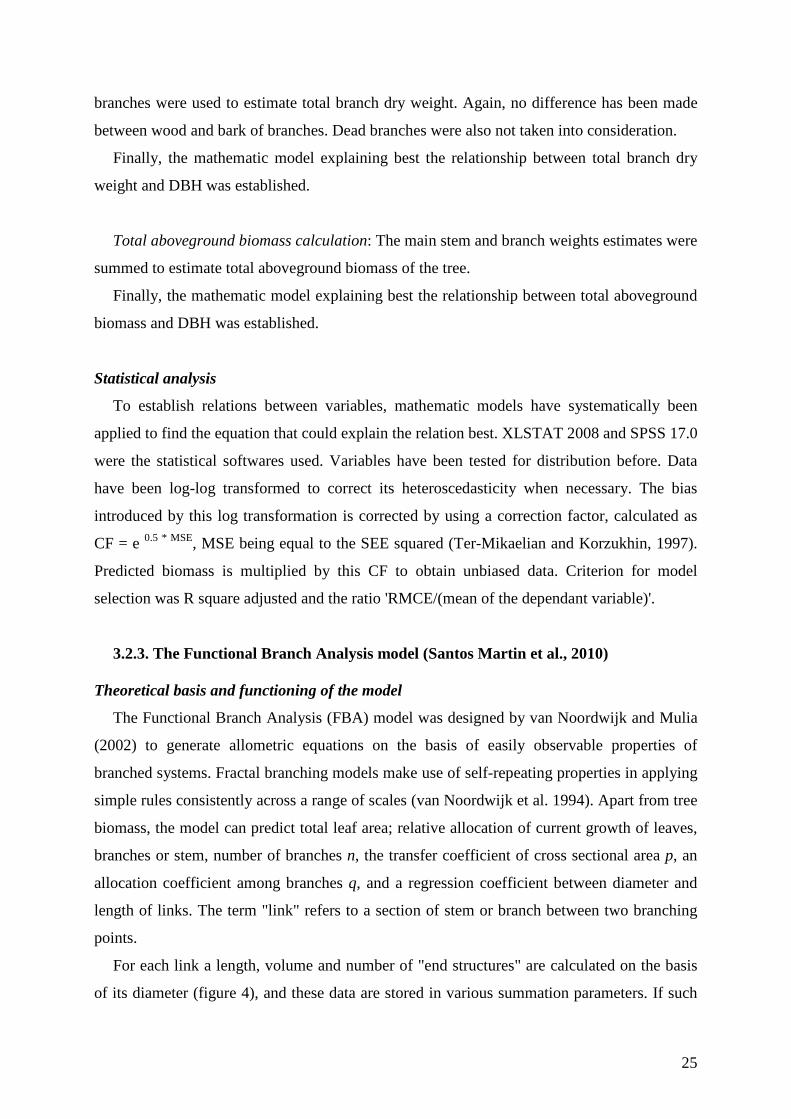
25
branches were used to estimate total branch dry weight. Again, no difference has been made
between wood and bark of branches. Dead branches were also not taken into consideration.
Finally, the mathematic model explaining best the relationship between total branch dry
weight and DBH was established.
Total aboveground biomass calculation: The main stem and branch weights estimates were
summed to estimate total aboveground biomass of the tree.
Finally, the mathematic model explaining best the relationship between total aboveground
biomass and DBH was established.
Statistical analysis
To establish relations between variables, mathematic models have systematically been
applied to find the equation that could explain the relation best. XLSTAT 2008 and SPSS 17.0
were the statistical softwares used. Variables have been tested for distribution before. Data
have been log-log transformed to correct its heteroscedasticity when necessary. The bias
introduced by this log transformation is corrected by using a correction factor, calculated as
CF = e 0.5 * MSE, MSE being equal to the SEE squared (Ter-Mikaelian and Korzukhin, 1997).
Predicted biomass is multiplied by this CF to obtain unbiased data. Criterion for model
selection was R square adjusted and the ratio 'RMCE/(mean of the dependant variable)'.
3.2.3. The Functional Branch Analysis model (Santos Martin et al., 2010)
Theoretical basis and functioning of the model
The Functional Branch Analysis (FBA) model was designed by van Noordwijk and Mulia
(2002) to generate allometric equations on the basis of easily observable properties of
branched systems. Fractal branching models make use of self-repeating properties in applying
simple rules consistently across a range of scales (van Noordwijk et al. 1994). Apart from tree
biomass, the model can predict total leaf area; relative allocation of current growth of leaves,
branches or stem, number of branches n, the transfer coefficient of cross sectional area p, an
allocation coefficient among branches q, and a regression coefficient between diameter and
length of links. The term "link" refers to a section of stem or branch between two branching
points.
For each link a length, volume and number of "end structures" are calculated on the basis
of its diameter (figure 4), and these data are stored in various summation parameters. If such

26
an algorithm for constructing branching patterns is applied many times to trees of different
initial diameters, Do, a range of properties of the tree as a whole can be related to Do, for
example by fitting a power-type allometric equation to the data (Mulia et al. 2001).
Figure 4: Schematic of stem length and diameter measurement process used for data
collection in WanFBA model (from Santos Martin et al., 2010)
The WanFBA protocol needs four kind of information to estimate tree biomass as listed in
the input sheet (see appendix 4):
- information on tree size;
- information on branching pattern;
- information on woody parts;
- and information on the final structures (leaves and others) of the tree.
Practically speaking, the whole measurements had to be carried out on cut trees. Indeed, it
would have been too time-consuming to do it on standing trees.
Once cut, all diameters at mid-length and length of links with basal diameter equal or
superior to 2 cm have been recorded (see appendix 5 for field form). Additionally, about 25%
of basal diameters of the links were measured in order to build a relationship between this and
the diameter at mid-length. That permitted to use the data collected to fuel the FBA model as
input data for the elaboration of our model for biomass estimation

27
These data have been used to fuel the FBA model (Excel sheet available at
http://www.worldagroforestrycentre.org/sea/fba_download, last access June 2010). Once all
the required parameters were ready, the model was run. The equations obtained, of the form
(Biomass)=a*(DBH)b, were compared to what we obtained with the model we elaborated.
3.3. Concluding remark
As stressed by Stamps and Linit (1999), "the problems of experimental design in temperate
agroforestry are many." In the context of an unorganized network of 'experimental plots' and
of an exploratory study, this master thesis project is highly lacking of experimental structure
and subject to poor design. This is taken into consideration by setting up broad objectives and
research questions. Results will also be discussed with pragmatism.

28
4. Results
4.1. Selected plots
Given our criteria for the selection of measurement plots, authorizations to cut branches or
trees, and time availability, 8 sites have been chosen (table 1). Most of sites censed during the
survey phase were 2 to 7 years old. As our interest is on the potential for biomass production
in agroforestry systems, thus from mature trees, we favoured older sites. It has not been
possible to only focus on silvoarable systems. Consequently, both silvoarable and
silvopastoral sites had to be chosen.
4.2. Tree biomass modelling for allometry construction
Details of the elaboration of the relationships are not presented. We tested reliability of
models depending on the choice of independent variable(s). However, here only are presented
equations with the best explaining independent variable: DBH. As a consequence, all
variables, being morphological characteristics or estimated volumes, are linked to DBH. Field
application of the final allometric relationship will thus allow biomass estimations with a
simple DBH measurement.
4.2.1. Modelling mass of the main stem
The equation linking main stem biomass to DBH required 4 variables: basal diameter of
the stem (Dbasal), diameter of the stem below the first living branch (Dhg), bole height (Hg) and
total height of the tree (Htot).
All of these variables were linked to DBH. Then, volumes of the main stem comprised
between (1) ground and 1.3 m (V0->BH), (2) breast height and Hg (VBH->Hg) and (3) Hg and Htot
(VHg->Htot) were calculated. V0->BH and VBH->Hg have been considered as truncated cones, while
VBH->Hg have been assimilated to a cone. Volumes were added up to obtain the total volume of
the main stem (Vms).
The equations obtained and used for the construction of volume's equations are6:
Dbasal = 0.218223+1.40064*DBH R square adjusted = 0.918 RMCE/mean = 8.2%
6 All variable's units are centimeters.
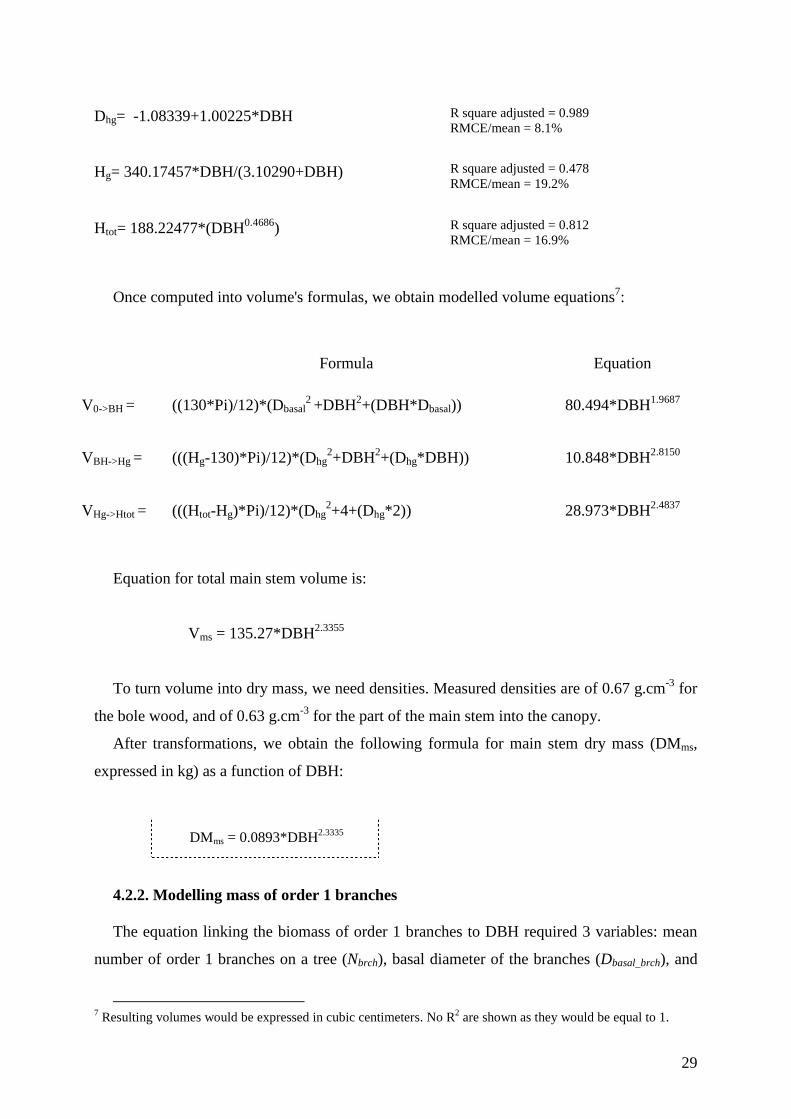
29
Dhg= -1.08339+1.00225*DBH R square adjusted = 0.989 RMCE/mean = 8.1%
Hg= 340.17457*DBH/(3.10290+DBH) R square adjusted = 0.478 RMCE/mean = 19.2%
Htot= 188.22477*(DBH0.4686) R square adjusted = 0.812 RMCE/mean = 16.9%
Once computed into volume's formulas, we obtain modelled volume equations7:
Formula Equation
V0->BH = ((130*Pi)/12)*(Dbasal2 +DBH2+(DBH*Dbasal)) 80.494*DBH1.9687
VBH->Hg = (((Hg-130)*Pi)/12)*(Dhg2+DBH2+(Dhg*DBH)) 10.848*DBH2.8150
VHg->Htot = (((Htot-Hg)*Pi)/12)*(Dhg2+4+(Dhg*2)) 28.973*DBH2.4837
Equation for total main stem volume is:
Vms = 135.27*DBH2.3355
To turn volume into dry mass, we need densities. Measured densities are of 0.67 g.cm-3 for
the bole wood, and of 0.63 g.cm-3 for the part of the main stem into the canopy.
After transformations, we obtain the following formula for main stem dry mass (DMms,
expressed in kg) as a function of DBH:
DMms = 0.0893*DBH2.3335
4.2.2. Modelling mass of order 1 branches
The equation linking the biomass of order 1 branches to DBH required 3 variables: mean
number of order 1 branches on a tree (Nbrch), basal diameter of the branches (Dbasal_brch), and
7 Resulting volumes would be expressed in cubic centimeters. No R2 are shown as they would be equal to 1.
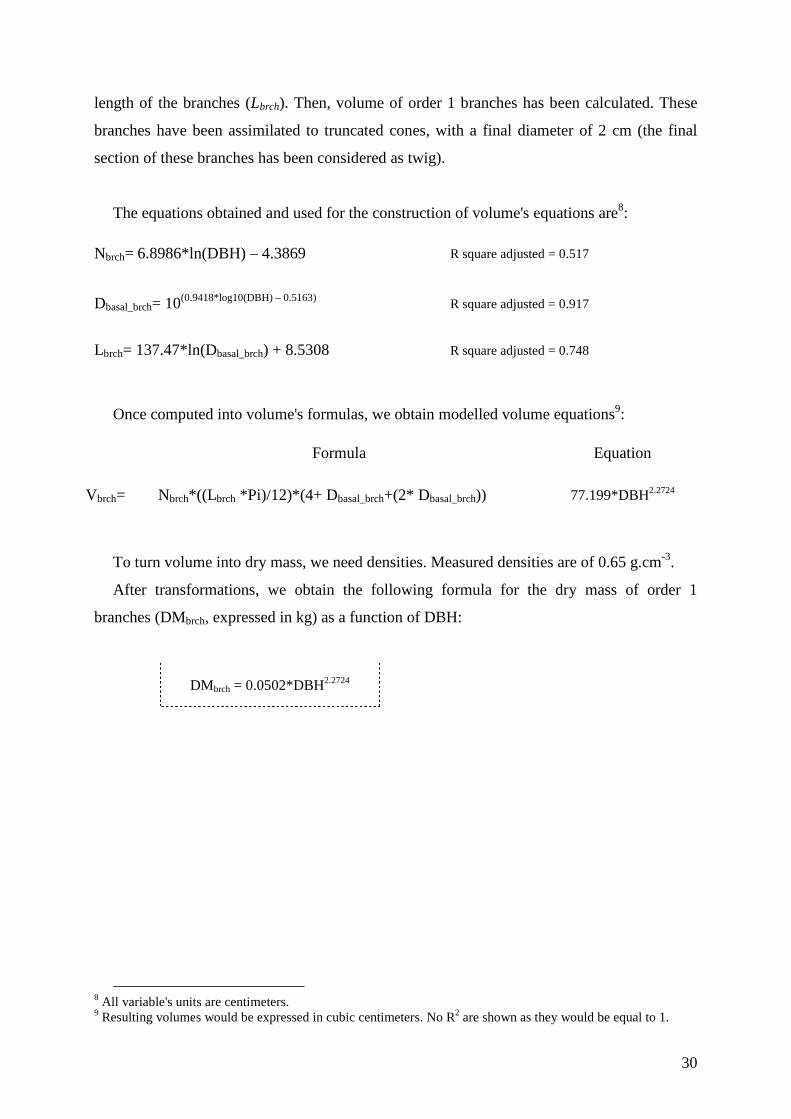
30
length of the branches (Lbrch). Then, volume of order 1 branches has been calculated. These
branches have been assimilated to truncated cones, with a final diameter of 2 cm (the final
section of these branches has been considered as twig).
The equations obtained and used for the construction of volume's equations are8:
Nbrch= 6.8986*ln(DBH) – 4.3869 R square adjusted = 0.517
Dbasal_brch= 10(0.9418*log10(DBH) – 0.5163) R square adjusted = 0.917
Lbrch= 137.47*ln(Dbasal_brch) + 8.5308 R square adjusted = 0.748
Once computed into volume's formulas, we obtain modelled volume equations9:
Formula Equation
Vbrch= Nbrch*((L brch *Pi)/12)*(4+ Dbasal_brch+(2* Dbasal_brch)) 77.199*DBH2.2724
To turn volume into dry mass, we need densities. Measured densities are of 0.65 g.cm-3.
After transformations, we obtain the following formula for the dry mass of order 1
branches (DMbrch, expressed in kg) as a function of DBH:
DMbrch = 0.0502*DBH2.2724
8 All variable's units are centimeters. 9 Resulting volumes would be expressed in cubic centimeters. No R2 are shown as they would be equal to 1.
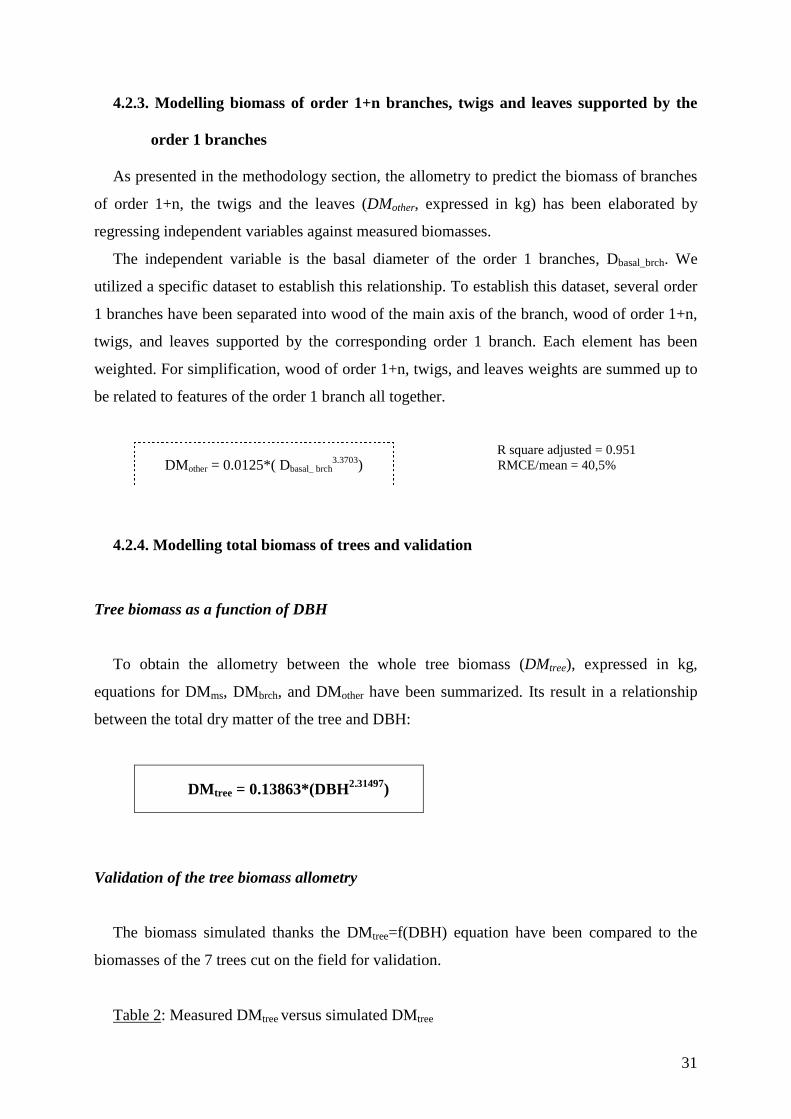
31
4.2.3. Modelling biomass of order 1+n branches, twigs and leaves supported by the
order 1 branches
As presented in the methodology section, the allometry to predict the biomass of branches
of order 1+n, the twigs and the leaves (DMother, expressed in kg) has been elaborated by
regressing independent variables against measured biomasses.
The independent variable is the basal diameter of the order 1 branches, Dbasal_brch. We
utilized a specific dataset to establish this relationship. To establish this dataset, several order
1 branches have been separated into wood of the main axis of the branch, wood of order 1+n,
twigs, and leaves supported by the corresponding order 1 branch. Each element has been
weighted. For simplification, wood of order 1+n, twigs, and leaves weights are summed up to
be related to features of the order 1 branch all together.
R square adjusted = 0.951 RMCE/mean = 40,5%
4.2.4. Modelling total biomass of trees and validation
Tree biomass as a function of DBH
To obtain the allometry between the whole tree biomass (DMtree), expressed in kg,
equations for DMms, DMbrch, and DMother have been summarized. Its result in a relationship
between the total dry matter of the tree and DBH:
DM tree = 0.13863*(DBH2.31497)
Validation of the tree biomass allometry
The biomass simulated thanks the DMtree=f(DBH) equation have been compared to the
biomasses of the 7 trees cut on the field for validation.
Table 2: Measured DMtree versus simulated DMtree
DMother = 0.0125*( Dbasal_ brch3.3703)
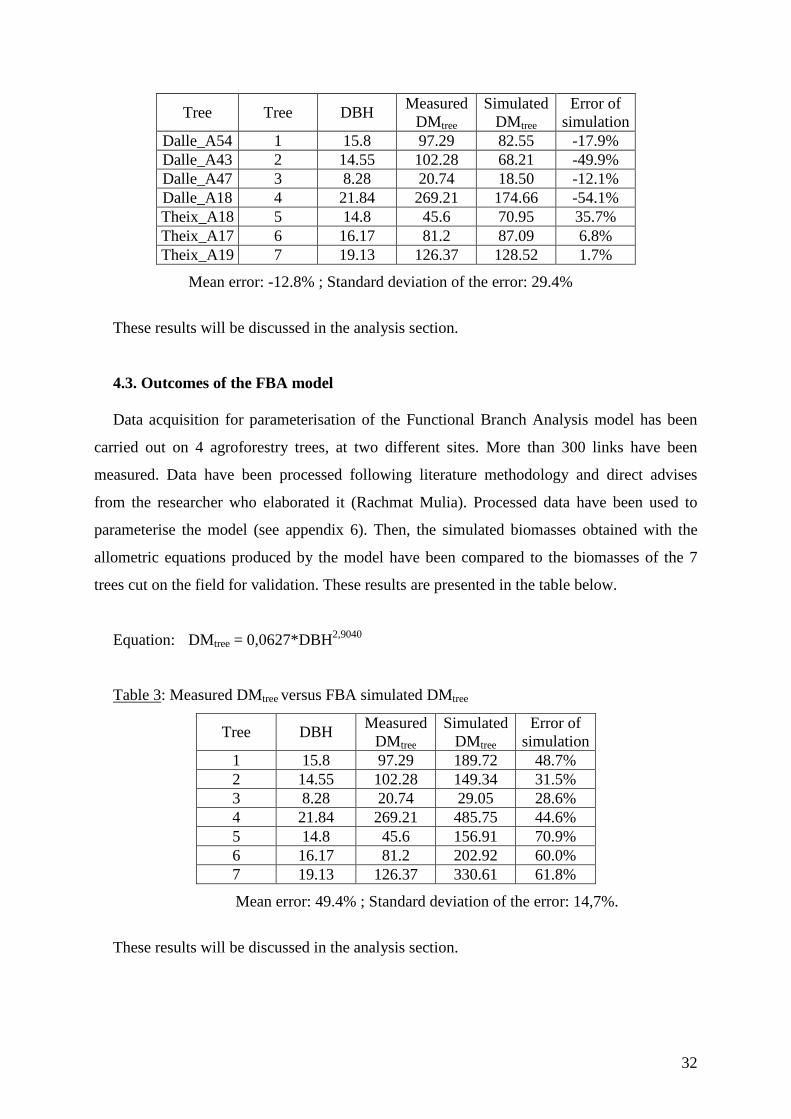
32
Tree Tree DBH Measured
DM tree Simulated
DM tree Error of
simulation Dalle_A54 1 15.8 97.29 82.55 -17.9% Dalle_A43 2 14.55 102.28 68.21 -49.9% Dalle_A47 3 8.28 20.74 18.50 -12.1% Dalle_A18 4 21.84 269.21 174.66 -54.1% Theix_A18 5 14.8 45.6 70.95 35.7% Theix_A17 6 16.17 81.2 87.09 6.8% Theix_A19 7 19.13 126.37 128.52 1.7%
Mean error: -12.8% ; Standard deviation of the error: 29.4%
These results will be discussed in the analysis section.
4.3. Outcomes of the FBA model
Data acquisition for parameterisation of the Functional Branch Analysis model has been
carried out on 4 agroforestry trees, at two different sites. More than 300 links have been
measured. Data have been processed following literature methodology and direct advises
from the researcher who elaborated it (Rachmat Mulia). Processed data have been used to
parameterise the model (see appendix 6). Then, the simulated biomasses obtained with the
allometric equations produced by the model have been compared to the biomasses of the 7
trees cut on the field for validation. These results are presented in the table below.
Equation: DMtree = 0,0627*DBH2,9040
Table 3: Measured DMtree versus FBA simulated DMtree
Tree DBH Measured
DM tree Simulated
DM tree Error of
simulation 1 15.8 97.29 189.72 48.7% 2 14.55 102.28 149.34 31.5% 3 8.28 20.74 29.05 28.6% 4 21.84 269.21 485.75 44.6% 5 14.8 45.6 156.91 70.9% 6 16.17 81.2 202.92 60.0% 7 19.13 126.37 330.61 61.8%
Mean error: 49.4% ; Standard deviation of the error: 14,7%.
These results will be discussed in the analysis section.

33
5. Analysis
Objectives of this section are to answer research questions, critically discuss results and
methodology, and formulate propositions.
5.1. Advantages and limits of the models
5.1.1. Advantages and limits for the model developed
The model we developed allows us to answer our research question 2 (What is the best
morphologic tree feature to predict aboveground biomass of the tree component in studied
systems?). Indeed, the power of prediction of other independent variables (Cross Sectional
Area at Breast Height, CSA below the first living branch, diameter below the first living
branch, bole height, total height, and combinations of them), but DBH remained the best
predictive variable. These trials were not shown in the results section due to their heaviness
for the reader.
Among the equations developed using the method set up during the project, the best
relationship between DBH and the biomass of the tree is DMtree = 0.13863*(DBH2.31497).
Even if this is the best relation that has been found, it did not explain so well biomasses of
the calibration trees. The mean error indicates that the model underestimates biomass by
about 13%. However, when compared to error of models found in the forestry literature
(among others, Whittaker et al., 1974; Chave et al., 2005), this mean error is not so important
given the sampling method we used and our objectives. However, standard deviation of this
error (29.4%) is more problematic, as it possibly involves individual tree simulations very
dispersed around the real biomass. Also, trees that were cut shown defaults (otherwise the
owner would not have agreed for their felling), excepted for trees 6 and 7. Interestingly, the
model best gave its best estimates for these same trees, showing, if not a statistical evidence, a
token of its reliability.
But the error has been calculated for a very limited set of sample trees. Representativeness
of our sampling has not been further investigated because we carried out an explorative study
with limited means. If we have had to establish allometry relationships for one natural region,
then sampling could have been on less plots and be more representative.
Of course, validation should be done on more trees if possible.

34
Also, it is very likely that the number of measurements of variables used to simulate
volumes, especially for the crown elements, has been too restrictive, i.e. not enough measures
have been taken. Combined to that, numerous confounding factors, such as genetic variability
of the hybrids, soils, annual rainfalls, management practices, etc. have not been handled by
the experimental design. This could have been compensated by multiplying measurements
and measurement sites, which was planned at first in the project but rendered impossible by
the non-active participation of the partners.
One of the most flagrant sources of error due to highly changing sampling conditions and
poor experimental design is the equation obtained for Hg. Pruning practices are highly
variable depending on managers. Thus, power of prediction of the model is lowered by our
incapacity to handle correctly Hg systematic fluctuations.
Also, it is important to note that a Nbrch equation with low R2 adjusted has been chosen,
while other models with higher R2 existed, because the corresponding mathematical model
seemed much sounded from a biophysical point of view (Natural logarithm rather than an
exponential for instance).
A limitation of the model that has been created is that its applicability to trees with DBH
over 40 cm is risky. Indeed, very little trees with DBH higher than 30 have been included in
measurements. Most of volume functions are power shaped, which we known is unlikely to
happen in the physiological reality of trees (excepted maybe for the trunk).
5.1.2. Advantages and limits of the FBA model
Mean error of biomasses simulated with the FBA model is high (49.4%). In average, the
model overestimated the true biomass, but it consistently did it, as standard deviation is quite
low (about 15%). Thus, with the equation obtained with the FBA model, we know it is likely
that we would overestimate biomass by 50%.
From the calibration trees we observe that the model had difficulties to predict biomass of
trees with a little DBH. We suppose this is inherent to a model based on the fractals, because
it cannot easily conceive very simple geometrical structures, which low DBH trees are.
It is very likely that not enough trees were measured at each site. More measurements, on
more similar sites, would probably increase confidence in the predictions.
More statistical analysis would be required for a better understanding of these results.
35
5.2. Comparison between the two models
What is the best allometric model to predict ABG biomass? From comparison between
simulated and field biomasses, the model developed within the project gives more reliable
predictions, but high variability. It is sure that an increased number of measured trees and
better handling of edaphic variables would increase the predictive power of the two models.
However, developing allometric relationships with the FBA model proved to be easier,
maybe because lots of effort were put into thinking our model, while this conceptualization
work was already done for the FBA model.
Also, it would be very interesting to compare these results, which are obtained from new
empirically-based biomass models, to biomasses simulated by the YieldSAFE or HiSAFE
models.
The FBA approach should be favoured for the coming researches, as it needs less
destructive measurements than the method we developed. But, when more agroforestry plots
will be available and the first trees harvested, a more classical allometric approach like we
adopted would certainly give good results at a regional level.
The experience acquired should permit the CasDAR projet team’ work more efficiently for
the elaboration of allometric relationships on other agroforestry species.
Also, as time goes, agroforestry trees grow and more hectares are planted every year in
France. This should give basis for facilitated applied research. Also, dynamism and results of
more fundamental research clears the way. Their advances should be taken into account.

36
List of tables and figures
Table 1: Description of the measurement plots p. 26 Table 2: Measured DMtree versus simulated DMtree p. 30 Table 3: Measured DMtree versus FBA simulated DMtree p. 30
Figure 1: How plots access and data collection was initially planned p. 18 Figure 2: Silvoarable (top) and silvopastoral (bottom) plots p. 19 Figure 3: Outline of the general approach of methods for field and lab measurements p. 20 Figure 4: Schematic of stem length and diameter measurement process used for data collection in WanFBA model (from Santos Martin et al., 2010)
p. 24

37
Appendices
Appendix 1: Letter accompanying the questionnaire
Appendix 2: Inventory form
Appendix 3: Field form for sample branches' data collection
Appendix 4: Parameters used by FBA model
Appendix 5: FBA field data form
Appendix 6: Parameterization data of the FBA model

Appendix 1: Letter accompanying the questionnaire
L'agroforesterie, une réponse aux défis posés à l'a griculture?
L'agriculture d'aujourd'hui doit relever les défis du "produire plus et mieux avec moins d'intrants". Les agriculteurs français, avec l'appui des instituts techniques et de la recherche, doivent donc innover afin d'adapter les systèmes de production existants.
Les systèmes agroforestiers – qui associent des arbres et des cultures ou de l'élevage sur une même parcelle - permettraient d'améliorer la durabilité économique, environnementale et productive des exploitations agricoles modernes, en tirant notamment avantage des interactions entre arbres et cultures.
L'une des conséquences attendues de l'association d'arbres et de cultures sur une même parcelle est une productivité globale en biomasse plus importante que lorsqu'arbres et cultures sont séparés, augmentation permise par une utilisation plus efficace des ressources du milieu. De plus, une parcelle agroforestière permet de séquestrer davantage de carbone qu'une parcelle agricole seule ou qu'une parcelle forestière seule, participant ainsi aux efforts de lutte contre le réchauffement climatique.
Un projet CasDAR visant à améliorer la gestion des systèmes agroforestiers
Le projet national CasDAR 2009/2011 intitulé "Améliorer l'efficacité agro-environnementale des systèmes agroforestiers en grande culture" est aujourd'hui en cours de réalisation. Son objectif est de créer des outils d’évaluation et de suivi des aménagements agroforestiers, et d’améliorer leur efficacité biologique. S'inscrivant dans la continuité du CasDAR Agroforesterie 2006/2008, il est financé par le ministère de l'Agriculture.
Estimer la productivité en biomasse des parcelles a groforestières
Parmi les objectifs poursuivis par ce projet figure celui d'estimation des potentialités de production de biomasse ligno-cellulosique par les systèmes agroforestiers. Si les éléments productifs principaux de la parcelle restent les cultures et le bois d'œuvre, les rémanents de biomasse peuvent être destinés à la production de Bois Raméal Fragmenté, de plaquettes bois-énergie, ou encore d'agro-carburant de seconde génération d'origine agricole.
Il est donc nécessaire de mettre au point une méthodologie qui permettrait d'estimer facilement la biomasse globale, et plus particulièrement ligneuse, d'une parcelle
agroforestière. La construction de cette méthodologie devra s'appuyer autant que possible

sur les parcelles agroforestières existantes au niveau national. Pour cette raison, votre assistance est plus que précieuse et indispensable.
Pourquoi ce questionnaire?
Un recueil des données de base sur les parcelles agroforestières existantes est en préalable nécessaire. Ainsi nous venons à vous pour vous proposer de remplir le questionnaire de description de votre (vos) parcelle(s) agroforestière(s) ci-joint. Les objectifs de ce questionnaire sont (1) la localisation et la description de l'environnement pédoclimatique, des caractéristiques agroforestières et des opérations de gestion passées et à venir de vos parcelles agroforestières, (2) l'identification des parcelles sur lesquelles des mesures d’accumulation de biomasse aérienne pourraient être entreprises. Recensées, ces parcelles agroforestières pourront dans un futur proche être associées à des projets de recherche et de développement fort utiles pour les propriétaires et gestionnaires comme pour les techniciens et ingénieurs abordant ce sujet.
Après recensement, et en accord avec les propriétaires de ces parcelles, une campagne de mesures de terrain pourra être décidée conjointement. Pour cela quelques questions en fin de questionnaire sont destinées à vous exprimer quant à la mise à disposition de vos parcelles pour le projet CasDAR Agroforesterie actuel.
Comment remplir le questionnaire?
Le questionnaire est divisé en une dizaine de parties, comprenant quelques questions chacune. Remplir ce questionnaire devrait prendre de 20 à 30 minutes.
Pour le lancer, il vous suffira de cliquer sur le lien tout en bas de ce courriel.
Une fois lancé, il vous suffira de répondre aux questions en renseignant les champs correspondants.
Les informations requises ne sont pas extraordinaires. Cependant, quelques données sont à préparer avant de débuter. Veillez ainsi à vous munir des informations suivantes:
- pH du sol de la parcelle - % MO du sol - pluviométrie moyenne sur 5 ans
Si vous rencontrez un problème pendant la saisie, n'hésitez pas à appeler au 06.11.42.32.63, je vous répondrai et nous essayerons de trouver ensemble une solution!
Si vous connaissez d'autres personnes possédant ou étant en charge d'autres parcelles agroforestières, n'hésitez pas à nous transférer ses coordonnées!
Dans l'attente de votre réponse, nous vous prions d'agréer nos sincères salutations.
David Grandgirard, enseignant-chercheur à l'Institut Lasalle Beauvais
Maxime Havas, étudiant en mémoire de fin d'études à l'Institut Lasalle Beauvais

Appendix 2: Inventory form
FEUILLE D'INVENTAIRE
Propriétaire: Date: Département: Parcelle: Coordonnées GPS: Plan correspondant: Surface: Essences:
Remarques concernant la parcelle et les arbres (forme, …):
cm cm cm cm cm
Ligne
Arbre n°
Essence
D basal DBH D sous
couronne H tot H grume Défaut Remarques
1 2 3 4 5 6 7 8 9 10 11 12 13 14 15 16 17 18 19 20 21 22 23 24 25 26 27 28 29 30 31 32 33 34 35 36 37 38 39 40
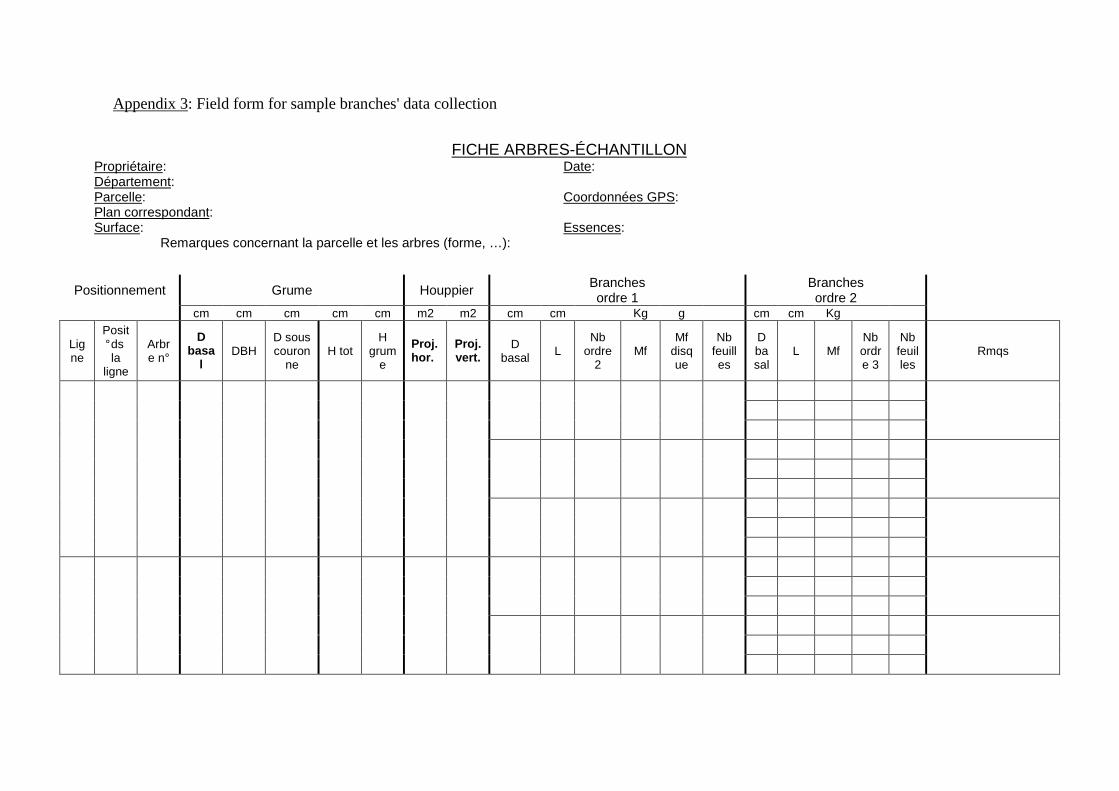
Appendix 3: Field form for sample branches' data collection
FICHE ARBRES-ÉCHANTILLON
Propriétaire: Date: Département: Parcelle: Coordonnées GPS: Plan correspondant: Surface: Essences:
Remarques concernant la parcelle et les arbres (forme, …):
Positionnement Grume Houppier Branches ordre 1
Branches ordre 2
cm cm cm cm cm m2 m2 cm cm Kg g cm cm Kg
Ligne
Posit° ds la
ligne
Arbre n°
D basa
l DBH
D sous couron
ne H tot
H grum
e
Proj. hor.
Proj. vert.
D basal L
Nb ordre
2 Mf
Mf disque
Nb feuilles
D basal
L Mf Nb ordre 3
Nb feuilles
Rmqs

Appendix 4: Parameters used by FBA model
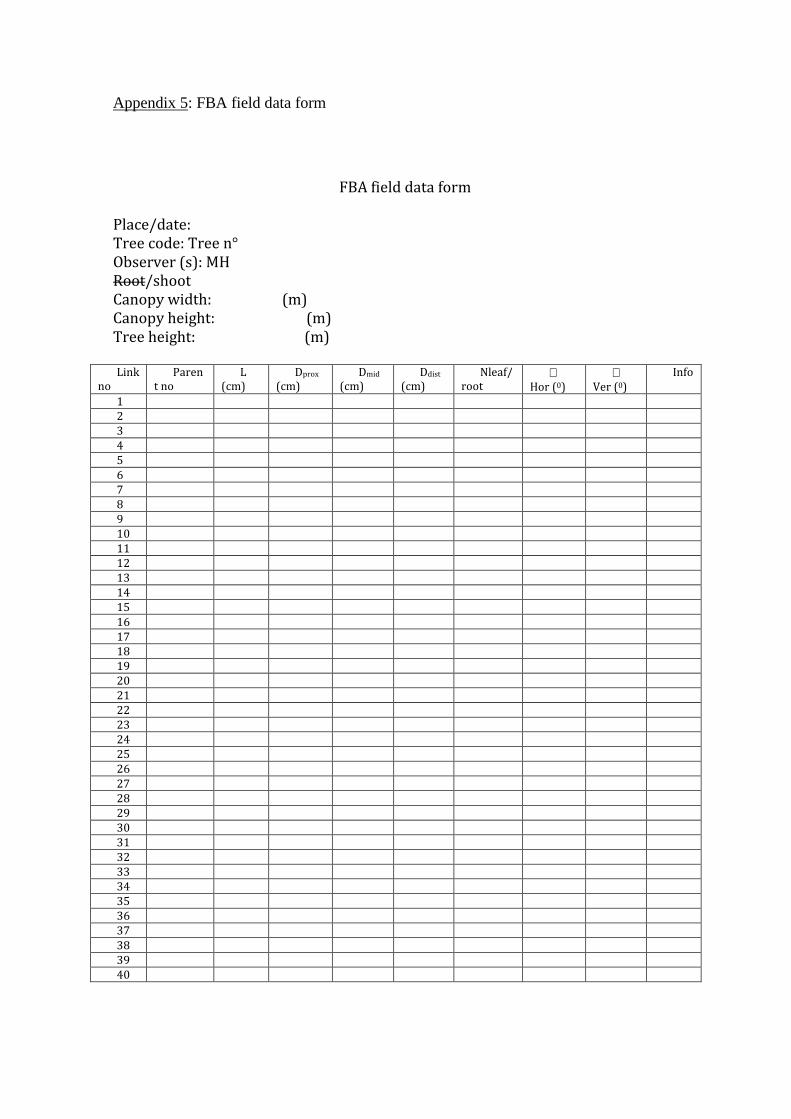
Appendix 5: FBA field data form
FBA field data form
Place/date:
Tree code: Tree n°
Observer (s): MH
Root/shoot
Canopy width: (m)
Canopy height: (m)
Tree height: (m)
Link
no
Paren
t no
L
(cm)
Dprox
(cm)
Dmid
(cm)
Ddist
(cm)
Nleaf/
root ∠
Hor (0)
∠
Ver (0)
Info
1
2
3
4
5
6
7
8
9
10
11
12
13
14
15
16
17
18
19
20
21
22
23
24
25
26
27
28
29
30
31
32
33
34
35
36
37
38
39
40
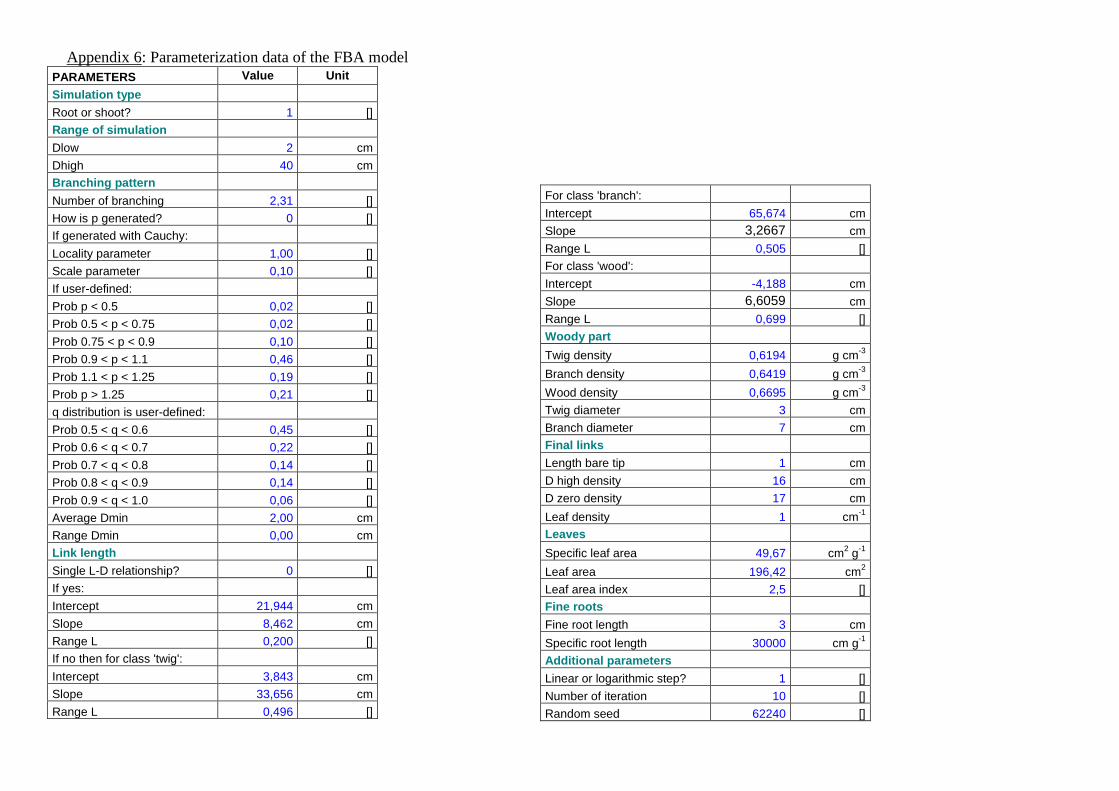
Appendix 6: Parameterization data of the FBA model
PARAMETERS Value Unit
Simulation type
Root or shoot? 1 []
Range of simulation
Dlow 2 cm
Dhigh 40 cm Branching pattern
Number of branching 2,31 []
How is p generated? 0 []
If generated with Cauchy:
Locality parameter 1,00 []
Scale parameter 0,10 []
If user-defined:
Prob p < 0.5 0,02 []
Prob 0.5 < p < 0.75 0,02 []
Prob 0.75 < p < 0.9 0,10 []
Prob 0.9 < p < 1.1 0,46 []
Prob 1.1 < p < 1.25 0,19 []
Prob p > 1.25 0,21 []
q distribution is user-defined:
Prob 0.5 < q < 0.6 0,45 []
Prob 0.6 < q < 0.7 0,22 []
Prob 0.7 < q < 0.8 0,14 []
Prob 0.8 < q < 0.9 0,14 []
Prob 0.9 < q < 1.0 0,06 []
Average Dmin 2,00 cm
Range Dmin 0,00 cm
Link length
Single L-D relationship? 0 []
If yes:
Intercept 21,944 cm
Slope 8,462 cm
Range L 0,200 []
If no then for class 'twig':
Intercept 3,843 cm
Slope 33,656 cm
Range L 0,496 []
For class 'branch':
Intercept 65,674 cm
Slope 3,2667 cm
Range L 0,505 []
For class 'wood':
Intercept -4,188 cm
Slope 6,6059 cm
Range L 0,699 []
Woody part
Twig density 0,6194 g cm-3
Branch density 0,6419 g cm-3
Wood density 0,6695 g cm-3
Twig diameter 3 cm
Branch diameter 7 cm
Final links
Length bare tip 1 cm
D high density 16 cm
D zero density 17 cm
Leaf density 1 cm-1 Leaves
Specific leaf area 49,67 cm2 g-1
Leaf area 196,42 cm2
Leaf area index 2,5 [] Fine roots
Fine root length 3 cm
Specific root length 30000 cm g-1
Additional parameters
Linear or logarithmic step? 1 []
Number of iteration 10 []
Random seed 62240 []


![Vers une circularisationde l’économie québécoise...• Réduction potentielle de 66 % des émissions de GES à l’horizon 2030 pour 5 pays européens [6] • Réduction potentielle](https://static.fdocuments.fr/doc/165x107/5f0c2d717e708231d4341f25/vers-une-circularisationde-laconomie-qubcoise-a-rduction-potentielle.jpg)