The Short-Run, Dynamic Employment Effects of Natural ...
44
1 Université du Québec à Montréal Université des Antilles 3 University of Bergamo 4 Université de Sherbrooke 5 kUniversity of Bern The Short-Run, Dynamic Employment Effects of Natural Disasters: New Insights Alessandro Barattieri 1 , Patrice Borda 2 , Alberto Brugnoli 3 , Martino Pelli 4 et Jeanne Tschopp 5 Cahier de recherche Working paper 2021-06 Juillet / July 2021
Transcript of The Short-Run, Dynamic Employment Effects of Natural ...

1 Université du Québec à Montréal 2 Université des Antilles 3 University of Bergamo 4 Université de Sherbrooke 5 kUniversity of Bern
The Short-Run, Dynamic
Employment Effects of
Natural Disasters: New Insights
Alessandro Barattieri1, Patrice Borda2, Alberto Brugnoli3, Martino Pelli4 et
Jeanne Tschopp5
Cahier de recherche Working paper 2021-06 Juillet / July 2021

La Chaire en macroéconomie et prévisions est fière de
s’appuyer sur un partenariat avec les organisations
suivantes:
Les opinions et analyses contenues dans les cahiers de recherche de la Chaire ne
peuvent en aucun cas être attribuées aux partenaires ni à la Chaire elle-même et
elles n’engagent que leurs auteurs.
Opinions and analyses contained in the Chair’s working papers cannot be attributed to the Chair or its partners and are the sole responsibility of the authors.
© 2021 Alessandro Barattieri, Patrice Borda, Alberto Brugnoli, Martino Pelli et Jeanne Tschopp.
Tous droits réservés. All rights reserved. Reproduction partielle permise avec citation du
document source, incluant la notice ©. Short sections may be quoted without explicit
permission, if full credit, including © notice, is given to the source.
The Short-Run, Dynamic Employment Effects of
Natural Disasters: New Insights⇤
Alessandro Barattieri† Patrice Borda ‡ Alberto Brugnoli §
Martino Pelli ¶ Jeanne Tschoppk
June 2021
Abstract
We study the short-run, dynamic employment effects of natural disasters. We ex-ploit monthly data for over 90 3-digits NAICS industries and 78 Puerto Rican countiesover the period 1995-2017. Our exogenous measure of exposure to natural disastersis computed using the maximum wind speed recorded in each county during eachhurricane. Using panel local projections, we find that after the “average” hurricane,employment and wages fall by 1% on average. The effects peak after six months anddisappear within two years. Across industries, we find substantial heterogeneity in theemployment responses. This heterogeneity can be partly explained by input-outputlinkages.
Keywords: Natural Disasters, Employment, High-Frequency Data, Local ProjectionsJEL Codes: Q54, E24.
⇤We are grateful to the Social Sciences and Humanities Research Council (SSHRC) for its financial sup-port (grant number 039367). We would like to thank Matias Cortes, Etienne Lale, Ben Sand, Charles Seguin,Eric Strobl and participants at various conferences and presentations for useful comments and suggestions.All errors are ours.
†ESG UQAM. Mail: Case Postale 8888, sucursale Centre-ville Montreal (Quebec) H3C 3P8, Canada;[email protected].
‡Universite des Antilles, UFR des Sciences Juridiques et Economiques Campus de Fouillole - BP 27097157 Pointe–Pitre, Guadeloupe; [email protected].
§University of Bergamo, Department of Economics. Via dei Caniana 2 - 24127, Bergamo, Italy; [email protected].
¶University of Sherbrooke, Department of Economics, 2500 Blvd de l’Universite, Sherbrooke, Q.C.,Canada, CIREQ, CIRANO, and GREDI; [email protected].
kUniversity of Bern, Department of Economics, Schanzeneckstrasse 1, 3001 Bern, Switzerland;[email protected].
1 Introduction
In 2020, for only the second time in history, the World Meteorological Organization ran out
of letters to name the Atlantic tropical storms, and started using names from the Greek
alphabet.1 Moreover, natural disasters are expected to increase reported direct losses from
the current $195 billion a year to $234 billion a year by 2040. This increase of $39 billion
could reach up to $100 billion per year if the indirect costs from supply chain disruption
and other knock-on economic consequences are factored in.2 Given these facts, it is hardly
surprising that studying the economic consequences of climate change and natural disasters
has become a central research question in several fields of economics. However, due to data
availability, and especially in the context of less developed regions, there has been so far
no evidence coming from high frequency, detailed industry data. This is relevant, because
detailed data can help uncover the economic mechanisms taking place in the aftermath of
a hurricane. As a first step towards filling this gap, in this paper we study the short-run,
dynamic employment effects of natural disasters using an ideal laboratory: Puerto Rico.
We exploit a unique feature of Puerto Rico: a frequent exposure to natural disasters,
combined with the availability of high frequency, detailed employment data. This combina-
tion allows us to propose the first estimates of the short-run, dynamic employment effects
of hurricanes using geo-coded monthly data for over 90 3-digits NAICS industries, and 78
counties over the period 1995-2017. We also study the impact of hurricanes on wages at
quarterly frequency.
With the aid of satellite data, we are able to track the position of the eye of each storm
and the wind speed within it at six-hours intervals. Due to the precise laws of physics, this
information is sufficient to compute the wind speed at any distance from the storm’s eye.
We are therefore able to measure the intensity of natural disasters in all of Puerto Rico’s
counties, by using the maximum wind speed recorded in each county cell during each storm.
Exploiting information on wind speed guarantees the absence of any potential endogeneity of
our measure with respect to economic outcomes, which can lead to biased results, as shown
by Felbermayr & Groschl (2014). Armed with this exogenous measure of exposure to natural
disasters, varying over time and at the county level, we explore the dynamic employment
effects of natural disasters using local projections. This tool, which has now been used in
many contexts, consists of running a sequence of regressions for different prediction horizons.
1“With #Alpha, 2020 Atlantic Tropical Storm Names Go Greek”, NOAA News, 17 September 2020.https://www.noaa.gov/news/with-alpha-2020-atlantic-tropical-storm-names-go-greek.
2“Natural Disasters Could Cost 20 Percent More By 2040 Due to ClimateChange,” E360 digest 27, 2020, Yale University. https://e360.yale.edu/digest/
natural-disasters-could-cost-20-percent-more-by-2040-due-to-climate-change.
1

One advantage of local projections is that, unlike panel VARs, they do not impose (potentially
incorrect) dynamic restrictions. We regress the cumulative change of our variables of interest
(employment and average weekly wages) on our disaster shock variable at each horizon. The
coefficients obtained trace the dynamic responses of employment and wages to a disaster
shock. The richness of our data allows us to include in the main specification a full set of
industry (3-digits NAICS), counties and time fixed effects. In one specification, focusing on a
reduced sample starting in 2010, we are also able to control for the county-level evolution of
population, which allows us to control for potential changes in labor supply. We also propose
the results we obtained for each industry, after controlling for seasonal and aggregate effects.
We find three main results. First, after the “average” hurricane, employment falls on av-
erage by about 1%, and so do average weekly wages. The effects peak after about six months
and they disappear within two years. Second, we find very heterogeneous effects across indus-
tries. In some industries, which we call the “strengthened industries”, employment increases
following a natural disaster. Examples of these industries include NAICS 236 (“Construction
of Buildings’)’ and NAICS 238 (“Specialty trade contractors”). In other industries, which
we call “weakened” industries, employment decreases. Examples of weakened industries are
NAICS 721 (“Accommodation”) and NAICS 487 (“Scenic and Sightseeing Transportation”).
In a third group of industries, employment does not seem to be directly affected by natural
disasters. We call them “neutral” industries. Most of the manufacturing sector falls in the
third category. Finally, we uncover a potential mechanism that can explain some of the
results at the industry level: input-output linkages. The construction boom, for instance,
is the likely trigger of the increase in employment in the manufacturing of furniture and of
metal products. According to the 2019 BEA I-O tables for the US, in fact, construction is
by far the most important buyer for both of these sectors.
Finally, the heterogeneous cyclicality of employment to hurricanes across different in-
dustries suggests a new concept of resilience to natural disaster shocks: adaptability-driven
employment resilience, defined as the potential ability of workers to rapidly reallocate from
the contracting industries to the expanding ones in the aftermath of a natural disaster. This
could be an important building block of the “post-disaster resilience”, which was included
as one of the three pillars of the “disaster resilience strategy” framework proposed by the
IMF (2019). Adaptability-driven employment resilience could potentially be achieved (or
enhanced) by introducing new and different vocational training programs, aimed at endow-
ing workers with a set of heterogeneous skills, which are needed for rapid and temporary
reallocations across different industries.
The remainder of the paper is structured as follows. After a brief overview of the rele-
vant literature, Section 2 presents the data, particularly our measure of exposure to natural
2
disasters. In Section 3 we discuss our empirical strategy, and Section 4 contains the results.
Finally, Section 5 concludes.
1.1 Related literature
First, this paper is linked to the literature exploring the effects of natural disasters on a variety
of different outcomes, such as economic growth (Hsiang & Jina, 2014; Felbermayr & Groschl,
2014; Bertinelli & Strobl, 2013; Cavallo et al., 2013; Strobl, 2011), firm level outcomes (Pelli
et al., 2020; Elliott et al., 2019; Seetharam, 2018; Vu & Noy, 2018), exports (Pelli & Tschopp,
2017), household finance (Deryugina et al., 2018; Gallagher & Hartley, 2017), education
(Sacerdote, 2012), housing (Ortega & Taspinar, 2018) and migration (Boustan et al., 2020).
Some papers have looked more closely at the employment effects of natural disasters. Belasen
& Polachek (2008) explore the employment effects of hurricanes in Florida for the period
1988-2005 using a difference in difference approach. McIntosh (2008) presents an event study
of the impact of the migration induced by Hurricane Katrina on the local labor market in
Houston. Groen & Polivka (2008) study the labor market outcome of the people evacuated
from hurricane Katrina. Kirchberger (2017) studies the effects of a large earthquake in
Indonesia on the wage dynamics across different sectors, while Groen et al. (2020) look at
the long-term employment outcomes of the workers affected by hurricanes Katrina and Rita.
None of these studies combines our measure of exposure to (frequent) natural disasters to
our analysis of their short-run, dynamic employment effects at a detailed industry level.
Second, our paper is linked to the literature using local projections to investigate the
dynamic effects of shocks on the economy, following the seminal work by Jorda (2005). Ex-
amples of this literature include Auerbach & Gorodnichenko (2013), Jorda & Taylor (2016),
and Leduc & Wilson (2013), who look at fiscal policy shocks. Ottonello & Winberry (2020)
investigates the effects of monetary shocks, while Barattieri & Cacciatore (2020) study trade
policy shocks in the presence of network effects. We apply this econometric tool for the first
time to the study of the employment effects of natural disasters shocks.
Finally, our paper is linked to the literature exploring features of the Puerto Rican econ-
omy, and especially the impact of hurricane Maria. Lugo (2019) studies the social and
technological effects of Maria. Watkins et al. (2020) look at health outcomes, while Peri
et al. (2020) study the labor market effects in Orlando of the inflow of immigrants from
Puerto Rico following hurricane Maria.
3
2 Data
In this Section we introduce both our measure of exposure to natural disasters, obtained
using satellite data, and the data on Puerto Rican employment dynamics taken from the
Bureau of Labor Statistics (BLS).
2.1 Wind speed at the county level
We use satellite data from the National Oceanic and Atmospheric Administration (NOAA)
Tropical Prediction Center. We look at the storms’ best tracks in the Caribbean Sea over the
period 1995-2017, to construct the maximum wind speed associated with each hurricane H
hitting Puerto Rican county c, i.e. wcH . A best track contains the full history of a hurricane,
with information at 6-hours intervals on latitude, longitude, date and wind speed at its eye.
First, we linearly interpolate the storms’ best tracks at every kilometer. For each inter-
polated kilometer, we obtain the set of coordinates for the position of the eye (landmark h)
and the wind speed at the eye, Vh. For each county that falls in the vortex associated with a
landmark h, we use the HURRECON model (see Boose et al., 1994, 2001, 2004) to compute
the sustained wind velocity at the county’s centroid, wch.3
In order to improve the precision of our measure and obtain a good proxy of the impact
of hurricanes on economic activity, we do not use the simple geometrical centroid of each
county. Instead, using population data from the 2010 Census at the block level and the
geometrical centroid of each census block, we construct a population weighted centroid for
each of the 78 counties of Puerto Rico. This correction allows us to compute the maximum
wind speed affecting populated areas and to give less weight to strong winds hitting forests
or other areas with no economic activity.
Finally, we obtain one measure of windspeed per county and hurricane by retaining the
maximum windspeed to which a county was exposed:
wcH = maxh∈H
{wch}.
2.2 Counties exposure to hurricanes
In what follows we describe how we construct Sct, the index of exposure to hurricanes of
county c at time t (where time can be at monthly or quarterly frequency). Following Bernabe
et al. (2021), Pelli et al. (2020), Pelli & Tschopp (2017), and Yang (2008), our index of
3More details about the HURRECON model are provided in Appendix A.1.
4
exposure is obtained in the following way:
Sct =X
H
xcHt where xcHt =(wcHt � 33)3
(wmax � 33)3if wcHt > 33 (1)
where xcHt represents the maximum windspeed affecting county c during storm H at time
t relative to the sample maximum (the term wmax). We normalize the index with respect
to the maximum wind speed observed in order to obtain a measure included between zero
and one. The cubic powers account for the force exerted by winds on physical structures
(see the technical HAZUS manual of the Federal Emergency Management Agency (FEMA)
of the US Department of Homeland Security and Emanuel, 2005).4 We use a threshold of
33 knots, which defines a tropical storm according to the Simpson and Riehl scale.5, 6
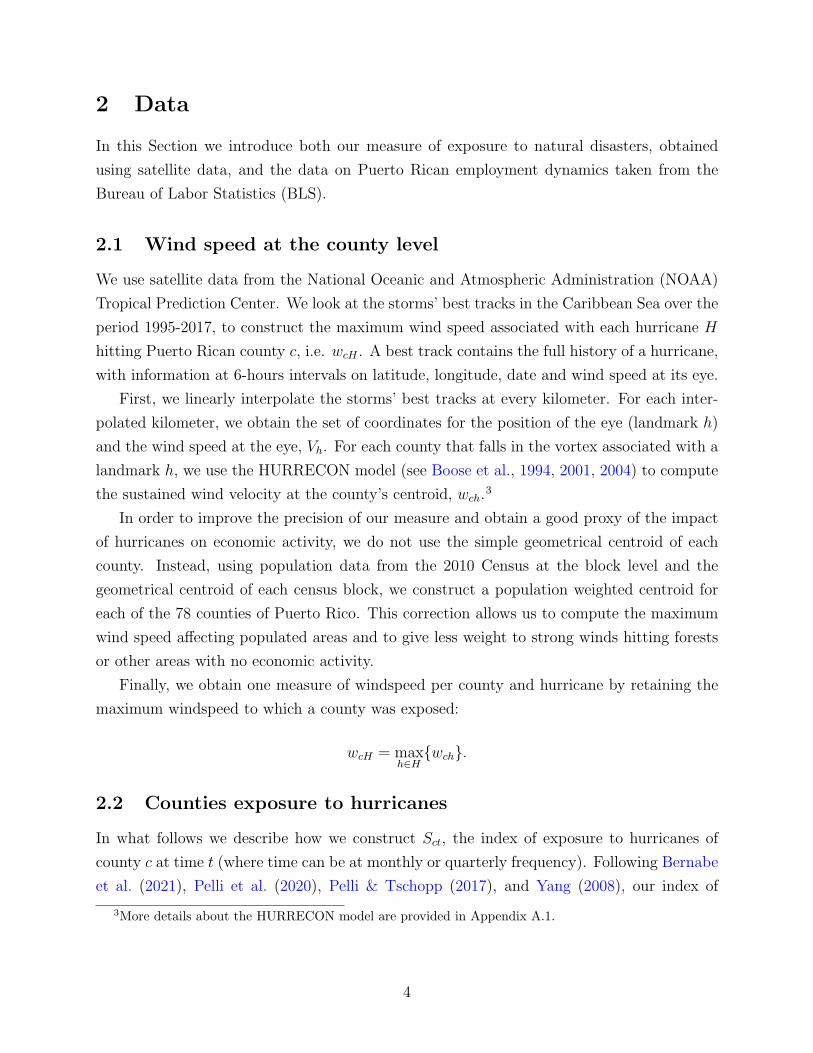
Figure 1 shows examples of our measure of exposure for four major hurricanes that hit
Puerto Rico over the years. On the left side of the figure we show the best track for each
of the four hurricanes while, on the right side, we show the exposure index, Sct, for each
of the four months concerned. This figure underlines the large extent of geographical and
time variation at our disposal for identification. Hurricanes Jeanne, for instance, hit mostly
the western part of Puerto Rico (the counties most affected were municipios “Aguada”,
“Aguadilla” and “Cabo Rojo”). On the contrary, hurricanes Irene and Maria hit much more
severely the eastern part of the island. Municipios “Vieques”, “Yabucoa” and “Culebra”were
the counties most affected by hurricane Irene, while municipios “Culebra”, “Fajardo” and
“Luquillo”were the counties most affected by hurricane Maria. Finally, hurricane George hit
mostly the central part of the island. The counties most affected were municipios “Catano”,
“Aibonito”, and “Toa Alta”. In the Online Appendix, we list the 23 hurricanes and storms
that hit Puerto Rico in our sample period.
2.3 Puerto Rico Employment Data
We use employment data from the Quarterly Census of Employment and Wages (QCEW)
by the Bureau of Labor Statistics of the United States (BLS). The QCEW contains monthly
data on employment and quarterly data on wages at the county-industry level. We focus
our attention on employment in the private sector. To give a broad idea of the economic
4In the Online Appendix we experiment with a variety of alternative specifications of counties exposureto hurricanes.
5In one robustness check, we increase the threshold from 33 knots to 64.6By definition, Sct 2 (0,
P
H), with a value of 0 indicating zero county exposure to hurricanes (i.e. winds
in county c are below the threshold) and withP
Hindicating the number of storms hitting a county at time
t. This is because in the cases when more that one hurricane hits Puerto Rican counties at the same time t,we sum xcHt over hurricanes.
5

Figure 1: County Exposure to Hurricanes – Examples
Hurricane Georges (September 1998)
Hurricane Jeanne (September 2004)
Hurricane Irene (August 2011)
Hurricane Maria (September 2017)
structure of the Puerto Rican economy, during our sample period, the private sector em-
ployed on average 674,800 people. Of those workers, 18.4% were employed in Retail Trade
(NAICS 44-45), 17.2% in Manufacturing (NAICS 30), 9.7% in Health care and social as-
sistance (NAICS 62), 9.1% in Accommodation and Food Services (NAICS 72), 8.7% in the
Administrative and Waste services (NAICS 46), and 7.1% in Construction (NAICS 23). In
terms of employment dynamics, manufacturing has witnessed a secular decline. Most ser-
vices display an increase over time, while the construction sector seems characterized by an
inverted U-shaped dynamics.
Within the manufacturing sector, the most important industries in terms of average
employment in our sample period are NAICS 325 (“Chemical manufacturing”), NAICS 311
(“Food manufacturing”), and NAICS 315 (“Apparel manufacturing”). While (unsurprisingly)
apparel manufacturing employment displays a negative trend, chemical manufacturing em-
6
ployment shows an inverted-U shape. In the Online Appendix, we provide tables and graphs
with more details on the structure of the Puerto Rican economy.
3 Empirical Strategy
Armed with the exogenous exposure to natural disaster shocks illustrated in the previous
section, we explore the dynamic employment effects of natural disasters using local projec-
tions. After the seminal contribution by Jorda (2005), local projections have become a tool
used in many settings, as discussed in the introduction. The approach consists of running a
sequence of predictive regressions of a variable of interest on a shock for different prediction
horizons. The sequence of regression coefficients traces the dynamic response of the variable
of interest to the shock. The main advantages of this approach are that local projections
do not impose potentially inappropriate dynamic restrictions (as panel VARS do), they are
robust to misspecification of the data generating process, and they can be estimated in a
simple univariate framework.
In our context, for our main specification, we run the following k-step ahead panel pre-
dictive regressions:
∆Xic,t+k = ↵k + �kSct + �t + ⌫i + ⌘c + ✏ic,t+k, (2)
where ∆Xic,t+k is the cumulative growth of our variable of interest from time t � 1 to
time t + k (that is, ∆Xic,t+k ⌘ logXic,t+k � logXic,t−1). X represents either employment
(for each industry i and county c at monthly frequency) or the average weekly wage (for
each industry i and county c at quarterly frequency). Sct is our measure of disaster shocks,
varying at county level for each month (or quarter). Our object of interest is �k, representing
the average response of X at horizon k to a disaster shock at time t. Our sample period
run from 1995M1 to 2017M11. We have data for a panel of 93 NAICS3 industries and 78
counties (GEO). The richness of our data allows us to also include time, NAICS3 and GEO
fixed effects (respectively �t, ⌫i, and ⌘c). We also experiment with alternative sets of fixed
effects (using GEO-NAICS3 and time or GEO and NAICS3-time fixed effects). Finally, we
restrict our attention to a more recent sample (from 2010) where we can insert as a further
control variable the cumulative growth of the population from time t � 1 to time t + k for
each county c (∆Popic,t+k).7 This extra control allows us to proxy for the evolution of labor
7Population estimates are provided by the US Census for each Puerto Rican county at yearly frequencystarting in 2010. In order to compute our monthly (or quarterly) frequency control variables, we linearlyinterpolate the annual population estimates. In the Online Appendix, we provide information on the structureof the Puerto Rican population in 2010 and its dynamics over time. On average, Puerto Rican counties saw
7

supply.
We also explore the dynamic employment effects at the level of each single industry. The
analog of equation 2 now becomes:
∆Xi,t+k = ↵k + �ki St + �k
∆XAGGRt+k + �m(�q) + ✏i,t+k, (3)
In this case, we do not exploit the variation at the county level, but only at the industry
level. As before, X represents either employment (for each industry i at monthly frequency)
or the average weekly wage (for each industry i at quarterly frequency). St is an aggregate
measure of exposure to disaster, computed as a population-weighted average of Sct. Our
object of interest is �ki , representing the response of Xi at horizon k to a disaster shock at
time t. In order to control for aggregate effects, we also insert in the regression XAGGR,
which is a measure of the aggregate counterpart of X. Finally, while we cannot use a full
set of time fixed effects, as in equation 2 , we insert instead �m (�q), which are monthly
(quarterly) dummies, to control for potential seasonal effects.
In the next Section, we report impulse responses following a disaster shock. This means
that we plot the coefficients �k and �ki at different horizons k, together with their 90%
confidence intervals. We consider a two years horizon. Therefore, at monthly frequency k
ranges from 0 to 24, while at quarterly frequency k ranges from 0 to 8.
4 Results
Figure 2 reports our main results. In the first row, we report the coefficients obtained from
equation 2. As the Figure shows, after the “average” hurricane, employment falls on average
by about 1%, and so do average weekly wages. The effects peak after about six months
and they disappear within two years. The effects are strongly statistically significant for
employment and borderline significant for average weekly wages. In the second and third
row of Figure 2, we report the results we obtain using different specifications for the fixed
effects in equation 2. In the second row, we report the results obtained if we substitute the
GEO and industry fixed effects (⌘c and ⌫i) with a combined GEO-industry fixed effect (⌘ci).
In the third row, we instead substitute the industry and time fixed effects (�t and ⌫i) with a
combined industry-time fixed effect (�it). As the Figure shows, the results are very similar
to our baseline specification.8 Finally, in the fourth row of Figure 2, we report a robustness
test based on a more recent sample (post 2010), in which we can add as control also the
a loss of population of about 10% during the period 2010-2017.8Clearly the third possible option, combining ηc and δt, would prevent us from estimating the coefficients
of interest γk, since Sct would be absorbed by the county-time fixed effects.
8

cumulative growth of the population at county-level. As the Figure shows, our main results
are robust also to this alternative specification, which accounts for potential changes in the
labor supply.
Figure 2: Employment Effects of Natural Disasters: Panel Results-1
.5-1
-.5
0.5
Pe
rce
nta
ge
Po
ints
0 6 12 18 24Months
Employment, Panel Results (Geo, NAICS, Time FE)
-3-2
-10
1P
erc
en
tag
e P
oin
ts
0 1 2 3 4 5 6 7 8Quarters
Wages, Panel Results (Geo, NAICS, Time FE)
-1.5
-1-.
50
.5P
erc
en
tag
e P
oin
ts
0 6 12 18 24Months
Employment, Panel Results (Geo*NAICS, Time FE)
-2-1
01
Pe
rce
nta
ge
Po
ints
0 1 2 3 4 5 6 7 8Quarters
Wages, Panel Results (Geo*NAICS, Time FE)
-1.5
-1-.
50
.5P
erc
en
tag
e P
oin
ts
0 6 12 18 24Months
Employment, Panel Results (Geo, NAICS*Time FE)
-2-1
01
Pe
rce
nta
ge
Po
ints
0 1 2 3 4 5 6 7 8Quarters
Wages, Panel Results (Geo, NAICS*Time FE)
-2-1
.5-1
-.5
0.5
Pe
rce
nta
ge
Po
ints
0 6 12 18 24Months
Employment, Panel Results (Post 2010, pop)
-3-2
-10
1P
erc
en
tag
e P
oin
ts
0 1 2 3 4 5 6 7 8Quarters
Wages, Panel Results (Post 2010, pop)
We then move to explore whether this average effect masks heterogeneous responses
across industries. Using specification 3, we find that industries can be divided into three
main groups. A first group of industries, which we call “strengthened”, is reported in Figure
3.
9
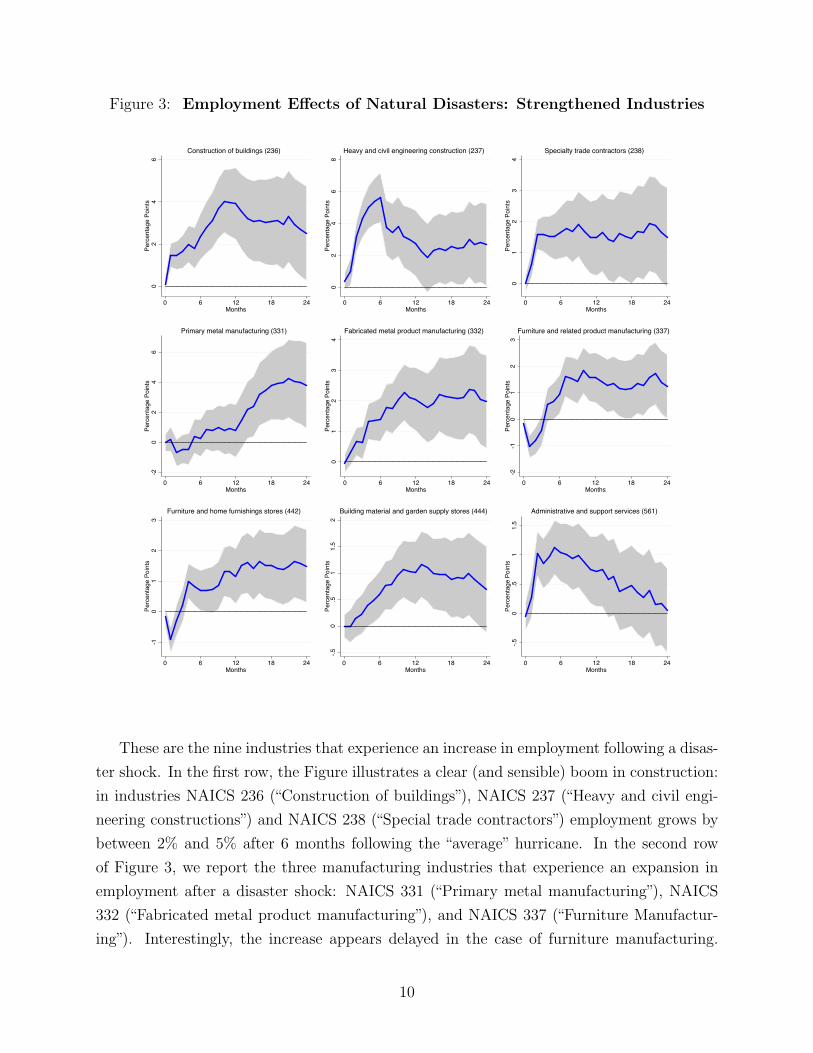
Figure 3: Employment Effects of Natural Disasters: Strengthened Industries
02
46
Pe
rce
nta
ge
Po
ints
0 6 12 18 24Months
Construction of buildings (236)
02
46
8P
erc
en
tag
e P
oin
ts
0 6 12 18 24Months
Heavy and civil engineering construction (237)
01
23
4P
erc
en
tag
e P
oin
ts
0 6 12 18 24Months
Specialty trade contractors (238) -2
02
46
Pe
rce
nta
ge
Po
ints
0 6 12 18 24Months
Primary metal manufacturing (331) 0
12
34
Pe
rce
nta
ge
Po
ints
0 6 12 18 24Months
Fabricated metal product manufacturing (332)
-2-1
01
23
Pe
rce
nta
ge
Po
ints
0 6 12 18 24Months
Furniture and related product manufacturing (337)
-10
12
3P
erc
en
tag
e P
oin
ts
0 6 12 18 24Months
Furniture and home furnishings stores (442)
-.5
0.5
11
.52
Pe
rce
nta
ge
Po
ints
0 6 12 18 24Months
Building material and garden supply stores (444) -.
50
.51
1.5
Pe
rce
nta
ge
Po
ints
0 6 12 18 24Months
Administrative and support services (561)
These are the nine industries that experience an increase in employment following a disas-
ter shock. In the first row, the Figure illustrates a clear (and sensible) boom in construction:
in industries NAICS 236 (“Construction of buildings”), NAICS 237 (“Heavy and civil engi-
neering constructions”) and NAICS 238 (“Special trade contractors”) employment grows by
between 2% and 5% after 6 months following the “average” hurricane. In the second row
of Figure 3, we report the three manufacturing industries that experience an expansion in
employment after a disaster shock: NAICS 331 (“Primary metal manufacturing”), NAICS
332 (“Fabricated metal product manufacturing”), and NAICS 337 (“Furniture Manufactur-
ing”). Interestingly, the increase appears delayed in the case of furniture manufacturing.
10
Finally, there are three service sector industries that see an increase in employment after
an hurricane, as reported by the third row in Figure 3: NAICS 442 (“Furniture and home
furniture stores”), NAICS 444 (“Building material and garden supply stores”), and NAICS
561 (“Administrative and support services”). In the Online Appendix, we report the impulse
response of average weekly wages for the nine strengthened industries. Wages responses tend
to be non-statistically significant, with the exception of sectors NAICS 237 (“Heavy and civil
engineering constructions”) and NAICS 238 (“Special trade contractors”), where we found a
large and statistically significant increase of the average weekly wage.
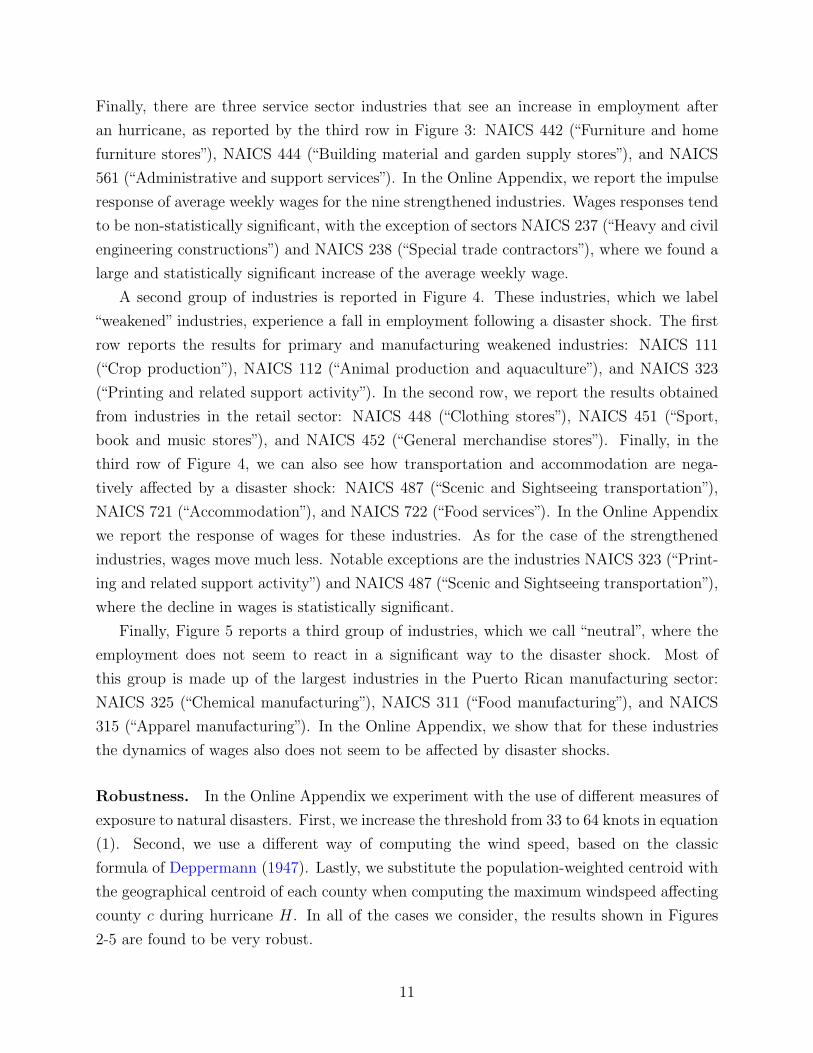
A second group of industries is reported in Figure 4. These industries, which we label
“weakened” industries, experience a fall in employment following a disaster shock. The first
row reports the results for primary and manufacturing weakened industries: NAICS 111
(“Crop production”), NAICS 112 (“Animal production and aquaculture”), and NAICS 323
(“Printing and related support activity”). In the second row, we report the results obtained
from industries in the retail sector: NAICS 448 (“Clothing stores”), NAICS 451 (“Sport,
book and music stores”), and NAICS 452 (“General merchandise stores”). Finally, in the
third row of Figure 4, we can also see how transportation and accommodation are nega-
tively affected by a disaster shock: NAICS 487 (“Scenic and Sightseeing transportation”),
NAICS 721 (“Accommodation”), and NAICS 722 (“Food services”). In the Online Appendix
we report the response of wages for these industries. As for the case of the strengthened
industries, wages move much less. Notable exceptions are the industries NAICS 323 (“Print-
ing and related support activity”) and NAICS 487 (“Scenic and Sightseeing transportation”),
where the decline in wages is statistically significant.
Finally, Figure 5 reports a third group of industries, which we call “neutral”, where the
employment does not seem to react in a significant way to the disaster shock. Most of
this group is made up of the largest industries in the Puerto Rican manufacturing sector:
NAICS 325 (“Chemical manufacturing”), NAICS 311 (“Food manufacturing”), and NAICS
315 (“Apparel manufacturing”). In the Online Appendix, we show that for these industries
the dynamics of wages also does not seem to be affected by disaster shocks.
Robustness. In the Online Appendix we experiment with the use of different measures of
exposure to natural disasters. First, we increase the threshold from 33 to 64 knots in equation
(1). Second, we use a different way of computing the wind speed, based on the classic
formula of Deppermann (1947). Lastly, we substitute the population-weighted centroid with
the geographical centroid of each county when computing the maximum windspeed affecting
county c during hurricane H. In all of the cases we consider, the results shown in Figures
2-5 are found to be very robust.
11

Figure 4: Employment Effects of Natural Disasters: Weakened Industries
-3-2
-10
1P
erc
en
tag
e P
oin
ts
0 6 12 18 24Months
Crop production (111)
-1.5
-1-.
50
.5P
erc
en
tag
e P
oin
ts
0 6 12 18 24Months
Animal production and aquaculture (112)
-1-.
50
.51
Pe
rce
nta
ge
Po
ints
0 6 12 18 24Months
Printing and related support activities (323) -3
-2-1
01
Pe
rce
nta
ge
Po
ints
0 6 12 18 24Months
Clothing and clothing accessories stores (448) -6
-4-2
02
Pe
rce
nta
ge
Po
ints
0 6 12 18 24Months
Sporting goods, hobby, book and music stores (451)
-2-1
.5-1
-.5
0.5
Pe
rce
nta
ge
Po
ints
0 6 12 18 24Months
General merchandise stores (452)
-10
-50
5P
erc
en
tag
e P
oin
ts
0 6 12 18 24Months
Scenic and sightseeing transportation (487)
-4-3
-2-1
0P
erc
en
tag
e P
oin
ts
0 6 12 18 24Months
Accommodation (721) -1
.5-1
-.5
0.5
Pe
rce
nta
ge
Po
ints
0 6 12 18 24Months
Food services and drinking places (722)
Discussion. Our first main result is consistent with the notion that natural disasters oper-
ate as temporary negative shocks to labor demand. Employment and wages fall temporarily,
even when controlling for the evolution of the population. As for our second result, some
of the heterogeneity we found across industries appears very sensible and self-evident: a
disaster shock generates a construction boom and negatively affects retail, transport and
accommodation industries.9 Some other results instead reveal a mechanism of transmission
of natural disaster shocks to employment at detailed industry level: input-output linkages.
The construction boom, for instance, is the likely trigger of the increase in employment in
9Our results on the construction sector are consistent with the findings by Strobl & Walsh (2009).
12

Figure 5: Employment Effects of Natural Disasters: Neutral Industries
-2-1
01
2P
erc
en
tag
e P
oin
ts
0 6 12 18 24Months
Chemical manufacturing (325)
-1-.
50
.51
1.5
Pe
rce
nta
ge
Po
ints
0 6 12 18 24Months
Food manufacturing (311)
-20
24
68
Pe
rce
nta
ge
Po
ints
0 6 12 18 24Months
Apparel manufacturing (315) -2
02
4P
erc
en
tag
e P
oin
ts
0 6 12 18 24Months
Computer and electronic product manufacturing (334) -2
-10
12
Pe
rce
nta
ge
Po
ints
0 6 12 18 24Months
Electrical equipment and appliance mfg. (335)
-10
12
Pe
rce
nta
ge
Po
ints
0 6 12 18 24Months
Nonmetallic mineral product manufacturing (327)
-2-1
01
Pe
rce
nta
ge
Po
ints
0 6 12 18 24Months
Beverage and tobacco product manufacturing (312)
-10
12
3P
erc
en
tag
e P
oin
ts
0 6 12 18 24Months
Plastics and rubber products manufacturing (326) -1
01
2P
erc
en
tag
e P
oin
ts
0 6 12 18 24Months
Machinery manufacturing (333)
some of its important suppliers, such as the manufacturing of metals and of furnitures. To
corroborate this hypothesis, we note that according to the 2019 BEA Input-Output table
for the US, construction sectors are by far the most important buyers of both furniture
manufacturing (absorbing 52% of total sales) and fabricated metal product manufacturing
(absorbing 26% of total sales). The same construction boom might also explain the increase
in employment in furniture stores and garden supply stores, which materializes only after a
few months. By the same token, the fall in employment in the printing and support activi-
ties, might be explained by the reduction of activity in the retail and accommodation sectors,
13
which could be important buyers of these activities, especially in Puerto Rico.10 Finally, the
lack of impact of hurricanes on the employment of the largest manufacturing sectors (which
might at first appear surprising) is consistent with what Pelli et al. (2020) find using firm
level data for India, where cyclones appear to have a large impact on manufacturing firms’
capital, but no significant effects on employment.
5 Conclusion
In this paper we study the short-run, dynamic employment effects of natural disasters. Using
monthly data for over 90 3-digits NAICS industries and 78 Puerto Rican counties over the
period 1995-2017, we show how the employment effects of natural disasters are consistent
with temporary negative shocks to labor demand. Employment and wages fall temporar-
ily, even when controlling for the evolution of the population. We also find an interesting
heterogeneity at the industry level, which can be partly explained by input-output linkages.
While we believe that the external validity of our quantitative results can be questionable,
due to the relatively small scale of our laboratory, we are convinced that the key qualitative
insights we provide are valid also for other contexts, such as developing countries, where data
limitations hinder the type of analysis performed in this paper.
In particular, the fact that some industries contract and some others expand following
natural disasters, suggests a new concept of resilience to natural disaster shocks: adaptability-
driven employment resilience, defined as the potential ability of workers to temporarily re-
allocate from the contracting industries (i.e. accommodation) to the expanding ones (i.e.
construction) in the aftermath of a natural disaster. The importance of these potential re-
allocations (or lack thereof) is witnessed by Sathyendrakajan et al. (2012), who surveyed
construction firms in Sri Lanka. The lack of skilled workers was cited as the most important
challenge faced by these firms during the post-disasters reconstruction efforts.
The IMF (2019) proposed a three-pillar “disaster resilience strategy”, based on structural,
financial, and post-disaster (and social) resilience. Adaptability-driven employment resilience
could be an important building block of the post-disaster (and social) resilience. It could
be achieved (or enhanced) by introducing new and different vocational training programs,
aimed at endowing workers with a set of heterogeneous skills needed for rapid and temporary
reallocations across different industries. As explained by the OECD (2010): “Vocational
Education and Training (VET), can play a central role in preparing young people for work,
developing skills of adults, and responding to the labour market needs of the economy”.
10When looking at the overall US Input-Output table, our weakened service industries accounts for about10% of sales of the sector NAICS 323 (“Printing and related support activity”).
14

References
Auerbach, A. J. & Gorodnichenko, Y. (2013). Output Spillovers from Fiscal Policy. American
Economic Review, 103, 141–146.
Barattieri, A. & Cacciatore, M. (2020). Self-Harming Trade Policy? Protectionism and
Production Networks. Working Paper 27630, NBER.
Belasen, A. & Polachek, S. (2008). How Hurricanes Affect Wages and Employment in LocalLabor Markets. American Economic Review, 98(2), 49–53.
Bernabe, A., Diop, B., Pelli, M., & Tschopp, J. (2021). The Long-Term Effects of Unexpected
Interruptions in Compulsory Schooling. mimeo.
Bertinelli, L. & Strobl, E. (2013). Quantifying the Local Economic Growth Impact of Hur-ricane Strikes: An Analysis from Outer Space for the Caribbean. Journal of Applied
Meteorology and Climatology, 52(8), 1688–1697.
Boose, E., Chamberlin, K., & Foster, D. (2001). Landscape and Regional Impacts of Hurri-canes in New England. Ecological Monographs, 71, 27–48.
Boose, E., Foster, D., & Fluet, M. (1994). Hurricane Impacts to Tropical and TemperateLandscapes. Ecological Monographs, 64, 369–400.
Boose, E., Serrano, M., & Foster, D. (2004). Landscape and Regional Impacts of Hurricanesin Puerto Rico. Ecological Monographs, 74(2), 335–352.
Boustan, L., Kahn, M., Rhode, P., & Yanguas, M. (2020). The Effect of Natural Disasterson Economic Activity in US Counties: A Century of Data. Journal of Urban Economics,118, 103257.
Cavallo, E., Galiani, S., Noy, I., & Pantano, J. (2013). Catastrophic Natural Disasters andEconomic Growth. The Review of Economics and Statistics, 95(5), 1549–1561.
Deppermann, C. (1947). Notes on the Origin and Structure of Philippine Typhoons. Bulletinof the American Meteorological Society, 28(9), 399–404.
Deryugina, T., Kawano, L., & Levitt, S. (2018). The Economic Impact of Hurricane Katrinaon Its Victims: Evidence from Individual Tax Returns. American Economic Journal:
Applied Economics, 10(2), 202–233.
Elliott, R., Liu, Y., Strobl, E., & Tong, M. (2019). Estimating the Direct and Indirect Impactof Typhoons on Plant Performance: Evidence from Chinese Manufacturers. Journal of
Environmental Economics and Management, 98, 102252.
Emanuel, K. (2005). Increasing Destructiveness of Tropical Cyclones over the Past 30 Years.Nature, 436(7051), 686–688.
Felbermayr, G. & Groschl, J. (2014). Naturally Negative: The Growth Effects of NaturalDisasters. Journal of Development Economics, 111, 92–106.
15

Gallagher, J. & Hartley, D. (2017). Household Finance after a Natural Disaster: The Caseof Hurricane Katrina. American Economic Journal: Economic Policy, 9(3), 199–228.
Groen, J., Kutzbach, M., & Polivka, A. (2020). Storms and Jobs: The Effect of Hurricanes onIndividuals’ Employment and Earnings over the Long Term. Journal of Labor Economics,38(3).
Groen, J. & Polivka, A. (2008). The Effect of Hurricane Katrina on the Labor MarketOutcomes of Evacuees. American Economic Review Papers and Proceedings, 98(2), 43–48.
Holland, G. (1980). An Analytical Model of the Wind and Pressure Profiles in Hurricanes.Monthly Weather Review, 108, 1212–1218.
Hsiang, S. & Jina, A. (2014). The Causal Effect of Environmental Catastrophe on Long-Run
Economic Growth: Evidence from 6,700 Cyclones. Working Paper 20352, NBER.
IMF (2019). Building Resilience in Developing Countries Vulnerable to Large Natural Dis-
asters. IMF Policy Paper 19/020, International Monetary Fund.
Jorda, O. (2005). Estimation and Inference of Impulse Responses by Local Projections.American Economic Review, 95, 161–182.
Jorda, O. & Taylor, A. (2016). The Time for Austerity: Estimating the Average TreatmentEffect of Fiscal Policy. Economic Journal, 126, 219–255.
Kirchberger, M. (2017). Natural Disasters and Labor Markets. Journal of Development
Economics, 125, 40–58.
Leduc, S. & Wilson, D. (2013). Roads to Prosperity or Bridges to Nowhere? Theory andEvidence on the Impact of Public Infrastructure Investment. NBER Macroeconomics
Annual, 27, 89–142.
Lugo, A. (2019). Social-Ecological-Technological Effects of Hurricane Maria on Puerto Rico.
Planning for Resilience under Extreme Events. Springer.
McIntosh, M. (2008). Measuring the Labor Market Impacts of Hurricane Katrina Migration:Evidence from Houston, Texas. American Economic Review, 98(2), 54–57.
OECD (2010). Learning for Jobs – OECD Reviews of Vocational Education and Training.OECD.
Ortega, F. & Taspinar, S. (2018). Rising Sea Levels and Sinking Property Values: HurricaneSandy and New YorkaAZs Housing Market. Journal of Urban Economics, 106(C), 81–100.
Ottonello, P. & Winberry, T. (2020). Financial Heterogeneity and the Investment Channelof Monetary Policy. Econometrica, 88, 2473–2502.
Pelli, M. & Tschopp, J. (2017). Comparative Advantage, Capital Destruction, and Hurri-canes. Journal of International Economics, 108, 315–337.
16
Pelli, M., Tschopp, J., Bezmaternykh, N., & Eklou, K. (2020). In the Eye of the Storm:
Firms and Capital Destruction in India. IMF Working Papers 2020/203, InternationalMonetary Fund.
Peri, G., Rury, D., & Wiltshire, J. (2020). The Economic Impact of Migrants from Hurricane
Maria. Working Paper 27718, NBER.
Sacerdote, B. (2012). When the Saints Go Marching Out: Long-Term Outcomes for Stu-dent Evacuees from Hurricanes Katrina and Rita. American Economic Journal: Applied
Economics, 4(1), 109–35.
Sathyendrakajan, N., Karunasena, G., & Wedikkara, C. (2012). Exploring Capacity of Con-struction Industry Post Disaster Housing Reconstruction. Built-Environment Sri Lanka,11(1), 2–6.
Seetharam, I. (2018). The Indirect Effects of Hurricanes: Evidence from Firm Internal
Networks. mimeo.
Strobl, E. (2011). The Economic Growth Impact of Hurricanes: Evidence from U.S. CoastalCounties. The Review of Economics and Statistics, 93(2), 575–589.
Strobl, E. & Walsh, F. (2009). The Rebuilding Effects of Hurricanes: Evidence from Em-ployment in the US Construction Industry. Economics bullettin, 29(4), 3059–3066.
Vu, T. B. & Noy, I. (2018). Natural Disasters and Firms in Vietnam. Pacific Economic
Review, 23(3), 426–452.
Watkins, D., Torres Zayas, H., Velez Vega, C., Rosario, Z., Welton, R., Agosto Arroyo,L., Zulmarie, N., Reguero, J., Santos Rivera, A., Huerta-Montanez, G., Brown, P., Al-shawabkeh, A., Cordero, J., & Meeker, J. (2020). Investigating the Impact of HurricaneMaria on an Ongoing Birth Cohort in Puerto Rico. Population and Environment, 42,95–111.
Yang, D. (2008). Coping with Disaster: The Impact of Hurricanes on International FinancialFlows, 1970-2002. The B.E. Journal of Economic Analysis and Policy, 8(2).
17
A Appendix
A.1 HURRECON model
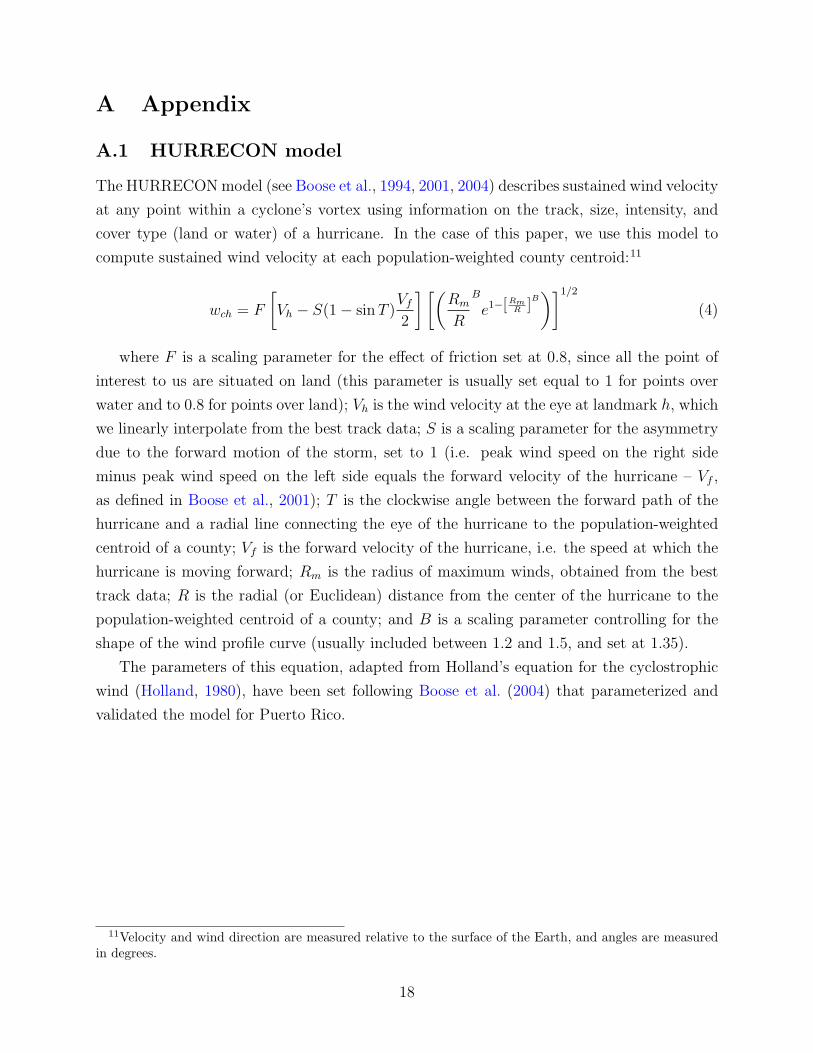
The HURRECONmodel (see Boose et al., 1994, 2001, 2004) describes sustained wind velocity
at any point within a cyclone’s vortex using information on the track, size, intensity, and
cover type (land or water) of a hurricane. In the case of this paper, we use this model to
compute sustained wind velocity at each population-weighted county centroid:11
wch = F
Vh � S(1� sinT )Vf
2
� ✓
Rm
R
B
e1−[Rm
R]B
◆�1/2
(4)
where F is a scaling parameter for the effect of friction set at 0.8, since all the point of
interest to us are situated on land (this parameter is usually set equal to 1 for points over
water and to 0.8 for points over land); Vh is the wind velocity at the eye at landmark h, which
we linearly interpolate from the best track data; S is a scaling parameter for the asymmetry
due to the forward motion of the storm, set to 1 (i.e. peak wind speed on the right side
minus peak wind speed on the left side equals the forward velocity of the hurricane – Vf ,
as defined in Boose et al., 2001); T is the clockwise angle between the forward path of the
hurricane and a radial line connecting the eye of the hurricane to the population-weighted
centroid of a county; Vf is the forward velocity of the hurricane, i.e. the speed at which the
hurricane is moving forward; Rm is the radius of maximum winds, obtained from the best
track data; R is the radial (or Euclidean) distance from the center of the hurricane to the
population-weighted centroid of a county; and B is a scaling parameter controlling for the
shape of the wind profile curve (usually included between 1.2 and 1.5, and set at 1.35).
The parameters of this equation, adapted from Holland’s equation for the cyclostrophic
wind (Holland, 1980), have been set following Boose et al. (2004) that parameterized and
validated the model for Puerto Rico.
11Velocity and wind direction are measured relative to the surface of the Earth, and angles are measuredin degrees.
18

The Short-Run, Dynamic Employment Effects of
Natural Disasters: New Insights
ONLINE APPENDIX
June 2021
This appendix contains some supplementary material not inserted (due to space con-
straints) in the main text of Barattieri, Borda, Brugnoli, Pelli and Tschopp (2021).
A-1

A Hurricanes used for the baseline specification
In this Section, we report the names of the 23 hurricanes and storms we use in our baseline
specification, together with the year and month when they hit Puerto Rico and the maximum
category they reached according to the Simpson and Riehl scale.
Table A.1: Hurricanes
Name Year Month CategoryLuis 1995 9 4Marilyn 1995 9 4Bertha 1996 7 2-3Hortense 1996 9 4George 1998 9 3Jose 1999 10 TSLenny 1999 11 4Debby 2000 8 1Keith 2000 10 3Dean 2001 8 1Jeanne 2004 9 3Frances 2004 9 4Dean 2007 5 5Olga 2007 12 TSOmar 2008 10 4Earl 2010 8 4Irene 2011 8 3Karen 2013 10 TSGonzalo 2014 10 4Danny 2015 8 3Erika 2015 8 TSIrma 2017 9 5Maria 2017 9 5
Note: Category refers to the category corre-
sponding to the maximum windspeed reached
by the hurricane according to the Saffir-
Simpson wind scale. TS stands for tropical
storm.
A-2
B Puerto Rico
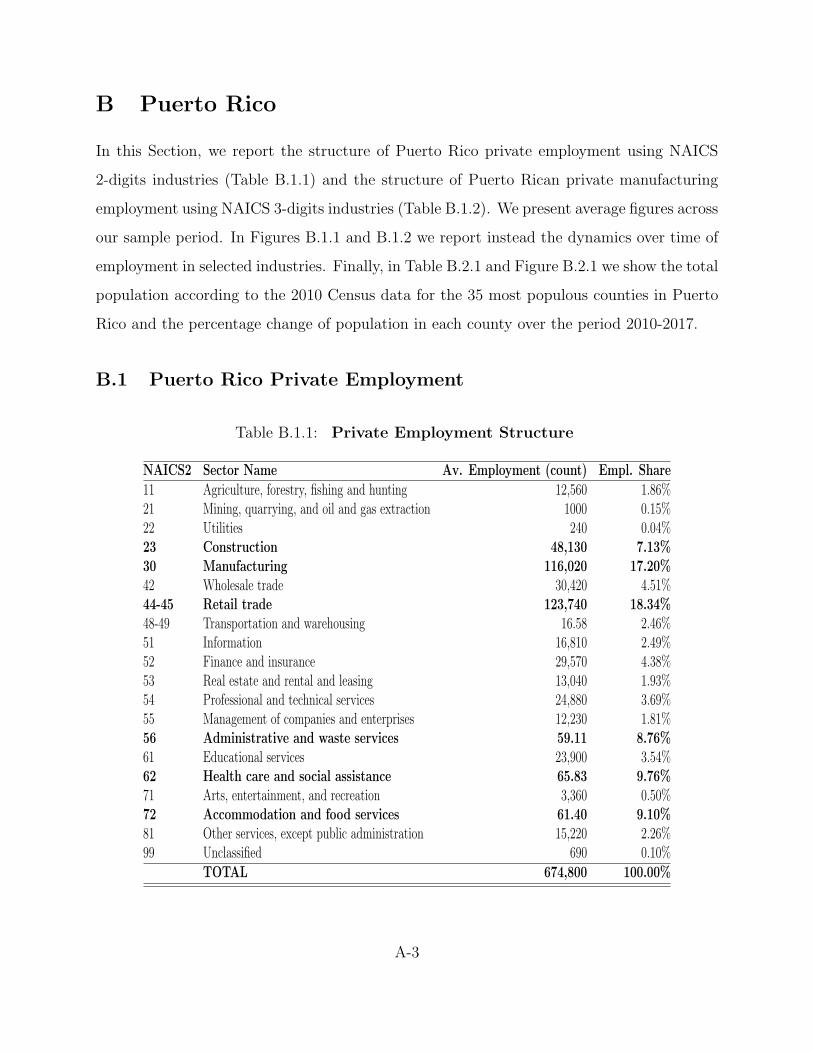
In this Section, we report the structure of Puerto Rico private employment using NAICS
2-digits industries (Table B.1.1) and the structure of Puerto Rican private manufacturing
employment using NAICS 3-digits industries (Table B.1.2). We present average figures across
our sample period. In Figures B.1.1 and B.1.2 we report instead the dynamics over time of
employment in selected industries. Finally, in Table B.2.1 and Figure B.2.1 we show the total
population according to the 2010 Census data for the 35 most populous counties in Puerto
Rico and the percentage change of population in each county over the period 2010-2017.
B.1 Puerto Rico Private Employment
Table B.1.1: Private Employment Structure
NAICS2 Sector Name Av. Employment (count) Empl. Share11 Agriculture, forestry, fishing and hunting 12,560 1.86%21 Mining, quarrying, and oil and gas extraction 1000 0.15%22 Utilities 240 0.04%23 Construction 48,130 7.13%30 Manufacturing 116,020 17.20%42 Wholesale trade 30,420 4.51%44-45 Retail trade 123,740 18.34%48-49 Transportation and warehousing 16.58 2.46%51 Information 16,810 2.49%52 Finance and insurance 29,570 4.38%53 Real estate and rental and leasing 13,040 1.93%54 Professional and technical services 24,880 3.69%55 Management of companies and enterprises 12,230 1.81%56 Administrative and waste services 59.11 8.76%61 Educational services 23,900 3.54%62 Health care and social assistance 65.83 9.76%71 Arts, entertainment, and recreation 3,360 0.50%72 Accommodation and food services 61.40 9.10%81 Other services, except public administration 15,220 2.26%99 Unclassified 690 0.10%
TOTAL 674,800 100.00%
A-3
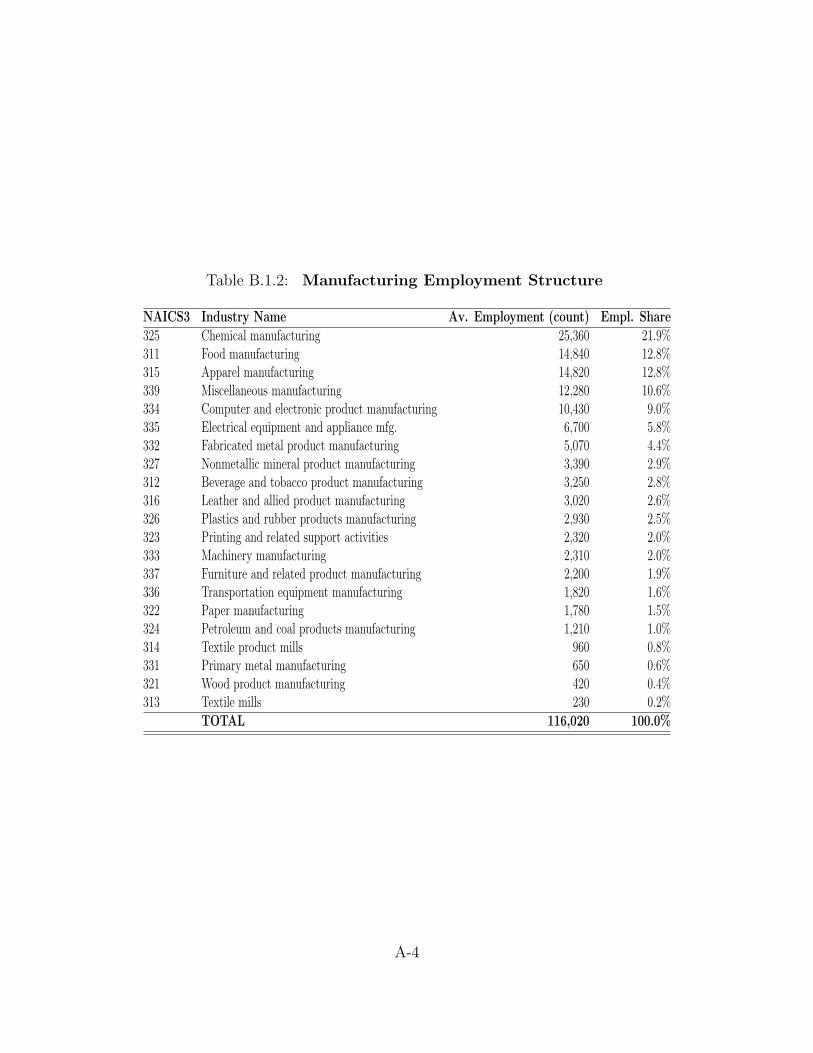
Table B.1.2: Manufacturing Employment Structure
NAICS3 Industry Name Av. Employment (count) Empl. Share325 Chemical manufacturing 25,360 21.9%311 Food manufacturing 14,840 12.8%315 Apparel manufacturing 14,820 12.8%339 Miscellaneous manufacturing 12,280 10.6%334 Computer and electronic product manufacturing 10,430 9.0%335 Electrical equipment and appliance mfg. 6,700 5.8%332 Fabricated metal product manufacturing 5,070 4.4%327 Nonmetallic mineral product manufacturing 3,390 2.9%312 Beverage and tobacco product manufacturing 3,250 2.8%316 Leather and allied product manufacturing 3,020 2.6%326 Plastics and rubber products manufacturing 2,930 2.5%323 Printing and related support activities 2,320 2.0%333 Machinery manufacturing 2,310 2.0%337 Furniture and related product manufacturing 2,200 1.9%336 Transportation equipment manufacturing 1,820 1.6%322 Paper manufacturing 1,780 1.5%324 Petroleum and coal products manufacturing 1,210 1.0%314 Textile product mills 960 0.8%331 Primary metal manufacturing 650 0.6%321 Wood product manufacturing 420 0.4%313 Textile mills 230 0.2%
TOTAL 116,020 100.0%
A-4

Figure B.1.1: Private Employment Dynamics (in thousands)
05
01
00
15
00
50
10
01
50
1995
m1
2003
m1
2011
m1
2019
m1
1995
m1
2003
m1
2011
m1
2019
m1
1995
m1
2003
m1
2011
m1
2019
m1
Construction Manufacturing Retail
Admin and Waste Serv. Health Accommodation
Figure B.1.2: Manufacturing Employment Dynamics (in thousands)
01
02
03
04
00
10
20
30
40
1995
m1
2003
m1
2011
m1
2019
m1
1995
m1
2003
m1
2011
m1
2019
m1
1995
m1
2003
m1
2011
m1
2019
m1
Food Manuf. Apparel Manuf. Chemical Manuf.
Fabbricated Metal Prod. Electronic Products Electrical Equipment
A-5
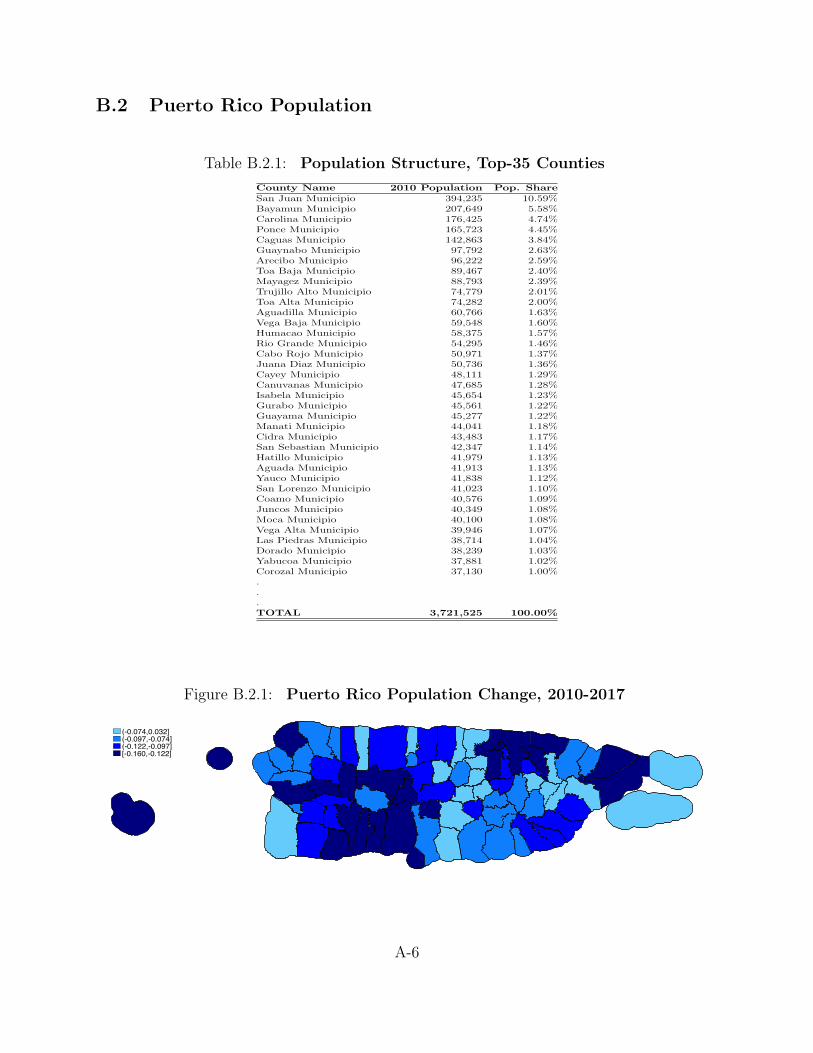
B.2 Puerto Rico Population
Table B.2.1: Population Structure, Top-35 Counties
County Name 2010 Population Pop. ShareSan Juan Municipio 394,235 10.59%Bayamun Municipio 207,649 5.58%Carolina Municipio 176,425 4.74%Ponce Municipio 165,723 4.45%Caguas Municipio 142,863 3.84%Guaynabo Municipio 97,792 2.63%Arecibo Municipio 96,222 2.59%Toa Baja Municipio 89,467 2.40%Mayagez Municipio 88,793 2.39%Trujillo Alto Municipio 74,779 2.01%Toa Alta Municipio 74,282 2.00%Aguadilla Municipio 60,766 1.63%Vega Baja Municipio 59,548 1.60%Humacao Municipio 58,375 1.57%Rio Grande Municipio 54,295 1.46%Cabo Rojo Municipio 50,971 1.37%Juana Diaz Municipio 50,736 1.36%Cayey Municipio 48,111 1.29%Canuvanas Municipio 47,685 1.28%Isabela Municipio 45,654 1.23%Gurabo Municipio 45,561 1.22%Guayama Municipio 45,277 1.22%Manati Municipio 44,041 1.18%Cidra Municipio 43,483 1.17%San Sebastian Municipio 42,347 1.14%Hatillo Municipio 41,979 1.13%Aguada Municipio 41,913 1.13%Yauco Municipio 41,838 1.12%San Lorenzo Municipio 41,023 1.10%Coamo Municipio 40,576 1.09%Juncos Municipio 40,349 1.08%Moca Municipio 40,100 1.08%Vega Alta Municipio 39,946 1.07%Las Piedras Municipio 38,714 1.04%Dorado Municipio 38,239 1.03%Yabucoa Municipio 37,881 1.02%Corozal Municipio 37,130 1.00%...TOTAL 3,721,525 100.00%
Figure B.2.1: Puerto Rico Population Change, 2010-2017
(-0.074,0.032](-0.097,-0.074](-0.122,-0.097][-0.160,-0.122]
A-6
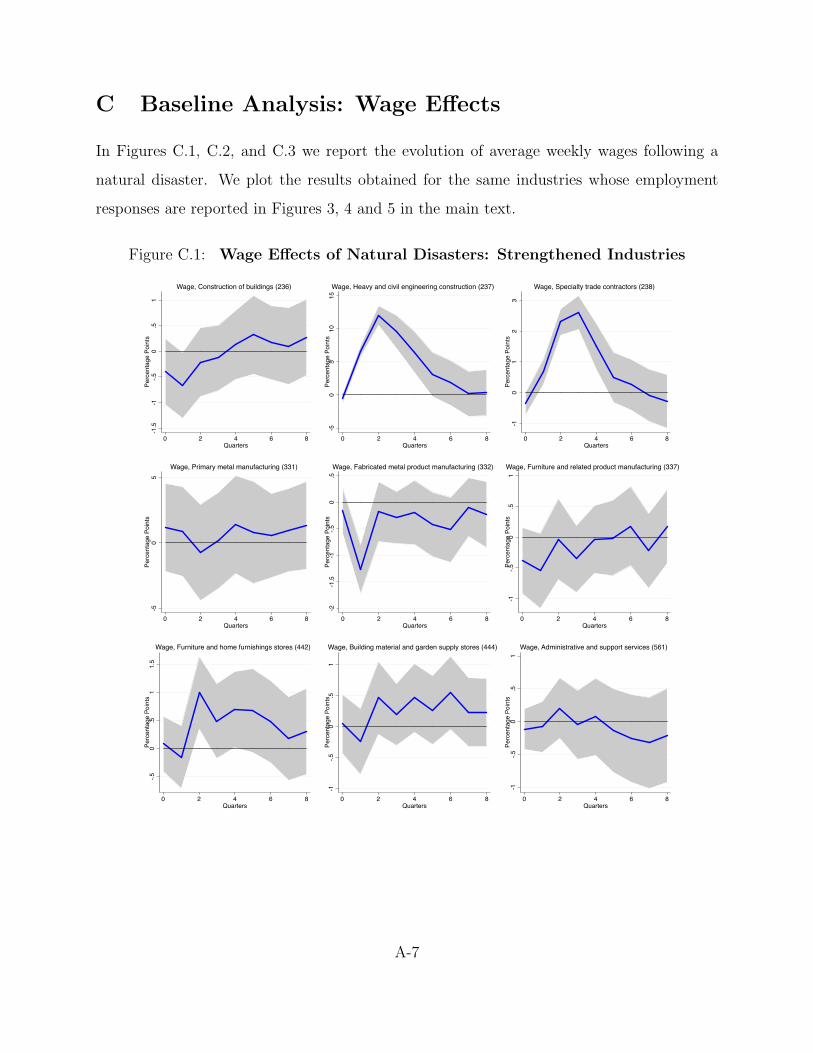
C Baseline Analysis: Wage Effects
In Figures C.1, C.2, and C.3 we report the evolution of average weekly wages following a
natural disaster. We plot the results obtained for the same industries whose employment
responses are reported in Figures 3, 4 and 5 in the main text.
Figure C.1: Wage Effects of Natural Disasters: Strengthened Industries
-1.5
-1-.
50
.51
Pe
rce
nta
ge
Po
ints
0 2 4 6 8Quarters
Wage, Construction of buildings (236)
-50
51
01
5P
erc
en
tag
e P
oin
ts
0 2 4 6 8Quarters
Wage, Heavy and civil engineering construction (237)
-10
12
3P
erc
en
tag
e P
oin
ts
0 2 4 6 8Quarters
Wage, Specialty trade contractors (238)
-50
5P
erc
en
tag
e P
oin
ts
0 2 4 6 8Quarters
Wage, Primary metal manufacturing (331)
-2-1
.5-1
-.5
0.5
Pe
rce
nta
ge
Po
ints
0 2 4 6 8Quarters
Wage, Fabricated metal product manufacturing (332)
-1-.
50
.51
Pe
rce
nta
ge
Po
ints
0 2 4 6 8Quarters
Wage, Furniture and related product manufacturing (337)
-.5
0.5
11
.5P
erc
en
tag
e P
oin
ts
0 2 4 6 8Quarters
Wage, Furniture and home furnishings stores (442)
-1-.
50
.51
Pe
rce
nta
ge
Po
ints
0 2 4 6 8Quarters
Wage, Building material and garden supply stores (444)
-1-.
50
.51
Pe
rce
nta
ge
Po
ints
0 2 4 6 8Quarters
Wage, Administrative and support services (561)
A-7

Figure C.2: Wage Effects of Natural Disasters: Weakened Industries
-2-1
01
2P
erc
en
tag
e P
oin
ts
0 2 4 6 8Quarters
Wage, Crop production (111)
-1-.
50
.51
Pe
rce
nta
ge
Po
ints
0 2 4 6 8Quarters
Wage, Animal production and aquaculture (112)
-1.5
-1-.
50
.51
Pe
rce
nta
ge
Po
ints
0 2 4 6 8Quarters
Wage, Printing and related support activities (323)
-.5
0.5
1P
erc
en
tag
e P
oin
ts
0 2 4 6 8Quarters
Wage, Clothing and clothing accessories stores (448)
-10
12
Pe
rce
nta
ge
Po
ints
0 2 4 6 8Quarters
Wage, Sporting goods, hobby, book and music stores (451)
-2-1
01
2P
erc
en
tag
e P
oin
ts
0 2 4 6 8Quarters
Wage, General merchandise stores (452)
-8-6
-4-2
02
Pe
rce
nta
ge
Po
ints
0 2 4 6 8Quarters
Wage, Scenic and sightseeing transportation (487)
-1-.
50
.51
Pe
rce
nta
ge
Po
ints
0 2 4 6 8Quarters
Wage, Accommodation (721)
-.5
0.5
1P
erc
en
tag
e P
oin
ts
0 2 4 6 8Quarters
Wage, Food services and drinking places (722)
A-8
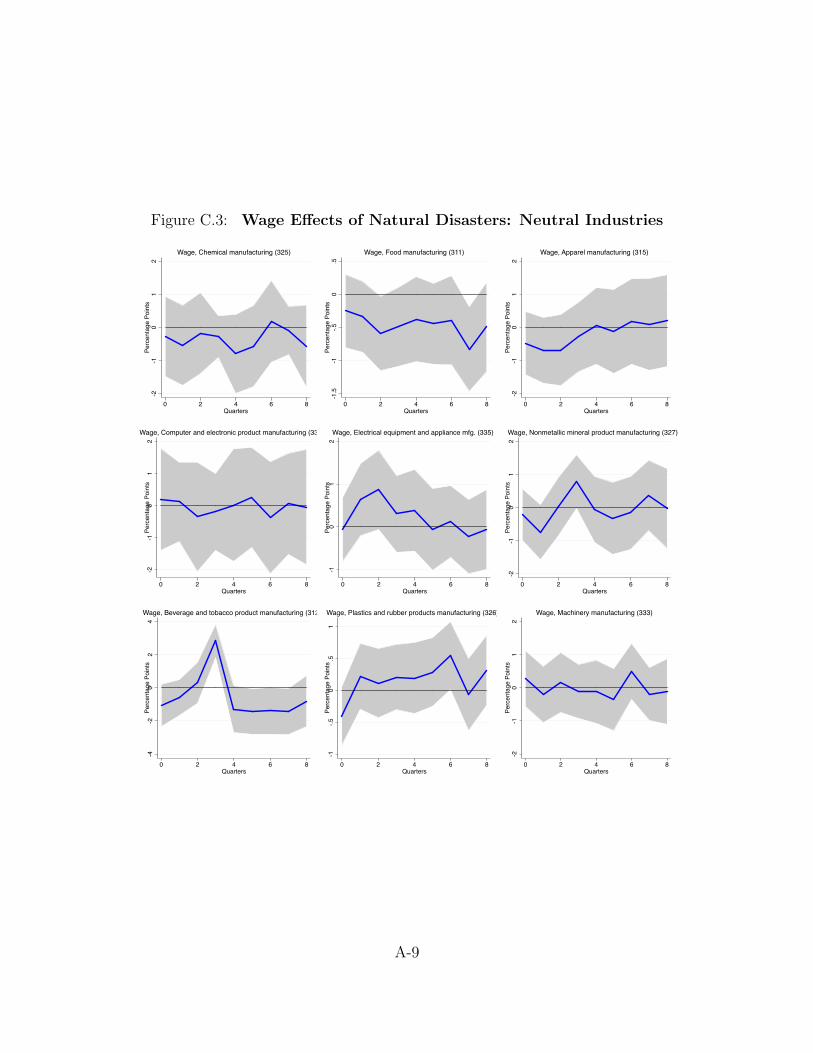
Figure C.3: Wage Effects of Natural Disasters: Neutral Industries
-2-1
01
2P
erc
en
tag
e P
oin
ts
0 2 4 6 8Quarters
Wage, Chemical manufacturing (325)
-1.5
-1-.
50
.5P
erc
en
tag
e P
oin
ts
0 2 4 6 8Quarters
Wage, Food manufacturing (311)
-2-1
01
2P
erc
en
tag
e P
oin
ts
0 2 4 6 8Quarters
Wage, Apparel manufacturing (315)
-2-1
01
2P
erc
en
tag
e P
oin
ts
0 2 4 6 8Quarters
Wage, Computer and electronic product manufacturing (334)
-10
12
Pe
rce
nta
ge
Po
ints
0 2 4 6 8Quarters
Wage, Electrical equipment and appliance mfg. (335)
-2-1
01
2P
erc
en
tag
e P
oin
ts
0 2 4 6 8Quarters
Wage, Nonmetallic mineral product manufacturing (327)
-4-2
02
4P
erc
en
tag
e P
oin
ts
0 2 4 6 8Quarters
Wage, Beverage and tobacco product manufacturing (312)
-1-.
50
.51
Pe
rce
nta
ge
Po
ints
0 2 4 6 8Quarters
Wage, Plastics and rubber products manufacturing (326)
-2-1
01
2P
erc
en
tag
e P
oin
ts
0 2 4 6 8Quarters
Wage, Machinery manufacturing (333)
A-9

D Robustness I: 64 Knots Threshold
Figures D.1, D.2, D.3, and D.4 report the equivalent of the analysis presented in the Figures
2-5 of the main text. Here we change the threshold used in equation 1 from 33 to 64 knots,
which defines a category 1 hurricanes according to the Simpson and Riehl scale. The results
are qualitatively similar to the one presented in the main paper.
Figure D.1: Employment Effects of Natural Disasters: Panel Results
-4-3
-2-1
01
Per
cent
age
Poi
nts
0 6 12 18 24Months
Employment, Panel Results (Geo, NAICS, Time FE)
-6-4
-20
2P
erce
ntag
e P
oint
s
0 1 2 3 4 5 6 7 8Quarters
Wages, Panel Results (Geo, NAICS, Time FE)
-4-3
-2-1
01
Per
cent
age
Poi
nts
0 6 12 18 24Months
Employment, Panel Results (Geo*NAICS, Time FE) -6
-4-2
02
Per
cent
age
Poi
nts
0 1 2 3 4 5 6 7 8Quarters
Wages, Panel Results (Geo*NAICS, Time FE)
-4-3
-2-1
01
Per
cent
age
Poi
nts
0 6 12 18 24Months
Employment, Panel Results (Geo, NAICS*Time FE)
-6-4
-20
2P
erce
ntag
e P
oint
s
0 1 2 3 4 5 6 7 8Quarters
Wages, Panel Results (Geo, NAICS*Time FE)
-4-3
-2-1
01
Per
cent
age
Poi
nts
0 6 12 18 24Months
Employment, Panel Results (Post 2010, pop)
-6-4
-20
2P
erce
ntag
e P
oint
s
0 1 2 3 4 5 6 7 8Quarters
Wages, Panel Results (Post 2010, pop)
A-10

Figure D.2: Employment Effects of Natural Disasters: Strengthened Industries
01
23
4P
erc
en
tag
e P
oin
ts
0 6 12 18 24Months
Construction of buildings (236)
01
23
45
Pe
rce
nta
ge
Po
ints
0 6 12 18 24Months
Heavy and civil engineering construction (237)
0.5
11
.52
2.5
Pe
rce
nta
ge
Po
ints
0 6 12 18 24Months
Specialty trade contractors (238)
-20
24
6P
erc
en
tag
e P
oin
ts
0 6 12 18 24Months
Primary metal manufacturing (331)
0.5
11
.52
2.5
Pe
rce
nta
ge
Po
ints
0 6 12 18 24Months
Fabricated metal product manufacturing (332)
-10
12
Pe
rce
nta
ge
Po
ints
0 6 12 18 24Months
Furniture and related product manufacturing (337)
-10
12
Pe
rce
nta
ge
Po
ints
0 6 12 18 24Months
Furniture and home furnishings stores (442)
-.5
0.5
11
.5P
erc
en
tag
e P
oin
ts
0 6 12 18 24Months
Building material and garden supply stores (444)
-.5
0.5
1P
erc
en
tag
e P
oin
ts
0 6 12 18 24Months
Administrative and support services (561)
A-11
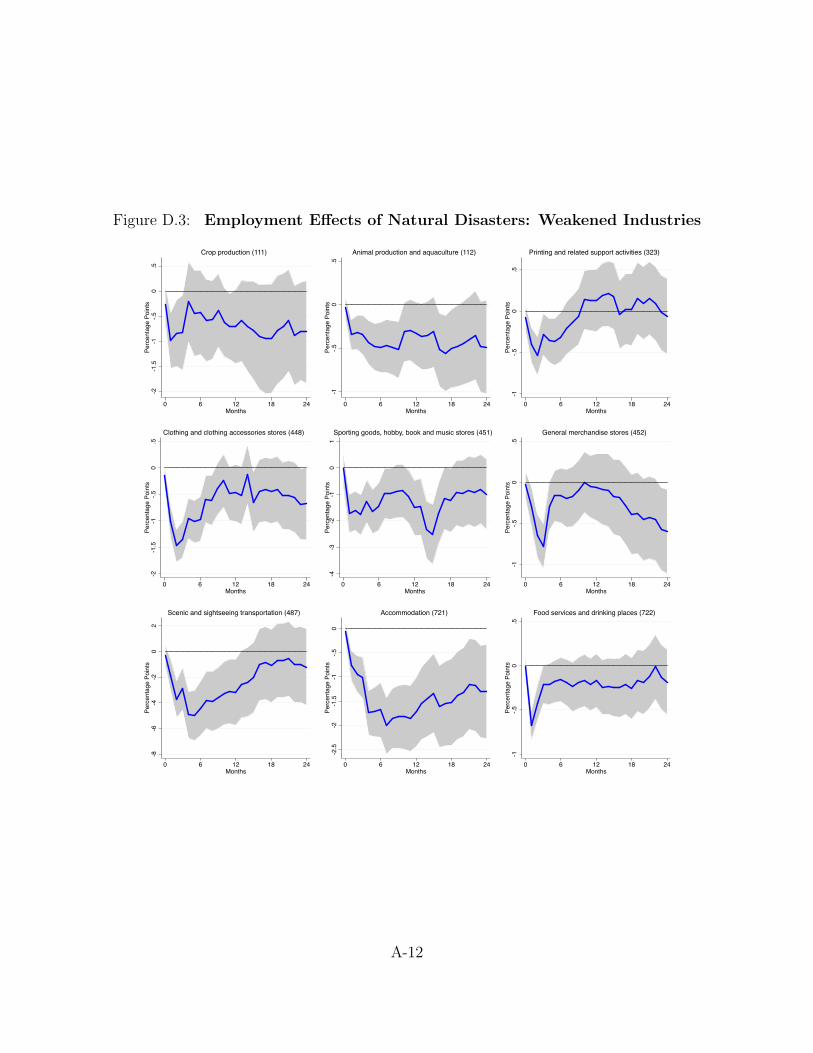
Figure D.3: Employment Effects of Natural Disasters: Weakened Industries
-2-1
.5-1
-.5
0.5
Pe
rce
nta
ge
Po
ints
0 6 12 18 24Months
Crop production (111)
-1-.
50
.5P
erc
en
tag
e P
oin
ts
0 6 12 18 24Months
Animal production and aquaculture (112)
-1-.
50
.5P
erc
en
tag
e P
oin
ts
0 6 12 18 24Months
Printing and related support activities (323)
-2-1
.5-1
-.5
0.5
Pe
rce
nta
ge
Po
ints
0 6 12 18 24Months
Clothing and clothing accessories stores (448)
-4-3
-2-1
01
Pe
rce
nta
ge
Po
ints
0 6 12 18 24Months
Sporting goods, hobby, book and music stores (451)
-1-.
50
.5P
erc
en
tag
e P
oin
ts
0 6 12 18 24Months
General merchandise stores (452)
-8-6
-4-2
02
Pe
rce
nta
ge
Po
ints
0 6 12 18 24Months
Scenic and sightseeing transportation (487)
-2.5
-2-1
.5-1
-.5
0P
erc
en
tag
e P
oin
ts
0 6 12 18 24Months
Accommodation (721)
-1-.
50
.5P
erc
en
tag
e P
oin
ts
0 6 12 18 24Months
Food services and drinking places (722)
A-12

Figure D.4: Employment Effects of Natural Disasters: Neutral Industries
-1-.
50
.51
Pe
rce
nta
ge
Po
ints
0 6 12 18 24Months
Chemical manufacturing (325)
-.5
0.5
1P
erc
en
tag
e P
oin
ts
0 6 12 18 24Months
Food manufacturing (311)
-20
24
6P
erc
en
tag
e P
oin
ts
0 6 12 18 24Months
Apparel manufacturing (315)
-10
12
3P
erc
en
tag
e P
oin
ts
0 6 12 18 24Months
Computer and electronic product manufacturing (334)
-1.5
-1-.
50
.51
Pe
rce
nta
ge
Po
ints
0 6 12 18 24Months
Electrical equipment and appliance mfg. (335)
-.5
0.5
11
.5P
erc
en
tag
e P
oin
ts
0 6 12 18 24Months
Nonmetallic mineral product manufacturing (327)
-1.5
-1-.
50
.51
Pe
rce
nta
ge
Po
ints
0 6 12 18 24Months
Beverage and tobacco product manufacturing (312)
-10
12
Pe
rce
nta
ge
Po
ints
0 6 12 18 24Months
Plastics and rubber products manufacturing (326)
-1-.
50
.51
1.5
Pe
rce
nta
ge
Po
ints
0 6 12 18 24Months
Machinery manufacturing (333)
A-13
E Robustness II: Depperman Formula
Figures E.1, E.2, E.3, and E.4 report the equivalent of the analysis presented in the Figures
2-5 of the main text. Here we change the formula used to compute wch, the wind speed at
each county c for each landmark h.We use here the classical Depperman formula instead of
the HURRECON model. The Depperman formula describes sustained wind velocity at any
point, in the specific case each population weighted centroid, in the following way:
wch = Vh ·
✓
Dch
26.9978
◆
if Dch ≤ 26.9978 wch = Vh ·
✓
26.9978
Dch
◆0.5
if Dch > 26.9978.
Dch is the radial distance of each county centroid from the landmark h and Vh the wind
speed at the landmark h. The number 26.9978 (50km) corresponds to Simpson and Riehl
radius of maximum wind speed. In general, the radius of maximum wind speed is computed
using the gap between the barometric pressure between the center and the outskirts of the
storm. Given the high number of missing measures of barometric pressure in the data, we
follow Simpson & Riehl (1981) and Hsu & Zhongde (1998) and use the average radius of
maximum windspeed (50 km) for all cyclones. The results are very similar to those reported
in the main text.
A-14
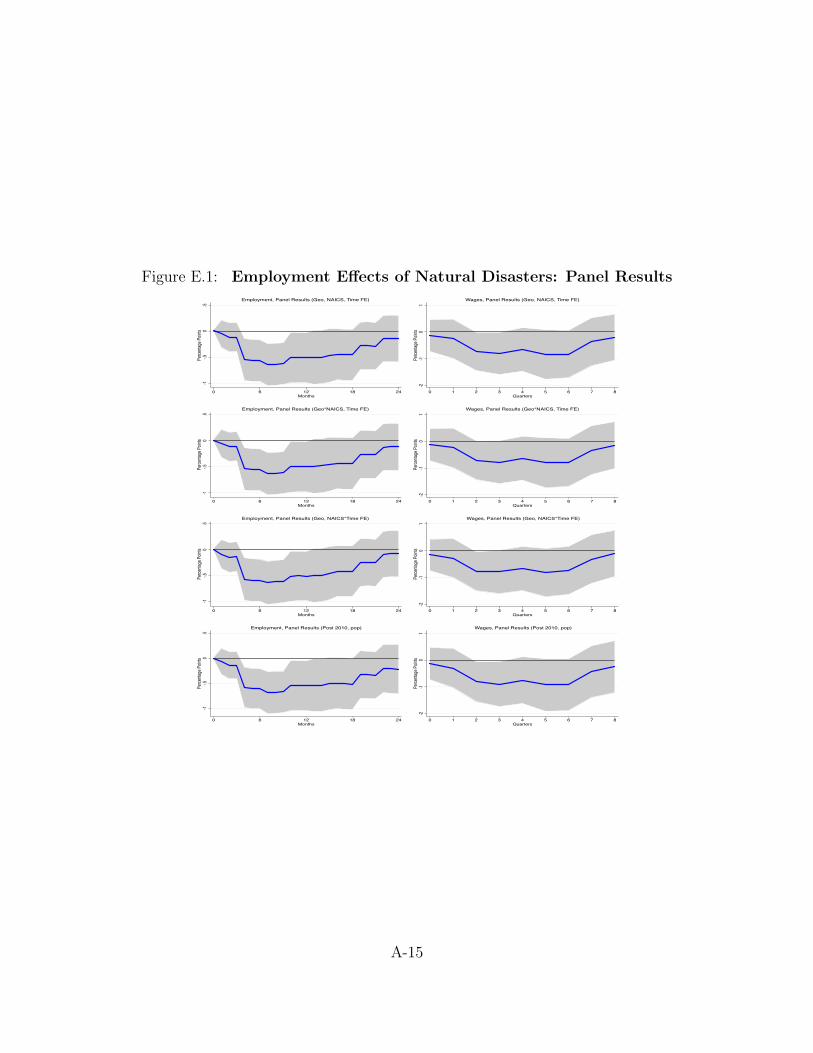
Figure E.1: Employment Effects of Natural Disasters: Panel Results
-1-.5
0.5
Per
cent
age
Poi
nts
0 6 12 18 24Months
Employment, Panel Results (Geo, NAICS, Time FE)
-2-1
01
Per
cent
age
Poi
nts
0 1 2 3 4 5 6 7 8Quarters
Wages, Panel Results (Geo, NAICS, Time FE)
-1-.5
0.5
Per
cent
age
Poi
nts
0 6 12 18 24Months
Employment, Panel Results (Geo*NAICS, Time FE)
-2-1
01
Per
cent
age
Poi
nts
0 1 2 3 4 5 6 7 8Quarters
Wages, Panel Results (Geo*NAICS, Time FE)
-1-.5
0.5
Per
cent
age
Poi
nts
0 6 12 18 24Months
Employment, Panel Results (Geo, NAICS*Time FE)
-2-1
01
Per
cent
age
Poi
nts
0 1 2 3 4 5 6 7 8Quarters
Wages, Panel Results (Geo, NAICS*Time FE)
-1-.5
0.5
Per
cent
age
Poi
nts
0 6 12 18 24Months
Employment, Panel Results (Post 2010, pop)
-2-1
01
Per
cent
age
Poi
nts
0 1 2 3 4 5 6 7 8Quarters
Wages, Panel Results (Post 2010, pop)
A-15
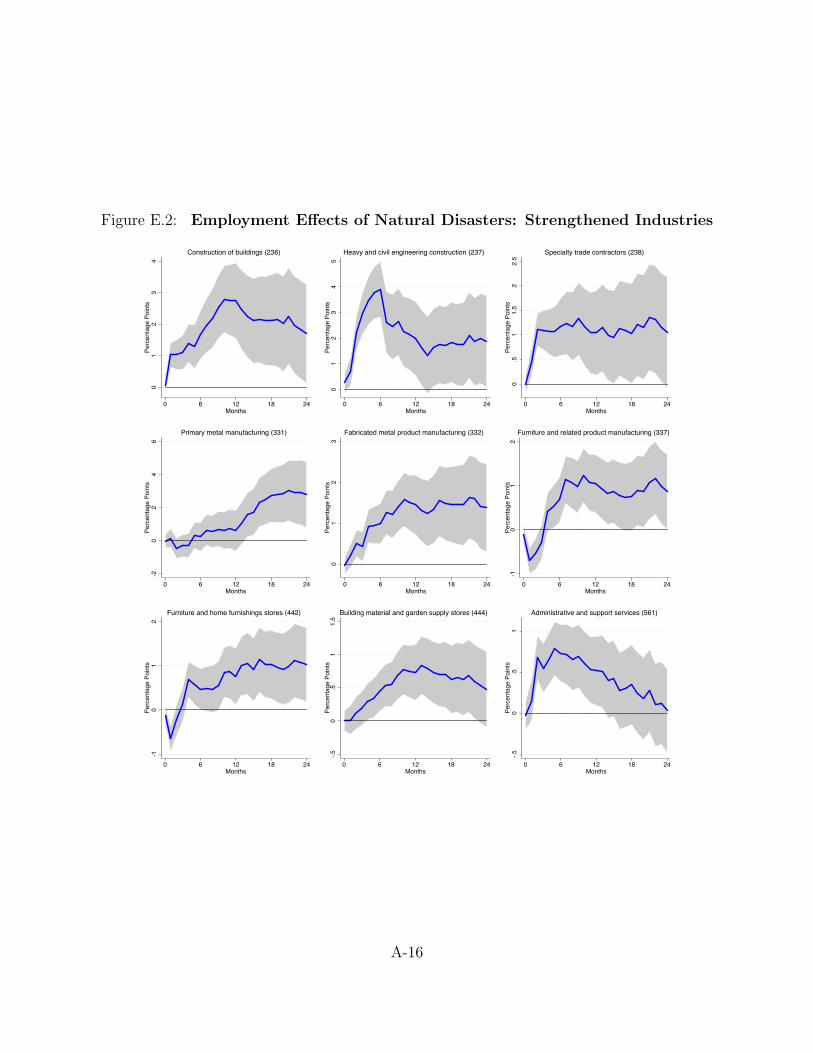
Figure E.2: Employment Effects of Natural Disasters: Strengthened Industries
01
23
4P
erc
en
tag
e P
oin
ts
0 6 12 18 24Months
Construction of buildings (236)
01
23
45
Pe
rce
nta
ge
Po
ints
0 6 12 18 24Months
Heavy and civil engineering construction (237)
0.5
11
.52
2.5
Pe
rce
nta
ge
Po
ints
0 6 12 18 24Months
Specialty trade contractors (238)
-20
24
6P
erc
en
tag
e P
oin
ts
0 6 12 18 24Months
Primary metal manufacturing (331)
01
23
Pe
rce
nta
ge
Po
ints
0 6 12 18 24Months
Fabricated metal product manufacturing (332)
-10
12
Pe
rce
nta
ge
Po
ints
0 6 12 18 24Months
Furniture and related product manufacturing (337)
-10
12
Pe
rce
nta
ge
Po
ints
0 6 12 18 24Months
Furniture and home furnishings stores (442)
-.5
0.5
11
.5P
erc
en
tag
e P
oin
ts
0 6 12 18 24Months
Building material and garden supply stores (444)
-.5
0.5
1P
erc
en
tag
e P
oin
ts
0 6 12 18 24Months
Administrative and support services (561)
A-16
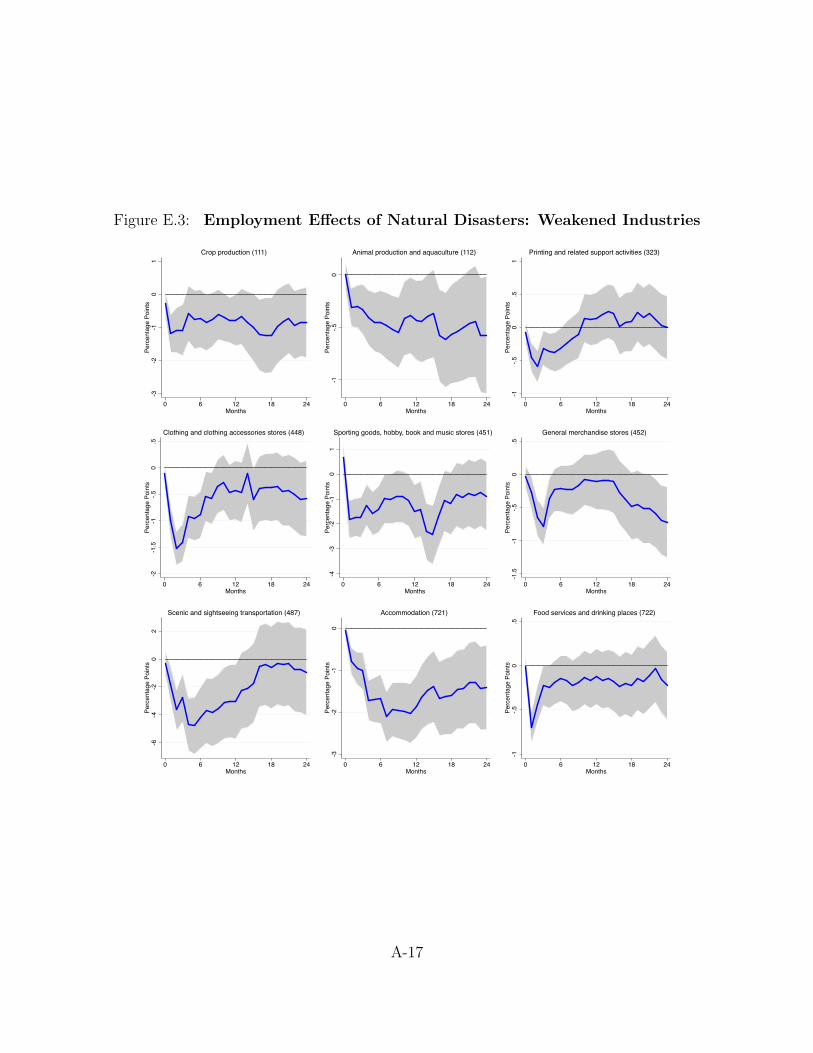
Figure E.3: Employment Effects of Natural Disasters: Weakened Industries
-3-2
-10
1P
erc
en
tag
e P
oin
ts
0 6 12 18 24Months
Crop production (111)
-1-.
50
Pe
rce
nta
ge
Po
ints
0 6 12 18 24Months
Animal production and aquaculture (112)
-1-.
50
.51
Pe
rce
nta
ge
Po
ints
0 6 12 18 24Months
Printing and related support activities (323)
-2-1
.5-1
-.5
0.5
Pe
rce
nta
ge
Po
ints
0 6 12 18 24Months
Clothing and clothing accessories stores (448)
-4-3
-2-1
01
Pe
rce
nta
ge
Po
ints
0 6 12 18 24Months
Sporting goods, hobby, book and music stores (451)
-1.5
-1-.
50
.5P
erc
en
tag
e P
oin
ts
0 6 12 18 24Months
General merchandise stores (452)
-6-4
-20
2P
erc
en
tag
e P
oin
ts
0 6 12 18 24Months
Scenic and sightseeing transportation (487)
-3-2
-10
Pe
rce
nta
ge
Po
ints
0 6 12 18 24Months
Accommodation (721)
-1-.
50
.5P
erc
en
tag
e P
oin
ts
0 6 12 18 24Months
Food services and drinking places (722)
A-17

Figure E.4: Employment Effects of Natural Disasters: Neutral Industries
-1-.
50
.51
Pe
rce
nta
ge
Po
ints
0 6 12 18 24Months
Chemical manufacturing (325)
-.5
0.5
1P
erc
en
tag
e P
oin
ts
0 6 12 18 24Months
Food manufacturing (311)
-20
24
6P
erc
en
tag
e P
oin
ts
0 6 12 18 24Months
Apparel manufacturing (315)
-10
12
3P
erc
en
tag
e P
oin
ts
0 6 12 18 24Months
Computer and electronic product manufacturing (334)
-1.5
-1-.
50
.51
Pe
rce
nta
ge
Po
ints
0 6 12 18 24Months
Electrical equipment and appliance mfg. (335)
-.5
0.5
11
.5P
erc
en
tag
e P
oin
ts
0 6 12 18 24Months
Nonmetallic mineral product manufacturing (327)
-1.5
-1-.
50
.51
Pe
rce
nta
ge
Po
ints
0 6 12 18 24Months
Beverage and tobacco product manufacturing (312)
-10
12
Pe
rce
nta
ge
Po
ints
0 6 12 18 24Months
Plastics and rubber products manufacturing (326)
-1-.
50
.51
1.5
Pe
rce
nta
ge
Po
ints
0 6 12 18 24Months
Machinery manufacturing (333)
A-18
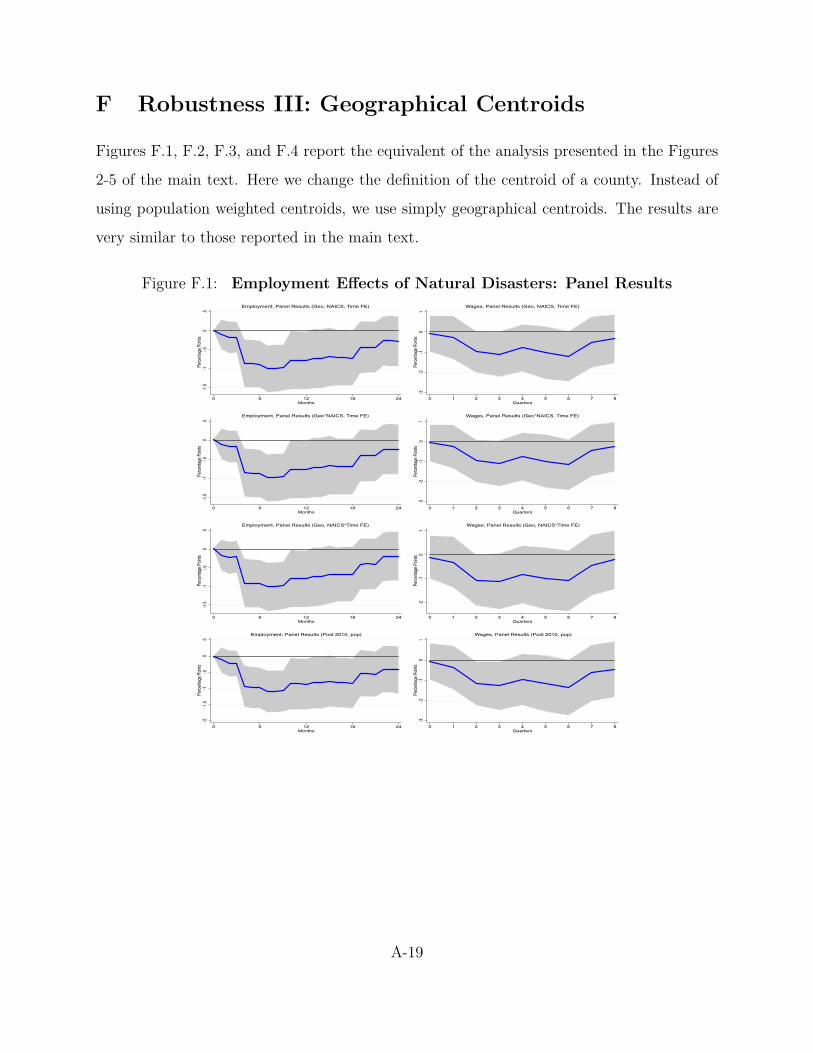
F Robustness III: Geographical Centroids
Figures F.1, F.2, F.3, and F.4 report the equivalent of the analysis presented in the Figures
2-5 of the main text. Here we change the definition of the centroid of a county. Instead of
using population weighted centroids, we use simply geographical centroids. The results are
very similar to those reported in the main text.
Figure F.1: Employment Effects of Natural Disasters: Panel Results
-1.5
-1-.5
0.5
Per
cent
age
Poi
nts
0 6 12 18 24Months
Employment, Panel Results (Geo, NAICS, Time FE)
-3-2
-10
1P
erce
ntag
e P
oint
s
0 1 2 3 4 5 6 7 8Quarters
Wages, Panel Results (Geo, NAICS, Time FE)
-1.5
-1-.5
0.5
Per
cent
age
Poi
nts
0 6 12 18 24Months
Employment, Panel Results (Geo*NAICS, Time FE) -3
-2-1
01
Per
cent
age
Poi
nts
0 1 2 3 4 5 6 7 8Quarters
Wages, Panel Results (Geo*NAICS, Time FE)
-1.5
-1-.5
0.5
Per
cent
age
Poi
nts
0 6 12 18 24Months
Employment, Panel Results (Geo, NAICS*Time FE)
-2-1
01
Per
cent
age
Poi
nts
0 1 2 3 4 5 6 7 8Quarters
Wages, Panel Results (Geo, NAICS*Time FE)
-2-1
.5-1
-.50
.5P
erce
ntag
e P
oint
s
0 6 12 18 24Months
Employment, Panel Results (Post 2010, pop)
-3-2
-10
1P
erce
ntag
e P
oint
s
0 1 2 3 4 5 6 7 8Quarters
Wages, Panel Results (Post 2010, pop)
A-19
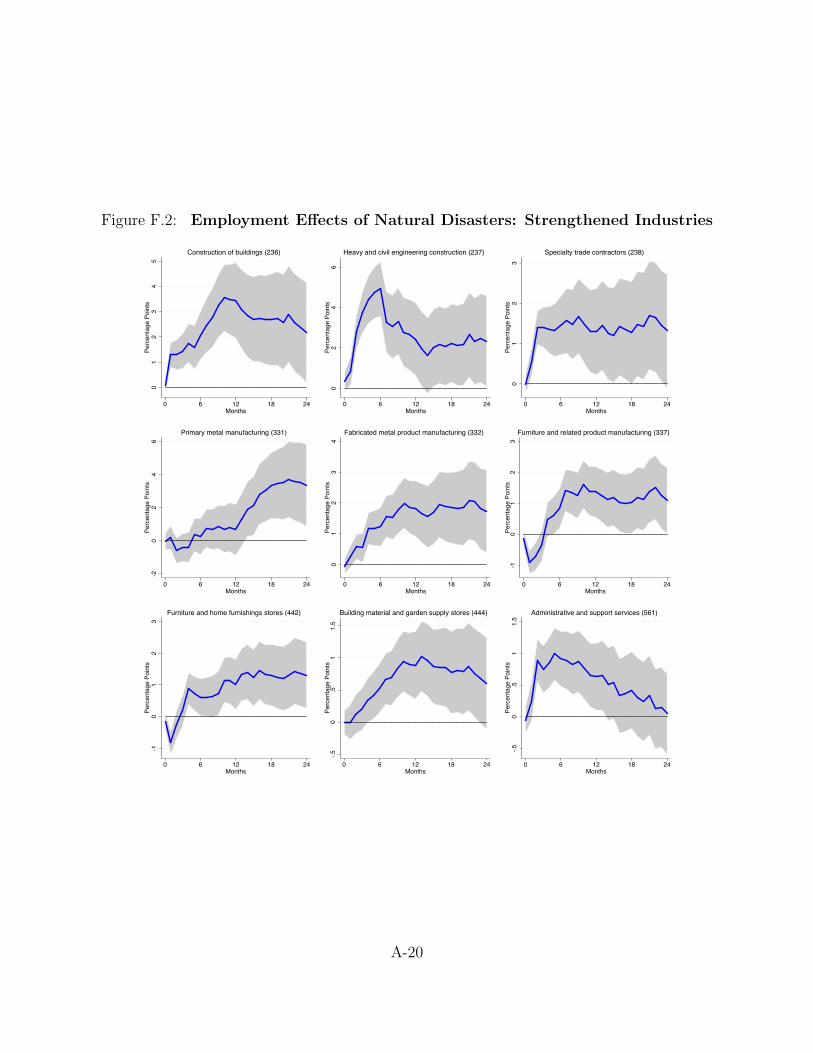
Figure F.2: Employment Effects of Natural Disasters: Strengthened Industries
01
23
45
Pe
rce
nta
ge
Po
ints
0 6 12 18 24Months
Construction of buildings (236)
02
46
Pe
rce
nta
ge
Po
ints
0 6 12 18 24Months
Heavy and civil engineering construction (237)
01
23
Pe
rce
nta
ge
Po
ints
0 6 12 18 24Months
Specialty trade contractors (238)
-20
24
6P
erc
en
tag
e P
oin
ts
0 6 12 18 24Months
Primary metal manufacturing (331)
01
23
4P
erc
en
tag
e P
oin
ts
0 6 12 18 24Months
Fabricated metal product manufacturing (332)
-10
12
3P
erc
en
tag
e P
oin
ts
0 6 12 18 24Months
Furniture and related product manufacturing (337)
-10
12
3P
erc
en
tag
e P
oin
ts
0 6 12 18 24Months
Furniture and home furnishings stores (442)
-.5
0.5
11
.5P
erc
en
tag
e P
oin
ts
0 6 12 18 24Months
Building material and garden supply stores (444)
-.5
0.5
11
.5P
erc
en
tag
e P
oin
ts
0 6 12 18 24Months
Administrative and support services (561)
A-20
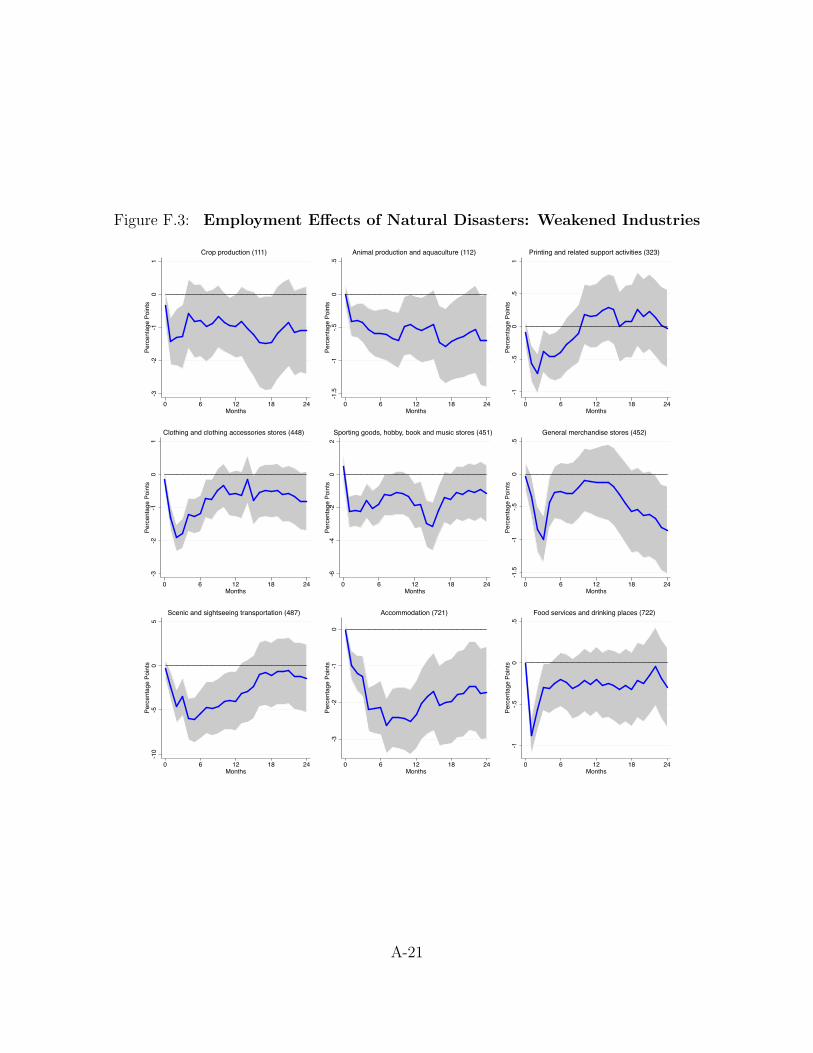
Figure F.3: Employment Effects of Natural Disasters: Weakened Industries
-3-2
-10
1P
erc
en
tag
e P
oin
ts
0 6 12 18 24Months
Crop production (111)
-1.5
-1-.
50
.5P
erc
en
tag
e P
oin
ts
0 6 12 18 24Months
Animal production and aquaculture (112)
-1-.
50
.51
Pe
rce
nta
ge
Po
ints
0 6 12 18 24Months
Printing and related support activities (323)
-3-2
-10
1P
erc
en
tag
e P
oin
ts
0 6 12 18 24Months
Clothing and clothing accessories stores (448)
-6-4
-20
2P
erc
en
tag
e P
oin
ts
0 6 12 18 24Months
Sporting goods, hobby, book and music stores (451)
-1.5
-1-.
50
.5P
erc
en
tag
e P
oin
ts
0 6 12 18 24Months
General merchandise stores (452)
-10
-50
5P
erc
en
tag
e P
oin
ts
0 6 12 18 24Months
Scenic and sightseeing transportation (487)
-3-2
-10
Pe
rce
nta
ge
Po
ints
0 6 12 18 24Months
Accommodation (721)
-1-.
50
.5P
erc
en
tag
e P
oin
ts
0 6 12 18 24Months
Food services and drinking places (722)
A-21

Figure F.4: Employment Effects of Natural Disasters: Neutral Industries
-1.5
-1-.
50
.51
Pe
rce
nta
ge
Po
ints
0 6 12 18 24Months
Chemical manufacturing (325)
-.5
0.5
11
.5P
erc
en
tag
e P
oin
ts
0 6 12 18 24Months
Food manufacturing (311)
-20
24
68
Pe
rce
nta
ge
Po
ints
0 6 12 18 24Months
Apparel manufacturing (315)
-10
12
3P
erc
en
tag
e P
oin
ts
0 6 12 18 24Months
Computer and electronic product manufacturing (334)
-2-1
01
2P
erc
en
tag
e P
oin
ts
0 6 12 18 24Months
Electrical equipment and appliance mfg. (335)
-10
12
Pe
rce
nta
ge
Po
ints
0 6 12 18 24Months
Nonmetallic mineral product manufacturing (327)
-2-1
01
Pe
rce
nta
ge
Po
ints
0 6 12 18 24Months
Beverage and tobacco product manufacturing (312)
-10
12
3P
erc
en
tag
e P
oin
ts
0 6 12 18 24Months
Plastics and rubber products manufacturing (326)
-1-.
50
.51
1.5
Pe
rce
nta
ge
Po
ints
0 6 12 18 24Months
Machinery manufacturing (333)
A-22

References
Hsu, S. & Zhongde, Y. (1998). A Note on the Radius of Maximum Wind for Hurricanes.Journal of Coastal Research, 14(2), 667–668.
Simpson, R. & Riehl, H. (1981). The Hurricane and Its Impact. Louisiana State UniversityPress.
A-23