
THE SAGUENAY FJORD: INTEGRATING MARINE GEOTECHNICAL … 20_6.pdf · THE SAGUENAY FJORD: INTEGRATING...
8
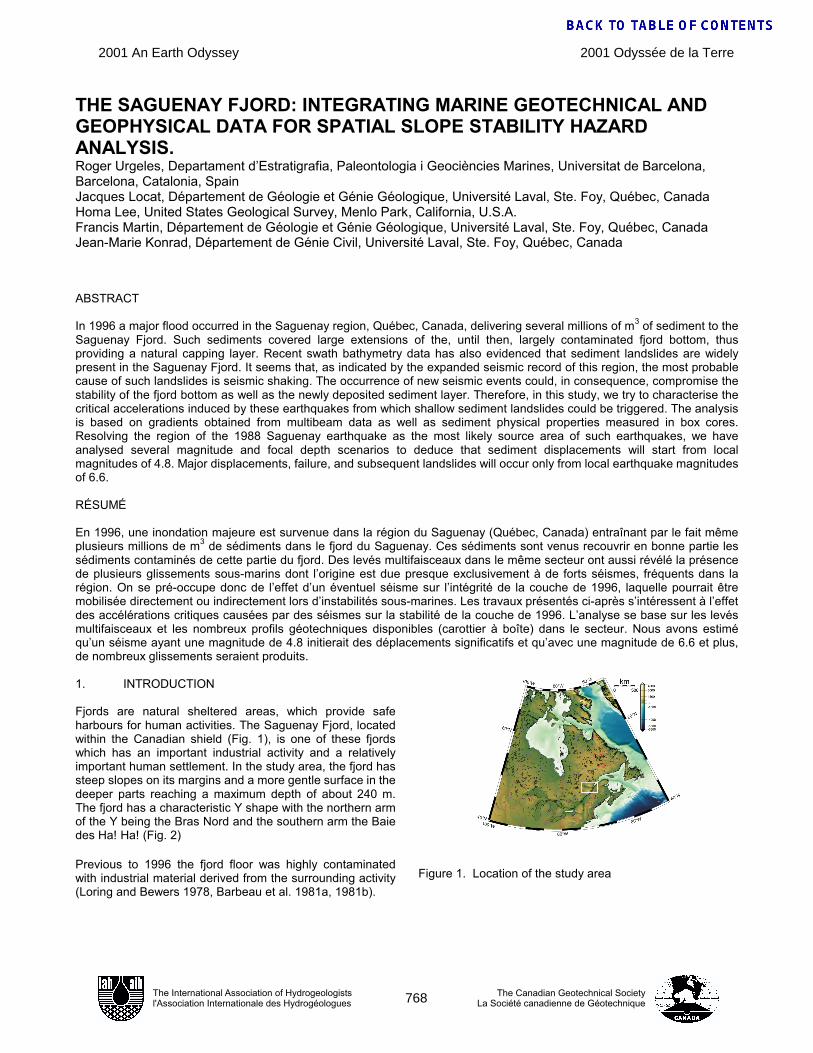
THE SAGUENAY FJORD: INTEGRATING MARINE GEOTECHNICAL AND GEOPHYSICAL DATA FOR SPATIAL SLOPE STABILITY HAZARD ANALYSIS. Roger Urgeles, Departament d’Estratigrafia, Paleontologia i Geociències Marines, Universitat de Barcelona, Barcelona, Catalonia, Spain Jacques Locat, Département de Géologie et Génie Géologique, Université Laval, Ste. Foy, Québec, Canada Homa Lee, United States Geological Survey, Menlo Park, California, U.S.A. Francis Martin, Département de Géologie et Génie Géologique, Université Laval, Ste. Foy, Québec, Canada Jean-Marie Konrad, Département de Génie Civil, Université Laval, Ste. Foy, Québec, Canada ABSTRACT In 1996 a major flood occurred in the Saguenay region, Québec, Canada, delivering several millions of m 3 of sediment to the Saguenay Fjord. Such sediments covered large extensions of the, until then, largely contaminated fjord bottom, thus providing a natural capping layer. Recent swath bathymetry data has also evidenced that sediment landslides are widely present in the Saguenay Fjord. It seems that, as indicated by the expanded seismic record of this region, the most probable cause of such landslides is seismic shaking. The occurrence of new seismic events could, in consequence, compromise the stability of the fjord bottom as well as the newly deposited sediment layer. Therefore, in this study, we try to characterise the critical accelerations induced by these earthquakes from which shallow sediment landslides could be triggered. The analysis is based on gradients obtained from multibeam data as well as sediment physical properties measured in box cores. Resolving the region of the 1988 Saguenay earthquake as the most likely source area of such earthquakes, we have analysed several magnitude and focal depth scenarios to deduce that sediment displacements will start from local magnitudes of 4.8. Major displacements, failure, and subsequent landslides will occur only from local earthquake magnitudes of 6.6. RÉSUMÉ En 1996, une inondation majeure est survenue dans la région du Saguenay (Québec, Canada) entraînant par le fait même plusieurs millions de m 3 de sédiments dans le fjord du Saguenay. Ces sédiments sont venus recouvrir en bonne partie les sédiments contaminés de cette partie du fjord. Des levés multifaisceaux dans le même secteur ont aussi révélé la présence de plusieurs glissements sous-marins dont l’origine est due presque exclusivement à de forts séismes, fréquents dans la région. On se pré-occupe donc de l’effet d’un éventuel séisme sur l’intégrité de la couche de 1996, laquelle pourrait être mobilisée directement ou indirectement lors d’instabilités sous-marines. Les travaux présentés ci-après s’intéressent à l’effet des accélérations critiques causées par des séismes sur la stabilité de la couche de 1996. L’analyse se base sur les levés multifaisceaux et les nombreux profils géotechniques disponibles (carottier à boîte) dans le secteur. Nous avons estimé qu’un séisme ayant une magnitude de 4.8 initierait des déplacements significatifs et qu’avec une magnitude de 6.6 et plus, de nombreux glissements seraient produits. 1. INTRODUCTION Fjords are natural sheltered areas, which provide safe harbours for human activities. The Saguenay Fjord, located within the Canadian shield (Fig. 1), is one of these fjords which has an important industrial activity and a relatively important human settlement. In the study area, the fjord has steep slopes on its margins and a more gentle surface in the deeper parts reaching a maximum depth of about 240 m. The fjord has a characteristic Y shape with the northern arm of the Y being the Bras Nord and the southern arm the Baie des Ha! Ha! (Fig. 2) Previous to 1996 the fjord floor was highly contaminated with industrial material derived from the surrounding activity (Loring and Bewers 1978, Barbeau et al. 1981a, 1981b). Figure 1. Location of the study area The International Association of Hydrogeologists l'Association Internationale des Hydrogéologues The Canadian Geotechnical Society La Société canadienne de Géotechnique 2001 Odyssée de la Terre 2001 An Earth Odyssey 768 AN EARTH ODDITY - BY RACHEL, JAMIE & TAI
Transcript of THE SAGUENAY FJORD: INTEGRATING MARINE GEOTECHNICAL … 20_6.pdf · THE SAGUENAY FJORD: INTEGRATING...
THE SAGUENAY FJORD: INTEGRATING MARINE GEOTECHNICAL AND GEOPHYSICAL DATA FOR SPATIAL SLOPE STABILITY HAZARD ANALYSIS. Roger Urgeles, Departament d’Estratigrafia, Paleontologia i Geociències Marines, Universitat de Barcelona, Barcelona, Catalonia, Spain Jacques Locat, Département de Géologie et Génie Géologique, Université Laval, Ste. Foy, Québec, Canada Homa Lee, United States Geological Survey, Menlo Park, California, U.S.A. Francis Martin, Département de Géologie et Génie Géologique, Université Laval, Ste. Foy, Québec, Canada Jean-Marie Konrad, Département de Génie Civil, Université Laval, Ste. Foy, Québec, Canada ABSTRACT In 1996 a major flood occurred in the Saguenay region, Québec, Canada, delivering several millions of m3 of sediment to the Saguenay Fjord. Such sediments covered large extensions of the, until then, largely contaminated fjord bottom, thus providing a natural capping layer. Recent swath bathymetry data has also evidenced that sediment landslides are widely present in the Saguenay Fjord. It seems that, as indicated by the expanded seismic record of this region, the most probable cause of such landslides is seismic shaking. The occurrence of new seismic events could, in consequence, compromise the stability of the fjord bottom as well as the newly deposited sediment layer. Therefore, in this study, we try to characterise the critical accelerations induced by these earthquakes from which shallow sediment landslides could be triggered. The analysis is based on gradients obtained from multibeam data as well as sediment physical properties measured in box cores. Resolving the region of the 1988 Saguenay earthquake as the most likely source area of such earthquakes, we have analysed several magnitude and focal depth scenarios to deduce that sediment displacements will start from local magnitudes of 4.8. Major displacements, failure, and subsequent landslides will occur only from local earthquake magnitudes of 6.6. RÉSUMÉ En 1996, une inondation majeure est survenue dans la région du Saguenay (Québec, Canada) entraînant par le fait même plusieurs millions de m3 de sédiments dans le fjord du Saguenay. Ces sédiments sont venus recouvrir en bonne partie les sédiments contaminés de cette partie du fjord. Des levés multifaisceaux dans le même secteur ont aussi révélé la présence de plusieurs glissements sous-marins dont l’origine est due presque exclusivement à de forts séismes, fréquents dans la région. On se pré-occupe donc de l’effet d’un éventuel séisme sur l’intégrité de la couche de 1996, laquelle pourrait être mobilisée directement ou indirectement lors d’instabilités sous-marines. Les travaux présentés ci-après s’intéressent à l’effet des accélérations critiques causées par des séismes sur la stabilité de la couche de 1996. L’analyse se base sur les levés multifaisceaux et les nombreux profils géotechniques disponibles (carottier à boîte) dans le secteur. Nous avons estimé qu’un séisme ayant une magnitude de 4.8 initierait des déplacements significatifs et qu’avec une magnitude de 6.6 et plus, de nombreux glissements seraient produits. 1. INTRODUCTION Fjords are natural sheltered areas, which provide safe harbours for human activities. The Saguenay Fjord, located within the Canadian shield (Fig. 1), is one of these fjords which has an important industrial activity and a relatively important human settlement. In the study area, the fjord has steep slopes on its margins and a more gentle surface in the deeper parts reaching a maximum depth of about 240 m. The fjord has a characteristic Y shape with the northern arm of the Y being the Bras Nord and the southern arm the Baie des Ha! Ha! (Fig. 2) Previous to 1996 the fjord floor was highly contaminated with industrial material derived from the surrounding activity (Loring and Bewers 1978, Barbeau et al. 1981a, 1981b).
Figure 1. Location of the study area
The International Association of Hydrogeologistsl'Association Internationale des Hydrogéologues
The Canadian Geotechnical SocietyLa Société canadienne de Géotechnique
2001 Odyssée de la Terre2001 An Earth Odyssey
768
AN
EA
RTH
OD
DIT
Y - B
Y R
AC
HEL
, JA
MIE
& T
AI
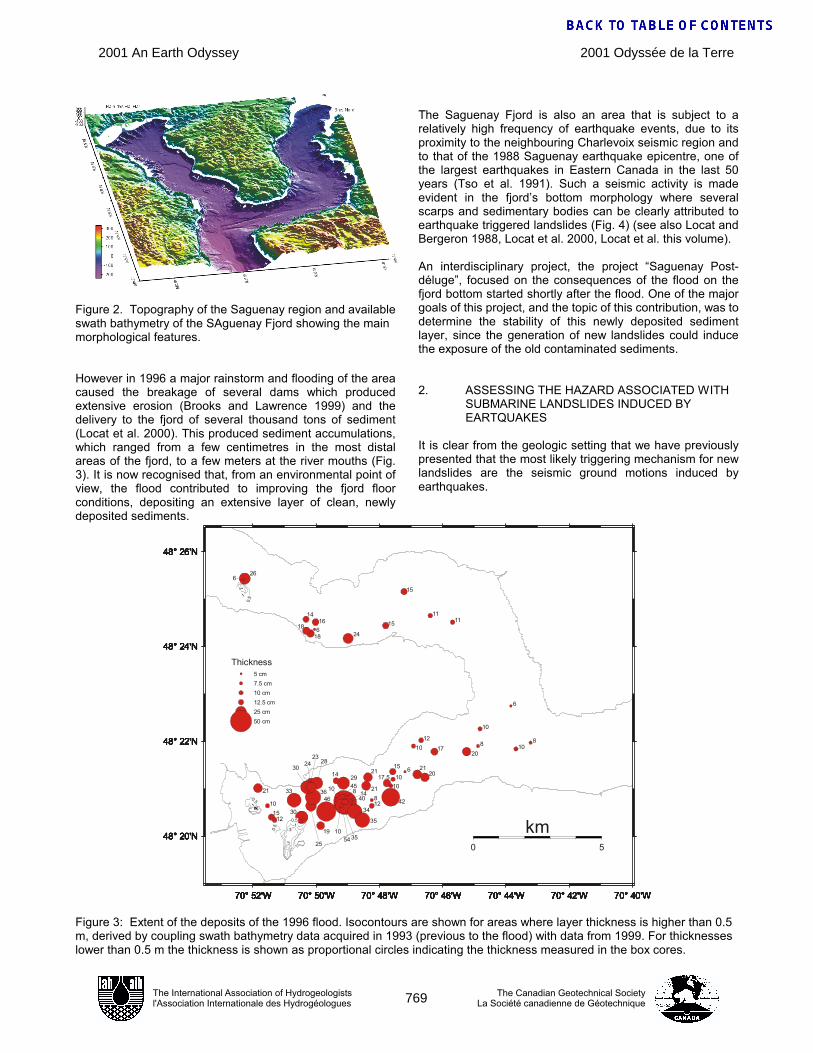
Figure 2. Topography of the Saguenay region and available swath bathymetry of the SAguenay Fjord showing the main morphological features. However in 1996 a major rainstorm and flooding of the area caused the breakage of several dams which produced extensive erosion (Brooks and Lawrence 1999) and the delivery to the fjord of several thousand tons of sediment (Locat et al. 2000). This produced sediment accumulations, which ranged from a few centimetres in the most distal areas of the fjord, to a few meters at the river mouths (Fig. 3). It is now recognised that, from an environmental point of view, the flood contributed to improving the fjord floor conditions, depositing an extensive layer of clean, newly deposited sediments.
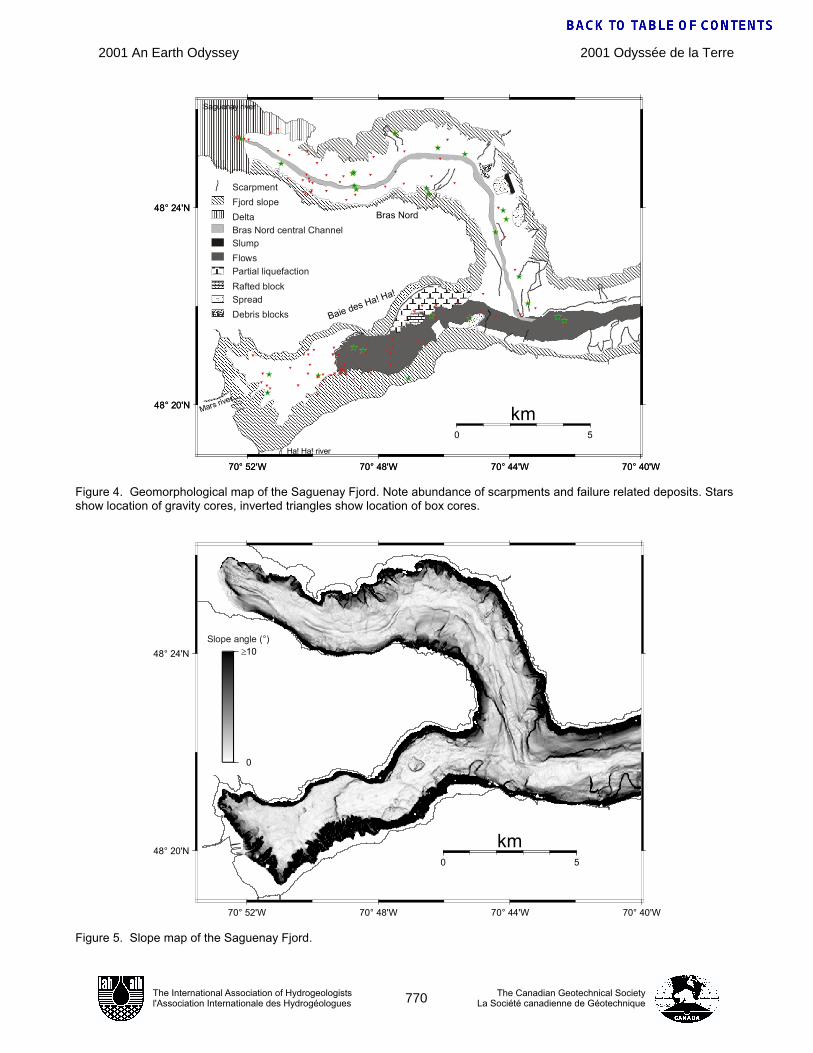
The Saguenay Fjord is also an area that is subject to a relatively high frequency of earthquake events, due to its proximity to the neighbouring Charlevoix seismic region and to that of the 1988 Saguenay earthquake epicentre, one of the largest earthquakes in Eastern Canada in the last 50 years (Tso et al. 1991). Such a seismic activity is made evident in the fjord’s bottom morphology where several scarps and sedimentary bodies can be clearly attributed to earthquake triggered landslides (Fig. 4) (see also Locat and Bergeron 1988, Locat et al. 2000, Locat et al. this volume). An interdisciplinary project, the project “Saguenay Post-déluge”, focused on the consequences of the flood on the fjord bottom started shortly after the flood. One of the major goals of this project, and the topic of this contribution, was to determine the stability of this newly deposited sediment layer, since the generation of new landslides could induce the exposure of the old contaminated sediments. 2. ASSESSING THE HAZARD ASSOCIATED WITH
SUBMARINE LANDSLIDES INDUCED BY EARTQUAKES
It is clear from the geologic setting that we have previously presented that the most likely triggering mechanism for new landslides are the seismic ground motions induced by earthquakes.
70° 52'W 70° 50'W 70° 48'W 70° 46'W 70° 44'W 70° 42'W 70° 40'W
48° 20'N
48° 22'N
48° 24'N
48° 26'N
70° 52'W 70° 50'W 70° 48'W 70° 46'W 70° 44'W 70° 42'W 70° 40'W
48° 20'N
48° 22'N
48° 24'N
48° 26'N
70° 52'W 70° 50'W 70° 48'W 70° 46'W 70° 44'W 70° 42'W 70° 40'W
48° 20'N
48° 22'N
48° 24'N
48° 26'N
70° 52'W 70° 50'W 70° 48'W 70° 46'W 70° 44'W 70° 42'W 70° 40'W
48° 20'N
48° 22'N
48° 24'N
48° 26'N
6
54
34
2921
10
20
812
17
4210
33
30
23
25
19
12
21
2115
20
10
10
28
3646
45
10
40
35
8
1010
14
35
10
15
30
8
8
21
12
24
14
6
6
6
17.5
15
18
15
1111
24
26
1416
18
70° 52'W 70° 50'W 70° 48'W 70° 46'W 70° 44'W 70° 42'W 70° 40'W
48° 20'N
48° 22'N
48° 24'N
48° 26'N
70° 52'W 70° 50'W 70° 48'W 70° 46'W 70° 44'W 70° 42'W 70° 40'W
48° 20'N
48° 22'N
48° 24'N
48° 26'N
0 5
km
70° 52'W 70° 50'W 70° 48'W 70° 46'W 70° 44'W 70° 42'W 70° 40'W
48° 20'N
48° 22'N
48° 24'N
48° 26'N
70° 52'W 70° 50'W 70° 48'W 70° 46'W 70° 44'W 70° 42'W 70° 40'W
48° 20'N
48° 22'N
48° 24'N
48° 26'N
5 cm7.5 cm10 cm12.5 cm25 cm50 cm
70° 52'W 70° 50'W 70° 48'W 70° 46'W 70° 44'W 70° 42'W 70° 40'W
48° 20'N
48° 22'N
48° 24'N
48° 26'N
0.5
0.5
0.5
0.5
1
1
Thickness
Figure 3: Extent of the deposits of the 1996 flood. Isocontours are shown for areas where layer thickness is higher than 0.5 m, derived by coupling swath bathymetry data acquired in 1993 (previous to the flood) with data from 1999. For thicknesses lower than 0.5 m the thickness is shown as proportional circles indicating the thickness measured in the box cores.
The International Association of Hydrogeologistsl'Association Internationale des Hydrogéologues
The Canadian Geotechnical SocietyLa Société canadienne de Géotechnique
2001 Odyssée de la Terre2001 An Earth Odyssey
769
AN
EA
RTH
OD
DIT
Y - B
Y R
AC
HEL
, JA
MIE
& T
AI
Scarpment
Debris blocksSpreadRafted blockPartial liquefactionFlows
Bras Nord central ChannelDeltaFjord slope
Slump
ll
ll
ll
lll
lll
l
l
l
llll
l
l
ll
l
llll
l
l
ll llllllll
l
l
ll
lllllll
ll
l l
l
l
l
ll
ll
ll
ll
ll
ll
ll
ll
l
l
l
ll
ll
ll
l
ll
l l
l l l l ll
l l llllllll
l l l l l
l
l ll l l l ll
l l ll lll l
l
l
l
l
ll
ll
ll
ll
l
l l
l
l l lll
ll
ll
ll
ll
ll
ll
ll
ll
ll
l
ll
ll
ll l l
llllll
ll
ll
ll
ll
l
l l ll
ll
ll
l
l l ll
l
l
l l l l
l
l l l lll l l
l l l l
l l l
ll
ll
l
ll
ll
ll
ll
l l l ll
l
l
l
l
l
l
ll
ll
l
l
l
l
l
ll l
ll
ll
ll
l
ll
ll
ll
l
ll
lll
l
l
ll
l
l ll
ll
ll
l
l l ll
llllllll
ll
ll
ll
ll
ll
l
ll
ll
ll
lllllll
l
l
ll
ll
ll
l
l
ll
l
llll
lll
ll
l
ll
ll
ll
l
l ll
l
ll
ll
lllllllll
ll
ll
ll
ll
ll
ll
ll
ll
ll
ll
l
ll
l
l
lll
ll
ll
ll
ll
ll
ll
ll
l
ll
lllllllllll
l l ll
l
l l l l l ll
l
lll
ll
ll
ll
lll
lll
l
l
l
l
ll
ll
ll
ll
llll
ll
ll
ll
ll
ll
ll
lllll
ll
ll
ll
ll
ll
ll
lll
lll
ll
ll
ll
ll
ll
l
ll
l
ll l
ll
l
l
ll lll
ll
ll
ll
ll
ll
ll
l
l
l l ll
l
ll
l
ll l
l
l
ll
ll
ll
ll
ll
llllll
48° 20'N
48° 24'N
48° 20'N
48° 24'N
70° 52'W 70° 48'W 70° 44'W 70° 40'W70° 52'W 70° 48'W 70° 44'W 70° 40'W
0 5
km
Saguenay river
Mars river
Ha! Ha! river
Baie des Ha! Ha!
Bras Nord
Figure 4. Geomorphological map of the Saguenay Fjord. Note abundance of scarpments and failure related deposits. Stars show location of gravity cores, inverted triangles show location of box cores.
70° 52'W 70° 48'W 70° 44'W 70° 40'W
48° 20'N
48° 24'N
0 5
km
0
≥10Slope angle (°)
Figure 5. Slope map of the Saguenay Fjord.
The International Association of Hydrogeologistsl'Association Internationale des Hydrogéologues
The Canadian Geotechnical SocietyLa Société canadienne de Géotechnique
2001 Odyssée de la Terre2001 An Earth Odyssey
770
AN
EA
RTH
OD
DIT
Y - B
Y R
AC
HEL
, JA
MIE
& T
AI
50
50
60
60
60
60
70
70
70
70
70
70
70
70
80
80
80
80
80
90
9090
90
90
90
100
100
100
100
100
100
100
110
110
110
110
110
120
120
120
120
120
120
120
120
130
130
130
130
130
140
70° 52'W 70° 48'W 70° 44'W 70° 40'W
48° 20'N
48° 24'N
0 5
km
Figure 6. Water content at 10 cm depth. Box cores (inverted triangles) used for gridding are also shown.
Therefore, to determine the stability of the fjord bottom and to assess the hazard that a new landslide could be triggered by a new seismic event we adopted the methodology of Newmark (1965). The final objective of this method, when applied for spatial analysis, is to obtain a displacement map that is indicative of the strain undergone by the sediment given a certain earthquake scenario. This method is a two-fold procedure: first we need to calculate the sediment’s critical pseudostatic acceleration (ac) to induce failure, and then calculate the permanent deformations induced by a selected representative strong ground motion record. 2.1. Calculating the critical pseudostatic acceleration The first step in Newmark’s (1965) method is determining the critical pseudostatic acceleration (ac). According to Lee and Edwards (1986) and Lee et al. (1999) the cyclic stress ratio (CSR = τc/γ’h) for a semi-infinite slope induced by seismic and gravitational loading can be expressed as:
'' γ
γα
γ
τ
gasin
hcc
+= [1]
where γ and γ’ are respectively the total unit weight and the submerged unit weight of sediment, α is the slope angle, h is depth in sediment, g is the gravity constant, and a the pseudostatic earthquake acceleration. Lee and Edward use normalized parameters, as can be seen form this formula, which allows the results obtained at surface to be interpolated at depth if no changes occur in lithology or physical properties.
0.25
0.30
0.35
0.40
0.45
γγ
'/at
1 m
dep
th
0.25 0.30 0.35γ γ '/ at 10 cm depth
y = 0.4792x + 0.2022R = 0.37952
Figure 7. The ratio of mean buoyant total unit weight at a depth of 1 m to that at 10 cm as measured in Lehigh cores. The slope angle may be known with great precision having into account the large amount of swath bathymetric data available in the area (Fig. 5), which provide a complete coverage of the fjord bottom. For this study we have only considered slopes with less than 10° due to method limitations, but it must also be noted that, in fact, slopes exceeding this value are generally constituted by rock outcrops in the Saguenay Fjord. Perret et al. (1995) have also shown that the Fjord sediments are normally consolidated and that the ratio of shear strength to preconsolidation pressure is about 0.3 in
The International Association of Hydrogeologistsl'Association Internationale des Hydrogéologues
The Canadian Geotechnical SocietyLa Société canadienne de Géotechnique
2001 Odyssée de la Terre2001 An Earth Odyssey
771
AN
EA
RTH
OD
DIT
Y - B
Y R
AC
HEL
, JA
MIE
& T
AI
the Saguenay Fjord sediments. This is the typical value observed in our cores at depth, and therefore we will assume that normal consolidation conditions are present in our sediment samples. However, it must also be noted that there is a typical superficial overconsolidation, which we will consider apparent.
0.0
0.1
0.2
0.3
0.4
0.5
0.6
0.7
0.8
0.9
Cyc
lic S
hear
Stre
ss/O
verb
urde
n Ef
fect
ive
Stre
ss (C
SR)
100 101101 102 103
Number of cycles to failure
wc 40 %≤
40 < wc 50 %≤
50 < wc 60 %≤
60 < wc 70 %≤
70 < wc 80 %≤
80 < wc 90 %≤
90 < wc 100 %≤
100 < wc 110 %≤
110 < wc 120 %≤
120 < wc
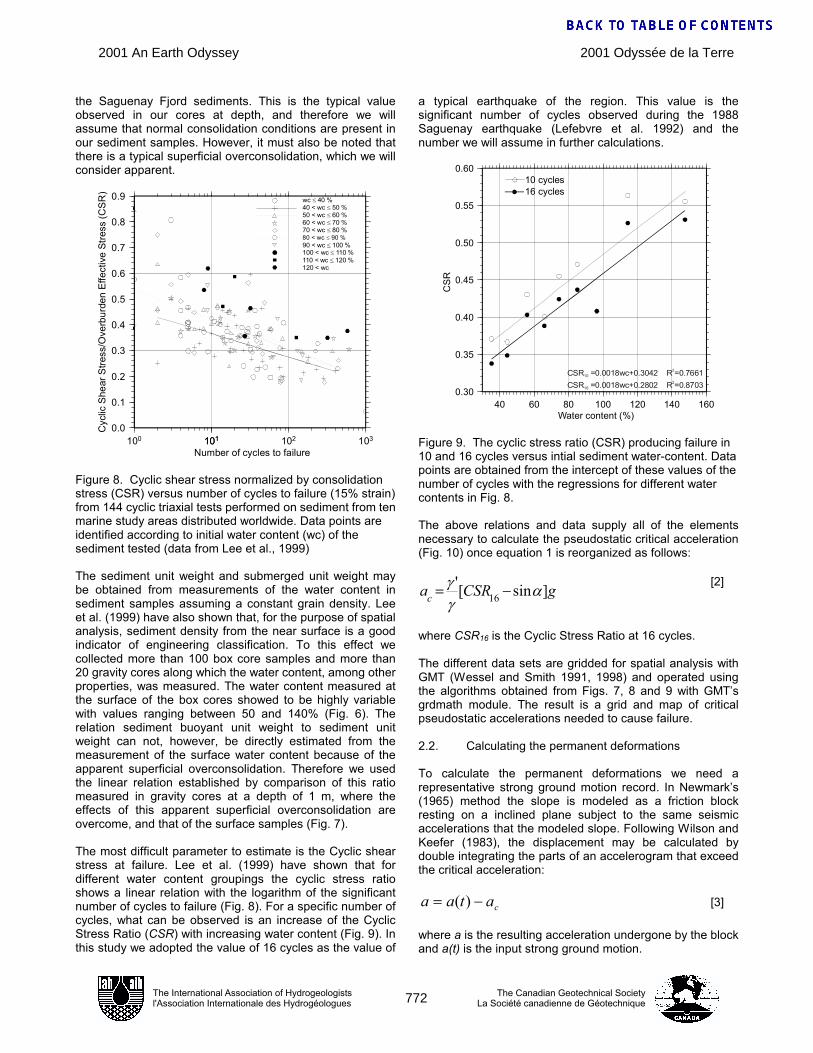
Figure 8. Cyclic shear stress normalized by consolidation stress (CSR) versus number of cycles to failure (15% strain) from 144 cyclic triaxial tests performed on sediment from ten marine study areas distributed worldwide. Data points are identified according to initial water content (wc) of the sediment tested (data from Lee et al., 1999) The sediment unit weight and submerged unit weight may be obtained from measurements of the water content in sediment samples assuming a constant grain density. Lee et al. (1999) have also shown that, for the purpose of spatial analysis, sediment density from the near surface is a good indicator of engineering classification. To this effect we collected more than 100 box core samples and more than 20 gravity cores along which the water content, among other properties, was measured. The water content measured at the surface of the box cores showed to be highly variable with values ranging between 50 and 140% (Fig. 6). The relation sediment buoyant unit weight to sediment unit weight can not, however, be directly estimated from the measurement of the surface water content because of the apparent superficial overconsolidation. Therefore we used the linear relation established by comparison of this ratio measured in gravity cores at a depth of 1 m, where the effects of this apparent superficial overconsolidation are overcome, and that of the surface samples (Fig. 7). The most difficult parameter to estimate is the Cyclic shear stress at failure. Lee et al. (1999) have shown that for different water content groupings the cyclic stress ratio shows a linear relation with the logarithm of the significant number of cycles to failure (Fig. 8). For a specific number of cycles, what can be observed is an increase of the Cyclic Stress Ratio (CSR) with increasing water content (Fig. 9). In this study we adopted the value of 16 cycles as the value of
a typical earthquake of the region. This value is the significant number of cycles observed during the 1988 Saguenay earthquake (Lefebvre et al. 1992) and the number we will assume in further calculations.
0.30
0.35
0.40
0.45
0.50
0.55
0.60
CSR
40 60 80 100 120 140 160Water content (%)
10 cycles16 cycles
CSR =0.0018wc+0.3042 R =0.7661102
CSR =0.0018wc+0.2802 R =0.8703162
Figure 9. The cyclic stress ratio (CSR) producing failure in 10 and 16 cycles versus intial sediment water-content. Data points are obtained from the intercept of these values of the number of cycles with the regressions for different water contents in Fig. 8. The above relations and data supply all of the elements necessary to calculate the pseudostatic critical acceleration (Fig. 10) once equation 1 is reorganized as follows:
gCSRac ]sin[' 16 α
γ
γ−=
[2]
where CSR16 is the Cyclic Stress Ratio at 16 cycles. The different data sets are gridded for spatial analysis with GMT (Wessel and Smith 1991, 1998) and operated using the algorithms obtained from Figs. 7, 8 and 9 with GMT’s grdmath module. The result is a grid and map of critical pseudostatic accelerations needed to cause failure. 2.2. Calculating the permanent deformations To calculate the permanent deformations we need a representative strong ground motion record. In Newmark’s (1965) method the slope is modeled as a friction block resting on a inclined plane subject to the same seismic accelerations that the modeled slope. Following Wilson and Keefer (1983), the displacement may be calculated by double integrating the parts of an accelerogram that exceed the critical acceleration:
cataa −= )( [3] where a is the resulting acceleration undergone by the block and a(t) is the input strong ground motion.
The International Association of Hydrogeologistsl'Association Internationale des Hydrogéologues
The Canadian Geotechnical SocietyLa Société canadienne de Géotechnique
2001 Odyssée de la Terre2001 An Earth Odyssey
772
AN
EA
RTH
OD
DIT
Y - B
Y R
AC
HEL
, JA
MIE
& T
AI
70° 52'W 70° 48'W 70° 44'W 70° 40'W
48° 20'N
48° 24'N
0 5
km
0.020.040.060.080.100.120.140.160.18
Criticalacceleration(fraction of g)
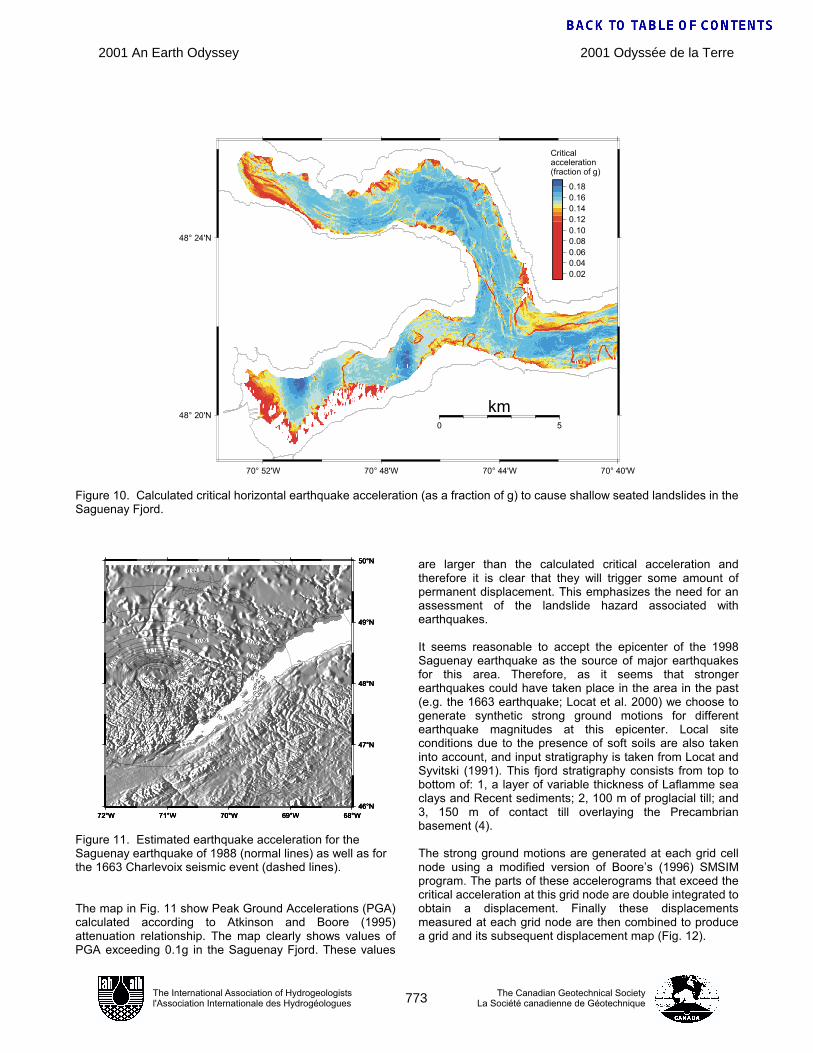
Figure 10. Calculated critical horizontal earthquake acceleration (as a fraction of g) to cause shallow seated landslides in the Saguenay Fjord.
72°W 71°W 70°W 69°W 68°W46°N
47°N
48°N
49°N
50°N
72°W 71°W 70°W 69°W 68°W46°N
47°N
48°N
49°N
50°N
0.02
0.02
0.04
0.06
0.08
0.08 0.1
0.1
0.12
0.14
0.16
0.18
0.2
72°W 71°W 70°W 69°W 68°W46°N
47°N
48°N
49°N
50°N
0.20.3
0.4
72°W 71°W 70°W 69°W 68°W46°N
47°N
48°N
49°N
50°N0.02
0.04
0.04
0.06
0.060.06
0.06
0.08
0.08
0.08
0.1
0.1
0.12
0.12
0.14
0.14
0.16
0.16
0.180.18
0.2
0.2
0.2
0.2
0.3
0.40.50.60.7
0.80.9
Figure 11. Estimated earthquake acceleration for the Saguenay earthquake of 1988 (normal lines) as well as for the 1663 Charlevoix seismic event (dashed lines). The map in Fig. 11 show Peak Ground Accelerations (PGA) calculated according to Atkinson and Boore (1995) attenuation relationship. The map clearly shows values of PGA exceeding 0.1g in the Saguenay Fjord. These values
are larger than the calculated critical acceleration and therefore it is clear that they will trigger some amount of permanent displacement. This emphasizes the need for an assessment of the landslide hazard associated with earthquakes. It seems reasonable to accept the epicenter of the 1998 Saguenay earthquake as the source of major earthquakes for this area. Therefore, as it seems that stronger earthquakes could have taken place in the area in the past (e.g. the 1663 earthquake; Locat et al. 2000) we choose to generate synthetic strong ground motions for different earthquake magnitudes at this epicenter. Local site conditions due to the presence of soft soils are also taken into account, and input stratigraphy is taken from Locat and Syvitski (1991). This fjord stratigraphy consists from top to bottom of: 1, a layer of variable thickness of Laflamme sea clays and Recent sediments; 2, 100 m of proglacial till; and 3, 150 m of contact till overlaying the Precambrian basement (4). The strong ground motions are generated at each grid cell node using a modified version of Boore’s (1996) SMSIM program. The parts of these accelerograms that exceed the critical acceleration at this grid node are double integrated to obtain a displacement. Finally these displacements measured at each grid node are then combined to produce a grid and its subsequent displacement map (Fig. 12).
The International Association of Hydrogeologistsl'Association Internationale des Hydrogéologues
The Canadian Geotechnical SocietyLa Société canadienne de Géotechnique
2001 Odyssée de la Terre2001 An Earth Odyssey
773
AN
EA
RTH
OD
DIT
Y - B
Y R
AC
HEL
, JA
MIE
& T
AI
70° 52'W 70° 48'W 70° 44'W 70° 40'W
48° 20'N
48° 24'N
0 5
km
70° 52'W 70° 48'W 70° 44'W 70° 40'W
48° 20'N
48° 24'N
0 5
km
70° 52'W 70° 48'W 70° 44'W 70° 40'W
48° 20'N
48° 24'N
0 5
km
70° 52'W 70° 48'W 70° 44'W 70° 40'W
48° 20'N
48° 24'N
0 5
km
70° 52'W 70° 48'W 70° 44'W 70° 40'W
48° 20'N
48° 24'N
0 5
km
70° 52'W 70° 48'W 70° 44'W 70° 40'W
48° 20'N
48° 24'N
0 5
km
70° 52'W 70° 48'W 70° 44'W 70° 40'W
48° 20'N
48° 24'N
0 5
km
70° 52'W 70° 48'W 70° 44'W 70° 40'W
48° 20'N
48° 24'N
0 5
km
0125
102550
100> 100
Newmarkdisplacement(cm)
M 5.5w
M 5.75w
M 6w
M 6.25w
M 6.5w
M 6.75w
M 7w
M 7.25w
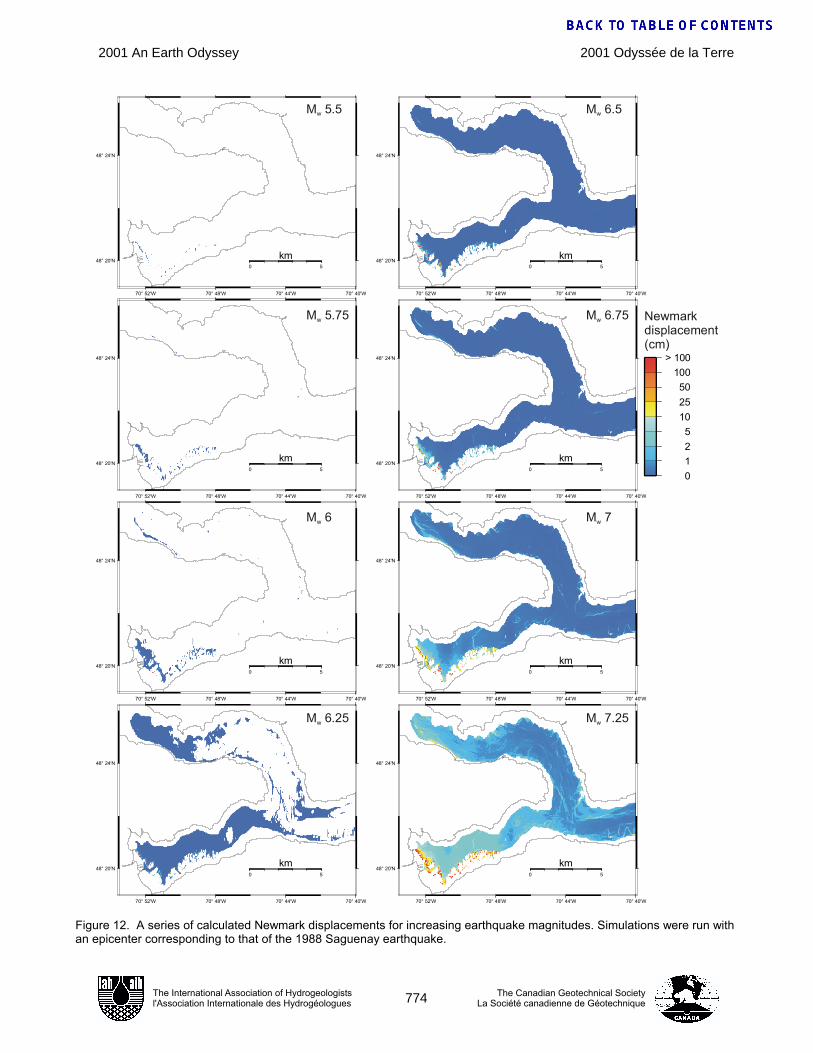
Figure 12. A series of calculated Newmark displacements for increasing earthquake magnitudes. Simulations were run with an epicenter corresponding to that of the 1988 Saguenay earthquake.
The International Association of Hydrogeologistsl'Association Internationale des Hydrogéologues
The Canadian Geotechnical SocietyLa Société canadienne de Géotechnique
2001 Odyssée de la Terre2001 An Earth Odyssey
774
AN
EA
RTH
OD
DIT
Y - B
Y R
AC
HEL
, JA
MIE
& T
AI
3. CONCLUSION The maps shown in Fig. 12 show a consistency of the method and an agreement between calculated displacements and the areas which have undergone slope instability or those which most likely will undergo instability. According to this study major displacements which could induce failure from earthquakes with epicenter coinciding with that of the Saguenay 1988, will only be expected from moment magnitudes of 6.5 or larger. The larger displacements are to be expected at the head regions of the Baie des Ha! Ha! and the St. Fulgence delta in the Bras Nord. Considering the frequency of events of this magnitude, estimated between 350 to 1000 years by Doig et al. (1988) the flood layer of 1996 can be considered seismically stable. 4. ACKNOWLEDGEMENT The authors would like to thank the several captains and crews of the vessels involved in acquiring the data here presented, including those of the F.G. Creed, D. Riverain and A.C. Horth. The Natural Sciences and Engineering Research Council and Alcan of Canada Ltd are also acknowledged for funds provided to the strategic project “Saguenay post-déluge” (STP201981) and COSTA-Canada (CRO-234277-00). We also acknowledge the financial support of the Québec Ministry of Education for postdoctoral fellowship provided to R. Urgeles. 5. REFERENCES Atkinson, G.M., and D.M. Boore, 1995. Ground-motion relations for eastern North America. Bull. Seismol. Soc. Am., 85: 17-30. Barbeau, C., R. Bougie, and J.-E. Côté, 1981a. Varations spatiales et temporelles du céssium-137 et du carbone dans des sédiments du fjord du Saguenay. Can. J. Earth Sci., 18: 1004-1011. Barbeau, C., R. Bougie, J.-E. and Côté, 1981b. Temporal and spatial variations of mercury, lead, zinc, and copper in sediments of the Saguenay fjord, Can. J. Earth Sci., 18: 1065-1074. Boore, D. B., 1996. SMSIM - Fortran Program for Simulating Ground motions from Earthquakes: Version 1.0. USGS Open File Report 96-80-A, U.S. Geological Survey, Denver, CO, 73 p. Brooks, G.R., and D.E. Lawrence, 1999. The drainage of the Lake Ha! Ha! reservoir and downstream impacts along Ha! Ha! River, Saguenay area, Quebec, Canada. Geomorphology, 28: 141-168. Doig, R., 1998. 3000-Year Paleoseismiological record from the region of the 1988 Saguenay, Quebec, earthquake. Bull. Seismol. Soc. Am., 88: 1198-1203
Lee, H.J., and B.D. Edwards, 1986. Regional method to assess offshore slope stability. J. Geotech. Eng., 112: 489-509. Lee, H.J., J. Locat, P. Dartnell, K. Israel, and F. Wong, 1999. Regional variability of slope stability: application to the Eel margin, California. Mar. Geol., 154: 305-321. Lefebvre, G., D. Lebouef, P. Hornych, and L. Tanguay, 1992. Slope failures associated with the 1988 Saguenay earthquake, Quebec, Canada. Can. Geotech. J., 29: 117-130. Locat, J., and M. Bergeron, 1988. Étude à rebours de glissements sous-marins, fjord du Saguenay, Québec. Proceedings of the 41st Canadian Geotechnical Conference, Waterloo, Canada, pp. 338-346. Locat, J., R. Urgeles, T. Schmitt, L. Houareau, F. Martin, P. Hill, B. Long, P. Simpkin, E. Kammerer, and R. Sanfaçon, 2000. The morphological signature of natural disasters in the Upper Saguenay Fjord area, Québec, Canada. Proceedings of the 53rd Canadian Geotechnical Conference, Montreal, Québec, pp. 109-116. Locat, J., and J.P. Syvitski, 1991. Le fjord du Saguenay et le golfe du St-Laurent: Étalons pour l’évaluation des changements globaux au Québec. In: M.A. Bouchard, J. Bérard, and C.E. Delisle (Eds.), Collection Environnement et Géologie, v. 12, Quebec, Canada, pp. 309-318. Locat, P., J. Locat, S. Leroueil, R. Urgeles, and B. Hart, 2001. Caractéristion préliminaire du glissement sous-marin de la Pointe-du-Fort, Fjord du Saguenay, Québec, Canada, this volume. Loring, D.H., and J.M. Bewers, 1978. Geochemical mass balance of mercury in Canadian fjord. J. Chem. Geol., 22: 309-330. Newmark, N.M., 1965. Effects of earthquakes on dams and embankments, Géotechnique, 15: 139-160. Perret, D., J. Locat, and S. Leroueil, 1995. Strength development with burial in fine-grained sediments from the Saguenay Fjord, Quebec. Can. Geotech. J., 32: 247-262. Tso, W.K., and T.J. Zhu, 1991. Implications of the 1988 Saguenay earthquake on Canadian seismic strength specification. Can. J. Civ. Eng., 18: 130-139. Wessel, P., and W. H. F. Smith, 1991. Free software helps map and display data. EOS Trans., AGU, 72: 441. Wessel, P., and W. H. F. Smith, 1998. New, improved version of the Generic Mapping Tools released, EOS Trans. AGU, 79: 579. Wilson, R.C., and D.K. Keefer, 1983. Dynamic analysis of a slope failure from the 6 August 1979 Coyote Lake, California, Earthquake. Bull. Seismol. Soc. Am., 73: 863-877.
The International Association of Hydrogeologistsl'Association Internationale des Hydrogéologues
The Canadian Geotechnical SocietyLa Société canadienne de Géotechnique
2001 Odyssée de la Terre2001 An Earth Odyssey
775
AN
EA
RTH
OD
DIT
Y - B
Y R
AC
HEL
, JA
MIE
& T
AI


![INTEGRATING THE NONINTEGRABLE - msh-paris.frsemioweb.msh-paris.fr › ... › Alan_Weinstein4.pdf · Poisson geometry going back to Lie [11], that of realizing a given Poisson manifold](https://static.fdocuments.fr/doc/165x107/5f0399de7e708231d409db4f/integrating-the-nonintegrable-msh-paris-a-a-alanweinstein4pdf-poisson.jpg)