
THE ROLE OF ENERGY PIPELINES Final - INGAA
70
THE ROLE OF ENERGY PIPELINES AND RESEARCH IN THE UNITED STATES Sustaining the Viability and Productivity of a National Asset The Steering Committee on Energy Pipelines and Research American Gas Association American Petroleum Institute Association of Oil Pipe Lines Interstate Natural Gas Association of America Northeast Gas Association/NYSEARCH Pipeline Research Council International, Inc. U.S. Department of Energy U.S. Department of Transportation May 2006
Transcript of THE ROLE OF ENERGY PIPELINES Final - INGAA
TTHHEE RROOLLEE OOFF EENNEERRGGYY PPIIPPEELLIINNEESS AANNDD RREESSEEAARRCCHH IINN TTHHEE UUNNIITTEEDD SSTTAATTEESS
SSuussttaaiinniinngg tthhee VViiaabbiilliittyy aanndd PPrroodduuccttiivviittyy ooff aa NNaattiioonnaall AAsssseett
TThhee SStteeeerriinngg CCoommmmiitttteeee oonn EEnneerrggyy PPiippeelliinneess aanndd RReesseeaarrcchh
AAmmeerriiccaann GGaass AAssssoocciiaattiioonn
AAmmeerriiccaann PPeettrroolleeuumm IInnssttiittuuttee AAssssoocciiaattiioonn ooff OOiill PPiippee LLiinneess
IInntteerrssttaattee NNaattuurraall GGaass AAssssoocciiaattiioonn ooff AAmmeerriiccaa NNoorrtthheeaasstt GGaass AAssssoocciiaattiioonn//NNYYSSEEAARRCCHH
PPiippeelliinnee RReesseeaarrcchh CCoouunncciill IInntteerrnnaattiioonnaall,, IInncc.. UU..SS.. DDeeppaarrttmmeenntt ooff EEnneerrggyy
UU..SS.. DDeeppaarrttmmeenntt ooff TTrraannssppoorrttaattiioonn
MMaayy 22000066
PPiippeelliinnee RReesseeaarrcchh CCoouunncciill IInntteerrnnaattiioonnaall,, IInncc..
TTHHEE RROOLLEE OOFF EENNEERRGGYY PPIIPPEELLIINNEESS AANNDD RREESSEEAARRCCHH IINN TTHHEE UUNNIITTEEDD SSTTAATTEESS
SSuussttaaiinniinngg tthhee VViiaabbiilliittyy aanndd PPrroodduuccttiivviittyy ooff aa NNaattiioonnaall AAsssseett
BByy CChheerryyll JJ.. TTrreenncchh
PPrreessiiddeenntt,, AAlllleeggrroo EEnneerrggyy CCoonnssuullttiinngg
aanndd
TThhoommaass OO.. MMiieessnneerr PPrriinncciippaall,, MMiieessnneerr LLLLCC
Acknowledgements
The Role of Energy Pipelines and Research i
AACCKKNNOOWWLLEEDDGGEEMMEENNTTSS
The sponsoring organizations listed on the report cover provided funding for this report and staffed the Steering Committee on Energy Pipelines and Research. The Steering Committee was the driving force behind this report, and the individuals on the Steering Committee contributed ideas, insight and expertise in developing each aspect of the scope and substance of this report. Current members of the Steering Committee:
American Gas Association Lori Traweek, Christina Sames
Association of Oil Pipe Lines Benjamin S. Cooper
Interstate Natural Gas Association of America Lisa Beal, Scott Thetford (GE Oil and Gas for the INGAA Foundation)
Northeast Gas Assocation/NYSEARCH Daphne D'Zurko
Pipeline Research Council International George Tenley, Mark Hereth (P-PIC), Art Meyer (Enbridge), Eric Thomas (El Paso)
U.S. Department of Energy Alice Lippert, David Salem, Mindi Farber-DeAnda (SAIC)
U.S. Department of Transportation (PHMSA) Jeffrey Wiese, Robert Smith
In addition to the Steering Committee, we received important insight from a broad group of subject matter experts. This group was comprised of: Bud Danenberger and Michael Else, MMS; Maher Nessim, C-FER; Steve Koetting, ExxonMobil Pipe Line; Rich Turley, Marathon Petroleum; J. Bruce Nestleroth, Battelle; L. Ray Fessler, BIZTEK Consulting; Richard Tennille; John Niemeyer; Harvey Haines, PRCI; Larry Clynch; and Jack Lucido, URS. From them, we gathered substantial knowledge regarding the history of pipeline research and improvement. The Appendix contains a summary of what we learned.
To each of these individuals, and to the ones we inadvertently neglected to mention, we express our thanks. Nonetheless, as always, we had the last word, so we carry the burden of interpreting correctly what they offered.
Cheryl J. Trench ([email protected]) Tom Miesner (tom@miesnerllc)
Copyright © 2006, Pipeline Research Council International, Inc.
Table of Contents
The Role of Energy Pipelines and Research ii
TTAABBLLEE OOFF CCOONNTTEENNTTSS
ACKNOWLEDGEMENTS .............................................................................................. i
TABLE OF CONTENTS................................................................................................. ii
ABBREVIATIONS AND ACRONYMS.......................................................................... iii
EXECUTIVE SUMMARY ...............................................................................................1
INTRODUCTION ........................................................................................................6
CHAPTER 1: CHARACTERISTICS OF ENERGY PIPELINES ........................................10
CHAPTER 2: STAKEHOLDERS AND REGULATION .................................................20
CHAPTER 3: THE ENERGY LANDSCAPE ..................................................................28
CHAPTER 4: IMPROVING PERFORMANCE .............................................................43
CHAPTER 5: THE EVOLUTION AND ROLE OF PIPELINE RESEARCH......................48
APPENDIX .................................................................................................................58
Abbreviations and Acronyms
The Role of Energy Pipelines and Research iii
AABBBBRREEVVIIAATTIIOONNSS AANNDD AACCRROONNYYMMSS
AGA American Gas Association AOPL Association of Oil Pipe Lines APGA American Public Gas Association API American Petroleum Institute BBL Barrel (42 gallons) BTU British Thermal Units CFR Code of Federal Regulations COS Cost of Service [rate regulation] DOE U.S. Department of Energy DOT U.S. Department of Transportation FERC Federal Energy Regulatory Commission GDP Gross Domestic Product GTI Gas Technology Institute GTL Gas-To-Liquid IGT Institute of Gas Technology ILI Inline Inspection INGAA Interstate Natural Gas Association of America LDC Local Distribution Company LNG Liquefied Natural Gas LPG Liquefied Petroleum Gas MMB/D Millions of Barrels Per Day MCF Thousand Cubic Feet NGL Natural Gas Liquids
OPS Office of Pipeline Safety [in this report, OPS is generally referred to by the name of its current parent agency, Pipeline and Hazardous Materials Safety Administration or PHMSA]
OTD Operations Technology Development PHMSA Pipeline and Hazardous Materials Safety Administration (and predecessor agencies) PPM Parts per million PRCI Pipeline Research Council International, Inc. SCADA Supervisory Control And Data Acquisition TCF Trillion Cubic Feet ULSD Ultra Low Sulfur Diesel [15 ppm sulfur]
Executive Summary
The Role of Energy Pipelines and Research 1
EEXXEECCUUTTIIVVEE SSUUMMMMAARRYY
Summary • Energy from oil and natural gas is essential, and will continue to be
essential, to all facets of our daily lives. It fuels most of our transportation needs, heats our homes, schools, offices and shops, and even generates a share of our electricity. Oil and natural gas together supply approximately two-thirds of the U.S. energy needs.
• Crude oil and natural gas are generally produced in regions located far from consumption centers. This means crude oil must be moved to refineries, and refined products and natural gas must be moved from producing regions to consumption centers.
• The U.S. pipeline infrastructure is the primary means of transporting this natural gas and oil, moving all the natural gas and about two-thirds of the oil. Consequently, everyone in the U.S. is a stakeholder. Few, however, recognize this fact, depending instead on governmental agencies to represent and protect their interests as citizens.
• These stakeholders justifiably demand safe, reliable, secure, and environmentally responsible pipeline operations, and they expect continued improvement in each of these areas.
• Research, broadly defined as the generation and application of knowledge, is the key to driving improvement. Collaborative research: robust strategic planning, clear direction, adequate funding, effective management, seamless technology transfer, and incentives for deployment, is the best model for producing research results that yield value to all stakeholders.
• The importance of energy pipelines to the U.S. economy and our standard of living dictates that all stakeholders, including the public, participate in funding pipeline research, thereby enabling continual safety, supply reliability, productivity, security, and environmental performance improvements.
Executive Summary
The Role of Energy Pipelines and Research 2
Background
Like other modes of transportation so important to the nation’s economy and standard of living -- roads, rivers, electric transmission lines, and railroads -- pipelines are long linear assets. They cross the U.S. from points of oil and natural gas production and import facilities to points of consumption. Pipelines, like the other modes of transportation, are expensive to build but have long lives when properly maintained. A pipeline company doesn’t normally own the land its pipeline crosses. Rather, a landowner sells an easement to the pipeline company, giving the company a right-of-way (ROW) to construct, operate, and maintain its pipeline across the landowner’s property. Unlike other modes of transportation, pipelines are buried. Because they are buried, they are not as visible as most other transportation assets and neighboring landowners may not even know pipelines are running nearby.
Pipeline Characteristics
The differences in physical properties between oil and natural gas dictate that they move on different pipelines. Sometimes oil remains on the same pipeline for its entire journey, but often it switches from one pipeline to another as it makes its way to the ultimate consumer. The same is true for natural gas. Both oil and natural gas can travel on different types of pipelines along their way; gathering, transmission, and distribution lines. Each performs a different function in the overall network. Along the way oil is refined, converting it into gasoline, diesel, and other liquid fuels. Natural gas is normally processed to extract liquids and insure quality before it is introduced into a pipeline.
Pipeline safety, pricing power, environmental issues, and other aspects of pipeline operation are all highly regulated. Federal rules promulgated by the Department of Transportation’s Pipeline and Hazardous Materials Safety Administration regulate oil and natural gas pipelines operations and safety, often incorporating industry standards into those regulations. The transportation rates that pipelines charge for interstate movements are regulated by the Federal Energy Regulatory Commission. Intrastate pipelines rates are regulated by state commissions. Pipelines must go through a lengthy process whenever they want tariff increases, regardless of the supply/demand balance in the underlying commodity. Hence, pipeline rates have little impact on the price of gasoline, diesel, jet fuel, and natural gas, but pipeline disruptions or lack of capacity can constrain supply causing price spikes.
Implications of Changing Supply and Demand
While the Energy Information Administration does not specifically address pipelines, its well-respected long-term forecast, Annual Energy
Pipelines are essential to link points of production to points of consumption
Different types of pipelines serve different functions in the supply chain
Pipeline disruptions or lack of capacity can constrain supply, causing price spikes
Executive Summary
The Role of Energy Pipelines and Research 3
More and realigned pipeline capacity will be necessary.
Outlook 2006 served as a framework for assessing the implications of supply and demand changes for the pipeline network. For example, natural gas pipelines will need to add distribution capacity to serve growing markets. Increasing imports of Liquefied Natural Gas (LNG) imply feeder lines to integrate LNG terminals on the Gulf and East Coast into the existing supply networks. Growing Colorado/ Wyoming production from unconventional reserves of gas mean more gathering lines will be needed in the Rockies and more transmission lines will be needed to move this gas to Midwest markets.
Changes to oil supply and demand indicate the need to add more trunklines in the Gulf of Mexico to transport offshore crude oil production as well as the need to construct more pipelines from marine import terminals to refineries and crude oil mainlines along the Gulf Coast. Crude oil capacity will also have to be expanded from Canada to the U.S. and from the Rocky Mountain to the Midwest trade and refining centers. Some inland crude oil gathering systems will be shut down, and others will be consolidated, as production of mature areas continues to decline. Changes to refined products systems will center on modifications required to handle ultra low sulfur distillates and possibly diesel from gas-to-liquid plants and biodiesel. Some additional refined product import capacity and associated distribution capacity will also be needed on the East and West coasts.
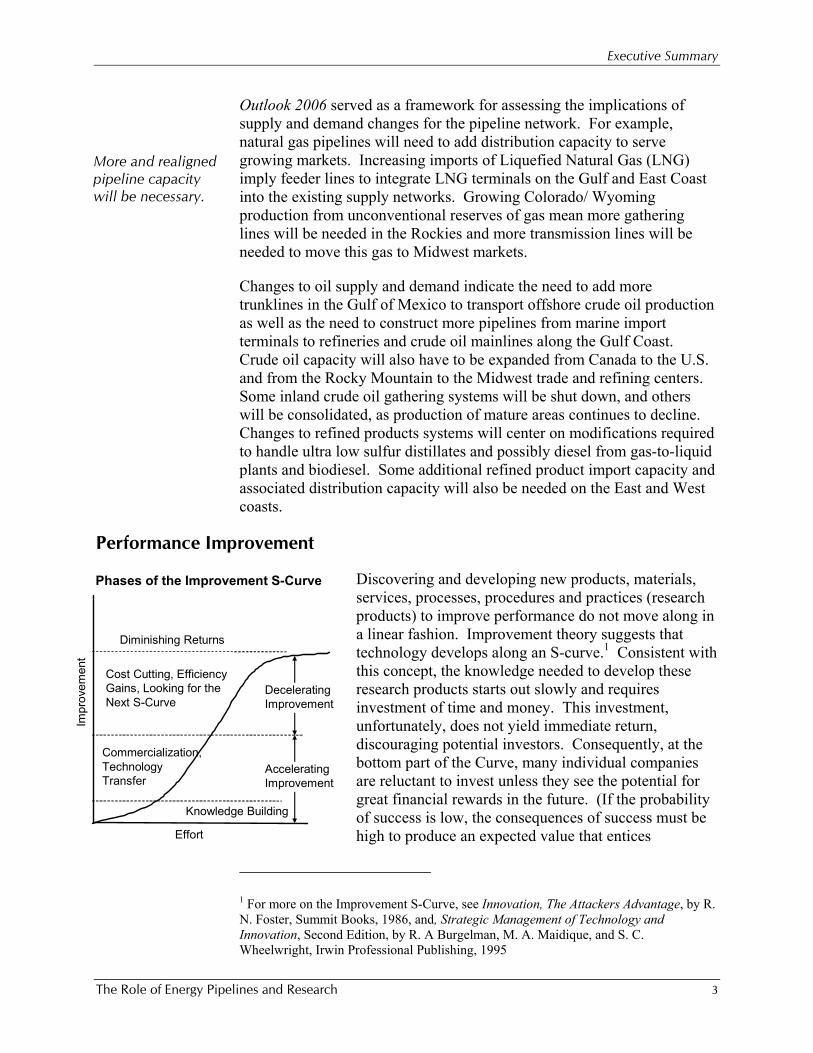
Performance Improvement
Discovering and developing new products, materials, services, processes, procedures and practices (research products) to improve performance do not move along in a linear fashion. Improvement theory suggests that technology develops along an S-curve.1 Consistent with this concept, the knowledge needed to develop these research products starts out slowly and requires investment of time and money. This investment, unfortunately, does not yield immediate return, discouraging potential investors. Consequently, at the bottom part of the Curve, many individual companies are reluctant to invest unless they see the potential for great financial rewards in the future. (If the probability of success is low, the consequences of success must be high to produce an expected value that entices
1 For more on the Improvement S-Curve, see Innovation, The Attackers Advantage, by R. N. Foster, Summit Books, 1986, and, Strategic Management of Technology and Innovation, Second Edition, by R. A Burgelman, M. A. Maidique, and S. C. Wheelwright, Irwin Professional Publishing, 1995
Impr
ovem
ent
Effort
Phases of the Improvement S-Curve
Knowledge Building
Diminishing Returns
AcceleratingImprovement
DeceleratingImprovement
Commercialization,Technology Transfer
Cost Cutting, EfficiencyGains, Looking for the Next S-Curve
Executive Summary
The Role of Energy Pipelines and Research 4
companies to invest.) Since many parts of the pipeline industry are mature, the prospect of financial incentives is often small, limiting investment in research.
As knowledge and the ability to apply the knowledge grow, improvement accelerates, requiring less incremental investment to move the improvement along. As the research product passes the proof of concept stage and approaches commercialization, it begins to attract investor attention. If investors feel the research product has commercial potential, as in the case of many products, materials, and services, companies begin to invest. This influx of investment drives knowledge about the improvement and how to apply it rapidly along. The opposite is also true: if investors feel the research product does not have commercial potential -- which is often the case for processes, procedures, practices -- they will not invest.
Reluctance to invest in the early, knowledge part of the Curve, and in process, procedures, and practices at any point on the curve, leaves these efforts to be funded by consortiums, governments, and private foundations.
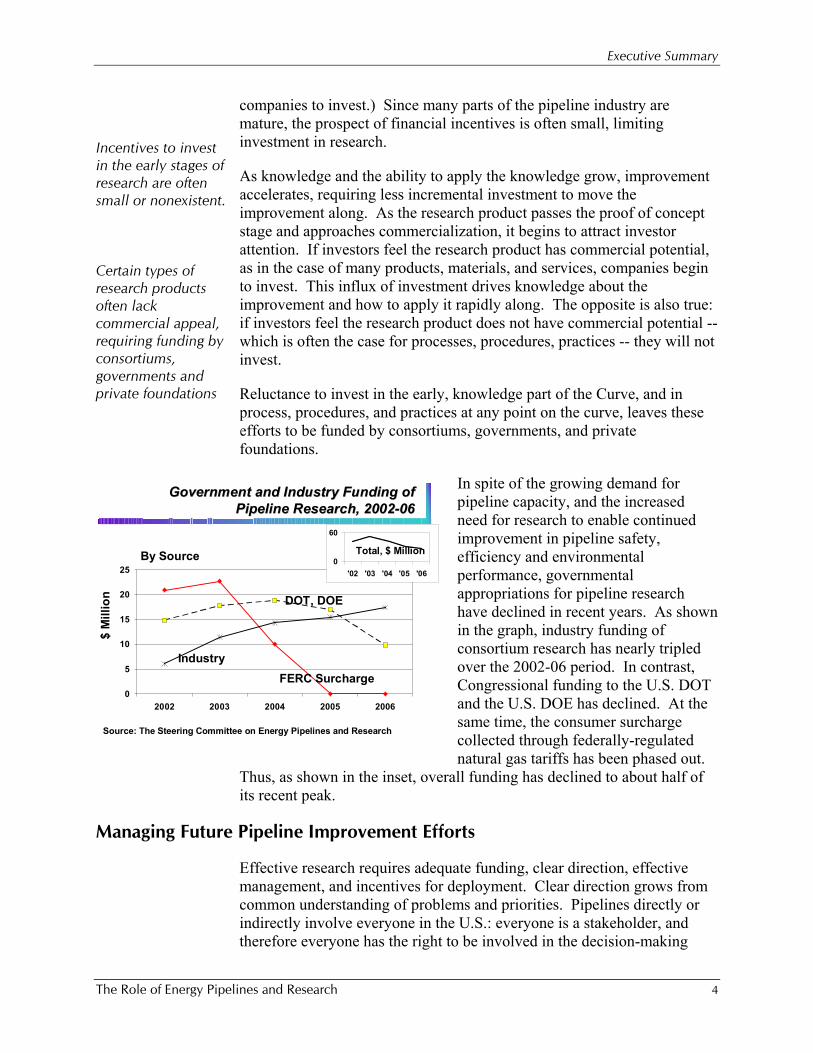
In spite of the growing demand for pipeline capacity, and the increased need for research to enable continued improvement in pipeline safety, efficiency and environmental performance, governmental appropriations for pipeline research have declined in recent years. As shown in the graph, industry funding of consortium research has nearly tripled over the 2002-06 period. In contrast, Congressional funding to the U.S. DOT and the U.S. DOE has declined. At the same time, the consumer surcharge collected through federally-regulated natural gas tariffs has been phased out.
Thus, as shown in the inset, overall funding has declined to about half of its recent peak.
Managing Future Pipeline Improvement Efforts
Effective research requires adequate funding, clear direction, effective management, and incentives for deployment. Clear direction grows from common understanding of problems and priorities. Pipelines directly or indirectly involve everyone in the U.S.: everyone is a stakeholder, and therefore everyone has the right to be involved in the decision-making
Incentives to invest in the early stages of research are often small or nonexistent. Certain types of research products often lack commercial appeal, requiring funding by consortiums, governments and private foundations
Government and Industry Funding of Government and Industry Funding of Pipeline Research, 2002Pipeline Research, 2002--0606
0
5
10
15
20
25
2002 2003 2004 2005 2006
0
60
'02 '03 '04 '05 '06
Total, $ Million
$ M
illio
n
FERC SurchargeIndustry
DOT, DOE
By Source
Source: The Steering Committee on Energy Pipelines and Research
Executive Summary
The Role of Energy Pipelines and Research 5
Adequate funding, clear direction, effective management and commercial potential are all essential
process. Often governments and advocacy groups establish themselves as surrogates for the public, with or without its permission. The right to involvement in the decision-making process often implies a requirement for funding the outcome of the decision-making. Effective management requires careful attention to details and clear measurement of and accountability for the outcomes versus desired results.
Deployment incentives are critical to promote research and improvement. These incentives take the form of improved safety, reliability, and efficiency, as well as increased earnings. The last one, increased earnings, is often the first one considered as individual companies decide whether or not to invest. Everyone is supportive of improved safety but when companies are under pressure to improve short term earnings, individual companies may assume that others in the industry will make the investment and they will benefit. Not only are deployment incentives needed, disincentives must be removed. In the highly regulated pipeline industry, where rates are justified based on costs plus a return, companies may not be able to realize the benefits of efficiency improvements. Sometimes companies even worry that regulations may force them to employ new technology or practices that are not cost effective.
The Road Ahead
Energy pipelines are required for the foreseeable future and continued research is needed so that energy pipelines can continue improving their safety, supply reliability, environmental performance, security and efficiency. An active research management function that includes effectively setting priorities and direction, assuring adequate and consistent funding levels, and creating incentives to facilitate effective technology transfer is needed to help move energy pipeline performance forward.
Companies, consortiums, and governments each have roles to play in managing the pipeline research arena and the research model should continue to evolve towards a collaborative model. A collaborative model, while difficult to manage because of the diverse motives and interests, is the best approach for discovering and agreeing on future research initiatives that balance the needs and wants of all stakeholders. A collaborative model will use all available resources to insure the future of energy pipelines, which are a national asset even though most of them are owned by private interests. For the collaborative model to work, all stakeholders must engage in true dialogue where benefits and concerns are thoroughly vetted. Each stakeholder must do their “fair share” to engender trust and thereby move forward the future of energy pipelines in the U.S.
Regulatory approaches sometimes impose disincentives
Introduction
The Role of Energy Pipelines and Research 6
IINNTTRROODDUUCCTTIIOONN
Background to Study
This report surveys the contributions of oil and gas pipelines in meeting the Nation’s energy needs, the critical role that research played in making those contributions possible up until now, and how research will be necessary in the future to meet the challenges facing pipelines. Continued, even increased, dependence on pipelines is clear. Not only will demand for oil and natural gas grow, requiring greater capacity for distribution across the nation and into communities, but regional patterns of supply and demand will shift, requiring reconfigured pipeline movements. Research is essential to improve pipeline safety, supply reliability, environmental performance, security and efficiency as the system encounters higher capacity utilization and higher bars for performance.
A group of parties interested in pipelines has come together to sponsor this report – trade associations, individual operators, the U.S. Department of Transportation, the U.S. Department of Energy, and industry research organizations. These organizations are direct stakeholders in the safe, environmentally responsible and efficient operation of oil and natural gas pipelines. The pipelines are so crucial to national economic health, however, that everyone is a stakeholder in pipeline safety and reliability to some degree.
The supply outages following hurricanes Katrina and Rita in September 2005 are the most recent demonstrations of the instant commodity price increases that follow a significant disruption in the transportation and distribution system. Electricity outages caused by the storms in turn prevented some pipelines from operating in the affected area. With no new supplies entering the pipelines at the Gulf Coast, the decreased supply was felt all along the pipelines’ routes. As refined products became scarce (or as traders thought they might become scare) prices spiked at the gasoline pump even in areas where the pipelines had never shut down. These sharp price increases should serve as clear reminders of the importance of supply reliability and the pivotal role that pipelines play to ensure supply and thereby keep prices reasonable.
Research is essential to improve pipeline safety, reliability and efficiency
Sponsors are direct stakeholders, but finally, everyone is a stakeholder
Introduction
The Role of Energy Pipelines and Research 7
The sponsors have come together for this study because they have observed divergent trends: growth in oil and gas demand and the need for additional pipeline capacity, contrasted with the decline in pipeline research funding, which is a critical component of improving pipeline reliability and performance.
The Unique Characteristics of Oil and Natural Gas Pipelines
Even though everyone in the U.S. is a stakeholder, the oil and natural gas networks in the U.S. are largely invisible to the public. While pipelines began to be used in the U.K., by the London and Westminster Gas Light and Coke Company for gas transport nearly 200 years ago, it was the development of large diameter, long distance oil and gas pipelines in the U.S. during World War II that fueled the post-war boom and shaped suburban life, a signature of U.S. demographics. Pipelines have become nearly ubiquitous, but few people are familiar with the networks or their complexities.
The pipelines that carry energy across the United States have a mix of characteristics that affects the way they are operated, maintained and regulated. This unique mix of features also creates an imperative for research. Among the important realities:
• Energy pipelines are capital-intensive, long-lived assets. Complete replacements are seldom an option, so robust maintenance regimes are essential.
• Energy pipelines are generally buried, making evaluation of the line’s condition by visual inspection difficult. Thus, research by pipelines and their vendors resulted in mechanisms to inspect the lines internally and to detect leaks.
• Energy pipeline failures, while rare, can have catastrophic consequences, since oil and natural gas pipelines carry flammable commodities that can also ignite, explode, or pollute air, ground and water. Thus, past research has focused on understanding failure mechanisms and developing practices to prevent and mitigate failures.
• Energy pipelines, especially transmission pipelines or trunklines, are generally made of steel and by their nature are susceptible to corrosion. Thus, research has supported a wide and intensive program for corrosion prevention and control.
• Energy pipeline are long, narrow assets, operating in rights-of-ways across property owned by others. This feature presents pipeline security and protection challenges, unlike refinery or production plants operating inside fenced facilities and controlled by the operator. Thus,
The need for pipelines is growing, but funding for research is declining
Few people are familiar with pipeline networks or their complexity
Capital-intensive, long-lived
Buried
Failures can have catastrophic consequences
Corrosion of steel must be managed
Remote
Introduction
The Role of Energy Pipelines and Research 8
pipeline research has focused on how to protect the assets outside of company-controlled facilities.
• The distance covered by energy pipelines increases the time to detect and respond to abnormal operations and releases. Robust Supervisory Control And Data Acquisition (SCADA) and leak detection systems have been developed and installed to control the pipelines, monitor flow and operations, and to respond to problems, providing increasingly swift and detailed data from the line.
• Energy pipelines have been designated as “critical infrastructure” by the National Infrastructure Advisory Council, part of the U.S. Department of Homeland Security. The Council has explicitly underscored the need for research to “enhance robustness and reliability” of these assets.2 The importance of pipelines extends both to cyberspace security, because of their reliance on SCADA, and to the physical protection of the assets in the ground.
• Energy pipelines serve growing commodity markets, requiring greater capacity, and better utilization of existing capacity. The need for additional capacity encouraged development of friction-reducing agents for oil pipelines to increase capacity without installing new steel pipe.
• Pipelines are designed and constructed with large margins of safety. Pipeline companies, through research, are continually developing ways to measure operating parameters that were previously not measurable. Further extending this research could enable increased capacity and improved safety.
• Energy pipelines are regulated to assure safe operation and research products, particularly procedures, processes and practices are frequently incorporated into these regulations to level the playing field among operators.
These features of energy pipelines and the contributions of research will be further developed in the coming sections.
Study Terminology
The remainder of this report uses certain conventions in terminology that are useful to review at the outset. As used in this report:
2 “The National Strategy for the Physical Protection of Critical Infrastructures and Key Assets,” February 2003, p. 53. See http://www.whitehouse.gov/pcipb/physical.html.
SCADA
Critical infrastructure
Growing markets for the fuels
Large margin of safety
Safety and economics regulated

Introduction
The Role of Energy Pipelines and Research 9
• “Energy pipelines” refers to pipelines that transport oil or natural gas.
• “Oil” refers to liquid hydrocarbons, also called petroleum, whether unrefined (i.e., crude oil) or processed in a refinery to manufacture an end-use product (i.e., refined petroleum product). There are important differences in crude oil and refined petroleum products pipelines, and the specific term is used where pertinent.
• “Natural gas” and “gas” are used synonymously, and refer to the mixture of gaseous hydrocarbons, primarily methane, used for fuel and manufacturing feedstock. (Only the term “gasoline” – never “gas” – is used to refer to the common refined petroleum product that fuels automobiles.)
• “Research” refers to the broad endeavor that is an exploration for knowledge. It encompasses a full spectrum of efforts on a given subject, from initial knowledge generation, through proof of concept, development, and commercialization. It is not limited to lines of exploration that will result in a product, material or service, but includes improvements in processes, procedures and practices (together, “research products”).
A list of abbreviations and acronyms is available at the front of the report.
“Energy pipelines” “Oil”
“Natural gas”
“Research”
Characteristics of Energy Pipelines
The Role of Energy Pipelines and Research 10
CCHHAAPPTTEERR 11:: CCHHAARRAACCTTEERRIISSTTIICCSS OOFF EENNEERRGGYY PPIIPPEELLIINNEESS
The Importance of Oil & Natural Gas Pipelines
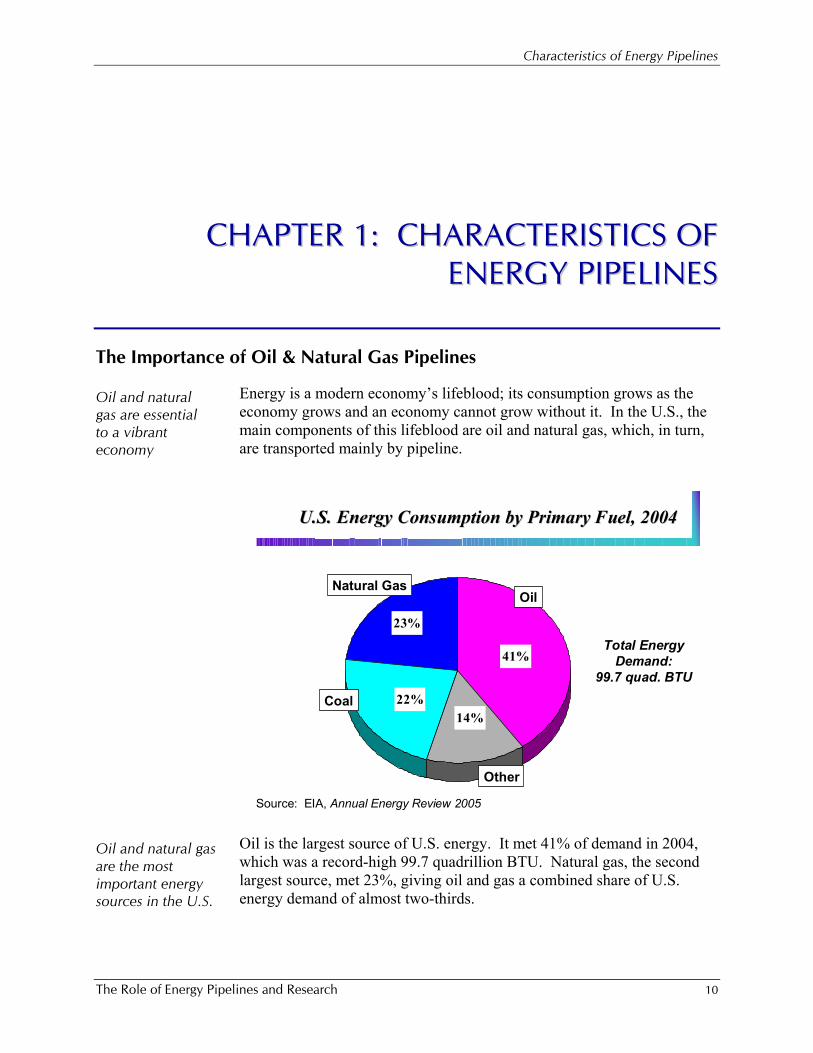
Energy is a modern economy’s lifeblood; its consumption grows as the economy grows and an economy cannot grow without it. In the U.S., the main components of this lifeblood are oil and natural gas, which, in turn, are transported mainly by pipeline.
Oil is the largest source of U.S. energy. It met 41% of demand in 2004, which was a record-high 99.7 quadrillion BTU. Natural gas, the second largest source, met 23%, giving oil and gas a combined share of U.S. energy demand of almost two-thirds.
Oil and natural gas are essential to a vibrant economy
U.S. Energy Consumption by Primary Fuel, 2004U.S. Energy Consumption by Primary Fuel, 2004
41%
14%22%
23%Total Energy
Demand: 99.7 quad. BTU
Source: EIA, Annual Energy Review 2005
Natural GasOil
Coal
Other
Oil and natural gas are the most important energy sources in the U.S.
Characteristics of Energy Pipelines
The Role of Energy Pipelines and Research 11
The importance of oil and natural gas to U.S. energy is not new. They have maintained these market share rankings for 17 of the last 20 years. During that time, energy and oil demand have each grown by 30%, and gas demand has grown by 24%.
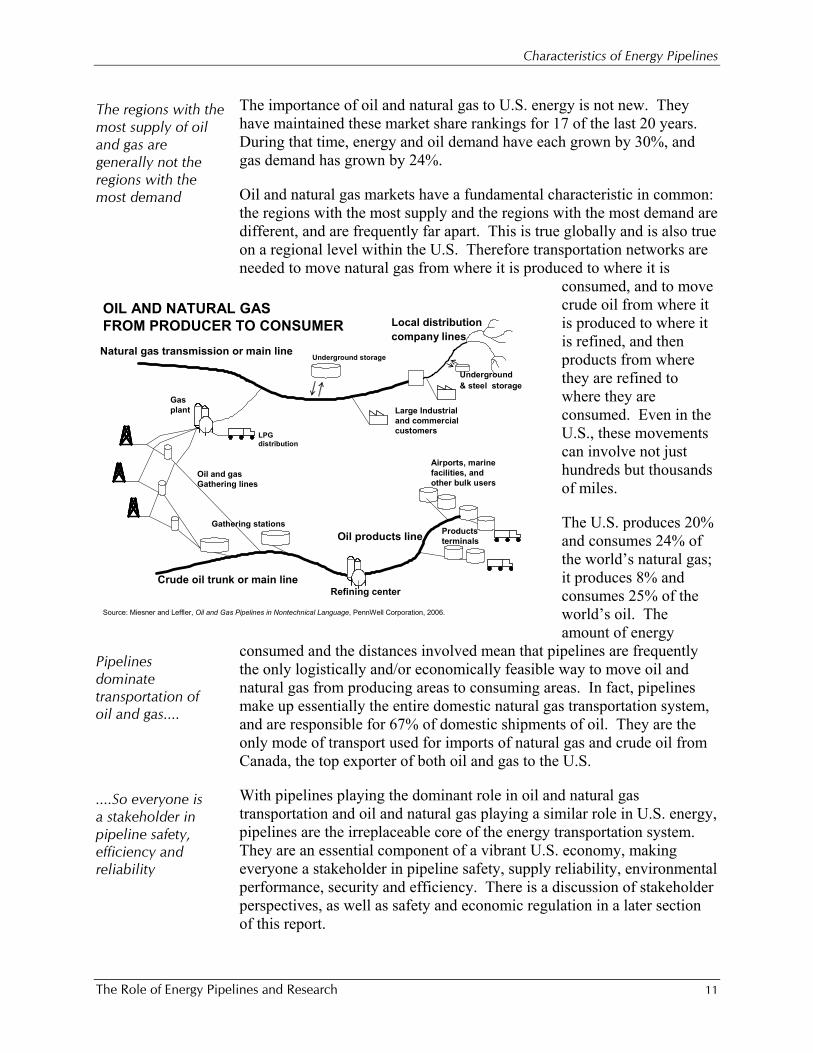
Oil and natural gas markets have a fundamental characteristic in common: the regions with the most supply and the regions with the most demand are different, and are frequently far apart. This is true globally and is also true on a regional level within the U.S. Therefore transportation networks are needed to move natural gas from where it is produced to where it is
consumed, and to move crude oil from where it is produced to where it is refined, and then products from where they are refined to where they are consumed. Even in the U.S., these movements can involve not just hundreds but thousands of miles.
The U.S. produces 20% and consumes 24% of the world’s natural gas; it produces 8% and consumes 25% of the world’s oil. The amount of energy
consumed and the distances involved mean that pipelines are frequently the only logistically and/or economically feasible way to move oil and natural gas from producing areas to consuming areas. In fact, pipelines make up essentially the entire domestic natural gas transportation system, and are responsible for 67% of domestic shipments of oil. They are the only mode of transport used for imports of natural gas and crude oil from Canada, the top exporter of both oil and gas to the U.S.
With pipelines playing the dominant role in oil and natural gas transportation and oil and natural gas playing a similar role in U.S. energy, pipelines are the irreplaceable core of the energy transportation system. They are an essential component of a vibrant U.S. economy, making everyone a stakeholder in pipeline safety, supply reliability, environmental performance, security and efficiency. There is a discussion of stakeholder perspectives, as well as safety and economic regulation in a later section of this report.
....So everyone is a stakeholder in pipeline safety, efficiency and reliability
Pipelines dominate transportation of oil and gas....
The regions with the most supply of oil and gas are generally not the regions with the most demand
Gas plant
Crude oil trunk or main line
Gathering stations
Oil and gas Gathering lines
Oil products line Products terminals
Large Industrial and commercial customers
Local distribution company lines
Underground storage
Underground& steel storage
Refining center
LPG distribution
Natural gas transmission or main line
Airports, marinefacilities, and other bulk users
Source: Miesner and Leffler, Oil and Gas Pipelines in Nontechnical Language, PennWell Corporation, 2006.
OIL AND NATURAL GAS FROM PRODUCER TO CONSUMER
Characteristics of Energy Pipelines
The Role of Energy Pipelines and Research 12
Current Pipeline Networks Pipeline Types and Roles
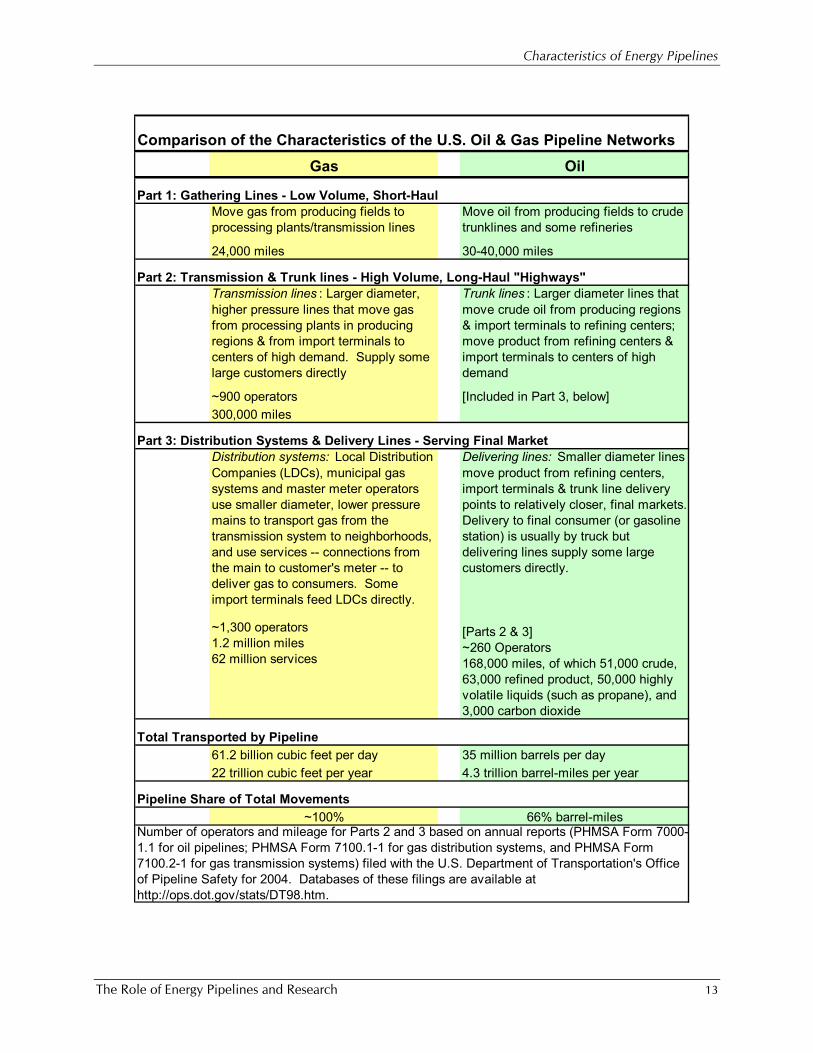
Natural gas and oil networks are composed of pipelines serving three distinct functions. They are normally called gathering, transmission and distribution lines for natural gas; and gathering, trunk and delivery pipelines for oil. More information regarding each function is included in the following table.
As noted, the different types of pipelines are aligned according to their core function. After the gathering lines, which fill the special role of bring gas or oil from production field to a processing facility, the pipeline network is analogous to the road network. The transmission systems, whether for oil or for gas, are the four-lane interstate highways: they take fuel through relatively larger diameter, longer distance, higher pressure lines to large distribution junctions. The distribution system serves as the back roads and neighborhood lanes, supplying fuel to the most distant locations along more and more branches, in smaller diameter, shorter distance, and lower pressure lines. Thus, it is not surprising that almost 60% of the mileage in the gas distribution network’s mains is less than 2” in diameter. At 1.2 million miles, their mileage eclipses the other types of pipelines. They are 4 times the mileage of the gas transmission systems, and 7 times the mileage of the oil trunkline and delivering pipeline systems, and typically operate at less than 10% of the pressure of transmission lines.
Key Differences between Natural Gas and Oil
The main differences between natural gas and oil that impact the design and operation of the pipeline networks are the physical state in which the commodity is transported (natural gas as a gas and oil as a liquid), and the number of different commodities transported in the same pipeline (one in the case of natural gas and many in the case of oil).
Since natural gas is transported in a gaseous state, it is compressible. This means it is possible, over periods of time, to put more natural gas into the pipeline at one end than is withdrawn at the other end, a phenomenon called “packing the line.” Balancing line pack and pressures along the line is a challenge for natural gas transmission lines. If the pressure is too high, suppliers attempting to put natural gas into the line may not be able to force their gas in. If it falls too low, customers seeking to withdraw gas may not be able to get as much out as they need. Oil, on the other hand, is essentially non-compressible meaning what goes in must come out in like volume. Many leak detection systems use volume balance over time. This means, generally speaking, volume-based leak detection systems for oil are less complex and more sensitive than for gas.
Oil and natural gas networks are comprised of 3 types of pipelines
Transmission lines are analogous to interstate highways; distribution lines to neighborhood lanes
Natural gas is compressible; oil is not
Physical state: natural gas as a gas, oil as a liquid
Characteristics of Energy Pipelines
The Role of Energy Pipelines and Research 13
Comparison of the Characteristics of the U.S. Oil & Gas Pipeline NetworksGas Oil
Part 1: Gathering Lines - Low Volume, Short-HaulMove gas from producing fields to processing plants/transmission lines
Move oil from producing fields to crude trunklines and some refineries
24,000 miles 30-40,000 miles
Part 2: Transmission & Trunk lines - High Volume, Long-Haul "Highways"Transmission lines : Larger diameter, higher pressure lines that move gas from processing plants in producing regions & from import terminals to centers of high demand. Supply some large customers directly
Trunk lines : Larger diameter lines that move crude oil from producing regions & import terminals to refining centers; move product from refining centers & import terminals to centers of high demand
~900 operators [Included in Part 3, below]300,000 miles
Part 3: Distribution Systems & Delivery Lines - Serving Final MarketDistribution systems: Local Distribution Companies (LDCs), municipal gas systems and master meter operators use smaller diameter, lower pressure mains to transport gas from the transmission system to neighborhoods, and use services -- connections from the main to customer's meter -- to deliver gas to consumers. Some import terminals feed LDCs directly.
Delivering lines: Smaller diameter lines move product from refining centers, import terminals & trunk line delivery points to relatively closer, final markets. Delivery to final consumer (or gasoline station) is usually by truck but delivering lines supply some large customers directly.
Total Transported by Pipeline61.2 billion cubic feet per day 35 million barrels per day22 trillion cubic feet per year 4.3 trillion barrel-miles per year
Pipeline Share of Total Movements~100% 66% barrel-miles
[Parts 2 & 3]~260 Operators168,000 miles, of which 51,000 crude, 63,000 refined product, 50,000 highly volatile liquids (such as propane), and 3,000 carbon dioxide
~1,300 operators1.2 million miles62 million services
Number of operators and mileage for Parts 2 and 3 based on annual reports (PHMSA Form 7000-1.1 for oil pipelines; PHMSA Form 7100.1-1 for gas distribution systems, and PHMSA Form 7100.2-1 for gas transmission systems) filed with the U.S. Department of Transportation's Office of Pipeline Safety for 2004. Databases of these filings are available at http://ops.dot.gov/stats/DT98.htm.
Characteristics of Energy Pipelines
The Role of Energy Pipelines and Research 14
Compressibility also means that natural gas in the pipeline stores more potential energy (as opposed to kinetic energy) than does the oil in oil pipelines. In the event of a small leak the potential energy stored in the natural gas is released suddenly and can “tear” the pipe apart further, creating a large rupture. On the positive side, the fact that natural gas is transported as a gas means that in the event of a release, there is essentially no environmental impact to surface or ground water. All of the natural gas dissipates into the air. By contrast, since oil is a liquid, it does not dissipate into the atmosphere as quickly as natural gas. Consequently, oil releases, in general, present more environmental challenges than natural gas releases.
Routine operating tasks -- starting and stopping pumps and compressors to increase or decrease pressures, and opening or closing valves to redirect flow – cause pressure waves. Since gas is compressible, natural gas pipelines absorb these pressure changes fairly smoothly. In contrast, because oil is not compressible, pressure waves move through the oil pipeline at the speed of sound. Attempting to stop them suddenly generates pressure waves, much like those that cause water to hammer in homes water systems, and can contribute to a pipeline failure.
Natural gas pipeline networks transport essentially one commodity, natural gas, whereas oil pipeline networks transport a wide variety of crude oils and refined products. This is important because it adds complexity to oil pipeline operations. Natural gas pipelines operate much like a hydrant system and input and offtake points can be added almost at will. Oil pipelines, on the other hand, must carefully control inputs and offtakes to keep incompatible products from mixing. (There have been some recent changes in gas quality which the industry is aggressively addressing. See text box below.)
Emerging Gas Quality Issues
Traditionally, natural gas liquids (ethane, propane, butane, and heavier hydrocarbons that are part of the natural gas stream as it is produced from a well) were more valuable than methane, the gas that comprises most of the natural gas stream as it is delivered to consumers. Accordingly the “raw” natural gas streams from wells were sent through processing plants to extract the heavier molecules – the liquids – before the residual methane entered natural gas transmission pipelines. (The liquids were then used as petrochemical feedstocks, as consumer fuels, or processed further in refineries). The residual gas from these plants was relatively uniform with respect to energy content per MCF. Consumer equipment such as water heaters, stoves, furnaces, and other natural gas appliances were designed to operate at these uniform energy content levels.
Over time gas processing economics changed as natural gas increased in price, and producers can now sometimes receive a higher price for their gas stream if they do not extract the heavier molecules. LNG also contains more of the heavier molecules than traditional natural gas streams, giving it a higher energy content. These two changes lead to quality issues; wider ranging energy content in the gas, and the potential for heavier molecules to drop out as liquids. The natural gas industry is developing standards and practices that deal with these two issues as a way to assure smooth, reliable operations and equitable tariffs structures.
Routine operating tasks cause pressure waves that are easier for gas lines to absorb
Compressibility is important in the event of a failure
One commodity versus many commodities
Characteristics of Energy Pipelines
The Role of Energy Pipelines and Research 15
The need to “batch” oil – keep one product, grade or quality separate from another – in a pipeline is another key difference between oil and gas pipeline operations. (Broadly speaking, gas tendered for pipeline shipment must meet certain specifications relating to energy content per unit, to impurities, to water and liquids content. Once the gas meets the ranges to be classified as pipeline grade, there is no reason to differentiate between one molecule of gas and another.)
Batching oil shipments is a central feature in the efficient distribution of oil in the United States. As previously noted, the oil market in the United States is the largest in the world, encompasses the largest continental area of any developed oil market region, and therefore has, by far, the most oil pipeline mileage. It would not be possible to serve the vast U.S. oil market without batching, so the same pipeline is used for many products, shipped one after the other, instead of using a separate pipeline for each distinct product.
Batching operations keep similar products together and different products apart. For instance, gasoline is kept with gasoline and apart from jet fuel or diesel. The need to batch refined oil products is easy to explain at a high level because the special characteristics and uses of gasoline, distillates and jet fuel are apparent.
To batch in a refined products pipeline, the operator injects one product, then another, and then another. To optimize operations, schedulers carefully consider how to configure the batch arrangement to minimize both the physical mixing, or “interface,” and its economic impact.
Although batching similar products together is most obviously a part of refined product pipeline operations, crude oils are also batched during pipeline transport. Crude oils, as produced, differ with respect to specific gravity, sulfur content, aromatics content, wax content, metals content and other features. These different characteristics are central to a crude oil’s value relative to other crudes. Those that can be refined into an economically desirable mix of products with ease – and less processing equipment – are worth more to a refiner. Refinery operations and investment are carefully optimized based on available crude quality and economics. They thus rely upon pipelines to deliver the crude oil of the same quality as purchased.
Market Centers and Hubs
There are two non-pipe components that are integral to the smooth and efficient operation of the natural gas and oil pipeline networks: market centers or hubs, and storage. The hubs grew up because, as noted earlier, the regions with the most supply are not the regions with the most demand. Hence, the fuels must be transported from where they are produced, imported or refined to where they will be used. The hubs make
Batch sequencing is carefully optimized
Crude oil is also batched
Oil and natural gas market hubs are analogous to airline hubs
By transporting oil in batches, the same pipeline can carry many products – key to efficient distribution
Characteristics of Energy Pipelines
The Role of Energy Pipelines and Research 16
Market hubs make oil and natural gas markets more efficient
these transfers more efficient, by consolidating supply from a number of different directions and sources, and sending it on in different directions and destinations. In this way, the oil and gas market hubs are analogous to an airline’s hub of operations.
In oil and gas terms, these market centers or hubs are locations with multiple pipeline interconnects and access to storage. In the case of oil, the hub may also have non-pipeline transportation options, such as rail or truck. Two of the best known hubs are Henry Hub, LA (natural gas) and Cushing, OK (oil). Both are pricing centers, as are most other hubs.
Oil and natural gas start at the production field or import terminal and flow through their pipeline networks by progressing from hub to hub. Prices offered and bid at the hubs indicate any supply/demand imbalances in the surrounding marketplace, and the transportation options and storage at the hubs allow the flows to react to these signals, restoring the market to balance. Thus, in addition to the contribution to smoothing logistics, hubs perform a market-clearing function and, as such, make both pipeline networks and their commodity markets more price responsive and efficient.
Market centers and hubs have flourished as the oil and natural gas markets have been deregulated.
Storage
Both oil and natural gas pipeline networks have substantial storage facilities. Natural gas must be stored under pressure, so it is normally stored underground in depleted oil or gas fields, aquifers, or mined or leached caverns. It can also be stored above ground in steel pressure vessels, or to a limited extent, in the pipeline itself (known as “line pack”). Oil is normally stored in large above ground steel tanks, with below ground caverns a less common alternative. Originally, storage was developed for operational reasons, but is now a critical factor in making both the pipelines and the markets more efficient.
Pipeline Network for Natural Gas
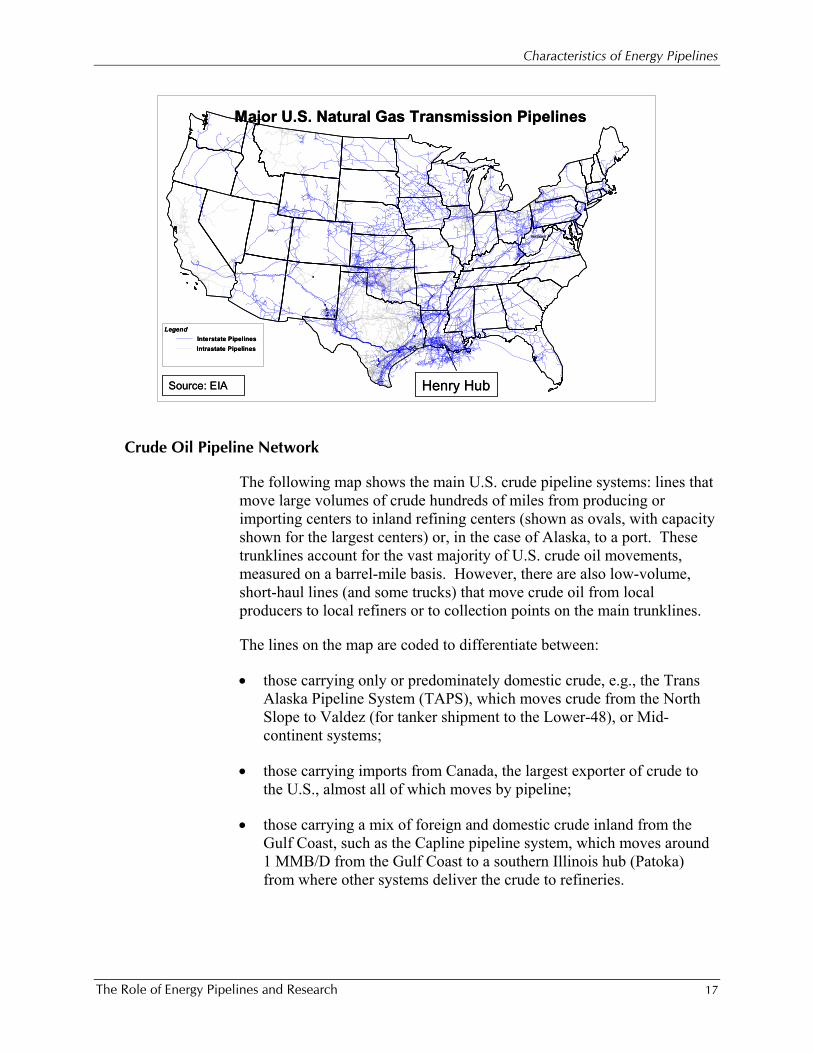
The chart shows how the natural gas pipeline network connects the main natural gas producing areas in the U.S. with the main consuming areas. It also shows where the Canadian natural gas flows enter the U.S. system. The LNG flows are too small to be separately identifiable.
The most active market center, Henry Hub, is highlighted in the seeming web of pipelines near the Louisiana coast. It receives natural gas produced from nearby fields both onshore and offshore, and redirects the gas to markets nearby as well as in the Northeast and Midwest. Other market centers, not shown, are located across the country.
Characteristics of Energy Pipelines
The Role of Energy Pipelines and Research 17
Crude Oil Pipeline Network
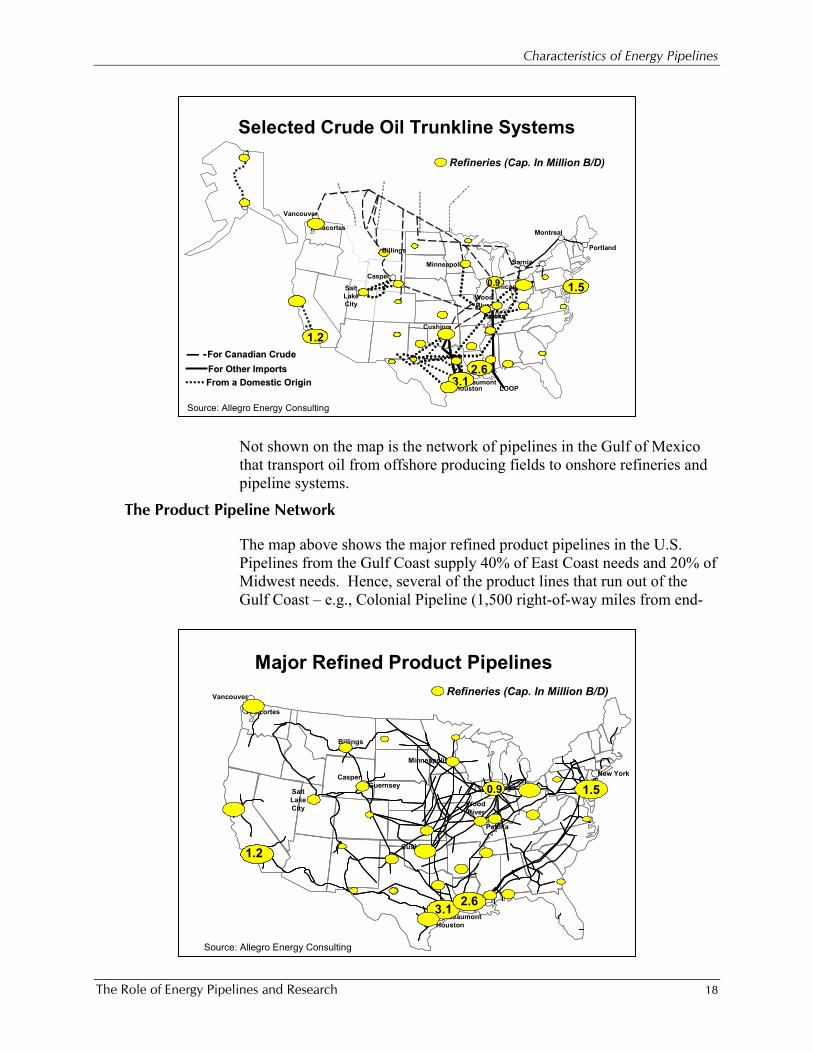
The following map shows the main U.S. crude pipeline systems: lines that move large volumes of crude hundreds of miles from producing or importing centers to inland refining centers (shown as ovals, with capacity shown for the largest centers) or, in the case of Alaska, to a port. These trunklines account for the vast majority of U.S. crude oil movements, measured on a barrel-mile basis. However, there are also low-volume, short-haul lines (and some trucks) that move crude oil from local producers to local refiners or to collection points on the main trunklines.
The lines on the map are coded to differentiate between:
• those carrying only or predominately domestic crude, e.g., the Trans Alaska Pipeline System (TAPS), which moves crude from the North Slope to Valdez (for tanker shipment to the Lower-48), or Mid-continent systems;
• those carrying imports from Canada, the largest exporter of crude to the U.S., almost all of which moves by pipeline;
• those carrying a mix of foreign and domestic crude inland from the Gulf Coast, such as the Capline pipeline system, which moves around 1 MMB/D from the Gulf Coast to a southern Illinois hub (Patoka) from where other systems deliver the crude to refineries.
LegendInterstate PipelinesIntrastate Pipelines
West Virginia
Utah
Henry Hub
Major U.S. Natural Gas Transmission Pipelines
Source: EIA
LegendInterstate PipelinesIntrastate Pipelines
West Virginia
Utah
Henry Hub
Major U.S. Natural Gas Transmission Pipelines
Source: EIA
Characteristics of Energy Pipelines
The Role of Energy Pipelines and Research 18
Not shown on the map is the network of pipelines in the Gulf of Mexico that transport oil from offshore producing fields to onshore refineries and pipeline systems.
The Product Pipeline Network
The map above shows the major refined product pipelines in the U.S. Pipelines from the Gulf Coast supply 40% of East Coast needs and 20% of Midwest needs. Hence, several of the product lines that run out of the Gulf Coast – e.g., Colonial Pipeline (1,500 right-of-way miles from end-
Selected Crude Oil Trunkline Systems
Vancouver
Anacortes
Casper
SaltLakeCity
Montreal
Portland
Cushing
HoustonBeaumont
LOOP
For Canadian CrudeFor Canadian CrudeFor Other ImportsFor Other ImportsFrom a Domestic OriginFrom a Domestic Origin
Minneapolis Sarnia
ChicagoWoodRiver
PatokaPatoka
Refineries (Cap. In Million B/D)
1.21.2
3.1
1.5
2.6
0.9
3.13.1
1.51.5
2.62.6
0.90.9
Billings
Source: Allegro Energy Consulting
Vancouver
Anacortes
Billings
Casper
SaltLakeCity
Guernsey
Minneapolis
Chicago
New York
Cushing
HoustonBeaumont
WoodRiver
Patoka
Major Refined Product Pipelines
3.13.1
1.5
1.21.2
2.62.6
0.9
Refineries (Cap. In Million B/D)
Source: Allegro Energy Consulting

Characteristics of Energy Pipelines
The Role of Energy Pipelines and Research 19
to-end) and Plantation Pipeline (1,100 miles) to the East Coast; Explorer (1,400 miles) and TEPPCO (1,100 miles) to the Midwest – are comparable in scale to crude trunklines. However, these pipelines are not typical. Most product shipments occur via pipelines that are shorter and smaller in diameter. Product pipelines are also generally intra-regional.
Stakeholders and Regulation
The Role of Energy Pipelines and Research 20
CCHHAAPPTTEERR 22:: SSTTAAKKEEHHOOLLDDEERRSS AANNDD RREEGGUULLAATTIIOONN
Overview of Stakeholder Communities
As discussed in the previous section, Americans rely on oil and natural gas for many facets of modern life – cooking, home heating, manufacture of myriad goods from plastics to medicines, generation of electricity, delivering goods. Furthermore, pipelines are the only economic way to move oil and natural gas from where it is produced to where it is used. Thus, the American standard of living depends on the oil and gas moving quietly through a web of interconnected pipelines, twenty-four hours a day, and seven days a week. These vital links means that virtually everyone in the U.S. has a stake in the economic, efficient, environmentally friendly, and safe operation of pipelines.
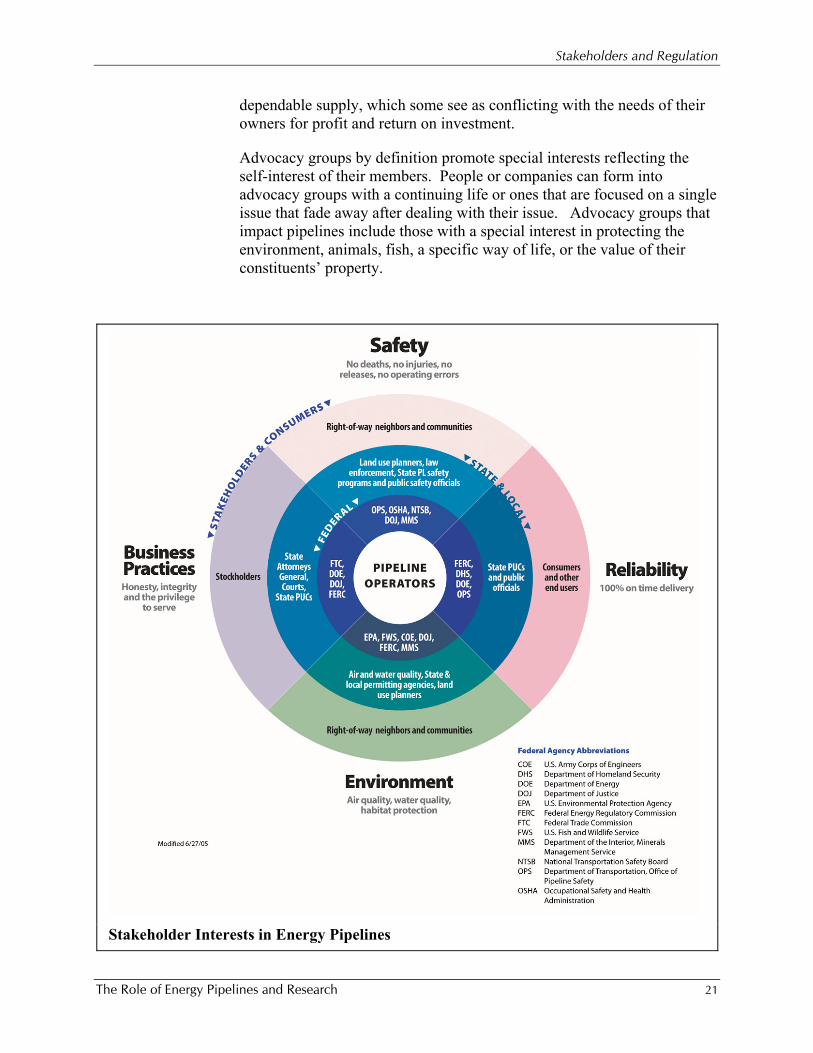
As shown in the graphic on the next page, different stakeholders have different perspectives on pipelines, what is acceptable and what is important. Some stakeholders are easily identified and their needs are obvious: the need for safety and environmental stewardship is a clear focus for communities along the right-of-way. In fact, however, this is also a need for pipeline operators, for regulators, and ultimately for owners. Likewise, customers – shippers – want reliable supply, but in fact so do end-use consumers. Reliability is impossible to achieve without safe operations, however.
The graphic may give the impression each person fits neatly into one group or another. But anyone can belong to several groups. A person can be an owner, customer, interested citizen, and part of an advocacy group. Another can be a landowner, customer, employee, and part of a governmental group like a local volunteer fire department.
With all these stakeholders, each with different and often competing wants, maneuvering for position, pipeline companies must work diligently to keep their focus on the overarching needs of safety and a secure
American standard of life depends on pipelines
Everyone is a stakeholder, but many different perspectives
Stakeholders and Regulation
The Role of Energy Pipelines and Research 21
dependable supply, which some see as conflicting with the needs of their owners for profit and return on investment.
Advocacy groups by definition promote special interests reflecting the self-interest of their members. People or companies can form into advocacy groups with a continuing life or ones that are focused on a single issue that fade away after dealing with their issue. Advocacy groups that impact pipelines include those with a special interest in protecting the environment, animals, fish, a specific way of life, or the value of their constituents’ property.
Stakeholder Interests in Energy Pipelines
Stakeholders and Regulation
The Role of Energy Pipelines and Research 22
Competing interests may fund advocacy groups. For example, the maritime industry may try to stop pipeline construction into coastal areas that would eliminate barge transportation. Pipeline companies may form an advocacy group to promote the project. The purposes of these advocacy groups and special interest groups are the same – to advance their issues – sometimes to the exclusion of all others.
A special case, the media, is not directly a stakeholder but influences stakeholders perceptions about the industry and individual companies. Members of the media may aggressively report pipeline failures and controversies surrounding new pipeline projects. Sensational stories are often considered more newsworthy than the good news stories, a juxtaposition that creates a tension with the industry. When something occurs, such as a pipeline leak, the media’s need is for factual and timely information. However, the pipeline operator’s need is to carefully and thoroughly investigate the incident to assure an appropriate resolution of the problem. The operator may also want to provide good information to the media thereby showing the public that a good faith effort is occurring to repair any problem and to contain and clean up the damage.
Pipeline Regulation
Government agencies fill a special role, because their role as stakeholders is not direct, but as proxies for interests of their citizens and constituencies. As shown in the previous graphic, there are many government agencies that regulate or interact with pipelines in some fashion. At the local level, for instance, there are first responders and emergency personnel, law enforcement agencies, and land use agencies. At the state level, pipelines are subject to the same laws as other commercial enterprises, and subject to some regulations that are specific only to pipelines. Regulation by state Public Service Commissions is a clear example; these agencies may regulate rates for intrastate pipelines, especially gas distribution companies as discussed below, and may have authority to regulate the operations of pipelines in the state.
At the federal level, pipelines are again subject to the same laws and regulations as other businesses, such as those applying to worker safety as administered by the U.S. Department of Labor’s Occupational Health and Safety Administration. They are also subject to the same oversight from the U.S. Department of Justice, the Federal Trade Commission, the Securities and Exchange Commission or the U.S. Environmental Protection Administration as other businesses. There are some agencies, however, that regulate pipeline safety and economics more directly, as discussed below.
Pipelines are subject to the same rules as other enterprises at the federal, state and local level
Stakeholders and Regulation
The Role of Energy Pipelines and Research 23
Safety Regulation
The U.S. Department of Transportation is the primary regulator of the safe operation of pipelines, through its Pipeline and Hazardous Materials Safety Administration’s Office of Pipeline Safety (PHMSA). (Certain offshore pipelines are regulated by the U.S. Department of Interior’s Minerals Management Service.) PHMSA’s regulations address the entire life cycle of pipelines thus providing layers of protection. They incorporate standards and practices that address pipe and component manufacture, shipping practices, construction techniques, operating procedures, operator training, emergency response, oversight, enforcement and, at the end of the life cycle, abandonment. These layers of protection are enabled by research, and enhanced by accident investigation and operating experience.
Federal regulation of pipeline safety began with the passage of the Natural Gas Pipeline Safety Act in 1968, which also established the Office of Pipeline Safety. Now broadly known as the Pipeline Safety Act and codified at 49 USC 60101, the legislation has extended to oil pipelines since 1970. In the early 1990s, PHMSA authority was also extended to cover pipeline environmental issues.
PHMSA’s regulations in 49 CFR Part 191 and Part 192 apply to natural gas transmission and gathering systems and to gas distribution systems. Regulations in 49 CFR Part 195 apply to transportation in “hazardous liquids pipelines,” a statutory term including crude oil and petroleum products and carbon dioxide. (Other sections apply to onshore oil spills contingency plans and LNG.)
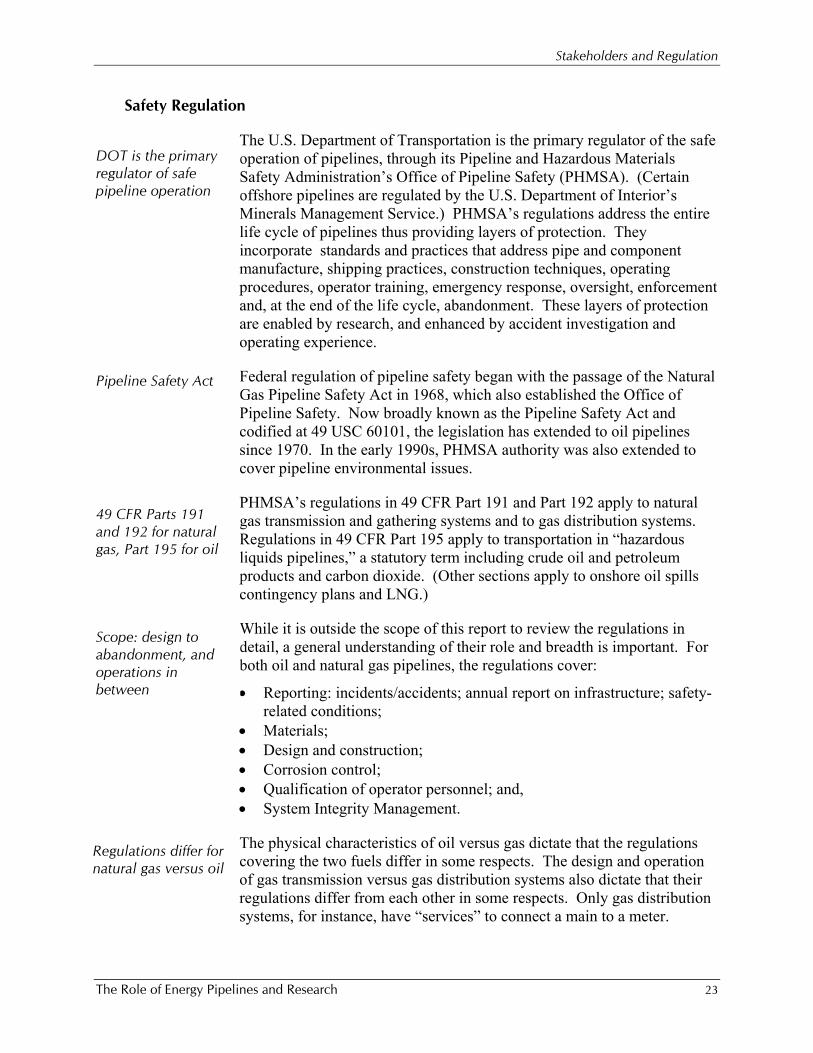
While it is outside the scope of this report to review the regulations in detail, a general understanding of their role and breadth is important. For both oil and natural gas pipelines, the regulations cover:
• Reporting: incidents/accidents; annual report on infrastructure; safety-related conditions;
• Materials; • Design and construction; • Corrosion control; • Qualification of operator personnel; and, • System Integrity Management.
The physical characteristics of oil versus gas dictate that the regulations covering the two fuels differ in some respects. The design and operation of gas transmission versus gas distribution systems also dictate that their regulations differ from each other in some respects. Only gas distribution systems, for instance, have “services” to connect a main to a meter.
DOT is the primary regulator of safe pipeline operation
Pipeline Safety Act
49 CFR Parts 191 and 192 for natural gas, Part 195 for oil
Scope: design to abandonment, and operations in between
Regulations differ for natural gas versus oil
Stakeholders and Regulation
The Role of Energy Pipelines and Research 24
The integrity management regulations, aimed particularly at the areas with highest consequences in the event of a failure, deserve special mention because they reflect a comprehensive, integrated approach to keeping the pipeline in sound operating condition. Prior to the integrity management program (IMP) rules, most regulations addressed one issue at a time. In contrast, the IMP rules require operators to take a system-wide approach, aggressively integrating information from all available sources to improve the performance and condition of the system. Operators must first evaluate which pipeline segments could affect areas with high consequences in the event of a failure.3 Segment-by-segment, operators then assess the relative risks of those segments that could affect a high consequence area, and prioritize the inspection and repair over a prescribed interval. Once the first assessment interval is complete, the next one follows, incorporating lessons learned during and since the last assessment. For oil pipelines, the assessment intervals are five years, and for the gas transmission pipelines, the intervals are seven years. (The five-year interval for oil pipeline was already in place when the Pipeline Safety Improvement Act of 2002 established the seven-year interval for gas transmission pipelines.)4
The regulatory regime also includes inspections of the physical assets and records relating to them, and a system of sanctions, penalties, and fines where an operator fails to follow the regulations.
PHMSA also partners with state agencies to facilitate oversight, particularly of intrastate systems like gas distribution companies. In states with “agency status,” state personnel conduct the safety inspections, following federal regulations from CFR Part 191, Part 192 and Part 195.
Prior to the Pipeline Safety Act, the industry largely relied on consensus standards to drive improvement in materials and operations practices. Consensus standards, developed in a public process and adopted by ballot among members of the issuing organization (often a trade association), were first applied to pipeline issues – steel quality – in the 1920s. By the time federal regulation for pipelines was adopted, many industry standards were already in place: for steel (tightened many times since its first adoption in the 1920s), for welder qualification, for pre-service testing, for weld inspection, for cathodic protection and corrosion control as well as many other topics.
3 For oil pipelines, these are defined by population, and consequences to water and the environment and are mapped. For gas transmission pipelines, these are based on the density of buildings intended for occupancy or as gathering places. 4 For gas distributions systems, designing an effective, workable program has been complicated by their unique characteristics. A regulatory approach was under development in late 2005 for these systems.
Rules on managing integrity in “high consequence areas” were a watershed
PHMSA partners with states
Industry’s consensus standards also make a continuing contribution to safety
Integrity Management regulations take a new approach
Stakeholders and Regulation
The Role of Energy Pipelines and Research 25
It is important to note that consensus standards are stringent. While they may involve varying amounts of flexibility about how to meet a standard, they are nonetheless prescriptive in setting the standard. Standards are not “voluntary” for any member of the issuing organization.5 In the absence of regulation, however, non-members of the issuing organization are not required to meet the standards. An important contribution of regulation, then, is to level the playing field among operators by requiring that all operators meet the same standards.
The need for consensus standards and the better understanding that comes from the process by which they are developed did not end when pipeline regulation began. Industry groups (see box) continue to develop consensus standards. Because of this robust development process, consensus standards are often used as the model for regulation, or incorporated by reference in the regulation, as more than 60 of these standards currently are.
Economic Regulation
Pipelines provide a transportation service. The rates they are allowed to charge their customers are a small percentage of the final delivered cost of energy. The federal government has regulated these rates for decades – since 1906 for oil pipelines and since 1938 for gas pipelines. Unlike most parts of the economy, including oil and gas production companies,
5 Industry consensus groups also develop “recommended practices.” These are not mandatory for members of the issuing organization. Recommended practices, however, are developed with the same process as standards: analysis, debate, and consensus, followed by a ballot to accept the practice. They are a powerful tool for improving practices, and are often incorporated into regulation, making them mandatory for all.
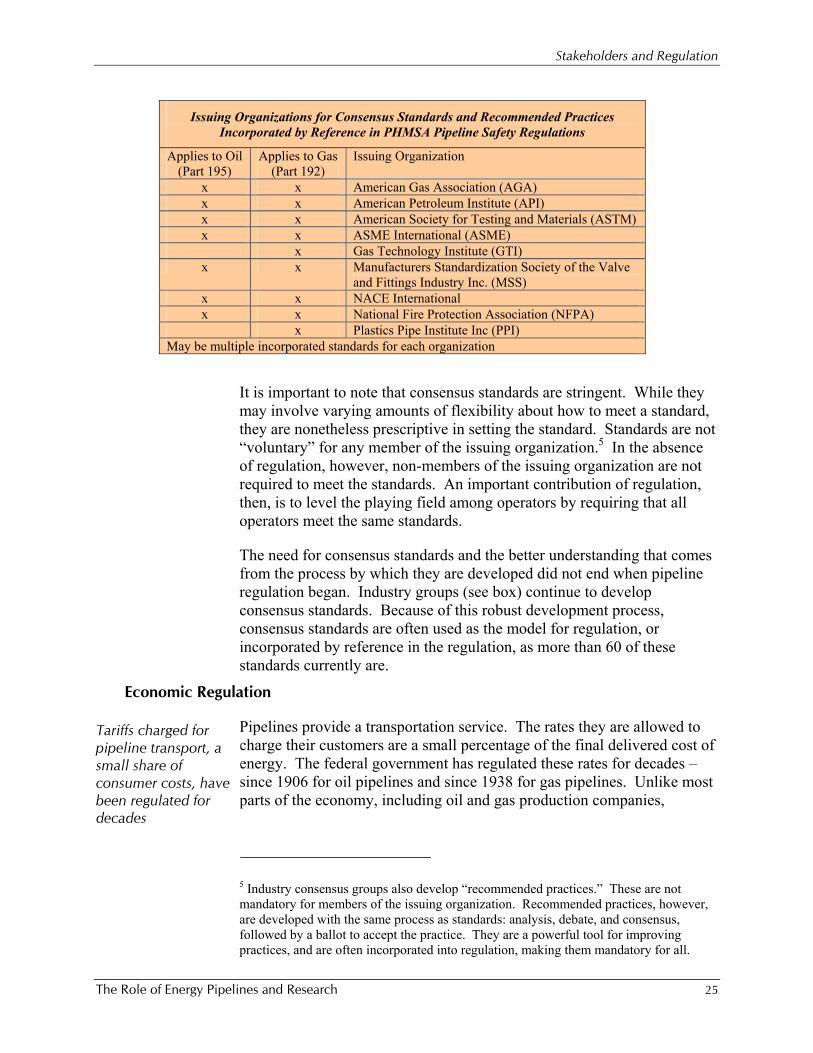
Issuing Organizations for Consensus Standards and Recommended Practices Incorporated by Reference in PHMSA Pipeline Safety Regulations
Applies to Oil (Part 195)
Applies to Gas (Part 192)
Issuing Organization
x x American Gas Association (AGA) x x American Petroleum Institute (API) x x American Society for Testing and Materials (ASTM) x x ASME International (ASME) x Gas Technology Institute (GTI)
x x Manufacturers Standardization Society of the Valve and Fittings Industry Inc. (MSS)
x x NACE International x x National Fire Protection Association (NFPA) x Plastics Pipe Institute Inc (PPI)
May be multiple incorporated standards for each organization
Tariffs charged for pipeline transport, a small share of consumer costs, have been regulated for decades
Stakeholders and Regulation
The Role of Energy Pipelines and Research 26
pipelines cannot raise their rates in response to short term market fluctuations (but they can lower them).
Like all economic regulations, pipeline tariff regulations can have unintended consequences, creating incentives or disincentives not originally anticipated. One such consequence may be real or perceived disincentives for research, if an operator is unable to recover the cost of research in its transportation rates.
The Federal Energy Regulatory Commission (FERC) regulates interstate pipelines rates and state authorities regulate intrastate pipelines rates. The basic rate mechanism pipelines are forced to follow, called Cost of Service (COS) calculations, seems simple enough: calculate an allowed rate of return on investment, add to that total costs, and divide the resulting number by total volumes to arrive at a rate per MCF or BBL. But, over many years of history, involving multiple entities and changes in accounting laws and regulations, the calculations have become complex, providing ample opportunity for differences in interpretation, sometimes leading to litigation.
Interstate Gas Transmission. FERC regulates many aspects of interstate gas transmission pipeline operations, including permitting and siting for new capacity (assessment of need and environmental consequences), as well as rates. The rates of FERC-regulated interstate gas transmission lines were for many years “bundled” with the rates for the commodity itself, and based on individually negotiated contract rates which were regulated within the COS model. Beginning in November 1993 with FERC Order 636, FERC required the unbundling of transport from the deregulated commodity price as an effort to introduce more competition. Now FERC-regulated interstate gas transmission pipelines normally have ceiling rates established by COS calculations and approved by the FERC. These rates include operating and maintenance expenses and an allowed return on investment set as a percentage of the amount of money invested in facilities used to serve customers.
Rates have two components, a demand charge and a volume charge. All fixed costs are recovered in the demand component, and the volume charge is used to recover variable costs. Rates can not exceed the set ceiling on an annual basis, but, pipelines regularly charge rates less than the ceiling to attract more business.
Customers generally fall into two service categories – firm and interruptible. Customers desiring firm service pay higher demand rates for guaranteed service. Local Distribution Companies (LDCs) fall into this category. “Interruptible service” is just that, intestate pipeline companies charge reduced rates to those customers who agree to be interrupted
Cost Of Service calculations establish basic rates
For interstate gas transmission lines, FERC regulates rates and more
Fixed costs are recovered in the demand charge; variable costs are recovered in the volume charge
Customers fall into two categories: “firm” and “interruptible”
Stakeholders and Regulation
The Role of Energy Pipelines and Research 27
during periods of peak demand. Many natural gas fired electric generators, for example, contract for interruptible service.
Local Gas Distribution. Most LDCs are owned by investors but some are owned by local governments. Base rates are set in periodic rate cases before state regulatory commissions and include operating and maintenance expenses, gas commodity costs, and a profit that is equal to a percentage of the amount of money invested in the facilities used and useful in providing service to the utility’s customers. Utilities are allowed to recover the exact cost of the gas that they purchase on customers’ behalf and they may not mark-up or earn a profit on the gas purchased for customers. Because the cost of gas changes frequently and because gas utilities purchase gas continuously, the cost of customer gas usually changes in the time between rate cases. In order for companies to charge customers for these cost changes, most regulators permit companies to employ purchased gas adjustments (PGAs) on a regular basis. Like the interstate gas pipelines, LDCs also have both firm and interruptible rate schedules.
Oil Pipelines. Oil pipelines rates are also regulated by the FERC. Oil pipeline rates are not, and never have been, tied to the price of the commodity. They cannot automatically rise when the cost of the commodity transported increases. While oil pipelines can also use COS to establish maximum rates, the oil pipeline business evolved differently from the natural gas pipeline business and so did COS factors and calculations. Unlike natural gas transmission companies whose costs were “bundled” until 1993, oil pipelines grew up as common carriers charging uniform rates for transport only.
Oil pipelines use COS filings to establish their rates but also use three other mechanisms.
• First, they can adjust their rates annually under an index established by the FERC.
• Second, when areas they serve are deemed “competitive,” they can also petition for “market based rates,” the right to raise and lower their rates in response to market conditions affecting transportation. (The number of market-based rates is limited.)
• Finally, if oil pipelines can convince all their customers through negotiations they deserve higher rates, the FERC will grant the increase.
Rates charged by local gas distribution companies are set by state regulatory commissions
Oil pipeline rates are regulated by FERC, too.
The Energy Landscape
The Role of Energy Pipelines and Research 28
CCHHAAPPTTEERR 33:: TTHHEE EENNEERRGGYY LLAANNDDSSCCAAPPEE
Evolving As Oil & Natural Gas Evolve
To be a positive factor for U.S. economic growth over the coming decades, pipelines must continue to anticipate the future needs of the oil and natural gas markets, and adapt their networks and operations accordingly. This chapter analyzes what adaptations might be needed.
The Energy Information Administration’s Annual Energy Outlook 20066 (AEO) frames the outlook for U.S. oil and natural gas: how much will demand grow, where and in what sectors; how much demand will be met from domestic supply and how much from imports; how will supply change regionally. Each of the questions above has a direct bearing on pipelines – what capacity is needed where, what kind of consumers will be served and what will be their demand patterns, what seasonal demand patterns will impact pipeline utilization.
This chapter uses the AEO to identify the pressure points in the outlook and assess their implications for oil and gas pipeline networks. It is important to note, however, that the AEO is only one forecast; there are other views available in the marketplace. In addition, the forecast discussed in this chapter reflects a point estimate in what is, in reality, a continuum of evolving energy supply and demand relationships. The forecast prepared in 2006 shows a markedly different outlook from the one prepared in 2005, and will probably differ in turn from the forecast prepared in 2007. Thus, the discussion below should be taken as an illustration of the implications that may be derived from the AEO’s 2006 snapshot of the future.
6 Annual Energy Outlook 2006 with Projections to 2030, DOE/EIA-0383(2006). While the EIA’s report includes projections to 2030, this chapter uses the reference case projections to 2025 only. The choice of 2025 was a matter of judgment, balancing the increasing uncertainty that comes with longer time frames with the desire to reflect a long-term, not a medium-term, view. Also, the 2006 version of the AEO was the first time that the EIA projection extended to 2030, and few other forecasters have yet addressed the 2030 outlook, introducing additional uncertainty.
EIA’s Annual Energy Outlook
Illustrative only: one forecast, one year
The Energy Landscape
The Role of Energy Pipelines and Research 29
Importantly, the chapter also describes the current shape of the nation’s oil and gas markets, to provide better understanding of the role of oil and natural gas pipelines.
Among the EIA’s key assumptions for the period 2004 through 2025:
• U.S. GDP grows by 3.0% per year – in line with long-run economic growth;
• In real terms, both oil and gas prices decline from today’s high levels over the next decade and then increase. U.S. gas prices in 2025 are expected to be about the same, at nearly $5.50/MCF, while world oil prices in 2025 are expected to be about one-third higher, at $54/barrel (2004 dollars). (Note: In nominal dollars, the prices are $9.00/MCF and $90/barrel respectively in 2025.)
The Natural Gas Market Today Natural Gas Demand
At 22.4 TCF, the U.S. is by far the largest natural gas market in the world. Demand grew rapidly over 1985-1995 but then stagnated, with growth in electricity generation offsetting losses in the industrial sector. The gas market still depends most heavily on demand from the industrial sector (38% share). However, natural gas has fueled over 90% of all new generating capacity over the last 5 years, due to its lower capital costs, shorter construction times, higher operating efficiency and lower emissions. Electricity generation now accounts for 1/4 of all U.S. gas use.
Even though natural gas remains highly important to the residential and commercial sectors, supplying around 3/4 of these sectors’ non-electrical energy (and 40% of their total energy including electricity), these two sectors together now account for only just over 1/3 of all natural gas demand. Thanks to their seasonality, however, the sectors’ influence on the structure of the pipeline network is considerably greater.
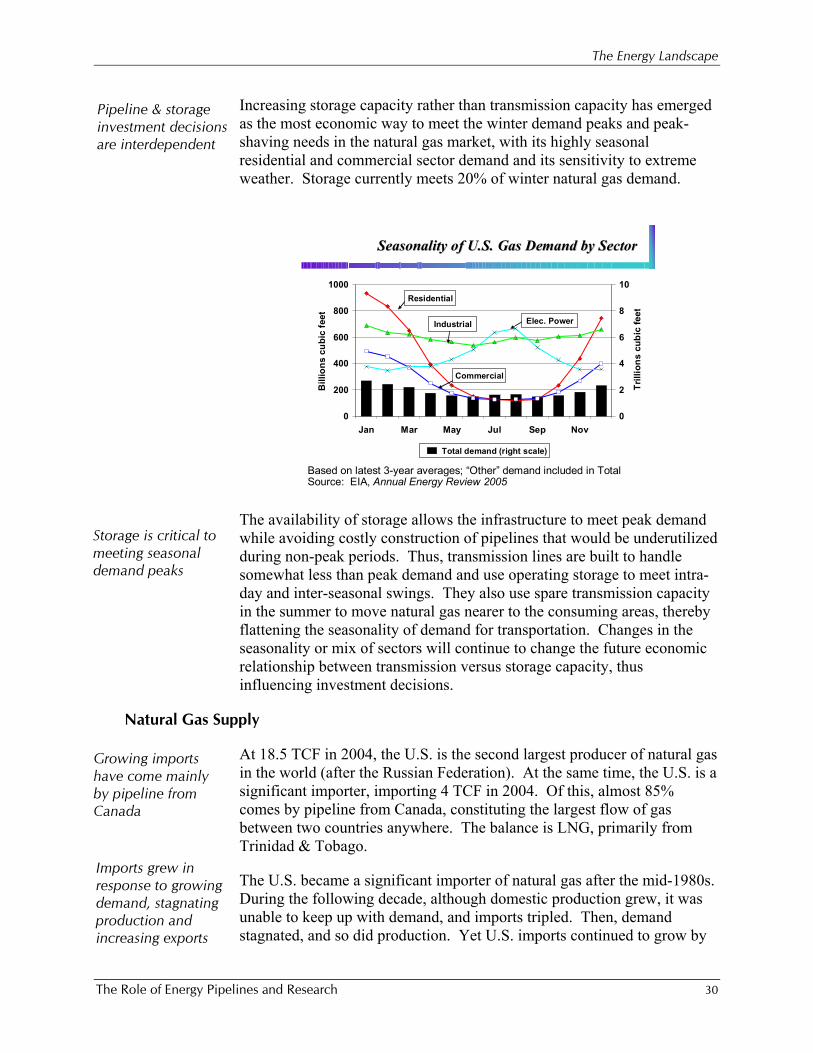
Seasonality
In the residential sector, winter demand is 7 times summer demand, and in the commercial sector, it is 4 times greater. In contrast, the industrial sector’s winter tilt is slight, as its natural gas meets mainly power or feedstock needs, and the electric power sector has a modest counter-cyclical summer peak. The net result is that total natural gas demand is higher in the winter than in the summer by a factor of around two. This demand seasonality, so pronounced at the national level, is also reflected in all the regional markets except the most southern.
Electricity generation is by far the fastest growing end-use for natural gas
Seasonality in residential and commercial demand is a key influence on gas markets and infrastructure
Assumptions
The Energy Landscape
The Role of Energy Pipelines and Research 30
Pipeline & storage investment decisions are interdependent
Storage is critical to meeting seasonal demand peaks
Growing imports have come mainly by pipeline from Canada
Increasing storage capacity rather than transmission capacity has emerged as the most economic way to meet the winter demand peaks and peak- shaving needs in the natural gas market, with its highly seasonal residential and commercial sector demand and its sensitivity to extreme weather. Storage currently meets 20% of winter natural gas demand.
The availability of storage allows the infrastructure to meet peak demand while avoiding costly construction of pipelines that would be underutilized during non-peak periods. Thus, transmission lines are built to handle somewhat less than peak demand and use operating storage to meet intra-day and inter-seasonal swings. They also use spare transmission capacity in the summer to move natural gas nearer to the consuming areas, thereby flattening the seasonality of demand for transportation. Changes in the seasonality or mix of sectors will continue to change the future economic relationship between transmission versus storage capacity, thus influencing investment decisions.
Natural Gas Supply
At 18.5 TCF in 2004, the U.S. is the second largest producer of natural gas in the world (after the Russian Federation). At the same time, the U.S. is a significant importer, importing 4 TCF in 2004. Of this, almost 85% comes by pipeline from Canada, constituting the largest flow of gas between two countries anywhere. The balance is LNG, primarily from Trinidad & Tobago.
The U.S. became a significant importer of natural gas after the mid-1980s. During the following decade, although domestic production grew, it was unable to keep up with demand, and imports tripled. Then, demand stagnated, and so did production. Yet U.S. imports continued to grow by
Imports grew in response to growing demand, stagnating production and increasing exports
Seasonality of U.S. Gas Demand by SectorSeasonality of U.S. Gas Demand by Sector
0
200
400
600
800
1000
Jan Mar May Jul Sep Nov
Bill
ions
cub
ic fe
et
0
2
4
6
8
10
Trill
ions
cub
ic fe
et
Residential
Elec. PowerIndustrial
Commercial
Total demand (right scale)
Based on latest 3-year averages; “Other” demand included in TotalSource: EIA, Annual Energy Review 2005
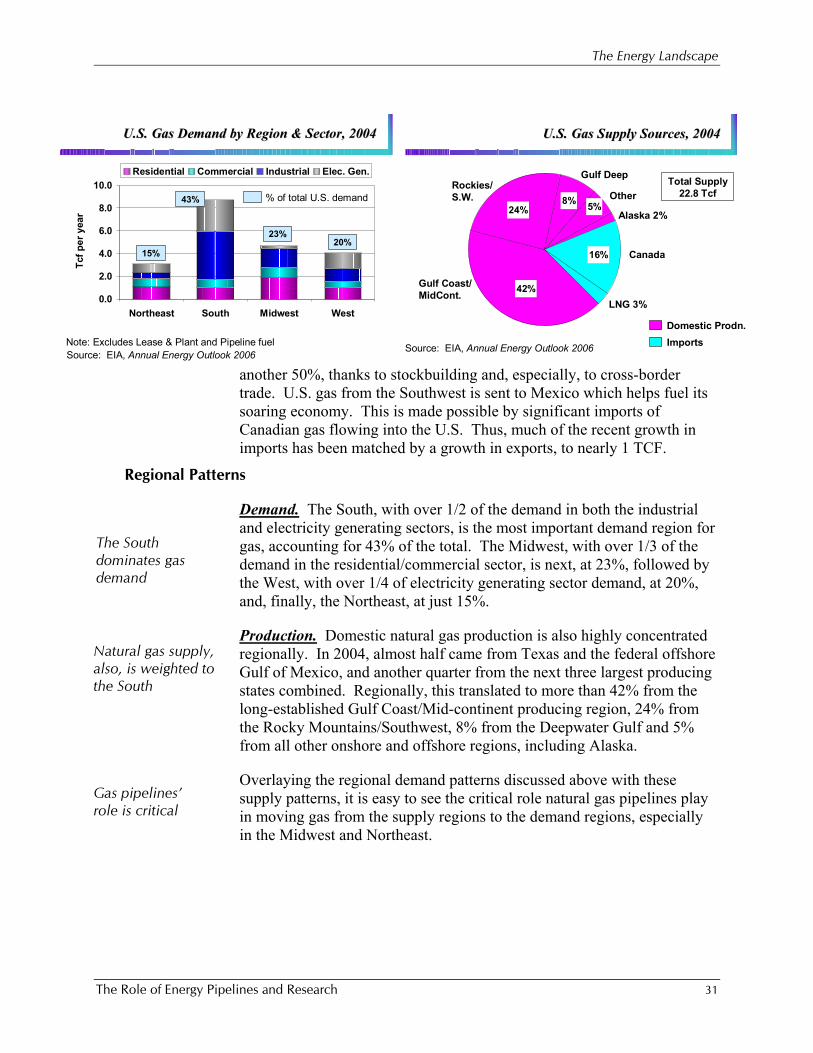
The Energy Landscape
The Role of Energy Pipelines and Research 31
The South dominates gas demand
Natural gas supply, also, is weighted to the South
U.S. Gas Demand by Region & Sector, 2004U.S. Gas Demand by Region & Sector, 2004
0.0
2.0
4.0
6.0
8.0
10.0
Northeast South Midwest West
Tcf p
er y
ear
Residential Commercial Industrial Elec. Gen.
Source: EIA, Annual Energy Outlook 2006
15%
43%
23%20%
% of total U.S. demand
Note: Excludes Lease & Plant and Pipeline fuel
another 50%, thanks to stockbuilding and, especially, to cross-border trade. U.S. gas from the Southwest is sent to Mexico which helps fuel its soaring economy. This is made possible by significant imports of Canadian gas flowing into the U.S. Thus, much of the recent growth in imports has been matched by a growth in exports, to nearly 1 TCF.
Regional Patterns
Demand. The South, with over 1/2 of the demand in both the industrial and electricity generating sectors, is the most important demand region for gas, accounting for 43% of the total. The Midwest, with over 1/3 of the demand in the residential/commercial sector, is next, at 23%, followed by the West, with over 1/4 of electricity generating sector demand, at 20%, and, finally, the Northeast, at just 15%.
Production. Domestic natural gas production is also highly concentrated regionally. In 2004, almost half came from Texas and the federal offshore Gulf of Mexico, and another quarter from the next three largest producing states combined. Regionally, this translated to more than 42% from the long-established Gulf Coast/Mid-continent producing region, 24% from the Rocky Mountains/Southwest, 8% from the Deepwater Gulf and 5% from all other onshore and offshore regions, including Alaska.
Overlaying the regional demand patterns discussed above with these supply patterns, it is easy to see the critical role natural gas pipelines play in moving gas from the supply regions to the demand regions, especially in the Midwest and Northeast.
Gas pipelines’ role is critical
U.S. Gas Supply Sources, 2004U.S. Gas Supply Sources, 2004
16%
5%8%24%
42%
Source: EIA, Annual Energy Outlook 2006
Canada
LNG 3%
Rockies/S.W.
Gulf Deep
Other
Alaska 2%
Gulf Coast/MidCont.
Domestic Prodn.Imports
Total Supply 22.8 Tcf
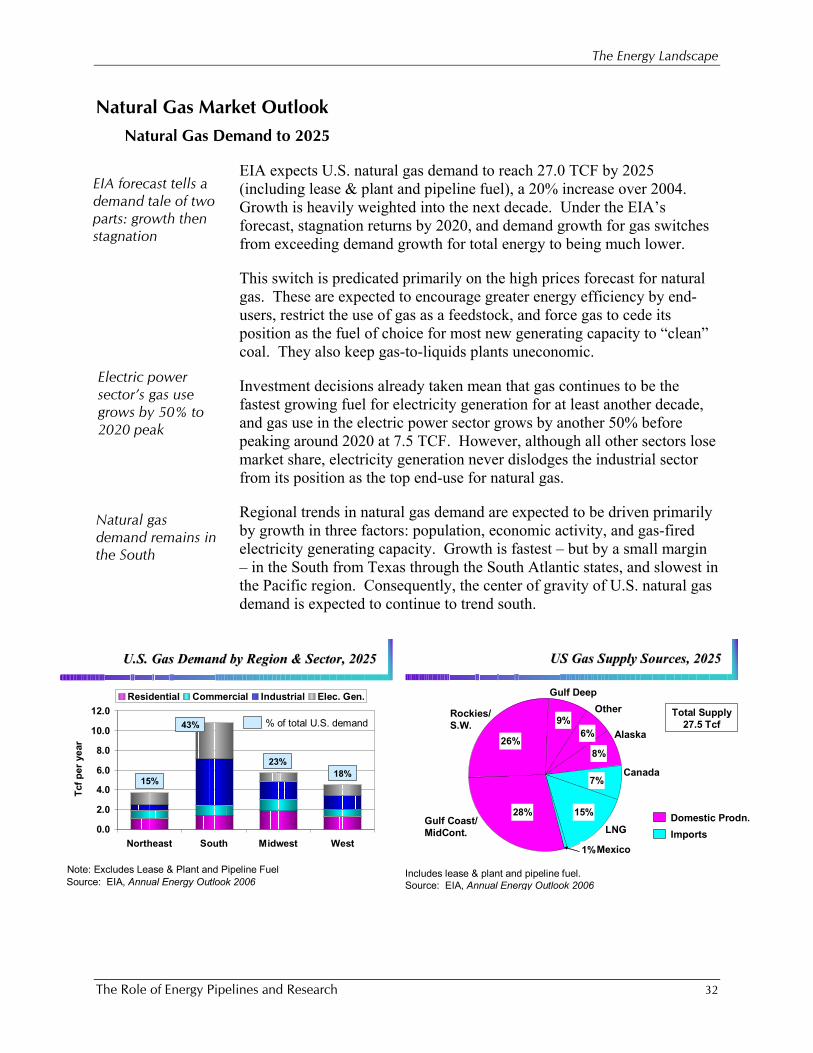
The Energy Landscape
The Role of Energy Pipelines and Research 32
U.S. Gas Demand by Region & Sector, 2025U.S. Gas Demand by Region & Sector, 2025
0.0
2.0
4.0
6.0
8.0
10.0
12.0
Northeast South Midwest West
Tcf p
er y
ear
Residential Commercial Industrial Elec. Gen.
Source: EIA, Annual Energy Outlook 2006
15%
43%
23%18%
% of total U.S. demand
Note: Excludes Lease & Plant and Pipeline Fuel
US Gas Supply Sources, 2025US Gas Supply Sources, 2025
8%
15%28%
26%
9%6%
7%
1%
Includes lease & plant and pipeline fuel.Source: EIA, Annual Energy Outlook 2006
Canada
LNG
Rockies/S.W.
Gulf DeepOther
Alaska
Gulf Coast/MidCont.
Domestic Prodn.Imports
Total Supply 27.5 Tcf
Mexico
Natural Gas Market Outlook Natural Gas Demand to 2025
EIA expects U.S. natural gas demand to reach 27.0 TCF by 2025 (including lease & plant and pipeline fuel), a 20% increase over 2004. Growth is heavily weighted into the next decade. Under the EIA’s forecast, stagnation returns by 2020, and demand growth for gas switches from exceeding demand growth for total energy to being much lower.
This switch is predicated primarily on the high prices forecast for natural gas. These are expected to encourage greater energy efficiency by end-users, restrict the use of gas as a feedstock, and force gas to cede its position as the fuel of choice for most new generating capacity to “clean” coal. They also keep gas-to-liquids plants uneconomic.
Investment decisions already taken mean that gas continues to be the fastest growing fuel for electricity generation for at least another decade, and gas use in the electric power sector grows by another 50% before peaking around 2020 at 7.5 TCF. However, although all other sectors lose market share, electricity generation never dislodges the industrial sector from its position as the top end-use for natural gas.
Regional trends in natural gas demand are expected to be driven primarily by growth in three factors: population, economic activity, and gas-fired electricity generating capacity. Growth is fastest – but by a small margin – in the South from Texas through the South Atlantic states, and slowest in the Pacific region. Consequently, the center of gravity of U.S. natural gas demand is expected to continue to trend south.
EIA forecast tells a demand tale of two parts: growth then stagnation
Natural gas demand remains in the South
Electric power sector’s gas use grows by 50% to 2020 peak
The Energy Landscape
The Role of Energy Pipelines and Research 33
Natural Gas Supply to 2025
Import Gap Grows Moderately
With the historically high projected prices dampening demand and encouraging production, EIA forecasts that the growth in natural gas demand will be met by a more homegrown supply mix - 60% domestic: 40% imports - than in the recent past. Exports dip, as Mexico starts importing LNG directly. By 2025, imports account for 23% (20% net) of U.S. gas supplies, marking only a modest increase in the U.S. gas market’s import dependence.
Regional Shift in Production
The production of conventional natural gas onshore has become more challenging in recent years. Hence, domestic natural gas supply is expected to remain below its 1973 high, in spite of prices at historic highs, advances in technology and the start-up of the Alaskan gas pipeline. It is projected to peak at over 21.5 TCF around 2020.
The most significant, sustained growth in natural gas production in recent years has come from unconventional sources (shale, tight sands, coal bed methane). Unconventional production grew from 15% of the U.S. Lower-48 total in 1990 to over 40% in 2004 and is expected to account for nearly half by 2025.
Production in the Rocky Mountain region more than doubled between 1990 and 2004, reflecting the region’s role as a primary player in natural gas from unconventional sources. Growth is expected to be more regionally dispersed over the next two decades, with the Northeast and Southwest combined adding as much as the Rocky Mountain region (+1.1 TCF), as they also become important producers of unconventional gas.
Within the Rocky Mountain region, the development focus is moving from the San Juan Basin in New Mexico to the Green River, Uinta-Piceance and Wind River basins in Utah, Colorado and Wyoming. Thus, the region’s center of gravity of production will move north. New pipelines are needed to move this new production to the energy hungry Mid-continent. Some new capacity is already planned for these shipments.
There are two other bright spots for U.S. natural gas production. EIA’s forecast assumes that a North Slope Alaska natural gas pipeline will begin transporting gas to the Lower-48 States after 2015, leading to a production plateau of 2.2 TCF for Alaska. In the Deepwater Gulf, the region is forecast to return to production growth despite a lingering impact from 2005’s hurricanes Rita and Katrina, peaking before 2020 at 75% above
U.S. import dependency rises to 23%
Within the Rockies, production moves north
Other bright spots: Alaska and the Deepwater Gulf of Mexico
EIA has a conservative outlook for domestic gas supply
Lower-48 growth is in the Rockies, Southwest & Northeast
Unconventional gas is the most important domestic source
The Energy Landscape
The Role of Energy Pipelines and Research 34
2004 levels. (The declines in the onshore Gulf Coast and shallow water Gulf, however, are expected to outweigh the growth in the Deepwater, so that total Gulf Coast production shrinks.)
Overall, these forecasts indicate a regional shift in U.S. natural gas production away from the traditional producing regions toward those that have emerged through new technologies. These regions lie mainly to the west and north. Just how far production swings in either direction depends critically on which route the North Slope Alaska pipeline follows: the new frontrunner, across Canada to the Midwest; or via Valdez. This new supply will require new capacity, either through new line construction, or expansion of existing lines, or both.
Shifting Imports
On the import side, the emphasis is expected to swing sharply away from Canada – supplier of 85% of the 4.3 TCF of imports currently - and to LNG – expected to supply 66% of the 6.2 TCF of imports projected for 2025.
In Canada, strong domestic demand and declining conventional production mean its pipeline exports to the U.S. exports are forecast to drop by nearly a half, despite the forecast start up of the Mackenzie Delta pipeline mid-period. LNG is expected to fill this gap and also meet all the expected 2 TCF growth in U.S. natural gas imports. Until recently, LNG was barely on the U.S. supply radar. It had only a 3% share of the U.S. natural gas market by 2004. It is forecast to be 15% by 2025.
There are strong indications that LNG capacity will keep pace with market needs. The four LNG terminals that have been in operation for some time have expansions in the works. The U.S. got its first new LNG terminal in 2005, after a 25 year hiatus, and many others have been approved or proposed. Economics, politics and logistics point to the vast majority of the early movers being, like 2005’s new terminal, on the Gulf Coast. In addition, the four existing terminals plan expansions.
Implications for Natural Gas Pipelines
Based on the current natural gas pipeline network and on the AEO’s forecast growth patterns for U.S. gas demand and for natural gas supplies to the U.S. market discussed above, the network will need to make the following adjustments:
-Add distribution capacity especially in the South;
-Add feeder lines to integrate new LNG terminals on the Gulf Coast into the transmission system;
-Tie offshore LNG terminals into the deepwater Gulf pipeline system;
Natural gas production shifts to the west and north
15% of U.S. gas supply to come from LNG
Gulf Coast to have large share of LNG growth
Imports shift from Canada to LNG
The Energy Landscape
The Role of Energy Pipelines and Research 35
-Add transmission lines from Colorado/Wyoming to the Midwest markets to handle unconventional production from new basins in the Rocky Mountain region;
-Add transmission line capacity from Canada into the Midwest for the post-2015 period if the trans-Canada route is chosen for the North Slope Alaska natural gas pipeline;
-Add connections from transmission systems to deliver directly to new electricity generating capacity, especially in Texas and the Southeast;
-Rebalance transmission and storage to account for a less pronounced winter peak in demand as demand from the electricity sector outstrips demand in the winter-peaking sectors;
-Expand gathering systems in the Rocky Mountain region to handle production growth; and
-Reduce/underutilize gathering system capacity in declining production areas elsewhere such as the onshore Gulf Coast.
The Oil Market Today Oil Demand
There are many similarities between oil and gas consuming markets. For instance, the U.S. is the largest consumer of oil in the world, just as it is the largest consumer of gas. In addition, oil meets about the same proportion of industrial sector energy demand as natural gas does. But there the similarities end, because of the near total dependence of the transportation sector on oil. The least important sector for gas, transportation is the most important for oil. Fuel for movement of goods and people by road, rail, water and air – primarily gasoline, diesel and jet fuel – accounts for two-thirds of all oil demand, while oil accounts for over 97% of transportation’s fuel needs.7 Oil has only a small role in the residential and commercial sectors, except in the Northeast.
Reflecting this sector mix, transportation fuels dominate U.S. oil demand. Of the 20.7 MMB/D total in 2004, gasoline accounted for 44%, distillate fuel oil (which is mostly diesel) a further 20% and jet fuel another 8%. Adding in feedstocks for industry, “light products” made up almost 90% of U.S. oil demand, the highest percentage for any country worldwide. These light products are both the most difficult and costly to produce and the products most commonly transported by pipeline.
7 In addition to the products and uses listed, heavy fuel oil is used to power oceangoing tankers. This “residual fuel oil” amounts to a small share of overall U.S. transportation demand. It is not shipped in pipelines.
Oil and the transportation sector are each other’s largest demand component
“Light products,” the type carried by pipelines, account for 90% of oil demand
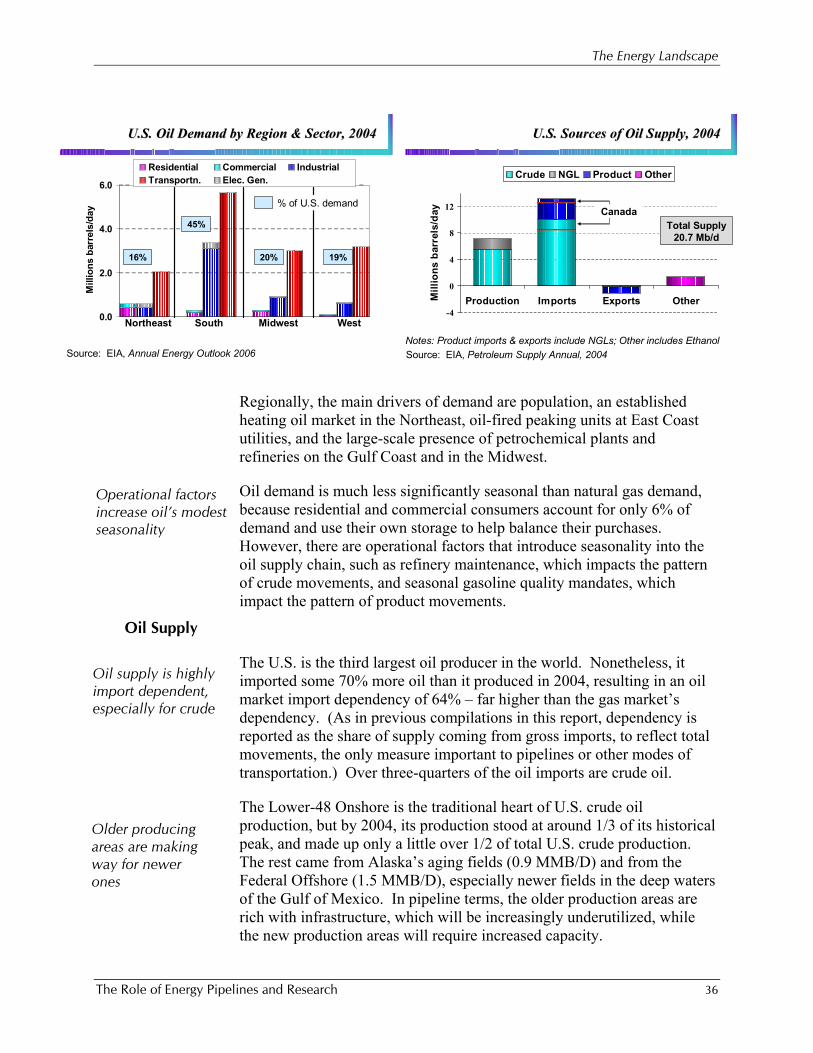
The Energy Landscape
The Role of Energy Pipelines and Research 36
Operational factors increase oil’s modest seasonality
Oil supply is highly import dependent, especially for crude
0.0
2.0
4.0
6.0
Mill
ions
bar
rels
/day
Residential Commercial IndustrialTransportn. Elec. Gen.
U.S. Oil Demand by Region & Sector, 2004U.S. Oil Demand by Region & Sector, 2004
Source: EIA, Annual Energy Outlook 2006
16%
45%
20% 19%
Northeast South Midwest West
% of U.S. demand
Regionally, the main drivers of demand are population, an established heating oil market in the Northeast, oil-fired peaking units at East Coast utilities, and the large-scale presence of petrochemical plants and refineries on the Gulf Coast and in the Midwest.
Oil demand is much less significantly seasonal than natural gas demand, because residential and commercial consumers account for only 6% of demand and use their own storage to help balance their purchases. However, there are operational factors that introduce seasonality into the oil supply chain, such as refinery maintenance, which impacts the pattern of crude movements, and seasonal gasoline quality mandates, which impact the pattern of product movements.
Oil Supply
The U.S. is the third largest oil producer in the world. Nonetheless, it imported some 70% more oil than it produced in 2004, resulting in an oil market import dependency of 64% – far higher than the gas market’s dependency. (As in previous compilations in this report, dependency is reported as the share of supply coming from gross imports, to reflect total movements, the only measure important to pipelines or other modes of transportation.) Over three-quarters of the oil imports are crude oil.
The Lower-48 Onshore is the traditional heart of U.S. crude oil production, but by 2004, its production stood at around 1/3 of its historical peak, and made up only a little over 1/2 of total U.S. crude production. The rest came from Alaska’s aging fields (0.9 MMB/D) and from the Federal Offshore (1.5 MMB/D), especially newer fields in the deep waters of the Gulf of Mexico. In pipeline terms, the older production areas are rich with infrastructure, which will be increasingly underutilized, while the new production areas will require increased capacity.
Older producing areas are making way for newer ones
U.S. Sources of Oil Supply, 2004U.S. Sources of Oil Supply, 2004
-4
0
4
8
12
Production Imports Exports OtherMill
ions
bar
rels
/day
Crude NGL Product Other
Source: EIA, Petroleum Supply Annual, 2004
Canada
Notes: Product imports & exports include NGLs; Other includes Ethanol
Total Supply 20.7 Mb/d
The Energy Landscape
The Role of Energy Pipelines and Research 37
Oil products movements are nearly all by pipeline, too
Combining the supply and demand patterns with the economic and historical factors that have driven refinery investment, the net result is that: 1) most refineries are now large and clustered in refining centers; 2) no region produces enough local crude to support either its refining needs or its local demand for products; and 3) the Gulf Coast produces significantly more product than it consumes, while the Midwest and, especially, the East Coast produce less.
The most important refining centers are located on the Gulf Coast, which gets its supply via pipeline from domestic fields onshore and offshore, and from waterborne imports. The West Coast has significant refining capacity which takes domestic crude oils via pipeline, tanker shipments of Alaskan crude (previously transported by pipeline), and oceangoing imports. In Washington State, refineries also receive Canadian crude oil via pipeline. In the Midwest, refineries receive virtually all of their supplies by pipeline, either from domestic fields, from Canada, or supplied from abroad through the Gulf Coast and then by pipeline to refineries in the Midwest. Of all the major refining centers, only the refineries in the Mid-Atlantic area on the East Coast do not receive pipelined shipments; their supply comes from abroad in tankers. The Rocky Mountain region, while a small market in terms of the U.S. total, is rapidly growing and gets all of its supply via pipeline either from Canada or domestic fields.
Products movements from the refining centers are also nearly all by pipeline, especially the movements that carry high volumes of products between regions. Primary markets for waterborne transportation are specialty markets: along the Northeast coast, across the Gulf of Mexico to the South Atlantic, and scattered local barge movements on rivers in other areas.
Thus, the main keys to resolving the imbalances between crude supply, refining and product consumption are the large-scale networks of crude pipelines and product pipelines that crisscross much of the U.S.
Oil Market Outlook Oil Demand to 2025
By Sector
The rate of oil demand growth is expected to parallel the growth forecast for total energy. Almost 90% of the forecast growth in oil demand comes from transportation, as oil loses its more price sensitive markets but the internal combustion engine remains relatively unchallenged. Thus, transportation is projected to become even more dominant (71%) over the next two decades.
Most refineries are clustered, improving logistics efficiency
Transportation becomes even more dominant
The pipeline network is key to resolving regional imbalances
Pipelines feed the refineries everywhere but the East Coast.
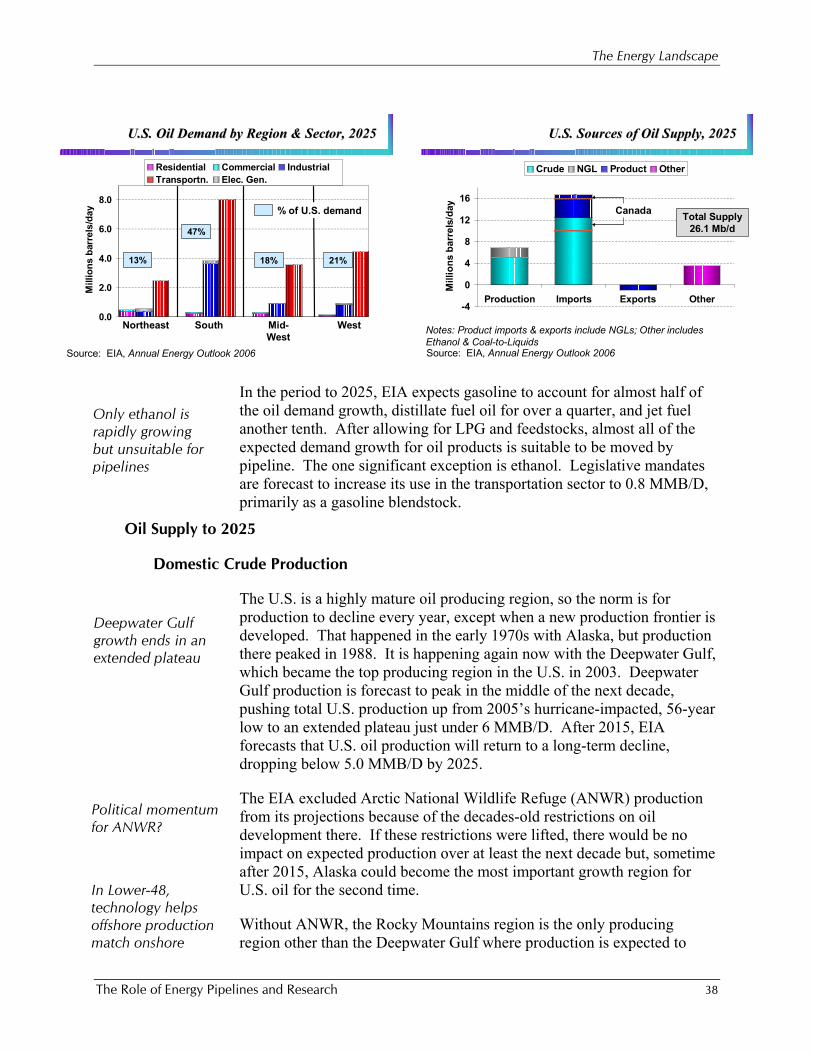
The Energy Landscape
The Role of Energy Pipelines and Research 38
U.S. Oil Demand by Region & Sector, 2025U.S. Oil Demand by Region & Sector, 2025
0.0
2.0
4.0
6.0
8.0
Mill
ions
bar
rels
/day
Residential Commercial IndustrialTransportn. Elec. Gen.
Source: EIA, Annual Energy Outlook 2006
13%
47%
18% 21%
Northeast South Mid-West
West
% of U.S. demand
Only ethanol is rapidly growing but unsuitable for pipelines
In the period to 2025, EIA expects gasoline to account for almost half of the oil demand growth, distillate fuel oil for over a quarter, and jet fuel another tenth. After allowing for LPG and feedstocks, almost all of the expected demand growth for oil products is suitable to be moved by pipeline. The one significant exception is ethanol. Legislative mandates are forecast to increase its use in the transportation sector to 0.8 MMB/D, primarily as a gasoline blendstock.
Oil Supply to 2025
Domestic Crude Production
The U.S. is a highly mature oil producing region, so the norm is for production to decline every year, except when a new production frontier is developed. That happened in the early 1970s with Alaska, but production there peaked in 1988. It is happening again now with the Deepwater Gulf, which became the top producing region in the U.S. in 2003. Deepwater Gulf production is forecast to peak in the middle of the next decade, pushing total U.S. production up from 2005’s hurricane-impacted, 56-year low to an extended plateau just under 6 MMB/D. After 2015, EIA forecasts that U.S. oil production will return to a long-term decline, dropping below 5.0 MMB/D by 2025.
The EIA excluded Arctic National Wildlife Refuge (ANWR) production from its projections because of the decades-old restrictions on oil development there. If these restrictions were lifted, there would be no impact on expected production over at least the next decade but, sometime after 2015, Alaska could become the most important growth region for U.S. oil for the second time.
Without ANWR, the Rocky Mountains region is the only producing region other than the Deepwater Gulf where production is expected to
Deepwater Gulf growth ends in an extended plateau
Political momentum for ANWR?
In Lower-48, technology helps offshore production match onshore
U.S. Sources of Oil Supply, 2025U.S. Sources of Oil Supply, 2025
-4
0
4
8
12
16
Production Imports Exports Other
Mill
ions
bar
rels
/day
Crude NGL Product Other
Notes: Product imports & exports include NGLs; Other includes Ethanol & Coal-to-LiquidsSource: EIA, Annual Energy Outlook 2006
Canada Total Supply 26.1 Mb/d
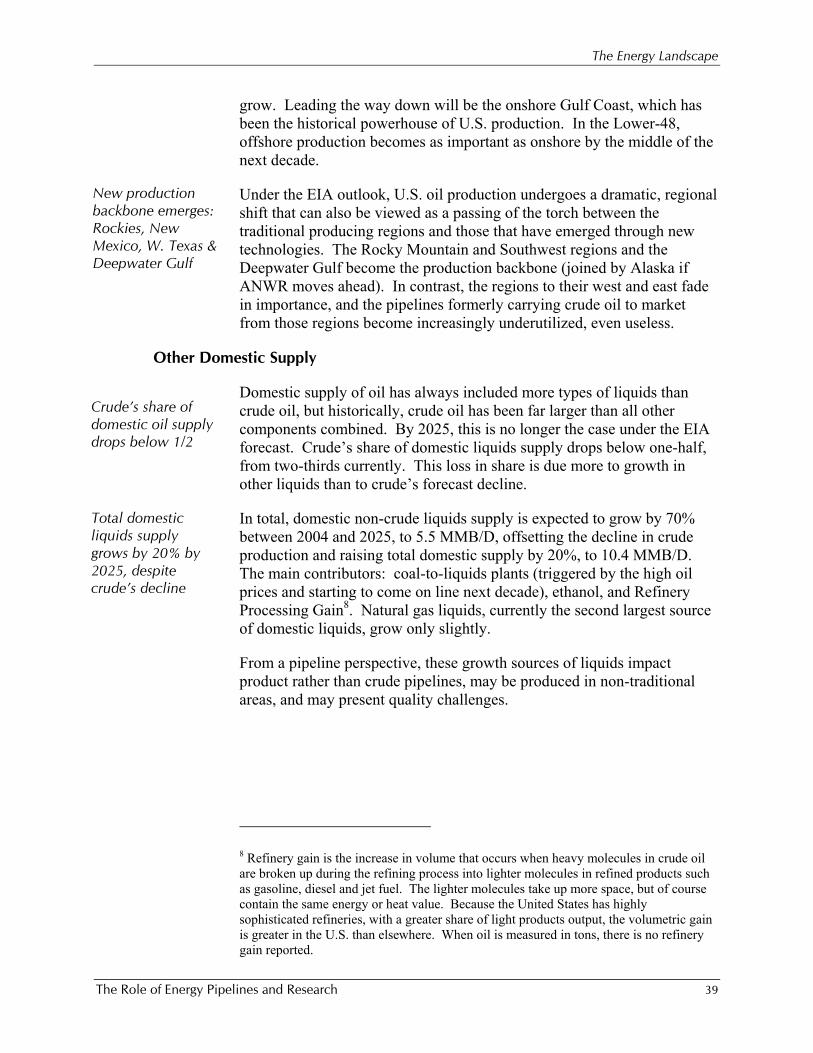
The Energy Landscape
The Role of Energy Pipelines and Research 39
grow. Leading the way down will be the onshore Gulf Coast, which has been the historical powerhouse of U.S. production. In the Lower-48, offshore production becomes as important as onshore by the middle of the next decade.
Under the EIA outlook, U.S. oil production undergoes a dramatic, regional shift that can also be viewed as a passing of the torch between the traditional producing regions and those that have emerged through new technologies. The Rocky Mountain and Southwest regions and the Deepwater Gulf become the production backbone (joined by Alaska if ANWR moves ahead). In contrast, the regions to their west and east fade in importance, and the pipelines formerly carrying crude oil to market from those regions become increasingly underutilized, even useless.
Other Domestic Supply
Domestic supply of oil has always included more types of liquids than crude oil, but historically, crude oil has been far larger than all other components combined. By 2025, this is no longer the case under the EIA forecast. Crude’s share of domestic liquids supply drops below one-half, from two-thirds currently. This loss in share is due more to growth in other liquids than to crude’s forecast decline.
In total, domestic non-crude liquids supply is expected to grow by 70% between 2004 and 2025, to 5.5 MMB/D, offsetting the decline in crude production and raising total domestic supply by 20%, to 10.4 MMB/D. The main contributors: coal-to-liquids plants (triggered by the high oil prices and starting to come on line next decade), ethanol, and Refinery Processing Gain8. Natural gas liquids, currently the second largest source of domestic liquids, grow only slightly.
From a pipeline perspective, these growth sources of liquids impact product rather than crude pipelines, may be produced in non-traditional areas, and may present quality challenges.
8 Refinery gain is the increase in volume that occurs when heavy molecules in crude oil are broken up during the refining process into lighter molecules in refined products such as gasoline, diesel and jet fuel. The lighter molecules take up more space, but of course contain the same energy or heat value. Because the United States has highly sophisticated refineries, with a greater share of light products output, the volumetric gain is greater in the U.S. than elsewhere. When oil is measured in tons, there is no refinery gain reported.
Total domestic liquids supply grows by 20% by 2025, despite crude’s decline
Crude’s share of domestic oil supply drops below 1/2
New production backbone emerges: Rockies, New Mexico, W. Texas & Deepwater Gulf
The Energy Landscape
The Role of Energy Pipelines and Research 40
Import Growth Continuing
The corollary of demand being expected to grow faster than supply is that imports must grow even faster. By 2025, almost 2 out of every 3 barrels of oil consumed in the U.S. is expected to come from non-U.S. sources
Crude oil is expected to continue to be by far the most important component of petroleum imports, although its share slips slightly, to just under three-quarters of the total. The situation with refined product imports appears contradictory at first glance: total imports of finished and unfinished products and blendstocks grow by almost a half by 2025, but the refined product share of total imports grows little, and the imported product share of total U.S. oil supply is not forecast to gain significantly. This seeming contradiction flows from the rapid growth in domestic supplies other than crude oil, and from the increased role of domestic refining.
All the refinery capacity added between 1996 and 2003 occurred through expansions at existing plants. The AEO forecast assumes that financial and legal considerations will continue to mean that most of the expected growth in refining capacity comes from expansions. In 2005, soaring gasoline prices triggered concerns about U.S. refining deficits and dependence on product imports that then triggered legislative moves to encourage the construction of new refineries.
The additional refining capacity is expected to be heavily weighted toward today’s top refining center, the Gulf Coast, and also to the Rockies, because of the growth in both population and crude production expected there. Because the West and East coasts are seen to be the most attractive locations for product imports, their refineries’ share of total distillation capacity, and therefore of crude runs, will decline. The Midwest share is also expected to decline, with the Gulf Coast taking up the slack.
Thus, meeting the increased demand in the population centers will mostly require the expansion of existing product pipeline capacity, especially from refining centers in the Gulf Coast, together with some reduction in the longer distance capacity serving the Rocky Mountain regions.
Import Sources
After the crude/product split, the most important characteristic of future imports from the pipeline industry’s perspective is whether they will arrive by land or by sea. A secondary consideration is their quality.
Canada, currently the largest source of both crude and product imports to the U.S., is the only country that sends oil overland to the U.S. It uses pipelines for essentially all its exports of crude and NGL, and trucks for a
Shift back to growth in refinery capacity to continue; mainly expansions, not new refineries
Canadian crude exports grow; synthetic crude’s share surges
Crude oil imports still three-quarters of total
Imports to meet almost 2/3 of oil demand by 2025
Meeting increased demand will require expansions of existing product pipelines
The Energy Landscape
The Role of Energy Pipelines and Research 41
Pipelines are providing new outlets for Canadian crudes
small portion of its product exports (the rest move by ship from eastern Canada to northeastern U.S. markets). Canadian crude exports are expected to increase by 40% by 2025. Since Canada’s conventional crude production is expected to continue its steady decline, the forecast export surge is predicated on a large increase in unconventional production from oil sands projects.
The increasing role of pipelined supply from Canada is already evident. With new building, capacity expansions and line reversals (shifting to a north-to-south direction of flow), Canadian crude oils have been transported to pipeline hubs in Oklahoma and ultimately to Gulf Coast refineries for the first time. Additional pipeline expansions to transport new supply from the oil sands are also in development.
Outside of Canada, the picture is one of shorter haul crudes giving way to longer haul, lighter crudes giving way to heavier, and the Middle East, the top supplier, maintaining its 25% market share. Under President George W. Bush’s target announced in January 2006 of a 75% decline in Middle East crude imports by 2025, the projected increase to 3.0 MMB/D would need to change to a decline to 0.6 MMB/D. Unless demand falls sharply or product imports soar, the growth that would then be required from all the other exporting regions looks challenging.
The story for U.S. product imports is one of diversity, with today’s top supplying regions: Canada, N. Europe and the Caribbean, losing market share to more distant suppliers, as other countries close the gap with the U.S. on product quality standards and refinery complexity.
Implications for Oil Pipelines
Based on the current oil pipeline networks and on the expected growth patterns for U.S. oil demand, for oil supplies to the U.S. market, and U.S. refining discussed above, the network will need to make a number of significant changes.
For the crude pipeline network, changes include:
-Adding trunklines in the Gulf of Mexico, to deliver the growing production in the deepwater Gulf to domestic refineries;
-Adding a number of large, short lines between marine terminals and coastal refineries on the Gulf Coast, to accommodate the growth in crude imports/refinery runs;
-Adding crude trunk line capacity from the Canadian border, to handle higher volumes of Canadian imports and to further expand their market reach;
Imported crude will be longer haul and heavier
The Energy Landscape
The Role of Energy Pipelines and Research 42
-Further rationalizing inland crude gathering systems and associated crude transmission systems throughout the older producing areas, as production declines continue;
-Expanding crude gathering systems and associated crude trunklines in the Rockies, to accommodate growth in crude production there;
-Expanding trunk line capacity from the Gulf Coast to inland markets; and
-Adjusting pipeline systems to carry more heavy and/or synthetic crude;
For the product pipeline network, there is less pressure to make wholesale changes to its underlying shape. The issues that need addressing are mainly related to being able to move more volume and more grades, with a smaller margin for error:
-Adjust pipeline network to handle ultra low sulfur diesel (ULSD) as it is introduced in line with its mandated timetable;
-Adjust systems to handle imports of diesel from gas-to-liquids (GTL) plants;
-Add capacity to integrate production from domestic Coal-to-Liquids plants into the product distribution system;
-Add capacity to move Unfinished Products from import terminals to refineries;
-Rationalize NGL infrastructure in line with declining onshore crude and natural gas production; and
-Expand capacity to import light products on the East and West coasts.
Improving Performance
The Role of Energy Pipelines and Research 43
CCHHAAPPTTEERR 44:: IIMMPPRROOVVIINNGG PPEERRFFOORRMMAANNCCEE
Across the previous three chapters: characteristics of energy pipelines, their many stakeholders, and the evolving landscape, ran a continuous theme – the need to continually improve safety, supply reliability, security and environmental performance. With the need to improve performance established, this chapter moves on to the issue of how to improve. The well known definition of insanity, “Doing the same thing over and over and expecting different results,” aids in understanding that broadly speaking, consistent and lasting improvement happens only when things are done differently than they have been done in the past. This means using different materials, products, services, processes, procedures and practices.
But, where do new materials, products, services, process, procedures and practices come from? They come from gaining and applying new knowledge or applying existing knowledge in new ways. So, what creates new knowledge? Simply put, the quest for knowledge depends upon research, which encompasses a full spectrum of efforts on a given subject, from early knowledge generation, through proof of concept, development, and finally commercialization. Each step along the way involves new knowledge, either about the materials, products, services, processes, procedures, or practices (collectively, “research products”) or how to put them to use.
Improvement becomes possible when knowledge, either new or existing, is applied in new ways, and research creates knowledge. But, before moving on to the topic of research, it is important to establish a framework to better understand improvement, knowledge, and how research produces knowledge to enable improvement.
What is Improvement?
Intuitively everyone knows what constitutes improvement. It is when more “good” things, or less “bad” things, happen. But, a closer look is worthwhile. Every event has associated probabilities and consequences. Improvement then occurs when either (or both) the probabilities and consequences of events with negative results are reduced. The corollary is
Continued pressure to improve safety, supply reliability and environmental performance
Improvement from applying new knowledge or existing knowledge in new ways
Reducing probabilities and/or consequences equals improvement
Improving Performance
The Role of Energy Pipelines and Research 44
that improvement also occurs when the probabilities and consequences of events with positive results are increased. Now is a good time to introduce two terms, risk and expected value. They are quantified as:
Risk = Probability of a negative event X Consequences of the event
Expected Value = Probability of a positive event X Consequences of the event
In pipeline vernacular, examples of negative events include releases, injuries, and supply disruptions, whether these events are caused by natural forces or human forces, such as construction activities or even terrorism. Expected value, on the other hand, has positive connotations, improved supply, reduced cost, or increased efficiency.
The previous equations look simple, but it is seldom easy to know either probability or consequence with certainty. For the purposes of this report it is sufficient to understand the degree of risk and expected value are dependent on the two components of probability and consequence9.
Improvement, as used in this report, is changing probabilities and/or consequences to either reduce risk or increase expected value.
What is Knowledge?
For purposes of this report a robust definition of knowledge is not necessary. But realizing that knowledge has both an understanding and an application component is necessary. The first part of knowledge is understanding information about a topic. The second part of knowledge is being able to apply what is known. The second part -- application -- is what enables improvement, but the first part -- understanding -- must be in place (obviously) before it can be applied. This relationship between learning and applying was at the heart of the quality movement which emphasized planning actions based on current knowledge, implementing the plan, measuring the results, developing new knowledge based on the results, and making changes to the implementation plan based on the new knowledge.
The Improvement “S-Curve”
The Improvement S-Curve demonstrates how the two components of knowledge contribute to the pace and progress of improvements.
9 For more on pipeline risk, see, Pipeline Risk Manual, Third Edition, by W. Kent Muhlbauer, Gulf Professional Publishing, 2004.
Knowledge has two components: understanding and application
Knowledge must be developed before it can be applied
Not easy to know probability or consequence with certainty
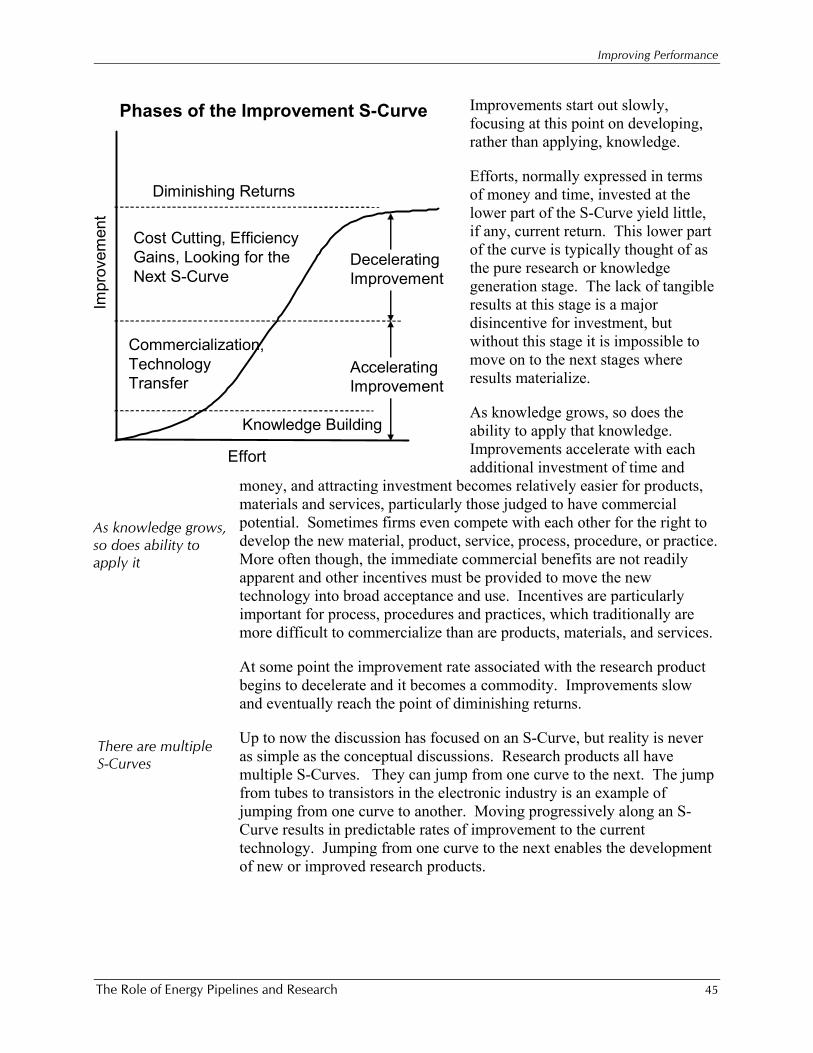
Improving Performance
The Role of Energy Pipelines and Research 45
Improvements start out slowly, focusing at this point on developing, rather than applying, knowledge.
Efforts, normally expressed in terms of money and time, invested at the lower part of the S-Curve yield little, if any, current return. This lower part of the curve is typically thought of as the pure research or knowledge generation stage. The lack of tangible results at this stage is a major disincentive for investment, but without this stage it is impossible to move on to the next stages where results materialize.
As knowledge grows, so does the ability to apply that knowledge. Improvements accelerate with each additional investment of time and
money, and attracting investment becomes relatively easier for products, materials and services, particularly those judged to have commercial potential. Sometimes firms even compete with each other for the right to develop the new material, product, service, process, procedure, or practice. More often though, the immediate commercial benefits are not readily apparent and other incentives must be provided to move the new technology into broad acceptance and use. Incentives are particularly important for process, procedures and practices, which traditionally are more difficult to commercialize than are products, materials, and services.
At some point the improvement rate associated with the research product begins to decelerate and it becomes a commodity. Improvements slow and eventually reach the point of diminishing returns.
Up to now the discussion has focused on an S-Curve, but reality is never as simple as the conceptual discussions. Research products all have multiple S-Curves. They can jump from one curve to the next. The jump from tubes to transistors in the electronic industry is an example of jumping from one curve to another. Moving progressively along an S-Curve results in predictable rates of improvement to the current technology. Jumping from one curve to the next enables the development of new or improved research products.
Impr
ovem
ent
Effort
Phases of the Improvement S-Curve
Knowledge Building
Diminishing Returns
AcceleratingImprovement
DeceleratingImprovement
Commercialization,Technology Transfer
Cost Cutting, EfficiencyGains, Looking for the Next S-Curve
There are multiple S-Curves
As knowledge grows, so does ability to apply it
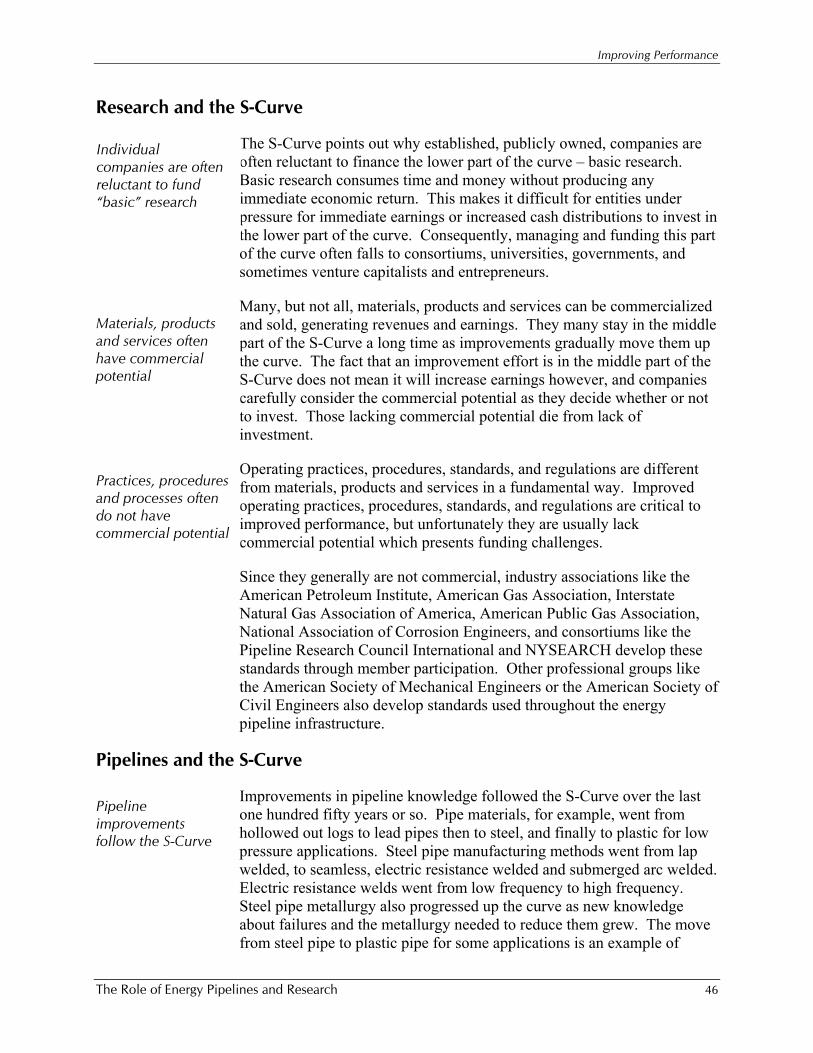
Improving Performance
The Role of Energy Pipelines and Research 46
Research and the S-Curve
The S-Curve points out why established, publicly owned, companies are often reluctant to finance the lower part of the curve – basic research. Basic research consumes time and money without producing any immediate economic return. This makes it difficult for entities under pressure for immediate earnings or increased cash distributions to invest in the lower part of the curve. Consequently, managing and funding this part of the curve often falls to consortiums, universities, governments, and sometimes venture capitalists and entrepreneurs.
Many, but not all, materials, products and services can be commercialized and sold, generating revenues and earnings. They many stay in the middle part of the S-Curve a long time as improvements gradually move them up the curve. The fact that an improvement effort is in the middle part of the S-Curve does not mean it will increase earnings however, and companies carefully consider the commercial potential as they decide whether or not to invest. Those lacking commercial potential die from lack of investment.
Operating practices, procedures, standards, and regulations are different from materials, products and services in a fundamental way. Improved operating practices, procedures, standards, and regulations are critical to improved performance, but unfortunately they are usually lack commercial potential which presents funding challenges.
Since they generally are not commercial, industry associations like the American Petroleum Institute, American Gas Association, Interstate Natural Gas Association of America, American Public Gas Association, National Association of Corrosion Engineers, and consortiums like the Pipeline Research Council International and NYSEARCH develop these standards through member participation. Other professional groups like the American Society of Mechanical Engineers or the American Society of Civil Engineers also develop standards used throughout the energy pipeline infrastructure.
Pipelines and the S-Curve
Improvements in pipeline knowledge followed the S-Curve over the last one hundred fifty years or so. Pipe materials, for example, went from hollowed out logs to lead pipes then to steel, and finally to plastic for low pressure applications. Steel pipe manufacturing methods went from lap welded, to seamless, electric resistance welded and submerged arc welded. Electric resistance welds went from low frequency to high frequency. Steel pipe metallurgy also progressed up the curve as new knowledge about failures and the metallurgy needed to reduce them grew. The move from steel pipe to plastic pipe for some applications is an example of
Individual companies are often reluctant to fund “basic” research
Materials, products and services often have commercial potential
Practices, procedures and processes often do not have commercial potential
Pipeline improvements follow the S-Curve
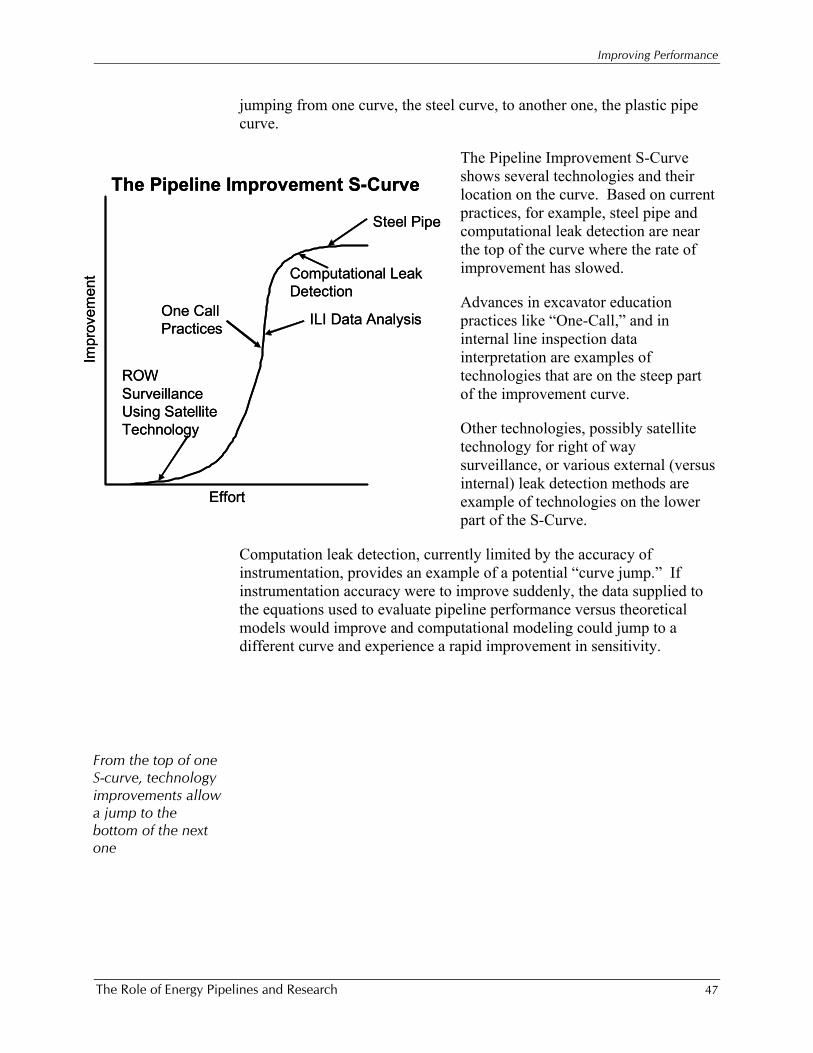
Improving Performance
The Role of Energy Pipelines and Research 47
From the top of one S-curve, technology improvements allow a jump to the bottom of the next one
jumping from one curve, the steel curve, to another one, the plastic pipe curve.
The Pipeline Improvement S-Curve shows several technologies and their location on the curve. Based on current practices, for example, steel pipe and computational leak detection are near the top of the curve where the rate of improvement has slowed.
Advances in excavator education practices like “One-Call,” and in internal line inspection data interpretation are examples of technologies that are on the steep part of the improvement curve.
Other technologies, possibly satellite technology for right of way surveillance, or various external (versus internal) leak detection methods are example of technologies on the lower part of the S-Curve.
Computation leak detection, currently limited by the accuracy of instrumentation, provides an example of a potential “curve jump.” If instrumentation accuracy were to improve suddenly, the data supplied to the equations used to evaluate pipeline performance versus theoretical models would improve and computational modeling could jump to a different curve and experience a rapid improvement in sensitivity.
Impr
ovem
ent
Effort
The Pipeline Improvement S-Curve
Steel Pipe
ILI Data Analysis
ROW Surveillance Using Satellite Technology
Computational Leak Detection
One Call Practices
Impr
ovem
ent
Effort
The Pipeline Improvement S-Curve
Steel Pipe
ILI Data Analysis
ROW Surveillance Using Satellite Technology
Computational Leak Detection
One Call Practices
The Role of Pipeline Research
The Role of Energy Pipelines and Research 48
CCHHAAPPTTEERR 55:: TTHHEE EEVVOOLLUUTTIIOONN AANNDD RROOLLEE OOFF PPIIPPEELLIINNEE RREESSEEAARRCCHH
Many people mark 1806, when the London and Westminster Gas Light and Coke Company began laying the first gas mains ever placed under a public street, as the beginning of the energy pipeline industry. Since that start two hundred years ago, research has moved pipelines along, improving their safety, supply reliability, environmental performance, security and efficiency. Many times, research was based on trial and error as pipeliners learned from their successes or failures as the following three examples demonstrate, other times the research involved detailed experiments in laboratory setting.
William Hart, a New York blacksmith, in 1821 pounded a few lengths of pipe into the ground near a creek bed where ignitable gas bubbled to the surface. He fashioned a floating, open-bottom, box to capture the gas as it surfaced, and ran it through hollowed out logs to a Lake Erie light house a half mile away, and then to a nearby town. J. L. Hutchings built a 2-inch cast iron pipeline in 1862 to demonstrate his new rotary pump. He soldered the joints together with lead, but the connection leaked so badly none of the oil made it to its destination and Hutchings gave up in defeat. Not long after, the Oil Transportation Association, learning from Hutchings failure, built a 2-inch line using threaded connections to prevent leaks, which was a wild success. In 1885 the Mannesman brothers, Reinhard and Max, devised a machine that could make pipe with no seams, thereby eliminating what had, until then been a weak link. And, in 1911, the Philadelphia and Suburban Gas Company started welding joints together using oxyacetylene torches. Progress, driven by research (sometimes in the laboratory but more often trial and error in the field) flowed steadily along:
• Pipeline lengths and diameters doubled and tripled and line pressures increased;
• Steam-driven pumps and compressors gave way to gasoline- or diesel driven pumps, or compressors powered by natural gas;
• Tractors and trucks replaced mules and horses;
Historically, educated trial and error played a large research role
The Role of Pipeline Research
The Role of Energy Pipelines and Research 49
• Ditching machines replaced picks and shovels; • Pipe coatings protected the steel from corrosion, extending its life; • The causes of corrosion were identified and remedied; • Electric control boards monitored throughput, pressures, and leak
detection; • Telephone lines provided communication.10
This list of improvements and a host of others drove safety, reliability, environmental and efficiency gains, and prepared the U.S. pipeline industry for a golden age of construction during the 1950s - 1970s.
Individual pipeline operators or consortiums of pipeline operators sometimes funded the research enabling these improvements. Other times contractors or suppliers, individually or collectively provided research funding. Many times, as with tractors and trucks, the pipeline industry simply took improvements developed by others and put them to their own uses.
Whatever the funding mechanism, the research efforts were only loosely coordinated, if they were coordinated at all. Research was performed in laboratories and facilities owned by pipeline companies, contractors or suppliers, or through competitive awards to universities and independent commercial or not of profit organizations. Practical research was also often conducted directly in the field by curious personnel as they worked within their individual spheres -- construction, operating, or maintenance, to name a few.
Historical Funding Models
As the three components of the energy pipeline industry -- natural gas transmission pipelines, natural gas local distribution pipelines, and oil pipelines -- matured, operators began to understand the value of cooperation and collaboration with respect to funding and conducting research, as well as in developing best practices and standards.
Three organizations emerged as the principal means to manage natural gas transmission and natural gas distribution research on behalf of the industry. These were Pipeline Research Council International (PRCI), formed in 1952, NYSEARCH formed around 1990, and the Institute of Gas Technology (IGT), formed in 1941. Recently, IGT merged with the Gas Research Institute (GRI) (originally formed in 1976) to create the Gas
10The information about the history of pipelines and pipeline research was extracted from. Miesner, Thomas, and Leffler, William. Oil and Gas Pipelines in Nontechnical Language, Tulsa, Oklahoma, PennWell Corporation, 2006, Chapter 2.
Research drove improvement
Research was loosely coordinated
Joint funding of research gradually became the rule
The Role of Pipeline Research
The Role of Energy Pipelines and Research 50
Technology Institute. In 2002 Operations Technology Development (OTD) was established to fund and manage LDC-focused research.
Natural gas research received a boon when, around 1976, the FERC instituted a surcharge on each MCF of natural gas sold in the U.S. Using an agreed-upon formula, this surcharge was collected by pipelines from customers. All funds collected under the surcharge were earmarked specifically to fund natural gas research. At its peak, this surcharge collected and disbursed on the order of $220 million annually, including funds for all aspects of the natural gas industry, not just pipelines. Much of the funding provided by the FERC surcharge went to GTI, which has received more than 1000 new patents and introduced over 400 new products over the more than 60 years is has been in existence.11 As the natural gas industry evolved and fragmented, different and more complex formulas were needed to collect the surcharge. Eventually, driven by politics and attendant litigation, the FERC surcharge was phased out. As of 2005, the surcharge, and consequently the funding provided by it, has disappeared entirely.
The oil pipeline component of the energy pipeline business took a less formal approach to research. The two primary oil pipeline industry leadership organizations, AOPL and the Pipeline Segment of American Petroleum Institute empowered the API Operations and Technical Committee to oversee research activities. There were no formal funding mechanisms for research. As the need arose, API member companies decided whether to fund the particular research, sometimes sponsoring research cooperatively with others. Around 2000, the AOPL and API began the search for better ways to conduct research. In 2001, 13 individual oil pipeline companies and AOPL agreed to join PRCI which has now emerged as a major research manager for both natural gas and oil pipeline research.
Pipeline suppliers and contractors have also formed organizations to promote their agendas, sponsor research, and develop standardized practices. The Inline Inspection Association (ILIA) and the National Association of Pipe Coating Applicators (NAPCA) are two examples of such organizations. Individual pipeline companies as well as individual suppliers and contractors often conduct their own in-house research, sometimes collaboratively with pipeline operators, sometimes with each other, and sometimes by themselves.
11 GTI at a Glance, Available from http://www.gastechnology.org/webroot/app/xn/xd.aspx?it=enweb&xd=gtihome.xml, Accessed March 25, 2006
FERC funding has ended
Pipeline companies are increasingly funding research
Suppliers also fund research
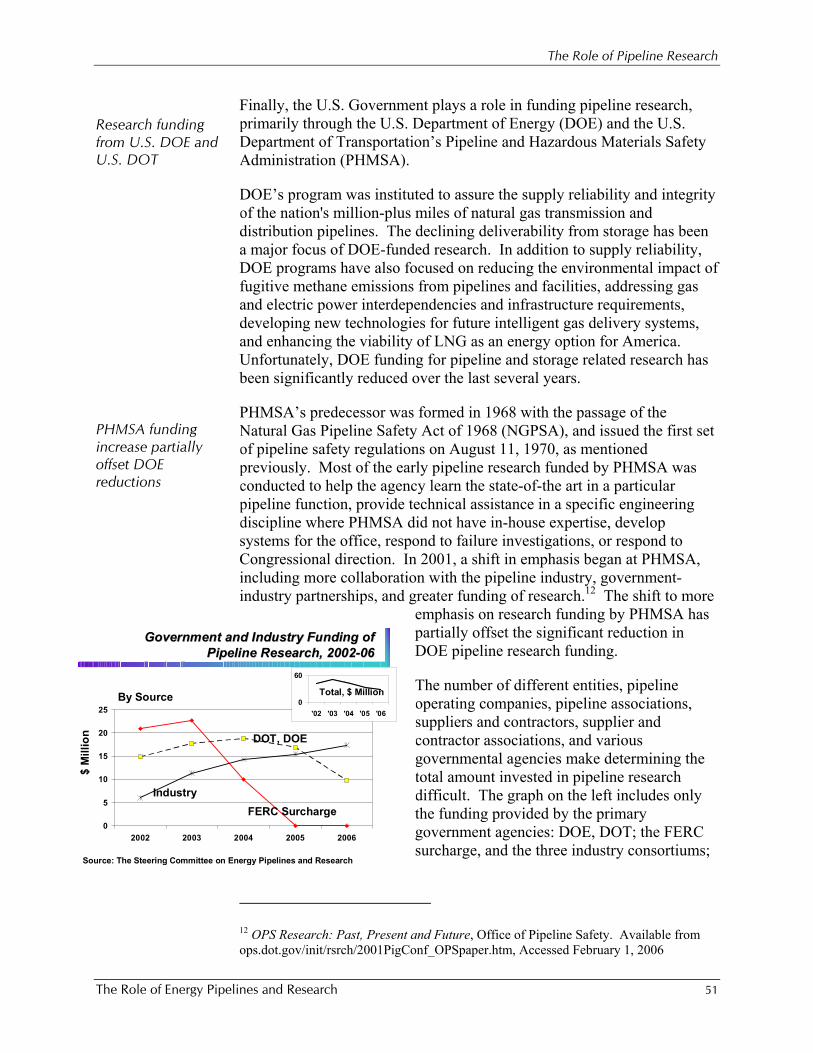
The Role of Pipeline Research
The Role of Energy Pipelines and Research 51
Finally, the U.S. Government plays a role in funding pipeline research, primarily through the U.S. Department of Energy (DOE) and the U.S. Department of Transportation’s Pipeline and Hazardous Materials Safety Administration (PHMSA).
DOE’s program was instituted to assure the supply reliability and integrity of the nation's million-plus miles of natural gas transmission and distribution pipelines. The declining deliverability from storage has been a major focus of DOE-funded research. In addition to supply reliability, DOE programs have also focused on reducing the environmental impact of fugitive methane emissions from pipelines and facilities, addressing gas and electric power interdependencies and infrastructure requirements, developing new technologies for future intelligent gas delivery systems, and enhancing the viability of LNG as an energy option for America. Unfortunately, DOE funding for pipeline and storage related research has been significantly reduced over the last several years.
PHMSA’s predecessor was formed in 1968 with the passage of the Natural Gas Pipeline Safety Act of 1968 (NGPSA), and issued the first set of pipeline safety regulations on August 11, 1970, as mentioned previously. Most of the early pipeline research funded by PHMSA was conducted to help the agency learn the state-of-the art in a particular pipeline function, provide technical assistance in a specific engineering discipline where PHMSA did not have in-house expertise, develop systems for the office, respond to failure investigations, or respond to Congressional direction. In 2001, a shift in emphasis began at PHMSA, including more collaboration with the pipeline industry, government-industry partnerships, and greater funding of research.12 The shift to more
emphasis on research funding by PHMSA has partially offset the significant reduction in DOE pipeline research funding.
The number of different entities, pipeline operating companies, pipeline associations, suppliers and contractors, supplier and contractor associations, and various governmental agencies make determining the total amount invested in pipeline research difficult. The graph on the left includes only the funding provided by the primary government agencies: DOE, DOT; the FERC surcharge, and the three industry consortiums;
12 OPS Research: Past, Present and Future, Office of Pipeline Safety. Available from ops.dot.gov/init/rsrch/2001PigConf_OPSpaper.htm, Accessed February 1, 2006
PHMSA funding increase partially offset DOE reductions
Research funding continues to evolve
Research funding from U.S. DOE and U.S. DOT
Government and Industry Funding of Government and Industry Funding of Pipeline Research, 2002Pipeline Research, 2002--0606
0
5
10
15
20
25
2002 2003 2004 2005 2006
0
60
'02 '03 '04 '05 '06
Total, $ Million
$ M
illio
n
FERC SurchargeIndustry
DOT, DOE
By Source
Source: The Steering Committee on Energy Pipelines and Research
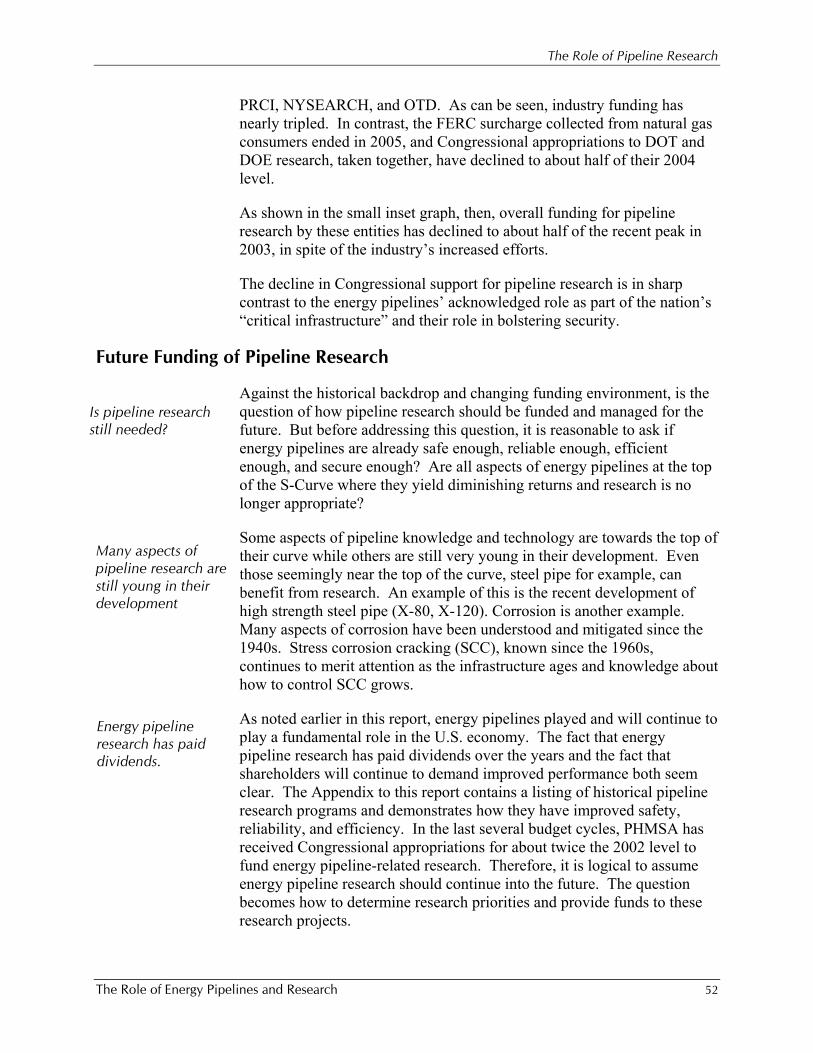
The Role of Pipeline Research
The Role of Energy Pipelines and Research 52
PRCI, NYSEARCH, and OTD. As can be seen, industry funding has nearly tripled. In contrast, the FERC surcharge collected from natural gas consumers ended in 2005, and Congressional appropriations to DOT and DOE research, taken together, have declined to about half of their 2004 level.
As shown in the small inset graph, then, overall funding for pipeline research by these entities has declined to about half of the recent peak in 2003, in spite of the industry’s increased efforts.
The decline in Congressional support for pipeline research is in sharp contrast to the energy pipelines’ acknowledged role as part of the nation’s “critical infrastructure” and their role in bolstering security.
Future Funding of Pipeline Research
Against the historical backdrop and changing funding environment, is the question of how pipeline research should be funded and managed for the future. But before addressing this question, it is reasonable to ask if energy pipelines are already safe enough, reliable enough, efficient enough, and secure enough? Are all aspects of energy pipelines at the top of the S-Curve where they yield diminishing returns and research is no longer appropriate?
Some aspects of pipeline knowledge and technology are towards the top of their curve while others are still very young in their development. Even those seemingly near the top of the curve, steel pipe for example, can benefit from research. An example of this is the recent development of high strength steel pipe (X-80, X-120). Corrosion is another example. Many aspects of corrosion have been understood and mitigated since the 1940s. Stress corrosion cracking (SCC), known since the 1960s, continues to merit attention as the infrastructure ages and knowledge about how to control SCC grows.
As noted earlier in this report, energy pipelines played and will continue to play a fundamental role in the U.S. economy. The fact that energy pipeline research has paid dividends over the years and the fact that shareholders will continue to demand improved performance both seem clear. The Appendix to this report contains a listing of historical pipeline research programs and demonstrates how they have improved safety, reliability, and efficiency. In the last several budget cycles, PHMSA has received Congressional appropriations for about twice the 2002 level to fund energy pipeline-related research. Therefore, it is logical to assume energy pipeline research should continue into the future. The question becomes how to determine research priorities and provide funds to these research projects.
Many aspects of pipeline research are still young in their development
Is pipeline research still needed?
Energy pipeline research has paid dividends.
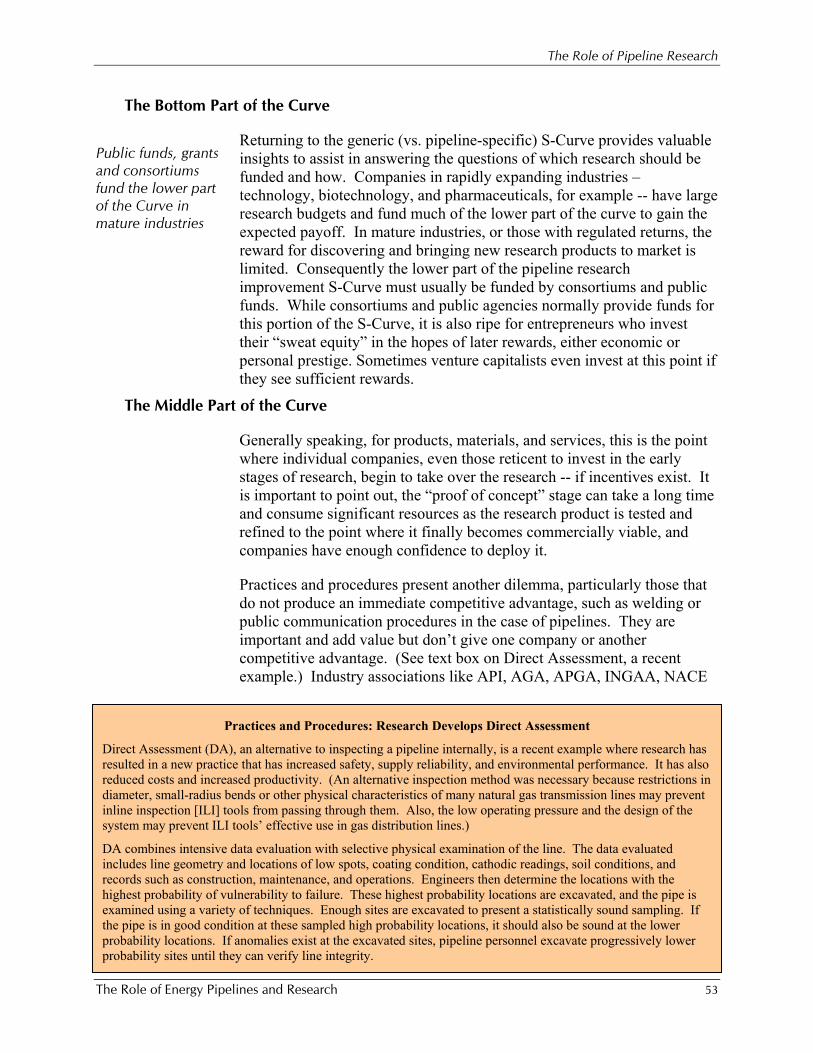
The Role of Pipeline Research
The Role of Energy Pipelines and Research 53
The Bottom Part of the Curve
Returning to the generic (vs. pipeline-specific) S-Curve provides valuable insights to assist in answering the questions of which research should be funded and how. Companies in rapidly expanding industries – technology, biotechnology, and pharmaceuticals, for example -- have large research budgets and fund much of the lower part of the curve to gain the expected payoff. In mature industries, or those with regulated returns, the reward for discovering and bringing new research products to market is limited. Consequently the lower part of the pipeline research improvement S-Curve must usually be funded by consortiums and public funds. While consortiums and public agencies normally provide funds for this portion of the S-Curve, it is also ripe for entrepreneurs who invest their “sweat equity” in the hopes of later rewards, either economic or personal prestige. Sometimes venture capitalists even invest at this point if they see sufficient rewards.
The Middle Part of the Curve
Generally speaking, for products, materials, and services, this is the point where individual companies, even those reticent to invest in the early stages of research, begin to take over the research -- if incentives exist. It is important to point out, the “proof of concept” stage can take a long time and consume significant resources as the research product is tested and refined to the point where it finally becomes commercially viable, and companies have enough confidence to deploy it.
Practices and procedures present another dilemma, particularly those that do not produce an immediate competitive advantage, such as welding or public communication procedures in the case of pipelines. They are important and add value but don’t give one company or another competitive advantage. (See text box on Direct Assessment, a recent example.) Industry associations like API, AGA, APGA, INGAA, NACE
Public funds, grants and consortiums fund the lower part of the Curve in mature industries
Practices and Procedures: Research Develops Direct Assessment
Direct Assessment (DA), an alternative to inspecting a pipeline internally, is a recent example where research has resulted in a new practice that has increased safety, supply reliability, and environmental performance. It has also reduced costs and increased productivity. (An alternative inspection method was necessary because restrictions in diameter, small-radius bends or other physical characteristics of many natural gas transmission lines may prevent inline inspection [ILI] tools from passing through them. Also, the low operating pressure and the design of the system may prevent ILI tools’ effective use in gas distribution lines.)
DA combines intensive data evaluation with selective physical examination of the line. The data evaluated includes line geometry and locations of low spots, coating condition, cathodic readings, soil conditions, and records such as construction, maintenance, and operations. Engineers then determine the locations with the highest probability of vulnerability to failure. These highest probability locations are excavated, and the pipe is examined using a variety of techniques. Enough sites are excavated to present a statistically sound sampling. If the pipe is in good condition at these sampled high probability locations, it should also be sound at the lower probability locations. If anomalies exist at the excavated sites, pipeline personnel excavate progressively lower probability sites until they can verify line integrity.
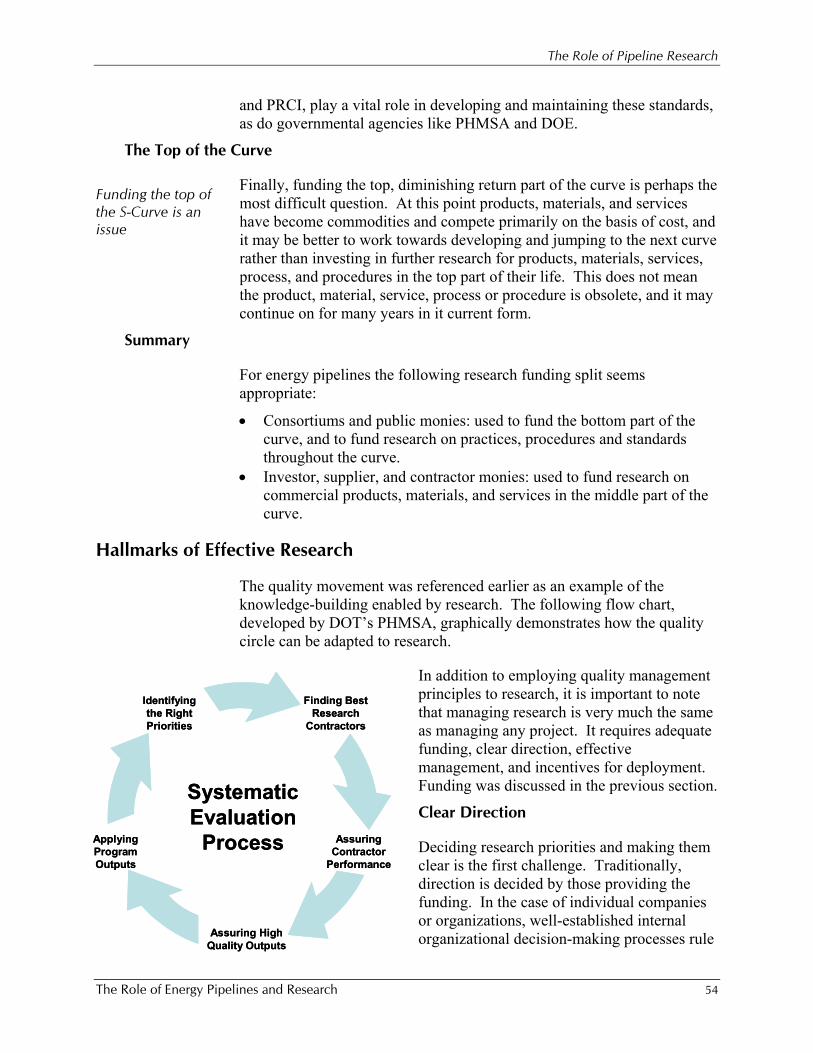
The Role of Pipeline Research
The Role of Energy Pipelines and Research 54
and PRCI, play a vital role in developing and maintaining these standards, as do governmental agencies like PHMSA and DOE.
The Top of the Curve
Finally, funding the top, diminishing return part of the curve is perhaps the most difficult question. At this point products, materials, and services have become commodities and compete primarily on the basis of cost, and it may be better to work towards developing and jumping to the next curve rather than investing in further research for products, materials, services, process, and procedures in the top part of their life. This does not mean the product, material, service, process or procedure is obsolete, and it may continue on for many years in it current form.
Summary
For energy pipelines the following research funding split seems appropriate:
• Consortiums and public monies: used to fund the bottom part of the curve, and to fund research on practices, procedures and standards throughout the curve.
• Investor, supplier, and contractor monies: used to fund research on commercial products, materials, and services in the middle part of the curve.
Hallmarks of Effective Research
The quality movement was referenced earlier as an example of the knowledge-building enabled by research. The following flow chart, developed by DOT’s PHMSA, graphically demonstrates how the quality circle can be adapted to research.
In addition to employing quality management principles to research, it is important to note that managing research is very much the same as managing any project. It requires adequate funding, clear direction, effective management, and incentives for deployment. Funding was discussed in the previous section.
Clear Direction
Deciding research priorities and making them clear is the first challenge. Traditionally, direction is decided by those providing the funding. In the case of individual companies or organizations, well-established internal organizational decision-making processes rule
Funding the top of the S-Curve is an issue
Identifyingthe RightPriorities
Finding BestResearch
Contractors
AssuringContractor
Performance
Assuring High Quality Outputs
ApplyingProgramOutputs
SystematicEvaluation
Process
Identifyingthe RightPriorities
Finding BestResearch
Contractors
AssuringContractor
Performance
Assuring High Quality Outputs
ApplyingProgramOutputs
SystematicEvaluation
Process
The Role of Pipeline Research
The Role of Energy Pipelines and Research 55
the day. Consortium decision-making is more complex as more stakeholders, each with their own perspectives and agendas complicate (but also enrich) the process. And, the decision making process regarding public funds is even more complex as individuals and special interest stakeholders join the fray.
Intelligent decisions regarding direction require full understanding of and agreement on the risks and expected values. The probabilities, consequences, and benefits of the research, must all be understood. Educating all the stakeholders who want to be involved in setting direction can be a long and arduous process and can delay potentially beneficial discoveries. Not educating and involving them in the process can result in misdirected research and wasted funds.
One example of an attempt to achieve clear direction is the R&D Forum sponsored by PHMSA in Houston on March 22-24, 2005. This forum, and others held periodically, brought together a diverse set of stakeholders to explore a national pipeline safety research agenda. A gathering of several hundred stakeholders can be an effective means to communicate information and gather input if it is fully planned and well-executed. It is not an effective means to make decisions which is best done through more dialogue usually involving a smaller set of stakeholders. This report stops short of recommending a specific forum for research decision-making but advocates the importance of a robust decision-making process.
Effective Management
After funding and clear direction comes effective management. Effective management entails planning the project scope and schedule, enlisting required resources, managing the schedule and logistics, and managing a wide variety of details. Managing the research details is important, but unless the knowledge gained from the research is deployed to produce new or improved research products, the research is of little, if any, value.
One of the important components of effective management therefore is a robust “technology transfer” plan. Intuitively it sounds simple that improved materials, products, services, procedures, process and practices should be welcomed with open arms. In reality it is not surprising that pipeliners, like almost everyone else, are often reluctant to leave their comfort zone and venture off into new technology. Consequently sound performance and economic data are needed to prove the technology will provide the required safety, supply reliability, environmental, security, or productivity improvements.
Incentives for Deployment
Technology transfer is the critical pathway of research from planning to execution to generate benefits and value. As the launch from research to
Stakeholder involvement is critical in establishing priorities
Knowledge must be deployed to have value
Robust “technology transfer” plan
The Role of Pipeline Research
The Role of Energy Pipelines and Research 56
use, technology transfer enables and drives the creation of products, materials and services, scientifically and operationally justified standards, sound regulations, best practices, and enhanced training and knowledge sharing. Successful technology transfer depends on a rigorous process that includes early involvement by all stakeholders. It also hinges upon incentives that reduce the risk associated with technology introduction. In the case of products, materials, and services, this incentive is normally economic – companies make money as they develop and sell new or improved products, materials, or services. Providing incentives to implement new processes, procedures, and practices is often difficult because there may be no immediate, quantifiable benefit. New regulatory requirements are sometimes strong drivers for technology improvement and deployment. Training and public education are two examples of legislators and regulators providing deployment incentives when they promulgate new operator qualification and public communication requirements.
Barriers to Pipeline Research
Funding and lack of immediate returns are two obvious pipeline research barriers. As discussed earlier, research is by nature long term and does not immediately, “Go to the bottom line.” Firms driven to produce increasing quarterly earnings and cash distributions are sometimes reluctant to allocate funds to research. Other barriers include regulatory approaches that restrict pipeline companies’ ability to earn a return on efficiency projects. Rates established through COS filings allow recovery of actual costs plus a return. Simplistically, if costs go down so do rates, providing little efficiency incentive.
While the most effective regulations can be achieved when regulators, operators, and other stakeholders work cooperatively, there also needs to be a healthy distance between regulators and those they regulate. This distance sometimes causes regulators to fear operators are not truly doing all they can. The converse is also true and sometimes operators fear regulators may ask them to make investments that are not truly justified based on costs and benefits. This fear can serve as a deterrent to research. Anecdotally, one supplier related the story of an operating company that said they did not want to try a particular new technology because they were concerned if it worked, “The regulators might make me use it everywhere on my system.” This is certainly not the prevalent industry attitude but it illustrates how all stakeholders must work together to arrive at the best answer.
Regulated returns hamper research
Incentives other than commercial may be needed
The Role of Pipeline Research
The Role of Energy Pipelines and Research 57
The Path Ahead
Energy pipelines in the U.S. are owned primarily by private interests, but they are nevertheless a national asset and everyone in the U.S. is a stakeholder in their success. Current, as well as new and expanded pipelines, are essential to support the U.S. (and the global) economy for the foreseeable future. Stakeholders will continue, rightly, to insist energy pipelines perform in a safe, environmentally responsible, reliable, efficient manner, and increasingly, that they are secure from terrorist attacks. Research broadly defined brought pipelines to their enviable record, and continued research is critical to enable future improvements. An active research management function is needed to effectively set priorities and direction, assure adequate funding, and create incentives to facilitate effective technology transfer.
Companies, consortiums, and governments each have a role to play in managing the pipeline research arena and the research model should continue to evolve towards a collaborative model. A collaborative model, while difficult to manage because of the diverse motives and interests, is the best approach for discovering and agreeing on future research initiatives, because it uses all available resources to insure the future of this national asset. For the collaborative model to work, it is essential all stakeholders engage in true dialogue where benefits and concerns are thoroughly vetted, and each of the stakeholders does their “fair share” with respect to moving forward the future of energy pipelines in the U.S.
Energy pipelines will continue to fuel our economy
Energy pipelines will continue to fuel our economy
Collaborative research is the key
Appendix
The Role of Energy Pipelines and Research 58
AAPPPPEENNDDIIXX
Research has enabled the U.S. energy pipeline industry to grow from its fledgling beginning about one hundred fifty years ago into a national asset, critical to our economy and the standard of living we enjoy. This appendix, compiled from input supplied by the subject matter experts listed in the acknowledgement section and supplemented with independent research conducted by the authors, chronicles representative examples of pipeline improvements. Some of the examples demonstrate how pipeline specific improvements grew directly from the knowledge and products of research which was sponsored directly by the pipeline industry. Others show how the pipeline industry readily adopted improvements from other industries. This appendix provides selected illustrations and is not intended to be complete or exhaustive.
Steel Pipe
Pipe, arguably one of the most important elements of pipelines, began as hollowed out logs, sometimes reinforced with iron bands spiral wound along the length of the pipe. The ability to pipeline natural gas and oil took a giant leap forward when, in about 1862, cast iron pipe was put into service. One of the first attempts to use cast iron pipe failed, not because of the pipe, but because the solder used to join the lengths of pipe together was not strong enough to hold them together. As temperatures changed the pipe expanded or contracted and the joints were pulled apart, causing the pipeline to leak like a sieve. Pipeliners quickly learned from this attempt and switched to threaded connections, resulting in one of the first, if not the first, successful “long distance’ pipeline. The iron and steel industry discovered the strength and ductility value of steel over iron and the pipeline industry quickly began to use steel pipe for high pressure applications rather using cast iron as in the past.
Longitudinal weld seam
Early pipe was manufactured from sheets of steel rolled into tubes with the edges welded together. But the longitudinal seam welding techniques of the day produced seams weaker than the parent metal. Consequently, pipeline internal operating pressures were limited to the pressure
Appendix
The Role of Energy Pipelines and Research 59
containing ability of the weld seam, effectively “wasting” some of the strength of the steel. These weld seams were the weak link in the process until the technique of piercing a red hot billet of steel with a mandrel, thereby producing lengths of “seamless pipe” without a longitudinal weld seam, was invented by the Mannesman brothers, Reinhard and Max, in around 1885. Later, electrical resistance welding in the 1920s and submerged arc welding in the 1940s resulted in weld seams with strength at least as strong as the parent metal, allowing increased operating pressures and improved efficiency.
Pipe metallurgy
Over the years improvements to steel metallurgy resulted in higher strength steel, moving from X-42 to X-52, and finally X-120. These stronger steels improved construction efficiency and reduced costs. In the 1930s and 1940s steel pipe had a tendency to “tear” as pressure escaped from the pipe during leaks. This phenomenon allowed small leaks to rapidly become ruptures. The pipeline industry, working with steel and pipe manufacturers developed metallurgical and manufacturing knowledge to allow production of pipe, beginning in the 1950s, with better ductility. Improved ductility helped limit these running fractures, resulting in improving safety, supply reliability, and environmental performance.
Corrosion Protection
Everyone knows buried steel has the potential to rust, and steel pipelines are no exception. Early pipeline operators understood that rusting, in simple terms, happens for the same reason that batteries work. That is, the difference in electrical potential between the pipe and the soil cause current flow, resulting in oxidation. This knowledge enabled development of corrosion protection techniques which maintain pipe at its original wall thickness and strength nearly indefinitely.
Coating materials
Based on their knowledge of corrosion mechanisms, pipeliners reasoned that coating pipelines with insulating materials before they were buried would limit current flow and thereby prevent the pipe from corroding. Early coatings were simply mastic materials poured or smeared on the outside of the pipeline. Or they were specially fabricated tapes spiral wound on the pipe. The 1940s saw the discovery and wide use of coal tar coatings. In the 1960s extruded plastics and fusion bonded epoxies came into use. Fusion bond epoxy coatings are now the defacto standard and research has made these coatings tough and able to withstand construction activities. Fusion bond epoxy coatings also have nearly indefinite lives.
Appendix
The Role of Energy Pipelines and Research 60
Cathodic protection
Coatings are only one of the many corrosion protection techniques developed through research. Researchers realized that, since corrosion resulted from minute current flow caused by differences in electrical potential, adjusting the electrical potential of the pipe relative to its environment would also protect the pipe. This line of reasoning led to galvanic protection in the 1930s: burying sacrificial anodes, commonly made from magnesium, along the pipeline to adjust the electrical potential between the pipeline and its surrounding environment. Impressed current cathodic protection, connecting rectifiers, which are essentially direct current transformers, to the pipe to impress a current on the pipe, thereby adjusting its electrical potential, was the next step in corrosion protection. An addition advance in cathodic protection, deep well ground beds were discovered in the 1970s and put into wide use in the 1980s. This technology allowed installation of ground bed anodes in limited areas with less impact on the surroundings. Today combinations of coatings, rectifiers, and sacrificial anodes are all used to protect pipelines and keep them from rusting.
Internal corrosion
In addition to external corrosion, pipelines are also susceptible to internal corrosion. Over time, pipeliners learned that internal corrosion can be partially controlled through sound operating practices such as regular runs of cleaning pigs and spheres to remove water and other contaminants. Corrosion inhibitors which came into wide use in the 1970s also are a key tool to assist in limiting internal corrosion. Knowledge about internal corrosion led to design considerations to either reduce or eliminate low spots where water could collect. Design considerations also were developed which provided for safely separating out water and removing it from the pipe thereby limiting internal corrosion.
Microbial assisted corrosion
Another important discovery regarding corrosion was the presence of corrosion assisting microorganisms. These tiny “creatures’ live on the pipe wall and feed on fluids or sludge in the line. They secrete chemicals that accelerate the corrosion process. The 1980s saw the introduction of biocorrosion field test kits to detection the presence of these microorganisms. While much is still to be learned about Microorganism Induced Corrosion (MIC) through research the pipe community and their suppliers are leaning how to keep lines clean and use chemicals to control the microorganisms, thereby controlling MIC.
Stress corrosion cracking
Another corrosion phenomenon, Stress Corrosion Cracking (SCC) was recognized as early as the 1960. But progress on controlling SCC lagged
Appendix
The Role of Energy Pipelines and Research 61
until researches learned more about its causes. By the 1970s enough knowledge was gained about SCC and the conditions under which is was most likely to occur to being taking actions. With this knowledge in hand the 1980s saw the beginning of prevention practices such as fusion bond coatings, mill scale removal, and shot preening. During the 1980s the practices of using hydrostatic testing to locate and control SCC was also developed. The 1990s saw the development of life-prediction models for high-pH SCC that enables pipeline operators to evaluate the significance (in terms of pipeline integrity and scheduling remedial measures) of cracks that are discovered and sized by nondestructive testing. Nondestructive testing tools are discussed in greater details later.
Plastic and composite pipe
Plastic pipe does not corrode, but it does not have the same strength as steel pipe. Ways were discovered through research to improve the strength of plastic enabling it to handle higher pressures and be produced in larger diameters. Plastic will likely never replace steel as the preferred material for high pressure long distance pipes, but it serves as a valuable product for low pressure applications such as local distribution lines. Research continues into composite and nonferrous pipe for specialty applications.
Early plastic pipe also deteriorated when exposed to the ultra violet spectrum of the sun rays. Plastic pipe is flexible enough to be coiled up and then unrolled as it is installed resulting in more efficient construction, but special joining techniques had to be developed to successfully “weld” the ends of the unrolled spools together.
Buried steel pipelines are located because they respond to magnetic detection techniques, but plastic pipes don’t, so techniques to locate buried plastic pipelines had to be discovered for improved safety at excavation sites.
Cathodic Survey Techniques
Corrosion protection was enabled by cathodic survey techniques. As previously mentioned, many types of corrosion come from current flow caused by differences in electrical potential. The discovery of pipe to soil reading techniques in the 1950s were an important advance in the understanding of cathodic protection as they established profiles of the electrical potential differences between the pipe and soil. These profiles allowed technicians to graphically locate areas of apparently low protection for further investigation. The 1960s saw the introduction of Close Interval Protection (CIP) surveys further defining areas of low protection. Additional survey techniques, including Direct Current Voltage Gradient (DCVG), Alternating Current Voltage Gradient
Appendix
The Role of Energy Pipelines and Research 62
(ACVC), C-Scan, and instant on and off surveys have been developed over the ensuing years. Each of these contributes to the industry’s ability to understand and control corrosion.
Fittings and Flanges
When early pipeliners wanted to turn corners with pipes they simply bent them, or welded pieces together at whatever the desired angle. Over time, as manufacturing techniques improved based on new knowledge, fabricated connections of various types (90 degree and 45 degree elbows, and tee connections for example) came into use. These fabricated connections, called “fittings” improved the quality of pipeline connections and of valve and meter manifolds which are used to direct flow at pipeline receipt and delivery stations. But fittings have different stress profiles than straight pipe which means they may need higher strength or thicker walls to contain the same pressures as straight pipe. In the 1970s industry associations developed “fitness for service” calculations and design standards allowing designers to ensure these fittings were just as reliable as the parent pipe.
Controls, SCADA, and Leak Detection
What happens at one location along the pipeline potentially affects the entire pipeline and pipeliners recognized early the value of rapid communication between operating locations. They built privately owned telegraph lines to communicate operating and shipper information along the pipeline. Telephones replaced telegraphs and central control rooms emerged. Data was manually phoned into the central dispatch rooms. Dispatchers recorded the information, developed an overall picture of pipeline operations and called back to field locations directing them to open or close valves or start or stop engines to control the pipeline.
Analog measurement devices allowed remote data gathering. The ability to transmit data (versus just voice) over telephone circuits transitioned centralized dispatch to rudimentary centralized control. (The difference between the two is dispatch involves directing others to control the pipeline, control involves sending out signals to devices mounted to valves or motors to make them open, close, stop, or start, remotely). The emergence in the 1970s of digital communications and main frame computers improved data acquisition and control, and allowed more robust control and optimization of pipeline systems. Leased phone circuits gave way to microwave and then fiber optic and satellite communications. Individual pipeline companies designed their own customized SCADA systems to be replaced over time by less customized systems provided by dedicated SCADA vendors. The 1980 and 90s saw the move from main frame computers to servers and desk top machines. Redundant computers, backup communication schemes, and even back up control rooms
Appendix
The Role of Energy Pipelines and Research 63
emerged, all to improve safety, reliability, efficiency and environmental performance.
The proliferation of SCADA data provided ready access to information about operating conditions, making computational leak detection possible starting in the 1980s. The 1990s saw development of more sophisticated equations of state and leak detection models, enabling improved leak detection accuracy and reliability.
Engineering and design
One of the primary engineering and design tools is engineering standards. These standards are usually developed based on the collective experience of experts, verified by additional testing and calculations as required. The American Petroleum Institute, established March 20, 1919 is one of the earliest developers of oil field and pipeline standards. Their standards cover most aspects of the pipeline operations, from valves to pipe, computational leak detection and control room design, to public communication. Without these standards and recommended practices each pipeline engineer would be left on their own to best determine how to engineer and design their specific project.
Standards development is a good example of turning the collective information and experience of thousands of people over a hundred years or more into information that benefits the entire industry and its stakeholders. Standards are invaluable, but standards development is expensive. It takes the most experienced technical and operations people from their jobs for periods of time. The hidden cost of standards development is the hours of time and the cost of travel expense for these experts to debate, and agree on common approaches. Standards are one example of a knowledge or technology transfer tool that is expensive to produce but difficult to commercialize.
Design approaches are currently under development for pipeline subject to large bending deformation due to seismic loading, slope movement and frost/thaw heave. The basic outcome of this research is to define the maximum safe axial compressive and tensile strengths for pipelines subject to bending. The research shows that, with appropriate design and girth weld quality assurance strategies, acceptable strains can be significantly increased from current established limits. This research is also in the process of establishing procedures to prove the strain capacity of pipelines subject to bending deformations. Complementing this work is a recent research product, optical strain gauges which can be used to monitor strain levels and accurately determine pipeline stress from those strain levels. This recent development promises great benefits for monitoring pipelines in active geological areas, providing increased pipeline safety.
Appendix
The Role of Energy Pipelines and Research 64
Construction
Construction follows on the heels of engineering and design, turning many of the standards into practice. Girth welds was one of the early welding advances, particularly the move from acetylene welds to electric resistance welds which, over time, eliminated the need for girth weld derating factors. Different steel metallurgies often called for new welding rods and sometimes even new welding techniques. Low hydrogen welding rods were developed in the 1980s to improve resistance to cracking and more exotic welding rods were developed to allow welding more special alloy materials. Artic construction lead to the need to understand preheating and post heating techniques to ensure quality welds. Radiographic weld inspection improved weld quality control and recently ultrasonic weld inspection has been applied to construction welding quality control.
Trenching has progressed a long way from the pick and shovel days. Improvements in mechanical trenchers and hydraulic backhoes aided construction activities. One of the larger developments however is “trenchless” installations. Guided directional drilling, based on oil field drilling technology, came into play in the 1980s, replacing trenching across obstacles such as river, roads, parking lots, and even under yards, decreasing the disruption and potential environmental damage caused by trenching. Advances in bit guidance systems and installation techniques are resulting in longer, more accurate, directional drills.
Pipelines crossing under roads, rail roads, and some other structures were cased, that is the pipeline was installed inside another “carrier” pipe to protect the pipe from stresses induced by heavy vehicles crossing over the pipe. While this practice made intuitive sense, over time pipeliners realized this situation established galvanic cells unless the two pipes were absolutely insulated from each other, a condition difficult to achieve. Corrosion leaks caused by electrically shorted cases led, in the 1980s, to eliminating the requirement to case crossings. This is an example of research proving what seems to be intuitively correct is not.
Internal line inspection
Pipelines are usually long and buried, making it hard to inspect their wall for potential corrosion, third party, or other types of damage. In the late 1960s the pipeline industry began using internal line inspection (ILI) devices, sometimes called “smart pigs”. Research has pushed the capabilities of these tools along from the early low resolution caliper deformation tools that simply detected pipe geometry to find potential anomalies. The 1970s saw the introduction of magnetic flux leakage tools and higher definition caliper tools. In the 1980s higher resolution magnetic flux tools and ultrasonic tools were introduced. At the same time these tools were coming into use, techniques had to be developed to
Appendix
The Role of Energy Pipelines and Research 65
process the data produced by the tools to allow pipeline operators to understand what the data meant and how to act on it. Over time the ability to precisely locate anomalies thereby limiting the dig area required to expose and examine them has improved based on experience and tool improvements. Miniaturization and battery life improvements have enabled ILI inspections of smaller diameter pipelines. Thus far the twenty first century has seen shear wave ultrasonic tools, electro-magnetic transfer tools and even tools containing a combination of different technologies come into wider use.
As mentioned in the report, some lines, primarily because of design or construction techniques do not allow ILI tools to pass through them in the “normal” way. Consequently research has been directed towards tethered ILI tools and robotic inspection to mention a few of the advances brought about by research. Direct Assessment, essentially a statistical tool that forecasts areas of likely damage for exposure and examination continues to developed and improve as an alternative to ILI tool runs. The development of direct assessment techniques have contributed greatly to the safety and reliability of natural gas pipelines.
The internal inspection state of the art, based on research, has progressed rapidly during the last thirty years, improving safety, reliability, and environmental performance.


![[Codeur en seine] Les Pipelines Jenkins dans la vraie vie](https://static.fdocuments.fr/doc/165x107/5883ebcc1a28ab34428b524f/codeur-en-seine-les-pipelines-jenkins-dans-la-vraie-vie.jpg)