Systembiologie 4 – Flux Balance Analysis -...
55
Humboldt- Universität Zu Berlin Edda Klipp, Humboldt-Universität zu Berlin Edda Klipp Systembiologie 4 – Flux Balance Analysis Sommersemester 2011 Humboldt-Universität zu Berlin Institut für Biologie Theoretische Biophysik
Transcript of Systembiologie 4 – Flux Balance Analysis -...

Humboldt-Universität
Zu Berlin
Edda Klipp, Humboldt-Universität zu Berlin
Edda Klipp
Systembiologie4 –
Flux Balance Analysis
Sommersemester 2011
Humboldt-Universität
zu
BerlinInstitut
für
BiologieTheoretische
Biophysik
Humboldt-Universität
Zu Berlin
Edda Klipp, Humboldt-Universität zu Berlin
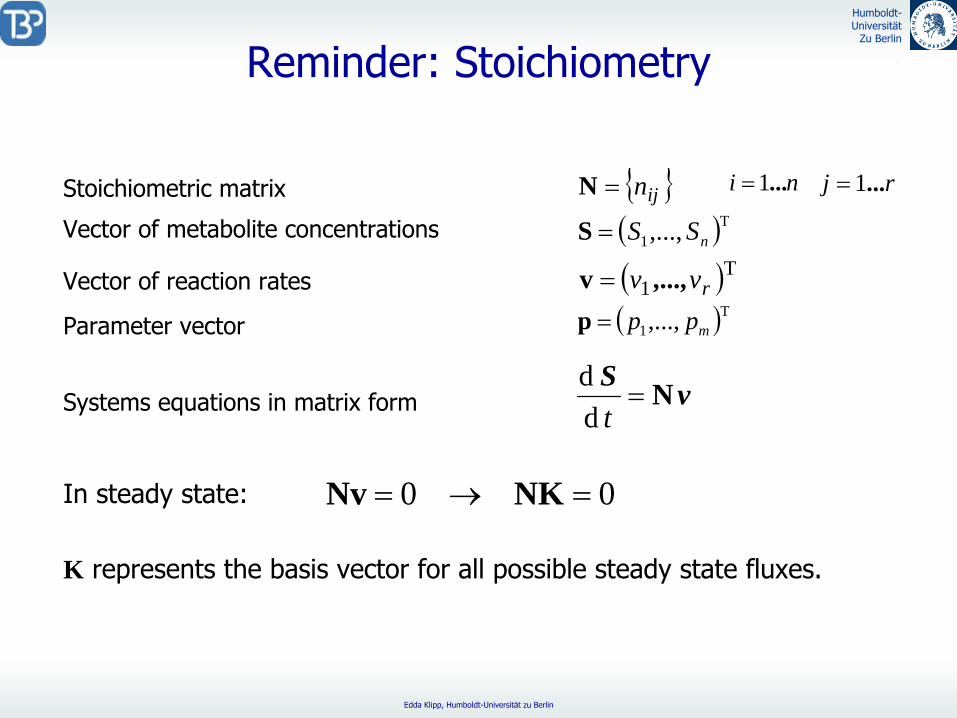
Reminder: Stoichiometry
Stoichiometric matrix
Vector of metabolite
concentrations
Vector of reaction
rates
Parameter vector
ijnN ni ...1 rj ...1
T1,..., nSSS
T1 rvv ,...,v T1,..., mppp
Systems equations
in matrix
formddS vt N
00 NKNvIn steady state:
K represents the basis vector for all possible steady state fluxes.
Humboldt-Universität
Zu Berlin
Edda Klipp, Humboldt-Universität zu Berlin
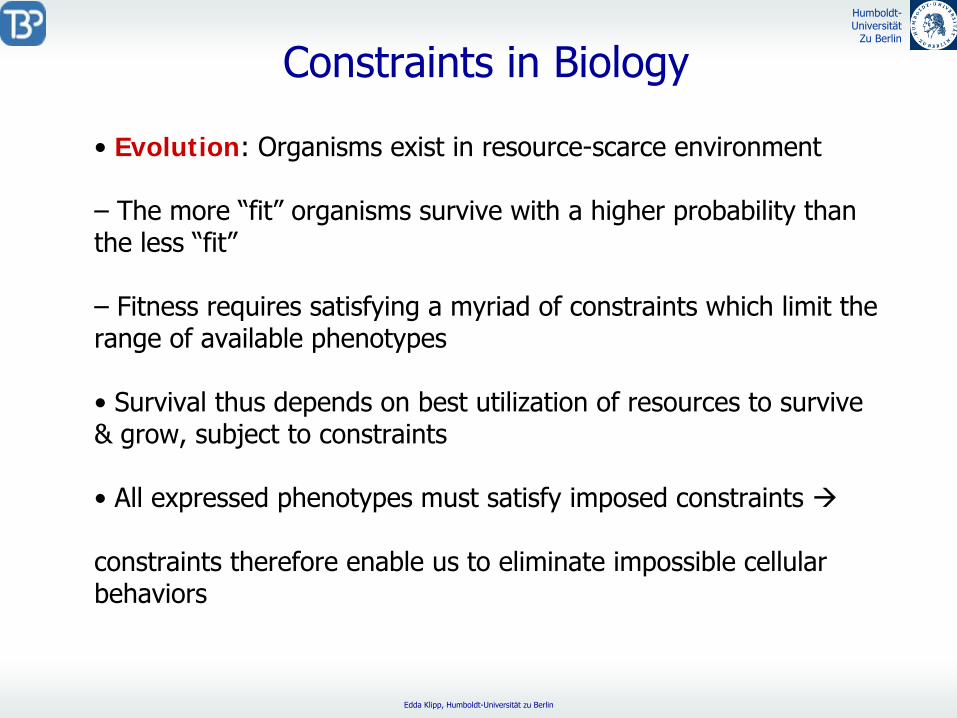
Constraints
in Biology
•
Evolution: Organisms
exist
in resource-scarce
environment
–
The
more
“fit”
organisms
survive
with
a higher
probability
than the
less
“fit”
–
Fitness requires
satisfying
a myriad
of constraints
which
limit
the range
of available
phenotypes
•
Survival
thus
depends
on best utilization
of resources
to survive & grow, subject
to constraints
•
All expressed
phenotypes
must
satisfy
imposed
constraints
constraints
therefore
enable
us
to eliminate
impossible
cellular behaviors

Humboldt-Universität
Zu Berlin
Edda Klipp, Humboldt-Universität zu Berlin
Constraints
in Biology•
Physico-chemical constraints
–
Conservation
of mass, energy, & momentum
–
Maximal reaction/transport
rates
–
Thermodynamic
constraints
•
Topobiological constraints
–
Macromolecular
crowding
constrains
possible
interactions
& diffusion of large molecules
–
DNA, e.g., must
be
both
tightly
packed
and yet
easily
accessible
to the
transcriptional
machinery
two
competing
needs
constrain
the
physical
arrangement
of DNA within
the
cell

Humboldt-Universität
Zu Berlin
Edda Klipp, Humboldt-Universität zu Berlin
Constraints
in Biology•
Environmental constraints
–
Condition-dependent
variable constraints
–
pH, temperature, osmolarity, availability
of electron
receptors, etc.
–
Availability
of carbon, oxygen, sulfur, nitrogen, and phosphate sources
in surrounding
media
•
Regulatory constraints
–
Self-imposed
“restraints”
–
Subject
to evolutionary
change
–
Allow
cells
to eliminate
suboptimal phenotypes
and confine themselves
to behaviors
of increased
fitness

Humboldt-Universität
Zu Berlin
Edda Klipp, Humboldt-Universität zu Berlin
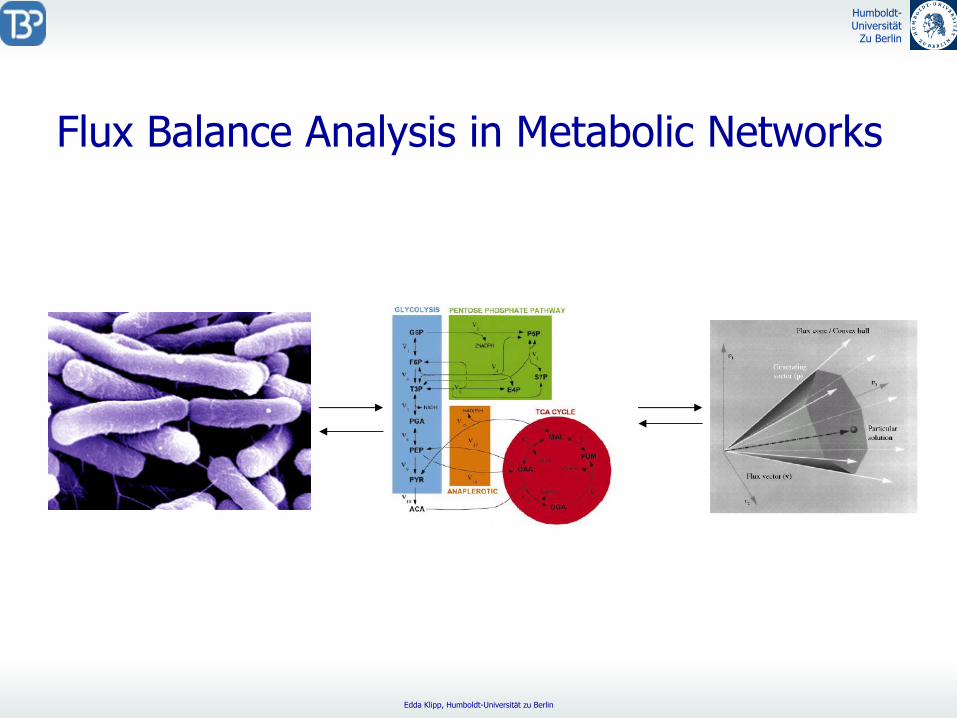
Metabolic
Networks: Complexity
E. coli

Humboldt-Universität
Zu Berlin
Edda Klipp, Humboldt-Universität zu Berlin
Metabolic
Networks: Pathways

Humboldt-Universität
Zu Berlin
Edda Klipp, Humboldt-Universität zu Berlin
The Flux Cone

Humboldt-Universität
Zu Berlin
Edda Klipp, Humboldt-Universität zu Berlin
The Flux Cone
vi
vj
vk
vi
vj
vk
v1
v2
v3
111
k
011
1k
101
2k
Illustrative case S1 S2 S3
v1 v4v2 v3S4
v5 S1
v1v2
v3

Humboldt-Universität
Zu Berlin
Edda Klipp, Humboldt-Universität zu Berlin
Example
for
Flux
Balance Analysis
max 32 vvv1
v2
v3
011
1k
101
2k
S1
v1v2
v3
Constraint: 1321 vvv
Objective:
v3
v21
1 Multiple optima
max 322 vv
Constraint: 1321 vvv
Objective:
v3
v21
1 Single optimum
max 322 vv
Constraints: 20
1
3
321.
vvvv
Objective:
v3
v21
1 Single optimum

Humboldt-Universität
Zu Berlin
Edda Klipp, Humboldt-Universität zu Berlin
Mathematical
Representation
of Constraints
•
Balances– Mass– Energy–
Solvent capacity
• Bounds–
Thermodynamics
–
Enzyme/transporter
capacity
•
Non-linear
P/C phenomena
N · v = 0

Humboldt-Universität
Zu Berlin
Edda Klipp, Humboldt-Universität zu Berlin
Metabolic
Network: Constraints
Humboldt-Universität
Zu Berlin
Edda Klipp, Humboldt-Universität zu Berlin
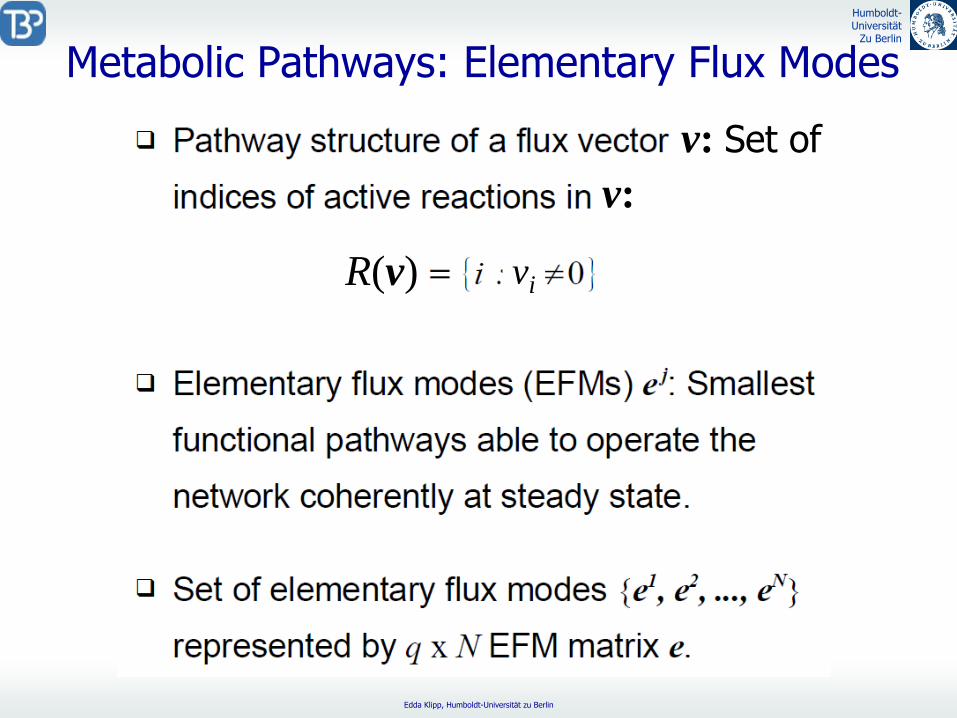
Metabolic
Pathways: Elementary
Flux
Modes
v: Set ofv:
R(v) vi

Humboldt-Universität
Zu Berlin
Edda Klipp, Humboldt-Universität zu Berlin
Elementary
Flux
Modes: Definitions

Humboldt-Universität
Zu Berlin
Edda Klipp, Humboldt-Universität zu Berlin
Elementary
Flux
Modes: Example

Humboldt-Universität
Zu Berlin
Edda Klipp, Humboldt-Universität zu Berlin
Elementary
Flux
Modes: Example
2

Humboldt-Universität
Zu Berlin
Edda Klipp, Humboldt-Universität zu Berlin
Elementary
Flux
Modes
& Extreme Pathways
Humboldt-Universität
Zu Berlin
Edda Klipp, Humboldt-Universität zu Berlin
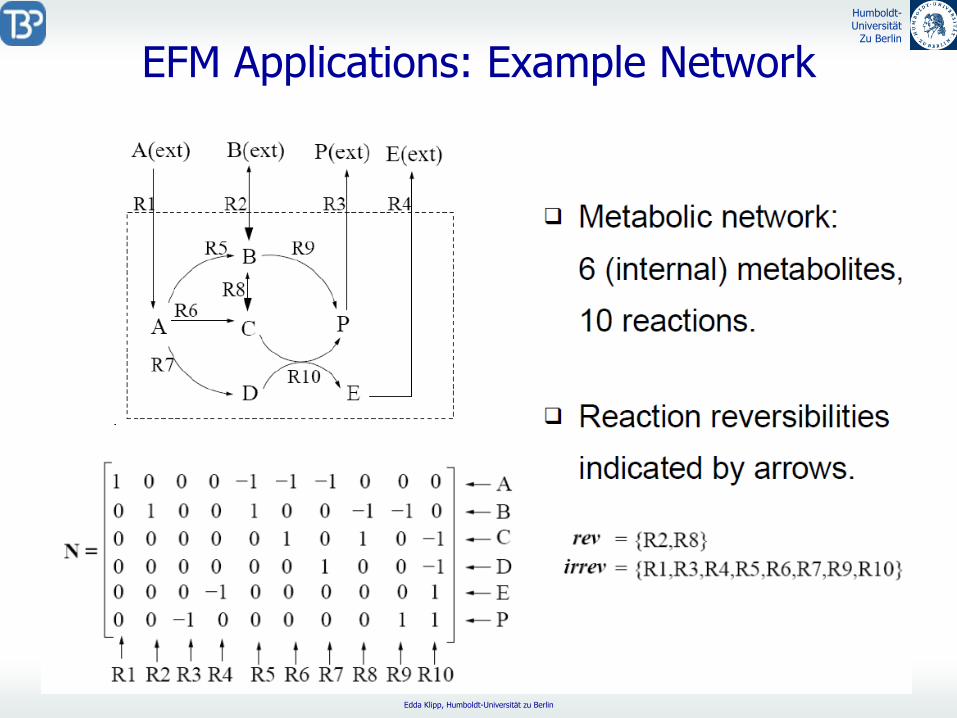
EFM Applications: Example
Network

Humboldt-Universität
Zu Berlin
Edda Klipp, Humboldt-Universität zu Berlin
EFM Applications: Example
Network

Humboldt-Universität
Zu Berlin
Edda Klipp, Humboldt-Universität zu Berlin
EFM Applications
1: Pathway
Lengths

Humboldt-Universität
Zu Berlin
Edda Klipp, Humboldt-Universität zu Berlin
EFM Applications
2: Optimal Yields
Humboldt-Universität
Zu Berlin
Edda Klipp, Humboldt-Universität zu Berlin
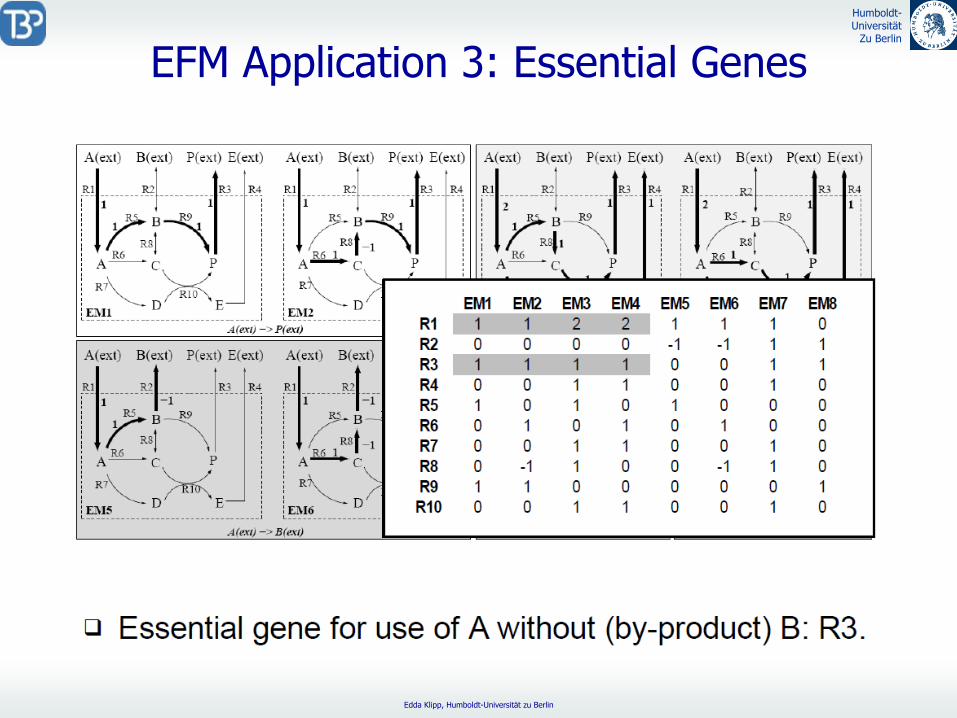
EFM Application
3: Essential Genes

Humboldt-Universität
Zu Berlin
Edda Klipp, Humboldt-Universität zu Berlin
Caveat
1: Applicability
Humboldt-Universität
Zu Berlin
Edda Klipp, Humboldt-Universität zu Berlin
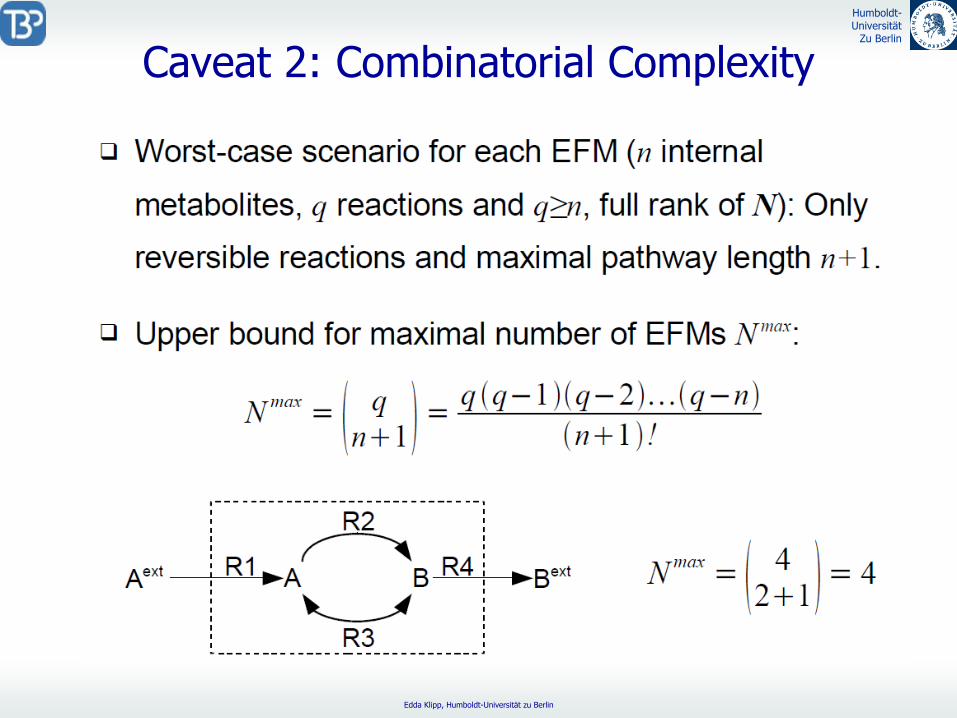
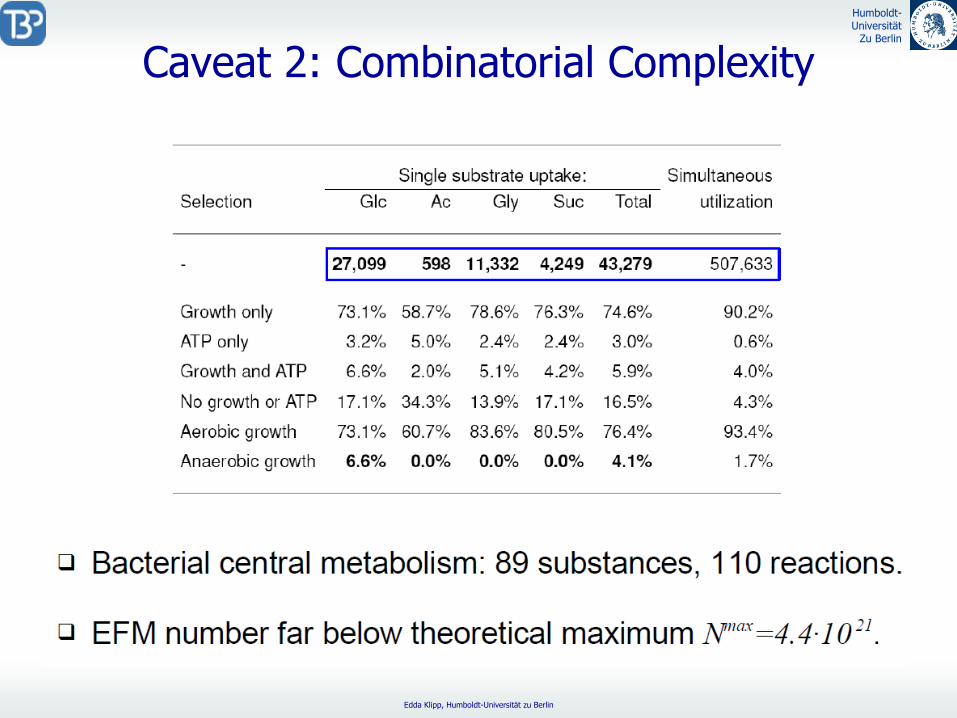
Caveat
2: Combinatorial
Complexity
Humboldt-Universität
Zu Berlin
Edda Klipp, Humboldt-Universität zu Berlin
Caveat
2: Combinatorial
Complexity

Humboldt-Universität
Zu Berlin
Edda Klipp, Humboldt-Universität zu Berlin
Caveat
3: Feasibility
of EFM

Humboldt-Universität
Zu Berlin
Edda Klipp, Humboldt-Universität zu Berlin
Caveat
3: Feasibility
of EFM
Humboldt-Universität
Zu Berlin
Edda Klipp, Humboldt-Universität zu Berlin
Flux Balance Analysis in Metabolic Networks

Humboldt-Universität
Zu Berlin
Edda Klipp, Humboldt-Universität zu Berlin
Predicting the E.coli
Optimal Growth
•Ibarra et al. Escherichia coli k-12 undergoes adaptive evolution to achieve in silico predicted optimal growth. Nature 2002.
•Daniel Segre, Dennis Vitkup, and George M. Church. Analysis of optimality in natural and perturbed metabolic networks. PNAS, vol. 99, 2002.
•Edwards et al. Characterizing the metabolic phenotype. A phenotype phase plan. Biotechnology and bioengineering. 2002
•Kenneth et al. Advances in flux balance analysis. Current Opinion in Biotechnology. 2003.
•Schillling
et. Al Combining pathway analysis with flux balance analysis for the comprehensive study of metabolic systems. Biotechnology and bioengineering, 2001.

Humboldt-Universität
Zu Berlin
Edda Klipp, Humboldt-Universität zu Berlin
E. Coli
Network: 53 metabolites, 78 internal
fluxes, 8 exchange
fluxes

Humboldt-Universität
Zu Berlin
Edda Klipp, Humboldt-Universität zu Berlin
(I) Narrowing the Steady State Flux Cone
•
The steady state flux cone contains infinite flux distributions!
•
Only a small portion of them is physiologically feasible.
•
More constraints
on the external fluxes.
These depend on factors as:–
Organism–
Environment and accessibility substrates –
maximum rates of diffusion mediated transport–
Etc…

Humboldt-Universität
Zu Berlin
Edda Klipp, Humboldt-Universität zu Berlin
(II) Calculating Optimal Flux Distribution
•
The constrained flux cone in E.coli
contains ~10^6 EFM(Schilling 2001)
•
How can we identify a “biologically meaningful”
flux?
Assumption…
the metabolic network is optimized with respect to a certain objective function Z.
Z will be a linear function. Later, we will deal with how exactly to choose Z

Humboldt-Universität
Zu Berlin
Edda Klipp, Humboldt-Universität zu Berlin
Minimize/Maximize S.T + inequality constraints
What we want to do is find the vector v in the flux cone which maximizes Z.
This optimization problem is a classical linear programming (LP) problem that can be solved using the simplex algorithm. W. Wiechert
. Journal of Biotechnology(2002)
j jjZ c v
(II) Calculating Optimal Flux Distribution
…this can be can formulated as an optimization problem:
vN0

Humboldt-Universität
Zu Berlin
Edda Klipp, Humboldt-Universität zu Berlin
(III) How to Choose the Objective Function Z
We want to choose a Z that is biologically meaningful. Reasonable options could be:1.
Z: Cellular growth
(maximization)
2.
Z: Particular metabolite engineering
(maximization)3.
Z: Energy consumption
(minimization)
We want a v that:(A) Resides in side the cone.(B) maximizes Z=B+D+2E.
Example:cellular growth is correlated with the production of B,D and 2E.

Humboldt-Universität
Zu Berlin
Edda Klipp, Humboldt-Universität zu Berlin
1. “It has been shown that under rich growth conditions (i.e. no lack of phosphate and nitrogen), E. Coli grows in a stoichiometrically optimal manner.”
(Schilling 2001, Edwards 1994)
We shall use Z which reflects:
Cellular Growth
(III) How to Choose the Objective Function Z
2. “It is reasonable to hypothesize that unicellular organisms have evolved toward maximal growth performance.”
(Segre, 2002.)
Humboldt-Universität
Zu Berlin
Edda Klipp, Humboldt-Universität zu Berlin
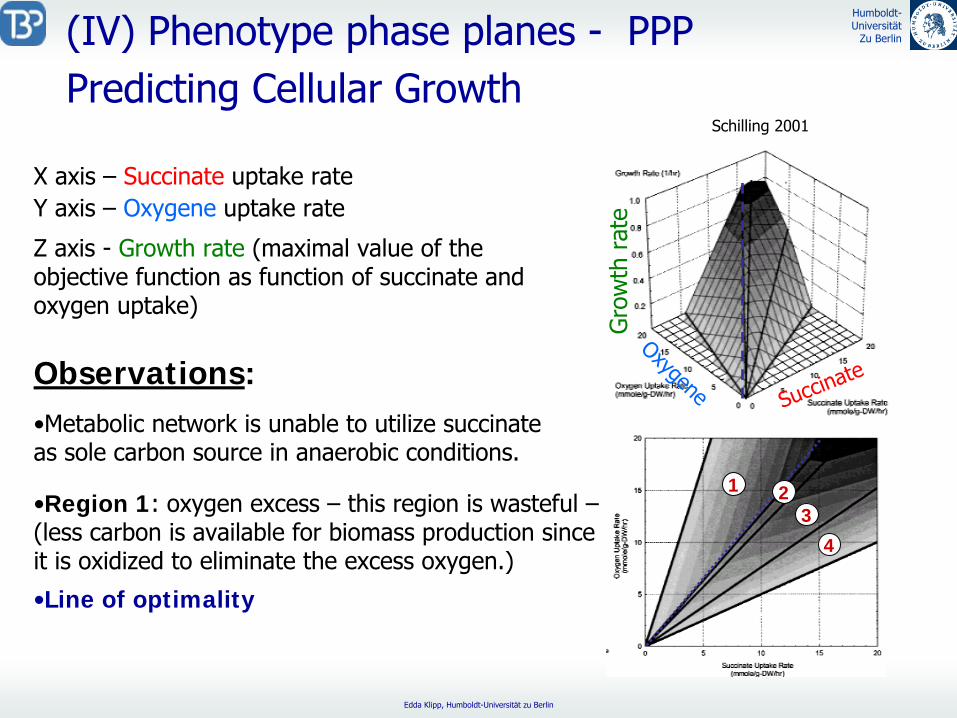
(IV) Phenotype phase planes -
PPPPredicting Cellular Growth
X axis –
Succinate
uptake rate
Observations:
Schilling 2001
Y axis –
Oxygene
uptake rate
Z axis -
Growth rate
(maximal value of the objective function as function of succinate and oxygen uptake)
•Metabolic network is unable to utilize succinate as sole carbon source in anaerobic conditions.
•Region 1: oxygen excess –
this region is wasteful – (less carbon is available for biomass production since
it is oxidized to eliminate the excess oxygen.)
•Line of optimality
Succinate
Oxygene
Gro
wth
rat
e
1 23
4

Humboldt-Universität
Zu Berlin
Edda Klipp, Humboldt-Universität zu Berlin
(IV) Phenotype phase planes -
PPPPredicting Cellular Growth
X axis –
Succinate
uptake rate
Observations:
Schilling 2001
Y axis –
Oxygene
uptake rateZ axis –
Growth rate
(maximal value of the
objective function as function of succinate and oxygen uptake)
•Region 2 –
limitation on both oxygen and succinate
•Region 3 –
the uptake of additional succinate has a negative effect. Cellular resources are required to eliminate excessive succinate.
Succinate
Oxygene
Gro
wth
rat
e
1 23
4

Humboldt-Universität
Zu Berlin
Edda Klipp, Humboldt-Universität zu Berlin
Robustness
Flux dependencies. Centre: phenotypic phase plane (PhPP). It shows the maximum biomass production that is achievable at every possible combination of O2 and succinate
uptake rates. The line of optimality corresponds to the conditions that are necessary for maximal biomass yield (g DW cell mmol–1 carbon source, where DW is dry weight). Robustness analysis of the two uptake rates is shown in the two side panels. Left: effect on growth rate of varying O2
uptake at a fixed succinate
uptake rate. Right: the effect on biomass generation of varying the succinate
uptake rate at a fixed O2
uptake rate.

Humboldt-Universität
Zu Berlin
Edda Klipp, Humboldt-Universität zu Berlin
Model vs. biological experiments

Humboldt-Universität
Zu Berlin
Edda Klipp, Humboldt-Universität zu Berlin
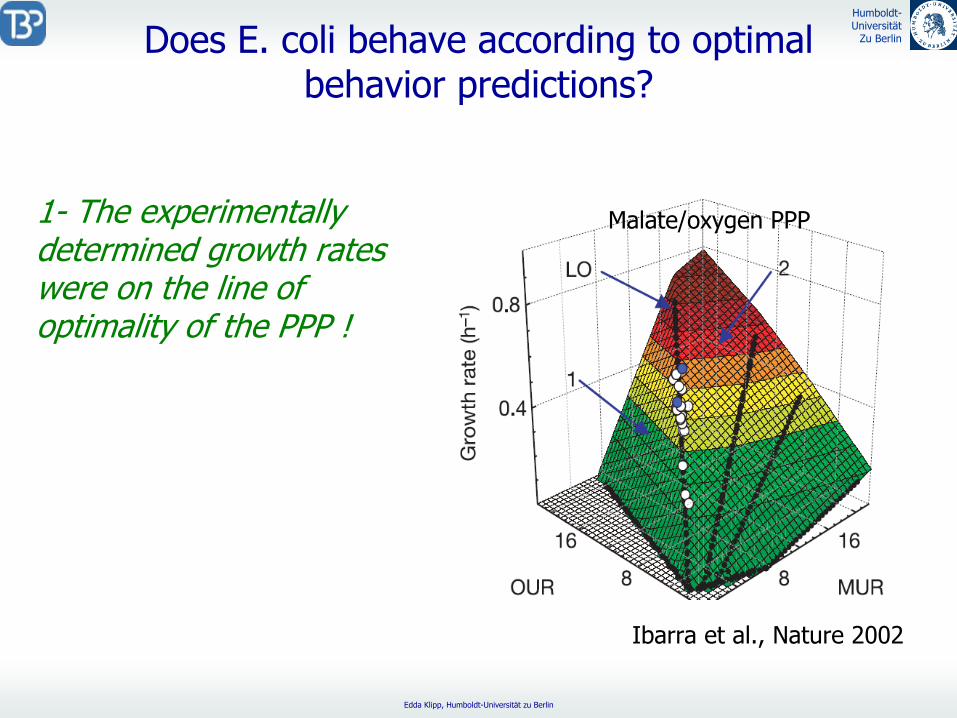
Does E. coli behave according to optimal behavior predictions?
•
E. coli was grown with malate as sole carbon source. •
A range of substrate concentrations and temperatures were used in order to vary the malate uptake rate (MUR).
•
Oxygen uptake rate (OUR) and growth rate were measured
.
.
.
Humboldt-Universität
Zu Berlin
Edda Klipp, Humboldt-Universität zu Berlin
Does E. coli behave according to optimal behavior predictions?
Malate/oxygen PPP
Ibarra et al., Nature 2002
1- The experimentally determined growth rates were on the line of optimality of the PPP !

Humboldt-Universität
Zu Berlin
Edda Klipp, Humboldt-Universität zu Berlin
Does E. coli behave according to optimal behavior predictions?
Malate/oxygen PPP
Ibarra et al., Nature 2002
Is the optimal performance on malate stable over prolonged periods of time?
Evolution of E. coli on malate was studied for 500 generations in a single condition…
2- An adaptive evolution was observed with an increase of 19% in growth rate!
3- Same adaptive evolution was observed for succinate and Malate!

Humboldt-Universität
Zu Berlin
Edda Klipp, Humboldt-Universität zu Berlin
Does E. coli behave according to optimal behavior predictions?
•Why does this adaptive evolution occur?
•In other words why is the starting point at the bottom of the hill?
Humboldt-Universität
Zu Berlin
Edda Klipp, Humboldt-Universität zu Berlin
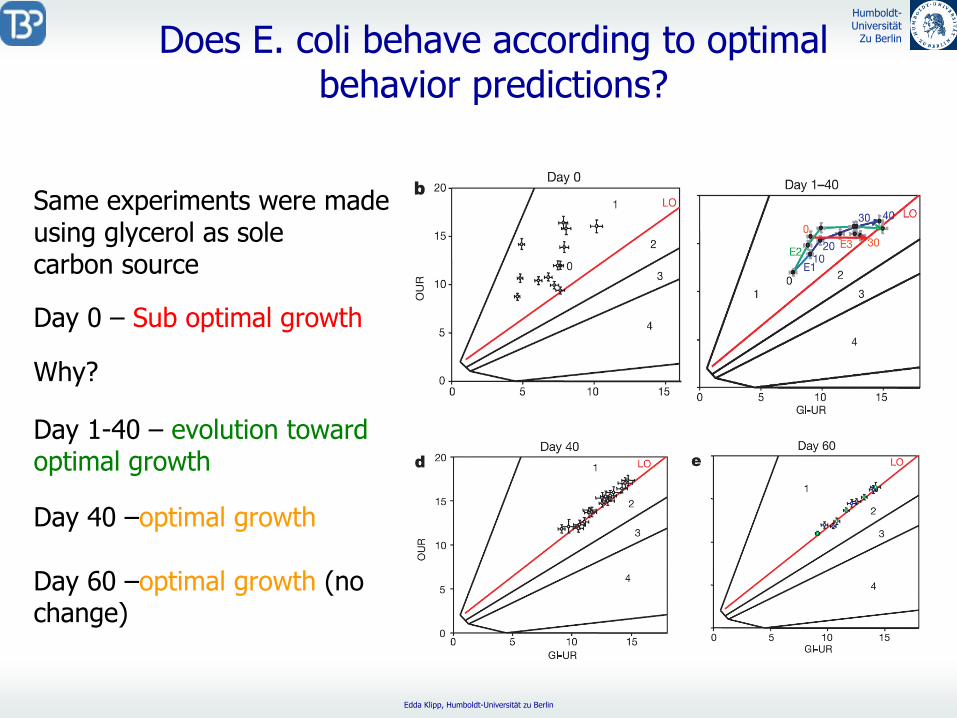
Does E. coli behave according to optimal behavior predictions?
Same experiments were made using glycerol as sole carbon source
Day 0 –
Sub optimal growth
Day 1-40 –
evolution toward optimal growth
Day 40 –optimal growth
Day 60 –optimal growth
(no change)
Why?
Humboldt-Universität
Zu Berlin
Edda Klipp, Humboldt-Universität zu Berlin
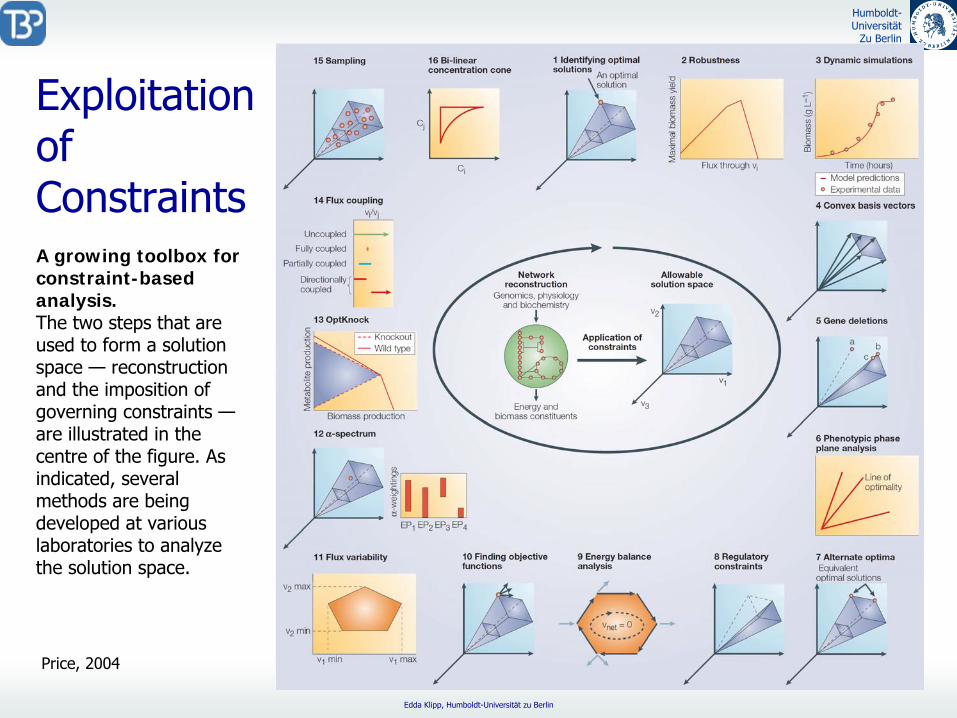
Exploitation of ConstraintsA growing toolbox for constraint-based analysis. The two steps that are used to form a solution space —
reconstruction and the imposition of governing constraints —
are illustrated in the centre of the figure. As indicated, several methods are being developed at various laboratories to analyze the solution space.
Price, 2004

Humboldt-Universität
Zu Berlin
Edda Klipp, Humboldt-Universität zu Berlin
Metabolic functions of duplicate genes inSaccharomyces cerevisiae
„Genome-scale“
metabolisches Modell
672 Reaktionen105 duplizierte Genfamilien
Systematischer Test von
Knock-outs
Gesamt-Genome (Hefe):~6000 Gene1500 duplizierte Gene
(mehrere Kopien)

Humboldt-Universität
Zu Berlin
Edda Klipp, Humboldt-Universität zu Berlin
13C-basierte metabolische
Flußanalyse

Humboldt-Universität
Zu Berlin
Edda Klipp, Humboldt-Universität zu Berlin
Funktionen duplizierter Gene
Back-up
für essentielle GeneNetzwerkrobustheit; Nullmutanten ohne Phänotyp32 von 52 Mutanten (einer Kopie) essentieller Gene lebensfähig
Gene dosageWege mit hohen Flüssen: Erhöhen der Aktivität kritischer Enzymebetrifft 19 der duplizierten FamilienBedeutung ist abhängig von Nährstoffquelle
Regulatorische
Funktion duplizierter Gene18 der 105 duplizierten Genfamilien spielen regulatorische
Rolle
z.B. bei lineare Pathways, Aminosäuresynthese
Gene mit neuer Aufgabe

Humboldt-Universität
Zu Berlin
Edda Klipp, Humboldt-Universität zu Berlin

Humboldt-Universität
Zu Berlin
Edda Klipp, Humboldt-Universität zu Berlin
Veränderte Flußverteilungbei anderen Nährstoffen

Humboldt-Universität
Zu Berlin
Edda Klipp, Humboldt-Universität zu Berlin
Metabolism
of Mycoplasma
pneumoniae
Judith Wodke, project
together
with
Luis Serrano, BarcelonaYus
et al., 2009
To understand
basic
principles
of bacterial
metabolism
organization
and regulation, but
also the
impact
of genome
size, one
of the
smallest
bacteria, Mycoplasma pneumoniae, was systematically
studied.
A manually
curated
metabolic
network
of 189 reactions
catalyzed
by
129 enzymes
allowed
the
design
of a defined, minimal medium
with
19 essential nutrients.
Humboldt-Universität
Zu Berlin
Edda Klipp, Humboldt-Universität zu Berlin
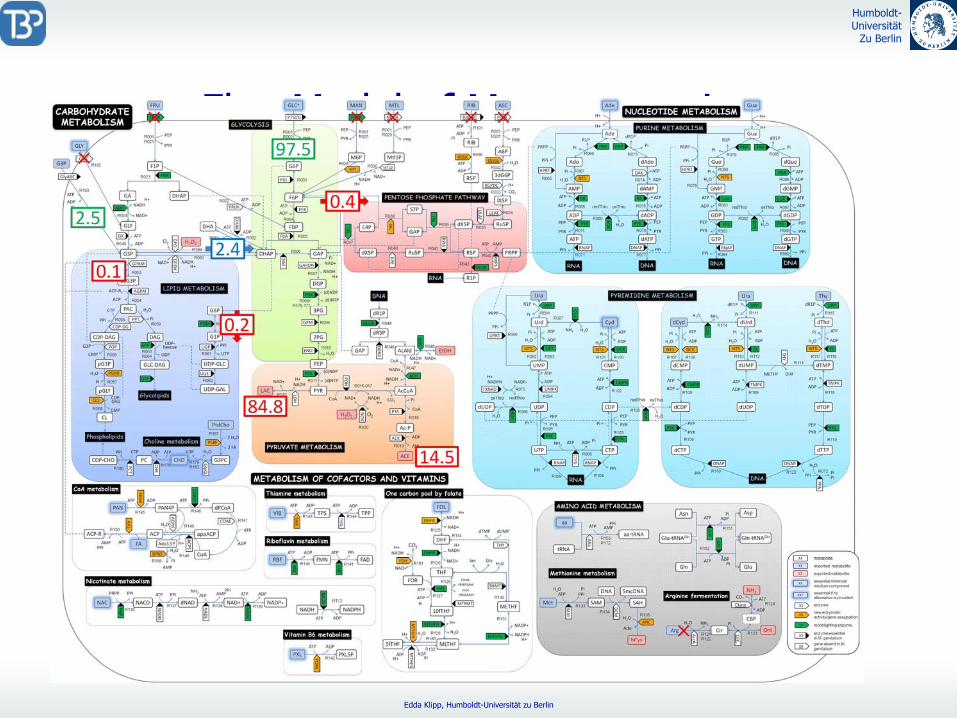
Flux
Model of M. pneumoniae

Humboldt-Universität
Zu Berlin
Edda Klipp, Humboldt-Universität zu Berlin
Detailed
Dynamic
Model of M. pneumoniae Metabolism
-
Dissecting growth on different conditions (rich vs
defined medium)- Regulation on the metabolic and the genetic level- Dynamics of input and output metabolites

Humboldt-Universität
Zu Berlin
Edda Klipp, Humboldt-Universität zu Berlin
Bibliography[1] Daniel Segre, Dennis Vitkup, and George M. Church. Analysis of optimality in natural and perturbed metabolic
networks. PNAS, vol. 99, 2002.[2] C. H. Schilling, D. Letscher
and Bernhard Palsson. Theory for the Systemic Definition of Metabolic Pathways and their use in Interpreting Metabolic Function from a Pathway-Oriented Perspective. J. theor. Biol. (2000)
[3] Schillling
et. Al Combining pathway analysis with flux balance analysis for the comprehensive study of metabolic systems. Biotechnology and bioengineering, 2001.
[4] Edwards et al. 2002. Characterizing the metabolic phenotype”
A phenotype phase plan. Biotechnology and bioengineering
[5] Kenethh
et al. Advances in flux balance analysis. Current Opinion in Biotechnology. [6] Ibarra et al. Escherichia coli k-12 undergoes adaptive evolution to achiev
in silico
predicted optimal growth. Nature 2002.
[7] W. Wiechert
. Modeling and simulation: tools for metabolic engineering. Journal of biotechnology(2002)[8] Cornish-Bowden. From genome to cellular phenotype-
a role for meatbolic
flux analysis? Nature biotechnology, vol
18, 2000.
[9] Schuster et al. Detection of elelmtary
flux modes in biochemical networks: a promising tool for pathway analysis and metabolic engineering. TIBTECH 1999
[10] J. Papin, Nathan D Price, B. Palsson. Extreme pathway lengths and reaction participation in genome scale metabolic networks. Genome research, 2002.
[11] Stelling
eta l. Metabolic netwrok
structure determines key aspects of functionality and regulation. Nature 2002.[12] A general definition of metabolic pathways useful for systematic organization and analysis of complex metabolic
networks.

Humboldt-Universität
Zu Berlin
Edda Klipp, Humboldt-Universität zu Berlin
Growth Phenotypes of insilico
deletion strains
The biomass yields are normalized with respect to the results for the full metabolic genotype. The α
and β
value for the constraints on the external fluxes for glucose and oxygen uptake are defined as follows (units-
mmole
g-1 hr-1): Phase 1 -
vglc = 10, voxy = 23; LO -
vgic = 10, voxy = 20.3; Phase 2 -
vglc = 10, voxy = 17; Phase 3 -
vglc = 10, voxy = 12; Phase 4 -
vglc = 10, voxy = 8; Phase 5 -
vglc = 10, voxy = 3; Phase 6 -
vglc = 10, voxy = 0.
Maximal biomass yields on glucose for all possible single gene deletions in central intermediary metabolism. The environmental variables (uptake rate/external metabolic fluxes) are set to correspond to a point within each of the phases of the wild-type PhPP
(figure inset). The maximal yields were calculated using flux-balance analysis with the objective of maximizing the growth flux.