Siège de la Société
57
MAPFRE AM Société d'investissement à Capital Variable R.C.S. Luxembourg N° B 211466 Annual Report, including Audited Financial Statements for the year ended December 31, 2020
Transcript of Siège de la Société
MAPFRE AMSociété d'investissement à Capital Variable
R.C.S. Luxembourg N° B 211466Annual Report, including Audited Financial Statements for the year ended
December 31, 2020
MAPFRE AM
MAPFRE AM - Euro Bonds Fund
MAPFRE AM - Short Term Euro
MAPFRE AM - Inclusion Responsable Fund
MAPFRE AM - US Forgotten Value Fund
MAPFRE AM - European Equities
MAPFRE AM - Iberian Equities
MAPFRE AM - Multi Asset Strategy
MAPFRE AM - Good Governance Fund
MAPFRE AM - Global Bond Fund
MAPFRE AM - Behavioral Fund
MAPFRE AM - Capital Responsable Fund
No subscription can be received on the basis of financial reports. Subscriptions are only valid if made on the basis of the current prospectus and relevant Key InvestorInformation Document (“KIID”) which will be accompanied by a copy of the latest annual report and a copy of the latest available semi-annual report, if published aftersuch annual report.
MAPFRE AM
1
Table of Contents
Management and Administration 3
Directors' Report 5
Independent Auditor's Report 18
Statistics 20
Combined Statement of Net Assets as at December 31, 2020 23
Combined Statement of Operations and Changes in Net Assets for the year ended December 31, 2020 23
MAPFRE AM - Euro Bonds Fund
Statement of Net Assets as at December 31, 2020 24
Statement of Operations and Changes in Net Assets for the year ended December 31, 2020 24
Statement of Changes in Number of Shares 24
Securities Portfolio as at December 31, 2020 25
MAPFRE AM - Short Term Euro
Statement of Net Assets as at December 31, 2020 26
Statement of Operations and Changes in Net Assets for the year ended December 31, 2020 26
Statement of Changes in Number of Shares 26
Securities Portfolio as at December 31, 2020 27
MAPFRE AM - Inclusion Responsable Fund
Statement of Net Assets as at December 31, 2020 28
Statement of Operations and Changes in Net Assets for the year ended December 31, 2020 28
Statement of Changes in Number of Shares 28
Securities Portfolio as at December 31, 2020 29
MAPFRE AM - US Forgotten Value Fund
Statement of Net Assets as at December 31, 2020 30
Statement of Operations and Changes in Net Assets for the year ended December 31, 2020 30
Statement of Changes in Number of Shares 30
Securities Portfolio as at December 31, 2020 31
MAPFRE AM - European Equities
Statement of Net Assets as at December 31, 2020 32
Statement of Operations and Changes in Net Assets for the year ended December 31, 2020 32
Statement of Changes in Number of Shares 32
Securities Portfolio as at December 31, 2020 33
Financial derivative instruments as at December 31, 2020 33
MAPFRE AM - Iberian Equities
Statement of Net Assets as at December 31, 2020 34
Statement of Operations and Changes in Net Assets for the year ended December 31, 2020 34
Statement of Changes in Number of Shares 34
Securities Portfolio as at December 31, 2020 35
MAPFRE AM - Multi Asset Strategy
Statement of Net Assets as at December 31, 2020 36
Statement of Operations and Changes in Net Assets for the year ended December 31, 2020 36
Statement of Changes in Number of Shares 36
Securities Portfolio as at December 31, 2020 37
MAPFRE AM
2
Table of Contents
MAPFRE AM - Good Governance Fund
Statement of Net Assets as at December 31, 2020 38
Statement of Operations and Changes in Net Assets for the year ended December 31, 2020 38
Statement of Changes in Number of Shares 38
Securities Portfolio as at December 31, 2020 39
MAPFRE AM - Global Bond Fund
Statement of Net Assets as at December 31, 2020 40
Statement of Operations and Changes in Net Assets for the year ended December 31, 2020 40
Statement of Changes in Number of Shares 40
Securities Portfolio as at December 31, 2020 41
Financial derivative instruments as at December 31, 2020 41
MAPFRE AM - Behavioral Fund
Statement of Net Assets as at December 31, 2020 43
Statement of Operations and Changes in Net Assets for the year ended December 31, 2020 43
Statement of Changes in Number of Shares 43
Securities Portfolio as at December 31, 2020 44
MAPFRE AM - Capital Responsable Fund
Statement of Net Assets as at December 31, 2020 45
Statement of Operations and Changes in Net Assets for the year ended December 31, 2020 45
Statement of Changes in Number of Shares 45
Securities Portfolio as at December 31, 2020 46
Notes to the Financial Statements 48
Other shareholder's information (unaudited) 54
MAPFRE AM
3
Registered office
60, avenue J. F. KennedyL-1855 Luxembourg Grand Duchy of Luxembourg
Members of the Board of Directors of the SICAV
ChairmanAlvaro Anguita AlegretChief Executive OfficerMAPFRE Asset Management SGIIC S.A.
Patrick Philip NielsenDeputy Director of International EquityMAPFRE Asset Management SGIIC S.A.
Juan José Pedraza LaynezDirector of the Corporate Legal DepartmentMAPFRE S.A.
Javier VallsIndependent DirectorThe Director's Office
Noel FordIndependent Director
Marzena Magdalena Formosa Chief Investment OfficerMAPFRE MSV Life p.l.c.
Management Company
Waystone Management Company (Lux) S.A.#
19, rue de BitbourgL-1273 LuxembourgGrand Duchy of Luxembourg
Directors of the Management Company
Géry DaeninckIndependent Director
Martin Peter Vogel Chief Executive OfficerWaystone Management Company (Lux) S.A.#
John Li How CheongIndependent Director
Carlo Montagna (until May 31, 2020)Independent Director
Yves Wagner (until May 31, 2020)Independent Director
Depositary
BNP Paribas Securities Services, Luxembourg Branch60, avenue J.F. KennedyL-1855 LuxembourgGrand Duchy of Luxembourg
Administrative Agent
BNP Paribas Securities Services, Luxembourg Branch60, avenue J.F. Kennedy L-1855 LuxembourgGrand Duchy of Luxembourg
# As of February 3, 2021, MDO Management Company has changed its name to Waystone Management Company (Lux) S.A..
Management and Administration
MAPFRE AM
4
Auditor
KPMG Luxembourg, Société Coopérative39, avenue J. F. KennedyL-1855 LuxembourgGrand Duchy of Luxembourg
Legal Adviser
Allen & Overy, Société en commandite simple5, avenue J. F. KennedyL-1855 LuxembourgGrand Duchy of Luxembourg
Global Distributor and Investment Manager
MAPFRE ASSET MANAGENMENT SGIIC S.A.Cr. Pozuelo de Alarcón, 50-1 - Edificio 428220 Majadahonda MadridSpain
Management and Administration (continued)
MAPFRE AM Directors’ Report
5
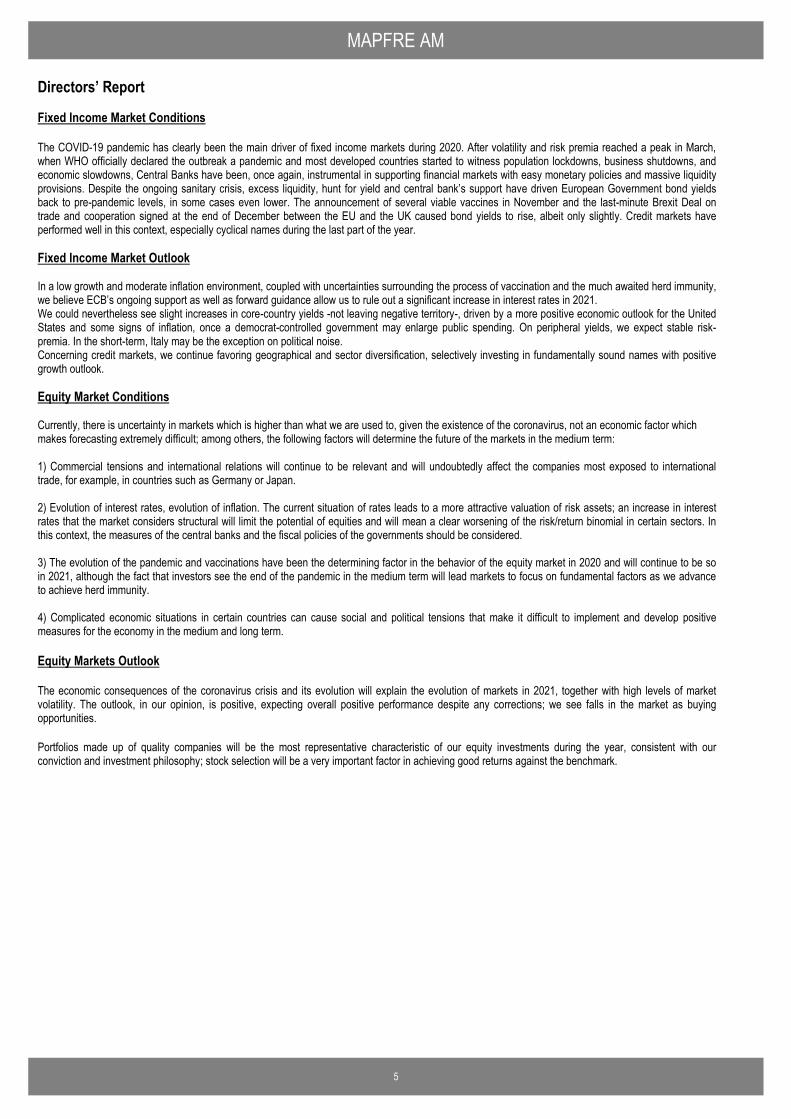
Fixed Income Market Conditions The COVID-19 pandemic has clearly been the main driver of fixed income markets during 2020. After volatility and risk premia reached a peak in March, when WHO officially declared the outbreak a pandemic and most developed countries started to witness population lockdowns, business shutdowns, and economic slowdowns, Central Banks have been, once again, instrumental in supporting financial markets with easy monetary policies and massive liquidity provisions. Despite the ongoing sanitary crisis, excess liquidity, hunt for yield and central bank’s support have driven European Government bond yields back to pre-pandemic levels, in some cases even lower. The announcement of several viable vaccines in November and the last-minute Brexit Deal on trade and cooperation signed at the end of December between the EU and the UK caused bond yields to rise, albeit only slightly. Credit markets have performed well in this context, especially cyclical names during the last part of the year. Fixed Income Market Outlook In a low growth and moderate inflation environment, coupled with uncertainties surrounding the process of vaccination and the much awaited herd immunity, we believe ECB’s ongoing support as well as forward guidance allow us to rule out a significant increase in interest rates in 2021. We could nevertheless see slight increases in core-country yields -not leaving negative territory-, driven by a more positive economic outlook for the United States and some signs of inflation, once a democrat-controlled government may enlarge public spending. On peripheral yields, we expect stable risk-premia. In the short-term, Italy may be the exception on political noise. Concerning credit markets, we continue favoring geographical and sector diversification, selectively investing in fundamentally sound names with positive growth outlook. Equity Market Conditions Currently, there is uncertainty in markets which is higher than what we are used to, given the existence of the coronavirus, not an economic factor which makes forecasting extremely difficult; among others, the following factors will determine the future of the markets in the medium term: 1) Commercial tensions and international relations will continue to be relevant and will undoubtedly affect the companies most exposed to international trade, for example, in countries such as Germany or Japan. 2) Evolution of interest rates, evolution of inflation. The current situation of rates leads to a more attractive valuation of risk assets; an increase in interest rates that the market considers structural will limit the potential of equities and will mean a clear worsening of the risk/return binomial in certain sectors. In this context, the measures of the central banks and the fiscal policies of the governments should be considered. 3) The evolution of the pandemic and vaccinations have been the determining factor in the behavior of the equity market in 2020 and will continue to be so in 2021, although the fact that investors see the end of the pandemic in the medium term will lead markets to focus on fundamental factors as we advance to achieve herd immunity. 4) Complicated economic situations in certain countries can cause social and political tensions that make it difficult to implement and develop positive measures for the economy in the medium and long term. Equity Markets Outlook The economic consequences of the coronavirus crisis and its evolution will explain the evolution of markets in 2021, together with high levels of market volatility. The outlook, in our opinion, is positive, expecting overall positive performance despite any corrections; we see falls in the market as buying opportunities. Portfolios made up of quality companies will be the most representative characteristic of our equity investments during the year, consistent with our conviction and investment philosophy; stock selection will be a very important factor in achieving good returns against the benchmark.
MAPFRE AM Directors’ Report (continued)
6
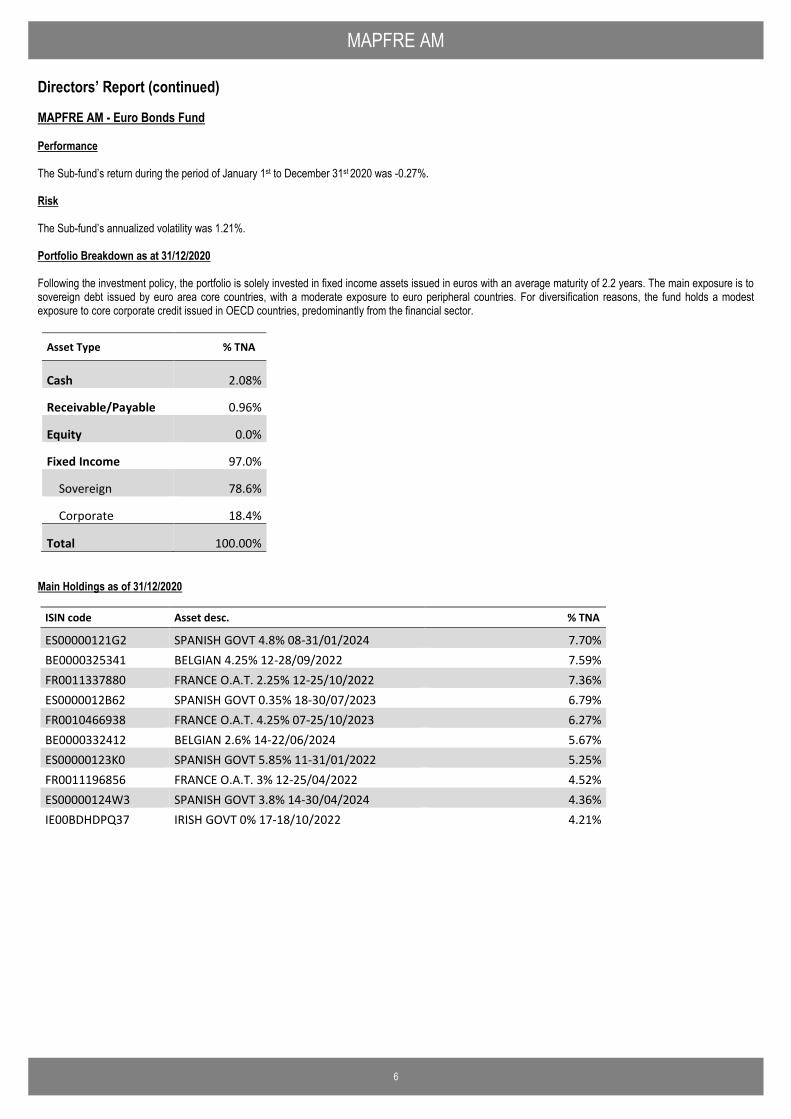
MAPFRE AM - Euro Bonds Fund Performance The Sub-fund’s return during the period of January 1st to December 31st 2020 was -0.27%. Risk
The Sub-fund’s annualized volatility was 1.21%. Portfolio Breakdown as at 31/12/2020 Following the investment policy, the portfolio is solely invested in fixed income assets issued in euros with an average maturity of 2.2 years. The main exposure is to sovereign debt issued by euro area core countries, with a moderate exposure to euro peripheral countries. For diversification reasons, the fund holds a modest exposure to core corporate credit issued in OECD countries, predominantly from the financial sector.
Asset Type % TNA
Cash 2.08%
Receivable/Payable 0.96%
Equity 0.0%
Fixed Income 97.0%
Sovereign 78.6%
Corporate 18.4%
Total 100.00% Main Holdings as of 31/12/2020
ISIN code Asset desc. % TNA
ES00000121G2 SPANISH GOVT 4.8% 08-31/01/2024 7.70% BE0000325341 BELGIAN 4.25% 12-28/09/2022 7.59% FR0011337880 FRANCE O.A.T. 2.25% 12-25/10/2022 7.36% ES0000012B62 SPANISH GOVT 0.35% 18-30/07/2023 6.79% FR0010466938 FRANCE O.A.T. 4.25% 07-25/10/2023 6.27% BE0000332412 BELGIAN 2.6% 14-22/06/2024 5.67% ES00000123K0 SPANISH GOVT 5.85% 11-31/01/2022 5.25% FR0011196856 FRANCE O.A.T. 3% 12-25/04/2022 4.52% ES00000124W3 SPANISH GOVT 3.8% 14-30/04/2024 4.36% IE00BDHDPQ37 IRISH GOVT 0% 17-18/10/2022 4.21%
MAPFRE AM Directors’ Report (continued)
7
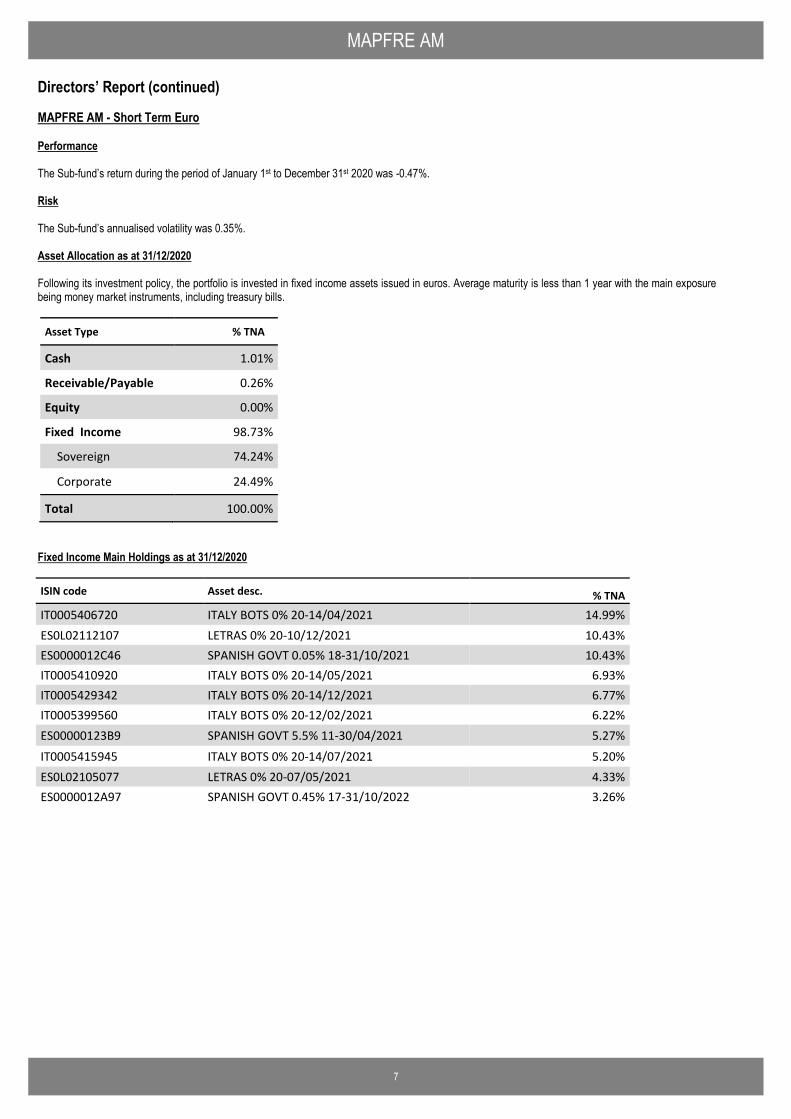
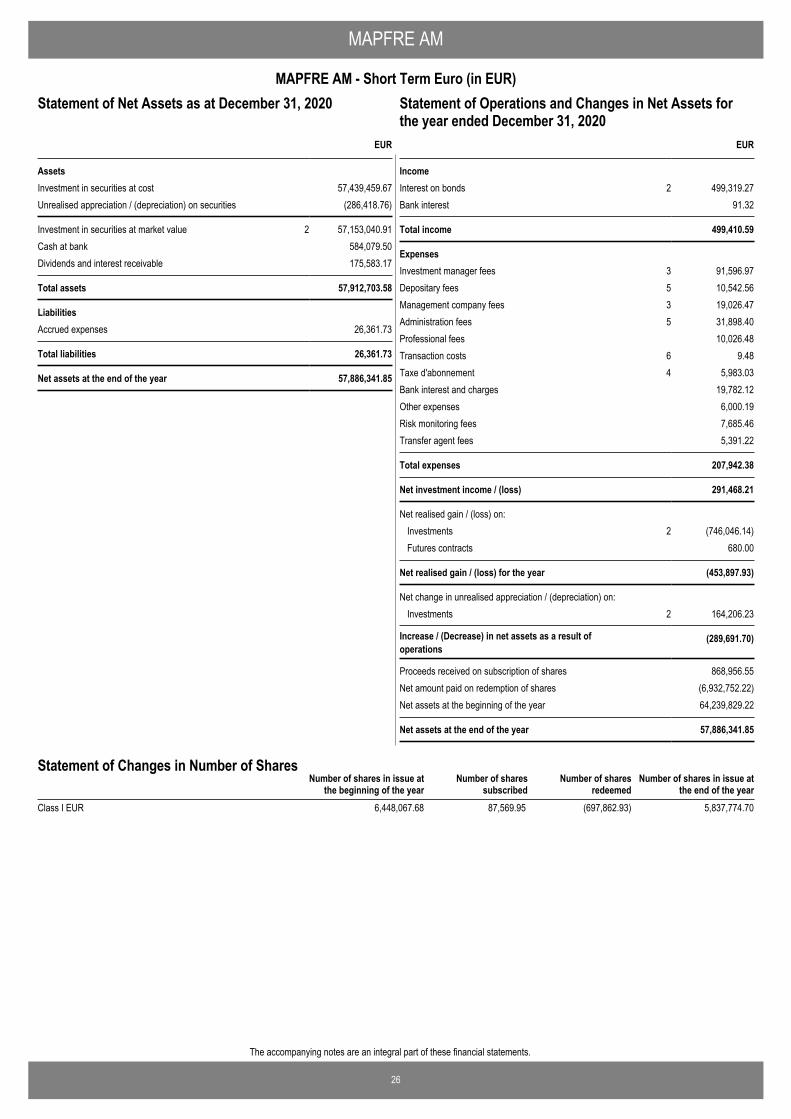
MAPFRE AM - Short Term Euro Performance The Sub-fund’s return during the period of January 1st to December 31st 2020 was -0.47%. Risk The Sub-fund’s annualised volatility was 0.35%. Asset Allocation as at 31/12/2020 Following its investment policy, the portfolio is invested in fixed income assets issued in euros. Average maturity is less than 1 year with the main exposure being money market instruments, including treasury bills.
Asset Type % TNA
Cash 1.01%
Receivable/Payable 0.26%
Equity 0.00%
Fixed Income 98.73%
Sovereign 74.24%
Corporate 24.49%
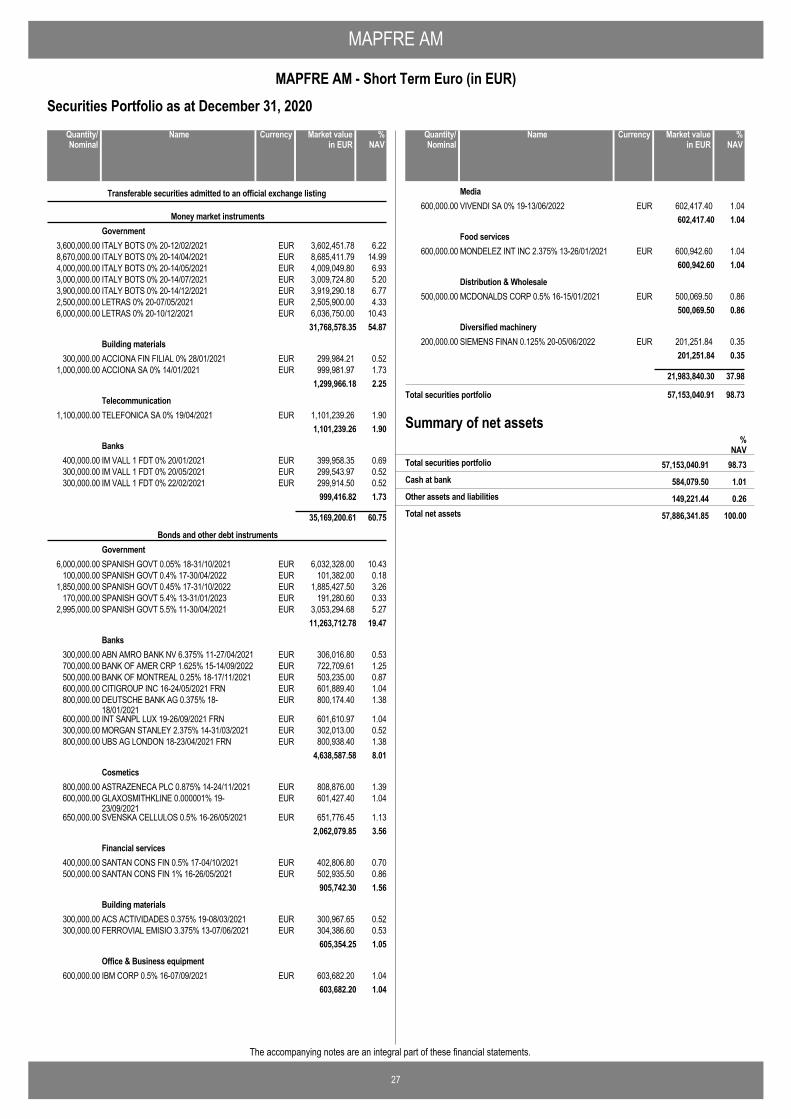
Total 100.00% Fixed Income Main Holdings as at 31/12/2020
ISIN code Asset desc. % TNA
IT0005406720 ITALY BOTS 0% 20-14/04/2021 14.99% ES0L02112107 LETRAS 0% 20-10/12/2021 10.43% ES0000012C46 SPANISH GOVT 0.05% 18-31/10/2021 10.43% IT0005410920 ITALY BOTS 0% 20-14/05/2021 6.93% IT0005429342 ITALY BOTS 0% 20-14/12/2021 6.77% IT0005399560 ITALY BOTS 0% 20-12/02/2021 6.22% ES00000123B9 SPANISH GOVT 5.5% 11-30/04/2021 5.27% IT0005415945 ITALY BOTS 0% 20-14/07/2021 5.20% ES0L02105077 LETRAS 0% 20-07/05/2021 4.33% ES0000012A97 SPANISH GOVT 0.45% 17-31/10/2022 3.26%
MAPFRE AM Directors’ Report (continued)
8
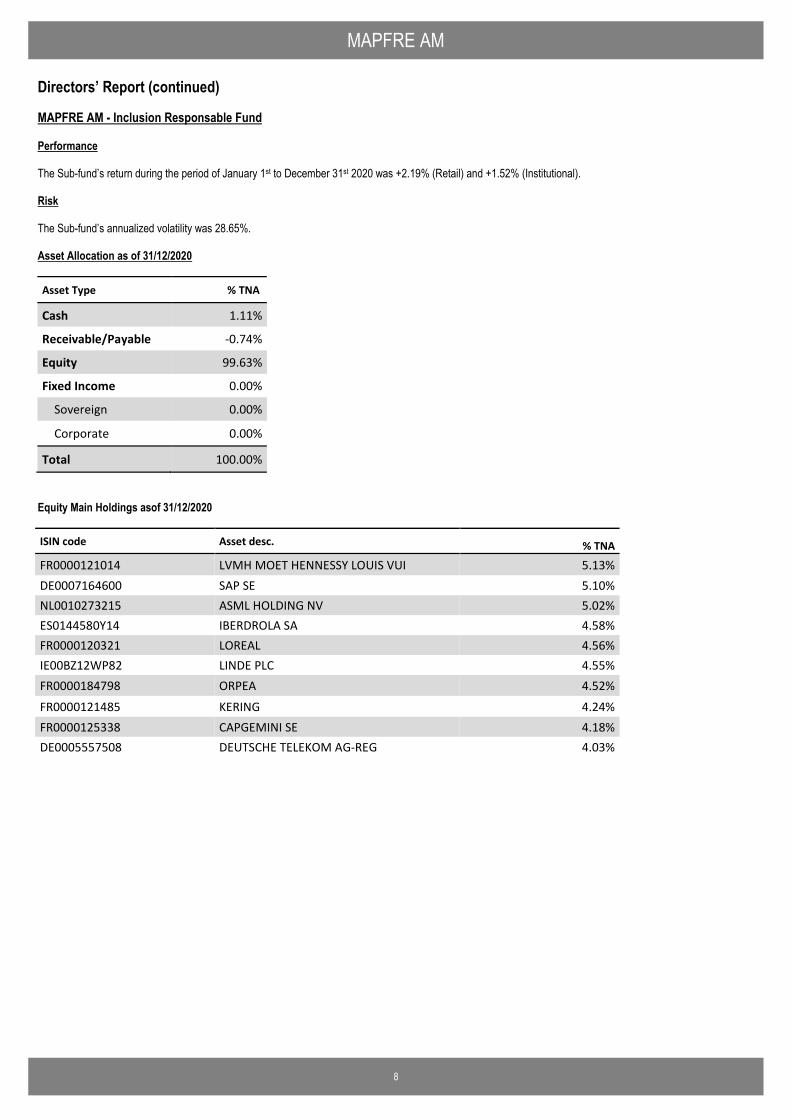
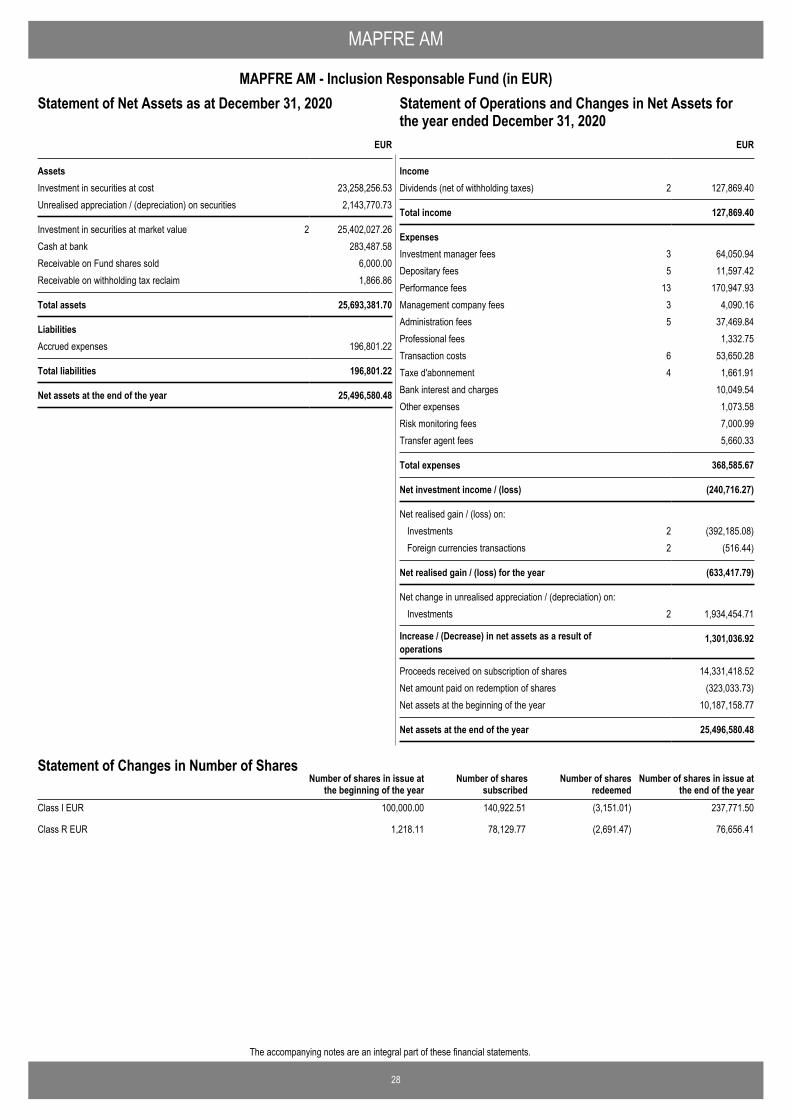
MAPFRE AM - Inclusion Responsable Fund Performance The Sub-fund’s return during the period of January 1st to December 31st 2020 was +2.19% (Retail) and +1.52% (Institutional). Risk The Sub-fund’s annualized volatility was 28.65%. Asset Allocation as of 31/12/2020
Asset Type % TNA
Cash 1.11%
Receivable/Payable -0.74%
Equity 99.63%
Fixed Income 0.00%
Sovereign 0.00%
Corporate 0.00%
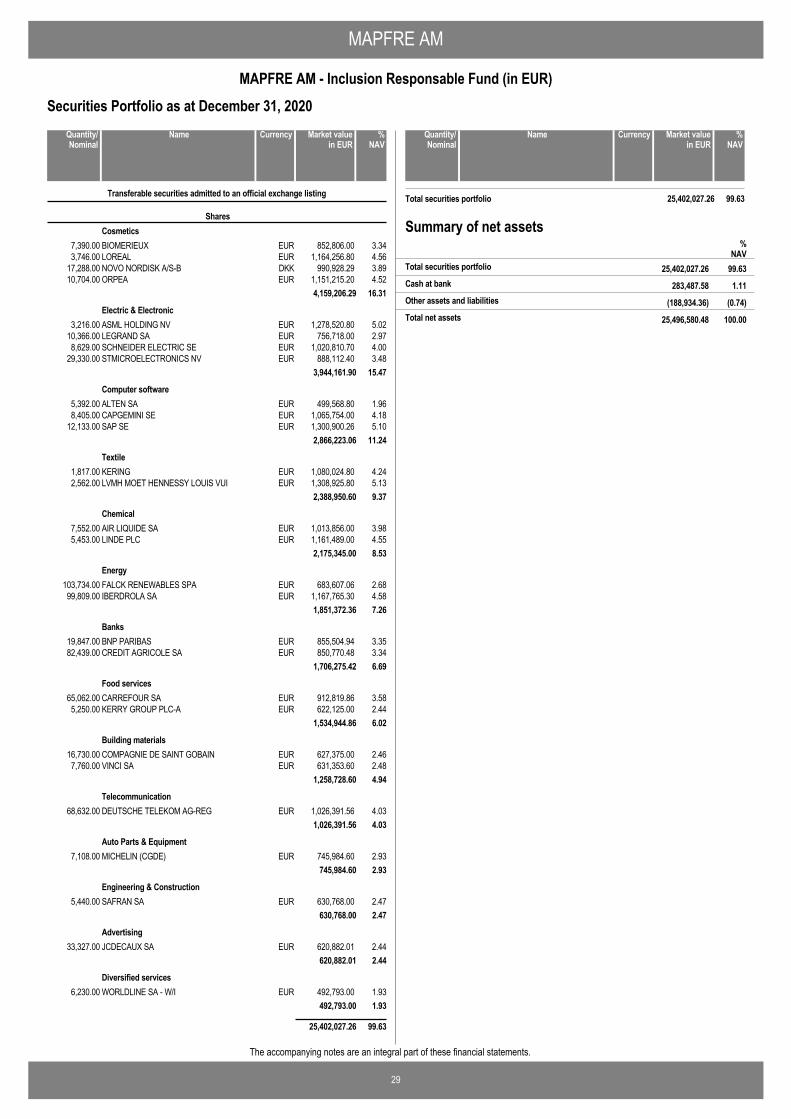
Total 100.00% Equity Main Holdings asof 31/12/2020 ISIN code Asset desc. % TNA
FR0000121014 LVMH MOET HENNESSY LOUIS VUI 5.13% DE0007164600 SAP SE 5.10% NL0010273215 ASML HOLDING NV 5.02% ES0144580Y14 IBERDROLA SA 4.58% FR0000120321 LOREAL 4.56% IE00BZ12WP82 LINDE PLC 4.55% FR0000184798 ORPEA 4.52%
FR0000121485 KERING 4.24% FR0000125338 CAPGEMINI SE 4.18% DE0005557508 DEUTSCHE TELEKOM AG-REG 4.03%
MAPFRE AM Directors’ Report (continued)
9
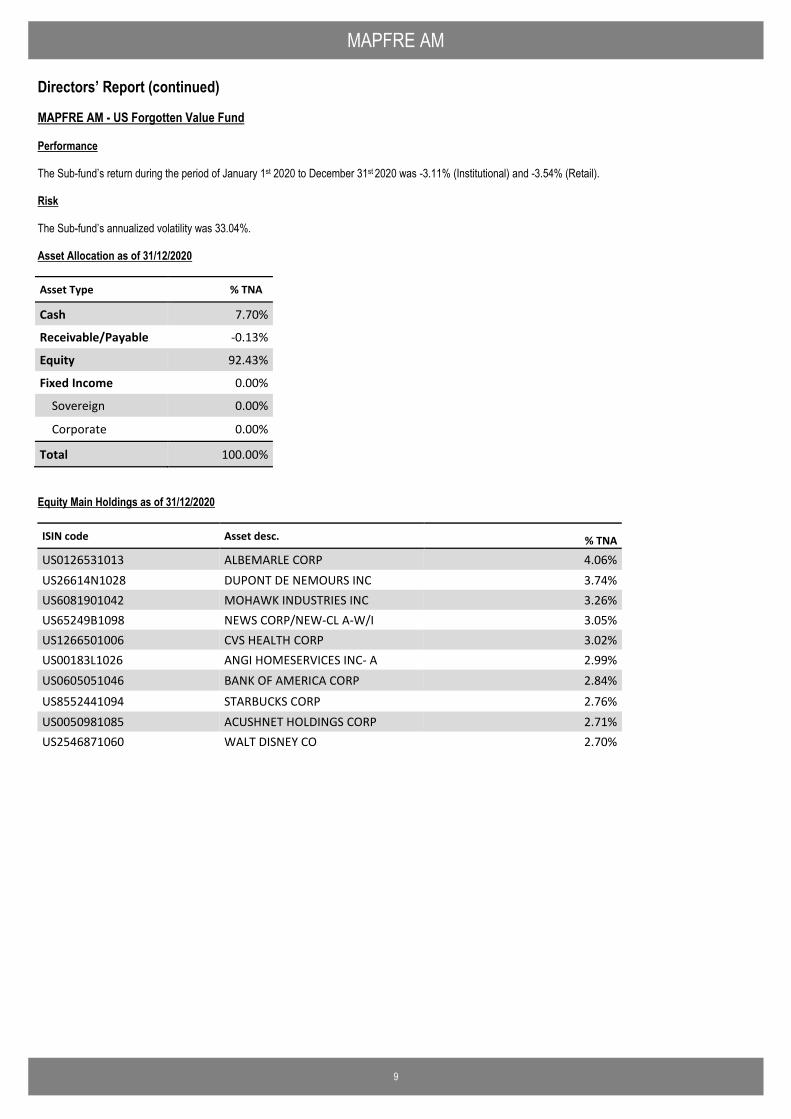
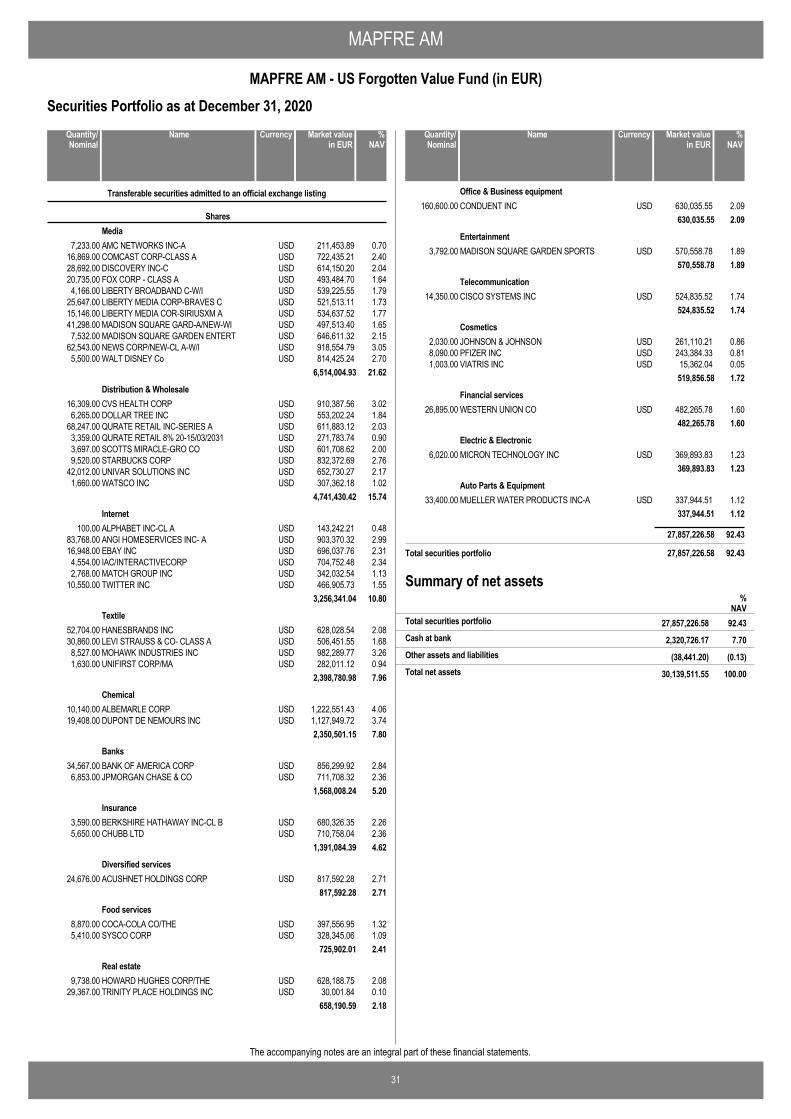
MAPFRE AM - US Forgotten Value Fund Performance The Sub-fund’s return during the period of January 1st 2020 to December 31st 2020 was -3.11% (Institutional) and -3.54% (Retail). Risk The Sub-fund’s annualized volatility was 33.04%. Asset Allocation as of 31/12/2020
Asset Type % TNA
Cash 7.70%
Receivable/Payable -0.13%
Equity 92.43%
Fixed Income 0.00%
Sovereign 0.00%
Corporate 0.00%
Total 100.00%
Equity Main Holdings as of 31/12/2020
ISIN code Asset desc. % TNA
US0126531013 ALBEMARLE CORP 4.06% US26614N1028 DUPONT DE NEMOURS INC 3.74% US6081901042 MOHAWK INDUSTRIES INC 3.26% US65249B1098 NEWS CORP/NEW-CL A-W/I 3.05% US1266501006 CVS HEALTH CORP 3.02% US00183L1026 ANGI HOMESERVICES INC- A 2.99% US0605051046 BANK OF AMERICA CORP 2.84% US8552441094 STARBUCKS CORP 2.76% US0050981085 ACUSHNET HOLDINGS CORP 2.71% US2546871060 WALT DISNEY CO 2.70%
MAPFRE AM Directors’ Report (continued)
10
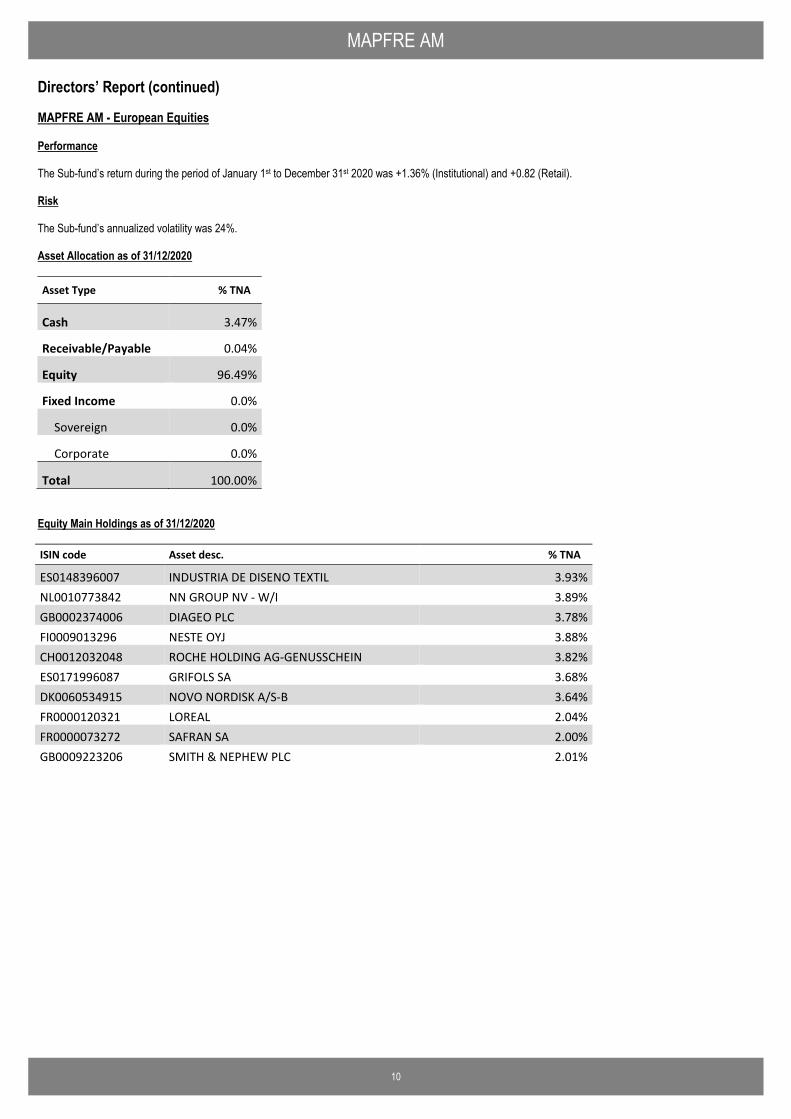
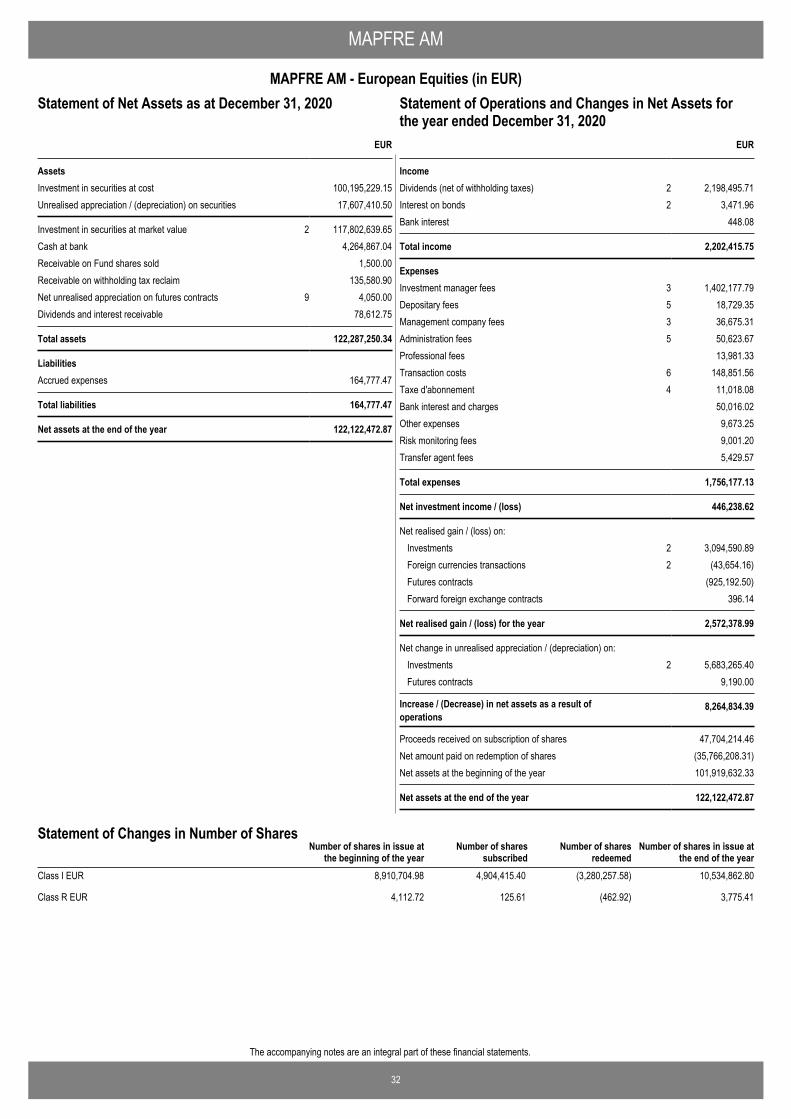
MAPFRE AM - European Equities Performance The Sub-fund’s return during the period of January 1st to December 31st 2020 was +1.36% (Institutional) and +0.82 (Retail). Risk The Sub-fund’s annualized volatility was 24%. Asset Allocation as of 31/12/2020
Asset Type % TNA
Cash 3.47%
Receivable/Payable 0.04%
Equity 96.49%
Fixed Income 0.0%
Sovereign 0.0%
Corporate 0.0%
Total 100.00% Equity Main Holdings as of 31/12/2020
ISIN code Asset desc. % TNA
ES0148396007 INDUSTRIA DE DISENO TEXTIL 3.93% NL0010773842 NN GROUP NV - W/I 3.89% GB0002374006 DIAGEO PLC 3.78% FI0009013296 NESTE OYJ 3.88% CH0012032048 ROCHE HOLDING AG-GENUSSCHEIN 3.82% ES0171996087 GRIFOLS SA 3.68% DK0060534915 NOVO NORDISK A/S-B 3.64% FR0000120321 LOREAL 2.04% FR0000073272 SAFRAN SA 2.00% GB0009223206 SMITH & NEPHEW PLC 2.01%
MAPFRE AM Directors’ Report (continued)
11
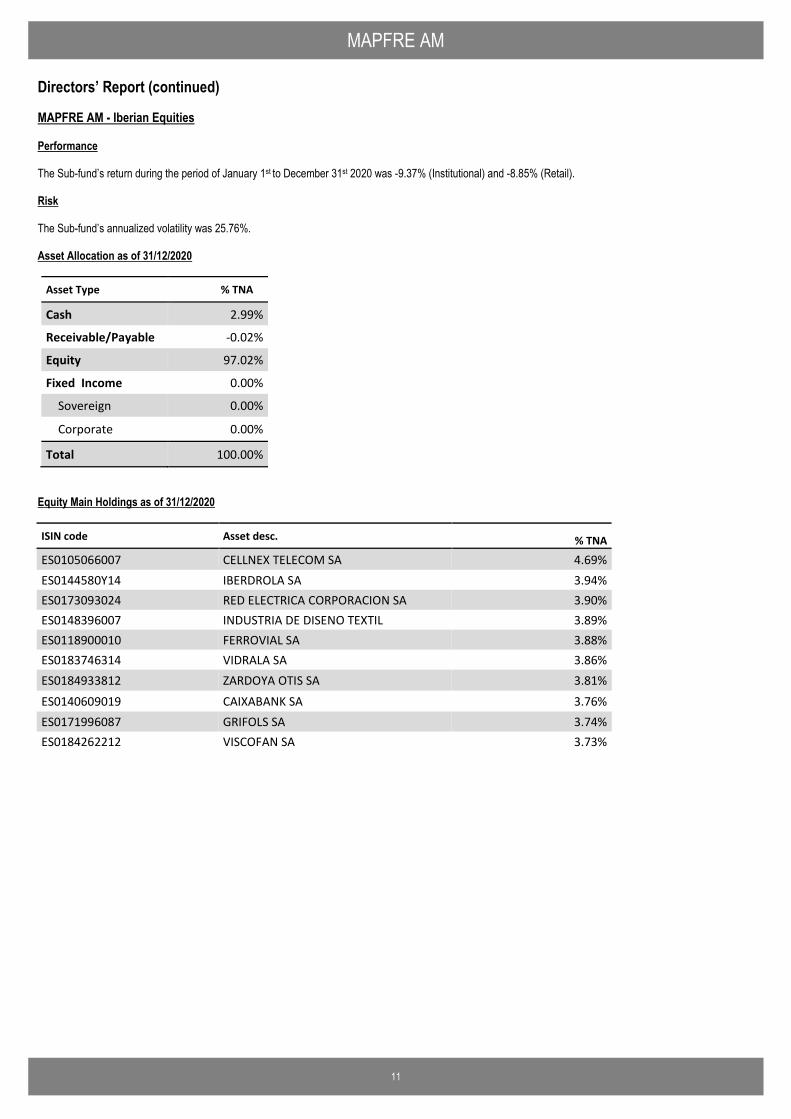
MAPFRE AM - Iberian Equities Performance The Sub-fund’s return during the period of January 1st to December 31st 2020 was -9.37% (Institutional) and -8.85% (Retail). Risk The Sub-fund’s annualized volatility was 25.76%. Asset Allocation as of 31/12/2020
Asset Type % TNA
Cash 2.99%
Receivable/Payable -0.02%
Equity 97.02%
Fixed Income 0.00%
Sovereign 0.00%
Corporate 0.00%
Total 100.00% Equity Main Holdings as of 31/12/2020
ISIN code Asset desc. % TNA
ES0105066007 CELLNEX TELECOM SA 4.69% ES0144580Y14 IBERDROLA SA 3.94% ES0173093024 RED ELECTRICA CORPORACION SA 3.90% ES0148396007 INDUSTRIA DE DISENO TEXTIL 3.89% ES0118900010 FERROVIAL SA 3.88% ES0183746314 VIDRALA SA 3.86% ES0184933812 ZARDOYA OTIS SA 3.81% ES0140609019 CAIXABANK SA 3.76% ES0171996087 GRIFOLS SA 3.74% ES0184262212 VISCOFAN SA 3.73%
MAPFRE AM Directors’ Report (continued)
12
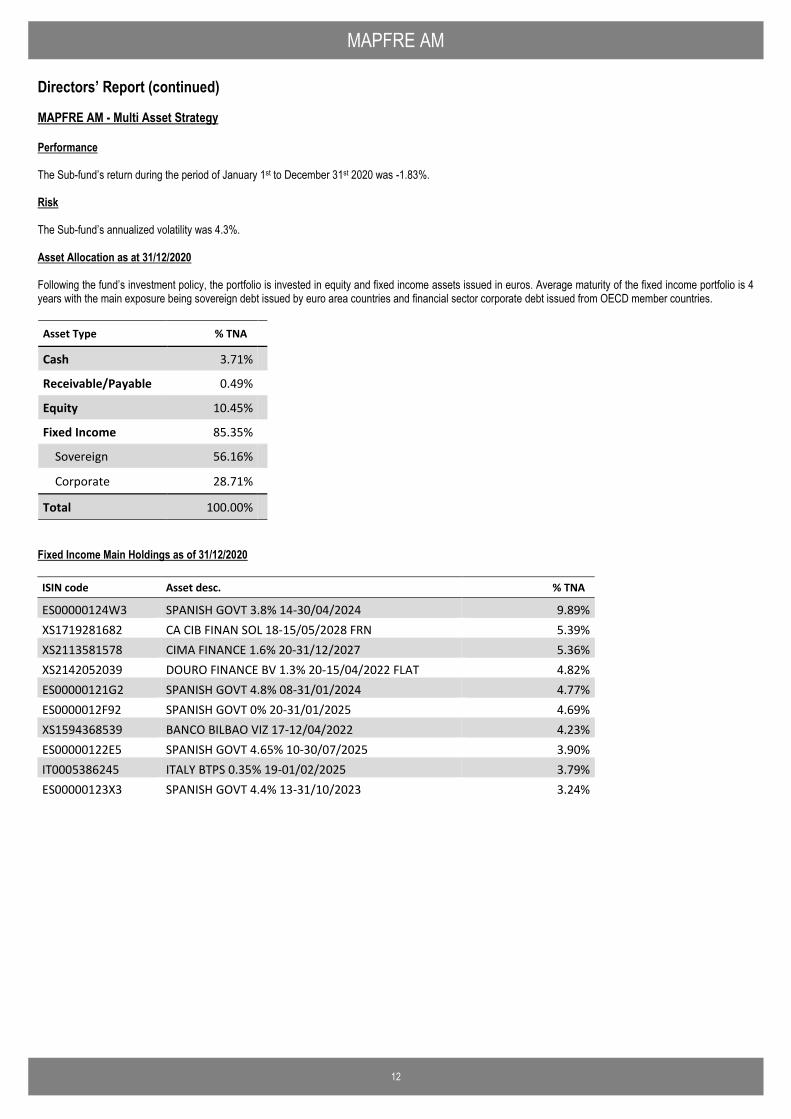
MAPFRE AM - Multi Asset Strategy Performance The Sub-fund’s return during the period of January 1st to December 31st 2020 was -1.83%. Risk The Sub-fund’s annualized volatility was 4.3%. Asset Allocation as at 31/12/2020
Following the fund’s investment policy, the portfolio is invested in equity and fixed income assets issued in euros. Average maturity of the fixed income portfolio is 4 years with the main exposure being sovereign debt issued by euro area countries and financial sector corporate debt issued from OECD member countries. Asset Type % TNA
Cash 3.71%
Receivable/Payable 0.49%
Equity 10.45%
Fixed Income 85.35%
Sovereign 56.16%
Corporate 28.71%
Total 100.00% Fixed Income Main Holdings as of 31/12/2020 ISIN code Asset desc. % TNA
ES00000124W3 SPANISH GOVT 3.8% 14-30/04/2024 9.89% XS1719281682 CA CIB FINAN SOL 18-15/05/2028 FRN 5.39% XS2113581578 CIMA FINANCE 1.6% 20-31/12/2027 5.36% XS2142052039 DOURO FINANCE BV 1.3% 20-15/04/2022 FLAT 4.82% ES00000121G2 SPANISH GOVT 4.8% 08-31/01/2024 4.77% ES0000012F92 SPANISH GOVT 0% 20-31/01/2025 4.69% XS1594368539 BANCO BILBAO VIZ 17-12/04/2022 4.23% ES00000122E5 SPANISH GOVT 4.65% 10-30/07/2025 3.90% IT0005386245 ITALY BTPS 0.35% 19-01/02/2025 3.79% ES00000123X3 SPANISH GOVT 4.4% 13-31/10/2023 3.24%
MAPFRE AM Directors’ Report (continued)
13
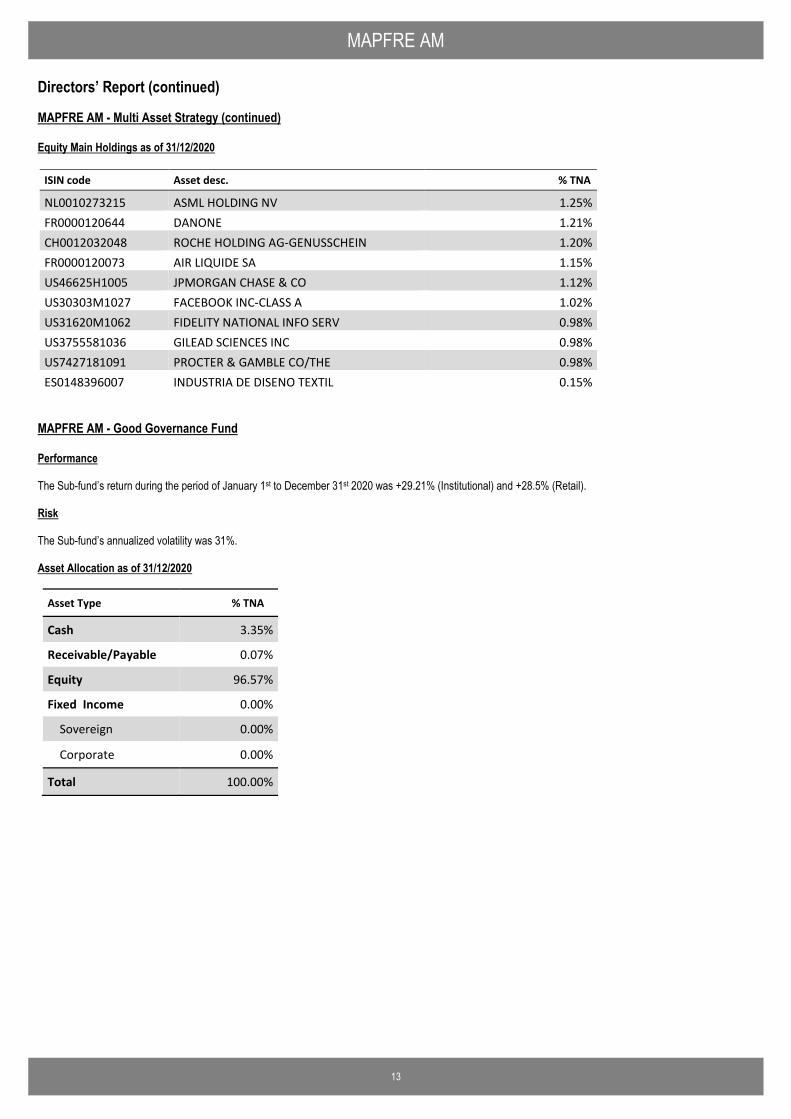
MAPFRE AM - Multi Asset Strategy (continued) Equity Main Holdings as of 31/12/2020
ISIN code Asset desc. % TNA
NL0010273215 ASML HOLDING NV 1.25% FR0000120644 DANONE 1.21% CH0012032048 ROCHE HOLDING AG-GENUSSCHEIN 1.20% FR0000120073 AIR LIQUIDE SA 1.15% US46625H1005 JPMORGAN CHASE & CO 1.12% US30303M1027 FACEBOOK INC-CLASS A 1.02% US31620M1062 FIDELITY NATIONAL INFO SERV 0.98% US3755581036 GILEAD SCIENCES INC 0.98% US7427181091 PROCTER & GAMBLE CO/THE 0.98% ES0148396007 INDUSTRIA DE DISENO TEXTIL 0.15%
MAPFRE AM - Good Governance Fund Performance The Sub-fund’s return during the period of January 1st to December 31st 2020 was +29.21% (Institutional) and +28.5% (Retail). Risk The Sub-fund’s annualized volatility was 31%. Asset Allocation as of 31/12/2020
Asset Type % TNA
Cash 3.35%
Receivable/Payable 0.07%
Equity 96.57%
Fixed Income 0.00%
Sovereign 0.00%
Corporate 0.00%
Total 100.00%
MAPFRE AM Directors’ Report (continued)
14
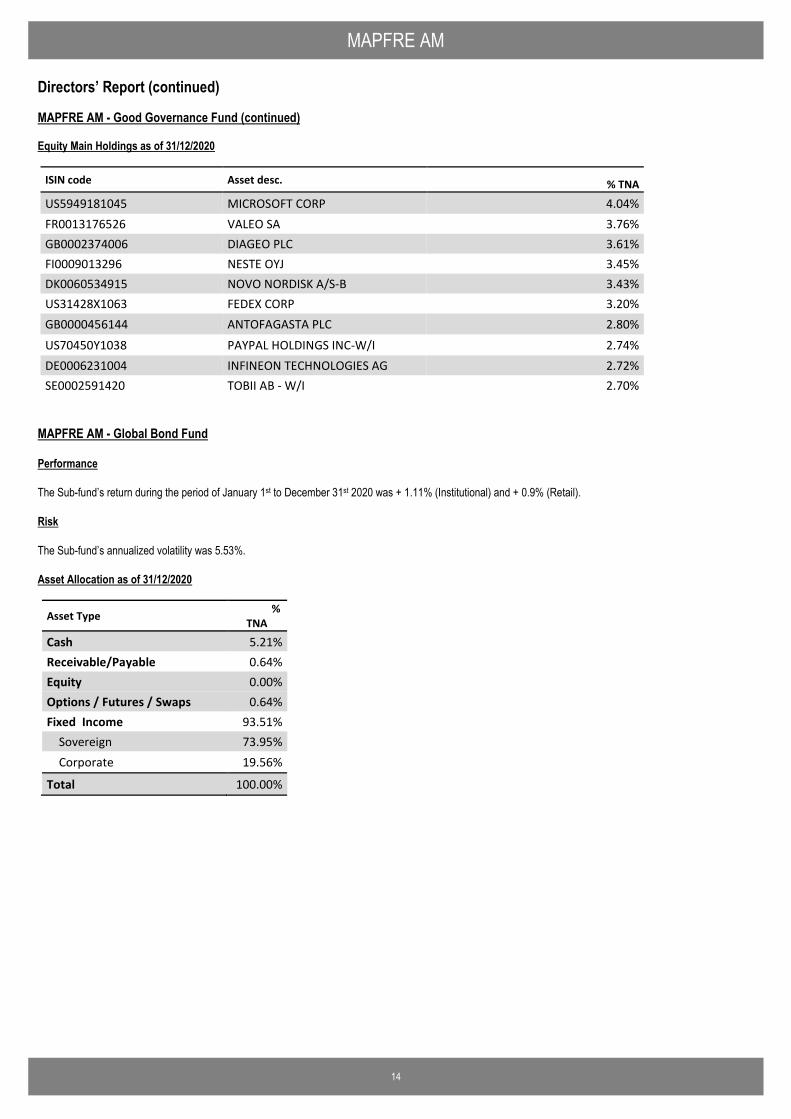
MAPFRE AM - Good Governance Fund (continued) Equity Main Holdings as of 31/12/2020
ISIN code Asset desc. % TNA
US5949181045 MICROSOFT CORP 4.04% FR0013176526 VALEO SA 3.76% GB0002374006 DIAGEO PLC 3.61% FI0009013296 NESTE OYJ 3.45% DK0060534915 NOVO NORDISK A/S-B 3.43% US31428X1063 FEDEX CORP 3.20% GB0000456144 ANTOFAGASTA PLC 2.80% US70450Y1038 PAYPAL HOLDINGS INC-W/I 2.74% DE0006231004 INFINEON TECHNOLOGIES AG 2.72% SE0002591420 TOBII AB - W/I 2.70%
MAPFRE AM - Global Bond Fund Performance The Sub-fund’s return during the period of January 1st to December 31st 2020 was + 1.11% (Institutional) and + 0.9% (Retail). Risk The Sub-fund’s annualized volatility was 5.53%. Asset Allocation as of 31/12/2020
Asset Type % TNA
Cash 5.21% Receivable/Payable 0.64% Equity 0.00% Options / Futures / Swaps 0.64% Fixed Income 93.51% Sovereign 73.95% Corporate 19.56%
Total 100.00%
MAPFRE AM Directors’ Report (continued)
15
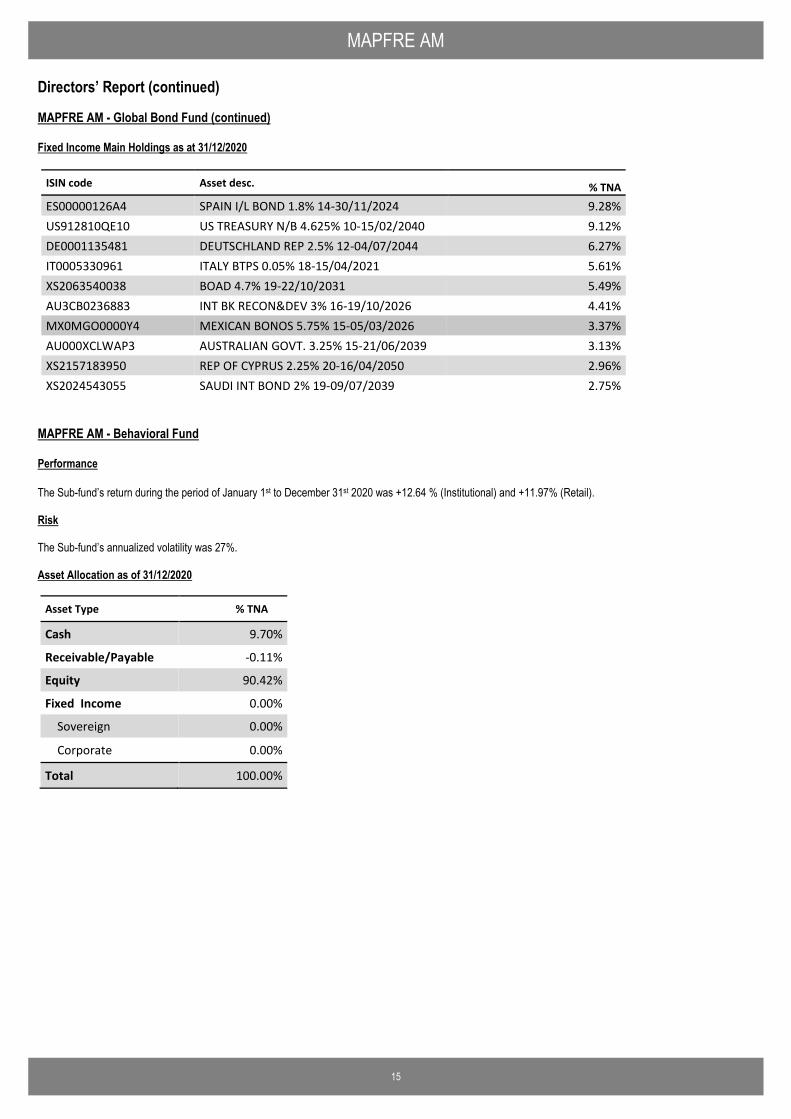
MAPFRE AM - Global Bond Fund (continued) Fixed Income Main Holdings as at 31/12/2020
ISIN code Asset desc. % TNA
ES00000126A4 SPAIN I/L BOND 1.8% 14-30/11/2024 9.28% US912810QE10 US TREASURY N/B 4.625% 10-15/02/2040 9.12% DE0001135481 DEUTSCHLAND REP 2.5% 12-04/07/2044 6.27% IT0005330961 ITALY BTPS 0.05% 18-15/04/2021 5.61% XS2063540038 BOAD 4.7% 19-22/10/2031 5.49% AU3CB0236883 INT BK RECON&DEV 3% 16-19/10/2026 4.41% MX0MGO0000Y4 MEXICAN BONOS 5.75% 15-05/03/2026 3.37% AU000XCLWAP3 AUSTRALIAN GOVT. 3.25% 15-21/06/2039 3.13% XS2157183950 REP OF CYPRUS 2.25% 20-16/04/2050 2.96% XS2024543055 SAUDI INT BOND 2% 19-09/07/2039 2.75%
MAPFRE AM - Behavioral Fund Performance The Sub-fund’s return during the period of January 1st to December 31st 2020 was +12.64 % (Institutional) and +11.97% (Retail). Risk The Sub-fund’s annualized volatility was 27%. Asset Allocation as of 31/12/2020
Asset Type % TNA
Cash 9.70%
Receivable/Payable -0.11%
Equity 90.42%
Fixed Income 0.00%
Sovereign 0.00%
Corporate 0.00%
Total 100.00%
MAPFRE AM Directors’ Report (continued)
16
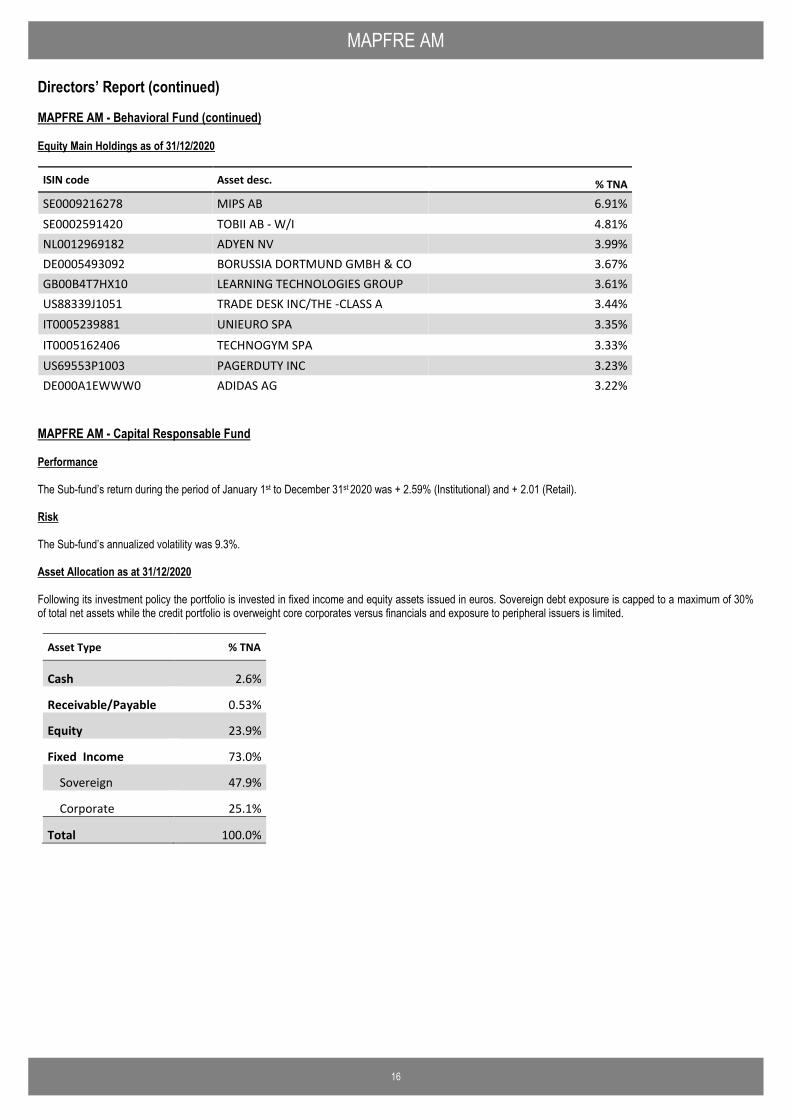
MAPFRE AM - Behavioral Fund (continued) Equity Main Holdings as of 31/12/2020
ISIN code Asset desc. % TNA
SE0009216278 MIPS AB 6.91% SE0002591420 TOBII AB - W/I 4.81% NL0012969182 ADYEN NV 3.99% DE0005493092 BORUSSIA DORTMUND GMBH & CO 3.67% GB00B4T7HX10 LEARNING TECHNOLOGIES GROUP 3.61% US88339J1051 TRADE DESK INC/THE -CLASS A 3.44% IT0005239881 UNIEURO SPA 3.35% IT0005162406 TECHNOGYM SPA 3.33% US69553P1003 PAGERDUTY INC 3.23% DE000A1EWWW0 ADIDAS AG 3.22%
MAPFRE AM - Capital Responsable Fund Performance The Sub-fund’s return during the period of January 1st to December 31st 2020 was + 2.59% (Institutional) and + 2.01 (Retail). Risk The Sub-fund’s annualized volatility was 9.3%. Asset Allocation as at 31/12/2020 Following its investment policy the portfolio is invested in fixed income and equity assets issued in euros. Sovereign debt exposure is capped to a maximum of 30% of total net assets while the credit portfolio is overweight core corporates versus financials and exposure to peripheral issuers is limited.
Asset Type % TNA
Cash 2.6%
Receivable/Payable 0.53%
Equity 23.9%
Fixed Income 73.0%
Sovereign 47.9%
Corporate 25.1%
Total 100.0%
MAPFRE AM Directors’ Report (continued)
17
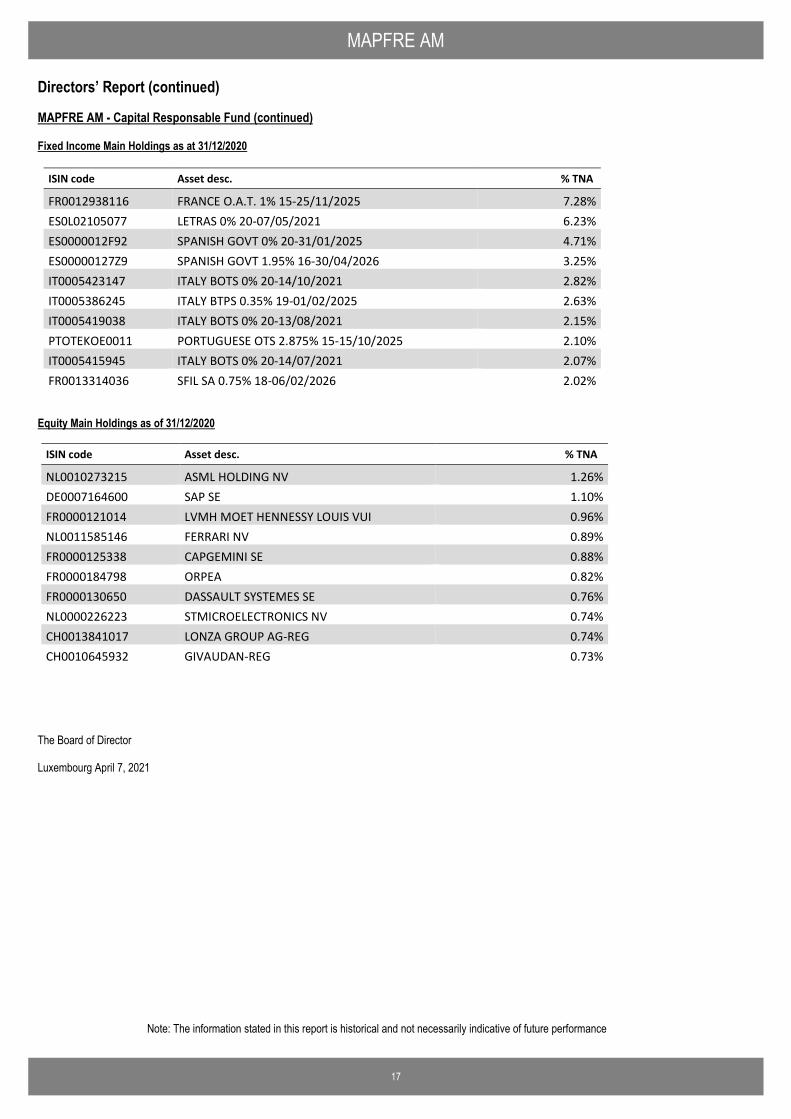
MAPFRE AM - Capital Responsable Fund (continued) Fixed Income Main Holdings as at 31/12/2020
ISIN code Asset desc. % TNA
FR0012938116 FRANCE O.A.T. 1% 15-25/11/2025 7.28% ES0L02105077 LETRAS 0% 20-07/05/2021 6.23% ES0000012F92 SPANISH GOVT 0% 20-31/01/2025 4.71% ES00000127Z9 SPANISH GOVT 1.95% 16-30/04/2026 3.25% IT0005423147 ITALY BOTS 0% 20-14/10/2021 2.82% IT0005386245 ITALY BTPS 0.35% 19-01/02/2025 2.63% IT0005419038 ITALY BOTS 0% 20-13/08/2021 2.15% PTOTEKOE0011 PORTUGUESE OTS 2.875% 15-15/10/2025 2.10% IT0005415945 ITALY BOTS 0% 20-14/07/2021 2.07% FR0013314036 SFIL SA 0.75% 18-06/02/2026 2.02%
Equity Main Holdings as of 31/12/2020
ISIN code Asset desc. % TNA
NL0010273215 ASML HOLDING NV 1.26% DE0007164600 SAP SE 1.10% FR0000121014 LVMH MOET HENNESSY LOUIS VUI 0.96% NL0011585146 FERRARI NV 0.89% FR0000125338 CAPGEMINI SE 0.88% FR0000184798 ORPEA 0.82% FR0000130650 DASSAULT SYSTEMES SE 0.76% NL0000226223 STMICROELECTRONICS NV 0.74% CH0013841017 LONZA GROUP AG-REG 0.74% CH0010645932 GIVAUDAN-REG 0.73%
The Board of Director Luxembourg April 7, 2021
Note: The information stated in this report is historical and not necessarily indicative of future performance
KPMG Luxembourg, Société coopérative 39, Avenue John F. Kennedy L-1855 Luxembourg
Tel.: +352 22 51 51 1 Fax: +352 22 51 71 E-mail: [email protected] Internet: www.kpmg.lu
© 2021 KPMG Luxembourg, Société coopérative, a Luxembourg entity and a member firm of the KPMG global organization of independent member firms affiliated with KPMG International Limited, a private English company limited by guarantee. All rights reserved.
T.V.A. LU 27351518 R.C.S. Luxembourg B 149133
To the Shareholders of MAPFRE AM 60, avenue J. F. Kennedy L1855 Luxembourg Grand Duchy of Luxembourg
REPORT OF THE REVISEUR D’ENTREPRISES AGREE
Report on the audit of the financial statements
Opinion
We have audited the financial statements of MAPFRE AM and each of its sub-funds (“the Fund”), which comprise the statement of net assets and the securities portfolio and financial derivative instruments as at 31 December 2020 and the statement of operations and changes in net assets for the year then ended and notes to the financial statements, including a summary of significant accounting policies.
In our opinion, the accompanying financial statements give a true and fair view of the financial position of MAPFRE AM and each of its sub-funds as at 31 December 2020, and of the results of their operations and changes in their net assets for the year then ended in accordance with Luxembourg legal and regulatory requirements relating to the preparation and presentation of the financial statements.
Basis for opinion
We conducted our audit in accordance with the Law of 23 July 2016 on the audit profession (“Law of 23 July 2016”) and with International Standards on Auditing (“ISAs”) as adopted for Luxembourg by the Commission de Surveillance du Secteur Financier (“CSSF”). Our responsibilities under the Law of 23 July 2016 and ISAs as adopted for Luxembourg by the CSSF are further described in the « Responsibilities of “réviseur d’entreprises agréé” for the Audit of the Financial Statements » section of our report. We are also independent of the Fund in accordance with the International Code of Ethics for Professional Accountants, including International Independence Standards, issued by the International Ethics Standards Board for Accountants (“IESBA Code”) as adopted for Luxembourg by the CSSF together with the ethical requirements that are relevant to our audit of the financial statements, and have fulfilled our other ethical responsibilities under those ethical requirements. We believe that the audit evidence we have obtained is sufficient and appropriate to provide a basis for our opinion.
Other information
The Board of Directors of the Fund is responsible for the other information. The other information comprises the information stated in the annual report but does not include the financial statements and our report of the “réviseur d’entreprises agréé” thereon.
Our opinion on the financial statements does not cover the other information and we do not express any form of assurance conclusion thereon.
In connection with our audit of the financial statements, our responsibility is to read the other information and, in doing so, consider whether the other information is materially inconsistent with the financial statements or our knowledge obtained in the audit or otherwise appears to be materially misstated. If, based on the work we have performed, we conclude that there is a material misstatement of this other information, we are required to report this fact. We have nothing to report in this regard.
Responsibilities of the Board of Directors of the Fund for the financial statements
The Board of Directors of the Fund is responsible for the preparation and fair presentation of these financial statements in accordance with Luxembourg legal and regulatory requirements relating to the preparation and presentation of the financial statements, and for such internal control as the Board of Directors of the Fund determines is necessary to enable the preparation of financial statements that are free from material misstatement, whether due to fraud or error.
In preparing the financial statements, the Board of Directors of the Fund is responsible for assessing the Fund’s and each of its sub-funds’ ability to continue as a going concern, disclosing, as applicable, matters related to going concern and using the going concern basis of accounting unless the Board of Directors of the Fund either intends to liquidate the Fund or any of its sub-funds or to cease operations, or has no realistic alternative but to do so.
Responsibilities of the “réviseur d’entreprises agréé” for the audit of the financial statements
The objectives of our audit are to obtain reasonable assurance about whether the financial statements as a whole are free from material misstatement, whether due to fraud or error, and to issue a report of the “réviseur d’entreprises agréé” that includes our opinion. Reasonable assurance is a high level of assurance, but is not a guarantee that an audit conducted in accordance with the Law of 23 July 2016 and with ISAs as adopted for Luxembourg by the CSSF will always detect a material misstatement when it exists. Misstatements can arise from fraud or error and are considered material if, individually or in the aggregate, they could reasonably be expected to influence the economic decisions of users taken on the basis of these financial statements.
As part of an audit in accordance with the Law of 23 July 2016 and with ISAs as adopted for Luxembourg by the CSSF, we exercise professional judgment and maintain professional skepticism throughout the audit. We also:
— Identify and assess the risks of material misstatement of the financial statements, whether due to fraud or error, design and perform audit procedures responsive to those risks, and obtain audit evidence that is sufficient and appropriate to provide a basis for our opinion. The risk of not detecting a material misstatement resulting from fraud is higher than for one resulting from error, as fraud may involve collusion, forgery, intentional omissions, misrepresentations, or the override of internal control.
— Obtain an understanding of internal control relevant to the audit in order to design audit procedures that are appropriate in the circumstances, but not for the purpose of expressing an opinion on the effectiveness of the Fund’s internal control.
— Evaluate the appropriateness of accounting policies used and the reasonableness of accounting estimates and related disclosures made by the Board of Directors of the Fund
— Conclude on the appropriateness of the Board of Directors of the Fund’s use of the going concern basis of accounting and, based on the audit evidence obtained, whether a material uncertainty exists related to events or conditions that may cast significant doubt on the Fund’s or any of its sub-funds’ ability to continue as a going concern. If we conclude that a material uncertainty exists, we are required to draw attention in our report of the “réviseur d’entreprises agréé” to the related disclosures in the financial statements or, if such disclosures are inadequate, to modify our opinion. Our conclusions are based on the audit evidence obtained up to the date of our report of the “réviseur d’entreprises agréé”. However, future events or conditions may cause the Fund or any of its sub-funds to cease to continue as a going concern.
— Evaluate the overall presentation, structure and content of the financial statements, including the disclosures, and whether the financial statements represent the underlying transactions and events in a manner that achieves fair presentation.
We communicate with those charged with governance regarding, among other matters, the planned scope and timing of the audit and significant audit findings, including any significant deficiencies in internal control that we identify during our audit.
Luxembourg, 22 April 2021 KPMG Luxembourg Société coopérative Cabinet de révision agréé Rushvin Appadoo Partner
MAPFRE AM
20
The accompanying notes are an integral part of these financial statements.
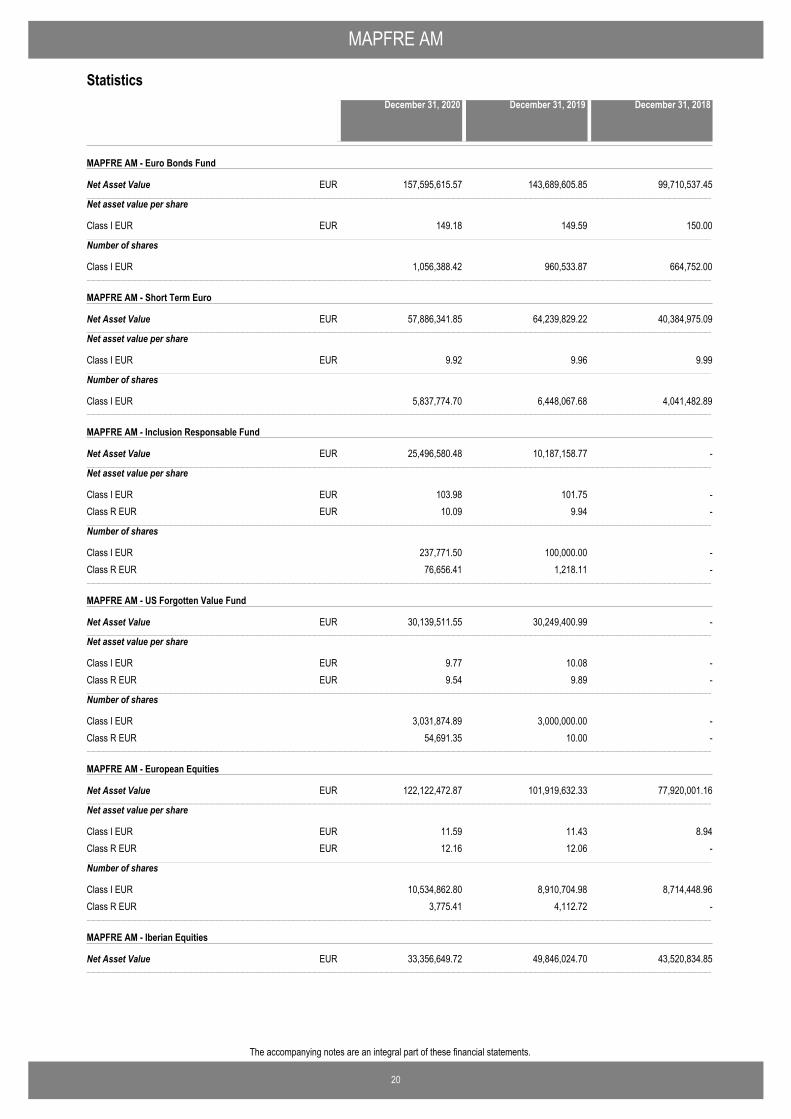
Statistics
MAPFRE AM - Euro Bonds Fund
Net Asset Value−−−−−−−−−−−−−−−−−−−−−−−−−−−−−−−−−−−−−−−−−−−−−−−−−−−−−−−−−−−−−−−−−−−−−−−−−−−−−−−−−−−−−−−−−−−−−−−−−−−−−−−−−−−−−−−−−−−−−−−−−−−−−−−−−−−−−−−−−−−−−−−−−−−−−−−−−−−−−−−−−−−−−−−−−−−−−−−−−−−−−−−−−−−−−−−−−−−−−−−−−−−−−−−−−−−−−−−−−−−−−−−−−−−−−−−−−−−−−−−−−−−−−−−−−−−−−−−−−−−−−−−−−−−−−−−−−−−−−−−−−−−−−−−−−−−−−−−−−−−−−−−−−−−−−−−−−−−−−−−−−−−−−−−−−−−−−−−−−−−−−−−−−−−−−−−−−−−−−−−−−−−−−−−−−−−−−−−−−−−−−−−−−−−−−−−−−−−−−−−−−−−−−−−−−−−−−−−−−−−−−−−−−−−−−−−−−−−−−−−−−−−−−−−−−−−−−−−−−−−−−−−−−−−−−−−−−−−−−−−−−−−−−−−−−−−−−−−−−−−−−−−
157,595,615.57 143,689,605.85 99,710,537.45EUR
Net asset value per share
Class I EUR 149.18 149.59 150.00EUR−−−−−−−−−−−−−−−−−−−−−−−−−−−−−−−−−−−−−−−−−−−−−−−−−−−−−−−−−−−−−−−−−−−−−−−−−−−−−−−−−−−−−−−−−−−−−−−−−−−−−−−−−−−−−−−−−−−−−−−−−−−−−−−−−−−−−−−−−−−−−−−−−−−−−−−−−−−−−−−−−−−−−−−−−−−−−−−−−−−−−−−−−−−−−−−−−−−−−−−−−−−−−−−−−−−−−−−−−−−−−−−−−−−−−−−−−−−−−−−−−−−−−−−−−−−−−−−−−−−−−−−−−−−−−−−−−−−−−−−−−−−−−−−−−−−−−−−−−−−−−−−−−−−−−−−−−−−−−−−−−−−−−−−−−−−−−−−−−−−−−−−−−−−−−−−−−−−−−−−−−−−−−−−−−−−−−−−−−−−−−−−−−−−−−−−−−−−−−−−−−−−−−−−−−−−−−−−−−−−−−−−−−−−−−−−−−−−−−−−−−−−−−−−−−−−−−−−−−−−−−−−−−−−−−−−−−−−−−−−−−−−−−−−−−−−−−−−−−−−−−−−
Number of shares
Class I EUR 1,056,388.42 960,533.87 664,752.00−−−−−−−−−−−−−−−−−−−−−−−−−−−−−−−−−−−−−−−−−−−−−−−−−−−−−−−−−−−−−−−−−−−−−−−−−−−−−−−−−−−−−−−−−−−−−−−−−−−−−−−−−−−−−−−−−−−−−−−−−−−−−−−−−−−−−−−−−−−−−−−−−−−−−−−−−−−−−−−−−−−−−−−−−−−−−−−−−−−−−−−−−−−−−−−−−−−−−−−−−−−−−−−−−−−−−−−−−−−−−−−−−−−−−−−−−−−−−−−−−−−−−−−−−−−−−−−−−−−−−−−−−−−−−−−−−−−−−−−−−−−−−−−−−−−−−−−−−−−−−−−−−−−−−−−−−−−−−−−−−−−−−−−−−−−−−−−−−−−−−−−−−−−−−−−−−−−−−−−−−−−−−−−−−−−−−−−−−−−−−−−−−−−−−−−−−−−−−−−−−−−−−−−−−−−−−−−−−−−−−−−−−−−−−−−−−−−−−−−−−−−−−−−−−−−−−−−−−−−−−−−−−−−−−−−−−−−−−−−−−−−−−−−−−−−−−−−−−−−−−−−
MAPFRE AM - Short Term Euro
Net Asset Value−−−−−−−−−−−−−−−−−−−−−−−−−−−−−−−−−−−−−−−−−−−−−−−−−−−−−−−−−−−−−−−−−−−−−−−−−−−−−−−−−−−−−−−−−−−−−−−−−−−−−−−−−−−−−−−−−−−−−−−−−−−−−−−−−−−−−−−−−−−−−−−−−−−−−−−−−−−−−−−−−−−−−−−−−−−−−−−−−−−−−−−−−−−−−−−−−−−−−−−−−−−−−−−−−−−−−−−−−−−−−−−−−−−−−−−−−−−−−−−−−−−−−−−−−−−−−−−−−−−−−−−−−−−−−−−−−−−−−−−−−−−−−−−−−−−−−−−−−−−−−−−−−−−−−−−−−−−−−−−−−−−−−−−−−−−−−−−−−−−−−−−−−−−−−−−−−−−−−−−−−−−−−−−−−−−−−−−−−−−−−−−−−−−−−−−−−−−−−−−−−−−−−−−−−−−−−−−−−−−−−−−−−−−−−−−−−−−−−−−−−−−−−−−−−−−−−−−−−−−−−−−−−−−−−−−−−−−−−−−−−−−−−−−−−−−−−−−−−−−−−−−
57,886,341.85 64,239,829.22 40,384,975.09EUR
Net asset value per share
Class I EUR 9.92 9.96 9.99EUR−−−−−−−−−−−−−−−−−−−−−−−−−−−−−−−−−−−−−−−−−−−−−−−−−−−−−−−−−−−−−−−−−−−−−−−−−−−−−−−−−−−−−−−−−−−−−−−−−−−−−−−−−−−−−−−−−−−−−−−−−−−−−−−−−−−−−−−−−−−−−−−−−−−−−−−−−−−−−−−−−−−−−−−−−−−−−−−−−−−−−−−−−−−−−−−−−−−−−−−−−−−−−−−−−−−−−−−−−−−−−−−−−−−−−−−−−−−−−−−−−−−−−−−−−−−−−−−−−−−−−−−−−−−−−−−−−−−−−−−−−−−−−−−−−−−−−−−−−−−−−−−−−−−−−−−−−−−−−−−−−−−−−−−−−−−−−−−−−−−−−−−−−−−−−−−−−−−−−−−−−−−−−−−−−−−−−−−−−−−−−−−−−−−−−−−−−−−−−−−−−−−−−−−−−−−−−−−−−−−−−−−−−−−−−−−−−−−−−−−−−−−−−−−−−−−−−−−−−−−−−−−−−−−−−−−−−−−−−−−−−−−−−−−−−−−−−−−−−−−−−−−
Number of shares
Class I EUR 5,837,774.70 6,448,067.68 4,041,482.89−−−−−−−−−−−−−−−−−−−−−−−−−−−−−−−−−−−−−−−−−−−−−−−−−−−−−−−−−−−−−−−−−−−−−−−−−−−−−−−−−−−−−−−−−−−−−−−−−−−−−−−−−−−−−−−−−−−−−−−−−−−−−−−−−−−−−−−−−−−−−−−−−−−−−−−−−−−−−−−−−−−−−−−−−−−−−−−−−−−−−−−−−−−−−−−−−−−−−−−−−−−−−−−−−−−−−−−−−−−−−−−−−−−−−−−−−−−−−−−−−−−−−−−−−−−−−−−−−−−−−−−−−−−−−−−−−−−−−−−−−−−−−−−−−−−−−−−−−−−−−−−−−−−−−−−−−−−−−−−−−−−−−−−−−−−−−−−−−−−−−−−−−−−−−−−−−−−−−−−−−−−−−−−−−−−−−−−−−−−−−−−−−−−−−−−−−−−−−−−−−−−−−−−−−−−−−−−−−−−−−−−−−−−−−−−−−−−−−−−−−−−−−−−−−−−−−−−−−−−−−−−−−−−−−−−−−−−−−−−−−−−−−−−−−−−−−−−−−−−−−−−
MAPFRE AM - Inclusion Responsable Fund
Net Asset Value−−−−−−−−−−−−−−−−−−−−−−−−−−−−−−−−−−−−−−−−−−−−−−−−−−−−−−−−−−−−−−−−−−−−−−−−−−−−−−−−−−−−−−−−−−−−−−−−−−−−−−−−−−−−−−−−−−−−−−−−−−−−−−−−−−−−−−−−−−−−−−−−−−−−−−−−−−−−−−−−−−−−−−−−−−−−−−−−−−−−−−−−−−−−−−−−−−−−−−−−−−−−−−−−−−−−−−−−−−−−−−−−−−−−−−−−−−−−−−−−−−−−−−−−−−−−−−−−−−−−−−−−−−−−−−−−−−−−−−−−−−−−−−−−−−−−−−−−−−−−−−−−−−−−−−−−−−−−−−−−−−−−−−−−−−−−−−−−−−−−−−−−−−−−−−−−−−−−−−−−−−−−−−−−−−−−−−−−−−−−−−−−−−−−−−−−−−−−−−−−−−−−−−−−−−−−−−−−−−−−−−−−−−−−−−−−−−−−−−−−−−−−−−−−−−−−−−−−−−−−−−−−−−−−−−−−−−−−−−−−−−−−−−−−−−−−−−−−−−−−−−−
25,496,580.48 10,187,158.77 -EUR
Net asset value per share
Class I EUR 103.98 101.75 -EURClass R EUR 10.09 9.94 -EUR−−−−−−−−−−−−−−−−−−−−−−−−−−−−−−−−−−−−−−−−−−−−−−−−−−−−−−−−−−−−−−−−−−−−−−−−−−−−−−−−−−−−−−−−−−−−−−−−−−−−−−−−−−−−−−−−−−−−−−−−−−−−−−−−−−−−−−−−−−−−−−−−−−−−−−−−−−−−−−−−−−−−−−−−−−−−−−−−−−−−−−−−−−−−−−−−−−−−−−−−−−−−−−−−−−−−−−−−−−−−−−−−−−−−−−−−−−−−−−−−−−−−−−−−−−−−−−−−−−−−−−−−−−−−−−−−−−−−−−−−−−−−−−−−−−−−−−−−−−−−−−−−−−−−−−−−−−−−−−−−−−−−−−−−−−−−−−−−−−−−−−−−−−−−−−−−−−−−−−−−−−−−−−−−−−−−−−−−−−−−−−−−−−−−−−−−−−−−−−−−−−−−−−−−−−−−−−−−−−−−−−−−−−−−−−−−−−−−−−−−−−−−−−−−−−−−−−−−−−−−−−−−−−−−−−−−−−−−−−−−−−−−−−−−−−−−−−−−−−−−−−−
Number of shares
Class I EUR 237,771.50 100,000.00 -Class R EUR 76,656.41 1,218.11 -−−−−−−−−−−−−−−−−−−−−−−−−−−−−−−−−−−−−−−−−−−−−−−−−−−−−−−−−−−−−−−−−−−−−−−−−−−−−−−−−−−−−−−−−−−−−−−−−−−−−−−−−−−−−−−−−−−−−−−−−−−−−−−−−−−−−−−−−−−−−−−−−−−−−−−−−−−−−−−−−−−−−−−−−−−−−−−−−−−−−−−−−−−−−−−−−−−−−−−−−−−−−−−−−−−−−−−−−−−−−−−−−−−−−−−−−−−−−−−−−−−−−−−−−−−−−−−−−−−−−−−−−−−−−−−−−−−−−−−−−−−−−−−−−−−−−−−−−−−−−−−−−−−−−−−−−−−−−−−−−−−−−−−−−−−−−−−−−−−−−−−−−−−−−−−−−−−−−−−−−−−−−−−−−−−−−−−−−−−−−−−−−−−−−−−−−−−−−−−−−−−−−−−−−−−−−−−−−−−−−−−−−−−−−−−−−−−−−−−−−−−−−−−−−−−−−−−−−−−−−−−−−−−−−−−−−−−−−−−−−−−−−−−−−−−−−−−−−−−−−−−−
MAPFRE AM - US Forgotten Value Fund
Net Asset Value−−−−−−−−−−−−−−−−−−−−−−−−−−−−−−−−−−−−−−−−−−−−−−−−−−−−−−−−−−−−−−−−−−−−−−−−−−−−−−−−−−−−−−−−−−−−−−−−−−−−−−−−−−−−−−−−−−−−−−−−−−−−−−−−−−−−−−−−−−−−−−−−−−−−−−−−−−−−−−−−−−−−−−−−−−−−−−−−−−−−−−−−−−−−−−−−−−−−−−−−−−−−−−−−−−−−−−−−−−−−−−−−−−−−−−−−−−−−−−−−−−−−−−−−−−−−−−−−−−−−−−−−−−−−−−−−−−−−−−−−−−−−−−−−−−−−−−−−−−−−−−−−−−−−−−−−−−−−−−−−−−−−−−−−−−−−−−−−−−−−−−−−−−−−−−−−−−−−−−−−−−−−−−−−−−−−−−−−−−−−−−−−−−−−−−−−−−−−−−−−−−−−−−−−−−−−−−−−−−−−−−−−−−−−−−−−−−−−−−−−−−−−−−−−−−−−−−−−−−−−−−−−−−−−−−−−−−−−−−−−−−−−−−−−−−−−−−−−−−−−−−−
30,139,511.55 30,249,400.99 -EUR
Net asset value per share
Class I EUR 9.77 10.08 -EURClass R EUR 9.54 9.89 -EUR−−−−−−−−−−−−−−−−−−−−−−−−−−−−−−−−−−−−−−−−−−−−−−−−−−−−−−−−−−−−−−−−−−−−−−−−−−−−−−−−−−−−−−−−−−−−−−−−−−−−−−−−−−−−−−−−−−−−−−−−−−−−−−−−−−−−−−−−−−−−−−−−−−−−−−−−−−−−−−−−−−−−−−−−−−−−−−−−−−−−−−−−−−−−−−−−−−−−−−−−−−−−−−−−−−−−−−−−−−−−−−−−−−−−−−−−−−−−−−−−−−−−−−−−−−−−−−−−−−−−−−−−−−−−−−−−−−−−−−−−−−−−−−−−−−−−−−−−−−−−−−−−−−−−−−−−−−−−−−−−−−−−−−−−−−−−−−−−−−−−−−−−−−−−−−−−−−−−−−−−−−−−−−−−−−−−−−−−−−−−−−−−−−−−−−−−−−−−−−−−−−−−−−−−−−−−−−−−−−−−−−−−−−−−−−−−−−−−−−−−−−−−−−−−−−−−−−−−−−−−−−−−−−−−−−−−−−−−−−−−−−−−−−−−−−−−−−−−−−−−−−−
Number of shares
Class I EUR 3,031,874.89 3,000,000.00 -Class R EUR 54,691.35 10.00 -−−−−−−−−−−−−−−−−−−−−−−−−−−−−−−−−−−−−−−−−−−−−−−−−−−−−−−−−−−−−−−−−−−−−−−−−−−−−−−−−−−−−−−−−−−−−−−−−−−−−−−−−−−−−−−−−−−−−−−−−−−−−−−−−−−−−−−−−−−−−−−−−−−−−−−−−−−−−−−−−−−−−−−−−−−−−−−−−−−−−−−−−−−−−−−−−−−−−−−−−−−−−−−−−−−−−−−−−−−−−−−−−−−−−−−−−−−−−−−−−−−−−−−−−−−−−−−−−−−−−−−−−−−−−−−−−−−−−−−−−−−−−−−−−−−−−−−−−−−−−−−−−−−−−−−−−−−−−−−−−−−−−−−−−−−−−−−−−−−−−−−−−−−−−−−−−−−−−−−−−−−−−−−−−−−−−−−−−−−−−−−−−−−−−−−−−−−−−−−−−−−−−−−−−−−−−−−−−−−−−−−−−−−−−−−−−−−−−−−−−−−−−−−−−−−−−−−−−−−−−−−−−−−−−−−−−−−−−−−−−−−−−−−−−−−−−−−−−−−−−−−−
MAPFRE AM - European Equities
Net Asset Value−−−−−−−−−−−−−−−−−−−−−−−−−−−−−−−−−−−−−−−−−−−−−−−−−−−−−−−−−−−−−−−−−−−−−−−−−−−−−−−−−−−−−−−−−−−−−−−−−−−−−−−−−−−−−−−−−−−−−−−−−−−−−−−−−−−−−−−−−−−−−−−−−−−−−−−−−−−−−−−−−−−−−−−−−−−−−−−−−−−−−−−−−−−−−−−−−−−−−−−−−−−−−−−−−−−−−−−−−−−−−−−−−−−−−−−−−−−−−−−−−−−−−−−−−−−−−−−−−−−−−−−−−−−−−−−−−−−−−−−−−−−−−−−−−−−−−−−−−−−−−−−−−−−−−−−−−−−−−−−−−−−−−−−−−−−−−−−−−−−−−−−−−−−−−−−−−−−−−−−−−−−−−−−−−−−−−−−−−−−−−−−−−−−−−−−−−−−−−−−−−−−−−−−−−−−−−−−−−−−−−−−−−−−−−−−−−−−−−−−−−−−−−−−−−−−−−−−−−−−−−−−−−−−−−−−−−−−−−−−−−−−−−−−−−−−−−−−−−−−−−−−
122,122,472.87 101,919,632.33 77,920,001.16EUR
Net asset value per share
Class I EUR 11.59 11.43 8.94EURClass R EUR 12.16 12.06 -EUR−−−−−−−−−−−−−−−−−−−−−−−−−−−−−−−−−−−−−−−−−−−−−−−−−−−−−−−−−−−−−−−−−−−−−−−−−−−−−−−−−−−−−−−−−−−−−−−−−−−−−−−−−−−−−−−−−−−−−−−−−−−−−−−−−−−−−−−−−−−−−−−−−−−−−−−−−−−−−−−−−−−−−−−−−−−−−−−−−−−−−−−−−−−−−−−−−−−−−−−−−−−−−−−−−−−−−−−−−−−−−−−−−−−−−−−−−−−−−−−−−−−−−−−−−−−−−−−−−−−−−−−−−−−−−−−−−−−−−−−−−−−−−−−−−−−−−−−−−−−−−−−−−−−−−−−−−−−−−−−−−−−−−−−−−−−−−−−−−−−−−−−−−−−−−−−−−−−−−−−−−−−−−−−−−−−−−−−−−−−−−−−−−−−−−−−−−−−−−−−−−−−−−−−−−−−−−−−−−−−−−−−−−−−−−−−−−−−−−−−−−−−−−−−−−−−−−−−−−−−−−−−−−−−−−−−−−−−−−−−−−−−−−−−−−−−−−−−−−−−−−−−
Number of shares
Class I EUR 10,534,862.80 8,910,704.98 8,714,448.96Class R EUR 3,775.41 4,112.72 -−−−−−−−−−−−−−−−−−−−−−−−−−−−−−−−−−−−−−−−−−−−−−−−−−−−−−−−−−−−−−−−−−−−−−−−−−−−−−−−−−−−−−−−−−−−−−−−−−−−−−−−−−−−−−−−−−−−−−−−−−−−−−−−−−−−−−−−−−−−−−−−−−−−−−−−−−−−−−−−−−−−−−−−−−−−−−−−−−−−−−−−−−−−−−−−−−−−−−−−−−−−−−−−−−−−−−−−−−−−−−−−−−−−−−−−−−−−−−−−−−−−−−−−−−−−−−−−−−−−−−−−−−−−−−−−−−−−−−−−−−−−−−−−−−−−−−−−−−−−−−−−−−−−−−−−−−−−−−−−−−−−−−−−−−−−−−−−−−−−−−−−−−−−−−−−−−−−−−−−−−−−−−−−−−−−−−−−−−−−−−−−−−−−−−−−−−−−−−−−−−−−−−−−−−−−−−−−−−−−−−−−−−−−−−−−−−−−−−−−−−−−−−−−−−−−−−−−−−−−−−−−−−−−−−−−−−−−−−−−−−−−−−−−−−−−−−−−−−−−−−−−
MAPFRE AM - Iberian Equities
Net Asset Value−−−−−−−−−−−−−−−−−−−−−−−−−−−−−−−−−−−−−−−−−−−−−−−−−−−−−−−−−−−−−−−−−−−−−−−−−−−−−−−−−−−−−−−−−−−−−−−−−−−−−−−−−−−−−−−−−−−−−−−−−−−−−−−−−−−−−−−−−−−−−−−−−−−−−−−−−−−−−−−−−−−−−−−−−−−−−−−−−−−−−−−−−−−−−−−−−−−−−−−−−−−−−−−−−−−−−−−−−−−−−−−−−−−−−−−−−−−−−−−−−−−−−−−−−−−−−−−−−−−−−−−−−−−−−−−−−−−−−−−−−−−−−−−−−−−−−−−−−−−−−−−−−−−−−−−−−−−−−−−−−−−−−−−−−−−−−−−−−−−−−−−−−−−−−−−−−−−−−−−−−−−−−−−−−−−−−−−−−−−−−−−−−−−−−−−−−−−−−−−−−−−−−−−−−−−−−−−−−−−−−−−−−−−−−−−−−−−−−−−−−−−−−−−−−−−−−−−−−−−−−−−−−−−−−−−−−−−−−−−−−−−−−−−−−−−−−−−−−−−−−−−
33,356,649.72 49,846,024.70 43,520,834.85EUR
December 31, 2018December 31, 2020 December 31, 2019
MAPFRE AM
21
The accompanying notes are an integral part of these financial statements.
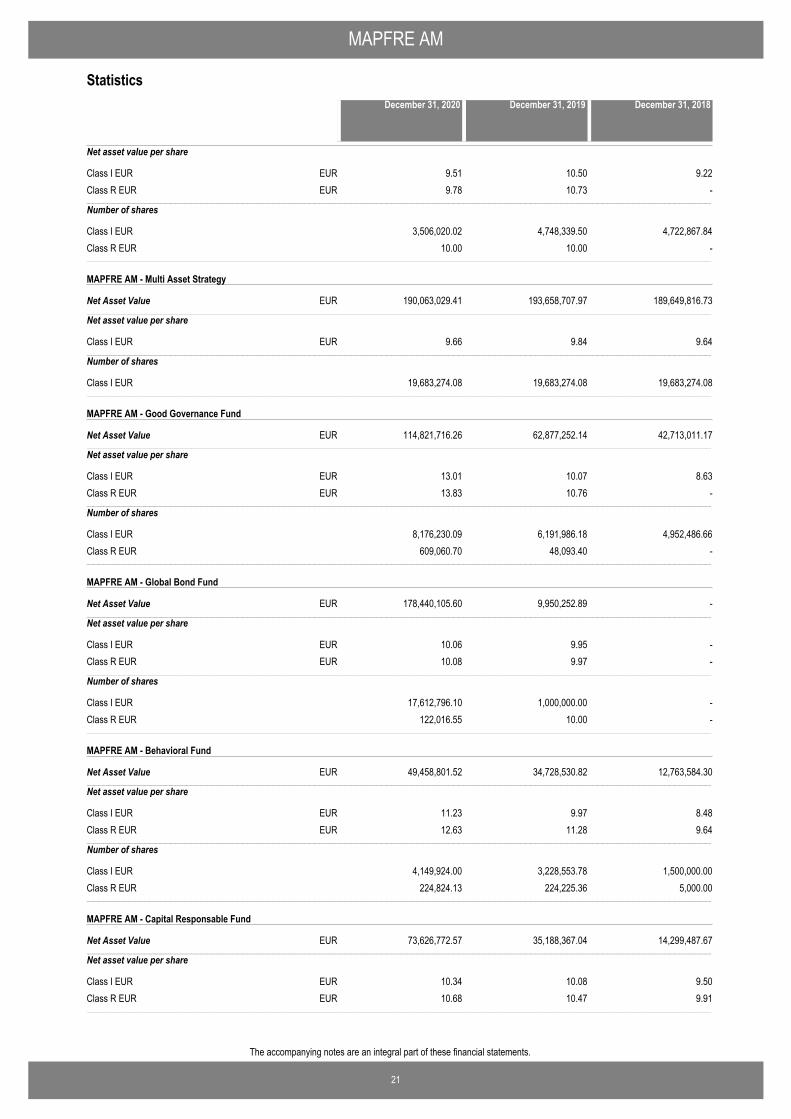
Statistics
Net asset value per share
Class I EUR 9.51 10.50 9.22EURClass R EUR 9.78 10.73 -EUR−−−−−−−−−−−−−−−−−−−−−−−−−−−−−−−−−−−−−−−−−−−−−−−−−−−−−−−−−−−−−−−−−−−−−−−−−−−−−−−−−−−−−−−−−−−−−−−−−−−−−−−−−−−−−−−−−−−−−−−−−−−−−−−−−−−−−−−−−−−−−−−−−−−−−−−−−−−−−−−−−−−−−−−−−−−−−−−−−−−−−−−−−−−−−−−−−−−−−−−−−−−−−−−−−−−−−−−−−−−−−−−−−−−−−−−−−−−−−−−−−−−−−−−−−−−−−−−−−−−−−−−−−−−−−−−−−−−−−−−−−−−−−−−−−−−−−−−−−−−−−−−−−−−−−−−−−−−−−−−−−−−−−−−−−−−−−−−−−−−−−−−−−−−−−−−−−−−−−−−−−−−−−−−−−−−−−−−−−−−−−−−−−−−−−−−−−−−−−−−−−−−−−−−−−−−−−−−−−−−−−−−−−−−−−−−−−−−−−−−−−−−−−−−−−−−−−−−−−−−−−−−−−−−−−−−−−−−−−−−−−−−−−−−−−−−−−−−−−−−−−−−
Number of shares
Class I EUR 3,506,020.02 4,748,339.50 4,722,867.84Class R EUR 10.00 10.00 -−−−−−−−−−−−−−−−−−−−−−−−−−−−−−−−−−−−−−−−−−−−−−−−−−−−−−−−−−−−−−−−−−−−−−−−−−−−−−−−−−−−−−−−−−−−−−−−−−−−−−−−−−−−−−−−−−−−−−−−−−−−−−−−−−−−−−−−−−−−−−−−−−−−−−−−−−−−−−−−−−−−−−−−−−−−−−−−−−−−−−−−−−−−−−−−−−−−−−−−−−−−−−−−−−−−−−−−−−−−−−−−−−−−−−−−−−−−−−−−−−−−−−−−−−−−−−−−−−−−−−−−−−−−−−−−−−−−−−−−−−−−−−−−−−−−−−−−−−−−−−−−−−−−−−−−−−−−−−−−−−−−−−−−−−−−−−−−−−−−−−−−−−−−−−−−−−−−−−−−−−−−−−−−−−−−−−−−−−−−−−−−−−−−−−−−−−−−−−−−−−−−−−−−−−−−−−−−−−−−−−−−−−−−−−−−−−−−−−−−−−−−−−−−−−−−−−−−−−−−−−−−−−−−−−−−−−−−−−−−−−−−−−−−−−−−−−−−−−−−−−−−
MAPFRE AM - Multi Asset Strategy
Net Asset Value−−−−−−−−−−−−−−−−−−−−−−−−−−−−−−−−−−−−−−−−−−−−−−−−−−−−−−−−−−−−−−−−−−−−−−−−−−−−−−−−−−−−−−−−−−−−−−−−−−−−−−−−−−−−−−−−−−−−−−−−−−−−−−−−−−−−−−−−−−−−−−−−−−−−−−−−−−−−−−−−−−−−−−−−−−−−−−−−−−−−−−−−−−−−−−−−−−−−−−−−−−−−−−−−−−−−−−−−−−−−−−−−−−−−−−−−−−−−−−−−−−−−−−−−−−−−−−−−−−−−−−−−−−−−−−−−−−−−−−−−−−−−−−−−−−−−−−−−−−−−−−−−−−−−−−−−−−−−−−−−−−−−−−−−−−−−−−−−−−−−−−−−−−−−−−−−−−−−−−−−−−−−−−−−−−−−−−−−−−−−−−−−−−−−−−−−−−−−−−−−−−−−−−−−−−−−−−−−−−−−−−−−−−−−−−−−−−−−−−−−−−−−−−−−−−−−−−−−−−−−−−−−−−−−−−−−−−−−−−−−−−−−−−−−−−−−−−−−−−−−−−−
190,063,029.41 193,658,707.97 189,649,816.73EUR
Net asset value per share
Class I EUR 9.66 9.84 9.64EUR−−−−−−−−−−−−−−−−−−−−−−−−−−−−−−−−−−−−−−−−−−−−−−−−−−−−−−−−−−−−−−−−−−−−−−−−−−−−−−−−−−−−−−−−−−−−−−−−−−−−−−−−−−−−−−−−−−−−−−−−−−−−−−−−−−−−−−−−−−−−−−−−−−−−−−−−−−−−−−−−−−−−−−−−−−−−−−−−−−−−−−−−−−−−−−−−−−−−−−−−−−−−−−−−−−−−−−−−−−−−−−−−−−−−−−−−−−−−−−−−−−−−−−−−−−−−−−−−−−−−−−−−−−−−−−−−−−−−−−−−−−−−−−−−−−−−−−−−−−−−−−−−−−−−−−−−−−−−−−−−−−−−−−−−−−−−−−−−−−−−−−−−−−−−−−−−−−−−−−−−−−−−−−−−−−−−−−−−−−−−−−−−−−−−−−−−−−−−−−−−−−−−−−−−−−−−−−−−−−−−−−−−−−−−−−−−−−−−−−−−−−−−−−−−−−−−−−−−−−−−−−−−−−−−−−−−−−−−−−−−−−−−−−−−−−−−−−−−−−−−−−−
Number of shares
Class I EUR 19,683,274.08 19,683,274.08 19,683,274.08−−−−−−−−−−−−−−−−−−−−−−−−−−−−−−−−−−−−−−−−−−−−−−−−−−−−−−−−−−−−−−−−−−−−−−−−−−−−−−−−−−−−−−−−−−−−−−−−−−−−−−−−−−−−−−−−−−−−−−−−−−−−−−−−−−−−−−−−−−−−−−−−−−−−−−−−−−−−−−−−−−−−−−−−−−−−−−−−−−−−−−−−−−−−−−−−−−−−−−−−−−−−−−−−−−−−−−−−−−−−−−−−−−−−−−−−−−−−−−−−−−−−−−−−−−−−−−−−−−−−−−−−−−−−−−−−−−−−−−−−−−−−−−−−−−−−−−−−−−−−−−−−−−−−−−−−−−−−−−−−−−−−−−−−−−−−−−−−−−−−−−−−−−−−−−−−−−−−−−−−−−−−−−−−−−−−−−−−−−−−−−−−−−−−−−−−−−−−−−−−−−−−−−−−−−−−−−−−−−−−−−−−−−−−−−−−−−−−−−−−−−−−−−−−−−−−−−−−−−−−−−−−−−−−−−−−−−−−−−−−−−−−−−−−−−−−−−−−−−−−−−−
MAPFRE AM - Good Governance Fund
Net Asset Value−−−−−−−−−−−−−−−−−−−−−−−−−−−−−−−−−−−−−−−−−−−−−−−−−−−−−−−−−−−−−−−−−−−−−−−−−−−−−−−−−−−−−−−−−−−−−−−−−−−−−−−−−−−−−−−−−−−−−−−−−−−−−−−−−−−−−−−−−−−−−−−−−−−−−−−−−−−−−−−−−−−−−−−−−−−−−−−−−−−−−−−−−−−−−−−−−−−−−−−−−−−−−−−−−−−−−−−−−−−−−−−−−−−−−−−−−−−−−−−−−−−−−−−−−−−−−−−−−−−−−−−−−−−−−−−−−−−−−−−−−−−−−−−−−−−−−−−−−−−−−−−−−−−−−−−−−−−−−−−−−−−−−−−−−−−−−−−−−−−−−−−−−−−−−−−−−−−−−−−−−−−−−−−−−−−−−−−−−−−−−−−−−−−−−−−−−−−−−−−−−−−−−−−−−−−−−−−−−−−−−−−−−−−−−−−−−−−−−−−−−−−−−−−−−−−−−−−−−−−−−−−−−−−−−−−−−−−−−−−−−−−−−−−−−−−−−−−−−−−−−−−
114,821,716.26 62,877,252.14 42,713,011.17EUR
Net asset value per share
Class I EUR 13.01 10.07 8.63EURClass R EUR 13.83 10.76 -EUR−−−−−−−−−−−−−−−−−−−−−−−−−−−−−−−−−−−−−−−−−−−−−−−−−−−−−−−−−−−−−−−−−−−−−−−−−−−−−−−−−−−−−−−−−−−−−−−−−−−−−−−−−−−−−−−−−−−−−−−−−−−−−−−−−−−−−−−−−−−−−−−−−−−−−−−−−−−−−−−−−−−−−−−−−−−−−−−−−−−−−−−−−−−−−−−−−−−−−−−−−−−−−−−−−−−−−−−−−−−−−−−−−−−−−−−−−−−−−−−−−−−−−−−−−−−−−−−−−−−−−−−−−−−−−−−−−−−−−−−−−−−−−−−−−−−−−−−−−−−−−−−−−−−−−−−−−−−−−−−−−−−−−−−−−−−−−−−−−−−−−−−−−−−−−−−−−−−−−−−−−−−−−−−−−−−−−−−−−−−−−−−−−−−−−−−−−−−−−−−−−−−−−−−−−−−−−−−−−−−−−−−−−−−−−−−−−−−−−−−−−−−−−−−−−−−−−−−−−−−−−−−−−−−−−−−−−−−−−−−−−−−−−−−−−−−−−−−−−−−−−−−
Number of shares
Class I EUR 8,176,230.09 6,191,986.18 4,952,486.66Class R EUR 609,060.70 48,093.40 -−−−−−−−−−−−−−−−−−−−−−−−−−−−−−−−−−−−−−−−−−−−−−−−−−−−−−−−−−−−−−−−−−−−−−−−−−−−−−−−−−−−−−−−−−−−−−−−−−−−−−−−−−−−−−−−−−−−−−−−−−−−−−−−−−−−−−−−−−−−−−−−−−−−−−−−−−−−−−−−−−−−−−−−−−−−−−−−−−−−−−−−−−−−−−−−−−−−−−−−−−−−−−−−−−−−−−−−−−−−−−−−−−−−−−−−−−−−−−−−−−−−−−−−−−−−−−−−−−−−−−−−−−−−−−−−−−−−−−−−−−−−−−−−−−−−−−−−−−−−−−−−−−−−−−−−−−−−−−−−−−−−−−−−−−−−−−−−−−−−−−−−−−−−−−−−−−−−−−−−−−−−−−−−−−−−−−−−−−−−−−−−−−−−−−−−−−−−−−−−−−−−−−−−−−−−−−−−−−−−−−−−−−−−−−−−−−−−−−−−−−−−−−−−−−−−−−−−−−−−−−−−−−−−−−−−−−−−−−−−−−−−−−−−−−−−−−−−−−−−−−−−
MAPFRE AM - Global Bond Fund
Net Asset Value−−−−−−−−−−−−−−−−−−−−−−−−−−−−−−−−−−−−−−−−−−−−−−−−−−−−−−−−−−−−−−−−−−−−−−−−−−−−−−−−−−−−−−−−−−−−−−−−−−−−−−−−−−−−−−−−−−−−−−−−−−−−−−−−−−−−−−−−−−−−−−−−−−−−−−−−−−−−−−−−−−−−−−−−−−−−−−−−−−−−−−−−−−−−−−−−−−−−−−−−−−−−−−−−−−−−−−−−−−−−−−−−−−−−−−−−−−−−−−−−−−−−−−−−−−−−−−−−−−−−−−−−−−−−−−−−−−−−−−−−−−−−−−−−−−−−−−−−−−−−−−−−−−−−−−−−−−−−−−−−−−−−−−−−−−−−−−−−−−−−−−−−−−−−−−−−−−−−−−−−−−−−−−−−−−−−−−−−−−−−−−−−−−−−−−−−−−−−−−−−−−−−−−−−−−−−−−−−−−−−−−−−−−−−−−−−−−−−−−−−−−−−−−−−−−−−−−−−−−−−−−−−−−−−−−−−−−−−−−−−−−−−−−−−−−−−−−−−−−−−−−−
178,440,105.60 9,950,252.89 -EUR
Net asset value per share
Class I EUR 10.06 9.95 -EURClass R EUR 10.08 9.97 -EUR−−−−−−−−−−−−−−−−−−−−−−−−−−−−−−−−−−−−−−−−−−−−−−−−−−−−−−−−−−−−−−−−−−−−−−−−−−−−−−−−−−−−−−−−−−−−−−−−−−−−−−−−−−−−−−−−−−−−−−−−−−−−−−−−−−−−−−−−−−−−−−−−−−−−−−−−−−−−−−−−−−−−−−−−−−−−−−−−−−−−−−−−−−−−−−−−−−−−−−−−−−−−−−−−−−−−−−−−−−−−−−−−−−−−−−−−−−−−−−−−−−−−−−−−−−−−−−−−−−−−−−−−−−−−−−−−−−−−−−−−−−−−−−−−−−−−−−−−−−−−−−−−−−−−−−−−−−−−−−−−−−−−−−−−−−−−−−−−−−−−−−−−−−−−−−−−−−−−−−−−−−−−−−−−−−−−−−−−−−−−−−−−−−−−−−−−−−−−−−−−−−−−−−−−−−−−−−−−−−−−−−−−−−−−−−−−−−−−−−−−−−−−−−−−−−−−−−−−−−−−−−−−−−−−−−−−−−−−−−−−−−−−−−−−−−−−−−−−−−−−−−−
Number of shares
Class I EUR 17,612,796.10 1,000,000.00 -Class R EUR 122,016.55 10.00 -−−−−−−−−−−−−−−−−−−−−−−−−−−−−−−−−−−−−−−−−−−−−−−−−−−−−−−−−−−−−−−−−−−−−−−−−−−−−−−−−−−−−−−−−−−−−−−−−−−−−−−−−−−−−−−−−−−−−−−−−−−−−−−−−−−−−−−−−−−−−−−−−−−−−−−−−−−−−−−−−−−−−−−−−−−−−−−−−−−−−−−−−−−−−−−−−−−−−−−−−−−−−−−−−−−−−−−−−−−−−−−−−−−−−−−−−−−−−−−−−−−−−−−−−−−−−−−−−−−−−−−−−−−−−−−−−−−−−−−−−−−−−−−−−−−−−−−−−−−−−−−−−−−−−−−−−−−−−−−−−−−−−−−−−−−−−−−−−−−−−−−−−−−−−−−−−−−−−−−−−−−−−−−−−−−−−−−−−−−−−−−−−−−−−−−−−−−−−−−−−−−−−−−−−−−−−−−−−−−−−−−−−−−−−−−−−−−−−−−−−−−−−−−−−−−−−−−−−−−−−−−−−−−−−−−−−−−−−−−−−−−−−−−−−−−−−−−−−−−−−−−−
MAPFRE AM - Behavioral Fund
Net Asset Value−−−−−−−−−−−−−−−−−−−−−−−−−−−−−−−−−−−−−−−−−−−−−−−−−−−−−−−−−−−−−−−−−−−−−−−−−−−−−−−−−−−−−−−−−−−−−−−−−−−−−−−−−−−−−−−−−−−−−−−−−−−−−−−−−−−−−−−−−−−−−−−−−−−−−−−−−−−−−−−−−−−−−−−−−−−−−−−−−−−−−−−−−−−−−−−−−−−−−−−−−−−−−−−−−−−−−−−−−−−−−−−−−−−−−−−−−−−−−−−−−−−−−−−−−−−−−−−−−−−−−−−−−−−−−−−−−−−−−−−−−−−−−−−−−−−−−−−−−−−−−−−−−−−−−−−−−−−−−−−−−−−−−−−−−−−−−−−−−−−−−−−−−−−−−−−−−−−−−−−−−−−−−−−−−−−−−−−−−−−−−−−−−−−−−−−−−−−−−−−−−−−−−−−−−−−−−−−−−−−−−−−−−−−−−−−−−−−−−−−−−−−−−−−−−−−−−−−−−−−−−−−−−−−−−−−−−−−−−−−−−−−−−−−−−−−−−−−−−−−−−−−
49,458,801.52 34,728,530.82 12,763,584.30EUR
Net asset value per share
Class I EUR 11.23 9.97 8.48EURClass R EUR 12.63 11.28 9.64EUR−−−−−−−−−−−−−−−−−−−−−−−−−−−−−−−−−−−−−−−−−−−−−−−−−−−−−−−−−−−−−−−−−−−−−−−−−−−−−−−−−−−−−−−−−−−−−−−−−−−−−−−−−−−−−−−−−−−−−−−−−−−−−−−−−−−−−−−−−−−−−−−−−−−−−−−−−−−−−−−−−−−−−−−−−−−−−−−−−−−−−−−−−−−−−−−−−−−−−−−−−−−−−−−−−−−−−−−−−−−−−−−−−−−−−−−−−−−−−−−−−−−−−−−−−−−−−−−−−−−−−−−−−−−−−−−−−−−−−−−−−−−−−−−−−−−−−−−−−−−−−−−−−−−−−−−−−−−−−−−−−−−−−−−−−−−−−−−−−−−−−−−−−−−−−−−−−−−−−−−−−−−−−−−−−−−−−−−−−−−−−−−−−−−−−−−−−−−−−−−−−−−−−−−−−−−−−−−−−−−−−−−−−−−−−−−−−−−−−−−−−−−−−−−−−−−−−−−−−−−−−−−−−−−−−−−−−−−−−−−−−−−−−−−−−−−−−−−−−−−−−−−
Number of shares
Class I EUR 4,149,924.00 3,228,553.78 1,500,000.00Class R EUR 224,824.13 224,225.36 5,000.00−−−−−−−−−−−−−−−−−−−−−−−−−−−−−−−−−−−−−−−−−−−−−−−−−−−−−−−−−−−−−−−−−−−−−−−−−−−−−−−−−−−−−−−−−−−−−−−−−−−−−−−−−−−−−−−−−−−−−−−−−−−−−−−−−−−−−−−−−−−−−−−−−−−−−−−−−−−−−−−−−−−−−−−−−−−−−−−−−−−−−−−−−−−−−−−−−−−−−−−−−−−−−−−−−−−−−−−−−−−−−−−−−−−−−−−−−−−−−−−−−−−−−−−−−−−−−−−−−−−−−−−−−−−−−−−−−−−−−−−−−−−−−−−−−−−−−−−−−−−−−−−−−−−−−−−−−−−−−−−−−−−−−−−−−−−−−−−−−−−−−−−−−−−−−−−−−−−−−−−−−−−−−−−−−−−−−−−−−−−−−−−−−−−−−−−−−−−−−−−−−−−−−−−−−−−−−−−−−−−−−−−−−−−−−−−−−−−−−−−−−−−−−−−−−−−−−−−−−−−−−−−−−−−−−−−−−−−−−−−−−−−−−−−−−−−−−−−−−−−−−−−
MAPFRE AM - Capital Responsable Fund
Net Asset Value−−−−−−−−−−−−−−−−−−−−−−−−−−−−−−−−−−−−−−−−−−−−−−−−−−−−−−−−−−−−−−−−−−−−−−−−−−−−−−−−−−−−−−−−−−−−−−−−−−−−−−−−−−−−−−−−−−−−−−−−−−−−−−−−−−−−−−−−−−−−−−−−−−−−−−−−−−−−−−−−−−−−−−−−−−−−−−−−−−−−−−−−−−−−−−−−−−−−−−−−−−−−−−−−−−−−−−−−−−−−−−−−−−−−−−−−−−−−−−−−−−−−−−−−−−−−−−−−−−−−−−−−−−−−−−−−−−−−−−−−−−−−−−−−−−−−−−−−−−−−−−−−−−−−−−−−−−−−−−−−−−−−−−−−−−−−−−−−−−−−−−−−−−−−−−−−−−−−−−−−−−−−−−−−−−−−−−−−−−−−−−−−−−−−−−−−−−−−−−−−−−−−−−−−−−−−−−−−−−−−−−−−−−−−−−−−−−−−−−−−−−−−−−−−−−−−−−−−−−−−−−−−−−−−−−−−−−−−−−−−−−−−−−−−−−−−−−−−−−−−−−−
73,626,772.57 35,188,367.04 14,299,487.67EUR
Net asset value per share
Class I EUR 10.34 10.08 9.50EURClass R EUR 10.68 10.47 9.91EUR−−−−−−−−−−−−−−−−−−−−−−−−−−−−−−−−−−−−−−−−−−−−−−−−−−−−−−−−−−−−−−−−−−−−−−−−−−−−−−−−−−−−−−−−−−−−−−−−−−−−−−−−−−−−−−−−−−−−−−−−−−−−−−−−−−−−−−−−−−−−−−−−−−−−−−−−−−−−−−−−−−−−−−−−−−−−−−−−−−−−−−−−−−−−−−−−−−−−−−−−−−−−−−−−−−−−−−−−−−−−−−−−−−−−−−−−−−−−−−−−−−−−−−−−−−−−−−−−−−−−−−−−−−−−−−−−−−−−−−−−−−−−−−−−−−−−−−−−−−−−−−−−−−−−−−−−−−−−−−−−−−−−−−−−−−−−−−−−−−−−−−−−−−−−−−−−−−−−−−−−−−−−−−−−−−−−−−−−−−−−−−−−−−−−−−−−−−−−−−−−−−−−−−−−−−−−−−−−−−−−−−−−−−−−−−−−−−−−−−−−−−−−−−−−−−−−−−−−−−−−−−−−−−−−−−−−−−−−−−−−−−−−−−−−−−−−−−−−−−−−−−−
December 31, 2018December 31, 2020 December 31, 2019
MAPFRE AM
22
The accompanying notes are an integral part of these financial statements.
Statistics
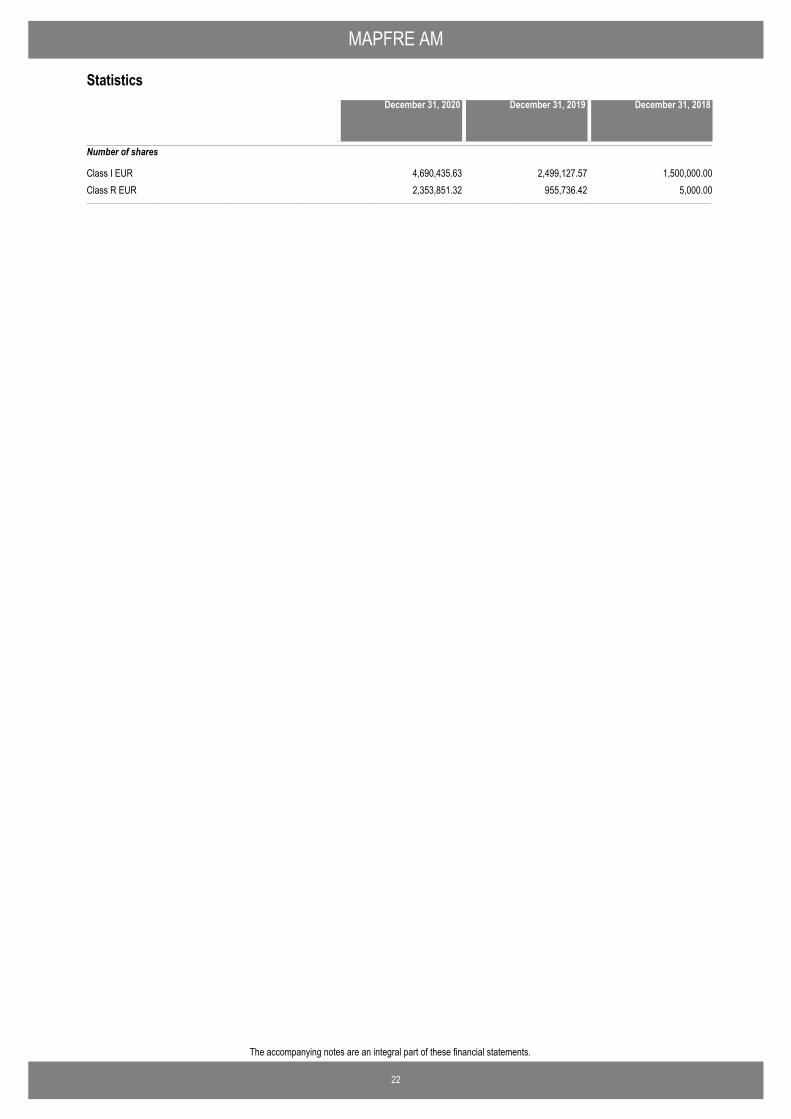
Number of shares
Class I EUR 4,690,435.63 2,499,127.57 1,500,000.00Class R EUR 2,353,851.32 955,736.42 5,000.00−−−−−−−−−−−−−−−−−−−−−−−−−−−−−−−−−−−−−−−−−−−−−−−−−−−−−−−−−−−−−−−−−−−−−−−−−−−−−−−−−−−−−−−−−−−−−−−−−−−−−−−−−−−−−−−−−−−−−−−−−−−−−−−−−−−−−−−−−−−−−−−−−−−−−−−−−−−−−−−−−−−−−−−−−−−−−−−−−−−−−−−−−−−−−−−−−−−−−−−−−−−−−−−−−−−−−−−−−−−−−−−−−−−−−−−−−−−−−−−−−−−−−−−−−−−−−−−−−−−−−−−−−−−−−−−−−−−−−−−−−−−−−−−−−−−−−−−−−−−−−−−−−−−−−−−−−−−−−−−−−−−−−−−−−−−−−−−−−−−−−−−−−−−−−−−−−−−−−−−−−−−−−−−−−−−−−−−−−−−−−−−−−−−−−−−−−−−−−−−−−−−−−−−−−−−−−−−−−−−−−−−−−−−−−−−−−−−−−−−−−−−−−−−−−−−−−−−−−−−−−−−−−−−−−−−−−−−−−−−−−−−−−−−−−−−−−−−−−−−−−−−
December 31, 2018December 31, 2020 December 31, 2019
23
The accompanying notes are an integral part of these financial statements.
MAPFRE AM
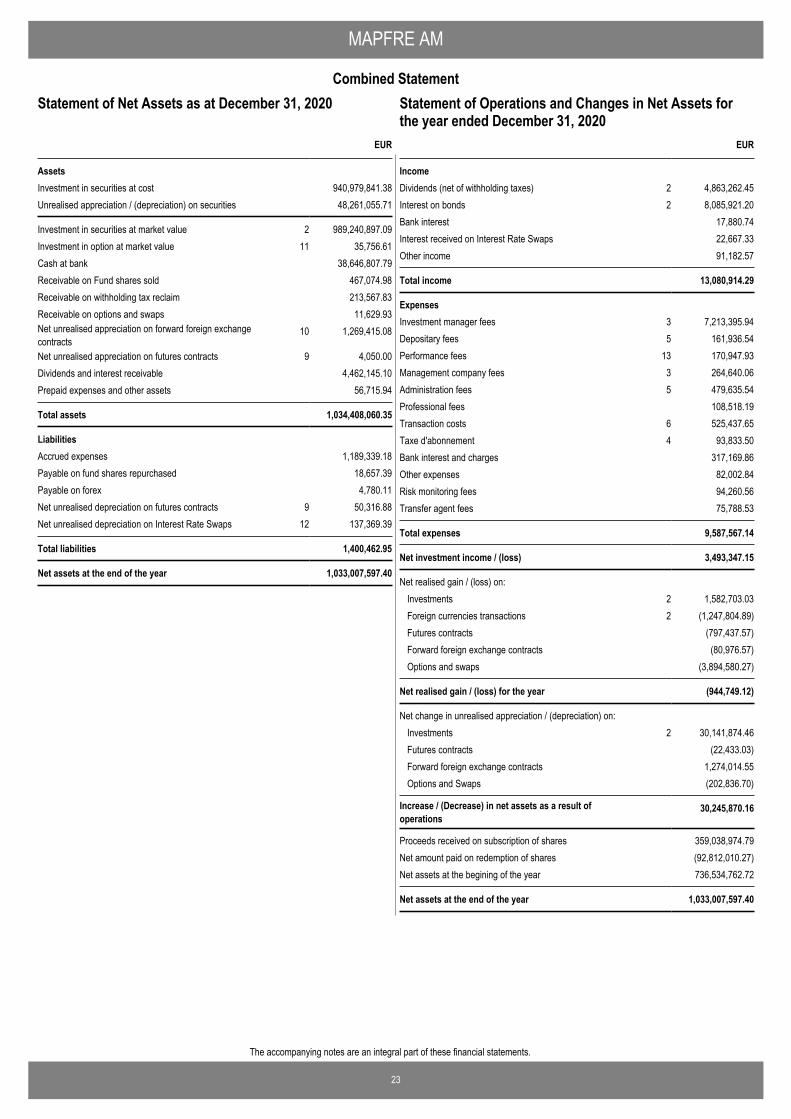
Combined Statement
EUR
AssetsInvestment in securities at cost 940,979,841.38Unrealised appreciation / (depreciation) on securities 48,261,055.71
Investment in securities at market value 2 989,240,897.09Investment in option at market value 11 35,756.61Cash at bank 38,646,807.79Receivable on Fund shares sold 467,074.98Receivable on withholding tax reclaim 213,567.83Receivable on options and swaps 11,629.93Net unrealised appreciation on forward foreign exchangecontracts
10 1,269,415.08
Net unrealised appreciation on futures contracts 9 4,050.00Dividends and interest receivable 4,462,145.10Prepaid expenses and other assets 56,715.94
Total assets 1,034,408,060.35
LiabilitiesAccrued expenses 1,189,339.18Payable on fund shares repurchased 18,657.39Payable on forex 4,780.11Net unrealised depreciation on futures contracts 9 50,316.88Net unrealised depreciation on Interest Rate Swaps 12 137,369.39
Total liabilities 1,400,462.95
Net assets at the end of the year 1,033,007,597.40
Statement of Net Assets as at December 31, 2020
IncomeDividends (net of withholding taxes) 2 4,863,262.45Interest on bonds 2 8,085,921.20Bank interest 17,880.74Interest received on Interest Rate Swaps 22,667.33Other income 91,182.57
Total income 13,080,914.29
ExpensesInvestment manager fees 3 7,213,395.94Depositary fees 5 161,936.54Performance fees 13 170,947.93Management company fees 3 264,640.06Administration fees 5 479,635.54Professional fees 108,518.19Transaction costs 6 525,437.65Taxe d'abonnement 4 93,833.50Bank interest and charges 317,169.86Other expenses 82,002.84Risk monitoring fees 94,260.56Transfer agent fees 75,788.53
Total expenses 9,587,567.14
Net investment income / (loss) 3,493,347.15
Net realised gain / (loss) on: Investments 2 1,582,703.03Foreign currencies transactions 2 (1,247,804.89)Futures contracts (797,437.57)Forward foreign exchange contracts (80,976.57)Options and swaps (3,894,580.27)
Net realised gain / (loss) for the year (944,749.12)
Net change in unrealised appreciation / (depreciation) on: Investments 2 30,141,874.46Futures contracts (22,433.03)Forward foreign exchange contracts 1,274,014.55Options and Swaps (202,836.70)
Increase / (Decrease) in net assets as a result ofoperations
30,245,870.16
Proceeds received on subscription of shares 359,038,974.79Net amount paid on redemption of shares (92,812,010.27)Net assets at the begining of the year 736,534,762.72
Net assets at the end of the year 1,033,007,597.40
EUR
Statement of Operations and Changes in Net Assets forthe year ended December 31, 2020
24
The accompanying notes are an integral part of these financial statements.
MAPFRE AM
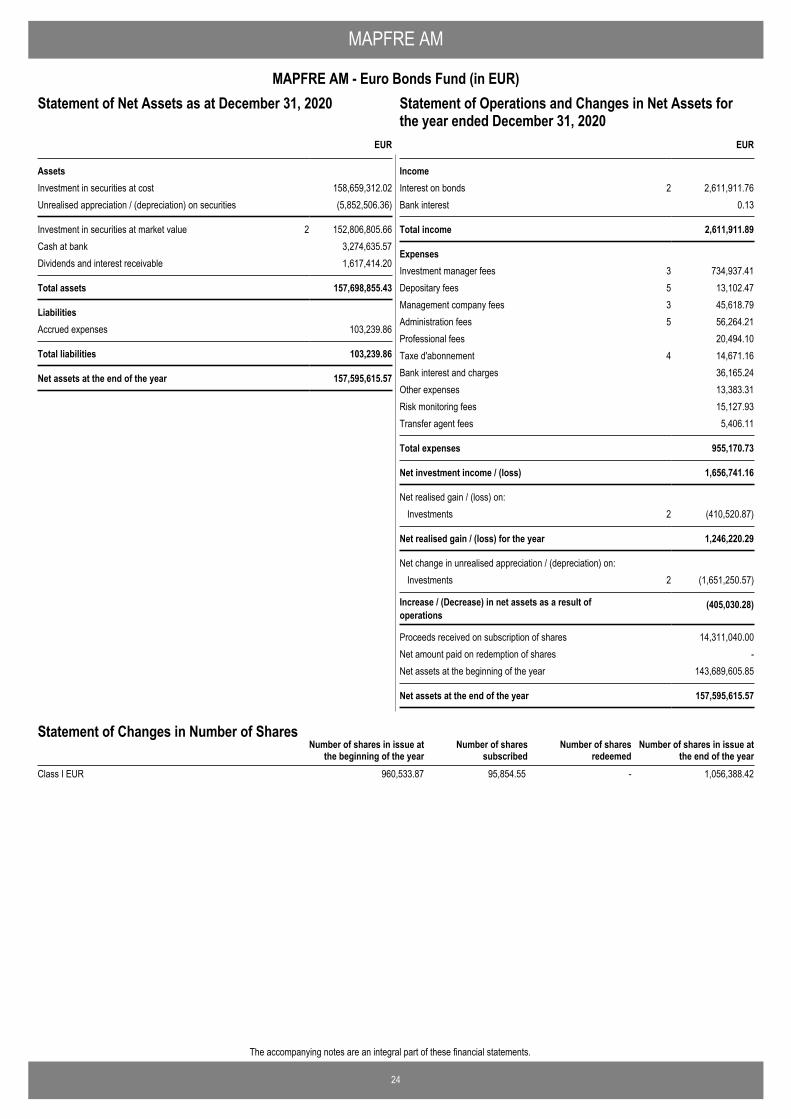
MAPFRE AM - Euro Bonds Fund (in EUR)Statement of Operations and Changes in Net Assets for theyear ended December 31, 2020
EUR
AssetsInvestment in securities at cost 158,659,312.02Unrealised appreciation / (depreciation) on securities (5,852,506.36)
Investment in securities at market value 2 152,806,805.66Cash at bank 3,274,635.57Dividends and interest receivable 1,617,414.20
Total assets 157,698,855.43
LiabilitiesAccrued expenses 103,239.86
Total liabilities 103,239.86
Net assets at the end of the year 157,595,615.57
Statement of Net Assets as at December 31, 2020
IncomeInterest on bonds 2 2,611,911.76Bank interest 0.13
Total income 2,611,911.89
ExpensesInvestment manager fees 3 734,937.41Depositary fees 5 13,102.47Management company fees 3 45,618.79Administration fees 5 56,264.21Professional fees 20,494.10Taxe d'abonnement 4 14,671.16Bank interest and charges 36,165.24Other expenses 13,383.31Risk monitoring fees 15,127.93Transfer agent fees 5,406.11
Total expenses 955,170.73
Net investment income / (loss) 1,656,741.16
Net realised gain / (loss) on: Investments 2 (410,520.87)
Net realised gain / (loss) for the year 1,246,220.29
Net change in unrealised appreciation / (depreciation) on: Investments 2 (1,651,250.57)
Increase / (Decrease) in net assets as a result ofoperations
(405,030.28)
Proceeds received on subscription of shares 14,311,040.00Net amount paid on redemption of shares -Net assets at the beginning of the year 143,689,605.85
Net assets at the end of the year 157,595,615.57
EUR
Statement of Operations and Changes in Net Assets forthe year ended December 31, 2020
Number of shares in issue atthe end of the year
Number of shares in issue atthe beginning of the year
Number of sharessubscribed
Number of sharesredeemed
Statement of Changes in Number of Shares
Class I EUR 960,533.87 95,854.55 - 1,056,388.42
MAPFRE AM
25
MAPFRE AM - Euro Bonds Fund (in EUR)
The accompanying notes are an integral part of these financial statements.
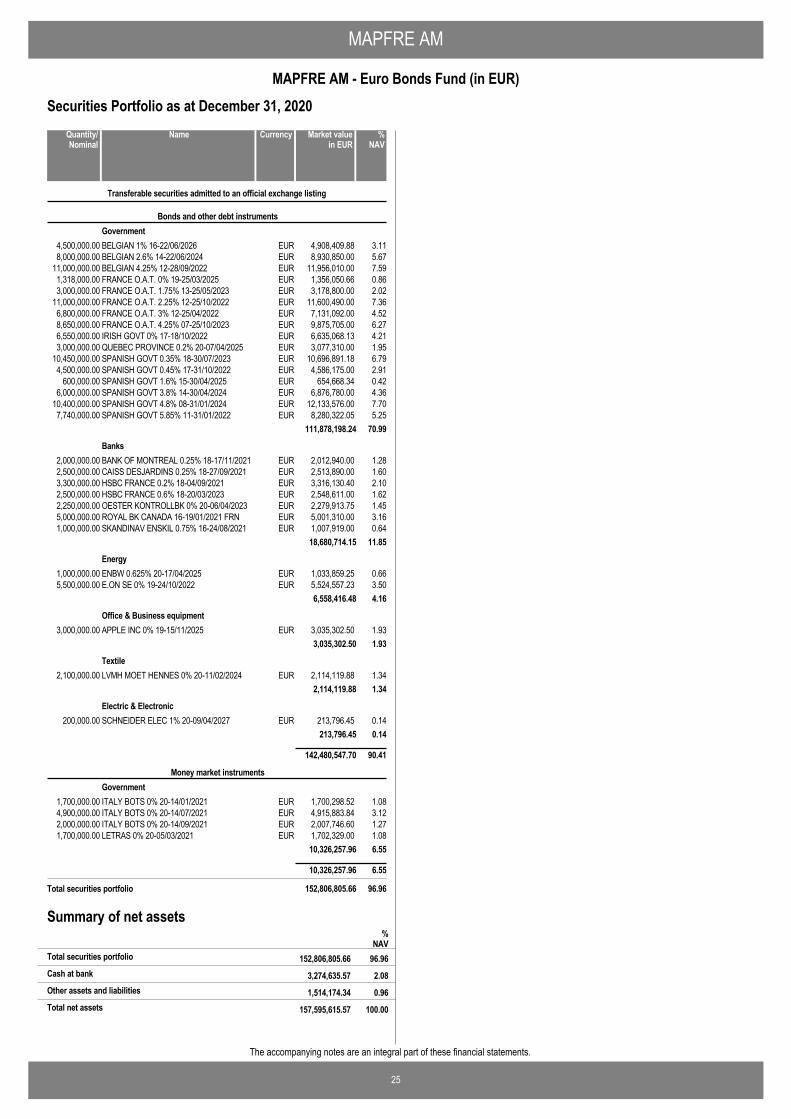
Securities Portfolio as at December 31, 2020
BELGIAN 1% 16-22/06/2026 EUR 4,908,409.88 3.114,500,000.00
Transferable securities admitted to an official exchange listing
Bonds and other debt instrumentsGovernment
BELGIAN 2.6% 14-22/06/2024 EUR 8,930,850.00 5.678,000,000.00BELGIAN 4.25% 12-28/09/2022 EUR 11,956,010.00 7.5911,000,000.00FRANCE O.A.T. 0% 19-25/03/2025 EUR 1,356,050.66 0.861,318,000.00FRANCE O.A.T. 1.75% 13-25/05/2023 EUR 3,178,800.00 2.023,000,000.00FRANCE O.A.T. 2.25% 12-25/10/2022 EUR 11,600,490.00 7.3611,000,000.00FRANCE O.A.T. 3% 12-25/04/2022 EUR 7,131,092.00 4.526,800,000.00FRANCE O.A.T. 4.25% 07-25/10/2023 EUR 9,875,705.00 6.278,650,000.00IRISH GOVT 0% 17-18/10/2022 EUR 6,635,068.13 4.216,550,000.00QUEBEC PROVINCE 0.2% 20-07/04/2025 EUR 3,077,310.00 1.953,000,000.00SPANISH GOVT 0.35% 18-30/07/2023 EUR 10,696,891.18 6.7910,450,000.00SPANISH GOVT 0.45% 17-31/10/2022 EUR 4,586,175.00 2.914,500,000.00SPANISH GOVT 1.6% 15-30/04/2025 EUR 654,668.34 0.42600,000.00SPANISH GOVT 3.8% 14-30/04/2024 EUR 6,876,780.00 4.366,000,000.00SPANISH GOVT 4.8% 08-31/01/2024 EUR 12,133,576.00 7.7010,400,000.00SPANISH GOVT 5.85% 11-31/01/2022 EUR 8,280,322.05 5.257,740,000.00
111,878,198.24 70.99
BANK OF MONTREAL 0.25% 18-17/11/2021 EUR 2,012,940.00 1.282,000,000.00Banks
CAISS DESJARDINS 0.25% 18-27/09/2021 EUR 2,513,890.00 1.602,500,000.00HSBC FRANCE 0.2% 18-04/09/2021 EUR 3,316,130.40 2.103,300,000.00HSBC FRANCE 0.6% 18-20/03/2023 EUR 2,548,611.00 1.622,500,000.00OESTER KONTROLLBK 0% 20-06/04/2023 EUR 2,279,913.75 1.452,250,000.00ROYAL BK CANADA 16-19/01/2021 FRN EUR 5,001,310.00 3.165,000,000.00SKANDINAV ENSKIL 0.75% 16-24/08/2021 EUR 1,007,919.00 0.641,000,000.00
18,680,714.15 11.85
ENBW 0.625% 20-17/04/2025 EUR 1,033,859.25 0.661,000,000.00Energy
E.ON SE 0% 19-24/10/2022 EUR 5,524,557.23 3.505,500,000.006,558,416.48 4.16
APPLE INC 0% 19-15/11/2025 EUR 3,035,302.50 1.933,000,000.00Office & Business equipment
3,035,302.50 1.93
LVMH MOET HENNES 0% 20-11/02/2024 EUR 2,114,119.88 1.342,100,000.00Textile
2,114,119.88 1.34
SCHNEIDER ELEC 1% 20-09/04/2027 EUR 213,796.45 0.14200,000.00Electric & Electronic
213,796.45 0.14
142,480,547.70 90.41
ITALY BOTS 0% 20-14/01/2021 EUR 1,700,298.52 1.081,700,000.00
Money market instrumentsGovernment
ITALY BOTS 0% 20-14/07/2021 EUR 4,915,883.84 3.124,900,000.00ITALY BOTS 0% 20-14/09/2021 EUR 2,007,746.60 1.272,000,000.00LETRAS 0% 20-05/03/2021 EUR 1,702,329.00 1.081,700,000.00
10,326,257.96 6.55
10,326,257.96 6.55
Total securities portfolio 152,806,805.66 96.96
NameQuantity/Nominal
Market valuein EUR
Currency %NAV
Summary of net assets%
NAV152,806,805.66 96.96Total securities portfolio
3,274,635.57 2.08Cash at bank
1,514,174.34 0.96Other assets and liabilities
157,595,615.57 100.00Total net assets
26
The accompanying notes are an integral part of these financial statements.
MAPFRE AM
MAPFRE AM - Short Term Euro (in EUR)Statement of Operations and Changes in Net Assets for theyear ended December 31, 2020
EUR
AssetsInvestment in securities at cost 57,439,459.67Unrealised appreciation / (depreciation) on securities (286,418.76)
Investment in securities at market value 2 57,153,040.91Cash at bank 584,079.50Dividends and interest receivable 175,583.17
Total assets 57,912,703.58
LiabilitiesAccrued expenses 26,361.73
Total liabilities 26,361.73
Net assets at the end of the year 57,886,341.85
Statement of Net Assets as at December 31, 2020
IncomeInterest on bonds 2 499,319.27Bank interest 91.32
Total income 499,410.59
ExpensesInvestment manager fees 3 91,596.97Depositary fees 5 10,542.56Management company fees 3 19,026.47Administration fees 5 31,898.40Professional fees 10,026.48Transaction costs 6 9.48Taxe d'abonnement 4 5,983.03Bank interest and charges 19,782.12Other expenses 6,000.19Risk monitoring fees 7,685.46Transfer agent fees 5,391.22
Total expenses 207,942.38
Net investment income / (loss) 291,468.21
Net realised gain / (loss) on: Investments 2 (746,046.14)Futures contracts 680.00
Net realised gain / (loss) for the year (453,897.93)
Net change in unrealised appreciation / (depreciation) on: Investments 2 164,206.23
Increase / (Decrease) in net assets as a result ofoperations
(289,691.70)
Proceeds received on subscription of shares 868,956.55Net amount paid on redemption of shares (6,932,752.22)Net assets at the beginning of the year 64,239,829.22
Net assets at the end of the year 57,886,341.85
EUR
Statement of Operations and Changes in Net Assets forthe year ended December 31, 2020
Number of shares in issue atthe end of the year
Number of shares in issue atthe beginning of the year
Number of sharessubscribed
Number of sharesredeemed
Statement of Changes in Number of Shares
Class I EUR 6,448,067.68 87,569.95 (697,862.93) 5,837,774.70
MAPFRE AM
27
MAPFRE AM - Short Term Euro (in EUR)
The accompanying notes are an integral part of these financial statements.
Securities Portfolio as at December 31, 2020
ITALY BOTS 0% 20-12/02/2021 EUR 3,602,451.78 6.223,600,000.00
Transferable securities admitted to an official exchange listing
Money market instrumentsGovernment
ITALY BOTS 0% 20-14/04/2021 EUR 8,685,411.79 14.998,670,000.00ITALY BOTS 0% 20-14/05/2021 EUR 4,009,049.80 6.934,000,000.00ITALY BOTS 0% 20-14/07/2021 EUR 3,009,724.80 5.203,000,000.00ITALY BOTS 0% 20-14/12/2021 EUR 3,919,290.18 6.773,900,000.00LETRAS 0% 20-07/05/2021 EUR 2,505,900.00 4.332,500,000.00LETRAS 0% 20-10/12/2021 EUR 6,036,750.00 10.436,000,000.00
31,768,578.35 54.87
ACCIONA FIN FILIAL 0% 28/01/2021 EUR 299,984.21 0.52300,000.00Building materials
ACCIONA SA 0% 14/01/2021 EUR 999,981.97 1.731,000,000.001,299,966.18 2.25
TELEFONICA SA 0% 19/04/2021 EUR 1,101,239.26 1.901,100,000.00Telecommunication
1,101,239.26 1.90
IM VALL 1 FDT 0% 20/01/2021 EUR 399,958.35 0.69400,000.00Banks
IM VALL 1 FDT 0% 20/05/2021 EUR 299,543.97 0.52300,000.00IM VALL 1 FDT 0% 22/02/2021 EUR 299,914.50 0.52300,000.00
999,416.82 1.73
35,169,200.61 60.75
SPANISH GOVT 0.05% 18-31/10/2021 EUR 6,032,328.00 10.436,000,000.00
Bonds and other debt instrumentsGovernment
SPANISH GOVT 0.4% 17-30/04/2022 EUR 101,382.00 0.18100,000.00SPANISH GOVT 0.45% 17-31/10/2022 EUR 1,885,427.50 3.261,850,000.00SPANISH GOVT 5.4% 13-31/01/2023 EUR 191,280.60 0.33170,000.00SPANISH GOVT 5.5% 11-30/04/2021 EUR 3,053,294.68 5.272,995,000.00
11,263,712.78 19.47
ABN AMRO BANK NV 6.375% 11-27/04/2021 EUR 306,016.80 0.53300,000.00Banks
BANK OF AMER CRP 1.625% 15-14/09/2022 EUR 722,709.61 1.25700,000.00BANK OF MONTREAL 0.25% 18-17/11/2021 EUR 503,235.00 0.87500,000.00CITIGROUP INC 16-24/05/2021 FRN EUR 601,889.40 1.04600,000.00DEUTSCHE BANK AG 0.375% 18-18/01/2021
EUR 800,174.40 1.38800,000.00
INT SANPL LUX 19-26/09/2021 FRN EUR 601,610.97 1.04600,000.00MORGAN STANLEY 2.375% 14-31/03/2021 EUR 302,013.00 0.52300,000.00UBS AG LONDON 18-23/04/2021 FRN EUR 800,938.40 1.38800,000.00
4,638,587.58 8.01
ASTRAZENECA PLC 0.875% 14-24/11/2021 EUR 808,876.00 1.39800,000.00Cosmetics
GLAXOSMITHKLINE 0.000001% 19-23/09/2021
EUR 601,427.40 1.04600,000.00
SVENSKA CELLULOS 0.5% 16-26/05/2021 EUR 651,776.45 1.13650,000.002,062,079.85 3.56
SANTAN CONS FIN 0.5% 17-04/10/2021 EUR 402,806.80 0.70400,000.00Financial services
SANTAN CONS FIN 1% 16-26/05/2021 EUR 502,935.50 0.86500,000.00905,742.30 1.56
ACS ACTIVIDADES 0.375% 19-08/03/2021 EUR 300,967.65 0.52300,000.00Building materials
FERROVIAL EMISIO 3.375% 13-07/06/2021 EUR 304,386.60 0.53300,000.00605,354.25 1.05
IBM CORP 0.5% 16-07/09/2021 EUR 603,682.20 1.04600,000.00Office & Business equipment
603,682.20 1.04
NameQuantity/Nominal
Market valuein EUR
Currency %NAV
VIVENDI SA 0% 19-13/06/2022 EUR 602,417.40 1.04600,000.00Media
602,417.40 1.04
MONDELEZ INT INC 2.375% 13-26/01/2021 EUR 600,942.60 1.04600,000.00Food services
600,942.60 1.04
MCDONALDS CORP 0.5% 16-15/01/2021 EUR 500,069.50 0.86500,000.00Distribution & Wholesale
500,069.50 0.86
SIEMENS FINAN 0.125% 20-05/06/2022 EUR 201,251.84 0.35200,000.00Diversified machinery
201,251.84 0.35
21,983,840.30 37.98
Total securities portfolio 57,153,040.91 98.73
NameQuantity/Nominal
Market valuein EUR
Currency %NAV
Summary of net assets%
NAV57,153,040.91 98.73Total securities portfolio
584,079.50 1.01Cash at bank
149,221.44 0.26Other assets and liabilities
57,886,341.85 100.00Total net assets
28
The accompanying notes are an integral part of these financial statements.
MAPFRE AM
MAPFRE AM - Inclusion Responsable Fund (in EUR)Statement of Operations and Changes in Net Assets for theyear ended December 31, 2020
EUR
AssetsInvestment in securities at cost 23,258,256.53Unrealised appreciation / (depreciation) on securities 2,143,770.73
Investment in securities at market value 2 25,402,027.26Cash at bank 283,487.58Receivable on Fund shares sold 6,000.00Receivable on withholding tax reclaim 1,866.86
Total assets 25,693,381.70
LiabilitiesAccrued expenses 196,801.22
Total liabilities 196,801.22
Net assets at the end of the year 25,496,580.48
Statement of Net Assets as at December 31, 2020
IncomeDividends (net of withholding taxes) 2 127,869.40
Total income 127,869.40
ExpensesInvestment manager fees 3 64,050.94Depositary fees 5 11,597.42Performance fees 13 170,947.93Management company fees 3 4,090.16Administration fees 5 37,469.84Professional fees 1,332.75Transaction costs 6 53,650.28Taxe d'abonnement 4 1,661.91Bank interest and charges 10,049.54Other expenses 1,073.58Risk monitoring fees 7,000.99Transfer agent fees 5,660.33
Total expenses 368,585.67
Net investment income / (loss) (240,716.27)
Net realised gain / (loss) on: Investments 2 (392,185.08)Foreign currencies transactions 2 (516.44)
Net realised gain / (loss) for the year (633,417.79)
Net change in unrealised appreciation / (depreciation) on: Investments 2 1,934,454.71
Increase / (Decrease) in net assets as a result ofoperations
1,301,036.92
Proceeds received on subscription of shares 14,331,418.52Net amount paid on redemption of shares (323,033.73)Net assets at the beginning of the year 10,187,158.77
Net assets at the end of the year 25,496,580.48
EUR
Statement of Operations and Changes in Net Assets forthe year ended December 31, 2020
Number of shares in issue atthe end of the year
Number of shares in issue atthe beginning of the year
Number of sharessubscribed
Number of sharesredeemed
Statement of Changes in Number of Shares
Class I EUR 100,000.00 140,922.51 (3,151.01) 237,771.50
Class R EUR 1,218.11 78,129.77 (2,691.47) 76,656.41
MAPFRE AM
29
MAPFRE AM - Inclusion Responsable Fund (in EUR)
The accompanying notes are an integral part of these financial statements.
Securities Portfolio as at December 31, 2020
BIOMERIEUX EUR 852,806.00 3.347,390.00
Transferable securities admitted to an official exchange listing
SharesCosmetics
LOREAL EUR 1,164,256.80 4.563,746.00NOVO NORDISK A/S-B DKK 990,928.29 3.8917,288.00ORPEA EUR 1,151,215.20 4.5210,704.00
4,159,206.29 16.31
ASML HOLDING NV EUR 1,278,520.80 5.023,216.00Electric & Electronic
LEGRAND SA EUR 756,718.00 2.9710,366.00SCHNEIDER ELECTRIC SE EUR 1,020,810.70 4.008,629.00STMICROELECTRONICS NV EUR 888,112.40 3.4829,330.00
3,944,161.90 15.47
ALTEN SA EUR 499,568.80 1.965,392.00Computer software
CAPGEMINI SE EUR 1,065,754.00 4.188,405.00SAP SE EUR 1,300,900.26 5.1012,133.00
2,866,223.06 11.24
KERING EUR 1,080,024.80 4.241,817.00Textile
LVMH MOET HENNESSY LOUIS VUI EUR 1,308,925.80 5.132,562.002,388,950.60 9.37
AIR LIQUIDE SA EUR 1,013,856.00 3.987,552.00Chemical
LINDE PLC EUR 1,161,489.00 4.555,453.002,175,345.00 8.53
FALCK RENEWABLES SPA EUR 683,607.06 2.68103,734.00Energy
IBERDROLA SA EUR 1,167,765.30 4.5899,809.001,851,372.36 7.26
BNP PARIBAS EUR 855,504.94 3.3519,847.00Banks
CREDIT AGRICOLE SA EUR 850,770.48 3.3482,439.001,706,275.42 6.69
CARREFOUR SA EUR 912,819.86 3.5865,062.00Food services
KERRY GROUP PLC-A EUR 622,125.00 2.445,250.001,534,944.86 6.02
COMPAGNIE DE SAINT GOBAIN EUR 627,375.00 2.4616,730.00Building materials
VINCI SA EUR 631,353.60 2.487,760.001,258,728.60 4.94
DEUTSCHE TELEKOM AG-REG EUR 1,026,391.56 4.0368,632.00Telecommunication
1,026,391.56 4.03
MICHELIN (CGDE) EUR 745,984.60 2.937,108.00Auto Parts & Equipment
745,984.60 2.93
SAFRAN SA EUR 630,768.00 2.475,440.00Engineering & Construction
630,768.00 2.47
JCDECAUX SA EUR 620,882.01 2.4433,327.00Advertising
620,882.01 2.44
WORLDLINE SA - W/I EUR 492,793.00 1.936,230.00Diversified services
492,793.00 1.93
25,402,027.26 99.63
NameQuantity/Nominal
Market valuein EUR
Currency %NAV
Total securities portfolio 25,402,027.26 99.63
NameQuantity/Nominal
Market valuein EUR
Currency %NAV
Summary of net assets%
NAV25,402,027.26 99.63Total securities portfolio
283,487.58 1.11Cash at bank
(188,934.36) (0.74)Other assets and liabilities
25,496,580.48 100.00Total net assets

30
The accompanying notes are an integral part of these financial statements.
MAPFRE AM
MAPFRE AM - US Forgotten Value Fund (in EUR)Statement of Operations and Changes in Net Assets for theyear ended December 31, 2020
EUR
AssetsInvestment in securities at cost 25,903,602.42Unrealised appreciation / (depreciation) on securities 1,953,624.16
Investment in securities at market value 2 27,857,226.58Cash at bank 2,320,726.17Dividends and interest receivable 4,807.76
Total assets 30,182,760.51
LiabilitiesAccrued expenses 43,139.90Payable on fund shares repurchased 109.06
Total liabilities 43,248.96
Net assets at the end of the year 30,139,511.55
Statement of Net Assets as at December 31, 2020
IncomeDividends (net of withholding taxes) 2 364,560.08Bank interest 4,650.71
Total income 369,210.79
ExpensesInvestment manager fees 3 327,553.48Depositary fees 5 10,993.92Management company fees 3 10,353.64Administration fees 5 38,788.76Professional fees 3,295.28Transaction costs 6 5,769.71Taxe d'abonnement 4 2,637.13Bank interest and charges 15,342.70Other expenses 2,481.36Risk monitoring fees 3,779.26Transfer agent fees 5,952.26
Total expenses 426,947.50
Net investment income / (loss) (57,736.71)
Net realised gain / (loss) on: Investments 2 (2,285,326.95)Foreign currencies transactions 2 (60,763.92)
Net realised gain / (loss) for the year (2,403,827.58)
Net change in unrealised appreciation / (depreciation) on: Investments 2 1,642,350.74
Increase / (Decrease) in net assets as a result ofoperations
(761,476.84)
Proceeds received on subscription of shares 1,047,272.13Net amount paid on redemption of shares (395,684.73)Net assets at the beginning of the year 30,249,400.99
Net assets at the end of the year 30,139,511.55
EUR
Statement of Operations and Changes in Net Assets forthe year ended December 31, 2020
Number of shares in issue atthe end of the year
Number of shares in issue atthe beginning of the year
Number of sharessubscribed
Number of sharesredeemed
Statement of Changes in Number of Shares
Class I EUR 3,000,000.00 62,499.99 (30,625.10) 3,031,874.89
Class R EUR 10.00 72,662.70 (17,981.35) 54,691.35
MAPFRE AM
31
MAPFRE AM - US Forgotten Value Fund (in EUR)
The accompanying notes are an integral part of these financial statements.
Securities Portfolio as at December 31, 2020
AMC NETWORKS INC-A USD 211,453.89 0.707,233.00
Transferable securities admitted to an official exchange listing
SharesMedia
COMCAST CORP-CLASS A USD 722,435.21 2.4016,869.00DISCOVERY INC-C USD 614,150.20 2.0428,692.00FOX CORP - CLASS A USD 493,484.70 1.6420,735.00LIBERTY BROADBAND C-W/I USD 539,225.55 1.794,166.00LIBERTY MEDIA CORP-BRAVES C USD 521,513.11 1.7325,647.00LIBERTY MEDIA COR-SIRIUSXM A USD 534,637.52 1.7715,146.00MADISON SQUARE GARD-A/NEW-WI USD 497,513.40 1.6541,298.00MADISON SQUARE GARDEN ENTERT USD 646,611.32 2.157,532.00NEWS CORP/NEW-CL A-W/I USD 918,554.79 3.0562,543.00WALT DISNEY Co USD 814,425.24 2.705,500.00
6,514,004.93 21.62
CVS HEALTH CORP USD 910,387.56 3.0216,309.00Distribution & Wholesale
DOLLAR TREE INC USD 553,202.24 1.846,265.00QURATE RETAIL INC-SERIES A USD 611,883.12 2.0368,247.00QURATE RETAIL 8% 20-15/03/2031 USD 271,783.74 0.903,359.00SCOTTS MIRACLE-GRO CO USD 601,708.62 2.003,697.00STARBUCKS CORP USD 832,372.69 2.769,520.00UNIVAR SOLUTIONS INC USD 652,730.27 2.1742,012.00WATSCO INC USD 307,362.18 1.021,660.00
4,741,430.42 15.74
ALPHABET INC-CL A USD 143,242.21 0.48100.00Internet
ANGI HOMESERVICES INC- A USD 903,370.32 2.9983,768.00EBAY INC USD 696,037.76 2.3116,948.00IAC/INTERACTIVECORP USD 704,752.48 2.344,554.00MATCH GROUP INC USD 342,032.54 1.132,768.00TWITTER INC USD 466,905.73 1.5510,550.00
3,256,341.04 10.80
HANESBRANDS INC USD 628,028.54 2.0852,704.00Textile
LEVI STRAUSS & CO- CLASS A USD 506,451.55 1.6830,860.00MOHAWK INDUSTRIES INC USD 982,289.77 3.268,527.00UNIFIRST CORP/MA USD 282,011.12 0.941,630.00
2,398,780.98 7.96
ALBEMARLE CORP USD 1,222,551.43 4.0610,140.00Chemical
DUPONT DE NEMOURS INC USD 1,127,949.72 3.7419,408.002,350,501.15 7.80
BANK OF AMERICA CORP USD 856,299.92 2.8434,567.00Banks
JPMORGAN CHASE & CO USD 711,708.32 2.366,853.001,568,008.24 5.20
BERKSHIRE HATHAWAY INC-CL B USD 680,326.35 2.263,590.00Insurance
CHUBB LTD USD 710,758.04 2.365,650.001,391,084.39 4.62
ACUSHNET HOLDINGS CORP USD 817,592.28 2.7124,676.00Diversified services
817,592.28 2.71
COCA-COLA CO/THE USD 397,556.95 1.328,870.00Food services
SYSCO CORP USD 328,345.06 1.095,410.00725,902.01 2.41
HOWARD HUGHES CORP/THE USD 628,188.75 2.089,738.00Real estate
TRINITY PLACE HOLDINGS INC USD 30,001.84 0.1029,367.00658,190.59 2.18
NameQuantity/Nominal
Market valuein EUR
Currency %NAV
CONDUENT INC USD 630,035.55 2.09160,600.00Office & Business equipment
630,035.55 2.09
MADISON SQUARE GARDEN SPORTS USD 570,558.78 1.893,792.00Entertainment
570,558.78 1.89
CISCO SYSTEMS INC USD 524,835.52 1.7414,350.00Telecommunication
524,835.52 1.74
JOHNSON & JOHNSON USD 261,110.21 0.862,030.00Cosmetics
PFIZER INC USD 243,384.33 0.818,090.00VIATRIS INC USD 15,362.04 0.051,003.00
519,856.58 1.72
WESTERN UNION CO USD 482,265.78 1.6026,895.00Financial services
482,265.78 1.60
MICRON TECHNOLOGY INC USD 369,893.83 1.236,020.00Electric & Electronic
369,893.83 1.23
MUELLER WATER PRODUCTS INC-A USD 337,944.51 1.1233,400.00Auto Parts & Equipment
337,944.51 1.12
27,857,226.58 92.43
Total securities portfolio 27,857,226.58 92.43
NameQuantity/Nominal
Market valuein EUR
Currency %NAV
Summary of net assets%
NAV27,857,226.58 92.43Total securities portfolio
2,320,726.17 7.70Cash at bank
(38,441.20) (0.13)Other assets and liabilities
30,139,511.55 100.00Total net assets
32
The accompanying notes are an integral part of these financial statements.
MAPFRE AM
MAPFRE AM - European Equities (in EUR)Statement of Operations and Changes in Net Assets for theyear ended December 31, 2020
EUR
AssetsInvestment in securities at cost 100,195,229.15Unrealised appreciation / (depreciation) on securities 17,607,410.50
Investment in securities at market value 2 117,802,639.65Cash at bank 4,264,867.04Receivable on Fund shares sold 1,500.00Receivable on withholding tax reclaim 135,580.90Net unrealised appreciation on futures contracts 9 4,050.00Dividends and interest receivable 78,612.75
Total assets 122,287,250.34
LiabilitiesAccrued expenses 164,777.47
Total liabilities 164,777.47
Net assets at the end of the year 122,122,472.87
Statement of Net Assets as at December 31, 2020
IncomeDividends (net of withholding taxes) 2 2,198,495.71Interest on bonds 2 3,471.96Bank interest 448.08
Total income 2,202,415.75
ExpensesInvestment manager fees 3 1,402,177.79Depositary fees 5 18,729.35Management company fees 3 36,675.31Administration fees 5 50,623.67Professional fees 13,981.33Transaction costs 6 148,851.56Taxe d'abonnement 4 11,018.08Bank interest and charges 50,016.02Other expenses 9,673.25Risk monitoring fees 9,001.20Transfer agent fees 5,429.57
Total expenses 1,756,177.13
Net investment income / (loss) 446,238.62
Net realised gain / (loss) on: Investments 2 3,094,590.89Foreign currencies transactions 2 (43,654.16)Futures contracts (925,192.50)Forward foreign exchange contracts 396.14
Net realised gain / (loss) for the year 2,572,378.99
Net change in unrealised appreciation / (depreciation) on: Investments 2 5,683,265.40Futures contracts 9,190.00
Increase / (Decrease) in net assets as a result ofoperations
8,264,834.39
Proceeds received on subscription of shares 47,704,214.46Net amount paid on redemption of shares (35,766,208.31)Net assets at the beginning of the year 101,919,632.33
Net assets at the end of the year 122,122,472.87
EUR
Statement of Operations and Changes in Net Assets forthe year ended December 31, 2020
Number of shares in issue atthe end of the year
Number of shares in issue atthe beginning of the year
Number of sharessubscribed
Number of sharesredeemed
Statement of Changes in Number of Shares
Class I EUR 8,910,704.98 4,904,415.40 (3,280,257.58) 10,534,862.80
Class R EUR 4,112.72 125.61 (462.92) 3,775.41
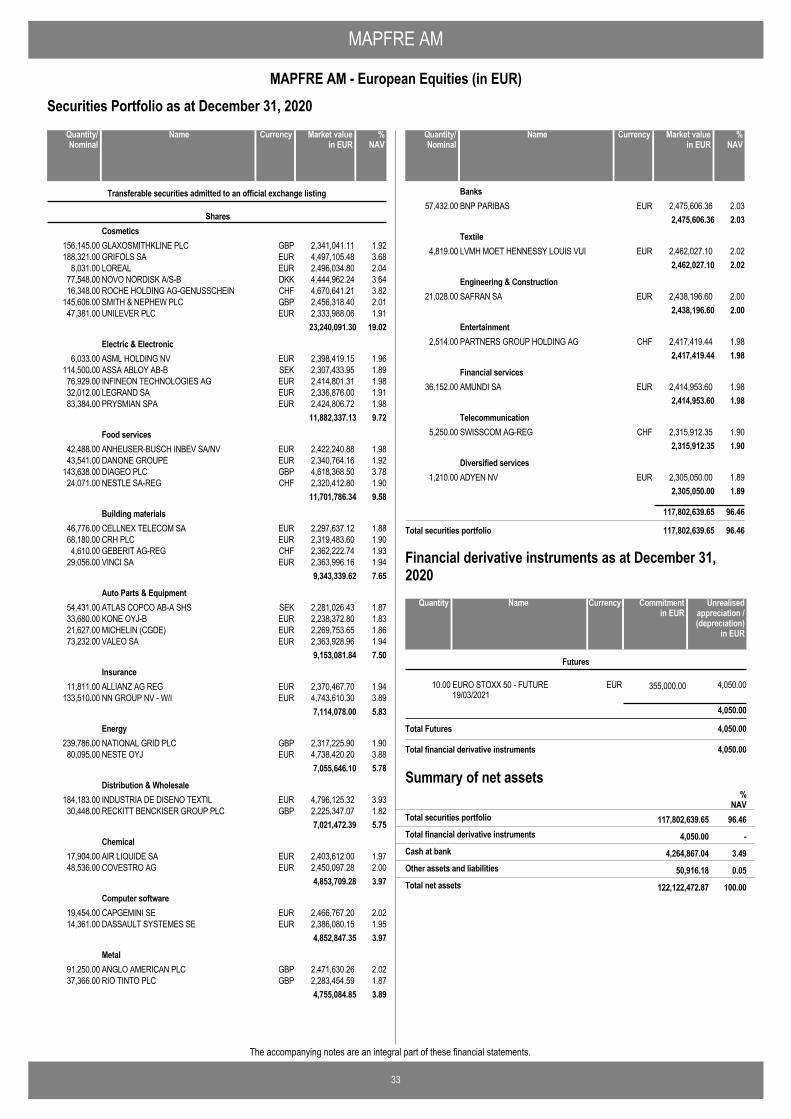
MAPFRE AM
33
MAPFRE AM - European Equities (in EUR)
The accompanying notes are an integral part of these financial statements.
Securities Portfolio as at December 31, 2020
GLAXOSMITHKLINE PLC GBP 2,341,041.11 1.92156,145.00
Transferable securities admitted to an official exchange listing
SharesCosmetics
GRIFOLS SA EUR 4,497,105.48 3.68188,321.00LOREAL EUR 2,496,034.80 2.048,031.00NOVO NORDISK A/S-B DKK 4,444,962.24 3.6477,548.00ROCHE HOLDING AG-GENUSSCHEIN CHF 4,670,641.21 3.8216,348.00SMITH & NEPHEW PLC GBP 2,456,318.40 2.01145,606.00UNILEVER PLC EUR 2,333,988.06 1.9147,381.00
23,240,091.30 19.02
ASML HOLDING NV EUR 2,398,419.15 1.966,033.00Electric & Electronic
ASSA ABLOY AB-B SEK 2,307,433.95 1.89114,500.00INFINEON TECHNOLOGIES AG EUR 2,414,801.31 1.9876,929.00LEGRAND SA EUR 2,336,876.00 1.9132,012.00PRYSMIAN SPA EUR 2,424,806.72 1.9883,384.00
11,882,337.13 9.72
ANHEUSER-BUSCH INBEV SA/NV EUR 2,422,240.88 1.9842,488.00Food services
DANONE GROUPE EUR 2,340,764.16 1.9243,541.00DIAGEO PLC GBP 4,618,368.50 3.78143,638.00NESTLE SA-REG CHF 2,320,412.80 1.9024,071.00
11,701,786.34 9.58
CELLNEX TELECOM SA EUR 2,297,637.12 1.8846,776.00Building materials
CRH PLC EUR 2,319,483.60 1.9068,180.00GEBERIT AG-REG CHF 2,362,222.74 1.934,610.00VINCI SA EUR 2,363,996.16 1.9429,056.00
9,343,339.62 7.65
ATLAS COPCO AB-A SHS SEK 2,281,026.43 1.8754,431.00Auto Parts & Equipment
KONE OYJ-B EUR 2,238,372.80 1.8333,680.00MICHELIN (CGDE) EUR 2,269,753.65 1.8621,627.00VALEO SA EUR 2,363,928.96 1.9473,232.00
9,153,081.84 7.50
ALLIANZ AG REG EUR 2,370,467.70 1.9411,811.00Insurance
NN GROUP NV - W/I EUR 4,743,610.30 3.89133,510.007,114,078.00 5.83
NATIONAL GRID PLC GBP 2,317,225.90 1.90239,786.00Energy
NESTE OYJ EUR 4,738,420.20 3.8880,095.007,055,646.10 5.78
INDUSTRIA DE DISENO TEXTIL EUR 4,796,125.32 3.93184,183.00Distribution & Wholesale
RECKITT BENCKISER GROUP PLC GBP 2,225,347.07 1.8230,448.007,021,472.39 5.75
AIR LIQUIDE SA EUR 2,403,612.00 1.9717,904.00Chemical
COVESTRO AG EUR 2,450,097.28 2.0048,536.004,853,709.28 3.97
CAPGEMINI SE EUR 2,466,767.20 2.0219,454.00Computer software
DASSAULT SYSTEMES SE EUR 2,386,080.15 1.9514,361.004,852,847.35 3.97
ANGLO AMERICAN PLC GBP 2,471,630.26 2.0291,250.00Metal
RIO TINTO PLC GBP 2,283,454.59 1.8737,366.004,755,084.85 3.89
NameQuantity/Nominal
Market valuein EUR
Currency %NAV
BNP PARIBAS EUR 2,475,606.36 2.0357,432.00Banks
2,475,606.36 2.03
LVMH MOET HENNESSY LOUIS VUI EUR 2,462,027.10 2.024,819.00Textile
2,462,027.10 2.02
SAFRAN SA EUR 2,438,196.60 2.0021,028.00Engineering & Construction
2,438,196.60 2.00
PARTNERS GROUP HOLDING AG CHF 2,417,419.44 1.982,514.00Entertainment
2,417,419.44 1.98
AMUNDI SA EUR 2,414,953.60 1.9836,152.00Financial services
2,414,953.60 1.98
SWISSCOM AG-REG CHF 2,315,912.35 1.905,250.00Telecommunication
2,315,912.35 1.90
ADYEN NV EUR 2,305,050.00 1.891,210.00Diversified services
2,305,050.00 1.89
117,802,639.65 96.46
Total securities portfolio 117,802,639.65 96.46
NameQuantity/Nominal
Market valuein EUR
Currency %NAV
EURO STOXX 50 - FUTURE19/03/2021
EUR 355,000.0010.00 4,050.00
Futures
4,050.00
Total Futures 4,050.00
NameQuantity Commitmentin EUR
Currency Unrealisedappreciation /(depreciation)
in EUR
Financial derivative instruments as at December 31,2020
Total financial derivative instruments 4,050.00
Summary of net assets
4,050.00 -Total financial derivative instruments
%NAV
117,802,639.65 96.46Total securities portfolio
4,264,867.04 3.49Cash at bank
50,916.18 0.05Other assets and liabilities
122,122,472.87 100.00Total net assets
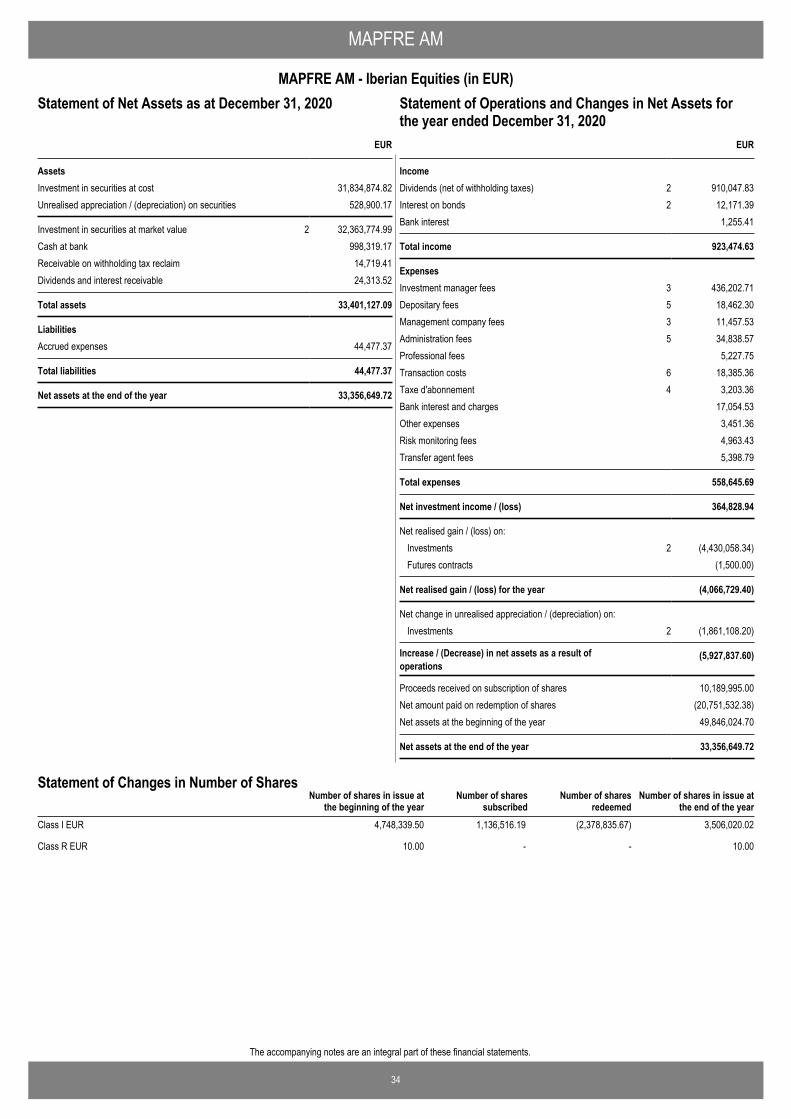
34
The accompanying notes are an integral part of these financial statements.
MAPFRE AM
MAPFRE AM - Iberian Equities (in EUR)Statement of Operations and Changes in Net Assets for theyear ended December 31, 2020
EUR
AssetsInvestment in securities at cost 31,834,874.82Unrealised appreciation / (depreciation) on securities 528,900.17
Investment in securities at market value 2 32,363,774.99Cash at bank 998,319.17Receivable on withholding tax reclaim 14,719.41Dividends and interest receivable 24,313.52
Total assets 33,401,127.09
LiabilitiesAccrued expenses 44,477.37
Total liabilities 44,477.37
Net assets at the end of the year 33,356,649.72
Statement of Net Assets as at December 31, 2020
IncomeDividends (net of withholding taxes) 2 910,047.83Interest on bonds 2 12,171.39Bank interest 1,255.41
Total income 923,474.63
ExpensesInvestment manager fees 3 436,202.71Depositary fees 5 18,462.30Management company fees 3 11,457.53Administration fees 5 34,838.57Professional fees 5,227.75Transaction costs 6 18,385.36Taxe d'abonnement 4 3,203.36Bank interest and charges 17,054.53Other expenses 3,451.36Risk monitoring fees 4,963.43Transfer agent fees 5,398.79
Total expenses 558,645.69
Net investment income / (loss) 364,828.94
Net realised gain / (loss) on: Investments 2 (4,430,058.34)Futures contracts (1,500.00)
Net realised gain / (loss) for the year (4,066,729.40)
Net change in unrealised appreciation / (depreciation) on: Investments 2 (1,861,108.20)
Increase / (Decrease) in net assets as a result ofoperations
(5,927,837.60)
Proceeds received on subscription of shares 10,189,995.00Net amount paid on redemption of shares (20,751,532.38)Net assets at the beginning of the year 49,846,024.70
Net assets at the end of the year 33,356,649.72
EUR
Statement of Operations and Changes in Net Assets forthe year ended December 31, 2020
Number of shares in issue atthe end of the year
Number of shares in issue atthe beginning of the year
Number of sharessubscribed
Number of sharesredeemed
Statement of Changes in Number of Shares
Class I EUR 4,748,339.50 1,136,516.19 (2,378,835.67) 3,506,020.02
Class R EUR 10.00 - - 10.00
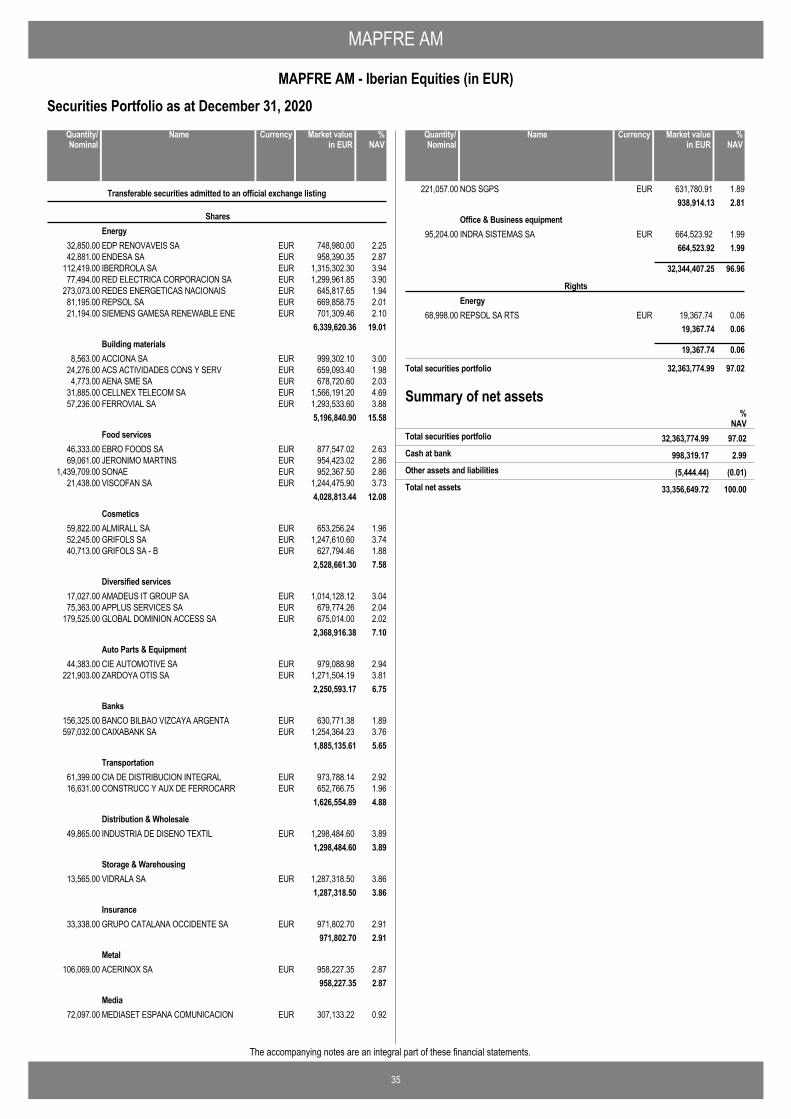
MAPFRE AM
35
MAPFRE AM - Iberian Equities (in EUR)
The accompanying notes are an integral part of these financial statements.
Securities Portfolio as at December 31, 2020
EDP RENOVAVEIS SA EUR 748,980.00 2.2532,850.00
Transferable securities admitted to an official exchange listing
SharesEnergy
ENDESA SA EUR 958,390.35 2.8742,881.00IBERDROLA SA EUR 1,315,302.30 3.94112,419.00RED ELECTRICA CORPORACION SA EUR 1,299,961.85 3.9077,494.00REDES ENERGETICAS NACIONAIS EUR 645,817.65 1.94273,073.00REPSOL SA EUR 669,858.75 2.0181,195.00SIEMENS GAMESA RENEWABLE ENE EUR 701,309.46 2.1021,194.00
6,339,620.36 19.01
ACCIONA SA EUR 999,302.10 3.008,563.00Building materials
ACS ACTIVIDADES CONS Y SERV EUR 659,093.40 1.9824,276.00AENA SME SA EUR 678,720.60 2.034,773.00CELLNEX TELECOM SA EUR 1,566,191.20 4.6931,885.00FERROVIAL SA EUR 1,293,533.60 3.8857,236.00
5,196,840.90 15.58
EBRO FOODS SA EUR 877,547.02 2.6346,333.00Food services
JERONIMO MARTINS EUR 954,423.02 2.8669,061.00SONAE EUR 952,367.50 2.861,439,709.00VISCOFAN SA EUR 1,244,475.90 3.7321,438.00
4,028,813.44 12.08
ALMIRALL SA EUR 653,256.24 1.9659,822.00Cosmetics
GRIFOLS SA EUR 1,247,610.60 3.7452,245.00GRIFOLS SA - B EUR 627,794.46 1.8840,713.00
2,528,661.30 7.58
AMADEUS IT GROUP SA EUR 1,014,128.12 3.0417,027.00Diversified services
APPLUS SERVICES SA EUR 679,774.26 2.0475,363.00GLOBAL DOMINION ACCESS SA EUR 675,014.00 2.02179,525.00
2,368,916.38 7.10
CIE AUTOMOTIVE SA EUR 979,088.98 2.9444,383.00Auto Parts & Equipment
ZARDOYA OTIS SA EUR 1,271,504.19 3.81221,903.002,250,593.17 6.75
BANCO BILBAO VIZCAYA ARGENTA EUR 630,771.38 1.89156,325.00Banks
CAIXABANK SA EUR 1,254,364.23 3.76597,032.001,885,135.61 5.65
CIA DE DISTRIBUCION INTEGRAL EUR 973,788.14 2.9261,399.00Transportation
CONSTRUCC Y AUX DE FERROCARR EUR 652,766.75 1.9616,631.001,626,554.89 4.88
INDUSTRIA DE DISENO TEXTIL EUR 1,298,484.60 3.8949,865.00Distribution & Wholesale
1,298,484.60 3.89
VIDRALA SA EUR 1,287,318.50 3.8613,565.00Storage & Warehousing
1,287,318.50 3.86
GRUPO CATALANA OCCIDENTE SA EUR 971,802.70 2.9133,338.00Insurance
971,802.70 2.91
ACERINOX SA EUR 958,227.35 2.87106,069.00Metal
958,227.35 2.87
MEDIASET ESPANA COMUNICACION EUR 307,133.22 0.9272,097.00Media
NameQuantity/Nominal
Market valuein EUR
Currency %NAV
NOS SGPS EUR 631,780.91 1.89221,057.00938,914.13 2.81
INDRA SISTEMAS SA EUR 664,523.92 1.9995,204.00Office & Business equipment
664,523.92 1.99
32,344,407.25 96.96
REPSOL SA RTS EUR 19,367.74 0.0668,998.00
RightsEnergy
19,367.74 0.06
19,367.74 0.06
Total securities portfolio 32,363,774.99 97.02
NameQuantity/Nominal
Market valuein EUR
Currency %NAV
Summary of net assets%
NAV32,363,774.99 97.02Total securities portfolio
998,319.17 2.99Cash at bank
(5,444.44) (0.01)Other assets and liabilities
33,356,649.72 100.00Total net assets
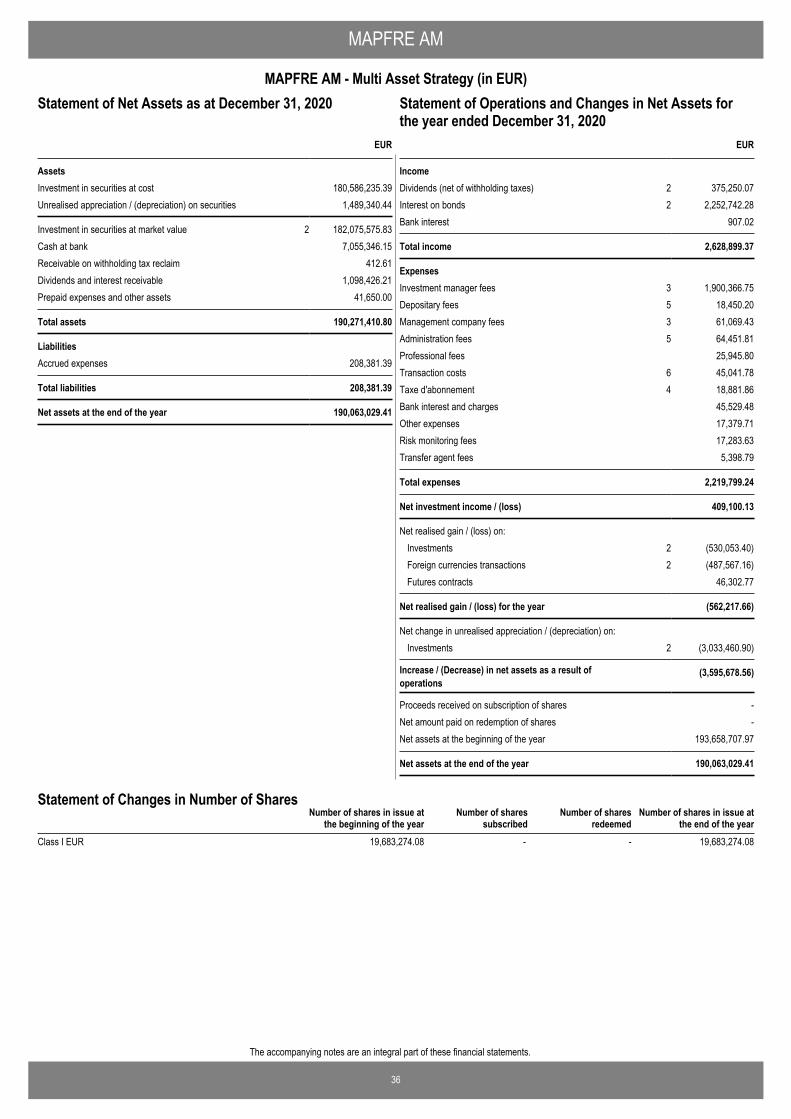
36
The accompanying notes are an integral part of these financial statements.
MAPFRE AM
MAPFRE AM - Multi Asset Strategy (in EUR)Statement of Operations and Changes in Net Assets for theyear ended December 31, 2020
EUR
AssetsInvestment in securities at cost 180,586,235.39Unrealised appreciation / (depreciation) on securities 1,489,340.44
Investment in securities at market value 2 182,075,575.83Cash at bank 7,055,346.15Receivable on withholding tax reclaim 412.61Dividends and interest receivable 1,098,426.21Prepaid expenses and other assets 41,650.00
Total assets 190,271,410.80
LiabilitiesAccrued expenses 208,381.39
Total liabilities 208,381.39
Net assets at the end of the year 190,063,029.41
Statement of Net Assets as at December 31, 2020
IncomeDividends (net of withholding taxes) 2 375,250.07Interest on bonds 2 2,252,742.28Bank interest 907.02
Total income 2,628,899.37
ExpensesInvestment manager fees 3 1,900,366.75Depositary fees 5 18,450.20Management company fees 3 61,069.43Administration fees 5 64,451.81Professional fees 25,945.80Transaction costs 6 45,041.78Taxe d'abonnement 4 18,881.86Bank interest and charges 45,529.48Other expenses 17,379.71Risk monitoring fees 17,283.63Transfer agent fees 5,398.79
Total expenses 2,219,799.24
Net investment income / (loss) 409,100.13
Net realised gain / (loss) on: Investments 2 (530,053.40)Foreign currencies transactions 2 (487,567.16)Futures contracts 46,302.77
Net realised gain / (loss) for the year (562,217.66)
Net change in unrealised appreciation / (depreciation) on: Investments 2 (3,033,460.90)
Increase / (Decrease) in net assets as a result ofoperations
(3,595,678.56)
Proceeds received on subscription of shares -Net amount paid on redemption of shares -Net assets at the beginning of the year 193,658,707.97
Net assets at the end of the year 190,063,029.41
EUR
Statement of Operations and Changes in Net Assets forthe year ended December 31, 2020
Number of shares in issue atthe end of the year
Number of shares in issue atthe beginning of the year
Number of sharessubscribed
Number of sharesredeemed
Statement of Changes in Number of Shares
Class I EUR 19,683,274.08 - - 19,683,274.08
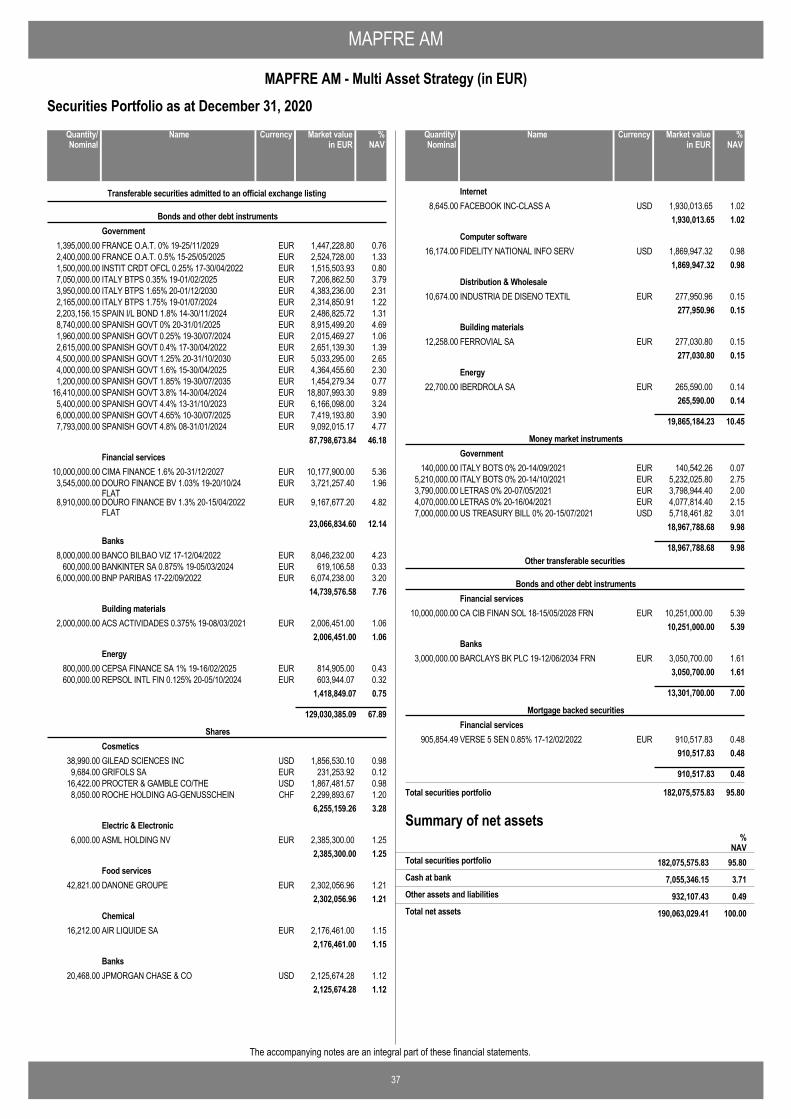
MAPFRE AM
37
MAPFRE AM - Multi Asset Strategy (in EUR)
The accompanying notes are an integral part of these financial statements.
Securities Portfolio as at December 31, 2020
FRANCE O.A.T. 0% 19-25/11/2029 EUR 1,447,228.80 0.761,395,000.00
Transferable securities admitted to an official exchange listing
Bonds and other debt instrumentsGovernment
FRANCE O.A.T. 0.5% 15-25/05/2025 EUR 2,524,728.00 1.332,400,000.00INSTIT CRDT OFCL 0.25% 17-30/04/2022 EUR 1,515,503.93 0.801,500,000.00ITALY BTPS 0.35% 19-01/02/2025 EUR 7,206,862.50 3.797,050,000.00ITALY BTPS 1.65% 20-01/12/2030 EUR 4,383,236.00 2.313,950,000.00ITALY BTPS 1.75% 19-01/07/2024 EUR 2,314,850.91 1.222,165,000.00SPAIN I/L BOND 1.8% 14-30/11/2024 EUR 2,486,825.72 1.312,203,156.15SPANISH GOVT 0% 20-31/01/2025 EUR 8,915,499.20 4.698,740,000.00SPANISH GOVT 0.25% 19-30/07/2024 EUR 2,015,469.27 1.061,960,000.00SPANISH GOVT 0.4% 17-30/04/2022 EUR 2,651,139.30 1.392,615,000.00SPANISH GOVT 1.25% 20-31/10/2030 EUR 5,033,295.00 2.654,500,000.00SPANISH GOVT 1.6% 15-30/04/2025 EUR 4,364,455.60 2.304,000,000.00SPANISH GOVT 1.85% 19-30/07/2035 EUR 1,454,279.34 0.771,200,000.00SPANISH GOVT 3.8% 14-30/04/2024 EUR 18,807,993.30 9.8916,410,000.00SPANISH GOVT 4.4% 13-31/10/2023 EUR 6,166,098.00 3.245,400,000.00SPANISH GOVT 4.65% 10-30/07/2025 EUR 7,419,193.80 3.906,000,000.00SPANISH GOVT 4.8% 08-31/01/2024 EUR 9,092,015.17 4.777,793,000.00
87,798,673.84 46.18
CIMA FINANCE 1.6% 20-31/12/2027 EUR 10,177,900.00 5.3610,000,000.00Financial services
DOURO FINANCE BV 1.03% 19-20/10/24FLAT
EUR 3,721,257.40 1.963,545,000.00
DOURO FINANCE BV 1.3% 20-15/04/2022FLAT
EUR 9,167,677.20 4.828,910,000.00
23,066,834.60 12.14
BANCO BILBAO VIZ 17-12/04/2022 EUR 8,046,232.00 4.238,000,000.00Banks
BANKINTER SA 0.875% 19-05/03/2024 EUR 619,106.58 0.33600,000.00BNP PARIBAS 17-22/09/2022 EUR 6,074,238.00 3.206,000,000.00
14,739,576.58 7.76
ACS ACTIVIDADES 0.375% 19-08/03/2021 EUR 2,006,451.00 1.062,000,000.00Building materials
2,006,451.00 1.06
CEPSA FINANCE SA 1% 19-16/02/2025 EUR 814,905.00 0.43800,000.00Energy
REPSOL INTL FIN 0.125% 20-05/10/2024 EUR 603,944.07 0.32600,000.001,418,849.07 0.75
129,030,385.09 67.89
GILEAD SCIENCES INC USD 1,856,530.10 0.9838,990.00
SharesCosmetics
GRIFOLS SA EUR 231,253.92 0.129,684.00PROCTER & GAMBLE CO/THE USD 1,867,481.57 0.9816,422.00ROCHE HOLDING AG-GENUSSCHEIN CHF 2,299,893.67 1.208,050.00
6,255,159.26 3.28
ASML HOLDING NV EUR 2,385,300.00 1.256,000.00Electric & Electronic
2,385,300.00 1.25
DANONE GROUPE EUR 2,302,056.96 1.2142,821.00Food services
2,302,056.96 1.21
AIR LIQUIDE SA EUR 2,176,461.00 1.1516,212.00Chemical
2,176,461.00 1.15
JPMORGAN CHASE & CO USD 2,125,674.28 1.1220,468.00Banks
2,125,674.28 1.12
NameQuantity/Nominal
Market valuein EUR
Currency %NAV
FACEBOOK INC-CLASS A USD 1,930,013.65 1.028,645.00Internet
1,930,013.65 1.02
FIDELITY NATIONAL INFO SERV USD 1,869,947.32 0.9816,174.00Computer software
1,869,947.32 0.98
INDUSTRIA DE DISENO TEXTIL EUR 277,950.96 0.1510,674.00Distribution & Wholesale
277,950.96 0.15
FERROVIAL SA EUR 277,030.80 0.1512,258.00Building materials
277,030.80 0.15
IBERDROLA SA EUR 265,590.00 0.1422,700.00Energy
265,590.00 0.14
19,865,184.23 10.45
ITALY BOTS 0% 20-14/09/2021 EUR 140,542.26 0.07140,000.00
Money market instrumentsGovernment
ITALY BOTS 0% 20-14/10/2021 EUR 5,232,025.80 2.755,210,000.00LETRAS 0% 20-07/05/2021 EUR 3,798,944.40 2.003,790,000.00LETRAS 0% 20-16/04/2021 EUR 4,077,814.40 2.154,070,000.00US TREASURY BILL 0% 20-15/07/2021 USD 5,718,461.82 3.017,000,000.00
18,967,788.68 9.98
18,967,788.68 9.98
CA CIB FINAN SOL 18-15/05/2028 FRN EUR 10,251,000.00 5.3910,000,000.00
Other transferable securities
Bonds and other debt instrumentsFinancial services
10,251,000.00 5.39
BARCLAYS BK PLC 19-12/06/2034 FRN EUR 3,050,700.00 1.613,000,000.00Banks
3,050,700.00 1.61
13,301,700.00 7.00
VERSE 5 SEN 0.85% 17-12/02/2022 EUR 910,517.83 0.48905,854.49
Mortgage backed securitiesFinancial services
910,517.83 0.48
910,517.83 0.48
Total securities portfolio 182,075,575.83 95.80
NameQuantity/Nominal
Market valuein EUR
Currency %NAV
Summary of net assets%
NAV182,075,575.83 95.80Total securities portfolio
7,055,346.15 3.71Cash at bank
932,107.43 0.49Other assets and liabilities
190,063,029.41 100.00Total net assets
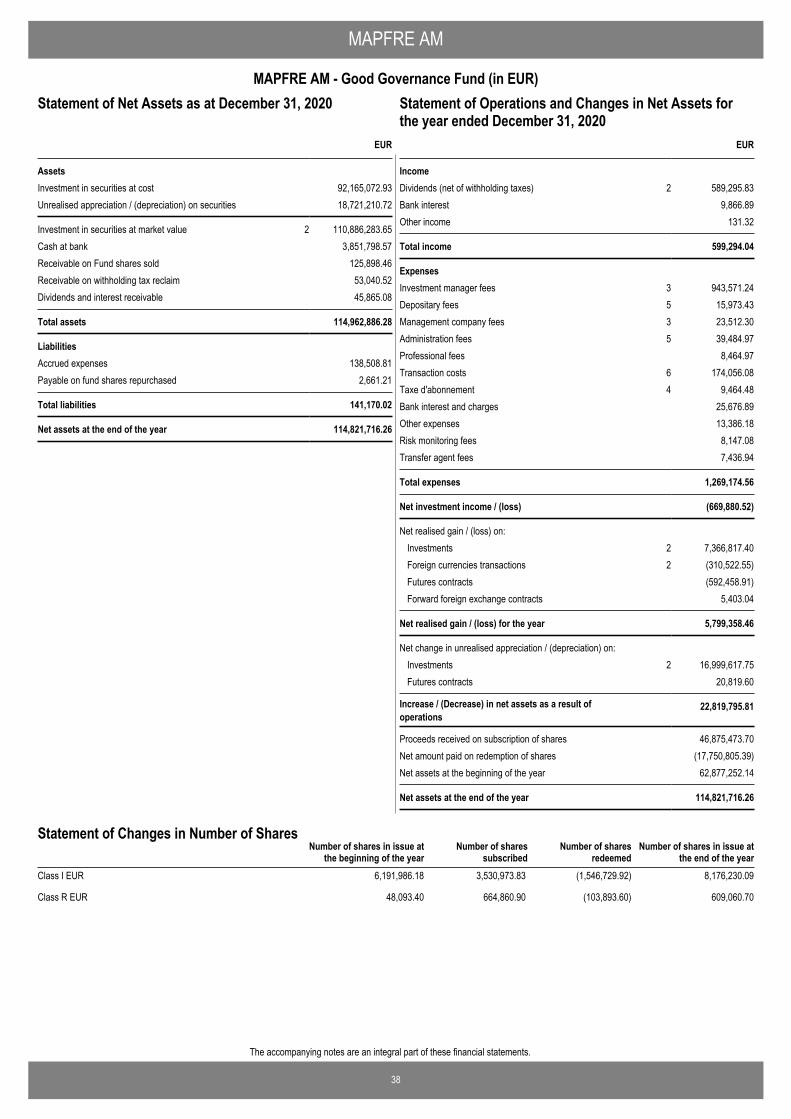
38
The accompanying notes are an integral part of these financial statements.
MAPFRE AM
MAPFRE AM - Good Governance Fund (in EUR)Statement of Operations and Changes in Net Assets for theyear ended December 31, 2020
EUR
AssetsInvestment in securities at cost 92,165,072.93Unrealised appreciation / (depreciation) on securities 18,721,210.72
Investment in securities at market value 2 110,886,283.65Cash at bank 3,851,798.57Receivable on Fund shares sold 125,898.46Receivable on withholding tax reclaim 53,040.52Dividends and interest receivable 45,865.08
Total assets 114,962,886.28
LiabilitiesAccrued expenses 138,508.81Payable on fund shares repurchased 2,661.21
Total liabilities 141,170.02
Net assets at the end of the year 114,821,716.26
Statement of Net Assets as at December 31, 2020
IncomeDividends (net of withholding taxes) 2 589,295.83Bank interest 9,866.89Other income 131.32
Total income 599,294.04
ExpensesInvestment manager fees 3 943,571.24Depositary fees 5 15,973.43Management company fees 3 23,512.30Administration fees 5 39,484.97Professional fees 8,464.97Transaction costs 6 174,056.08Taxe d'abonnement 4 9,464.48Bank interest and charges 25,676.89Other expenses 13,386.18Risk monitoring fees 8,147.08Transfer agent fees 7,436.94
Total expenses 1,269,174.56
Net investment income / (loss) (669,880.52)
Net realised gain / (loss) on: Investments 2 7,366,817.40Foreign currencies transactions 2 (310,522.55)Futures contracts (592,458.91)Forward foreign exchange contracts 5,403.04
Net realised gain / (loss) for the year 5,799,358.46
Net change in unrealised appreciation / (depreciation) on: Investments 2 16,999,617.75Futures contracts 20,819.60
Increase / (Decrease) in net assets as a result ofoperations
22,819,795.81
Proceeds received on subscription of shares 46,875,473.70Net amount paid on redemption of shares (17,750,805.39)Net assets at the beginning of the year 62,877,252.14
Net assets at the end of the year 114,821,716.26
EUR
Statement of Operations and Changes in Net Assets forthe year ended December 31, 2020
Number of shares in issue atthe end of the year
Number of shares in issue atthe beginning of the year
Number of sharessubscribed
Number of sharesredeemed
Statement of Changes in Number of Shares
Class I EUR 6,191,986.18 3,530,973.83 (1,546,729.92) 8,176,230.09
Class R EUR 48,093.40 664,860.90 (103,893.60) 609,060.70
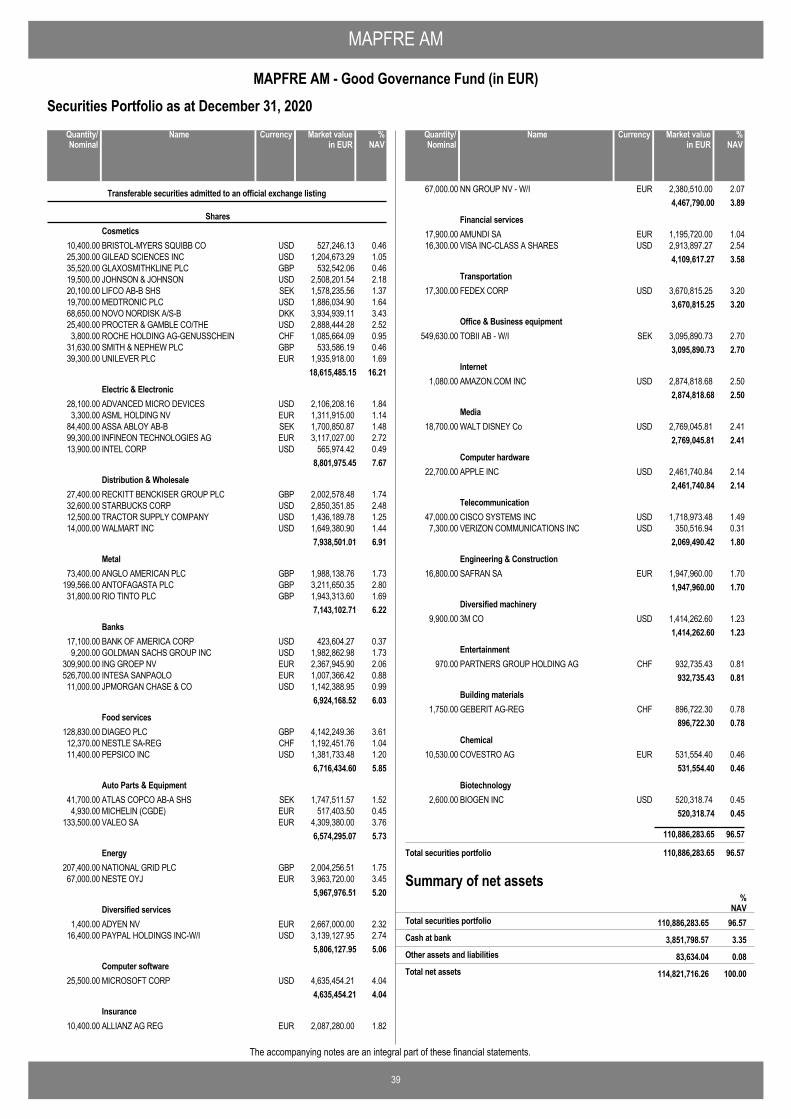
MAPFRE AM
39
MAPFRE AM - Good Governance Fund (in EUR)
The accompanying notes are an integral part of these financial statements.
Securities Portfolio as at December 31, 2020
BRISTOL-MYERS SQUIBB CO USD 527,246.13 0.4610,400.00
Transferable securities admitted to an official exchange listing
SharesCosmetics
GILEAD SCIENCES INC USD 1,204,673.29 1.0525,300.00GLAXOSMITHKLINE PLC GBP 532,542.06 0.4635,520.00JOHNSON & JOHNSON USD 2,508,201.54 2.1819,500.00LIFCO AB-B SHS SEK 1,578,235.56 1.3720,100.00MEDTRONIC PLC USD 1,886,034.90 1.6419,700.00NOVO NORDISK A/S-B DKK 3,934,939.11 3.4368,650.00PROCTER & GAMBLE CO/THE USD 2,888,444.28 2.5225,400.00ROCHE HOLDING AG-GENUSSCHEIN CHF 1,085,664.09 0.953,800.00SMITH & NEPHEW PLC GBP 533,586.19 0.4631,630.00UNILEVER PLC EUR 1,935,918.00 1.6939,300.00
18,615,485.15 16.21
ADVANCED MICRO DEVICES USD 2,106,208.16 1.8428,100.00Electric & Electronic
ASML HOLDING NV EUR 1,311,915.00 1.143,300.00ASSA ABLOY AB-B SEK 1,700,850.87 1.4884,400.00INFINEON TECHNOLOGIES AG EUR 3,117,027.00 2.7299,300.00INTEL CORP USD 565,974.42 0.4913,900.00
8,801,975.45 7.67
RECKITT BENCKISER GROUP PLC GBP 2,002,578.48 1.7427,400.00Distribution & Wholesale
STARBUCKS CORP USD 2,850,351.85 2.4832,600.00TRACTOR SUPPLY COMPANY USD 1,436,189.78 1.2512,500.00WALMART INC USD 1,649,380.90 1.4414,000.00
7,938,501.01 6.91
ANGLO AMERICAN PLC GBP 1,988,138.76 1.7373,400.00Metal
ANTOFAGASTA PLC GBP 3,211,650.35 2.80199,566.00RIO TINTO PLC GBP 1,943,313.60 1.6931,800.00
7,143,102.71 6.22
BANK OF AMERICA CORP USD 423,604.27 0.3717,100.00Banks
GOLDMAN SACHS GROUP INC USD 1,982,862.98 1.739,200.00ING GROEP NV EUR 2,367,945.90 2.06309,900.00INTESA SANPAOLO EUR 1,007,366.42 0.88526,700.00JPMORGAN CHASE & CO USD 1,142,388.95 0.9911,000.00
6,924,168.52 6.03
DIAGEO PLC GBP 4,142,249.36 3.61128,830.00Food services
NESTLE SA-REG CHF 1,192,451.76 1.0412,370.00PEPSICO INC USD 1,381,733.48 1.2011,400.00
6,716,434.60 5.85
ATLAS COPCO AB-A SHS SEK 1,747,511.57 1.5241,700.00Auto Parts & Equipment
MICHELIN (CGDE) EUR 517,403.50 0.454,930.00VALEO SA EUR 4,309,380.00 3.76133,500.00
6,574,295.07 5.73
NATIONAL GRID PLC GBP 2,004,256.51 1.75207,400.00Energy
NESTE OYJ EUR 3,963,720.00 3.4567,000.005,967,976.51 5.20
ADYEN NV EUR 2,667,000.00 2.321,400.00Diversified services
PAYPAL HOLDINGS INC-W/I USD 3,139,127.95 2.7416,400.005,806,127.95 5.06
MICROSOFT CORP USD 4,635,454.21 4.0425,500.00Computer software
4,635,454.21 4.04
ALLIANZ AG REG EUR 2,087,280.00 1.8210,400.00Insurance
NameQuantity/Nominal
Market valuein EUR
Currency %NAV
NN GROUP NV - W/I EUR 2,380,510.00 2.0767,000.004,467,790.00 3.89
AMUNDI SA EUR 1,195,720.00 1.0417,900.00Financial services
VISA INC-CLASS A SHARES USD 2,913,897.27 2.5416,300.004,109,617.27 3.58
FEDEX CORP USD 3,670,815.25 3.2017,300.00Transportation
3,670,815.25 3.20
TOBII AB - W/I SEK 3,095,890.73 2.70549,630.00Office & Business equipment
3,095,890.73 2.70
AMAZON.COM INC USD 2,874,818.68 2.501,080.00Internet
2,874,818.68 2.50
WALT DISNEY Co USD 2,769,045.81 2.4118,700.00Media
2,769,045.81 2.41
APPLE INC USD 2,461,740.84 2.1422,700.00Computer hardware
2,461,740.84 2.14
CISCO SYSTEMS INC USD 1,718,973.48 1.4947,000.00Telecommunication
VERIZON COMMUNICATIONS INC USD 350,516.94 0.317,300.002,069,490.42 1.80
SAFRAN SA EUR 1,947,960.00 1.7016,800.00Engineering & Construction
1,947,960.00 1.70
3M CO USD 1,414,262.60 1.239,900.00Diversified machinery
1,414,262.60 1.23
PARTNERS GROUP HOLDING AG CHF 932,735.43 0.81970.00Entertainment
932,735.43 0.81
GEBERIT AG-REG CHF 896,722.30 0.781,750.00Building materials
896,722.30 0.78
COVESTRO AG EUR 531,554.40 0.4610,530.00Chemical
531,554.40 0.46
BIOGEN INC USD 520,318.74 0.452,600.00Biotechnology
520,318.74 0.45
110,886,283.65 96.57
Total securities portfolio 110,886,283.65 96.57
NameQuantity/Nominal
Market valuein EUR
Currency %NAV
Summary of net assets%
NAV110,886,283.65 96.57Total securities portfolio
3,851,798.57 3.35Cash at bank
83,634.04 0.08Other assets and liabilities
114,821,716.26 100.00Total net assets
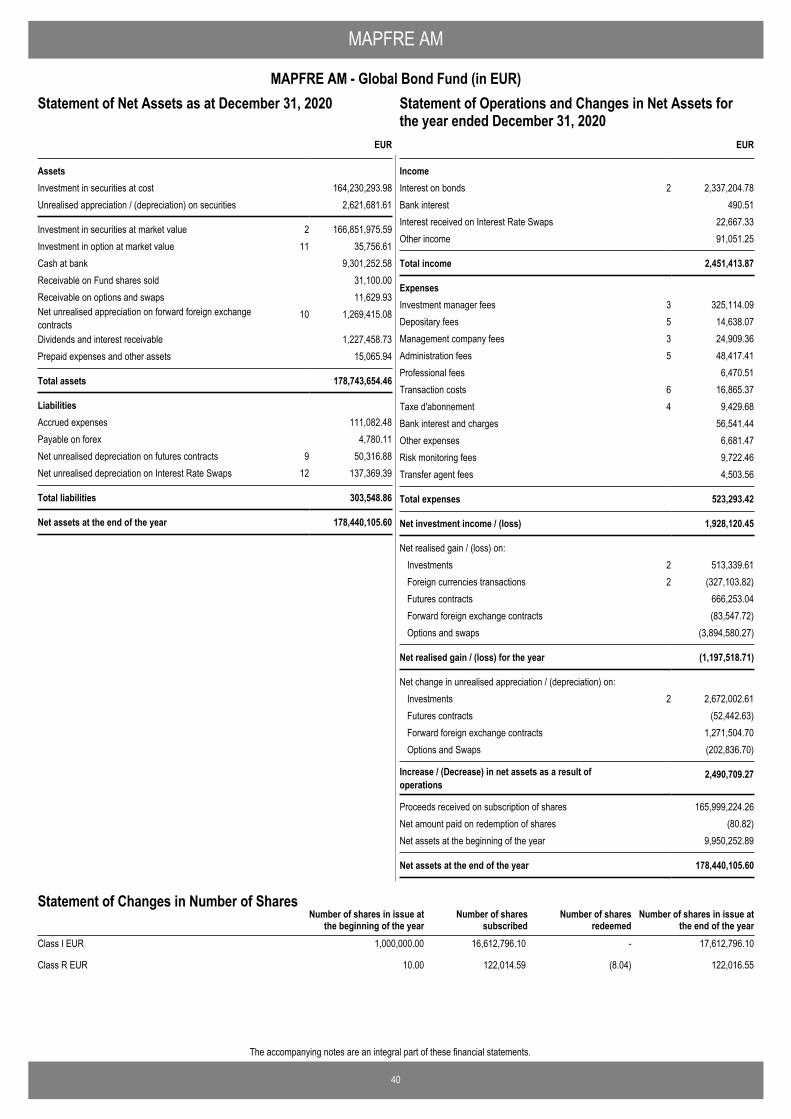
40
The accompanying notes are an integral part of these financial statements.
MAPFRE AM
MAPFRE AM - Global Bond Fund (in EUR)Statement of Operations and Changes in Net Assets for theyear ended December 31, 2020
EUR
AssetsInvestment in securities at cost 164,230,293.98Unrealised appreciation / (depreciation) on securities 2,621,681.61
Investment in securities at market value 2 166,851,975.59Investment in option at market value 11 35,756.61Cash at bank 9,301,252.58Receivable on Fund shares sold 31,100.00Receivable on options and swaps 11,629.93Net unrealised appreciation on forward foreign exchangecontracts
10 1,269,415.08
Dividends and interest receivable 1,227,458.73Prepaid expenses and other assets 15,065.94
Total assets 178,743,654.46
LiabilitiesAccrued expenses 111,082.48Payable on forex 4,780.11Net unrealised depreciation on futures contracts 9 50,316.88Net unrealised depreciation on Interest Rate Swaps 12 137,369.39
Total liabilities 303,548.86
Net assets at the end of the year 178,440,105.60
Statement of Net Assets as at December 31, 2020
IncomeInterest on bonds 2 2,337,204.78Bank interest 490.51Interest received on Interest Rate Swaps 22,667.33Other income 91,051.25
Total income 2,451,413.87
ExpensesInvestment manager fees 3 325,114.09Depositary fees 5 14,638.07Management company fees 3 24,909.36Administration fees 5 48,417.41Professional fees 6,470.51Transaction costs 6 16,865.37Taxe d'abonnement 4 9,429.68Bank interest and charges 56,541.44Other expenses 6,681.47Risk monitoring fees 9,722.46Transfer agent fees 4,503.56
Total expenses 523,293.42
Net investment income / (loss) 1,928,120.45
Net realised gain / (loss) on: Investments 2 513,339.61Foreign currencies transactions 2 (327,103.82)Futures contracts 666,253.04Forward foreign exchange contracts (83,547.72)Options and swaps (3,894,580.27)
Net realised gain / (loss) for the year (1,197,518.71)
Net change in unrealised appreciation / (depreciation) on: Investments 2 2,672,002.61Futures contracts (52,442.63)Forward foreign exchange contracts 1,271,504.70Options and Swaps (202,836.70)
Increase / (Decrease) in net assets as a result ofoperations
2,490,709.27
Proceeds received on subscription of shares 165,999,224.26Net amount paid on redemption of shares (80.82)Net assets at the beginning of the year 9,950,252.89
Net assets at the end of the year 178,440,105.60
EUR
Statement of Operations and Changes in Net Assets forthe year ended December 31, 2020
Number of shares in issue atthe end of the year
Number of shares in issue atthe beginning of the year
Number of sharessubscribed
Number of sharesredeemed
Statement of Changes in Number of Shares
Class I EUR 1,000,000.00 16,612,796.10 - 17,612,796.10
Class R EUR 10.00 122,014.59 (8.04) 122,016.55
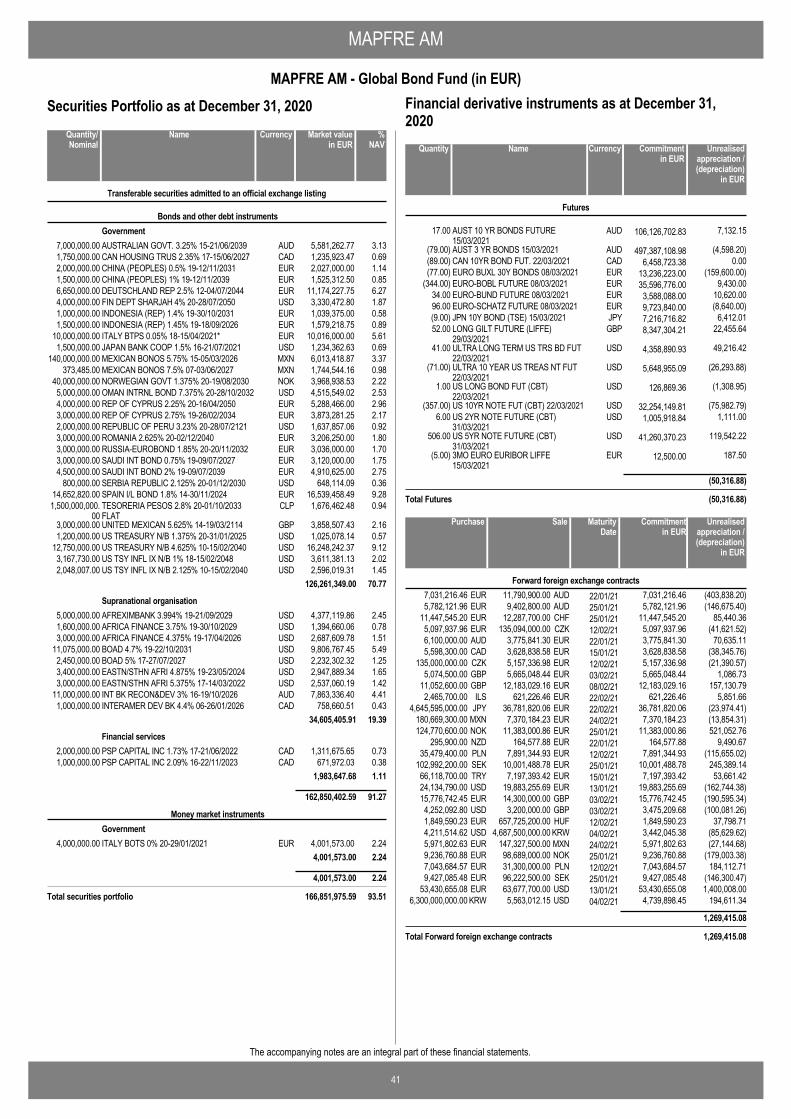
MAPFRE AM
41
MAPFRE AM - Global Bond Fund (in EUR)
The accompanying notes are an integral part of these financial statements.
Securities Portfolio as at December 31, 2020
AUSTRALIAN GOVT. 3.25% 15-21/06/2039 AUD 5,581,262.77 3.137,000,000.00
Transferable securities admitted to an official exchange listing
Bonds and other debt instrumentsGovernment
CAN HOUSING TRUS 2.35% 17-15/06/2027 CAD 1,235,923.47 0.691,750,000.00CHINA (PEOPLES) 0.5% 19-12/11/2031 EUR 2,027,000.00 1.142,000,000.00CHINA (PEOPLES) 1% 19-12/11/2039 EUR 1,525,312.50 0.851,500,000.00DEUTSCHLAND REP 2.5% 12-04/07/2044 EUR 11,174,227.75 6.276,650,000.00FIN DEPT SHARJAH 4% 20-28/07/2050 USD 3,330,472.80 1.874,000,000.00INDONESIA (REP) 1.4% 19-30/10/2031 EUR 1,039,375.00 0.581,000,000.00INDONESIA (REP) 1.45% 19-18/09/2026 EUR 1,579,218.75 0.891,500,000.00ITALY BTPS 0.05% 18-15/04/2021* EUR 10,016,000.00 5.6110,000,000.00JAPAN BANK COOP 1.5% 16-21/07/2021 USD 1,234,362.63 0.691,500,000.00MEXICAN BONOS 5.75% 15-05/03/2026 MXN 6,013,418.87 3.37140,000,000.00MEXICAN BONOS 7.5% 07-03/06/2027 MXN 1,744,544.16 0.98373,485.00NORWEGIAN GOVT 1.375% 20-19/08/2030 NOK 3,968,938.53 2.2240,000,000.00OMAN INTRNL BOND 7.375% 20-28/10/2032 USD 4,515,549.02 2.535,000,000.00REP OF CYPRUS 2.25% 20-16/04/2050 EUR 5,288,466.00 2.964,000,000.00REP OF CYPRUS 2.75% 19-26/02/2034 EUR 3,873,281.25 2.173,000,000.00REPUBLIC OF PERU 3.23% 20-28/07/2121 USD 1,637,857.06 0.922,000,000.00ROMANIA 2.625% 20-02/12/2040 EUR 3,206,250.00 1.803,000,000.00RUSSIA-EUROBOND 1.85% 20-20/11/2032 EUR 3,036,000.00 1.703,000,000.00SAUDI INT BOND 0.75% 19-09/07/2027 EUR 3,120,000.00 1.753,000,000.00SAUDI INT BOND 2% 19-09/07/2039 EUR 4,910,625.00 2.754,500,000.00SERBIA REPUBLIC 2.125% 20-01/12/2030 USD 648,114.09 0.36800,000.00SPAIN I/L BOND 1.8% 14-30/11/2024 EUR 16,539,458.49 9.2814,652,820.00TESORERIA PESOS 2.8% 20-01/10/2033FLAT
CLP 1,676,462.48 0.941,500,000,000.00
UNITED MEXICAN 5.625% 14-19/03/2114 GBP 3,858,507.43 2.163,000,000.00US TREASURY N/B 1.375% 20-31/01/2025 USD 1,025,078.14 0.571,200,000.00US TREASURY N/B 4.625% 10-15/02/2040 USD 16,248,242.37 9.1212,750,000.00US TSY INFL IX N/B 1% 18-15/02/2048 USD 3,611,381.13 2.023,167,730.00US TSY INFL IX N/B 2.125% 10-15/02/2040 USD 2,596,019.31 1.452,048,007.00
126,261,349.00 70.77
AFREXIMBANK 3.994% 19-21/09/2029 USD 4,377,119.86 2.455,000,000.00Supranational organisation
AFRICA FINANCE 3.75% 19-30/10/2029 USD 1,394,660.06 0.781,600,000.00AFRICA FINANCE 4.375% 19-17/04/2026 USD 2,687,609.78 1.513,000,000.00BOAD 4.7% 19-22/10/2031 USD 9,806,767.45 5.4911,075,000.00BOAD 5% 17-27/07/2027 USD 2,232,302.32 1.252,450,000.00EASTN/STHN AFRI 4.875% 19-23/05/2024 USD 2,947,889.34 1.653,400,000.00EASTN/STHN AFRI 5.375% 17-14/03/2022 USD 2,537,060.19 1.423,000,000.00INT BK RECON&DEV 3% 16-19/10/2026 AUD 7,863,336.40 4.4111,000,000.00INTERAMER DEV BK 4.4% 06-26/01/2026 CAD 758,660.51 0.431,000,000.00
34,605,405.91 19.39
PSP CAPITAL INC 1.73% 17-21/06/2022 CAD 1,311,675.65 0.732,000,000.00Financial services
PSP CAPITAL INC 2.09% 16-22/11/2023 CAD 671,972.03 0.381,000,000.001,983,647.68 1.11
162,850,402.59 91.27
ITALY BOTS 0% 20-29/01/2021 EUR 4,001,573.00 2.244,000,000.00
Money market instrumentsGovernment
4,001,573.00 2.24
4,001,573.00 2.24
Total securities portfolio 166,851,975.59 93.51
NameQuantity/Nominal
Market valuein EUR
Currency %NAV
AUST 10 YR BONDS FUTURE15/03/2021
AUD 106,126,702.8317.00 7,132.15
Futures
AUST 3 YR BONDS 15/03/2021 AUD 497,387,108.98(79.00) (4,598.20)CAN 10YR BOND FUT. 22/03/2021 CAD 6,458,723.38(89.00) 0.00EURO BUXL 30Y BONDS 08/03/2021 EUR 13,236,223.00(77.00) (159,600.00)EURO-BOBL FUTURE 08/03/2021 EUR 35,596,776.00(344.00) 9,430.00EURO-BUND FUTURE 08/03/2021 EUR 3,588,088.0034.00 10,620.00EURO-SCHATZ FUTURE 08/03/2021 EUR 9,723,840.0096.00 (8,640.00)JPN 10Y BOND (TSE) 15/03/2021 JPY 7,216,716.82(9.00) 6,412.01LONG GILT FUTURE (LIFFE)29/03/2021
GBP 8,347,304.2152.00 22,455.64
ULTRA LONG TERM US TRS BD FUT22/03/2021
USD 4,358,890.9341.00 49,216.42
ULTRA 10 YEAR US TREAS NT FUT22/03/2021
USD 5,648,955.09(71.00) (26,293.88)
US LONG BOND FUT (CBT)22/03/2021
USD 126,869.361.00 (1,308.95)
US 10YR NOTE FUT (CBT) 22/03/2021 USD 32,254,149.81(357.00) (75,982.79)US 2YR NOTE FUTURE (CBT)31/03/2021
USD 1,005,918.846.00 1,111.00
US 5YR NOTE FUTURE (CBT)31/03/2021
USD 41,260,370.23506.00 119,542.22
3MO EURO EURIBOR LIFFE15/03/2021
EUR 12,500.00(5.00) 187.50
(50,316.88)
Total Futures (50,316.88)
NameQuantity Commitmentin EUR
Currency Unrealisedappreciation /(depreciation)
in EUR
Financial derivative instruments as at December 31,2020
11,790,900.00 22/01/217,031,216.46 (403,838.20)AUDEUR 7,031,216.46Forward foreign exchange contracts
9,402,800.00 25/01/215,782,121.96 (146,675.40)AUDEUR 5,782,121.9612,287,700.00 25/01/2111,447,545.20 85,440.36CHFEUR 11,447,545.20
135,094,000.00 12/02/215,097,937.96 (41,621.52)CZKEUR 5,097,937.963,775,841.30 22/01/216,100,000.00 70,635.11EURAUD 3,775,841.303,628,838.58 15/01/215,598,300.00 (38,345.76)EURCAD 3,628,838.585,157,336.98 12/02/21135,000,000.00 (21,390.57)EURCZK 5,157,336.985,665,048.44 03/02/215,074,500.00 1,086.73EURGBP 5,665,048.44
12,183,029.16 08/02/2111,052,600.00 157,130.79EURGBP 12,183,029.16621,226.46 22/02/212,465,700.00 5,851.66EURILS 621,226.46
36,781,820.06 22/02/214,645,595,000.00 (23,974.41)EURJPY 36,781,820.067,370,184.23 24/02/21180,669,300.00 (13,854.31)EURMXN 7,370,184.23
11,383,000.86 25/01/21124,770,600.00 521,052.76EURNOK 11,383,000.86164,577.88 22/01/21295,900.00 9,490.67EURNZD 164,577.88
7,891,344.93 12/02/2135,479,400.00 (115,655.02)EURPLN 7,891,344.9310,001,488.78 25/01/21102,992,200.00 245,389.14EURSEK 10,001,488.787,197,393.42 15/01/2166,118,700.00 53,661.42EURTRY 7,197,393.42
19,883,255.69 13/01/2124,134,790.00 (162,744.38)EURUSD 19,883,255.6914,300,000.00 03/02/2115,776,742.45 (190,595.34)GBPEUR 15,776,742.453,200,000.00 03/02/214,252,092.80 (100,081.26)GBPUSD 3,475,209.68
657,725,200.00 12/02/211,849,590.23 37,798.71HUFEUR 1,849,590.234,687,500,000.00 04/02/214,211,514.62 (85,629.62)KRWUSD 3,442,045.38
147,327,500.00 24/02/215,971,802.63 (27,144.68)MXNEUR 5,971,802.6398,689,000.00 25/01/219,236,760.88 (179,003.38)NOKEUR 9,236,760.8831,300,000.00 12/02/217,043,684.57 184,112.71PLNEUR 7,043,684.5796,222,500.00 25/01/219,427,085.48 (146,300.47)SEKEUR 9,427,085.4863,677,700.00 13/01/2153,430,655.08 1,400,008.00USDEUR 53,430,655.085,563,012.15 04/02/216,300,000,000.00 194,611.34USDKRW 4,739,898.45
1,269,415.08
Total Forward foreign exchange contracts 1,269,415.08
SalePurchase Unrealisedappreciation /(depreciation)
in EUR
MaturityDate
Commitmentin EUR
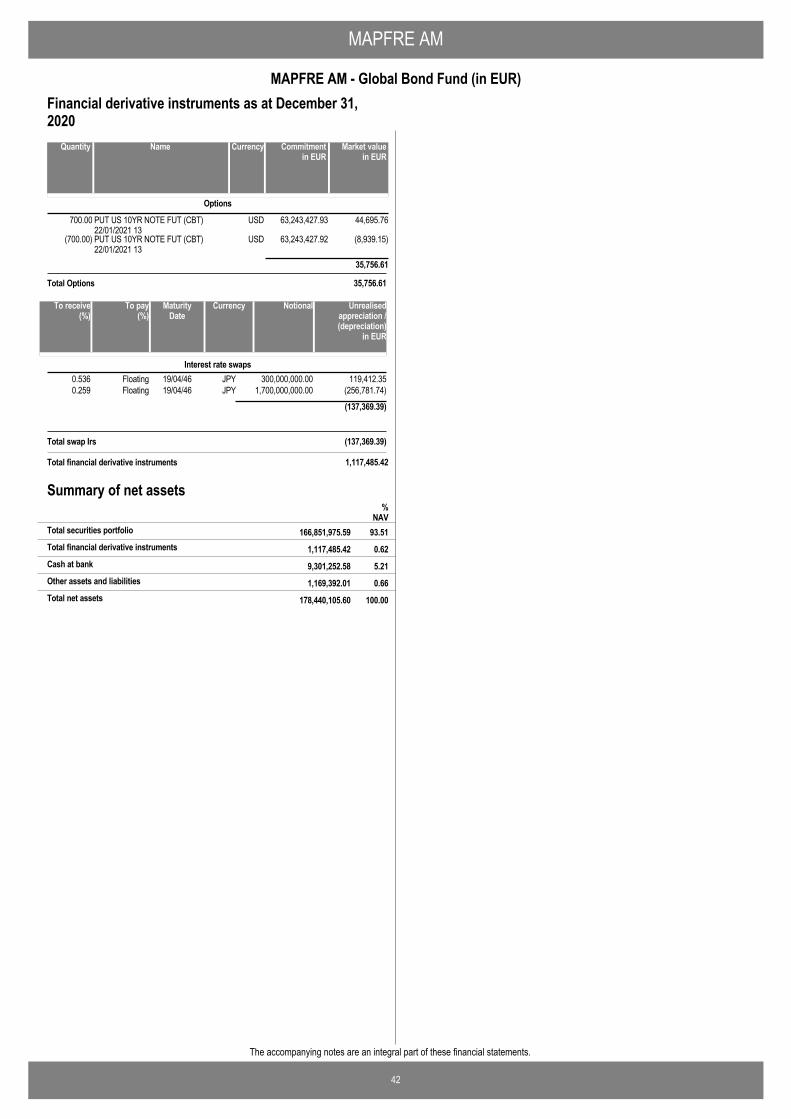
MAPFRE AM
42
MAPFRE AM - Global Bond Fund (in EUR)
The accompanying notes are an integral part of these financial statements.
PUT US 10YR NOTE FUT (CBT)22/01/2021 13
USD700.00 63,243,427.93 44,695.76
Options
PUT US 10YR NOTE FUT (CBT)22/01/2021 13
USD(700.00) 63,243,427.92 (8,939.15)
35,756.61
Total Options 35,756.61
NameQuantity Market valuein EUR
Currency Commitmentin EUR
Financial derivative instruments as at December 31,2020
19/04/460.536 300,000,000.00 119,412.35JPYFloatingInterest rate swaps
19/04/460.259 1,700,000,000.00 (256,781.74)JPYFloating
(137,369.39)
To pay (%)
To receive (%)
NotionalMaturityDate
Unrealisedappreciation /(depreciation)
in EUR
Currency
Total swap Irs (137,369.39)
Total financial derivative instruments 1,117,485.42
Summary of net assets
1,117,485.42 0.62Total financial derivative instruments
%NAV
166,851,975.59 93.51Total securities portfolio
9,301,252.58 5.21Cash at bank
1,169,392.01 0.66Other assets and liabilities
178,440,105.60 100.00Total net assets
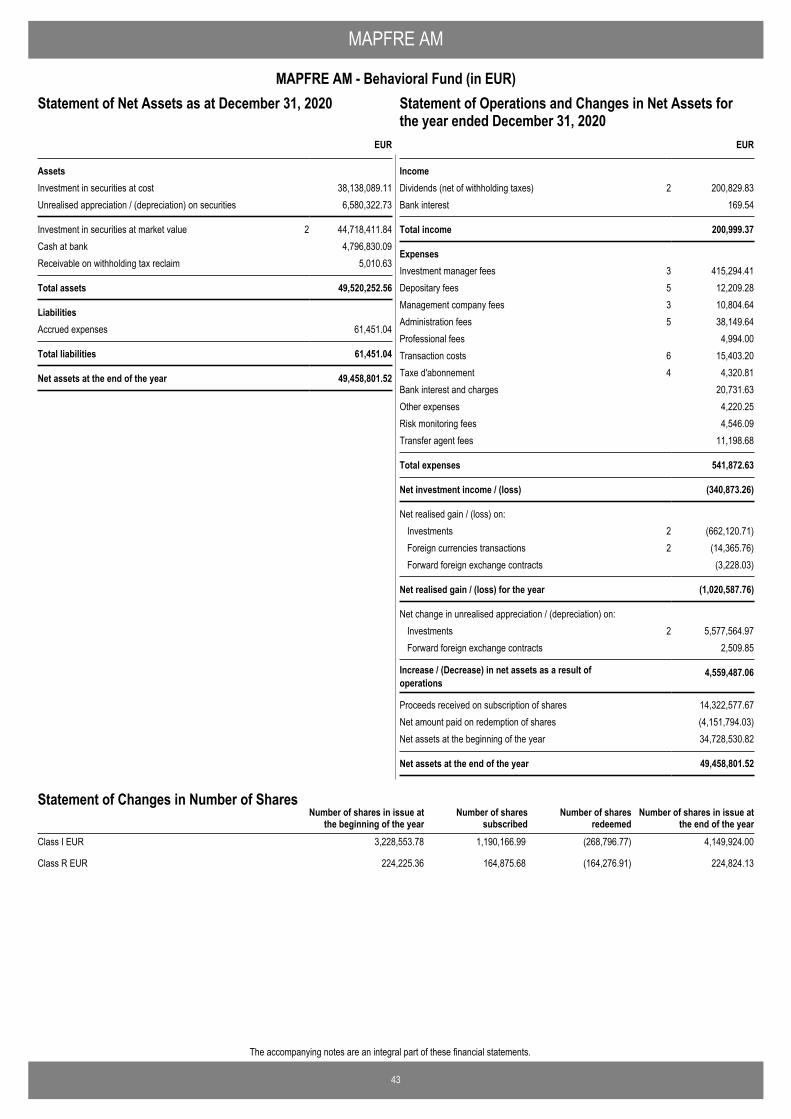
43
The accompanying notes are an integral part of these financial statements.
MAPFRE AM
MAPFRE AM - Behavioral Fund (in EUR)Statement of Operations and Changes in Net Assets for theyear ended December 31, 2020
EUR
AssetsInvestment in securities at cost 38,138,089.11Unrealised appreciation / (depreciation) on securities 6,580,322.73
Investment in securities at market value 2 44,718,411.84Cash at bank 4,796,830.09Receivable on withholding tax reclaim 5,010.63
Total assets 49,520,252.56
LiabilitiesAccrued expenses 61,451.04
Total liabilities 61,451.04
Net assets at the end of the year 49,458,801.52
Statement of Net Assets as at December 31, 2020
IncomeDividends (net of withholding taxes) 2 200,829.83Bank interest 169.54
Total income 200,999.37
ExpensesInvestment manager fees 3 415,294.41Depositary fees 5 12,209.28Management company fees 3 10,804.64Administration fees 5 38,149.64Professional fees 4,994.00Transaction costs 6 15,403.20Taxe d'abonnement 4 4,320.81Bank interest and charges 20,731.63Other expenses 4,220.25Risk monitoring fees 4,546.09Transfer agent fees 11,198.68
Total expenses 541,872.63
Net investment income / (loss) (340,873.26)
Net realised gain / (loss) on: Investments 2 (662,120.71)Foreign currencies transactions 2 (14,365.76)Forward foreign exchange contracts (3,228.03)
Net realised gain / (loss) for the year (1,020,587.76)
Net change in unrealised appreciation / (depreciation) on: Investments 2 5,577,564.97Forward foreign exchange contracts 2,509.85
Increase / (Decrease) in net assets as a result ofoperations
4,559,487.06
Proceeds received on subscription of shares 14,322,577.67Net amount paid on redemption of shares (4,151,794.03)Net assets at the beginning of the year 34,728,530.82
Net assets at the end of the year 49,458,801.52
EUR
Statement of Operations and Changes in Net Assets forthe year ended December 31, 2020
Number of shares in issue atthe end of the year
Number of shares in issue atthe beginning of the year
Number of sharessubscribed
Number of sharesredeemed
Statement of Changes in Number of Shares
Class I EUR 3,228,553.78 1,190,166.99 (268,796.77) 4,149,924.00
Class R EUR 224,225.36 164,875.68 (164,276.91) 224,824.13
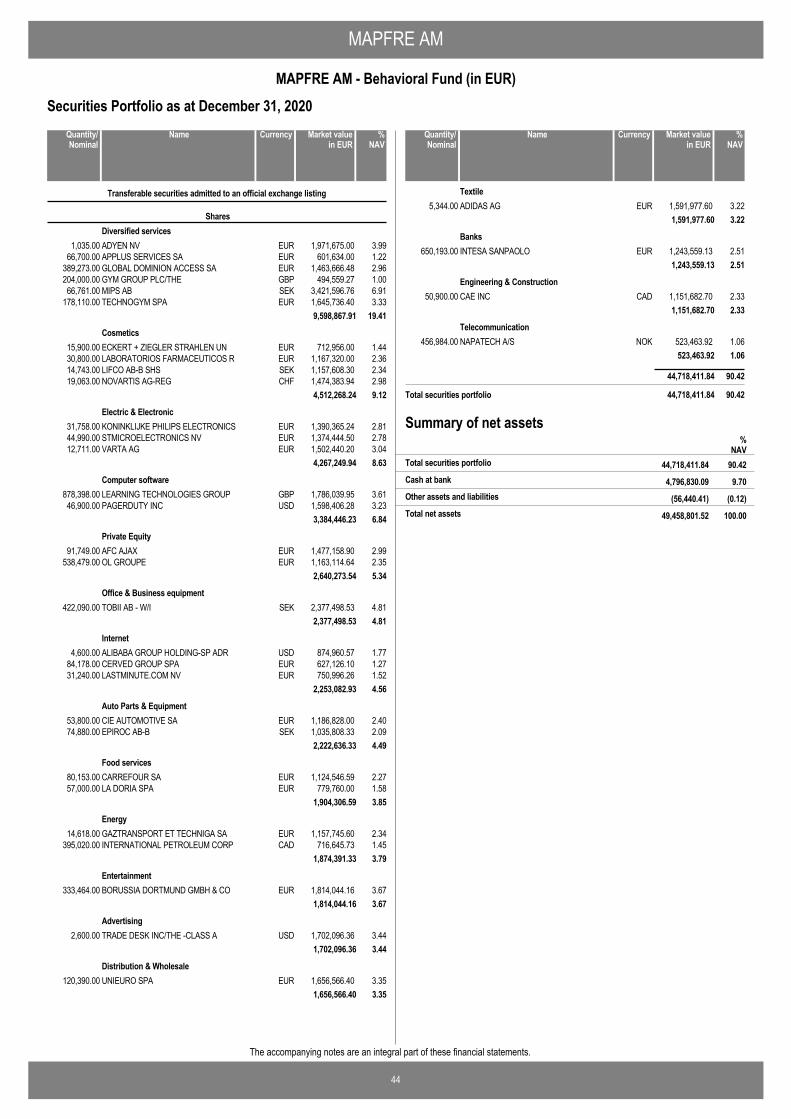
MAPFRE AM
44
MAPFRE AM - Behavioral Fund (in EUR)
The accompanying notes are an integral part of these financial statements.
Securities Portfolio as at December 31, 2020
ADYEN NV EUR 1,971,675.00 3.991,035.00
Transferable securities admitted to an official exchange listing
SharesDiversified services
APPLUS SERVICES SA EUR 601,634.00 1.2266,700.00GLOBAL DOMINION ACCESS SA EUR 1,463,666.48 2.96389,273.00GYM GROUP PLC/THE GBP 494,559.27 1.00204,000.00MIPS AB SEK 3,421,596.76 6.9166,761.00TECHNOGYM SPA EUR 1,645,736.40 3.33178,110.00
9,598,867.91 19.41
ECKERT + ZIEGLER STRAHLEN UN EUR 712,956.00 1.4415,900.00Cosmetics
LABORATORIOS FARMACEUTICOS R EUR 1,167,320.00 2.3630,800.00LIFCO AB-B SHS SEK 1,157,608.30 2.3414,743.00NOVARTIS AG-REG CHF 1,474,383.94 2.9819,063.00
4,512,268.24 9.12
KONINKLIJKE PHILIPS ELECTRONICS EUR 1,390,365.24 2.8131,758.00Electric & Electronic
STMICROELECTRONICS NV EUR 1,374,444.50 2.7844,990.00VARTA AG EUR 1,502,440.20 3.0412,711.00
4,267,249.94 8.63
LEARNING TECHNOLOGIES GROUP GBP 1,786,039.95 3.61878,398.00Computer software
PAGERDUTY INC USD 1,598,406.28 3.2346,900.003,384,446.23 6.84
AFC AJAX EUR 1,477,158.90 2.9991,749.00Private Equity
OL GROUPE EUR 1,163,114.64 2.35538,479.002,640,273.54 5.34
TOBII AB - W/I SEK 2,377,498.53 4.81422,090.00Office & Business equipment
2,377,498.53 4.81
ALIBABA GROUP HOLDING-SP ADR USD 874,960.57 1.774,600.00Internet
CERVED GROUP SPA EUR 627,126.10 1.2784,178.00LASTMINUTE.COM NV EUR 750,996.26 1.5231,240.00
2,253,082.93 4.56
CIE AUTOMOTIVE SA EUR 1,186,828.00 2.4053,800.00Auto Parts & Equipment
EPIROC AB-B SEK 1,035,808.33 2.0974,880.002,222,636.33 4.49
CARREFOUR SA EUR 1,124,546.59 2.2780,153.00Food services
LA DORIA SPA EUR 779,760.00 1.5857,000.001,904,306.59 3.85
GAZTRANSPORT ET TECHNIGA SA EUR 1,157,745.60 2.3414,618.00Energy
INTERNATIONAL PETROLEUM CORP CAD 716,645.73 1.45395,020.001,874,391.33 3.79
BORUSSIA DORTMUND GMBH & CO EUR 1,814,044.16 3.67333,464.00Entertainment
1,814,044.16 3.67
TRADE DESK INC/THE -CLASS A USD 1,702,096.36 3.442,600.00Advertising
1,702,096.36 3.44
UNIEURO SPA EUR 1,656,566.40 3.35120,390.00Distribution & Wholesale
1,656,566.40 3.35
NameQuantity/Nominal
Market valuein EUR
Currency %NAV
ADIDAS AG EUR 1,591,977.60 3.225,344.00Textile
1,591,977.60 3.22
INTESA SANPAOLO EUR 1,243,559.13 2.51650,193.00Banks
1,243,559.13 2.51
CAE INC CAD 1,151,682.70 2.3350,900.00Engineering & Construction
1,151,682.70 2.33
NAPATECH A/S NOK 523,463.92 1.06456,984.00Telecommunication
523,463.92 1.06
44,718,411.84 90.42
Total securities portfolio 44,718,411.84 90.42
NameQuantity/Nominal
Market valuein EUR
Currency %NAV
Summary of net assets%
NAV44,718,411.84 90.42Total securities portfolio
4,796,830.09 9.70Cash at bank
(56,440.41) (0.12)Other assets and liabilities
49,458,801.52 100.00Total net assets
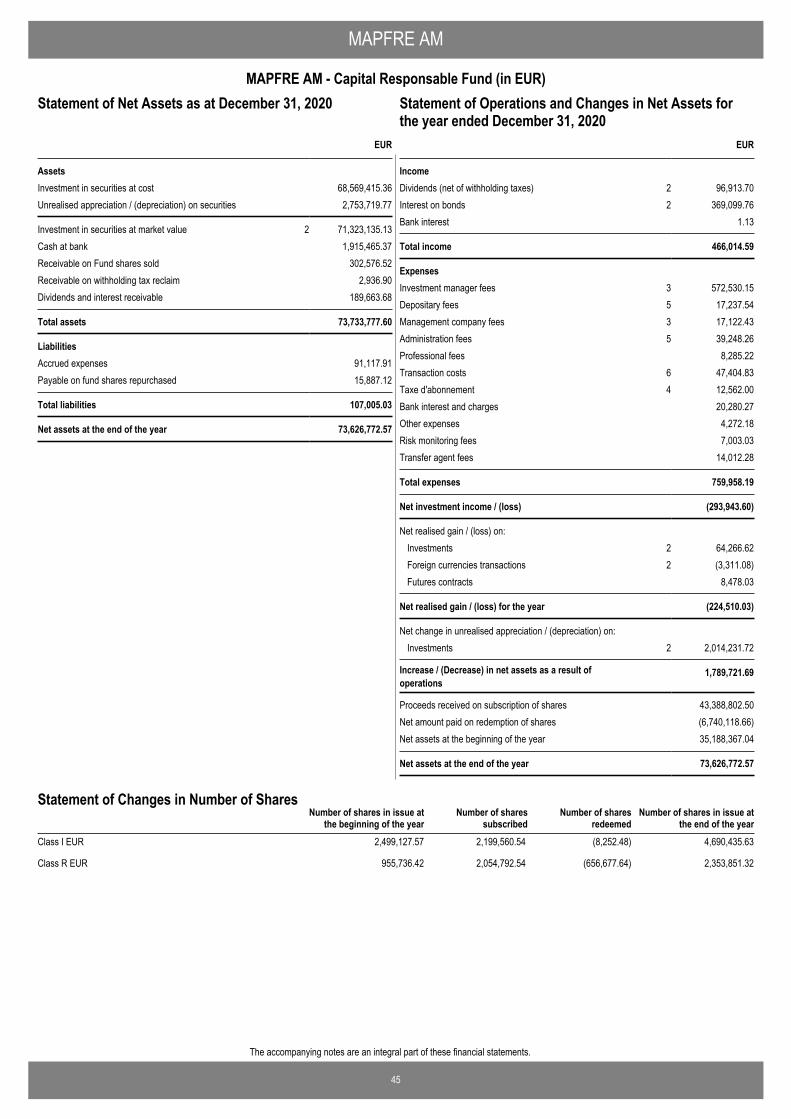
45
The accompanying notes are an integral part of these financial statements.
MAPFRE AM
MAPFRE AM - Capital Responsable Fund (in EUR)Statement of Operations and Changes in Net Assets for theyear ended December 31, 2020
EUR
AssetsInvestment in securities at cost 68,569,415.36Unrealised appreciation / (depreciation) on securities 2,753,719.77
Investment in securities at market value 2 71,323,135.13Cash at bank 1,915,465.37Receivable on Fund shares sold 302,576.52Receivable on withholding tax reclaim 2,936.90Dividends and interest receivable 189,663.68
Total assets 73,733,777.60
LiabilitiesAccrued expenses 91,117.91Payable on fund shares repurchased 15,887.12
Total liabilities 107,005.03
Net assets at the end of the year 73,626,772.57
Statement of Net Assets as at December 31, 2020
IncomeDividends (net of withholding taxes) 2 96,913.70Interest on bonds 2 369,099.76Bank interest 1.13
Total income 466,014.59
ExpensesInvestment manager fees 3 572,530.15Depositary fees 5 17,237.54Management company fees 3 17,122.43Administration fees 5 39,248.26Professional fees 8,285.22Transaction costs 6 47,404.83Taxe d'abonnement 4 12,562.00Bank interest and charges 20,280.27Other expenses 4,272.18Risk monitoring fees 7,003.03Transfer agent fees 14,012.28
Total expenses 759,958.19
Net investment income / (loss) (293,943.60)
Net realised gain / (loss) on: Investments 2 64,266.62Foreign currencies transactions 2 (3,311.08)Futures contracts 8,478.03
Net realised gain / (loss) for the year (224,510.03)
Net change in unrealised appreciation / (depreciation) on: Investments 2 2,014,231.72
Increase / (Decrease) in net assets as a result ofoperations
1,789,721.69
Proceeds received on subscription of shares 43,388,802.50Net amount paid on redemption of shares (6,740,118.66)Net assets at the beginning of the year 35,188,367.04
Net assets at the end of the year 73,626,772.57
EUR
Statement of Operations and Changes in Net Assets forthe year ended December 31, 2020
Number of shares in issue atthe end of the year
Number of shares in issue atthe beginning of the year
Number of sharessubscribed
Number of sharesredeemed
Statement of Changes in Number of Shares
Class I EUR 2,499,127.57 2,199,560.54 (8,252.48) 4,690,435.63
Class R EUR 955,736.42 2,054,792.54 (656,677.64) 2,353,851.32
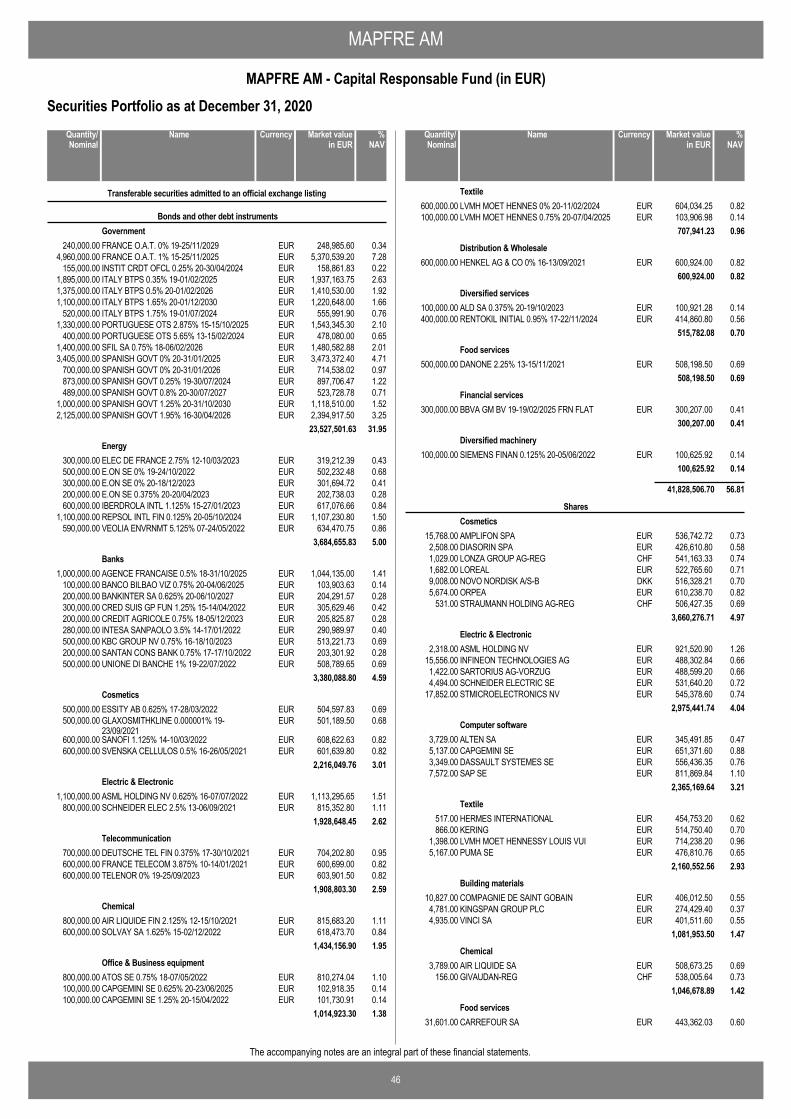
MAPFRE AM
46
MAPFRE AM - Capital Responsable Fund (in EUR)
The accompanying notes are an integral part of these financial statements.
Securities Portfolio as at December 31, 2020
FRANCE O.A.T. 0% 19-25/11/2029 EUR 248,985.60 0.34240,000.00
Transferable securities admitted to an official exchange listing
Bonds and other debt instrumentsGovernment
FRANCE O.A.T. 1% 15-25/11/2025 EUR 5,370,539.20 7.284,960,000.00INSTIT CRDT OFCL 0.25% 20-30/04/2024 EUR 158,861.83 0.22155,000.00ITALY BTPS 0.35% 19-01/02/2025 EUR 1,937,163.75 2.631,895,000.00ITALY BTPS 0.5% 20-01/02/2026 EUR 1,410,530.00 1.921,375,000.00ITALY BTPS 1.65% 20-01/12/2030 EUR 1,220,648.00 1.661,100,000.00ITALY BTPS 1.75% 19-01/07/2024 EUR 555,991.90 0.76520,000.00PORTUGUESE OTS 2.875% 15-15/10/2025 EUR 1,543,345.30 2.101,330,000.00PORTUGUESE OTS 5.65% 13-15/02/2024 EUR 478,080.00 0.65400,000.00SFIL SA 0.75% 18-06/02/2026 EUR 1,480,582.88 2.011,400,000.00SPANISH GOVT 0% 20-31/01/2025 EUR 3,473,372.40 4.713,405,000.00SPANISH GOVT 0% 20-31/01/2026 EUR 714,538.02 0.97700,000.00SPANISH GOVT 0.25% 19-30/07/2024 EUR 897,706.47 1.22873,000.00SPANISH GOVT 0.8% 20-30/07/2027 EUR 523,728.78 0.71489,000.00SPANISH GOVT 1.25% 20-31/10/2030 EUR 1,118,510.00 1.521,000,000.00SPANISH GOVT 1.95% 16-30/04/2026 EUR 2,394,917.50 3.252,125,000.00
23,527,501.63 31.95
ELEC DE FRANCE 2.75% 12-10/03/2023 EUR 319,212.39 0.43300,000.00Energy
E.ON SE 0% 19-24/10/2022 EUR 502,232.48 0.68500,000.00E.ON SE 0% 20-18/12/2023 EUR 301,694.72 0.41300,000.00E.ON SE 0.375% 20-20/04/2023 EUR 202,738.03 0.28200,000.00IBERDROLA INTL 1.125% 15-27/01/2023 EUR 617,076.66 0.84600,000.00REPSOL INTL FIN 0.125% 20-05/10/2024 EUR 1,107,230.80 1.501,100,000.00VEOLIA ENVRNMT 5.125% 07-24/05/2022 EUR 634,470.75 0.86590,000.00
3,684,655.83 5.00
AGENCE FRANCAISE 0.5% 18-31/10/2025 EUR 1,044,135.00 1.411,000,000.00Banks
BANCO BILBAO VIZ 0.75% 20-04/06/2025 EUR 103,903.63 0.14100,000.00BANKINTER SA 0.625% 20-06/10/2027 EUR 204,291.57 0.28200,000.00CRED SUIS GP FUN 1.25% 15-14/04/2022 EUR 305,629.46 0.42300,000.00CREDIT AGRICOLE 0.75% 18-05/12/2023 EUR 205,825.87 0.28200,000.00INTESA SANPAOLO 3.5% 14-17/01/2022 EUR 290,989.97 0.40280,000.00KBC GROUP NV 0.75% 16-18/10/2023 EUR 513,221.73 0.69500,000.00SANTAN CONS BANK 0.75% 17-17/10/2022 EUR 203,301.92 0.28200,000.00UNIONE DI BANCHE 1% 19-22/07/2022 EUR 508,789.65 0.69500,000.00
3,380,088.80 4.59
ESSITY AB 0.625% 17-28/03/2022 EUR 504,597.83 0.69500,000.00Cosmetics
GLAXOSMITHKLINE 0.000001% 19-23/09/2021
EUR 501,189.50 0.68500,000.00
SANOFI 1.125% 14-10/03/2022 EUR 608,622.63 0.82600,000.00SVENSKA CELLULOS 0.5% 16-26/05/2021 EUR 601,639.80 0.82600,000.00
2,216,049.76 3.01
ASML HOLDING NV 0.625% 16-07/07/2022 EUR 1,113,295.65 1.511,100,000.00Electric & Electronic
SCHNEIDER ELEC 2.5% 13-06/09/2021 EUR 815,352.80 1.11800,000.001,928,648.45 2.62
DEUTSCHE TEL FIN 0.375% 17-30/10/2021 EUR 704,202.80 0.95700,000.00Telecommunication
FRANCE TELECOM 3.875% 10-14/01/2021 EUR 600,699.00 0.82600,000.00TELENOR 0% 19-25/09/2023 EUR 603,901.50 0.82600,000.00
1,908,803.30 2.59
AIR LIQUIDE FIN 2.125% 12-15/10/2021 EUR 815,683.20 1.11800,000.00Chemical
SOLVAY SA 1.625% 15-02/12/2022 EUR 618,473.70 0.84600,000.001,434,156.90 1.95
ATOS SE 0.75% 18-07/05/2022 EUR 810,274.04 1.10800,000.00Office & Business equipment
CAPGEMINI SE 0.625% 20-23/06/2025 EUR 102,918.35 0.14100,000.00CAPGEMINI SE 1.25% 20-15/04/2022 EUR 101,730.91 0.14100,000.00
1,014,923.30 1.38
NameQuantity/Nominal
Market valuein EUR
Currency %NAV
LVMH MOET HENNES 0% 20-11/02/2024 EUR 604,034.25 0.82600,000.00Textile
LVMH MOET HENNES 0.75% 20-07/04/2025 EUR 103,906.98 0.14100,000.00707,941.23 0.96
HENKEL AG & CO 0% 16-13/09/2021 EUR 600,924.00 0.82600,000.00Distribution & Wholesale
600,924.00 0.82
ALD SA 0.375% 20-19/10/2023 EUR 100,921.28 0.14100,000.00Diversified services
RENTOKIL INITIAL 0.95% 17-22/11/2024 EUR 414,860.80 0.56400,000.00515,782.08 0.70
DANONE 2.25% 13-15/11/2021 EUR 508,198.50 0.69500,000.00Food services
508,198.50 0.69
BBVA GM BV 19-19/02/2025 FRN FLAT EUR 300,207.00 0.41300,000.00Financial services
300,207.00 0.41
SIEMENS FINAN 0.125% 20-05/06/2022 EUR 100,625.92 0.14100,000.00Diversified machinery
100,625.92 0.14
41,828,506.70 56.81
AMPLIFON SPA EUR 536,742.72 0.7315,768.00
SharesCosmetics
DIASORIN SPA EUR 426,610.80 0.582,508.00LONZA GROUP AG-REG CHF 541,163.33 0.741,029.00LOREAL EUR 522,765.60 0.711,682.00NOVO NORDISK A/S-B DKK 516,328.21 0.709,008.00ORPEA EUR 610,238.70 0.825,674.00STRAUMANN HOLDING AG-REG CHF 506,427.35 0.69531.00
3,660,276.71 4.97
ASML HOLDING NV EUR 921,520.90 1.262,318.00Electric & Electronic
INFINEON TECHNOLOGIES AG EUR 488,302.84 0.6615,556.00SARTORIUS AG-VORZUG EUR 488,599.20 0.661,422.00SCHNEIDER ELECTRIC SE EUR 531,640.20 0.724,494.00STMICROELECTRONICS NV EUR 545,378.60 0.7417,852.00
2,975,441.74 4.04
ALTEN SA EUR 345,491.85 0.473,729.00Computer software
CAPGEMINI SE EUR 651,371.60 0.885,137.00DASSAULT SYSTEMES SE EUR 556,436.35 0.763,349.00SAP SE EUR 811,869.84 1.107,572.00
2,365,169.64 3.21
HERMES INTERNATIONAL EUR 454,753.20 0.62517.00Textile
KERING EUR 514,750.40 0.70866.00LVMH MOET HENNESSY LOUIS VUI EUR 714,238.20 0.961,398.00PUMA SE EUR 476,810.76 0.655,167.00
2,160,552.56 2.93
COMPAGNIE DE SAINT GOBAIN EUR 406,012.50 0.5510,827.00Building materials
KINGSPAN GROUP PLC EUR 274,429.40 0.374,781.00VINCI SA EUR 401,511.60 0.554,935.00
1,081,953.50 1.47
AIR LIQUIDE SA EUR 508,673.25 0.693,789.00Chemical
GIVAUDAN-REG CHF 538,005.64 0.73156.001,046,678.89 1.42
CARREFOUR SA EUR 443,362.03 0.6031,601.00Food services
NameQuantity/Nominal
Market valuein EUR
Currency %NAV
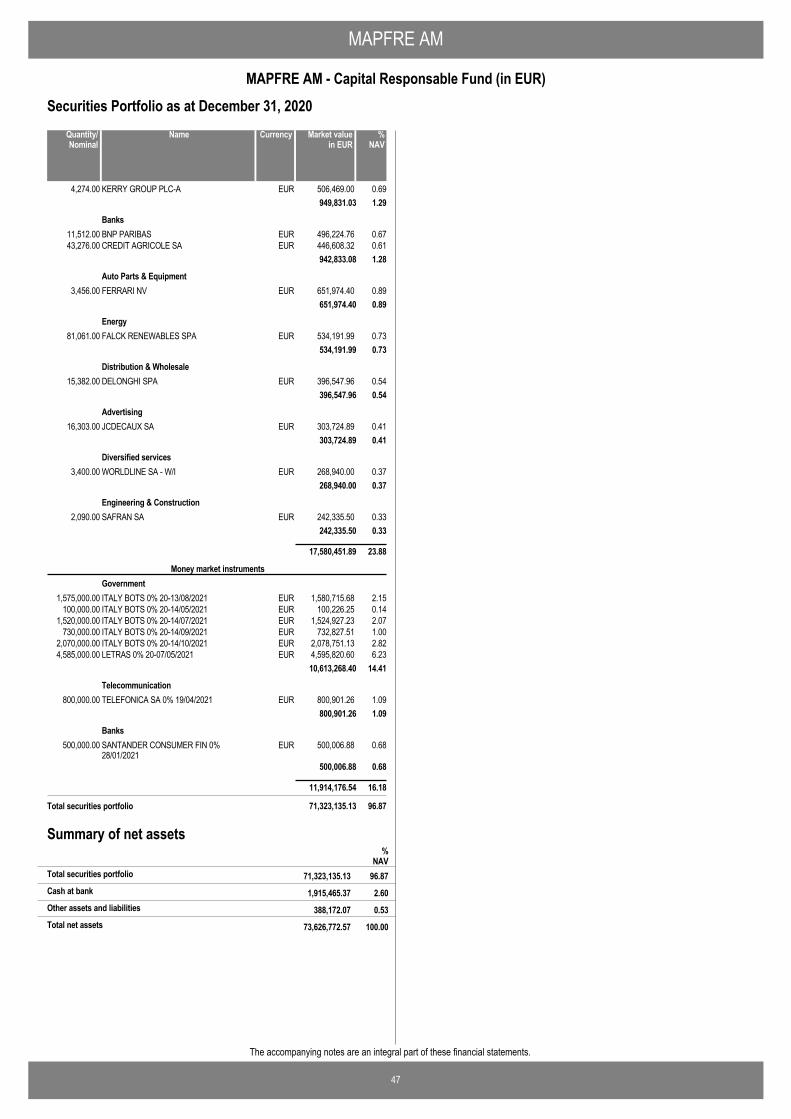
MAPFRE AM
47
MAPFRE AM - Capital Responsable Fund (in EUR)
The accompanying notes are an integral part of these financial statements.
Securities Portfolio as at December 31, 2020
KERRY GROUP PLC-A EUR 506,469.00 0.694,274.00949,831.03 1.29
BNP PARIBAS EUR 496,224.76 0.6711,512.00Banks
CREDIT AGRICOLE SA EUR 446,608.32 0.6143,276.00942,833.08 1.28
FERRARI NV EUR 651,974.40 0.893,456.00Auto Parts & Equipment
651,974.40 0.89
FALCK RENEWABLES SPA EUR 534,191.99 0.7381,061.00Energy
534,191.99 0.73
DELONGHI SPA EUR 396,547.96 0.5415,382.00Distribution & Wholesale
396,547.96 0.54
JCDECAUX SA EUR 303,724.89 0.4116,303.00Advertising
303,724.89 0.41
WORLDLINE SA - W/I EUR 268,940.00 0.373,400.00Diversified services
268,940.00 0.37
SAFRAN SA EUR 242,335.50 0.332,090.00Engineering & Construction
242,335.50 0.33
17,580,451.89 23.88
ITALY BOTS 0% 20-13/08/2021 EUR 1,580,715.68 2.151,575,000.00
Money market instrumentsGovernment
ITALY BOTS 0% 20-14/05/2021 EUR 100,226.25 0.14100,000.00ITALY BOTS 0% 20-14/07/2021 EUR 1,524,927.23 2.071,520,000.00ITALY BOTS 0% 20-14/09/2021 EUR 732,827.51 1.00730,000.00ITALY BOTS 0% 20-14/10/2021 EUR 2,078,751.13 2.822,070,000.00LETRAS 0% 20-07/05/2021 EUR 4,595,820.60 6.234,585,000.00
10,613,268.40 14.41
TELEFONICA SA 0% 19/04/2021 EUR 800,901.26 1.09800,000.00Telecommunication
800,901.26 1.09
SANTANDER CONSUMER FIN 0%28/01/2021
EUR 500,006.88 0.68500,000.00Banks
500,006.88 0.68
11,914,176.54 16.18
Total securities portfolio 71,323,135.13 96.87
NameQuantity/Nominal
Market valuein EUR
Currency %NAV
Summary of net assets%
NAV71,323,135.13 96.87Total securities portfolio
1,915,465.37 2.60Cash at bank
388,172.07 0.53Other assets and liabilities
73,626,772.57 100.00Total net assets
MAPFRE AM Notes to the Financial Statements as at December 31, 2020
48
Note 1. General information MAPFRE AM (the “Fund”) is an open-ended investment fund organised under the laws of Luxembourg as a société d'investissement à capital variable (SICAV), incorporated on December 21, 2016 under the form of a public limited liability company (société anonyme) under part I of the Law of 17 December 2010, as amended. The Fund is registered with the Luxembourg trade and companies register under number B 211466. Its deed of incorporation was published in the Luxembourg Official Gazette on January 2, 2017. As at December 31, 2020, the “Fund” has the following Sub-funds open to subscriptions: - MAPFRE AM - Euro Bonds Fund - MAPFRE AM - Short Term Euro - MAPFRE AM - Inclusion Responsable Fund - MAPFRE AM - US Forgotten Value Fund - MAPFRE AM - European Equities - MAPFRE AM - Iberian Equities - MAPFRE AM - Multi Asset Strategy - MAPFRE AM - Good Governance Fund - MAPFRE AM - Global Bond Fund - MAPFRE AM - Behavioral Fund - MAPFRE AM - Capital Responsable Fund As of September 4, 2020, Capital Investment (the “Merging Fund”), a Luxembourg common fund (fonds commun de placement) subject to Part I of the Luxembourg act of 17 December 2010 with registered office at 5, allée Scheffer, L-2520 Luxembourg, Grand Duchy of Luxembourg, registered with the Luxembourg Trade and companies register under number K 1193 and represented by its management company Amundi Luxembourg S.A., has been merged into MAPFRE AM - Global bond Fund (the “Receiving Sub-fund”), a Sub-fund of MAPFRE AM. Note 2. Significant accounting policies 2.1 Presentation of the Financial Statements The Financial Statements of the Fund are established on a going concern basis of accounting in accordance with the Luxembourg legal and regulatory requirements concerning undertakings for collective investment and generally accepted accounting principles in Luxembourg. All the Sub-funds of the Fund have a daily NAV computation. 2.2 Valuation of assets a) Transferable Securities or Money Market Instruments quoted or traded on an official stock exchange or any other Regulated Market, are valued on the basis of the last known price as of the relevant Valuation Day, and, if the securities or Money Market Instruments are listed on several stock exchanges or Regulated Markets, the last known price of the stock exchange which is the principal market for the security or Money Market Instrument in question, unless these prices are not representative. b) For Transferable Securities or Money Market Instruments not quoted or traded on an official stock exchange or any other Regulated Market, and for quoted Transferable Securities or Money Market Instruments, but for which the last known price as of the relevant Valuation Day is not representative, valuation is based on the probable sales price estimated prudently and in good faith by the Board of Directors of the Fund. c) Units and shares issued by UCITS or other UCIs will be valued at their last available net asset value as of the relevant Valuation Day. d) Accrued interest on securities will be taken into account if it is not reflected in the share price. e) All assets denominated in a currency other than the Reference Currency of the respective Sub-fund/Class will be converted at the mid-market conversion rate as of the relevant Valuation Day between the Reference Currency and the currency of denomination.
MAPFRE AM Notes to the Financial Statements as at December 31, 2020 (continued)
49
Note 2. Significant accounting policies (continued) 2.2 Valuation of assets (continued) f) All other securities and other permissible assets as well as any of the above mentioned assets for which the valuation in accordance with the above paragraphs would not be possible or practicable, or would not be representative of their probable realisation value, will be valued at probable realisation value, as determined with care and in good faith pursuant to procedures established by the Board of Directors of the Fund. 2.3 Acquisition cost of securities in the portfolio The acquisition cost of the securities held by each Sub-fund that are denominated in currencies other than the reference currency of the Sub-fund is converted into this currency at the exchange rate prevailing on the date of purchase. 2.4 Net realised gain / (loss) on sales of securities The realised gains and losses on sales of securities are calculated on the basis of the average acquisition cost. 2.5 Investment income Dividend income is recorded at the ex-date, net of any withholding tax. Interest income accrued and payable are recorded, net of any withholding tax. 2.6 Valuation method for futures
Unrealized gains or losses on open futures contracts are calculated as being the net difference, on any Valuation day, between the contract price and the closing price reported on the primary exchange of the futures contracts. These amounts are included in cash at bank in the Statement of Net Assets and in the Statement of Operations and Changes in Net Assets.
2.7 Conversion of foreign currencies Cash at banks, other net assets and liabilities and the market value of the securities in portfolio expressed in currencies other than the currency of the Sub-fund are converted into this currency at the exchange rate prevailing on the date of the report. Income and expenses expressed in currencies other than the currency of the Sub-fund are converted into this currency at the exchange rate prevailing on the date of the transaction. Exchange gains and losses are recorded in the Statement of Operations and Changes in Net Assets. At the date of this report, the exchanges rates used are as follows: 1 EUR = 1.585600 AUD 1 EUR = 126.325450 JPY 1 EUR = 1.558800 CAD 1 EUR = 1,329.142400 KRW 1 EUR = 1.081550 CHF 1 EUR = 24.379850 MXN 1 EUR = 869.332400 CLP 1 EUR = 10.476000 NOK 1 EUR = 26.262000 CZK 1 EUR = 1.699400 NZD 1 EUR = 7.443450 DKK 1 EUR = 4.558950 PLN 1 EUR = 0.895100 GBP 1 EUR = 10.048500 SEK 1 EUR = 362.685000 HUF 1 EUR = 9.094050 TRY 1 EUR = 3.928600 ILS 1 EUR = 1.223550 USD 2.8 Valuation of options contracts A purchaser of a put option has the right, but not the obligation, to sell the underlying instrument at an agreed upon (“Strike price”) to the option seller. A purchaser of a call option has the right, but not the obligation, to purchase the underlying instrument at the strike price from the option seller. Premiums paid by the Sub-fund for purchased options are included in the statement of net assets as an investment. The option is adjusted daily to reflect the current market value of the option and the change is recorded as unrealised appreciation or depreciation. If the option is allowed to expire, the Fund will lose the entire premium that it paid and record a realised loss for the premium amount. Premiums paid for purchased options that are exercised or closed are added to the amounts paid or offset against the proceeds on the underlying investment transaction to determine the realised gain/loss or cost basis of the security. 2.9 Valuation of forward foreign exchange contracts The forward foreign exchange contracts represent obligations of purchase or the sale of foreign currency on the basis of future exchange rates determined at a fixed price at the time of conclusion of the contracts. The unexpired forward foreign exchange contracts are valued at the last “forward” rate available on the valuation dates or at the balance sheet date and unrealised gains or losses are recorded. Realised gains / (losses) and the resulting Changes in unrealised gains or (losses) are included in the Statement of Operations and Changes in Net Assets.
MAPFRE AM Notes to the Financial Statements as at December 31, 2020 (continued)
50
Note 2. Significant accounting policies (continued) 2.10 Interest Rate Swaps (IRS) An Interest Rate Swap is a bilateral agreement in which each party agrees to exchange a series of interest payments for another series of interest payments on the basis of a notional amount serving as the basis of calculation that is generally not exchanged. Interest Rate Swaps are valued on the basis of the present value of future cash flows resulting from interest and notional repayments. Realised gains / (losses) and the resulting changes in unrealised gains or (losses) are included in the Statement of Operations and Changes in Net Assets under item Swaps. 2.11 Combined statements The combined Financial Statements of the Fund are expressed in EUR and are equal to the sum of the corresponding captions in the Financial Statements of each Sub-fund. Note 3. Investment Manager and Management Company fees The Board of Directors of the Fund appointed Waystone Management Company (Lux) S.A. (previously MDO Management Company S.A.) as Management Company by means of the Management Company Agreement to provide management, administration and marketing services. As remuneration for the services of the Management Company, there is a fee up to 0.03% per year of the net assets of the each of the Sub-funds, subject to an annual minimum of EUR 10,000 per Sub-fund. The Management Company has, by means of the Investment Management Agreement, appointed MAPFRE Asset Management S.G.I.I.C S.A. as the Investment Manager of the assets of the Fund. The Investment Manager is remunerated as follows:
Sub-funds name Active shares classes
Investment Management Fees
MAPFRE AM - Euro Bonds Fund Class I EUR 0.50% MAPFRE AM - Short Term Euro Class I EUR 0.15% MAPFRE AM - Inclusion Responsable Fund Class I EUR
Class R EUR 0.50% 1.25%
MAPFRE AM - US Forgotten Value Fund Class I EUR Class R EUR
1.25% 1.75%
MAPFRE AM - European Equities Class I EUR Class R EUR
1.25% 1.75%
MAPFRE AM - Iberian Equities Class I EUR Class R EUR
1.25% 1.75%
MAPFRE AM - Multi Asset Strategy Class I EUR 1.00% MAPFRE AM - Good Governance Fund Class I EUR
Class R EUR 1.25% 1.75%
MAPFRE AM - Global Bond Fund Class I EUR Class R EUR
0.50% 1.00%
MAPFRE AM - Behavioral Fund Class I EUR 1.25% Class R EUR 1.75%
MAPFRE AM - Capital Responsable Fund Class I EUR 1.00% Class R EUR 1.50%
The remuneration of the Investment Manager is recorded under the caption “Investment Manager fees” in the Statement of Operations and Changes in Net Assets. The remuneration of the Management Company is recorded under the caption “Management Company fees” in the Statement of Operations and Changes in Net Assets.
MAPFRE AM Notes to the Financial Statements as at December 31, 2020 (continued)
51
Note 4. Taxe d’abonnement The Fund is governed by Luxembourg tax laws. Under current law and practice, the Fund is liable to an annual registration tax of 0.05% (except those Sub-funds or share categories or classes, which may benefit from the lower rate of 0.01%, i.e. the "Institutions" (considered as institutional investors in accordance with Luxembourg law) category or class of shares of the various Sub-funds). This tax is payable quarterly and calculated on the basis of the Fund’s net assets at the end of the relevant quarter. No duty or other tax will be paid in Luxembourg on the issue of shares of the Fund. Income received by the Fund may be liable to withholding taxes in the country of origin and is thus collected by the Fund after deduction of such tax. This is neither chargeable nor recoverable. Note 5. Depositary and administration fees The Depositary is entitled to receive out of the assets of each Sub-fund a fee of up to 0.50% p.a. calculated on the average of the value of the NAV of the relevant Sub-fund over the relevant period and is payable quarterly in arrears. The Administrative Agent is entitled to receive out of the assets of each Sub-fund a fee of up to 1.00% p.a. calculated on the average of the value of the NAV of the relevant Sub-fund over the relevant period and is payable quarterly in arrears. Note 6. Transaction costs Transaction costs are disclosed under the caption “Transaction costs” in the expenses of the Statement of Operations and Changes in Net Assets and are mainly composed of transaction costs incurred by the Fund relating to purchases or sales of securities, of fees relating to liquidation of transactions paid to the depositary bank and of transaction fees on financial instruments. Note 7. Statement of changes in investments The statement of changes in investments for the year in reference to the report is available free of charge at the registered office of the Fund. Note 8. Swing price The actual cost of purchasing or selling assets and investments for a Sub-fund may deviate from the latest available price or net asset value used, as appropriate, in calculating the net asset value per shares due to duties and charges and spreads from buying and selling prices of the underlying investments. These costs have an adverse effect on the value of a Sub-fund and are known as dilution. To mitigate the effects of dilution, the Fund may, at its discretion, make a dilution adjustment to the net asset value per shares. As at December 31, 2020, the Board of Directors of the Fund has not yet adopted Swing Pricing. Note 9. Futures contracts As at December 31, 2020, the following Sub-funds holds positions in futures contracts. No collateral was pledged by these Sub-funds and their counterparties are as follows: Sub-funds Counterparties
MAPFRE AM - European Equities BNP Paribas Paris MAPFRE AM - Global Bond Fund Société Générale
MAPFRE AM Notes to the Financial Statements as at December 31, 2020 (continued)
52
Note 10. Forward foreign exchange contracts As at December 31, 2020, the following Sub-fund holds positions in forward foreign exchange contracts. The counterparties are as follows: Sub-fund Counterparties
MAPFRE AM - Global Bond Fund Barclays Ireland PLC BNP Paribas Paris Bank of America Securities Europe S.A. Citigroupe Global Market Credit Lyonnais Euro-Securities Ltd Goldman Sachs AG HSBC France/Act.De March J.P. Morgan AG Morgan Stanley Bank AG Royal Bank of Canada UBS Europe SE The Sub-fund has received a collateral for a total of EUR 590,000.00 together with EUR 1,080,000.00. The counterparties are Bank of America Securities Europe S.A. and BNP Paribas Paris. Collateral of EUR 1,080,000.00 is covering also Swaps contracts. Note 11. Options contracts As at December 31, 2020, the Sub-fund MAPFRE AM - Global Bond Fund holds positions in options contracts. The Sub-fund has not pledged any collateral. The counterparty for these positions is Société Générale. Note 12. Swaps contracts As at December 31, 2020, the Sub-fund MAPFRE AM - Global Bond Fund holds positions in Interest rate Swaps contracts. The counterparties for these positions are BNP Paribas Paris and HSBC France. The Sub-fund has given collateral for a total of EUR 40,000.00 to HSBC France. The Sub-fund has received collateral for a total of EUR 1,080,000.00. The counterparty is BNP Paribas Paris. This collateral is covering also Forward foreign exchange contracts. Note 13. Performance fee MAPFRE AM - Inclusion Responsable Fund The Investment Manager is entitled to receive from the Sub-fund a performance fee (the Performance Fee) calculated, and accrued daily as an expense of the relevant Class, over the relevant calendar year (the Performance Period). Provided that the performance of the Sub-Fund since the beginning of the year is positive and exceeds the performance of EURO STOXX 50 Net Return EUR2 (the Reference Index) described hereafter, a daily provision of a maximum of 25 % of the positive difference between the change in the NAV based on the number of units outstanding at the end of the relevant Performance Period (the Calculation Date) and the change in the Reference Index is established. In the event of redemptions, the portion of the performance fee provision corresponding to the redeemed Shares is transferred to the Investment Manager under the crystallization. The whole performance fee is paid to the Investment Manager at year-end. Provision is made for the Performance Fee on each Valuation Day. If the NAV per Share decreases during the Performance Period, the provisions made in respect of the Performance Fee are be reduced accordingly. If these provisions fall to zero, no Performance Fee is payable. The Performance Fee is calculated on the basis of the NAV after deduction of all expenses, liabilities (but not the Performance Fee), and is adjusted to take account all subscriptions, redemptions, dividends and distributions. None of other Sub-funds are subject to performance fees. Note 14. COVID-19 2020 has been characterized for the irruption of COVID-19. This crisis was declared by the World Health Organization (“WHO”) as pandemic and its propagation, together with the measures aimed at controlling and mitigation of its affects, has caused a slow-down on the economic activity which final impact is difficult to quantify.
MAPFRE AM Notes to the Financial Statements as at December 31, 2020 (continued)
53
Note 14. COVID-19 (continued) Under these circumstances, MAPFRE developed from the start of the crisis a series of actions under two main priorities: ensuring health security of all the human capital and ensure the business continuity of operations in such a way that they would allow to keep the level of service provision to clients. Main actions included: - Set-up of the business continuity plan in all countries and units, adapted according to the specific characteristics of the COVID-19 crisis through telework. - Evaluations of risks derived from the crisis and the adoption of a strategy aimed at protecting balance, specially investments, and to preserve the Group´s capital, with the necessary liquidity and finances available that could neutralize any monetary pressure, specially considering operations in emerging countries. - Mobilisation of resources and transfer of funds to the economy by providing economic aid and additional financing to agents, direct suppliers and clients, with special consideration to the SME and self-employed segment. COVID-19 crisis has caused a strong decrease on the world economic activity due to population lock-down, with important impacts on business volumes and returns, high volatility in financial markets and a strong devaluation of currency in emerging countries. Note 15. Other event As of February 3, 2021, MDO Management Company S.A., part of the DMS Group, has changed its name to Waystone Management Company (Lux) S.A. followed by a global group re-branding effective since March 22, 2021.
MAPFRE AM
Other shareholder’s information (unaudited)
54
Investments remuneration policy and UCITS V requirement The management company has adopted a remuneration policy pursuant to applicable laws and regulations with the objective to ensure that its remuneration structure is in line with its interests and those of the collective investment schemes it manages and to prevent risk‐taking which is inconsistent with the risk profiles, rules or articles of incorporation or management regulations of the collective investment schemes it manages. Details of the remuneration policy of the management company, including the persons in charge of determining the fixed and variable remunerations of staffs, a description of the key remuneration elements and an overview of how remuneration is determined, is available at http://www.mdo-manco.com/about-us/legal-documents. With respect to the financial year ended December 31, 2020 (as of that date, the management company had a headcount of 73 employees), the total fixed and variable remuneration paid by the management company to its employees amounted to EUR 5,236,688 and to EUR 1,448,313 respectively. The total remuneration paid by the management company to senior management and members of its staff whose actions have a material impact on the risk profile of the collective investment schemes managed amounted to EUR 3,569,815. The remuneration committee of the management company has reviewed the implementation of the remuneration policy and has not identified any deficiency in that respect. Moreover, the current version of the remuneration policy was updated and approved by the board of directors in the course of the financial year ended December 31, 2020, the current version being dated July 2020. There was no identified need for an update of the policy in the course of the financial year ended 31 December 2020, and a similar assessment will be performed in 2021. SFTR During the year ended December 31, 2020, the Fund did not engage in transactions which are the subject of EU Regulation No 2015/2365 on the transparency of securities financing transactions and of reuse. Accordingly, no global, concentration or transaction data, or information on the reuse or safekeeping of collateral is required to be reported.
Global Exposure and Expected level of leverage The method used to calculate global exposure is the commitment approach for all Sub-funds, except for the MAPFRE AM - Multi Asset Strategy and MAPFRE AM - Global Bond Fund which are using the historical absolute value-at-risk approach ("VAR"). Further details are available below on the use of VAR.
Sub-fund Historical VAR (20 days, 99%) Leverage (sum of notional) Min Max Average Average MAPFRE AM - Multi Asset Strategy 1.24% 8.15% 5.44% 0.05% MAPFRE AM - Global Bond Fund 2.45% 7.31% 4.87% 171.43%