Stora Enso CLT - Matériau millénaire, le bois innove et redevient plus moderne que jamais. - FR
SAMOA�S SECOND NATIONAL COMMUNICATION TO THE UNITED NATIONS FRAMEWORK CONVENTION ON CLIMATE CHANGE
FOREWORD The Samoan Government has made significant progress in its efforts to address climate change since signing the United Nations Framework Convention on Climate Change (UNFCCC) in 1992. With this, our Second National Communication under the UNFCCC, I am pleased to present an updated summary of the steps Samoa has taken to implement the Convention. Samoa, along with its Pacific Island neighbours and all other small island developing states, is particularly vulnerable to the adverse impacts of climate change. Our land, livelihoods, culture and ecosystems are fundamentally threatened by sea level rise and the changing climatic conditions. To the best of our abilities, we in Samoa have been proactive in our efforts to deal with climate change. Amongst other things, this includes adopting policies to minimise our greenhouse gas emissions, implementing practical adaptation projects in vulnerable communities, conducting detailed systematic observation of our climate, educating our people and increasing the resilience of our natural environment. Yet Samoa acting alone can do little to stop the earth�s climate from changing. We are critically dependant on the international community finding the political will to urgently cut global greenhouse gas emissions to safe levels. And while we possess the commitment to address this issue at home, we are also in need of much greater financial and technical support. The Second National Communication brings together the hard work of many within the Samoan public service, my staff from the Meteorology Division in particular the Climate Change section of the ministry, and their colleagues in the National Climate Change Country Team. I now take this opportunity to thank them all for their efforts. I would like also to acknowledge the Global Environment Facility and its supporting donors, the United Nations Development Program, which acted as the implementing agency, as well as the technical support from the National Communication Support Program. Tu�u�u Dr Ieti Taulealo Chief Executive Officer Ministry of Natural Resources & Environment
ACKNOWLEDGEMENTS This report was prepared and published by the Ministry of Natural Resources and Environment with financial assistance from the Global Environment Facility through UNDP. Prepared and compiled by: Anne Rasmussen & Will McGoldrick (MNRE) Close collaboration with: Tu�u�u Dr Ieti Taule�alo (CEO Ministry of Natural Resources & Environment) Mulipola Ausetalia Titimaea (ACEO Meteorology MNRE) National Climate Change Country Team (NCCT) Considerable assistance and support by these key individuals: Aukuso Leavasa (MNRE) Pau Ioane (MNRE) Patila Amosa (NUS) William Cable (NUS) Jacinta Moreau (NUS) Faainu Latu (NUS) Faafetai Sagapolutele Segi Usufono Patrick Rasmussen Silia Ualesi (MoF) Sale Faletolu (EPC) Ueta Faasili (MAF) Ulusapeti Tiitii (MAF) Mose Malaga (MAF) Ricky Faatonu (MAF) Terenia Simanu (MoH) Andrew Peteru (MoH) Sinei Fili Levaai Toremana (SWA) Kuinimeri Asora (SWA) Thomas Soon (SWA) Malaki Iakopo (MNRE) Juney Ward (MNRE) Afele Failagi (MNRE) Paulino Pania (MNRE) Eiko Fuimaono (MNRE) Larissa Toelupe (MNRE) Sunny Seuseu (MNRE Special mention must also be made of the considerable contribution and assistance of the following individuals and organisations:
Solomone Fifita (SPREP) Dean Solofa (RSO Chapter, SPREP) Taulealeausumai Laavasa Malua (Technology Needs Assessment Chapter, IPA) Wairarapa Young (Climate Risk Profile MNRE) UNDP/UNEP/GEF National Communication Support Programme (NCSP) Professor John Hay (Consultant V&A) Will McGoldrick (Consultant/MNRE)
3
ACRONYMS ACEO Assistant Chief Executive Officer ADB Asian Development Bank AFOLU Agriculture Forestry and Land Use CEO Chief Executive Officer CRP Climate Risk Profile CERP Cyclone Emergency Recovery Programme CIMP Coastal Infrastructure Management Plan EPC Electric Power Corporation EIA Environment Impact Assessment EGTT Expert Group on Technology Transfer ENSO El Niño Southern Oscillation FAO Food and Agriculture Organization GEF Global Environment Facility GDP Gross Domestic Product GHG Green House Gas GHGAS Greenhouse Gas Abatement Strategy GCM Global Climate Models IPA Isikuki Punivalu and Associates IPCC Intergovernmental Panel on Climate Change IPPU Industrial Processes and Products Use JICA Japanese International Cooperation Agency KP Kyoto Protocol MNRE Ministry of Natural Resources and Environment MAF Ministry of Agriculture and Fisheries MoH Ministry of Health MWTI Ministry of Natural Resources and Environment NGOs Non-Government Organisations NHS National Health Service NCCP National Climate Change Policy NCCCT National Climate Change Country Team NAPA National Adaptation Programme of Action NHS National Health Services POPs Persistent Organic Pollutants PUMA Planning and Urban Management Agency PIFACC Pacific Islands Framework on Climate Change PIGGAREP Pacific Island Green House Gas abatement Renewable Energy Programme RDIS Research and Development SDS Sustainable Development Strategy SPREP Secretariat of the Pacific Regional Environment Programme SPCZ South Pacific Convergent Zone SOPAC South Pacific Applied Geosciences Commission SWA Samoa Water Authority TNA Technology Needs Assessment UNFCCC United Nations Framework Convention on Climate Change UNDP United Nations Development Program V&A Vulnerability and Adaptation Assessment
4
CONTENTS
FOREWORD ............................................................................................................................................... 2
ACKNOWLEDGEMENTS....................................................................................................................... 3
ACRONYMS................................................................................................................................................ 4
EXECUTIVE SUMMARY......................................................................................................................... 7
1. ATIONAL CIRCUMSTANCESN ......................................................................................................16 1.1 GEOGRAPH Y AN1.2 CLIMATE ....
D GEOLOGY ................................................................................................................... 17
1.3 POPULATIO .................................................................................................................................................... 18N....
1.4 ECONOMY .. .......................................................................................................................................... 18
1.5 AGRICULTU .................................................................................................................................................. 19
1.6 FOREST RE .......................................................................................................................................... 20
1.7 FISHERI RY .................................................................................................................................................. 20
1.8 WATER . ES ................................................................................................................................................... 21.
1.9 HEALTH. ......................................................................................................................................................... 21...
1.10 WASTE ... ...................................................................................................................................................... 22..........
1.11 ENERGY.. ............................................................................................................................................ 22
1.12 TRANSPO .................................................................................................................................................... 23RT ....
1.13 TOURISM ............ ........................................................................................................................................ 23........................................................................................................................................ 24
1.14 BIODIVERSITY ........................................................................................................................................ 24
2. NATIONAL GREENHOUSE GAS INVENTORY ...................................................................26 2.1 INTRODUCTION...................................................... .......................2.2 OVERVIEW AND NAT
........................................................... 27
2.3 TRENDS IN SAMOA�S IONAL EMISSIONS .................................................................................. 27 GHG
2.4 EMISSIONS BY GAS ............. EMISSIONS: 1994-2007........................................................... 29........................
2.5 SECTORAL BREAKDOWN ........................ .......................................................................................... 30.......................................................................................... 33
2.6 BACKGROUND TO THE INVENTORY .......................................................................................... 37
3. VULNERABILITY AND ADAPTATION....................................................................................39 3.1 INTRODUCTION........................................................ ........3.2 CURRENT AND FUTURE
........................................................................ 40
3.3 VULNERABILITIES AND CLIMATE RISKS................................................................................ 42ADVERSE EFFECTS .............
3.4 ADAPTATION OPTIONS ............................................................ ........................................................... 45........................................................... 59
3.5 CONCLUSION & PRIORITY AREAS FOR SUPPORT ........................................................... 61
4. MITIGATION .....................................................................................................................................62 4.1 INTRODUCTION.......................................... ..4.2 EXISTING MITIGATION ACTIVITIES..
............................................................................................ 63
..................4.3 PLANNED MITIGATION IN
.......................................................................... 66
4.4 ADDITIONAL MITIGAT ITIATIVES ............................................................................................ 67
4.5 EMISSIONS SCENAR ION OPPORTUNITIES .......................................................................... 70
IOS .................................................................................................................... 764.6 THE WAY FORWARD ............................................................................................................................. 77
5. OTHER INFORMATION................................................................................................................79
5.1 TECHNOLOGY TRANSFER ...... .................................................5.2 SYSTEMATIC OBSERVATION .................................................
......................................................... 80
.................5.3 EDUCATION, TRAINING AND PUBLIC AWARENESS .................
........................................ 88
........................5.4 CONTRIBUTION OF NGOS AND ACADEMIC INSTITUTIONS ........................
................ 92
................ 955.5 GAPS, NEEDS AND PRIORITIES IN CLIMATE CHANGE INFORMATION ................ 96
REFERENCES .........................................................................................................................................97
ANNEX 1: GHG INVENTORY REPORTING TABLES ...............................................................98
6
EXECUTIVE SUMMARY
NATIONAL CIRCUMSTANCES Samoa is a small island country in the southwest Pacific, comprised of four main inhabited islands and six smaller, uninhabited islands (see Figure 1.1). Samoa has a total land area of roughly 2,900 km2. The capital, Apia, is in the northern part of Upolu. Samoa�s main islands are characterised by a rugged and mountainous topography. Samoa is of volcanic origin, mainly from the Samoa-Uvea hotspot, and the movement of continental plates over a thin, hot spot in the crust. On Upolu, the central mountain range runs along the length of the island with some peaks rising more than 1,000 metres above sea level with the highest peak being Mt Fito at a height of 1,100 metres. Savai�i contains a central core of volcanic peaks reaching the highest point, Mt Silisili, at 1,858 metres. More than 170,000 ha are categorised under forest areas. Around 46% of Upolu and 69% of Savai�i�s total land area is covered by forest. The biggest portion of Upolu�s forest area is made up of open forest and secondary forest, which clearly shows the high degree of forest depletion on the island. Savai�i�s medium forest makes up for the largest portion of the total forest area, more than open forest and secondary forest combined. Samoa�s climate is characterised by high rainfall and humidity, near-uniform temperatures throughout the year, winds dominated by the southeasterly trade winds and the occurrence of tropical cyclones during the southern-hemisphere summer. Samoa has two seasons, marked by significant differences in rainfall. The annual rainfall is about 3,000 mm (varying from 2,500 mm in the northwest parts of the main islands to over 6,000 mm in the highlands of Savai�i) and about 75% of the precipitation occurs between November and February. There are commonly tropical cyclones during Samoa�s wet season, particularly between December and February. Samoa is also vulnerable to anomalously long dry spells that coincide with the El Niño Southern Oscillation (ENSO). Temperatures are generally uniform throughout the year, with a slight seasonal variation. The 2006 census estimated 180,741 persons in Samoa. The population is estimated to have grown at a rate of 0.3�0.9%, per annum between 1971 and 2007. Since Samoa�s independence in 1962, significant levels of emigration have slowed the overall rate of population growth. The New Zealand quota scheme is a contributing factor. The net migration rate estimated for Samoa is 1.6�2.2%, per annum. Samoa has a small and developing economy, with a GDP, as of September 2008, of around US$537 million. Like many other less-developed countries, the Samoan economy depends heavily on natural resources, both for the sustenance of its people and future economic expansion. Samoa�s main primary industries are agriculture and fisheries. Secondary sectors include manufacturing, construction, electricity and water. Tertiary sectors include hospitality (hotels and restaurants) transport, communication, finance and business services. Samoa�s national income depends heavily on international trade, and overseas aid and remittances. Agriculture has traditionally provided the bulk of Samoa�s commodity exports, including cocoanut oil, cocoanut cream, bananas, taro, kava and fish. Exports are subject to a number of constraining factors such as price stability, high transport costs, lack of overseas markets and harsh weather conditions. However, tourism has taken a
7
prominent role in Samoa�s economy. Since 1994, tourism earnings have been the largest source of foreign exchange. Between 1990 and 2000, the number of tourists visiting Samoa increased from 39,414 to 87,688. Visitor numbers are currently growing at an annual rate of 5.1%. The earnings from tourism activities have grown significantly from US$40.6 million in 1999 to US$107.3 million in 2007. Fisheries are critical both for commercial purposes and the sustenance of the populace. According to the 2005 agricultural survey, a total of 5,060 households harvest fish: 77% of households consume all that they catch, 23% sell their surplus at market. Samoa depends upon imported petroleum products for much of its energy needs. Unleaded petrol is widely used for terrestrial and marine transport and automotive diesel is used for electricity generation and heavy machinery. From 2001, diesel has supplied about half of Samoa�s electricity. About 95% of Samoa has access to electricity. The Government�s objective is to change Samoa�s reliance on fossil fuels to renewable energy. The Samoan Government has endorsed the Samoa Energy Policy, which is intended to encourage the use of renewable energy sources like solar, wind, cocoanut oil, and energy from wastes. Currently, Samoa generates up to 50% of its electricity from hydro power plants.
Country�s profile and relevant institutional and policy framework
Location: Oceania. Half way between Hawai�i and New Zealand. Co-ordinates: 13° 35� South, 172° 20� West.
Landforms: Samoa is a volcanic island that has 4 main inhabited islands and 6 smaller, uninhabited islands, with a combined land area of 2,935 km2.
Climate: Tropical rainy season (November to April), dry season (May to October).
Population: Population census of Samoa (2006) � 180,741.
Politics: In 1962, Samoa became the first Pacific island country to achieve independence.
Economy: Samoa has a small and developing economy, with a GDP of around US$537 million as of September 2008. Samoa�s economy is based on agriculture, fisheries, forestry and tourism. Fish and agricultural products are the main exports, and the tourism sector has grown steadily in recent years.
UNFCCC Focal Point:
Ministry of Foreign Affairs and Trade (MFAT)
Ministry of Natural Resources and Environment (MNRE)
Other Stakeholders:
National Climate Change Country Team, academic sector, NGOs, private sector, overseas and local experts, media.
International Relevant Agreements:
Samoa signed the UNFCCC in 1992 and ratified it in 1994. It signed the Kyoto Protocol in 1998 and ratified it in 2000.
Strategy for the Development of Samoa 2008�2012
National Climate Change Policy
National Strategic Documents:
Other relevant documents: the First National Communication report, the National Adaptation Programme of Action and the National Greenhouse Gas Abatement Strategy.
NATIONAL GREENHOUSE GAS INVENTORY
8
> Background and methodology Although Samoa is a small country, the government recognises that all countries must do their part to cut global greenhouse gas (GHG) emissions. As a developing country, Samoa aims to cut GHG emissions, while at the same time continuing to fulfil economic and social development objectives. The GHG inventory helps monitor progress towards this goal, and provides an indication of where the biggest GHG savings can be made. The first inventory of GHG emissions was published in 1999, covering the years 1994�1997. Samoa�s second GHG inventory focused primarily on emissions for the years 2000�2007, but also included a revision of the results from the first GHG inventory to allow a complete assessment of national GHG emission trends. The second inventory was prepared in line with the 2006 Intergovernmental Panel on Climate Change (IPCC) Guidelines for National Greenhouse Gas Inventories (�2006 IPCC Guidelines�). The report covers all relevant sectors: energy, Industrial Processes and Product Use, Agriculture, Forestry and Other Land Use and Waste.
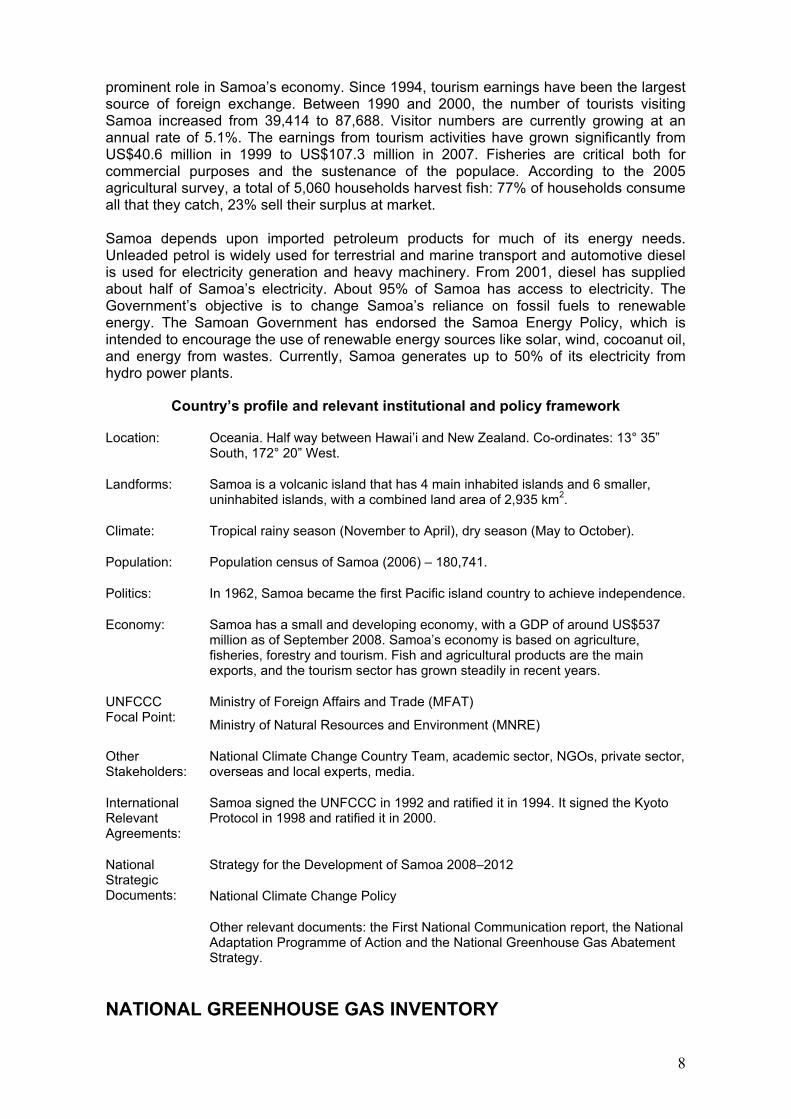
> Overview of results In 2007, Samoa�s GHG emissions totalled approximately 352 Gg CO2-e. CO2 removals in forests and on croplands totalled 785.07 Gg in 2007. A summary of Samoa�s GHG emissions for the years 1994 (base-year), 2000 and 2007 is presented in Table 0.1.
Table 0.1: Summary of Samoa�s GHG emissions for 1994, 2000 and 2007.
1.1.1.1 Gg CO2-e
Sector 1994 2000 2007
Energy 102.83 142.74 174.35
Industrial Processes & Product Use unavailable 4.59 9.51
Agriculture, Forestry & Other Land Use (excluding removals) 37.92 86.06 135.37
Waste 24.88 33.09 32.81
Total Emissions 165.63 266.43 352.03
Estimated CO2 Removals
Agriculture, Forestry & Other Land Use -658.56 -1150.04 -785.07
The second GHG inventory found that 95% of Samoa�s emissions come from just 6 sources (Table 0.2). This has important implications for GHG abatement efforts, as it means that limited resources can target areas where they can have the most effect.
Table 0.2: Top six sources of GHG emissions in Samoa (2007).
Rank Source Emissions (Gg CO2-e) % of total emissions
1 Road Transport 95.11 27%
2 Livestock Farming 88.36 25%
4 N2O from Agricultural Soils 47.01 13%
3 Electricity Generation 44.21 13%
5 Other Energy Consumption 34.14 10%
6 Wastewater 25.44 7%
1.1.1.2 TOTAL 335.15 95%
9
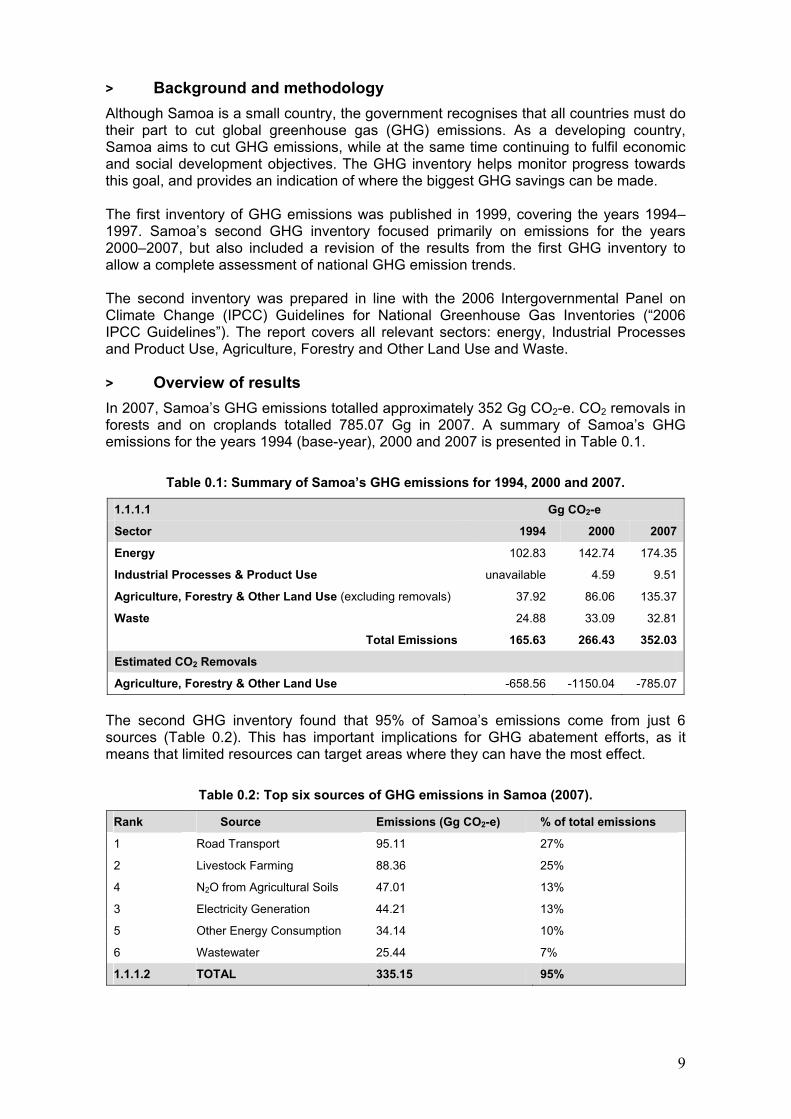
As detailed in Table 0.3, Samoa�s GHG emissions have increased significantly since 1994. In particular, emissions from energy consumption have expanded, in large part due to the expansion of the national grid. Electricity generation rose from 58.82 GWh in 1994 to approximately 111 GWh in 2006. The growth in emissions also reflects the declining share of electricity from hydropower. In 1994, approximately 89% of Samoa�s electricity was supplied through hydropower schemes; by 2006, this figure had declined to 47%.
Table 0.3: GHG emissions from the energy sector in Samoa (Gg CO2-e 1994-2007).
Source 1994 2000 2007 % Change since 1994
% Change since 2000
Electricity generation 8.82 28.96 44.21 401% 53%
Manufacturing & construction - 12.48 16.30 - 31%
Domestic aviation 0.06 0.06 0 -100% -100%
Road transportation 68.93 84.23 95.02 38% 13%
Domestic shipping 2.24 4.22 5.51 146% 31%
Commercial & institutional 1.17 0.93 1.39 19% 50%
Residential energy use 11.20 7.47 6.22 -44% -17%
Fishing 10.40 4.39 5.70 -45% 30%
TOTAL 102.83 142.74 174.35 70% 22%
> Recommendations To strengthen Samoa�s GHG inventory in the coming years, we make the following recommendations: ! Establish a database in which all activity data required for the GHG inventory can
be updated annually. This will accelerate the inventory process and should mean that GHG emissions can be monitored every year.
! Investigate ways the activity data used for the GHG inventory can be made more detailed. This will ensure more accurate estimates, thus reducing any uncertainties associated with the inventory.
! Begin collecting data on local GHG sources. Because of insufficient data, this material was not included in the first inventory. Details of these sources are provided in the methodologies document.
! Update land-cover data for Samoa to allow more accurate estimates of CO2 emissions and removals from forests and other land-use categories.
! Mainstream the GHG inventory as an annual activity. This will mean that GHG abatement efforts can be monitored in a more accurate and meaningful way.
VULNERABILITY & ADAPTATION TO CLIMATE CHANGE
> Introduction Since the First National Communication, a considerable amount of work has been done to assess the vulnerabilities of key sectors and implement adaptation efforts to address them. But insufficient money at a local level, not to mention a lack of financial support from international partners, has meant there are still gaps with respect to starting certain adaptation projects.
10
The Second National Communication (SNC) gave the Ministry of Natural Resources and Environment (MNRE) and the National Climate Change Country Team (NCCCT) the chance to prepare an updated vulnerability and adaptation assessment for Samoa. The MNRE and NCCCT undertook this assessment on a sectoral basis, providing detailed analysis for these six sectors: water resources, health, agriculture, fisheries, biodiversity and infrastructure. Samoa�s past adaptation efforts have been fragmented, with individual sectors implementing their own adaptation measures without reference to a broader context. By adopting a more holistic view, the SNC is part of a growing, cross-sectoral approach to climate change issues and is meant to harmonise current and future adaptation initiatives.
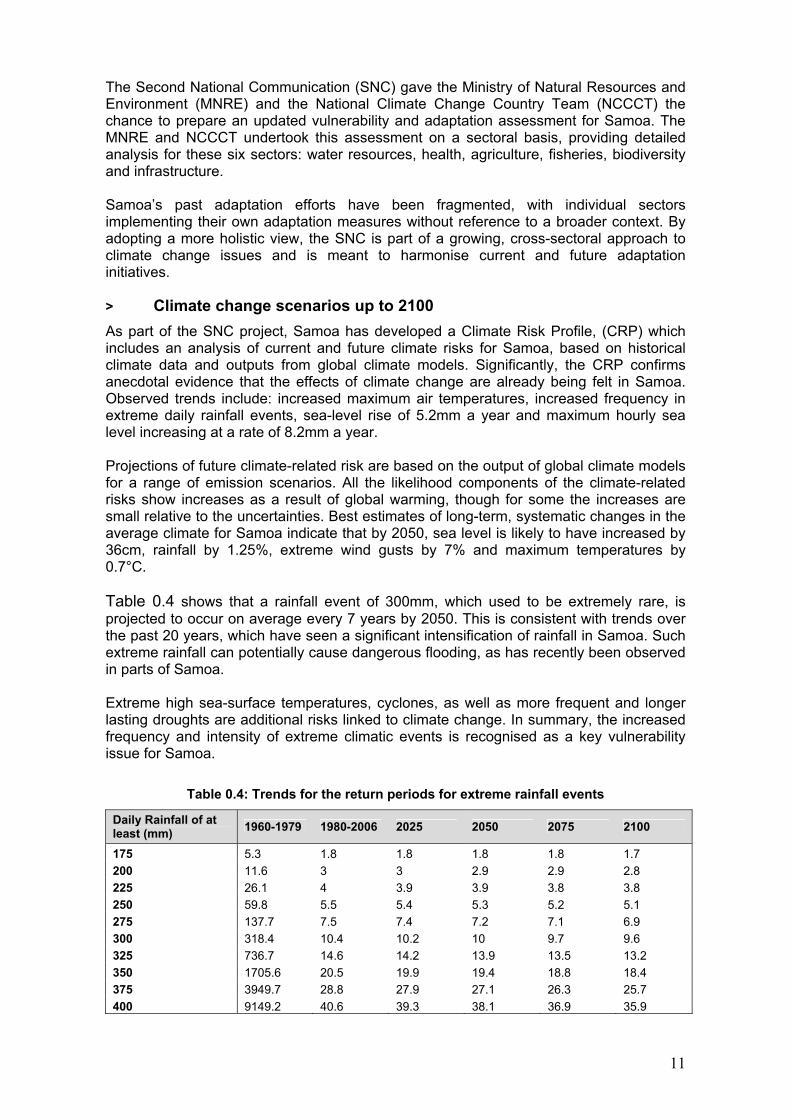
> Climate change scenarios up to 2100 As part of the SNC project, Samoa has developed a Climate Risk Profile, (CRP) which includes an analysis of current and future climate risks for Samoa, based on historical climate data and outputs from global climate models. Significantly, the CRP confirms anecdotal evidence that the effects of climate change are already being felt in Samoa. Observed trends include: increased maximum air temperatures, increased frequency in extreme daily rainfall events, sea-level rise of 5.2mm a year and maximum hourly sea level increasing at a rate of 8.2mm a year. Projections of future climate-related risk are based on the output of global climate models for a range of emission scenarios. All the likelihood components of the climate-related risks show increases as a result of global warming, though for some the increases are small relative to the uncertainties. Best estimates of long-term, systematic changes in the average climate for Samoa indicate that by 2050, sea level is likely to have increased by 36cm, rainfall by 1.25%, extreme wind gusts by 7% and maximum temperatures by 0.7°C. Table 0.4 shows that a rainfall event of 300mm, which used to be extremely rare, is projected to occur on average every 7 years by 2050. This is consistent with trends over the past 20 years, which have seen a significant intensification of rainfall in Samoa. Such extreme rainfall can potentially cause dangerous flooding, as has recently been observed in parts of Samoa. Extreme high sea-surface temperatures, cyclones, as well as more frequent and longer lasting droughts are additional risks linked to climate change. In summary, the increased frequency and intensity of extreme climatic events is recognised as a key vulnerability issue for Samoa.
Table 0.4: Trends for the return periods for extreme rainfall events
Daily Rainfall of at least (mm) 1960-1979 1980-2006 2025 2050 2075 2100
175 5.3 1.8 1.8 1.8 1.8 1.7 200 11.6 3 3 2.9 2.9 2.8 225 26.1 4 3.9 3.9 3.8 3.8 250 59.8 5.5 5.4 5.3 5.2 5.1 275 137.7 7.5 7.4 7.2 7.1 6.9 300 318.4 10.4 10.2 10 9.7 9.6 325 736.7 14.6 14.2 13.9 13.5 13.2 350 1705.6 20.5 19.9 19.4 18.8 18.4 375 3949.7 28.8 27.9 27.1 26.3 25.7 400 9149.2 40.6 39.3 38.1 36.9 35.9
11
> Water resources Water resources are particularly vulnerable to the effects of climate change. Significant problems associated with climate change include: ! periods of low rainfall, resulting in water shortages ! heavy rains that cause flooding and subsequent damage to water infrastructure,
quality and supply ! enforced water rationing to compensate for inconsistent rainfall ! rapid water evaporation, caused by higher temperatures ! salt water despoiling ground water and coastal springs as sea levels rise.
Samoa�s National Adaptation Programme of Action (NAPA) prioritises the water sector and recognises that immediate action must be taken to mitigate the adverse effects of climate change. The vulnerability and adaptation assessment conducted as part of the SNC has confirmed this view, and identified a number of priority adaptation measures, including: ! upgrading and climate-proofing water storage systems to secure supply of high-
quality drinking water for the entire population throughout the year ! improved water quality monitoring to address contamination issues ! ensuring all future developments undergo proper Environmental Impact
Assessments (EIA) to ensure they will not exacerbate pre-existing climate risks ! enforcing sustainable management and water-related legislation to ensure ongoing
availability of high-quality water.
The Government of Samoa recently launched a sector-wide approach to improve the co-ordination of agencies responsible for water management. It is, however, important to note that managing water is not solely the responsibility of Government. Different national entities, communities and individuals must collaborate to ensure that water is managed sustainably.
> Health Local research into the links between climate-related extreme events and water- and vector-borne diseases has been minimal. Current monitoring and surveillance systems cannot provide precise data on disease incidences, and so it is almost impossible to gather and analyse long-term data on how climate change affects human health. There is, however, ample anecdotal evidence to suggest that public-health objectives are closely intertwined with climate-related risks. Indeed, public-health professionals consulted as part of the vulnerability and adaptation assessment confirm that outbreaks of diseases such as typhoid and dengue fever correlate closely with changes in Samoa�s climate. This is in addition to the physical and psychological harm caused by extreme events like cyclones and floods. Current health-sector vulnerabilities are expected to increase over time, particularly given the projected changes in Samoa�s climate. The vulnerability and adaptation assessment found that the current development baseline does not adequately address health problems associated with these changes. The most important adaptation measures involve improving surveillance systems, early response systems and developing sustainable prevention and control programmes. An initiative by MNRE under the National Adaptation programme of Action (NAPA), the
12
National Health Service (NHS) and the United Nations Development Program (UNDP) will develop an integrated adaptation approach to develop an early warning system that can improve climate reporting to the health sector. Raising public awareness will also be particularly important.
> Agriculture Agricultural production is particularly vulnerable to climatic change. Crops can be damaged or destroyed by extreme climate conditions like drought and prolonged heavy rainfall, as well as by isolated extreme events, like cyclones and tropical storms. Climatic variations can also expose crops and livestock to more pests and diseases. These climate-related stresses cause farmers significant financial hardship and disrupt food supply for local and export markets. The assessment conducted as part of the SNC project identified higher temperatures, changing rainfall conditions, heavier winds and sea-level rise as key challenges associated with climate change, which will increase the vulnerability of Samoa�s agriculture sector. Adaptation in the agriculture sector will depend on national policies, planning for projected climatic changes and developing appropriate response measures. At the village level, the emphasis should be on implementing practical adaptation measures that enhance local people�s resilience to climate change. Combined, these activities will facilitate adaptation in commercial and subsistence agriculture and promote food security. More detailed analysis is reflected in the V&A chapter of this report.
> Fisheries The fisheries sector is not only a source of food for the local population � it injects considerable foreign revenue into Samoa�s economy. Data collected by the Samoan fisheries department shows a strong correlation between sea-surface temperatures and stocks for pelagic species. Warmer sea-surface temperatures have been linked to lower catches per-unit effort. In recent years, higher sea-surface temperatures have damaged marine ecosystems, thus affecting near-shore fishing stocks. Coral bleaching has been of particular concern, and Increasingly heavy rainfall has boosted sedimentation levels in coastal waters, again affecting fishing stocks. Each of these climate-related risks is expected to worsen because of climate change. Adaptation measures include managing fisheries resources, establishing marine protected areas and reserves, restoring vital habitats like mangroves and coral reefs, improving public education and devising and implementing sound policy and regulation. Current fisheries policies and systems fail to provide a coherent plan-of-action to address the effects of climate change. The current Fisheries Act 1988, which provides the scope of fisheries, must be updated to include a system capable of addressing climate-change risks. Such a system must focus on a thorough analysis of risks and develop strategies for the sector, based on climate-change projections.
> Biodiversity Samoa�s biological resources are already under stress from a range of factors unrelated to climate change. Climate change may exacerbate these stresses and cause irreversible damage in the medium to long-term through species loss and changes to the ecosystem. Marine species and their habitats are significantly affected by rising sea levels and sea temperatures and by changes in wave action. Rising sea levels compromise the fertility of low-lying agricultural land, exacerbating the already negative effects of increasing temperatures and rainfall. Increasing sea temperatures also pose potential threats to the
13
timing of biological processes of certain species � marine turtles and birds for example � and many species have shown changes in morphology and physiology associated with changes in climatic variables, for instance certain species are reaching sexual maturity faster. Priority adaptation measures identified in this study include: ! replanting mangroves and restoring habitats ! re-introducing native and endemic plants within established national reserves and
parks ! improving the way protection regimes for marine and terrestrial biodiversity are
managed ! reviewing the way different laws, policies, and strategies are implemented.
Although Samoa has developed a stronger understanding of the vulnerabilities and adaptation potentials of its biodiversity, critical information gaps still exist. More must be done to understand the role each species plays in the ecosystem. This would also improve general knowledge of the risks posed by degradation of the ecosystem and species loss.
> Infrastructure Infrastructure development is critical for Samoa�s economic progress. Currently, about 80% of Samoa has access to electricity and water, and the whole country is served by tar-sealed roads. Increasing instances of cyclones and heavy rainfall have major implications for Samoa�s infrastructure. In 1990 and 1991, Samoa was struck by successive cyclones Ofa and Val. High winds, storm surges and heavy rains severely damaged 90% of Samoa�s infrastructure, including the coast of the capital Apia. Given that 70% of Samoa�s population and infrastructure is located along the coastline, erosion linked to rising sea levels poses a significant risk. High-priority adaptation measures include creating a Coastal Infrastructure Management Plan (CIMP) that will improve the resilience of coastal infrastructure against erosion and flooding. New developments must also be managed sustainably to ensure that infrastructure is efficient, environmentally friendly and supports Samoa�s economic growth.
NATIONAL MITIGATION EFFORTS Samoa is committed to reducing GHG emissions to help mitigate the effects of climate change. Samoa has posed the following three questions to help better target mitigation efforts: ! What are the biggest sources of GHG emissions in Samoa? ! Which sectors have the most potential for GHG reductions? ! How can mitigation efforts contribute to national development?
Table 0.5 contains a summary of the additional mitigation opportunities that are available to Samoa. Thus far, Samoa�s most promising mitigation option is to expand its hydropower generation capacity, while vehicle fuel-efficiency improvements and demand-side energy efficiency also hold significant potential. As discussed in more detail below, Samoa will depend on financial and technical support to implement these mitigation opportunities.
14
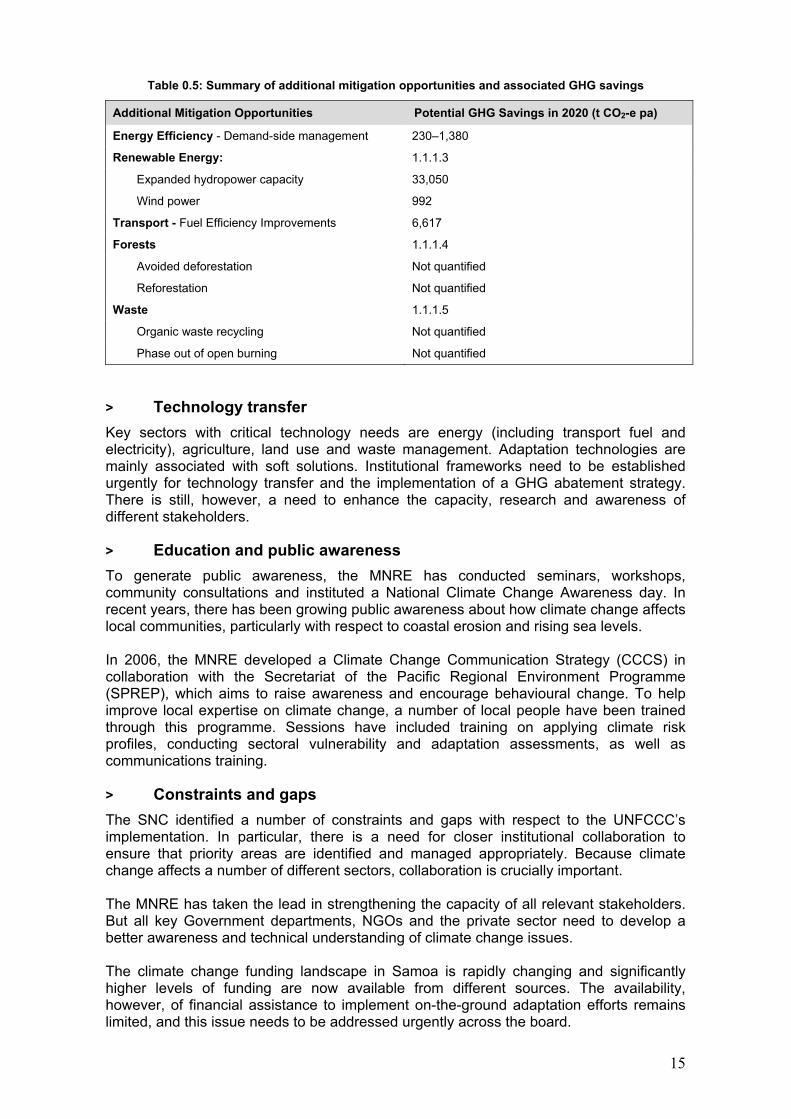
Table 0.5: Summary of additional mitigation opportunities and associated GHG savings
Additional Mitigation Opportunities Potential GHG Savings in 2020 (t CO2-e pa)
Energy Efficiency - Demand-side management 230�1,380
Renewable Energy: 1.1.1.3
Expanded hydropower capacity 33,050
Wind power 992
Transport - Fuel Efficiency Improvements 6,617
Forests 1.1.1.4
Avoided deforestation Not quantified
Reforestation Not quantified
Waste 1.1.1.5
Organic waste recycling Not quantified
Phase out of open burning Not quantified
> Technology transfer Key sectors with critical technology needs are energy (including transport fuel and electricity), agriculture, land use and waste management. Adaptation technologies are mainly associated with soft solutions. Institutional frameworks need to be established urgently for technology transfer and the implementation of a GHG abatement strategy. There is still, however, a need to enhance the capacity, research and awareness of different stakeholders.
> Education and public awareness To generate public awareness, the MNRE has conducted seminars, workshops, community consultations and instituted a National Climate Change Awareness day. In recent years, there has been growing public awareness about how climate change affects local communities, particularly with respect to coastal erosion and rising sea levels. In 2006, the MNRE developed a Climate Change Communication Strategy (CCCS) in collaboration with the Secretariat of the Pacific Regional Environment Programme (SPREP), which aims to raise awareness and encourage behavioural change. To help improve local expertise on climate change, a number of local people have been trained through this programme. Sessions have included training on applying climate risk profiles, conducting sectoral vulnerability and adaptation assessments, as well as communications training.
> Constraints and gaps The SNC identified a number of constraints and gaps with respect to the UNFCCC�s implementation. In particular, there is a need for closer institutional collaboration to ensure that priority areas are identified and managed appropriately. Because climate change affects a number of different sectors, collaboration is crucially important. The MNRE has taken the lead in strengthening the capacity of all relevant stakeholders. But all key Government departments, NGOs and the private sector need to develop a better awareness and technical understanding of climate change issues. The climate change funding landscape in Samoa is rapidly changing and significantly higher levels of funding are now available from different sources. The availability, however, of financial assistance to implement on-the-ground adaptation efforts remains limited, and this issue needs to be addressed urgently across the board.
15
1. NATIONAL CIRCUMSTANCES
16
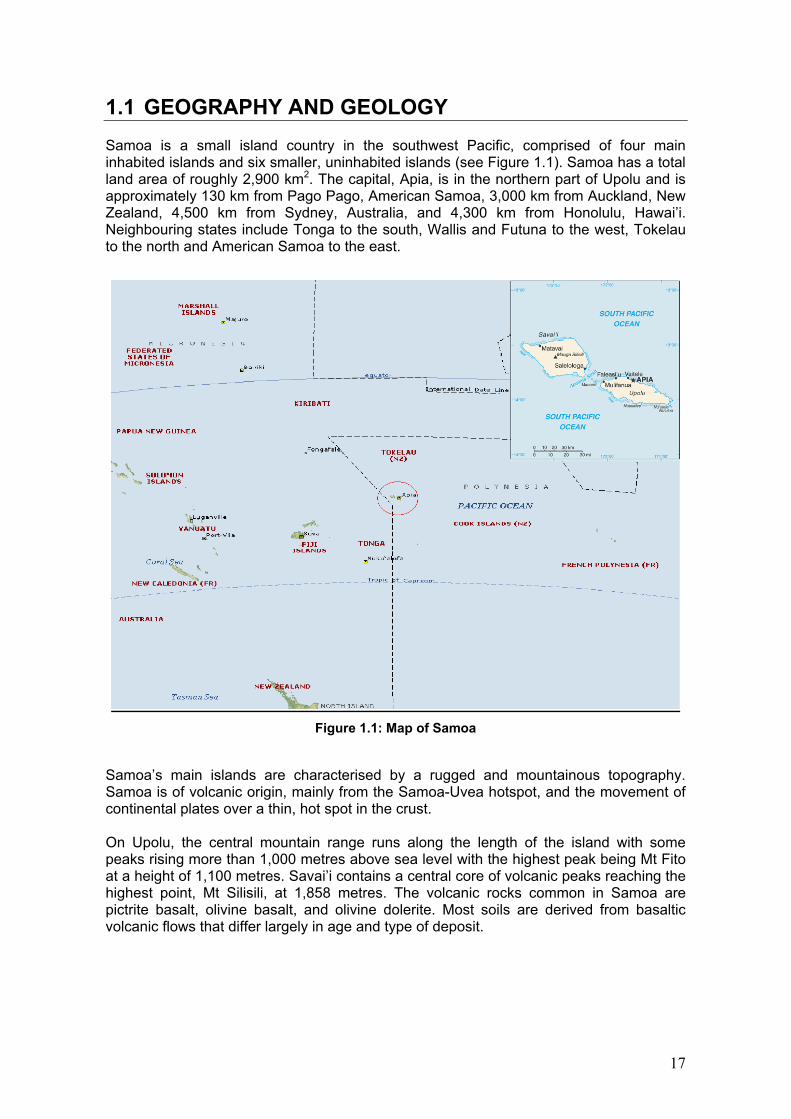
1.1 GEOGRAPHY AND GEOLOGY Samoa is a small island country in the southwest Pacific, comprised of four main inhabited islands and six smaller, uninhabited islands (see Figure 1.1). Samoa has a total land area of roughly 2,900 km2. The capital, Apia, is in the northern part of Upolu and is approximately 130 km from Pago Pago, American Samoa, 3,000 km from Auckland, New Zealand, 4,500 km from Sydney, Australia, and 4,300 km from Honolulu, Hawai�i. Neighbouring states include Tonga to the south, Wallis and Futuna to the west, Tokelau to the north and American Samoa to the east.
Figure 1.1: Map of Samoa
Samoa�s main islands are characterised by a rugged and mountainous topography. Samoa is of volcanic origin, mainly from the Samoa-Uvea hotspot, and the movement of continental plates over a thin, hot spot in the crust. On Upolu, the central mountain range runs along the length of the island with some peaks rising more than 1,000 metres above sea level with the highest peak being Mt Fito at a height of 1,100 metres. Savai�i contains a central core of volcanic peaks reaching the highest point, Mt Silisili, at 1,858 metres. The volcanic rocks common in Samoa are pictrite basalt, olivine basalt, and olivine dolerite. Most soils are derived from basaltic volcanic flows that differ largely in age and type of deposit.
17
1.2 CLIMATE Samoa�s climate is characterised by high rainfall and humidity, near-uniform temperatures throughout the year, winds dominated by the southeasterly trade winds and the occurrence of tropical cyclones during the southern-hemisphere summer. Samoa has two seasons, marked by significant differences in rainfall. Samoa�s wet season lasts from November to April and its dry season starts in May and ends in October. The annual rainfall is about 3,000 mm (varying from 2,500 mm in the northwest parts of the main islands to over 6,000 mm in the highlands of Savai�i) and about 75% of the precipitation occurs between November and February. Samoa�s topography has a significant effect on rainfall distribution. Because of a predominant easterly wind, the mountain ranges determine the distribution of rainfall. Wet areas are generally those located in the southeast and the relatively drier areas are located in the northwest. Temperatures are generally uniform throughout the year, with a slight seasonal variation. The most striking feature of Samoa�s surface winds is the dominance of the southeasterlies. These winds are directly associated with the meridional migration of the South Pacific Convergence Zone (SPCZ). The SPCZ is generally located further north of the Samoan group in winter, but moves southward to Samoa�s latitudes during the summer. Therefore, the southeasterlies prevail in winter months while the wind direction becomes more variable during summer. The close proximity of the SPCZ to the Samoan islands during summer results in the winds being generally stronger than in winter. These periods are characterised by heavy rainfall throughout the country and strong winds. Air pressure is relatively stable with a maximum in August of 1,012 mb and a minimum in January of 1,008 mb. There are commonly tropical cyclones during Samoa�s wet season, particularly between December and February. Samoa is also vulnerable to anomalously long dry spells that coincide with the El Niño Southern Oscillation (ENSO).
1.3 POPULATION At the time of the 2006 census there were 180,741 persons in Samoa, (76% residing in Upolu and 21% in Savai�i) which is a 2.2% (an additional 4,031 persons) increase from the last census in 2001. According to the Statistics Department, 52% of the population is male and 48% is female. The population is estimated to have grown at a rate of 0.3�0.9%, per annum between 1971 and 2007. Since Samoa�s independence in 1962, significant levels of emigration have slowed the overall rate of population growth. The New Zealand quota scheme is a contributing factor. The net migration rate estimated for Samoa is 1.6�2.2%, per annum.
18
0
20,000
40,000
60,000
80,000
100,000
120,000
140,000
160,000
180,000
1950 1955 1960 1965 1970 1975 1980 1985 1990 1995 2000 2005
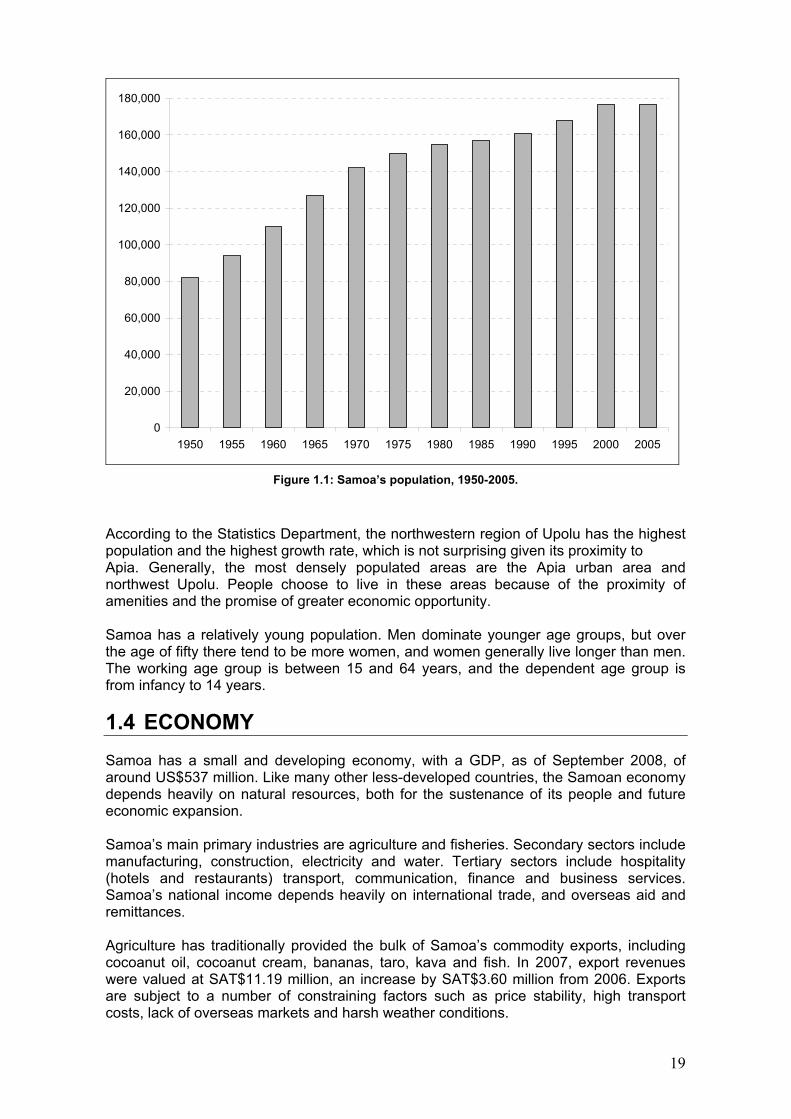
Figure 1.1: Samoa�s population, 1950-2005.
According to the Statistics Department, the northwestern region of Upolu has the highest population and the highest growth rate, which is not surprising given its proximity to Apia. Generally, the most densely populated areas are the Apia urban area and northwest Upolu. People choose to live in these areas because of the proximity of amenities and the promise of greater economic opportunity. Samoa has a relatively young population. Men dominate younger age groups, but over the age of fifty there tend to be more women, and women generally live longer than men. The working age group is between 15 and 64 years, and the dependent age group is from infancy to 14 years.
1.4 ECONOMY Samoa has a small and developing economy, with a GDP, as of September 2008, of around US$537 million. Like many other less-developed countries, the Samoan economy depends heavily on natural resources, both for the sustenance of its people and future economic expansion. Samoa�s main primary industries are agriculture and fisheries. Secondary sectors include manufacturing, construction, electricity and water. Tertiary sectors include hospitality (hotels and restaurants) transport, communication, finance and business services. Samoa�s national income depends heavily on international trade, and overseas aid and remittances. Agriculture has traditionally provided the bulk of Samoa�s commodity exports, including cocoanut oil, cocoanut cream, bananas, taro, kava and fish. In 2007, export revenues were valued at SAT$11.19 million, an increase by SAT$3.60 million from 2006. Exports are subject to a number of constraining factors such as price stability, high transport costs, lack of overseas markets and harsh weather conditions.
19
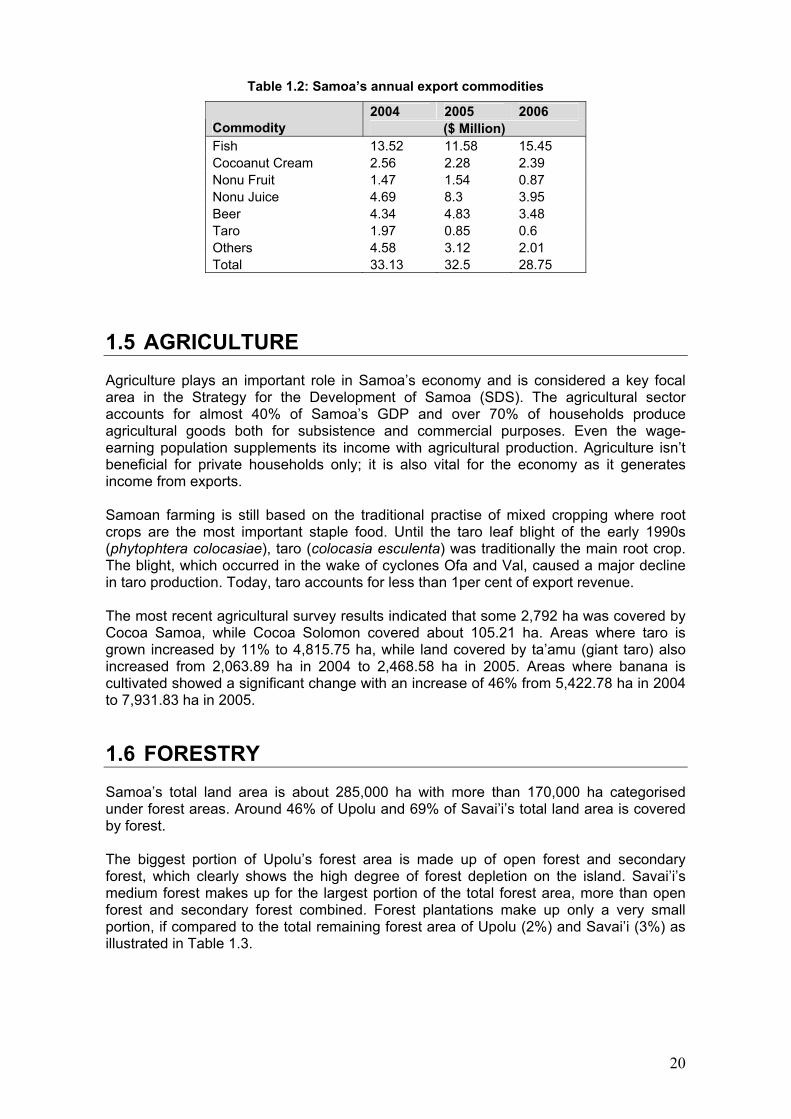
Table 1.2: Samoa�s annual export commodities
2004 2005 2006 Commodity ($ Million) Fish 13.52 11.58 15.45 Cocoanut Cream 2.56 2.28 2.39 Nonu Fruit 1.47 1.54 0.87 Nonu Juice 4.69 8.3 3.95 Beer 4.34 4.83 3.48 Taro 1.97 0.85 0.6 Others 4.58 3.12 2.01 Total 33.13 32.5 28.75
1.5 AGRICULTURE Agriculture plays an important role in Samoa�s economy and is considered a key focal area in the Strategy for the Development of Samoa (SDS). The agricultural sector accounts for almost 40% of Samoa�s GDP and over 70% of households produce agricultural goods both for subsistence and commercial purposes. Even the wage-earning population supplements its income with agricultural production. Agriculture isn�t beneficial for private households only; it is also vital for the economy as it generates income from exports. Samoan farming is still based on the traditional practise of mixed cropping where root crops are the most important staple food. Until the taro leaf blight of the early 1990s (phytophtera colocasiae), taro (colocasia esculenta) was traditionally the main root crop. The blight, which occurred in the wake of cyclones Ofa and Val, caused a major decline in taro production. Today, taro accounts for less than 1per cent of export revenue. The most recent agricultural survey results indicated that some 2,792 ha was covered by Cocoa Samoa, while Cocoa Solomon covered about 105.21 ha. Areas where taro is grown increased by 11% to 4,815.75 ha, while land covered by ta�amu (giant taro) also increased from 2,063.89 ha in 2004 to 2,468.58 ha in 2005. Areas where banana is cultivated showed a significant change with an increase of 46% from 5,422.78 ha in 2004 to 7,931.83 ha in 2005.
1.6 FORESTRY Samoa�s total land area is about 285,000 ha with more than 170,000 ha categorised under forest areas. Around 46% of Upolu and 69% of Savai�i�s total land area is covered by forest. The biggest portion of Upolu�s forest area is made up of open forest and secondary forest, which clearly shows the high degree of forest depletion on the island. Savai�i�s medium forest makes up for the largest portion of the total forest area, more than open forest and secondary forest combined. Forest plantations make up only a very small portion, if compared to the total remaining forest area of Upolu (2%) and Savai�i (3%) as illustrated in Table 1.3.
20
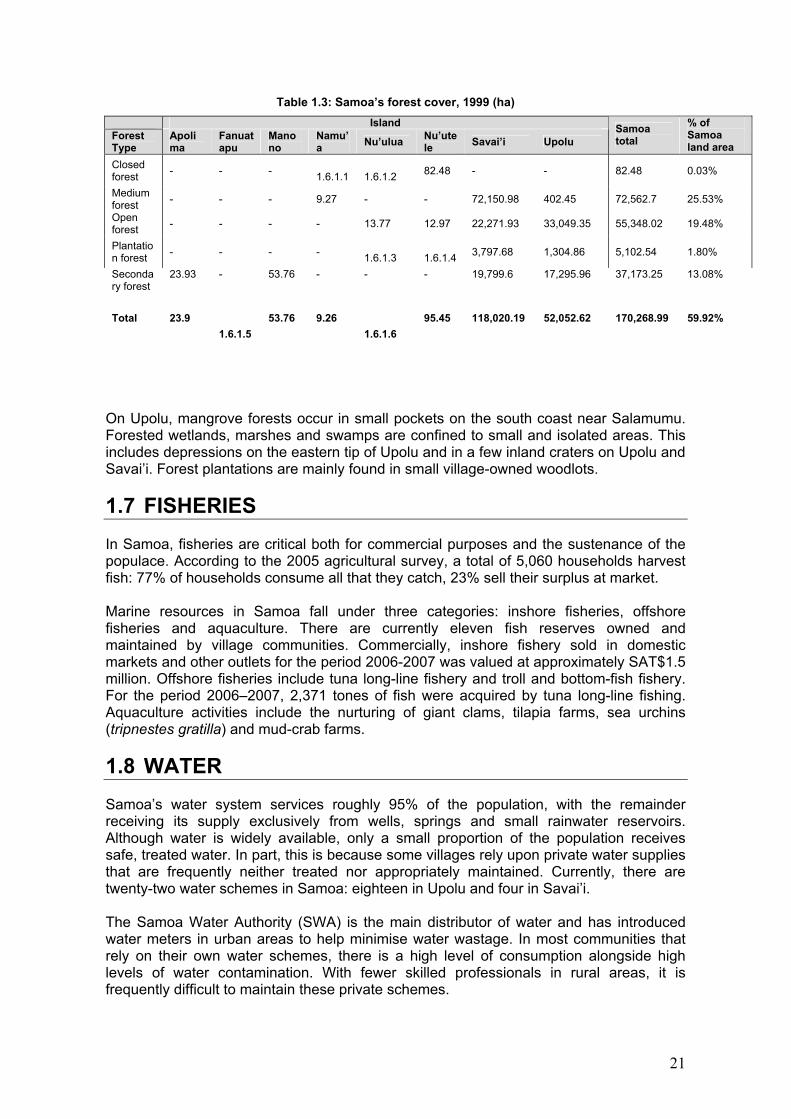
Table 1.3: Samoa�s forest cover, 1999 (ha)
Island Forest Type
Apolima
Fanuatapu
Manono
Namu�a Nu�ulua Nu�ute
le Savai�i Upolu Samoa total
% of Samoa land area
Closed forest - - - 1.6.1.1 1.6.1.2 82.48 - - 82.48 0.03%
Medium forest - - - 9.27 - - 72,150.98 402.45 72,562.7 25.53%
Open forest - - - - 13.77 12.97 22,271.93 33,049.35 55,348.02 19.48%
Plantation forest - - - - 1.6.1.3 1.6.1.4 3,797.68 1,304.86 5,102.54 1.80%
Secondary forest
23.93 - 53.76 - - - 19,799.6 17,295.96 37,173.25 13.08%
Total 23.9 1.6.1.5
53.76 9.26 1.6.1.6
95.45 118,020.19 52,052.62 170,268.99 59.92%
On Upolu, mangrove forests occur in small pockets on the south coast near Salamumu. Forested wetlands, marshes and swamps are confined to small and isolated areas. This includes depressions on the eastern tip of Upolu and in a few inland craters on Upolu and Savai�i. Forest plantations are mainly found in small village-owned woodlots.
1.7 FISHERIES In Samoa, fisheries are critical both for commercial purposes and the sustenance of the populace. According to the 2005 agricultural survey, a total of 5,060 households harvest fish: 77% of households consume all that they catch, 23% sell their surplus at market. Marine resources in Samoa fall under three categories: inshore fisheries, offshore fisheries and aquaculture. There are currently eleven fish reserves owned and maintained by village communities. Commercially, inshore fishery sold in domestic markets and other outlets for the period 2006-2007 was valued at approximately SAT$1.5 million. Offshore fisheries include tuna long-line fishery and troll and bottom-fish fishery. For the period 2006�2007, 2,371 tones of fish were acquired by tuna long-line fishing. Aquaculture activities include the nurturing of giant clams, tilapia farms, sea urchins (tripnestes gratilla) and mud-crab farms.
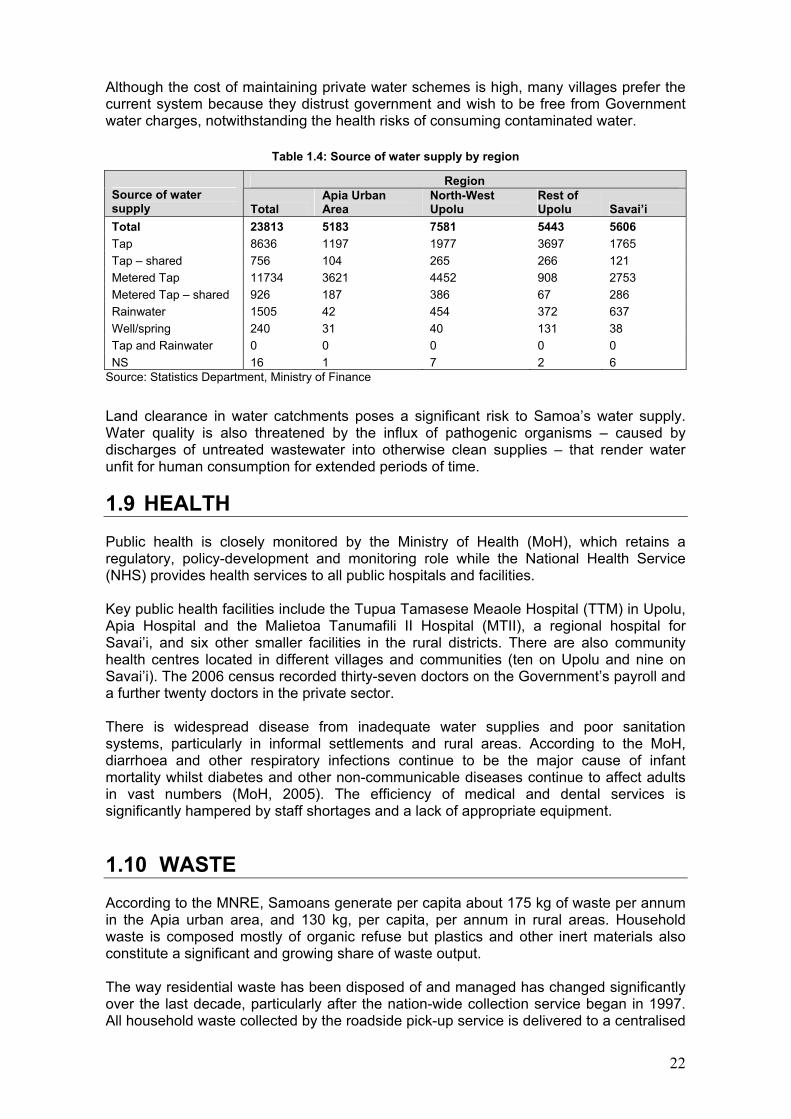
1.8 WATER Samoa�s water system services roughly 95% of the population, with the remainder receiving its supply exclusively from wells, springs and small rainwater reservoirs. Although water is widely available, only a small proportion of the population receives safe, treated water. In part, this is because some villages rely upon private water supplies that are frequently neither treated nor appropriately maintained. Currently, there are twenty-two water schemes in Samoa: eighteen in Upolu and four in Savai�i. The Samoa Water Authority (SWA) is the main distributor of water and has introduced water meters in urban areas to help minimise water wastage. In most communities that rely on their own water schemes, there is a high level of consumption alongside high levels of water contamination. With fewer skilled professionals in rural areas, it is frequently difficult to maintain these private schemes.
21
Although the cost of maintaining private water schemes is high, many villages prefer the current system because they distrust government and wish to be free from Government water charges, notwithstanding the health risks of consuming contaminated water.
Table 1.4: Source of water supply by region
Region Source of water supply Total
Apia Urban Area
North-West Upolu
Rest of Upolu Savai�i
Total 23813 5183 7581 5443 5606 Tap 8636 1197 1977 3697 1765 Tap � shared 756 104 265 266 121 Metered Tap 11734 3621 4452 908 2753 Metered Tap � shared 926 187 386 67 286 Rainwater 1505 42 454 372 637 Well/spring 240 31 40 131 38 Tap and Rainwater 0 0 0 0 0 NS 16 1 7 2 6
Source: Statistics Department, Ministry of Finance
Land clearance in water catchments poses a significant risk to Samoa�s water supply. Water quality is also threatened by the influx of pathogenic organisms � caused by discharges of untreated wastewater into otherwise clean supplies � that render water unfit for human consumption for extended periods of time.
1.9 HEALTH Public health is closely monitored by the Ministry of Health (MoH), which retains a regulatory, policy-development and monitoring role while the National Health Service (NHS) provides health services to all public hospitals and facilities. Key public health facilities include the Tupua Tamasese Meaole Hospital (TTM) in Upolu, Apia Hospital and the Malietoa Tanumafili II Hospital (MTII), a regional hospital for Savai�i, and six other smaller facilities in the rural districts. There are also community health centres located in different villages and communities (ten on Upolu and nine on Savai�i). The 2006 census recorded thirty-seven doctors on the Government�s payroll and a further twenty doctors in the private sector. There is widespread disease from inadequate water supplies and poor sanitation systems, particularly in informal settlements and rural areas. According to the MoH, diarrhoea and other respiratory infections continue to be the major cause of infant mortality whilst diabetes and other non-communicable diseases continue to affect adults in vast numbers (MoH, 2005). The efficiency of medical and dental services is significantly hampered by staff shortages and a lack of appropriate equipment.
1.10 WASTE According to the MNRE, Samoans generate per capita about 175 kg of waste per annum in the Apia urban area, and 130 kg, per capita, per annum in rural areas. Household waste is composed mostly of organic refuse but plastics and other inert materials also constitute a significant and growing share of waste output. The way residential waste has been disposed of and managed has changed significantly over the last decade, particularly after the nation-wide collection service began in 1997. All household waste collected by the roadside pick-up service is delivered to a centralised
22
solid waste disposal site (SWDS). The roadside collection service began in the Apia urban area only, but by 2000 the collection service was extended to whole of Upolu and Savai�i. In 2005, it was further expanded to cover the islands of Apolima and Manono. The current semi-aerobic landfill system used at the Upolu SWDS (Tafaigata) opened in 2004. This replaced the old, unmanaged dump that had been in operation at the same site since 1995. Before 1995, waste was dumped at the Vaitoloa mangroves. The current semi-aerobic landfill system used on Savai�i came into operation in 2006, before which waste was dumped at the Vaia�ata quarry. Before the national roadside collection service was established, residential waste was usually managed by individual households, which burnt waste or buried it in shallow pits on or near their property. The Tafaigata landfill is the main landfill on the island of Upolu, and is located 10 km west of Apia. The landfill is about 40 ha and contains house waste, incombustible bulky waste, sludge and medical waste. Tafaigata landfill uses the Fukuoka method (a semi aerobic landfill structure) of waste disposal, as introduced to Samoa by the Japanese International Cooperation agency (JICA). The Fukuoka method involves the creation of leachate collection ponds, using local materials like old tyres and waste drums, and pipes that aerate the dumped rubbish, thus lowering carbon dioxide and methane emissions. Leachate is caught in pipes and sent to leachate collection ponds to be treated. The leachate is processed through a treatment facility that employs natural cleaning methods rather than chemical ones. This system has proven to be effective and has helped manage Samoa�s waste more efficiently. Other waste-management measures that the Government has adopted include fining companies and individuals for dumping waste illegally, improving waste collection systems and duplicating the Fukuoka waste treatment facility on Savai�i.
1.11 ENERGY Samoa depends upon imported petroleum products for much of its energy needs. Unleaded petrol is widely used for terrestrial and marine transport and automotive diesel is used for electricity generation and heavy machinery. From 2001, diesel has supplied about half of Samoa�s electricity. About 95% of Samoa has access to electricity. The Government�s objective is to change Samoa�s reliance on fossil fuels to renewable energy. The Samoan Government has endorsed the Samoa Energy Policy, which is intended to encourage the use of renewable energy sources like solar, wind, cocoanut oil, and energy from wastes. Currently, Samoa generates up to 50% of its electricity from hydro power plants, subject of course to variations in rainfall and demand. But as demand for electricity has grown, so has dependence on diesel generators. In the medium term, with financial and technical assistance, Samoa plans to expand its hydropower generating capacity and diversify into wind, solar and cocoanut oil-energy generation.
1.12 TRANSPORT Road networks are relatively reliable in Samoa. According to the Ministry of Works, Transport and Infrastructure (MWTI), there is approximately 429 km of tar-sealed road on Upolu and 238 km on Savai�i. Unsealed roads are about 190 km in total. Modes of
23
transportation include privately owned vehicles, buses and taxis. Although road networks are reliable, the Government must continue to ensure that roads are maintained and improved where necessary, particularly in times of heavy rain and flooding. Three major wharfs service Samoa�s maritime transportation: Matautu wharf in Apia, Mulifanua wharf in the far-west of Upolu and Salelologa wharf in Savai�i. Matautu wharf is the main international port for immigrants to Samoa, and accommodates almost all international sea freight traffic. Mulifanua wharf serves as an inter-island teriminus between Upolu and Salelologa wharf in Savai�i.
1.13 TOURISM Tourism offers great potential for foreign exchange and employment for local site operators, both in resorts and in tourist-related services. Some communities and families in rural areas have set up small beach fale (beach huts) for tourists and locals. In line with Samoa Tourism Authority (STA) policy, tourism developments must be consistent with Samoan culture and traditions. Since 1994, tourism earnings have been the largest source of foreign exchange. Between 1990 and 2000, the number of tourists visiting Samoa increased from 39,414 to 87,688. Visitor numbers are currently growing at an annual rate of 5.1%. The earnings from tourism activities have grown significantly from US$40.6 million in 1999 to US$107.3 million in 2007. The relevant authorities must undertake Environmental Impact Assessments (EIA) before allowing tourist developments to be built. The Development Consent process under the PUMA Act aims to ensure that the environment is protected whilst simultaneously being available for sustainable tourism activities. Some tourism establishments have already undertaken EIA, which has proven to be very successful in terms of improving designs and managements plans.
1.14 BIODIVERSITY Samoan native fauna is comprised of thirteen terrestrial mammals, with three that are native to the Samoan islands: the Samoan flying fox (Pteropus Samoensis), the Tongan flying fox (Pteropus Tonganus) and the sheath-tailed bat (Emballonura Semi Candata). Introduced species include the Polynesian rat (Rattus Exulans), pigs, dogs, cattle, horses, goats, cats, other species of rat and the domestic mouse, which was introduced by early colonists. There are thirty-five species of land birds and twenty-one sea and shore birds, with eight being endemic and four introduced, including the common myna bird (Acridontheres Trisis). Fourteen species of lizard and one snake have been recorded in Samoa. Fresh water fish species include the Mosquito Fish and the Topminnow, which were introduced as a biological control for mosquitoes. There are twenty-one species of butterfly with two that are endemic. There are also twenty species of snail, which are highly threatened by the spread of the Giant African Snail. Samoa has nineteen species of ants. Samoan flora consists of ninety-six families, 298 genera and nearly 500 species, of which 32% are endemic. Native ferns consist of 521 families, seventy-one genera and about 220 species. Today, half of Samoa�s flora is composed of introduced species, some of which are beneficial to agriculture and the environment, and some of which have been highly destructive. A common pest today is the mile-a-minute vine (Mikania Micarantha), which was introduced to help with agricultural activities but has since become a pest.
24
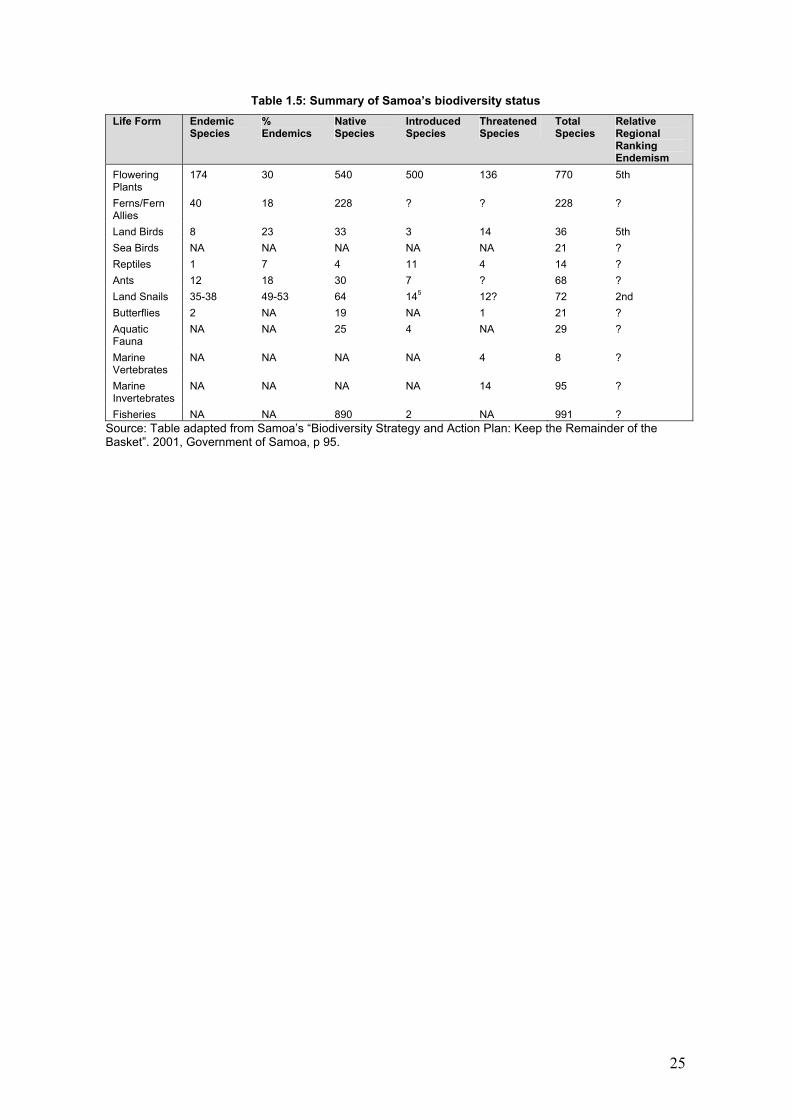
Table 1.5: Summary of Samoa�s biodiversity status
Life Form Endemic Species
% Endemics
Native Species
Introduced Species
Threatened Species
Total Species
Relative Regional Ranking Endemism
Flowering Plants
174 30 540 500 136 770 5th
Ferns/Fern Allies
40 18 228 ? ? 228 ?
Land Birds 8 23 33 3 14 36 5th Sea Birds NA NA NA NA NA 21 ? Reptiles 1 7 4 11 4 14 ? Ants 12 18 30 7 ? 68 ? Land Snails 35-38 49-53 64 145 12? 72 2nd Butterflies 2 NA 19 NA 1 21 ? Aquatic Fauna
NA NA 25 4 NA 29 ?
Marine Vertebrates
NA NA NA NA 4 8 ?
Marine Invertebrates
NA NA NA NA 14 95 ?
Fisheries NA NA 890 2 NA 991 ? Source: Table adapted from Samoa�s �Biodiversity Strategy and Action Plan: Keep the Remainder of the Basket�. 2001, Government of Samoa, p 95.
25
2. NATIONAL GREENHOUSE GAS INVENTORY
26
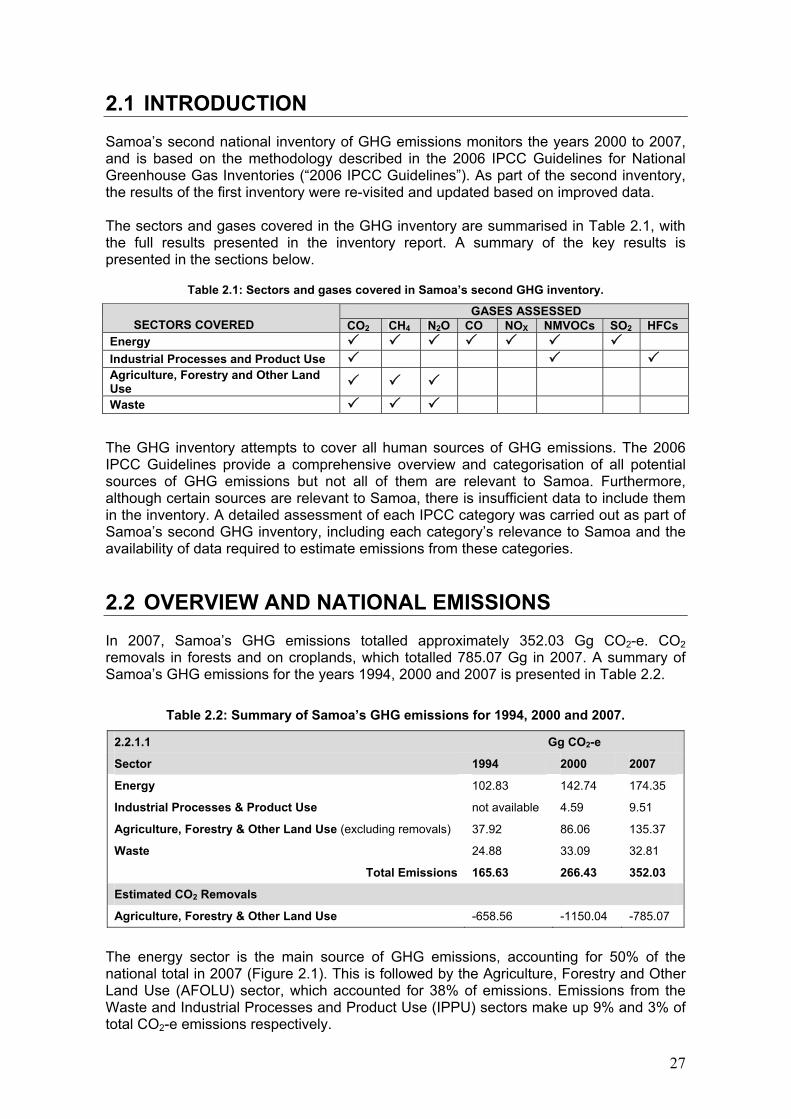
2.1 INTRODUCTION Samoa�s second national inventory of GHG emissions monitors the years 2000 to 2007, and is based on the methodology described in the 2006 IPCC Guidelines for National Greenhouse Gas Inventories (�2006 IPCC Guidelines�). As part of the second inventory, the results of the first inventory were re-visited and updated based on improved data. The sectors and gases covered in the GHG inventory are summarised in Table 2.1, with the full results presented in the inventory report. A summary of the key results is presented in the sections below.
Table 2.1: Sectors and gases covered in Samoa�s second GHG inventory.
GASES ASSESSED SECTORS COVERED CO2 CH4 N2O CO NOX NMVOCs SO2 HFCs
Energy ! ! ! ! ! ! ! Industrial Processes and Product Use ! ! ! Agriculture, Forestry and Other Land Use ! ! ! Waste ! ! !
The GHG inventory attempts to cover all human sources of GHG emissions. The 2006 IPCC Guidelines provide a comprehensive overview and categorisation of all potential sources of GHG emissions but not all of them are relevant to Samoa. Furthermore, although certain sources are relevant to Samoa, there is insufficient data to include them in the inventory. A detailed assessment of each IPCC category was carried out as part of Samoa�s second GHG inventory, including each category�s relevance to Samoa and the availability of data required to estimate emissions from these categories.
2.2 OVERVIEW AND NATIONAL EMISSIONS In 2007, Samoa�s GHG emissions totalled approximately 352.03 Gg CO2-e. CO2 removals in forests and on croplands, which totalled 785.07 Gg in 2007. A summary of Samoa�s GHG emissions for the years 1994, 2000 and 2007 is presented in Table 2.2.
Table 2.2: Summary of Samoa�s GHG emissions for 1994, 2000 and 2007.
2.2.1.1 Gg CO2-e
Sector 1994 2000 2007
Energy 102.83 142.74 174.35
Industrial Processes & Product Use not available 4.59 9.51
Agriculture, Forestry & Other Land Use (excluding removals) 37.92 86.06 135.37
Waste 24.88 33.09 32.81
Total Emissions 165.63 266.43 352.03
Estimated CO2 Removals
Agriculture, Forestry & Other Land Use -658.56 -1150.04 -785.07
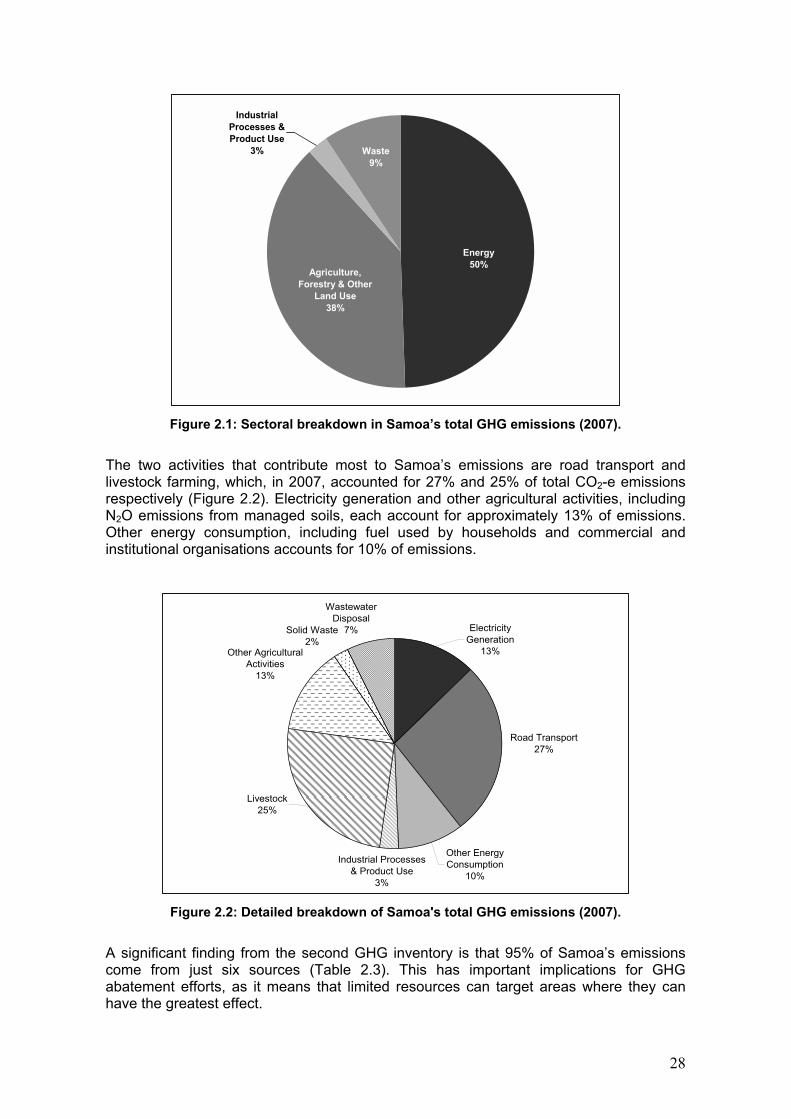
The energy sector is the main source of GHG emissions, accounting for 50% of the national total in 2007 (Figure 2.1). This is followed by the Agriculture, Forestry and Other Land Use (AFOLU) sector, which accounted for 38% of emissions. Emissions from the Waste and Industrial Processes and Product Use (IPPU) sectors make up 9% and 3% of total CO2-e emissions respectively.
27
Energy50%
Agriculture, Forestry & Other
Land Use38%
Industrial Processes & Product Use
3% Waste9%
Figure 2.1: Sectoral breakdown in Samoa�s total GHG emissions (2007).
The two activities that contribute most to Samoa�s emissions are road transport and livestock farming, which, in 2007, accounted for 27% and 25% of total CO2-e emissions respectively (Figure 2.2). Electricity generation and other agricultural activities, including N2O emissions from managed soils, each account for approximately 13% of emissions. Other energy consumption, including fuel used by households and commercial and institutional organisations accounts for 10% of emissions.
Industrial Processes & Product Use
3%
Solid Waste2%
Wastewater Disposal
7%
Livestock25%
Road Transport27%
Electricity Generation
13%Other Agricultural Activities
13%
Other Energy Consumption
10%
Figure 2.2: Detailed breakdown of Samoa's total GHG emissions (2007).
A significant finding from the second GHG inventory is that 95% of Samoa�s emissions come from just six sources (Table 2.3). This has important implications for GHG abatement efforts, as it means that limited resources can target areas where they can have the greatest effect.
28
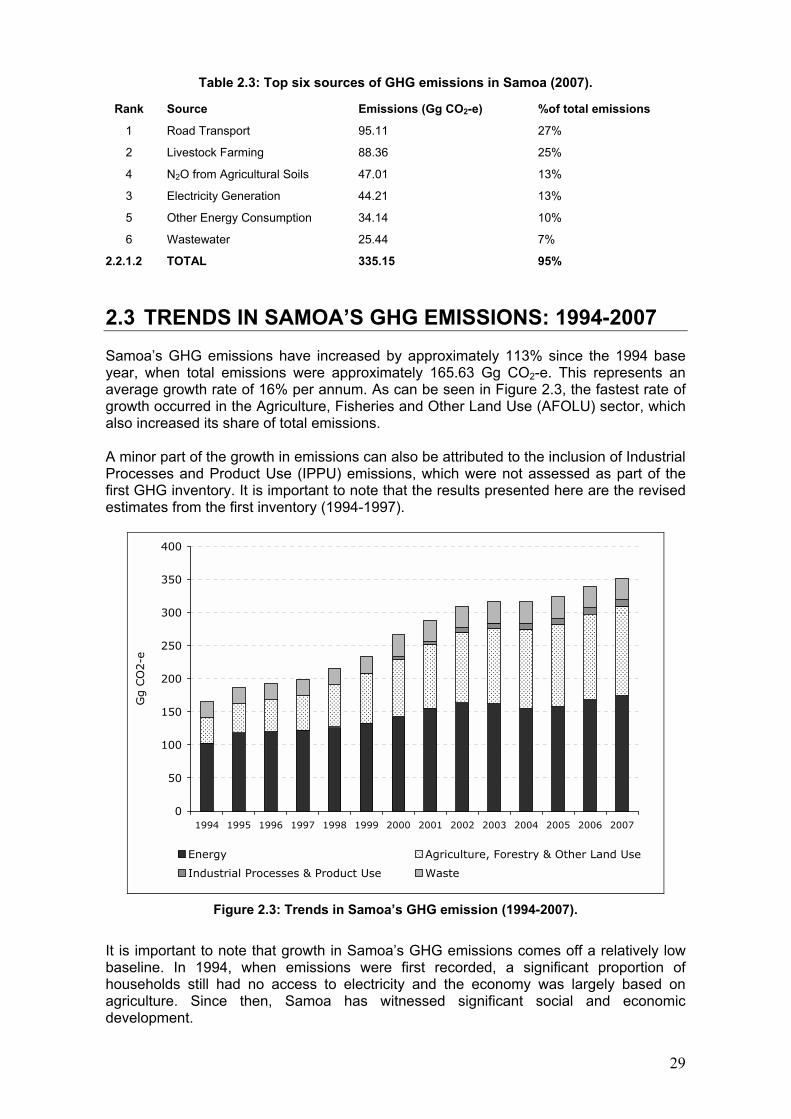
Table 2.3: Top six sources of GHG emissions in Samoa (2007).
Rank Source Emissions (Gg CO2-e) %of total emissions
1 Road Transport 95.11 27%
2 Livestock Farming 88.36 25%
4 N2O from Agricultural Soils 47.01 13%
3 Electricity Generation 44.21 13%
5 Other Energy Consumption 34.14 10%
6 Wastewater 25.44 7%
2.2.1.2 TOTAL 335.15 95%
2.3 TRENDS IN SAMOA�S GHG EMISSIONS: 1994-2007 Samoa�s GHG emissions have increased by approximately 113% since the 1994 base year, when total emissions were approximately 165.63 Gg CO2-e. This represents an average growth rate of 16% per annum. As can be seen in Figure 2.3, the fastest rate of growth occurred in the Agriculture, Fisheries and Other Land Use (AFOLU) sector, which also increased its share of total emissions. A minor part of the growth in emissions can also be attributed to the inclusion of Industrial Processes and Product Use (IPPU) emissions, which were not assessed as part of the first GHG inventory. It is important to note that the results presented here are the revised estimates from the first inventory (1994-1997).
0
50
100
150
200
250
300
350
400
1994 1995 1996 1997 1998 1999 2000 2001 2002 2003 2004 2005 2006 2007
Gg
CO
2-e
Energy Agriculture, Forestry & Other Land Use
Industrial Processes & Product Use Waste
Figure 2.3: Trends in Samoa�s GHG emission (1994-2007).
It is important to note that growth in Samoa�s GHG emissions comes off a relatively low baseline. In 1994, when emissions were first recorded, a significant proportion of households still had no access to electricity and the economy was largely based on agriculture. Since then, Samoa has witnessed significant social and economic development.
29
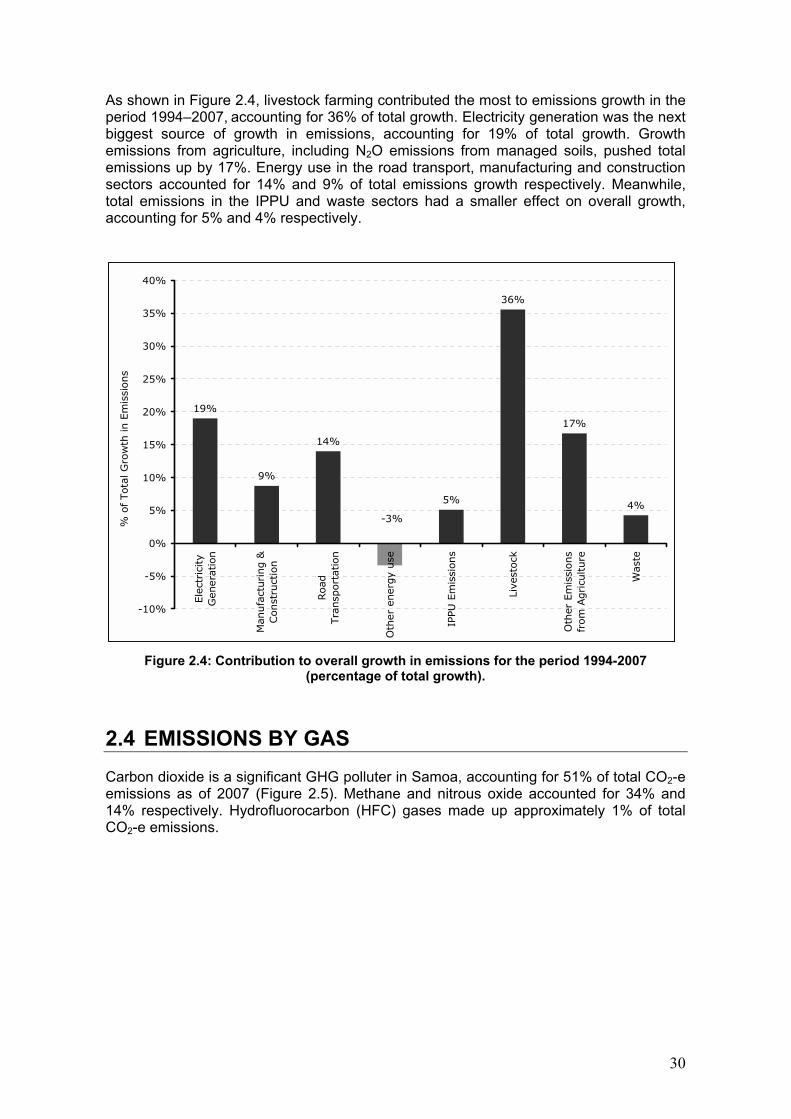
As shown in Figure 2.4, livestock farming contributed the most to emissions growth in the period 1994�2007, accounting for 36% of total growth. Electricity generation was the next biggest source of growth in emissions, accounting for 19% of total growth. Growth emissions from agriculture, including N2O emissions from managed soils, pushed total emissions up by 17%. Energy use in the road transport, manufacturing and construction sectors accounted for 14% and 9% of total emissions growth respectively. Meanwhile, total emissions in the IPPU and waste sectors had a smaller effect on overall growth, accounting for 5% and 4% respectively.
19%
9%
14%
5%
36%
17%
4%-3%
-10%
-5%
0%
5%
10%
15%
20%
25%
30%
35%
40%
Elec
tric
ity
Gen
erat
ion
Man
ufac
turing
&Con
stru
ctio
n
Roa
dTr
ansp
orta
tion
Oth
er e
nerg
y us
e
IPPU
Em
issi
ons
Live
stoc
k
Oth
er E
mis
sion
sfr
om A
gric
ultu
re
Was
te
% o
f To
tal G
row
th in
Em
issi
ons
Figure 2.4: Contribution to overall growth in emissions for the period 1994-2007
(percentage of total growth).
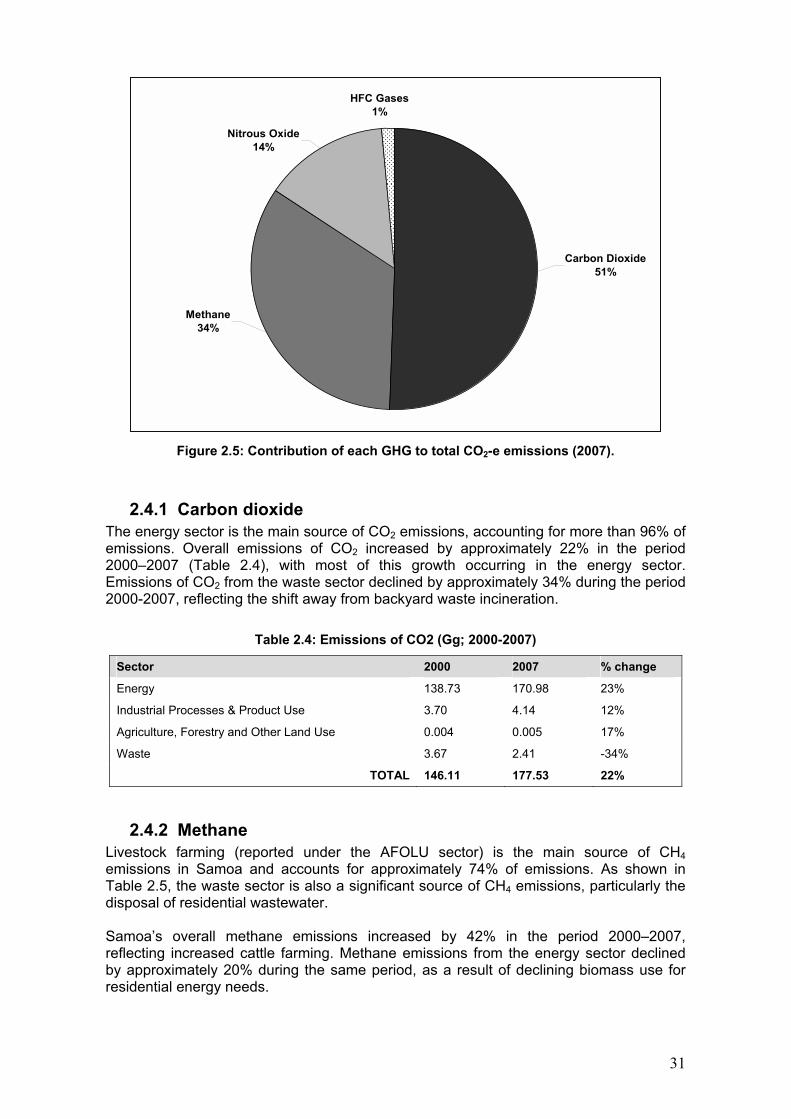
2.4 EMISSIONS BY GAS Carbon dioxide is a significant GHG polluter in Samoa, accounting for 51% of total CO2-e emissions as of 2007 (Figure 2.5). Methane and nitrous oxide accounted for 34% and 14% respectively. Hydrofluorocarbon (HFC) gases made up approximately 1% of total CO2-e emissions.
30
HFC Gases1%
Nitrous Oxide14%
Methane34%
Carbon Dioxide51%
Figure 2.5: Contribution of each GHG to total CO2-e emissions (2007).
2.4.1 Carbon dioxide The energy sector is the main source of CO2 emissions, accounting for more than 96% of emissions. Overall emissions of CO2 increased by approximately 22% in the period 2000�2007 (Table 2.4), with most of this growth occurring in the energy sector. Emissions of CO2 from the waste sector declined by approximately 34% during the period 2000-2007, reflecting the shift away from backyard waste incineration.
Table 2.4: Emissions of CO2 (Gg; 2000-2007)
Sector 2000 2007 % change
Energy 138.73 170.98 23%
Industrial Processes & Product Use 3.70 4.14 12%
Agriculture, Forestry and Other Land Use 0.004 0.005 17%
Waste 3.67 2.41 -34%
TOTAL 146.11 177.53 22%
2.4.2 Methane Livestock farming (reported under the AFOLU sector) is the main source of CH4 emissions in Samoa and accounts for approximately 74% of emissions. As shown in Table 2.5, the waste sector is also a significant source of CH4 emissions, particularly the disposal of residential wastewater. Samoa�s overall methane emissions increased by 42% in the period 2000�2007, reflecting increased cattle farming. Methane emissions from the energy sector declined by approximately 20% during the same period, as a result of declining biomass use for residential energy needs.
31
Table 2.5: Emissions of CH4 (Gg; 2000-2007)
Sector 2000 2007 % change
Energy 0.062 0.050 -20%
Industrial Processes and Product Use 0 0 0
Agriculture, Forestry and Other Land Use 2.58 4.21 63%
Waste 1.36 1.42 4%
TOTAL 4.00 5.69 42%
2.4.3 Nitrous oxide As shown in Table 2.6, in 2007 total N2O emissions reached 0.16 Gg, with approximately 94% of these emissions coming from the AFOLU sector. Despite falls in the Energy, IPPU and Waste sectors, strong growth in livestock farming pushed overall N2O emissions up by 40% during the period 2000-2007.
Table 2.6: Emissions of N2O (Gg; 2000-2007)
Sector 2000 2007 % change
Energy 0.009 0.007 -14%
Industrial Processes and Product Use 0.0005 0.0004 -31%
Agriculture, Forestry and Other Land Use 0.10 0.15 48%
Waste 0.003 0.002 -35%
TOTAL 0.12 0.16 40%
2.4.4 Hydrofluorocarbons Emissions of HFC reached 5.25 Gg CO2-e in 2007, which represents a 630% increase from 2000 levels when emissions were estimated to be 0.72 Gg CO2-e. The main reason for the growth in HFC levels is the shift to these gases for use in air conditioning and refrigeration units, in lieu of ozone depleting CFCs.
2.4.5 Indirect and precursor emissions The second GHG inventory also recorded indirect and precursor emissions, which are not included in Samoa�s aggregate emissions because they do not have global warming potential values. This includes carbon monoxide (CO), oxides of nitrogen (NOX), non-methane volatile organic compounds (NMVOC) and sulphur dioxide (SO2), which are reported separately in Table 2.7.
Table 2.7: Indirect and precursor emissions, excluded from total CO2-e emissions (2007)
CO NOX NMVOCs SO2Sector
Gg Gg Gg Gg
Energy 10.14 0.90 1.73 0.29
Agriculture, Forestry & Other Land Use - - - -
Industrial Processes & Product Use - - 0.10 -
Waste 0.0002 0.0003 - 0.0002
TOTAL 10.14 0.90 1.83 0.29
The trends in indirect and precursor emissions are summarised in Table 2.8. In the period 2000�2007, emissions of CO and NMVOC declined by 17% and 9% respectively, reflecting the shift away from biomass as fuel for cooking. In the same period, emissions
32
of NOX and SO2 rose by 7% and 3% respectively, as a result of increased fossil fuel usage.
Table 2.8: Trends in indirect and pre-cursor emissions, by gas (Gg; 2000-2007)
Gas 2000 2007 % change
CO 12.19 10.14 -17%
NOX 0.86 0.90 7%
NMVOC 2.02 1.83 -9%
SO2 0.29 0.29 2%
2.5 SECTORAL BREAKDOWN
2.5.1 Energy In 2007, emissions from the energy sector accounted for approximately 50% of total GHG emissions (174.35 Gg CO2-e), reflecting Samoa�s heavy reliance on imported petroleum products to meet its energy requirements. Emissions from energy use increased by approximately 70% in the period 1994�2007 (Table 2.9).
Table 2.9: GHG emissions from the energy sector in Samoa (Gg CO2-e 1994�2007).
Source 1994 2000 2007 % Change since 1994
% Change since 2000
Electricity Generation 8.82 28.96 44.21 401% 53%
Manufacturing & Construction - 12.48 16.30 - 31%
Domestic Aviation 0.06 0.06 0 -100% -100%
Road Transportation 68.93 84.23 95.02 38% 13%
Domestic Shipping 2.24 4.22 5.51 146% 31%
Commercial & Institutional 1.17 0.93 1.39 19% 50%
Residential energy use 11.20 7.47 6.22 -44% -17%
Fishing 10.40 4.39 5.70 -45% 30%
TOTAL 102.83 142.74 174.35 70% 22%
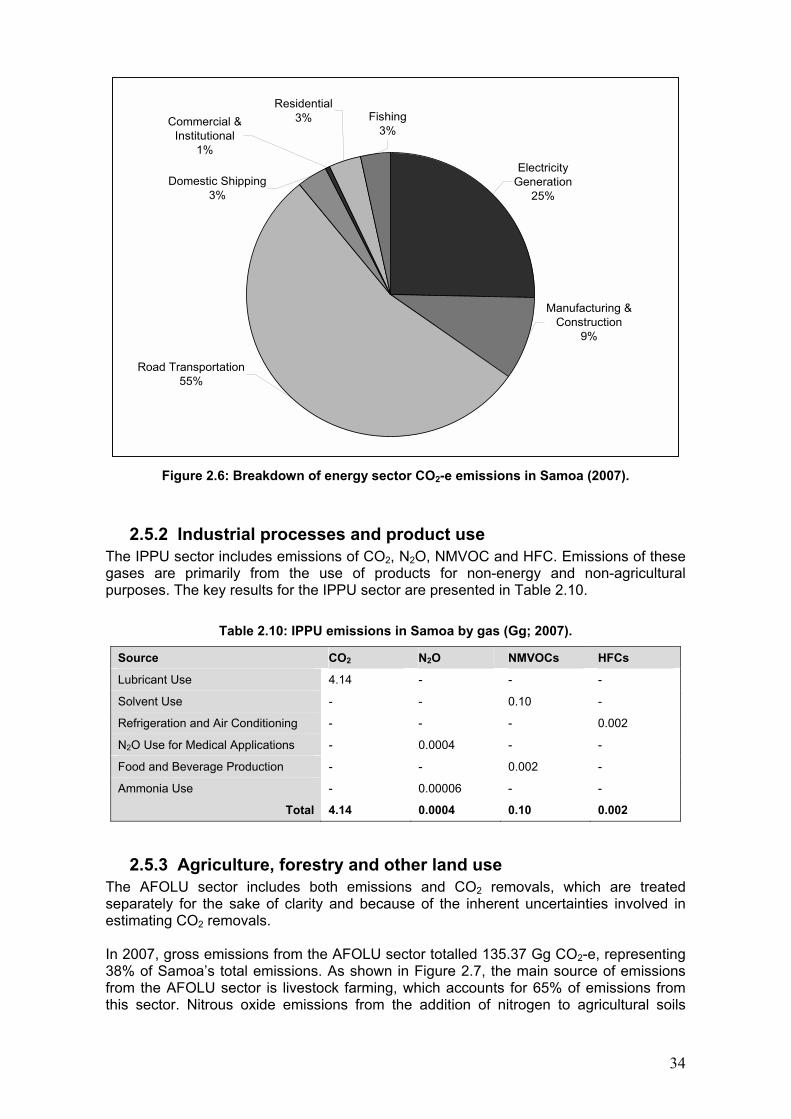
As shown in Figure 2.6, road transportation (55%) and electricity generation (25%) are the two biggest sources of GHG emissions in the energy sector. Energy use for manufacturing and construction (9%) is the third biggest contributor to emissions in the energy sector. Energy used by households (excluding electricity), fishing and for shipping each accounts for 3% of energy sector emissions.
33
Electricity Generation
25%
Road Transportation55%
Fishing3%
Residential3%Commercial &
Institutional1%
Domestic Shipping3%
Manufacturing & Construction
9%
Figure 2.6: Breakdown of energy sector CO2-e emissions in Samoa (2007).
2.5.2 Industrial processes and product use The IPPU sector includes emissions of CO2, N2O, NMVOC and HFC. Emissions of these gases are primarily from the use of products for non-energy and non-agricultural purposes. The key results for the IPPU sector are presented in Table 2.10.
Table 2.10: IPPU emissions in Samoa by gas (Gg; 2007).
Source CO2 N2O NMVOCs HFCs
Lubricant Use 4.14 - - -
Solvent Use - - 0.10 -
Refrigeration and Air Conditioning - - - 0.002
N2O Use for Medical Applications - 0.0004 - -
Food and Beverage Production - - 0.002 -
Ammonia Use - 0.00006 - -
Total 4.14 0.0004 0.10 0.002
2.5.3 Agriculture, forestry and other land use The AFOLU sector includes both emissions and CO2 removals, which are treated separately for the sake of clarity and because of the inherent uncertainties involved in estimating CO2 removals. In 2007, gross emissions from the AFOLU sector totalled 135.37 Gg CO2-e, representing 38% of Samoa�s total emissions. As shown in Figure 2.7, the main source of emissions from the AFOLU sector is livestock farming, which accounts for 65% of emissions from this sector. Nitrous oxide emissions from the addition of nitrogen to agricultural soils
34
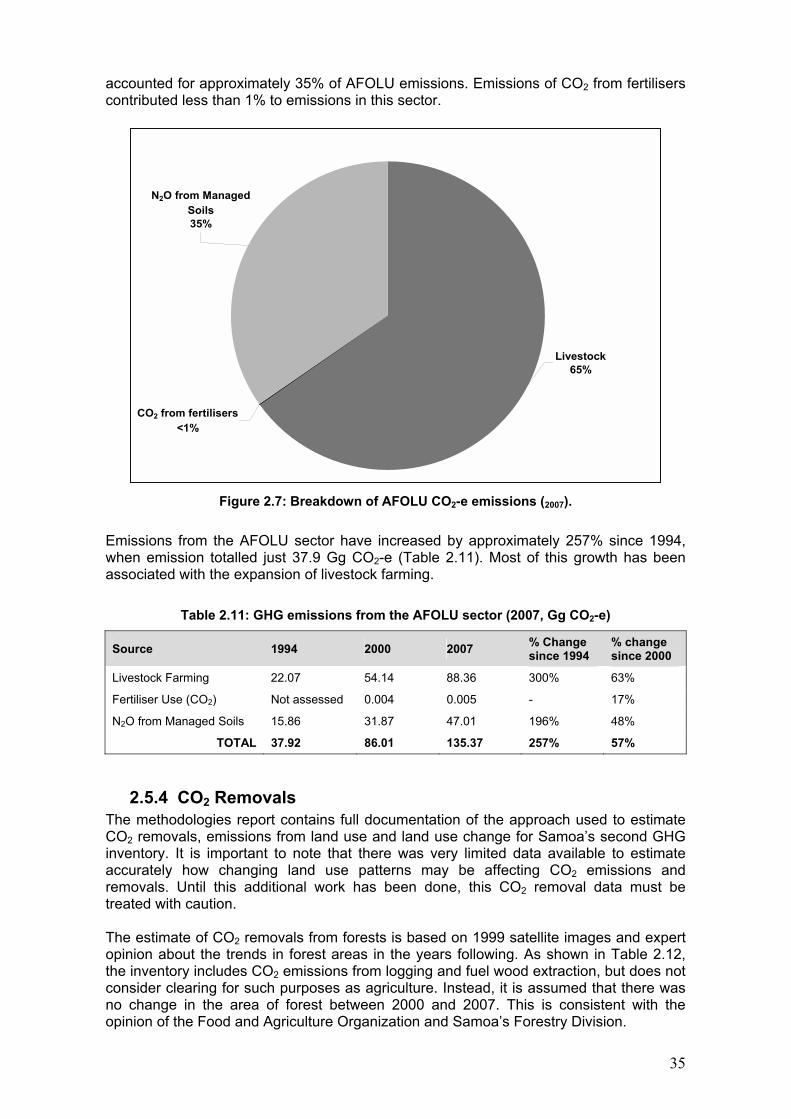
accounted for approximately 35% of AFOLU emissions. Emissions of CO2 from fertilisers contributed less than 1% to emissions in this sector.
N2O from Managed Soils35%
CO2 from fertilisers<1%
Livestock65%
Figure 2.7: Breakdown of AFOLU CO2-e emissions (2007).
Emissions from the AFOLU sector have increased by approximately 257% since 1994, when emission totalled just 37.9 Gg CO2-e (Table 2.11). Most of this growth has been associated with the expansion of livestock farming.
Table 2.11: GHG emissions from the AFOLU sector (2007, Gg CO2-e)
Source 1994 2000 2007 % Change since 1994
% change since 2000
Livestock Farming 22.07 54.14 88.36 300% 63%
Fertiliser Use (CO2) Not assessed 0.004 0.005 - 17%
N2O from Managed Soils 15.86 31.87 47.01 196% 48%
TOTAL 37.92 86.01 135.37 257% 57%
2.5.4 CO2 Removals The methodologies report contains full documentation of the approach used to estimate CO2 removals, emissions from land use and land use change for Samoa�s second GHG inventory. It is important to note that there was very limited data available to estimate accurately how changing land use patterns may be affecting CO2 emissions and removals. Until this additional work has been done, this CO2 removal data must be treated with caution. The estimate of CO2 removals from forests is based on 1999 satellite images and expert opinion about the trends in forest areas in the years following. As shown in Table 2.12, the inventory includes CO2 emissions from logging and fuel wood extraction, but does not consider clearing for such purposes as agriculture. Instead, it is assumed that there was no change in the area of forest between 2000 and 2007. This is consistent with the opinion of the Food and Agriculture Organization and Samoa�s Forestry Division.
35
Although there is some anecdotal evidence to suggest that forests are being cleared for cattle farming, the general contraction in Samoa�s agricultural sector since the taro blight of the 1990s suggests that some former croplands may have reverted to forest. Without up-to-date satellite imagery, the net effect of these processes on CO2 emissions cannot be accurately assessed. The accuracy of these results can only be confirmed if and when new satellite imagery is made available and a comprehensive forest resource assessment is undertaken. If new images reveal that the overall area of forest has declined, then the estimates of CO2 removals and emissions from this source will need to be revised.
Table 2.12: Net CO2 removals from forests (Gg CO2, 2000-2007).
Annual Gg CO2 Emitted / Removed (forests)
Source/Sink of CO2 2000 2001 2002 2003 2004 2005 2006 2007
Biomass Growth (removal) -805.43 -805.43 -805.43 -805.43 -805.43 -805.43 -805.43 -805.43
Logging (emissions) 71.74 85.40 87.65 56.23 49.23 61.46 13.20 13.20
Fuelwood (Emissions) 28.43 27.12 24.88 22.83 20.94 19.21 16.09 14.76
Net Removals -705.27 -692.91 -692.90 -726.38 -735.26 -724.76 -776.14 -777.47
Two perennial crop species were assessed as part of the second GHG inventory: cocoanut and cocoa. Data from the Ministry of Agriculture and Fisheries (MAF) shows a downward trend in the total area of these two species under cultivation. As shown in Table 2.13, the inventory assessed CO2 removals through biomass growth for both these crops and CO2 emissions associated with their clearance. The trend observed for the period 2000�2007 is that the net amount of CO2 removed from the atmosphere (because of biomass growth on croplands) is declining because of clearance.
Table 2.13: Net CO2 removals on croplands (Gg CO2, 2000-2007)
Annual Gg CO2 Emitted / Removed
Source/Sink of CO2 2000 2001 2002 2003 2004 2005 2006 2007
Clearance of coconut and cocoa (Emissions)
400.10 400.10 400.10 338.62 305.04 372.20 338.62 338.62
Biomass growth of coconut and cocoa (Removals)
-844.87 -764.85 -684.83 -617.11 -556.10 -481.66 -413.94 -346.22
Net CO2 Removals -444.78 -364.76 -284.74 -278.49 -251.07 -109.46 -75.32 -7.6
2.5.5 Waste Emissions from the waste sector totalled 32.81 Gg CO2-e in 2007, which was approximately 9% of Samoa�s total CO2-e emissions. As shown in Figure 2.8, the biggest source of emissions in this sector is wastewater management and discharge (78%), followed by open burning of waste (13%), solid waste management (9%) and waste incineration (<1%).
36
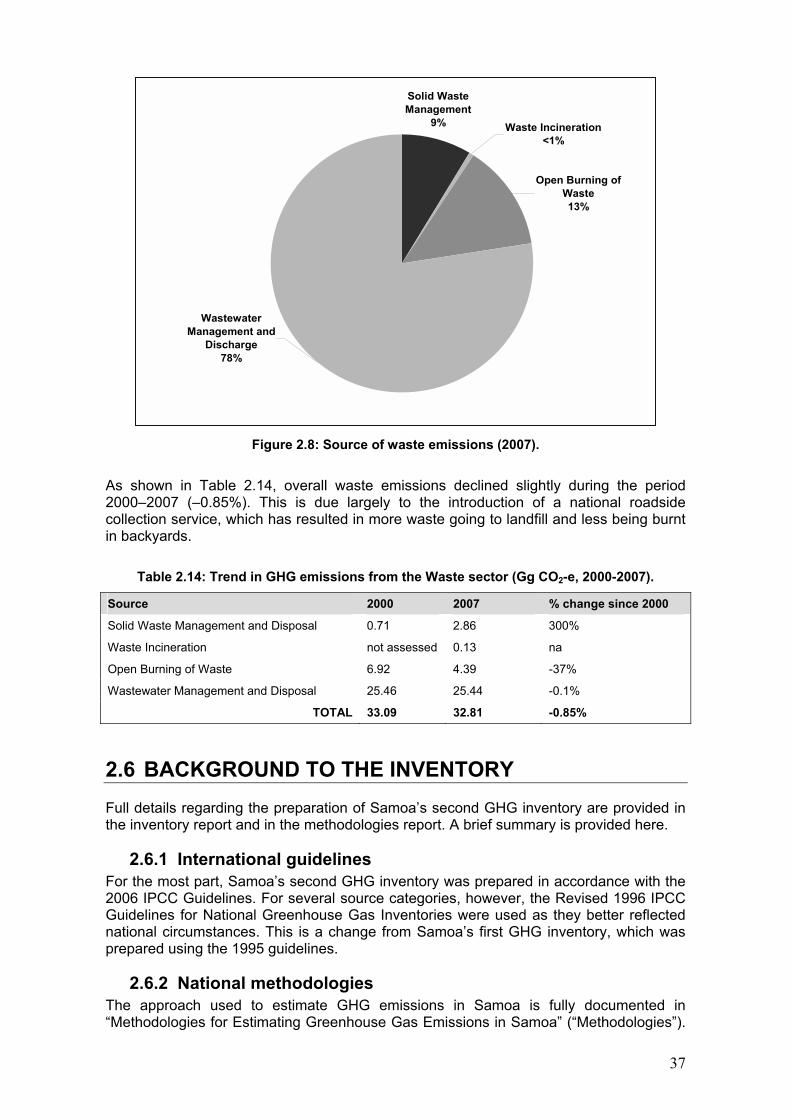
Solid Waste Management
9%
Wastewater Management and
Discharge78%
Open Burning of Waste13%
Waste Incineration <1%
Figure 2.8: Source of waste emissions (2007).
As shown in Table 2.14, overall waste emissions declined slightly during the period 2000�2007 (�0.85%). This is due largely to the introduction of a national roadside collection service, which has resulted in more waste going to landfill and less being burnt in backyards.
Table 2.14: Trend in GHG emissions from the Waste sector (Gg CO2-e, 2000-2007).
Source 2000 2007 % change since 2000
Solid Waste Management and Disposal 0.71 2.86 300%
Waste Incineration not assessed 0.13 na
Open Burning of Waste 6.92 4.39 -37%
Wastewater Management and Disposal 25.46 25.44 -0.1%
TOTAL 33.09 32.81 -0.85%
2.6 BACKGROUND TO THE INVENTORY Full details regarding the preparation of Samoa�s second GHG inventory are provided in the inventory report and in the methodologies report. A brief summary is provided here.
2.6.1 International guidelines For the most part, Samoa�s second GHG inventory was prepared in accordance with the 2006 IPCC Guidelines. For several source categories, however, the Revised 1996 IPCC Guidelines for National Greenhouse Gas Inventories were used as they better reflected national circumstances. This is a change from Samoa�s first GHG inventory, which was prepared using the 1995 guidelines.
2.6.2 National methodologies The approach used to estimate GHG emissions in Samoa is fully documented in �Methodologies for Estimating Greenhouse Gas Emissions in Samoa� (�Methodologies�).
37
This document explains all the assumptions and data used to calculate the GHG emissions for the second GHG inventory and should provide a good foundation for future inventories. All of the estimates presented in this report were calculated using national-level activity data and IPCC default emission factors. Full details of all the activity data and emission factors used (including their source) are documented in the methodologies report. Global warming potential values used in the inventory are the 1995 IPCC values.
2.6.3 Revision of old data A revision of the results from the first GHG inventory was undertaken as part of the second GHG inventory. This allowed a full and accurate trend analysis to be prepared for the years 1994�2007. A full explanation of the review process is provided in Appendix 1 of this document.
2.6.4 Key gaps and limitations The GHG inventory is based on activity data from each of the sectors, and includes, for instance, such things as fuel consumption, livestock numbers and waste generation. While there has been significant improvement in the accuracy and availability of data since the first GHG inventory, many limitations remain. Generally speaking, the activity data requires more detail and whilst all sectors have some basic data, the GHG inventory could be improved with more detailed information. A good example of this is the energy sector, where there is good high-level data on fuel imports, but only limited detail on end use. This means that certain assumptions and estimates have to be made based on relatively scant data. Similarly, for the waste sector, there is very little data available on the delivery of waste to landfill sites. This means the estimates are based on findings from household waste audits, rather than actual deliveries to landfill. Perhaps the biggest gap in the GHG inventory is the lack of accurate and reliable data on land use changes in Samoa. The results from the second GHG inventory show that Samoa is a net CO2 sink, removing more gases from the atmosphere than it releases. This does not, however, take into account changes in the total area of forests and other land-use categories during the inventory period. New satellite images may show that the total area of forest in Samoa has increased of decreased in recent years. Samoa�s GHG inventory estimates will need to be emended to reflect the emissions or removals associated with changes in forest areas. Another significant source of uncertainty in the energy sector estimates is the data used for biomass fuel consumption. Very little information exists on the amount of biomass fuel used in Samoa. Samoa�s Methodologies provides a detailed account of how biomass energy consumption was estimated for the second GHG inventory. While the GHG inventory captures all the main sources of emissions, there are several activities that are excluded because of insufficient data. This includes emissions of NMVOCs from the laying of asphalt in road construction, as well as emissions from aerosols, fire equipment and foam-blowing agents. Efforts should be made to include these sources in future inventories.
38
3. VULNERABILITY AND ADAPTATION
39
3.1 INTRODUCTION This chapter outlines Samoa�s vulnerability and adaptation efforts, including a summary of potential adaptation actions for priority sectors. Although climate change is caused largely by industrialised countries, it is Samoa that must bear increasing adaptation costs, particularly as the adverse effects of climate change escalate. Samoa is committed to implementing practical adaptation measures at both the national and the community level by integrating the endorsed NAPA and other adaptation planning documents, including the SNC, with other social, economic and environmental priorities.
3.1.1 Agencies responsible for adaptation The MNRE is the agency responsible for the overall implementation of Samoa�s adaptation activities. The MNRE also plays a major role in developing strategies, policies and coordinating adaptation measures. Other key Government agencies include the Ministry of Health, the Ministry of Agriculture and Fisheries, the Samoa Water Authority (SWA), Ministry of Works and Infrastructure (MWI) and the Electric Power Corporation (EPC). NGOs, private sector and private citizens also play a key role in implementing adaptation initiatives.
3.1.2 Key policies and legislation Although Samoa has no legislation dealing with climate change adaptation, there is a strong policy framework that outlines and supports adaptation. This is briefly summarised below: Strategy for the Development of Samoa (SDS) 2008�20012: The SDS is the government�s main planning document that outlines a five-year programme of work to achieve Samoa�s development priorities. The current strategy covers the period 2008�2012 and includes a number of cross-sectoral activities relevant to climate change adaptation. Importantly, this includes a commitment to improve local resilience �through continuation of work on coastal management and adaptation programmes for vulnerable villages and other coastal locations.� National Climate Change Policy: This was approved by Cabinet in early 2000 and outlines Samoa�s response to climate change, providing a national framework to mitigate and adapt to climate change. Highlighted adaptation measures include: implementing the NAPA, promoting cross-sectoral adaptation, promoting technology transfer, integrating climate change considerations into national planning and environmental policies, implementing coastal infrastructure management plans, implementing the Pacific Adaptation to Climate Change (PACC) project and providing financial resources to support adaptation. National Adaptation Programme of Action: The Government of Samoa endorsed the NAPA as the national adaptation strategy and has given it top priority. The NAPA has also been incorporated into the Strategy for the Development of Samoa (SDS) 2008�2012. Samoa�s NAPA includes nine project profiles as priority adaptation activities (see Table 3.1). In the long-term, it is envisaged that the NAPA will continue to serve as the country's national adaptation programme and that future adaptation programmes will proceed from it.
40
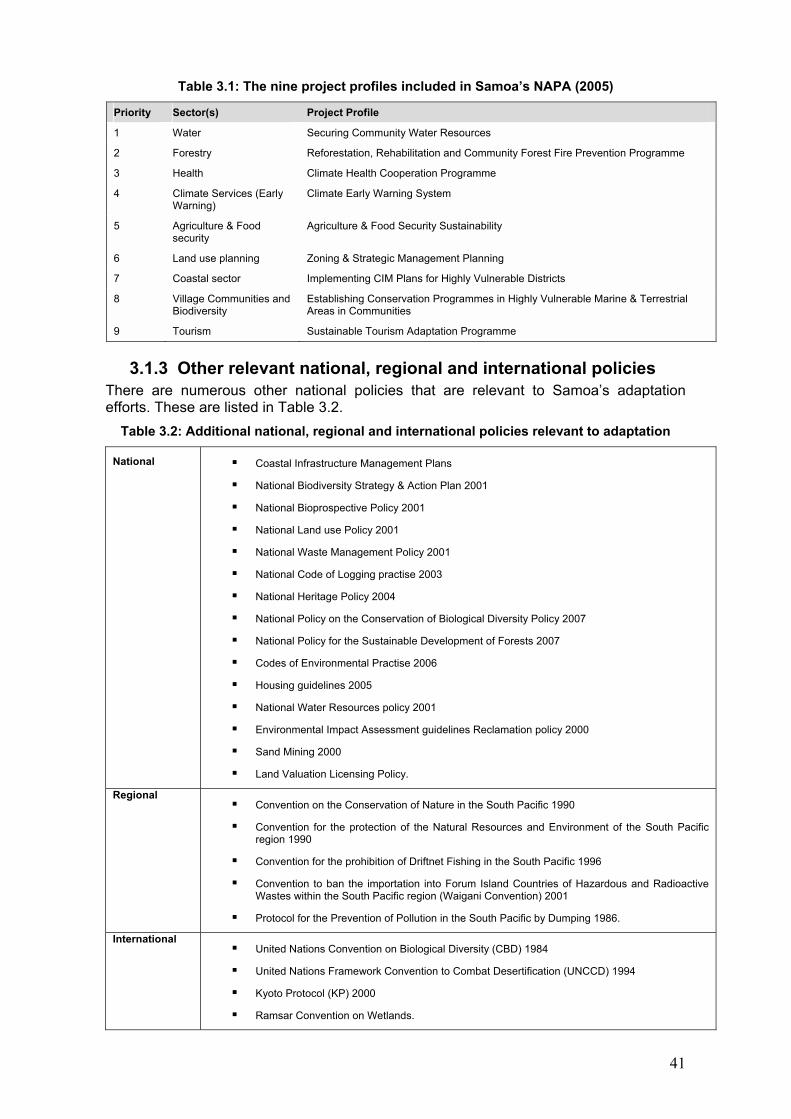
Table 3.1: The nine project profiles included in Samoa�s NAPA (2005)
Priority Sector(s) Project Profile
1 Water Securing Community Water Resources
2 Forestry Reforestation, Rehabilitation and Community Forest Fire Prevention Programme
3 Health Climate Health Cooperation Programme
4 Climate Services (Early Warning)
Climate Early Warning System
5 Agriculture & Food security
Agriculture & Food Security Sustainability
6 Land use planning Zoning & Strategic Management Planning
7 Coastal sector Implementing CIM Plans for Highly Vulnerable Districts
8 Village Communities and Biodiversity
Establishing Conservation Programmes in Highly Vulnerable Marine & Terrestrial Areas in Communities
9 Tourism Sustainable Tourism Adaptation Programme
3.1.3 Other relevant national, regional and international policies There are numerous other national policies that are relevant to Samoa�s adaptation efforts. These are listed in Table 3.2.
Table 3.2: Additional national, regional and international policies relevant to adaptation
National ! Coastal Infrastructure Management Plans
! National Biodiversity Strategy & Action Plan 2001
! National Bioprospective Policy 2001
! National Land use Policy 2001
! National Waste Management Policy 2001
! National Code of Logging practise 2003
! National Heritage Policy 2004
! National Policy on the Conservation of Biological Diversity Policy 2007
! National Policy for the Sustainable Development of Forests 2007
! Codes of Environmental Practise 2006
! Housing guidelines 2005
! National Water Resources policy 2001
! Environmental Impact Assessment guidelines Reclamation policy 2000
! Sand Mining 2000
! Land Valuation Licensing Policy.
Regional ! Convention on the Conservation of Nature in the South Pacific 1990
! Convention for the protection of the Natural Resources and Environment of the South Pacific region 1990
! Convention for the prohibition of Driftnet Fishing in the South Pacific 1996
! Convention to ban the importation into Forum Island Countries of Hazardous and Radioactive Wastes within the South Pacific region (Waigani Convention) 2001
! Protocol for the Prevention of Pollution in the South Pacific by Dumping 1986.
International ! United Nations Convention on Biological Diversity (CBD) 1984
! United Nations Framework Convention to Combat Desertification (UNCCD) 1994
! Kyoto Protocol (KP) 2000
! Ramsar Convention on Wetlands.
41
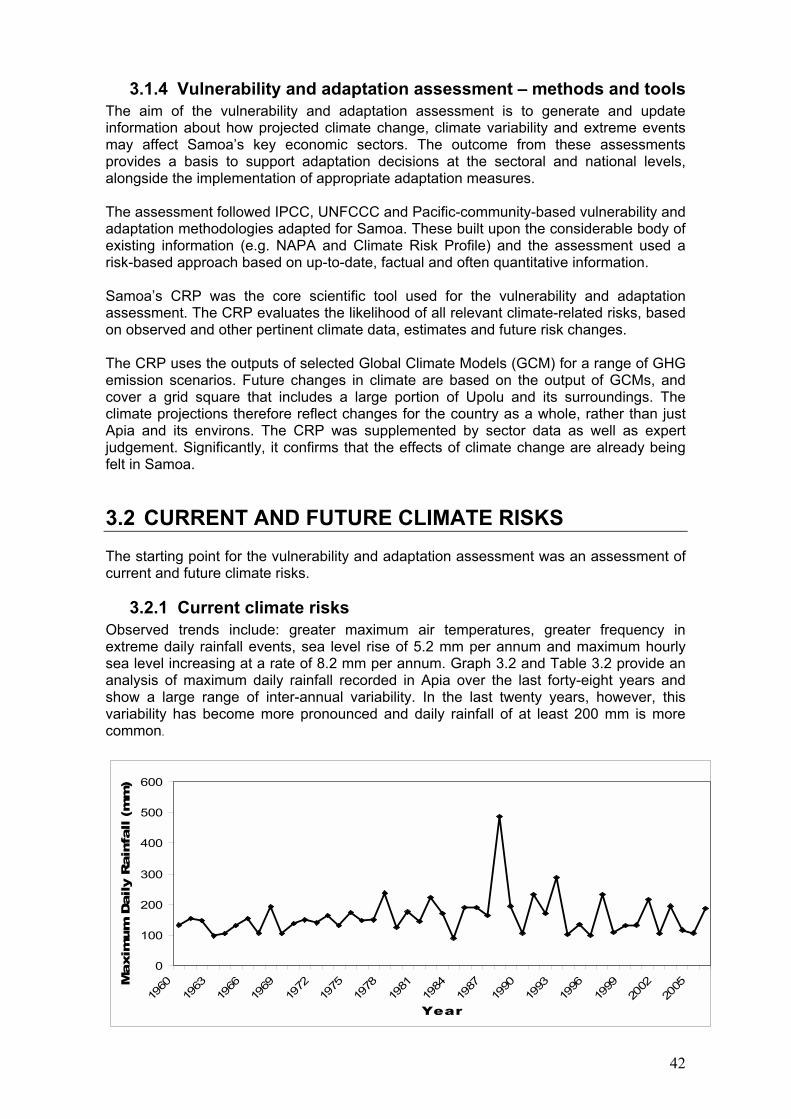
3.1.4 Vulnerability and adaptation assessment � methods and tools The aim of the vulnerability and adaptation assessment is to generate and update information about how projected climate change, climate variability and extreme events may affect Samoa�s key economic sectors. The outcome from these assessments provides a basis to support adaptation decisions at the sectoral and national levels, alongside the implementation of appropriate adaptation measures. The assessment followed IPCC, UNFCCC and Pacific-community-based vulnerability and adaptation methodologies adapted for Samoa. These built upon the considerable body of existing information (e.g. NAPA and Climate Risk Profile) and the assessment used a risk-based approach based on up-to-date, factual and often quantitative information. Samoa�s CRP was the core scientific tool used for the vulnerability and adaptation assessment. The CRP evaluates the likelihood of all relevant climate-related risks, based on observed and other pertinent climate data, estimates and future risk changes. The CRP uses the outputs of selected Global Climate Models (GCM) for a range of GHG emission scenarios. Future changes in climate are based on the output of GCMs, and cover a grid square that includes a large portion of Upolu and its surroundings. The climate projections therefore reflect changes for the country as a whole, rather than just Apia and its environs. The CRP was supplemented by sector data as well as expert judgement. Significantly, it confirms that the effects of climate change are already being felt in Samoa.
3.2 CURRENT AND FUTURE CLIMATE RISKS The starting point for the vulnerability and adaptation assessment was an assessment of current and future climate risks.
3.2.1 Current climate risks Observed trends include: greater maximum air temperatures, greater frequency in extreme daily rainfall events, sea level rise of 5.2 mm per annum and maximum hourly sea level increasing at a rate of 8.2 mm per annum. Graph 3.2 and Table 3.2 provide an analysis of maximum daily rainfall recorded in Apia over the last forty-eight years and show a large range of inter-annual variability. In the last twenty years, however, this variability has become more pronounced and daily rainfall of at least 200 mm is more common.
0
100
200
300
400
500
600
1960
1963
1966
1969
1972
1975
1978
1981
1984
1987
1990
1993
1996
1999
2002
2005
Year
Maxim
um
Daily
Rain
fall (m
m)
42
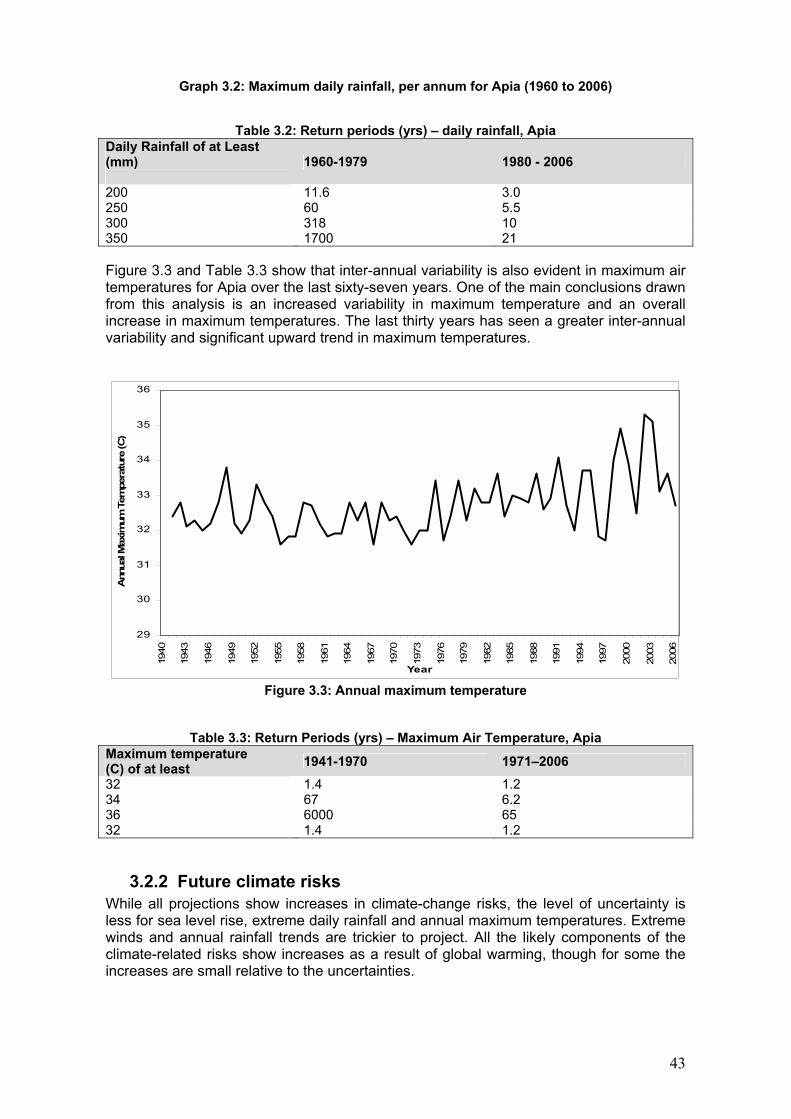
Graph 3.2: Maximum daily rainfall, per annum for Apia (1960 to 2006)
Table 3.2: Return periods (yrs) � daily rainfall, Apia Daily Rainfall of at Least (mm)
1960-1979 1980 - 2006
200 11.6 3.0 250 60 5.5 300 318 10 350 1700 21 Figure 3.3 and Table 3.3 show that inter-annual variability is also evident in maximum air temperatures for Apia over the last sixty-seven years. One of the main conclusions drawn from this analysis is an increased variability in maximum temperature and an overall increase in maximum temperatures. The last thirty years has seen a greater inter-annual
riability and significant upward trend in maximum temperatures. va
29
30
31
32
33
34
35
36
1940
1943
1946
1949
1952
1955
1958
1961
1964
1967
1970
1973
1976
1979
1982
1985
1988
1991
1994
1997
2000
2003
2006
Year
Ann
ual M
axim
um T
empe
ratu
re (C
)
Figure 3.3: Annual maximum temperature
Table 3.3: Return Periods (yrs) � Maximum Air Temperature, Apia Maximum temperature (C) of at least 1941-1970 1971�2006
32 1.4 1.2 34 67 6.2 36 6000 65 32 1.4 1.2
3.2.2 Future climate risks While all projections show increases in climate-change risks, the level of uncertainty is less for sea level rise, extreme daily rainfall and annual maximum temperatures. Extreme winds and annual rainfall trends are trickier to project. All the likely components of the climate-related risks show increases as a result of global warming, though for some the increases are small relative to the uncertainties.
43
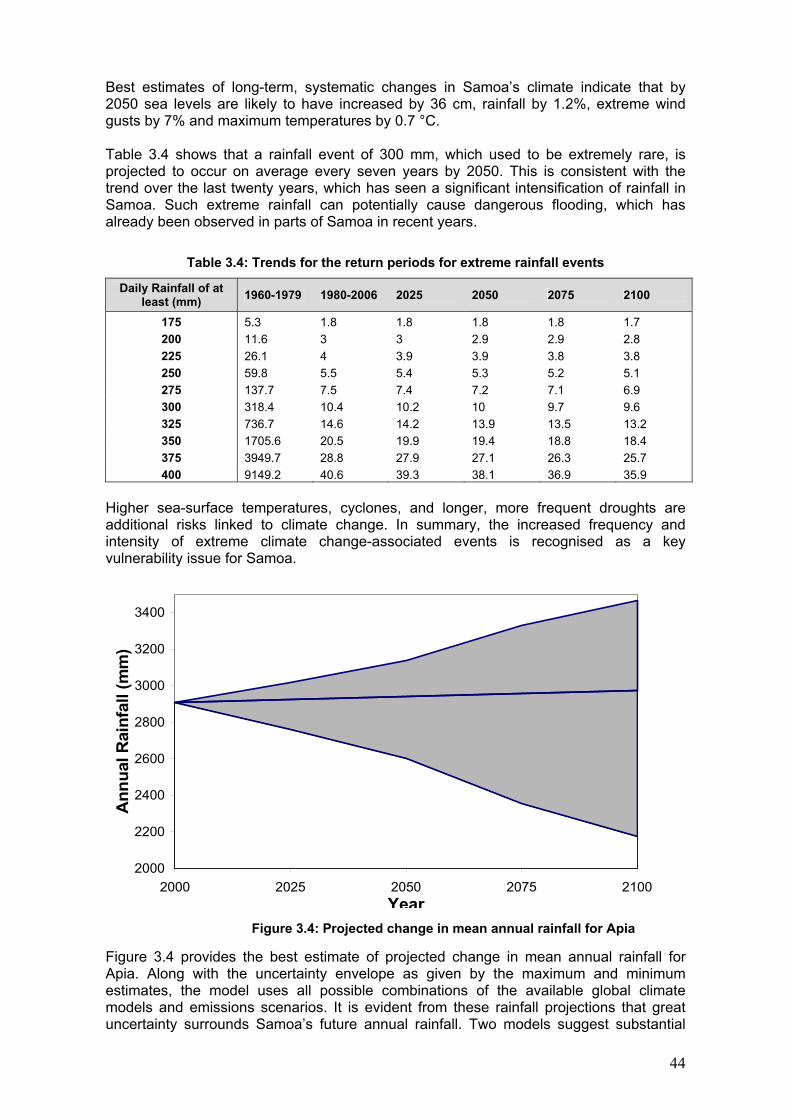
Best estimates of long-term, systematic changes in Samoa�s climate indicate that by 2050 sea levels are likely to have increased by 36 cm, rainfall by 1.2%, extreme wind gusts by 7% and maximum temperatures by 0.7 °C. Table 3.4 shows that a rainfall event of 300 mm, which used to be extremely rare, is projected to occur on average every seven years by 2050. This is consistent with the trend over the last twenty years, which has seen a significant intensification of rainfall in Samoa. Such extreme rainfall can potentially cause dangerous flooding, which has already been observed in parts of Samoa in recent years.
Table 3.4: Trends for the return periods for extreme rainfall events
Daily Rainfall of at least (mm) 1960-1979 1980-2006 2025 2050 2075 2100
175 5.3 1.8 1.8 1.8 1.8 1.7 200 11.6 3 3 2.9 2.9 2.8 225 26.1 4 3.9 3.9 3.8 3.8 250 59.8 5.5 5.4 5.3 5.2 5.1 275 137.7 7.5 7.4 7.2 7.1 6.9 300 318.4 10.4 10.2 10 9.7 9.6 325 736.7 14.6 14.2 13.9 13.5 13.2 350 1705.6 20.5 19.9 19.4 18.8 18.4 375 3949.7 28.8 27.9 27.1 26.3 25.7 400 9149.2 40.6 39.3 38.1 36.9 35.9
Higher sea-surface temperatures, cyclones, and longer, more frequent droughts are additional risks linked to climate change. In summary, the increased frequency and intensity of extreme climate change-associated events is recognised as a key vulnerability issue for Samoa.
2000
2200
2400
2600
2800
3000
3200
3400
2000 2025 2050 2075 2100Year
Ann
ual R
ainf
all (
mm
)
Figure 3.4: Projected change in mean annual rainfall for Apia Figure 3.4 provides the best estimate of projected change in mean annual rainfall for Apia. Along with the uncertainty envelope as given by the maximum and minimum estimates, the model uses all possible combinations of the available global climate models and emissions scenarios. It is evident from these rainfall projections that great uncertainty surrounds Samoa�s future annual rainfall. Two models suggest substantial
44
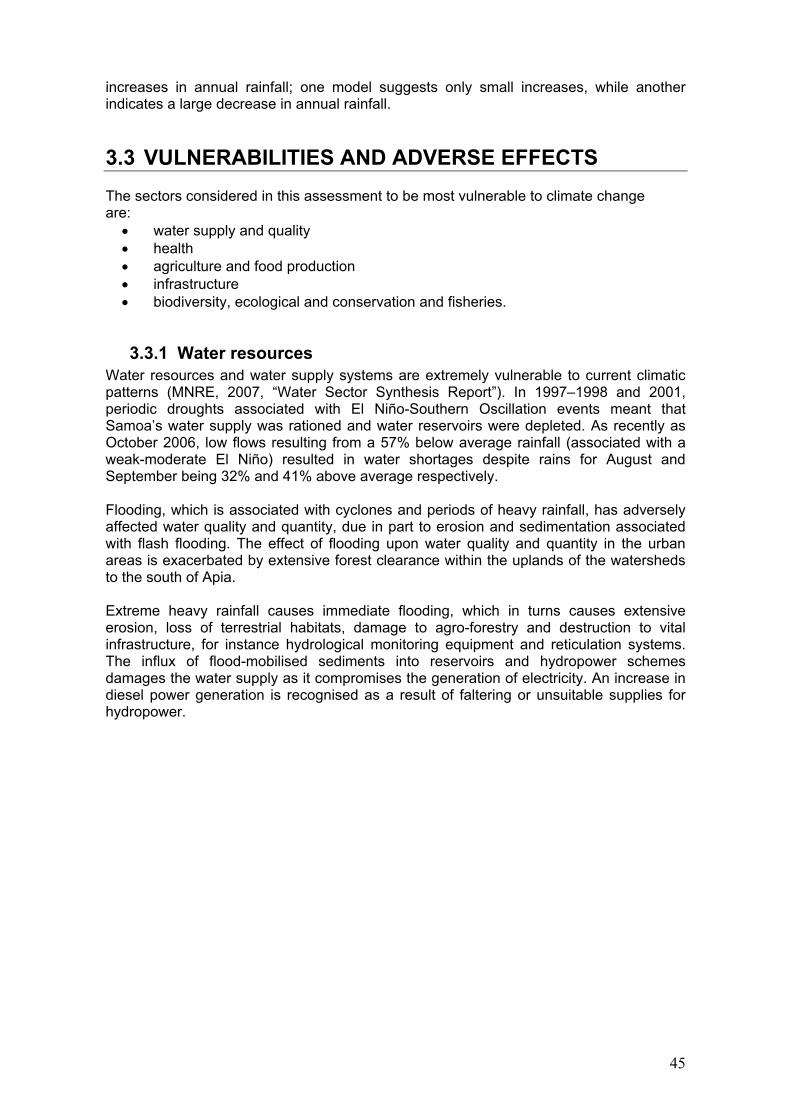
increases in annual rainfall; one model suggests only small increases, while another indicates a large decrease in annual rainfall.
3.3 VULNERABILITIES AND ADVERSE EFFECTS The sectors considered in this assessment to be most vulnerable to climate change are: • water supply and quality • health • agriculture and food production • infrastructure • biodiversity, ecological and conservation and fisheries.
3.3.1 Water resources Water resources and water supply systems are extremely vulnerable to current climatic patterns (MNRE, 2007, �Water Sector Synthesis Report�). In 1997�1998 and 2001, periodic droughts associated with El Niño-Southern Oscillation events meant that Samoa�s water supply was rationed and water reservoirs were depleted. As recently as October 2006, low flows resulting from a 57% below average rainfall (associated with a weak-moderate El Niño) resulted in water shortages despite rains for August and September being 32% and 41% above average respectively. Flooding, which is associated with cyclones and periods of heavy rainfall, has adversely affected water quality and quantity, due in part to erosion and sedimentation associated with flash flooding. The effect of flooding upon water quality and quantity in the urban areas is exacerbated by extensive forest clearance within the uplands of the watersheds to the south of Apia. Extreme heavy rainfall causes immediate flooding, which in turns causes extensive erosion, loss of terrestrial habitats, damage to agro-forestry and destruction to vital infrastructure, for instance hydrological monitoring equipment and reticulation systems. The influx of flood-mobilised sediments into reservoirs and hydropower schemes damages the water supply as it compromises the generation of electricity. An increase in diesel power generation is recognised as a result of faltering or unsuitable supplies for hydropower.
45
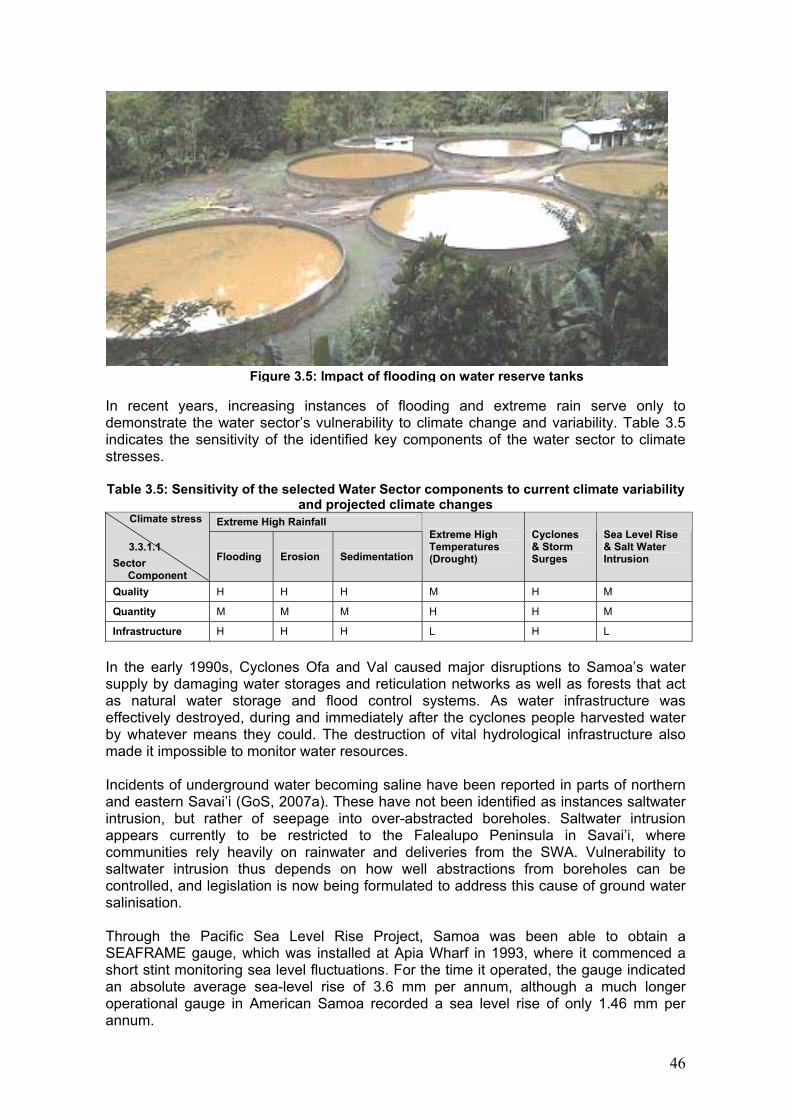
Figure 3.5: Impact of flooding on water reserve tanks In recent years, increasing instances of flooding and extreme rain serve only to demonstrate the water sector�s vulnerability to climate change and variability. Table 3.5 indicates the sensitivity of the identified key components of the water sector to climate stresses. Table 3.5: Sensitivity of the selected Water Sector components to current climate variability
and projected climate changes Extreme High Rainfall Climate stress
3.3.1.1 Sector
Component
Flooding Erosion Sedimentation
Extreme High Temperatures (Drought)
Cyclones & Storm Surges
Sea Level Rise & Salt Water Intrusion
Quality H H H M H M
Quantity M M M H H M
Infrastructure H H H L H L
In the early 1990s, Cyclones Ofa and Val caused major disruptions to Samoa�s water supply by damaging water storages and reticulation networks as well as forests that act as natural water storage and flood control systems. As water infrastructure was effectively destroyed, during and immediately after the cyclones people harvested water by whatever means they could. The destruction of vital hydrological infrastructure also made it impossible to monitor water resources. Incidents of underground water becoming saline have been reported in parts of northern and eastern Savai�i (GoS, 2007a). These have not been identified as instances saltwater intrusion, but rather of seepage into over-abstracted boreholes. Saltwater intrusion appears currently to be restricted to the Falealupo Peninsula in Savai�i, where communities rely heavily on rainwater and deliveries from the SWA. Vulnerability to saltwater intrusion thus depends on how well abstractions from boreholes can be controlled, and legislation is now being formulated to address this cause of ground water salinisation. Through the Pacific Sea Level Rise Project, Samoa was been able to obtain a SEAFRAME gauge, which was installed at Apia Wharf in 1993, where it commenced a short stint monitoring sea level fluctuations. For the time it operated, the gauge indicated an absolute average sea-level rise of 3.6 mm per annum, although a much longer operational gauge in American Samoa recorded a sea level rise of only 1.46 mm per annum.
46
Although the current rate of sea level rise has a slight effect on watershed and aquifers (SOPAC, 2007), several coastal springs are becoming inundated by what communities view as rising sea levels. Coastal springs used by some villages for bathing and as alternative water sources have become overwhelmed by seawater, even during low tides. Cement and rock walls built to protect some of these springs have been destroyed by storm surges and strong waves.. Future risks The CRP projections for Samoa show that over time, sea level, rainfall, wind gusts and temperature will continue to increase alongside ever-frequent climate stresses, and that these will make water resources increasingly vulnerable. Projected changes in precipitation will be significant in determining stream flows and groundwater recharge. An increase in annual precipitation will mean that the surface and groundwater resources will continue to be recharged and that water will be available for supply, development and the environment. The agriculture sector will benefit from high rainfall through irrigation and the energy sector is expected to benefit through increased hydropower generation. Conversely, higher rainfall will potentially case floods that further mobilise sediments, increasing pressure on water treatment, flood control and watershed management. Water reticulation, treatment and infrastructure will also become more vulnerable to floods. On the other hand, If there is an extreme reduction in annual rainfall, surface and underground water will become increasingly scarce. Droughts will become frequent and the allocation of scarce water resources could lead to irregularities in vital services such as hydropower and water supply, placing much demand on the Government�s resources. Projected higher annual maximum temperatures are expected to create increased water evaporation and may also lead to an increase in water temperature, thus affecting water quality. Higher annual temperatures and lower annual rainfall will enhance evapo-transpiration from the ground and plants, thus making water scarce. The risk of saltwater inundating groundwater is expected to increase as sea levels rise. The recharging of groundwater is expected to lessen as annual rainfall lessens. Rising sea levels will also affect coastal springs as current boundaries become flooded. Damage to water supplies, water treatment and hydrological research infrastructure is expected to be significant and costly. Whilst the water sector is aware of its vulnerability to climate change, its response to the problem, in terms of implementing more advanced technologies and adaptation methods, has not kept pace with climate change and developing knowledge. Current efforts focus mainly on coping mechanisms to reduce physical damage to infrastructure and secure life and property in the event of natural disasters. These include efforts to ensure that emergency supplies are available in case of drought or cyclones. Improving capacity to ensure adjustment to an uncertain future should be a top priority for this sector.
3.3.2 HEALTH The effect of climate change upon the health sector is evidenced in the growth of vector-and water-borne diseases. Other projected health issues are the result of changes in ecological and social systems, namely changes in local food production, potential malnutrition from successive agricultural under-production, population displacement and stresses caused by economic disruption.
Some adverse health effects relate directly to weather and climatic events, for example potential fatalities in times of flooding or cyclonic activity. Others are more indirectly
47
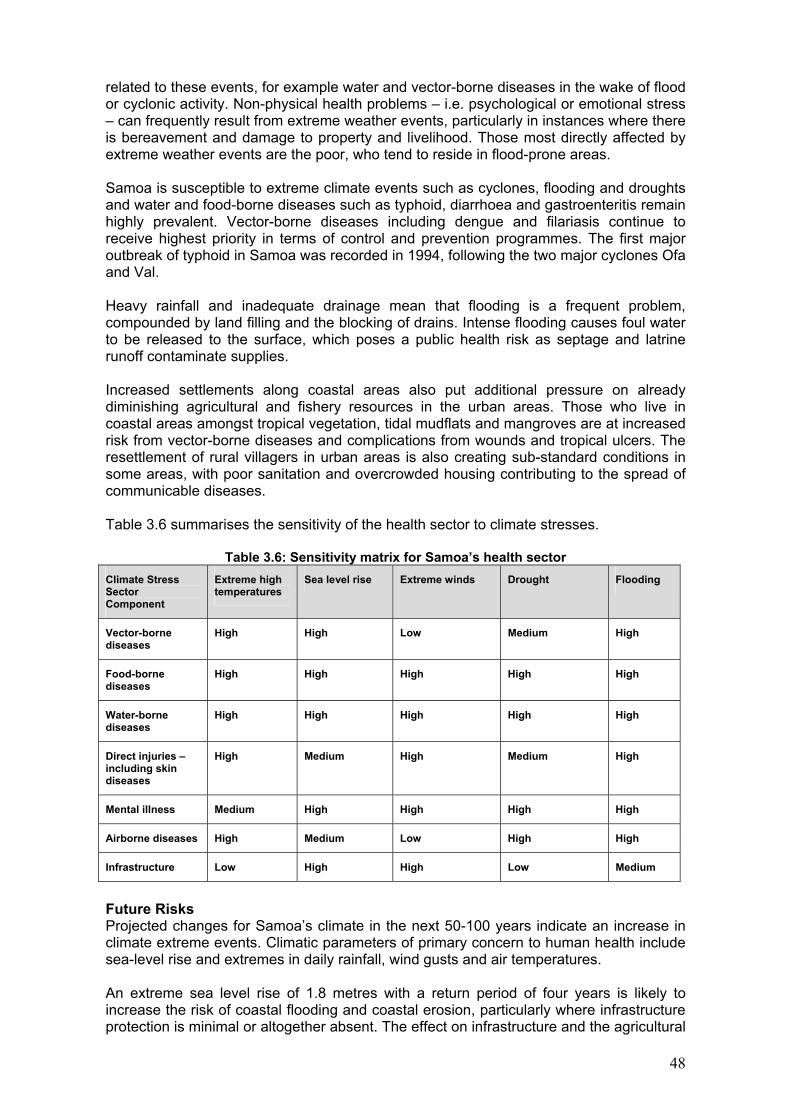
related to these events, for example water and vector-borne diseases in the wake of flood or cyclonic activity. Non-physical health problems � i.e. psychological or emotional stress � can frequently result from extreme weather events, particularly in instances where there is bereavement and damage to property and livelihood. Those most directly affected by extreme weather events are the poor, who tend to reside in flood-prone areas. Samoa is susceptible to extreme climate events such as cyclones, flooding and droughts and water and food-borne diseases such as typhoid, diarrhoea and gastroenteritis remain highly prevalent. Vector-borne diseases including dengue and filariasis continue to receive highest priority in terms of control and prevention programmes. The first major outbreak of typhoid in Samoa was recorded in 1994, following the two major cyclones Ofa and Val. Heavy rainfall and inadequate drainage mean that flooding is a frequent problem, compounded by land filling and the blocking of drains. Intense flooding causes foul water to be released to the surface, which poses a public health risk as septage and latrine runoff contaminate supplies. Increased settlements along coastal areas also put additional pressure on already diminishing agricultural and fishery resources in the urban areas. Those who live in coastal areas amongst tropical vegetation, tidal mudflats and mangroves are at increased risk from vector-borne diseases and complications from wounds and tropical ulcers. The resettlement of rural villagers in urban areas is also creating sub-standard conditions in some areas, with poor sanitation and overcrowded housing contributing to the spread of communicable diseases. Table 3.6 summarises the sensitivity of the health sector to climate stresses.
Table 3.6: Sensitivity matrix for Samoa�s health sector
Climate Stress Sector Component
Extreme high temperatures
Sea level rise Extreme winds Drought Flooding
Vector-borne diseases
High High Low Medium High
Food-borne diseases
High High High High High
Water-borne diseases
High High High High High
Direct injuries � including skin diseases
High Medium High Medium High
Mental illness Medium High High High High
Airborne diseases High Medium Low High High
Infrastructure Low High High Low Medium
Future Risks Projected changes for Samoa�s climate in the next 50-100 years indicate an increase in climate extreme events. Climatic parameters of primary concern to human health include sea-level rise and extremes in daily rainfall, wind gusts and air temperatures. An extreme sea level rise of 1.8 metres with a return period of four years is likely to increase the risk of coastal flooding and coastal erosion, particularly where infrastructure protection is minimal or altogether absent. The effect on infrastructure and the agricultural
48
sector will have a detrimental effect on the health of many, particularly those living in coastal areas. Those who are displaced because of climate-related land loss will have to face not only the economic hardship associated with relocation � in some instances significant � but also the psychological distress of dislocation. The loss of customary and private property will have a significant economic and cultural impact on Samoa. Of major importance to the health sector is the possibility that it may have to relocate one of its major hospitals on Savai�i because its current coastal location makes it highly vulnerable to rising sea levels. There is also grave concern that rising sea levels will affect the distribution of the mosquito Aedes Polynesiensis, which transmits dengue fever. Distribution of vector-borne diseases such as dengue and filariasis will also increase, as extreme rainfall creates more breeding habitats for disease-carrying mosquitoes.
Projected extreme air temperatures of 34 °C over a forty-year period by 2050, are likely to have both directly and indirectly negative consequences for a whole range of population groups. Those with co-morbid illnesses, infants, children and elderly are likely to be at increased risk of heat-related illnesses and respiratory conditions like asthma and influenza. Repeated and prolonged exposure to extreme temperatures for those with minimal protection, for example construction workers and agricultural labourers, poses significant occupational health and safety problems. Cases of food poisoning and other diarrhoeal diseases are also likely to increase as hotter temperature accelerate food spoilage. Currently, monitoring and surveillance systems cannot provide data on disease incidences that establish an indubitable connexion between them and climate change. Relevant sectors must act to obtain long-term data that can establish this connexion.
3.3.3 Agriculture Agriculture�s contribution to Samoa�s GDP dropped from 12% in 1998 to 8% in 2003 and stayed at 7% during 2004�2007. Increasingly, agricultural production competes with other growing sectors such as tourism and manufacturing. Remittances and more attractive salary opportunities in Apia and overseas have likewise caused a shift away from agricultural production. Notwithstanding these socioeconomic changes, MAF has claimed that one of the factors contributing to the diminution of agricultural production in Samoa is climate change. The numerous effects of climate change and variability: cyclones, flash floods, high rainfall, high temperature and long dry periods have made agricultural production increasingly challenging. Climatic changes have meant greater incidence of pests and pestilence, which meant a loss of quality and quantity in production. Unstable and inconsistent food production caused by climate change has affected farmers� capacity for self-sufficiency, not to mention their ability to generate income from their crops. Perhaps the most devastating effect of natural disasters in Samoa is the damage wrought on agricultural production, and consequently the sector�s capacity to supply domestic demand. Samoa�s geographic location presents difficulties in terms of reducing the vulnerability of the agriculture sector, particularly as cyclones, droughts and floods become increasingly common. Three intense cyclones have visited Samoa in the past twenty years and the effect on agricultural production is clear. In particular, cyclones Ofa and Val caused significant
49
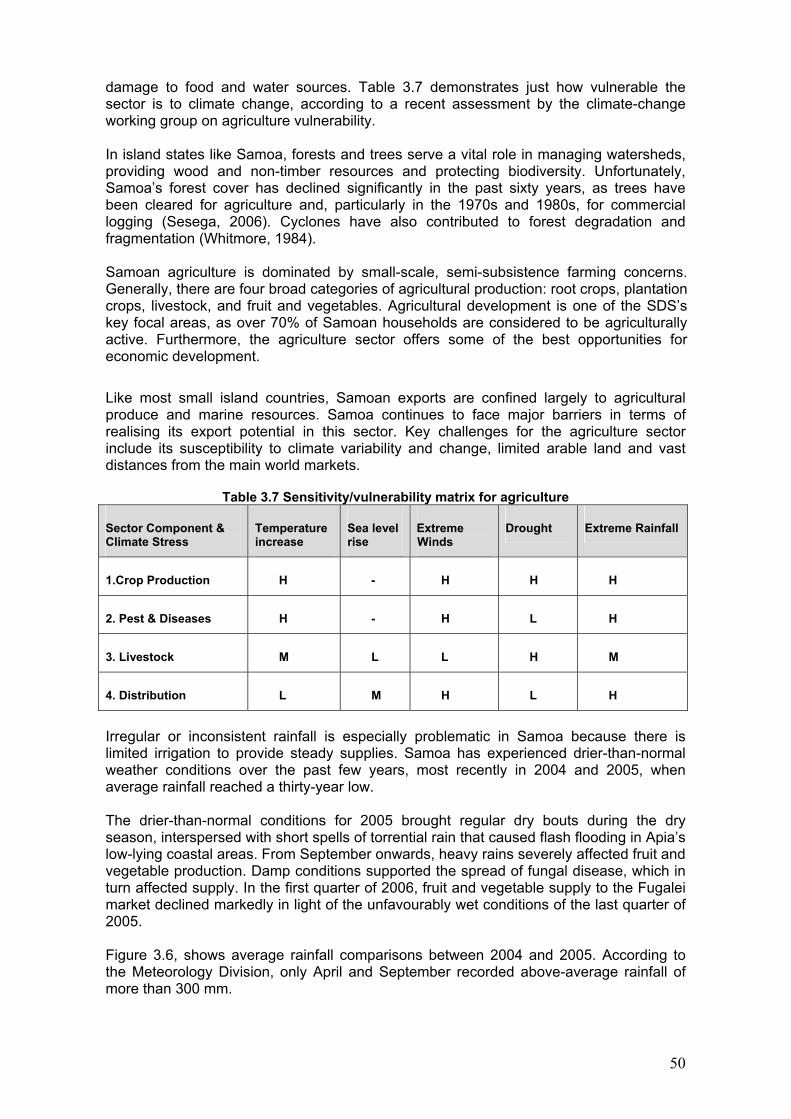
damage to food and water sources. Table 3.7 demonstrates just how vulnerable the sector is to climate change, according to a recent assessment by the climate-change working group on agriculture vulnerability. In island states like Samoa, forests and trees serve a vital role in managing watersheds, providing wood and non-timber resources and protecting biodiversity. Unfortunately, Samoa�s forest cover has declined significantly in the past sixty years, as trees have been cleared for agriculture and, particularly in the 1970s and 1980s, for commercial logging (Sesega, 2006). Cyclones have also contributed to forest degradation and fragmentation (Whitmore, 1984). Samoan agriculture is dominated by small-scale, semi-subsistence farming concerns. Generally, there are four broad categories of agricultural production: root crops, plantation crops, livestock, and fruit and vegetables. Agricultural development is one of the SDS�s key focal areas, as over 70% of Samoan households are considered to be agriculturally active. Furthermore, the agriculture sector offers some of the best opportunities for economic development.
Like most small island countries, Samoan exports are confined largely to agricultural produce and marine resources. Samoa continues to face major barriers in terms of realising its export potential in this sector. Key challenges for the agriculture sector include its susceptibility to climate variability and change, limited arable land and vast distances from the main world markets.
Table 3.7 Sensitivity/vulnerability matrix for agriculture
Sector Component & Climate Stress
Temperature increase
Sea level rise
Extreme Winds
Drought Extreme Rainfall
1.Crop Production H - H H H
2. Pest & Diseases H - H L H
3. Livestock M L L H M
4. Distribution L M H L H
Irregular or inconsistent rainfall is especially problematic in Samoa because there is limited irrigation to provide steady supplies. Samoa has experienced drier-than-normal weather conditions over the past few years, most recently in 2004 and 2005, when average rainfall reached a thirty-year low. The drier-than-normal conditions for 2005 brought regular dry bouts during the dry season, interspersed with short spells of torrential rain that caused flash flooding in Apia�s low-lying coastal areas. From September onwards, heavy rains severely affected fruit and vegetable production. Damp conditions supported the spread of fungal disease, which in turn affected supply. In the first quarter of 2006, fruit and vegetable supply to the Fugalei market declined markedly in light of the unfavourably wet conditions of the last quarter of 2005. Figure 3.6, shows average rainfall comparisons between 2004 and 2005. According to the Meteorology Division, only April and September recorded above-average rainfall of more than 300 mm.
50
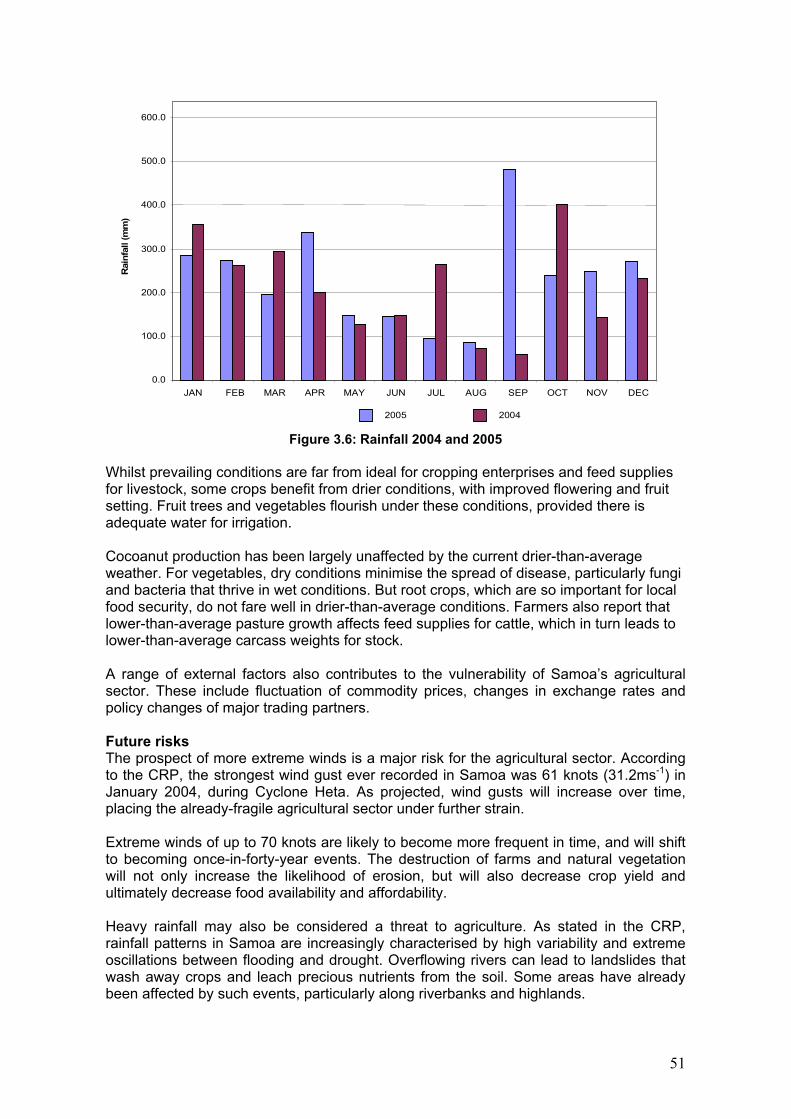
0.0
100.0
200.0
300.0
400.0
500.0
600.0
JAN FEB MAR APR MAY JUN JUL AUG SEP OCT NOV DEC
Rai
nfal
l (m
m)
2005 2004 Figure 3.6: Rainfall 2004 and 2005
Whilst prevailing conditions are far from ideal for cropping enterprises and feed supplies for livestock, some crops benefit from drier conditions, with improved flowering and fruit setting. Fruit trees and vegetables flourish under these conditions, provided there is adequate water for irrigation. Cocoanut production has been largely unaffected by the current drier-than-average weather. For vegetables, dry conditions minimise the spread of disease, particularly fungi and bacteria that thrive in wet conditions. But root crops, which are so important for local food security, do not fare well in drier-than-average conditions. Farmers also report that lower-than-average pasture growth affects feed supplies for cattle, which in turn leads to lower-than-average carcass weights for stock. A range of external factors also contributes to the vulnerability of Samoa�s agricultural sector. These include fluctuation of commodity prices, changes in exchange rates and policy changes of major trading partners. Future risks The prospect of more extreme winds is a major risk for the agricultural sector. According to the CRP, the strongest wind gust ever recorded in Samoa was 61 knots (31.2ms-1) in January 2004, during Cyclone Heta. As projected, wind gusts will increase over time, placing the already-fragile agricultural sector under further strain. Extreme winds of up to 70 knots are likely to become more frequent in time, and will shift to becoming once-in-forty-year events. The destruction of farms and natural vegetation will not only increase the likelihood of erosion, but will also decrease crop yield and ultimately decrease food availability and affordability. Heavy rainfall may also be considered a threat to agriculture. As stated in the CRP, rainfall patterns in Samoa are increasingly characterised by high variability and extreme oscillations between flooding and drought. Overflowing rivers can lead to landslides that wash away crops and leach precious nutrients from the soil. Some areas have already been affected by such events, particularly along riverbanks and highlands.
51
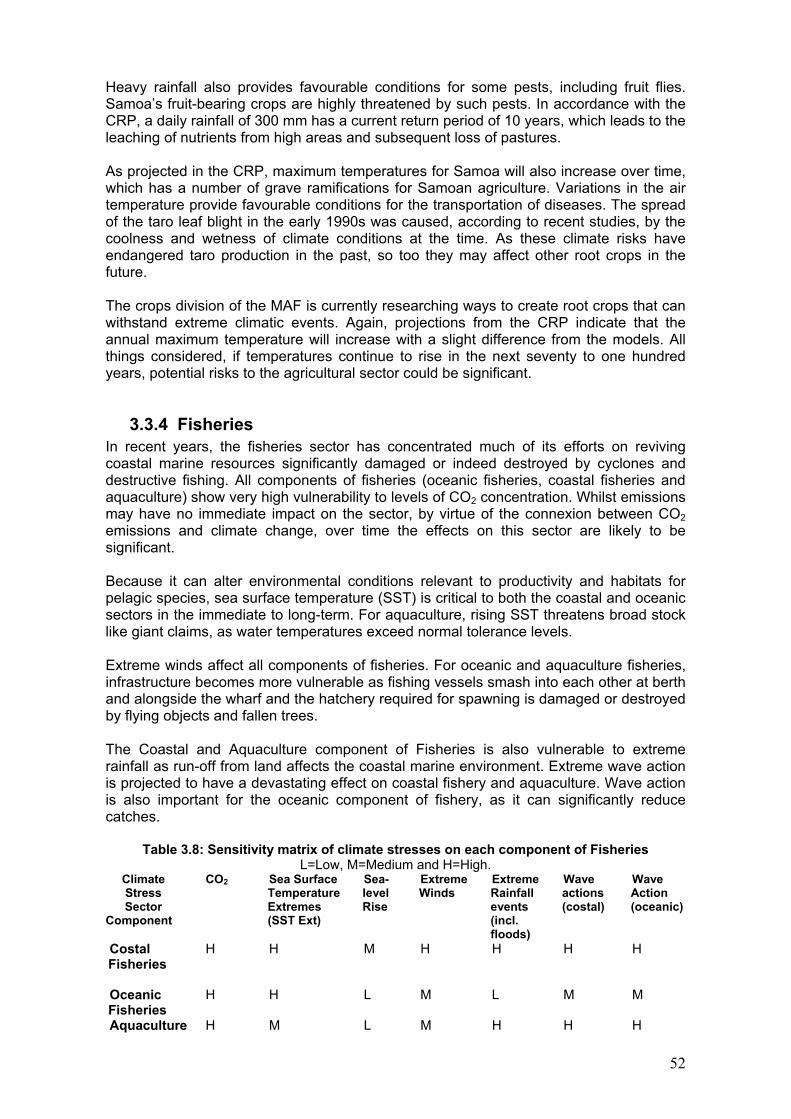
Heavy rainfall also provides favourable conditions for some pests, including fruit flies. Samoa�s fruit-bearing crops are highly threatened by such pests. In accordance with the CRP, a daily rainfall of 300 mm has a current return period of 10 years, which leads to the leaching of nutrients from high areas and subsequent loss of pastures. As projected in the CRP, maximum temperatures for Samoa will also increase over time, which has a number of grave ramifications for Samoan agriculture. Variations in the air temperature provide favourable conditions for the transportation of diseases. The spread of the taro leaf blight in the early 1990s was caused, according to recent studies, by the coolness and wetness of climate conditions at the time. As these climate risks have endangered taro production in the past, so too they may affect other root crops in the future. The crops division of the MAF is currently researching ways to create root crops that can withstand extreme climatic events. Again, projections from the CRP indicate that the annual maximum temperature will increase with a slight difference from the models. All things considered, if temperatures continue to rise in the next seventy to one hundred years, potential risks to the agricultural sector could be significant.
3.3.4 Fisheries In recent years, the fisheries sector has concentrated much of its efforts on reviving coastal marine resources significantly damaged or indeed destroyed by cyclones and destructive fishing. All components of fisheries (oceanic fisheries, coastal fisheries and aquaculture) show very high vulnerability to levels of CO2 concentration. Whilst emissions may have no immediate impact on the sector, by virtue of the connexion between CO2 emissions and climate change, over time the effects on this sector are likely to be significant. Because it can alter environmental conditions relevant to productivity and habitats for pelagic species, sea surface temperature (SST) is critical to both the coastal and oceanic sectors in the immediate to long-term. For aquaculture, rising SST threatens broad stock like giant claims, as water temperatures exceed normal tolerance levels. Extreme winds affect all components of fisheries. For oceanic and aquaculture fisheries, infrastructure becomes more vulnerable as fishing vessels smash into each other at berth and alongside the wharf and the hatchery required for spawning is damaged or destroyed by flying objects and fallen trees. The Coastal and Aquaculture component of Fisheries is also vulnerable to extreme rainfall as run-off from land affects the coastal marine environment. Extreme wave action is projected to have a devastating effect on coastal fishery and aquaculture. Wave action is also important for the oceanic component of fishery, as it can significantly reduce catches.
Table 3.8: Sensitivity matrix of climate stresses on each component of Fisheries L=Low, M=Medium and H=High.
Climate Stress Sector
Component
CO2 Sea Surface Temperature Extremes (SST Ext)
Sea-level Rise
Extreme Winds
Extreme Rainfall events (incl. floods)
Wave actions (costal)
Wave Action (oceanic)
Costal Fisheries
H H M H H H H
Oceanic Fisheries
H H L M L M M
Aquaculture H M L M H H H
52
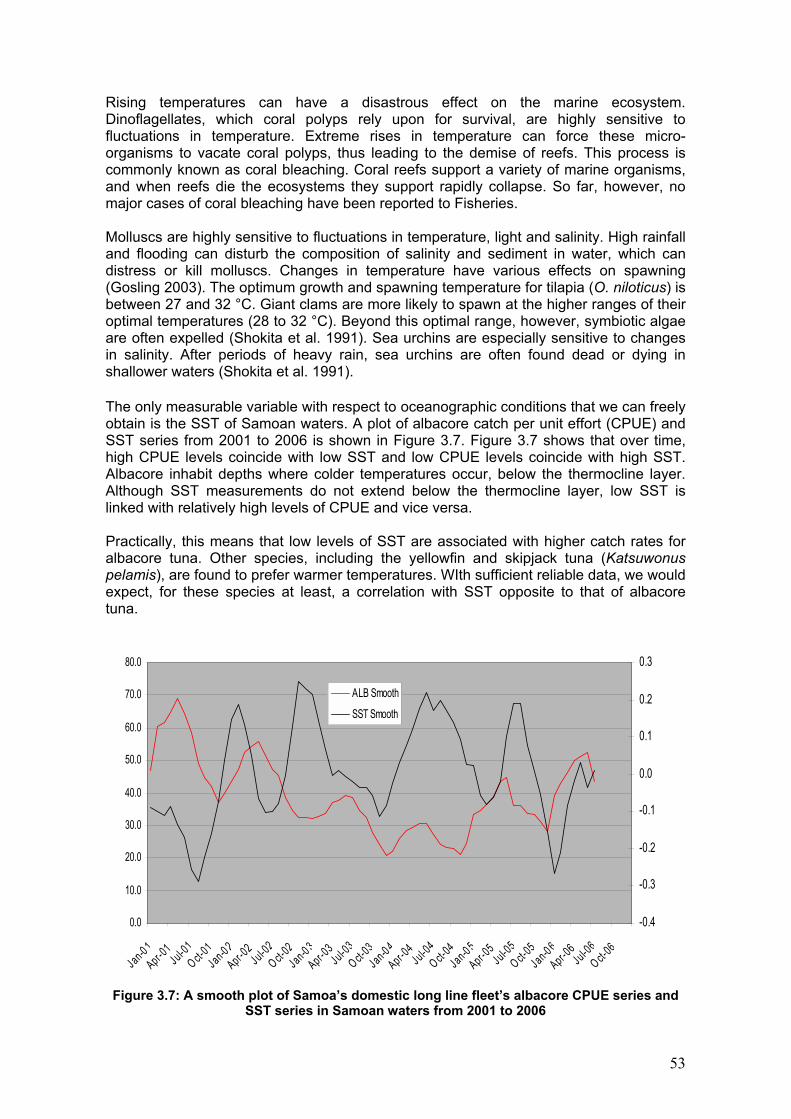
Rising temperatures can have a disastrous effect on the marine ecosystem. Dinoflagellates, which coral polyps rely upon for survival, are highly sensitive to fluctuations in temperature. Extreme rises in temperature can force these micro-organisms to vacate coral polyps, thus leading to the demise of reefs. This process is commonly known as coral bleaching. Coral reefs support a variety of marine organisms, and when reefs die the ecosystems they support rapidly collapse. So far, however, no major cases of coral bleaching have been reported to Fisheries. Molluscs are highly sensitive to fluctuations in temperature, light and salinity. High rainfall and flooding can disturb the composition of salinity and sediment in water, which can distress or kill molluscs. Changes in temperature have various effects on spawning (Gosling 2003). The optimum growth and spawning temperature for tilapia (O. niloticus) is between 27 and 32 °C. Giant clams are more likely to spawn at the higher ranges of their optimal temperatures (28 to 32 °C). Beyond this optimal range, however, symbiotic algae are often expelled (Shokita et al. 1991). Sea urchins are especially sensitive to changes in salinity. After periods of heavy rain, sea urchins are often found dead or dying in shallower waters (Shokita et al. 1991). The only measurable variable with respect to oceanographic conditions that we can freely obtain is the SST of Samoan waters. A plot of albacore catch per unit effort (CPUE) and SST series from 2001 to 2006 is shown in Figure 3.7. Figure 3.7 shows that over time, high CPUE levels coincide with low SST and low CPUE levels coincide with high SST. Albacore inhabit depths where colder temperatures occur, below the thermocline layer. Although SST measurements do not extend below the thermocline layer, low SST is linked with relatively high levels of CPUE and vice versa. Practically, this means that low levels of SST are associated with higher catch rates for albacore tuna. Other species, including the yellowfin and skipjack tuna (Katsuwonus pelamis), are found to prefer warmer temperatures. WIth sufficient reliable data, we would expect, for these species at least, a correlation with SST opposite to that of albacore tuna.
0.0
10.0
20.0
30.0
40.0
50.0
60.0
70.0
80.0
Jan-0 1Apr-0
1Jul-01
O ct-01Jan-0 2
Apr-02
Jul-02O ct-0
2Jan-0 3
Apr-03
Jul-03O ct-0
3Jan-0 4
Apr-04
Jul-04O ct-0
4Jan-0 5
Apr-05
Jul-05O ct-0
5Jan-0 6
Apr-06
Jul-06O ct-0
6
-0.4
-0.3
-0.2
-0.1
0.0
0.1
0.2
0.3
ALB Smooth
SST Smooth
Figure 3.7: A smooth plot of Samoa�s domestic long line fleet�s albacore CPUE series and
SST series in Samoan waters from 2001 to 2006
53
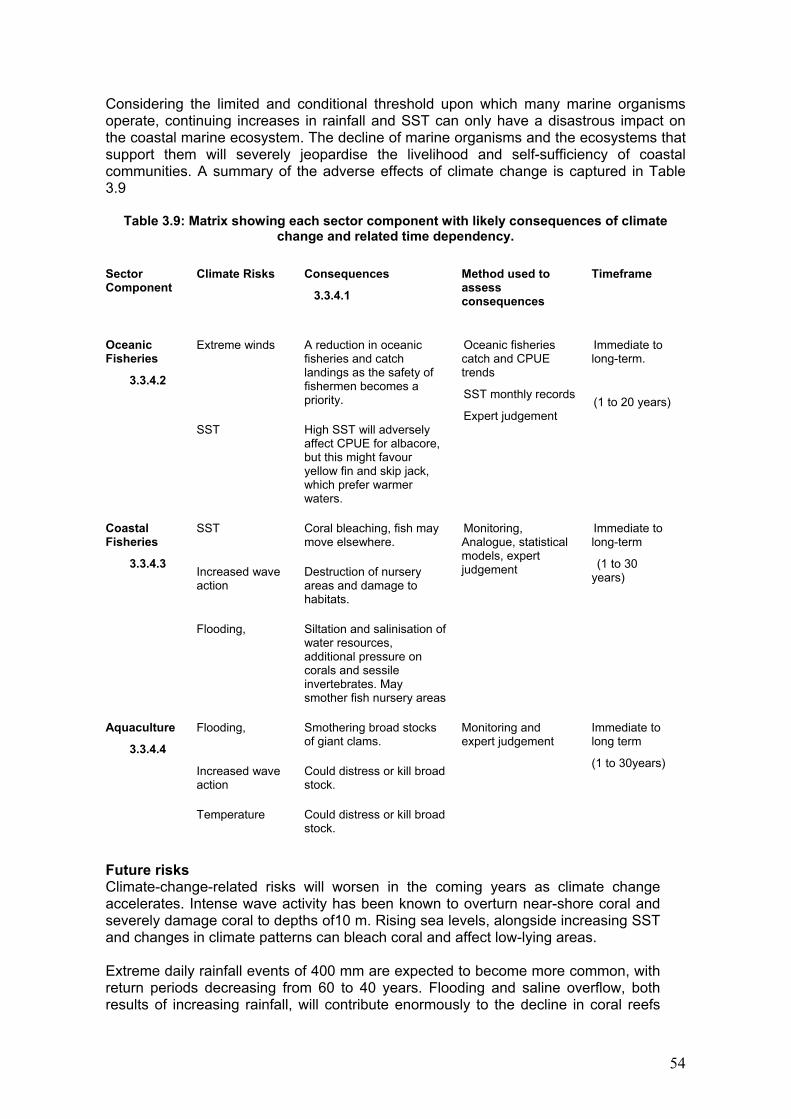
Considering the limited and conditional threshold upon which many marine organisms operate, continuing increases in rainfall and SST can only have a disastrous impact on the coastal marine ecosystem. The decline of marine organisms and the ecosystems that support them will severely jeopardise the livelihood and self-sufficiency of coastal communities. A summary of the adverse effects of climate change is captured in Table 3.9
Table 3.9: Matrix showing each sector component with likely consequences of climate change and related time dependency.
Sector Component
Climate Risks Consequences
3.3.4.1
Method used to assess consequences
Timeframe
Extreme winds A reduction in oceanic fisheries and catch landings as the safety of fishermen becomes a priority.
Oceanic Fisheries
3.3.4.2
SST High SST will adversely affect CPUE for albacore, but this might favour yellow fin and skip jack, which prefer warmer waters.
Oceanic fisheries catch and CPUE trends
SST monthly records
Expert judgement
Immediate to long-term.
(1 to 20 years)
SST Coral bleaching, fish may move elsewhere.
Increased wave action
Destruction of nursery areas and damage to habitats.
Coastal Fisheries
3.3.4.3
Flooding, Siltation and salinisation of water resources, additional pressure on corals and sessile invertebrates. May smother fish nursery areas
Monitoring, Analogue, statistical models, expert judgement
Immediate to long-term
(1 to 30 years)
Flooding, Smothering broad stocks of giant clams.
Increased wave action
Could distress or kill broad stock.
Aquaculture
3.3.4.4
Temperature Could distress or kill broad stock.
Monitoring and expert judgement
Immediate to long term
(1 to 30years)
Future risks Climate-change-related risks will worsen in the coming years as climate change accelerates. Intense wave activity has been known to overturn near-shore coral and severely damage coral to depths of10 m. Rising sea levels, alongside increasing SST and changes in climate patterns can bleach coral and affect low-lying areas. Extreme daily rainfall events of 400 mm are expected to become more common, with return periods decreasing from 60 to 40 years. Flooding and saline overflow, both results of increasing rainfall, will contribute enormously to the decline in coral reefs
54
and subordinate ecosystems. This will have an immediate effect on the survival rate of restocking species. El Niño events have a direct, causal effect on marine nutrient levels and consequently conditions for fishery. Global warming is believed to be causing more pronounced El Niño events.
3.3.5 Biodiversity Many changes are anticipated for the biodiversity sector as a result of climate change, not only in terms of species population but also in terms of the health of entire ecosystems. The health of the biodiversity sector has direct consequences for inter-related sectors, namely fisheries, forestry, agriculture, tourism, infrastructure, health and water. The biodiversity sector will need to implement sound adaptation activities to combat both the detrimental consequences of human activity and the effects of climate change. Potential consequences at the species level Sectoral efforts to assess vulnerabilities and generate future climate-change scenarios face numerous difficulties and uncertainties. Most animals depend on more than one habitat for survival, thus, if only one of these habitats is damaged or destroyed a great deal of uncertainty surrounds their capacity to adapt and survive. To identify potential damage to habitat and ecosystems will therefore provide an idea of how different species may be affected. Increasing temperatures can affect species in quite profound ways. A change in SST may for instance affect the timing of biological events (phenology) for certain species. Many species may also show changes in morphology, physiology and behaviour associated with changes in climatic variables, for example accelerated attainment of sexual maturity. Furthermore, there is some concern that particular species may become endangered or extinct, particularly species that are currently vulnerable, for instance the endemic Manumea and certain species of turtle. Changes in species distribution and density from climatic stress could also affect the availability of food and increase the frequency and intensity of pestilential outbreaks, which would again have some bearing on species� capacity to survive. Potential consequences at the ecosystems level Climate change is expected not only to affect the diversity of native fauna and flora, but also the ecosystems that provide goods and services for human welfare and development. Marine biodiversity Extreme climatic conditions relevant for the marine biodiversity sector include:
• sea-level rise
• higher SST
• increasingly frequent and intense tropical storms
• frequent flooding
• extreme high and low tides
• increases in ocean acidification.
These climatic changes will have potentially disastrous consequences for marine biodiversity and ecosystems, including:
55
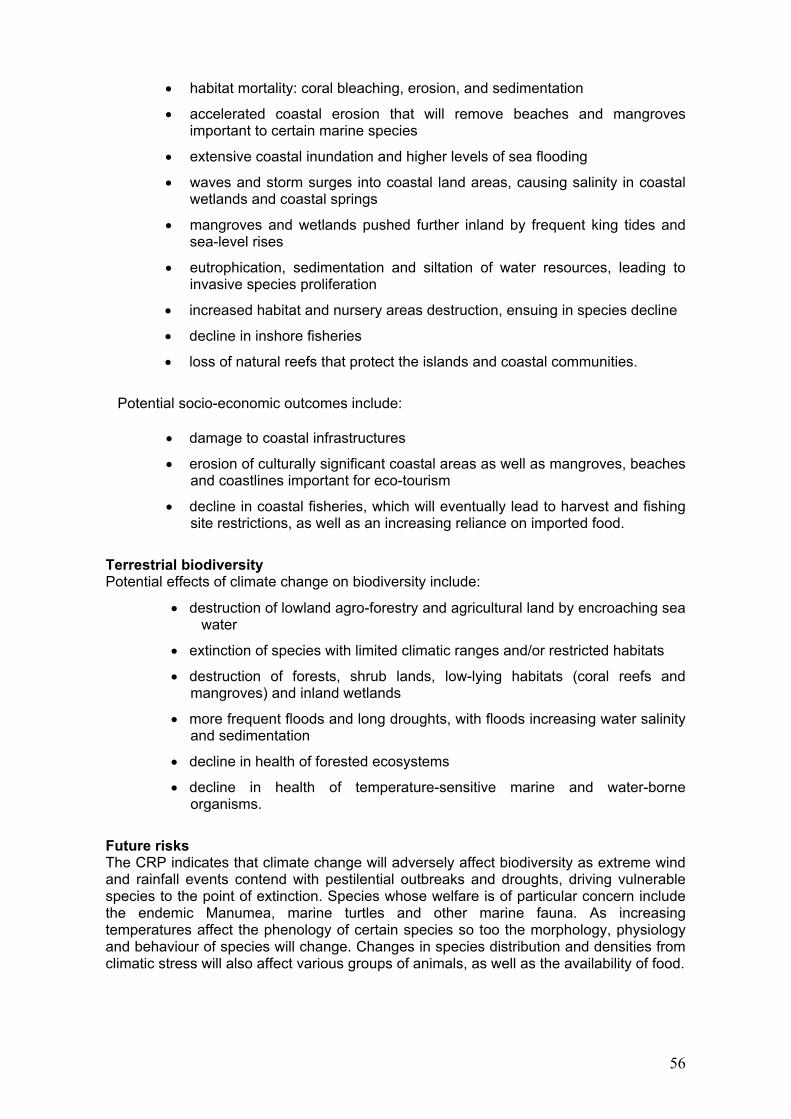
• habitat mortality: coral bleaching, erosion, and sedimentation
• accelerated coastal erosion that will remove beaches and mangroves important to certain marine species
• extensive coastal inundation and higher levels of sea flooding
• waves and storm surges into coastal land areas, causing salinity in coastal wetlands and coastal springs
• mangroves and wetlands pushed further inland by frequent king tides and sea-level rises
• eutrophication, sedimentation and siltation of water resources, leading to invasive species proliferation
• increased habitat and nursery areas destruction, ensuing in species decline
• decline in inshore fisheries
• loss of natural reefs that protect the islands and coastal communities.
Potential socio-economic outcomes include:
• damage to coastal infrastructures
• erosion of culturally significant coastal areas as well as mangroves, beaches and coastlines important for eco-tourism
• decline in coastal fisheries, which will eventually lead to harvest and fishing site restrictions, as well as an increasing reliance on imported food.
Terrestrial biodiversity Potential effects of climate change on biodiversity include:
• destruction of lowland agro-forestry and agricultural land by encroaching sea water
• extinction of species with limited climatic ranges and/or restricted habitats
• destruction of forests, shrub lands, low-lying habitats (coral reefs and mangroves) and inland wetlands
• more frequent floods and long droughts, with floods increasing water salinity and sedimentation
• decline in health of forested ecosystems
• decline in health of temperature-sensitive marine and water-borne organisms.
Future risks The CRP indicates that climate change will adversely affect biodiversity as extreme wind and rainfall events contend with pestilential outbreaks and droughts, driving vulnerable species to the point of extinction. Species whose welfare is of particular concern include the endemic Manumea, marine turtles and other marine fauna. As increasing temperatures affect the phenology of certain species so too the morphology, physiology and behaviour of species will change. Changes in species distribution and densities from climatic stress will also affect various groups of animals, as well as the availability of food.
56
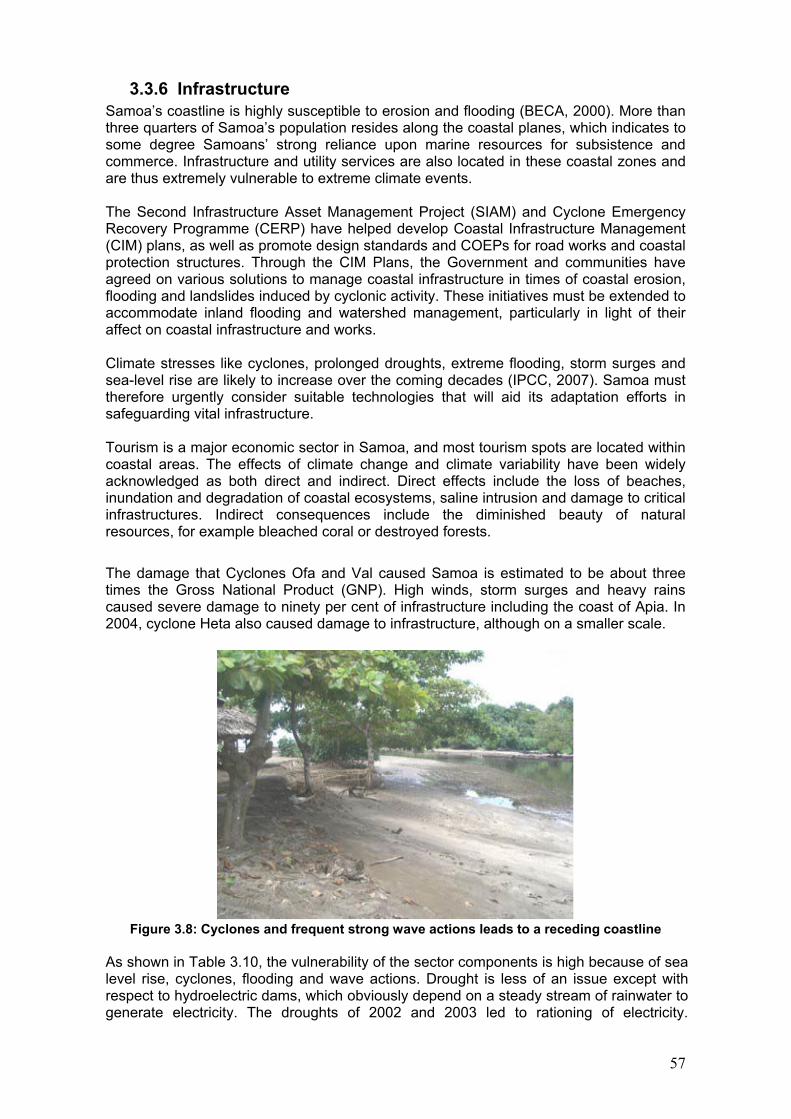
3.3.6 Infrastructure Samoa�s coastline is highly susceptible to erosion and flooding (BECA, 2000). More than three quarters of Samoa�s population resides along the coastal planes, which indicates to some degree Samoans� strong reliance upon marine resources for subsistence and commerce. Infrastructure and utility services are also located in these coastal zones and are thus extremely vulnerable to extreme climate events. The Second Infrastructure Asset Management Project (SIAM) and Cyclone Emergency Recovery Programme (CERP) have helped develop Coastal Infrastructure Management (CIM) plans, as well as promote design standards and COEPs for road works and coastal protection structures. Through the CIM Plans, the Government and communities have agreed on various solutions to manage coastal infrastructure in times of coastal erosion, flooding and landslides induced by cyclonic activity. These initiatives must be extended to accommodate inland flooding and watershed management, particularly in light of their affect on coastal infrastructure and works. Climate stresses like cyclones, prolonged droughts, extreme flooding, storm surges and sea-level rise are likely to increase over the coming decades (IPCC, 2007). Samoa must therefore urgently consider suitable technologies that will aid its adaptation efforts in safeguarding vital infrastructure. Tourism is a major economic sector in Samoa, and most tourism spots are located within coastal areas. The effects of climate change and climate variability have been widely acknowledged as both direct and indirect. Direct effects include the loss of beaches, inundation and degradation of coastal ecosystems, saline intrusion and damage to critical infrastructures. Indirect consequences include the diminished beauty of natural resources, for example bleached coral or destroyed forests.
The damage that Cyclones Ofa and Val caused Samoa is estimated to be about three times the Gross National Product (GNP). High winds, storm surges and heavy rains caused severe damage to ninety per cent of infrastructure including the coast of Apia. In 2004, cyclone Heta also caused damage to infrastructure, although on a smaller scale.
Figure 3.8: Cyclones and frequent strong wave actions leads to a receding coastline
As shown in Table 3.10, the vulnerability of the sector components is high because of sea level rise, cyclones, flooding and wave actions. Drought is less of an issue except with respect to hydroelectric dams, which obviously depend on a steady stream of rainwater to generate electricity. The droughts of 2002 and 2003 led to rationing of electricity.
57
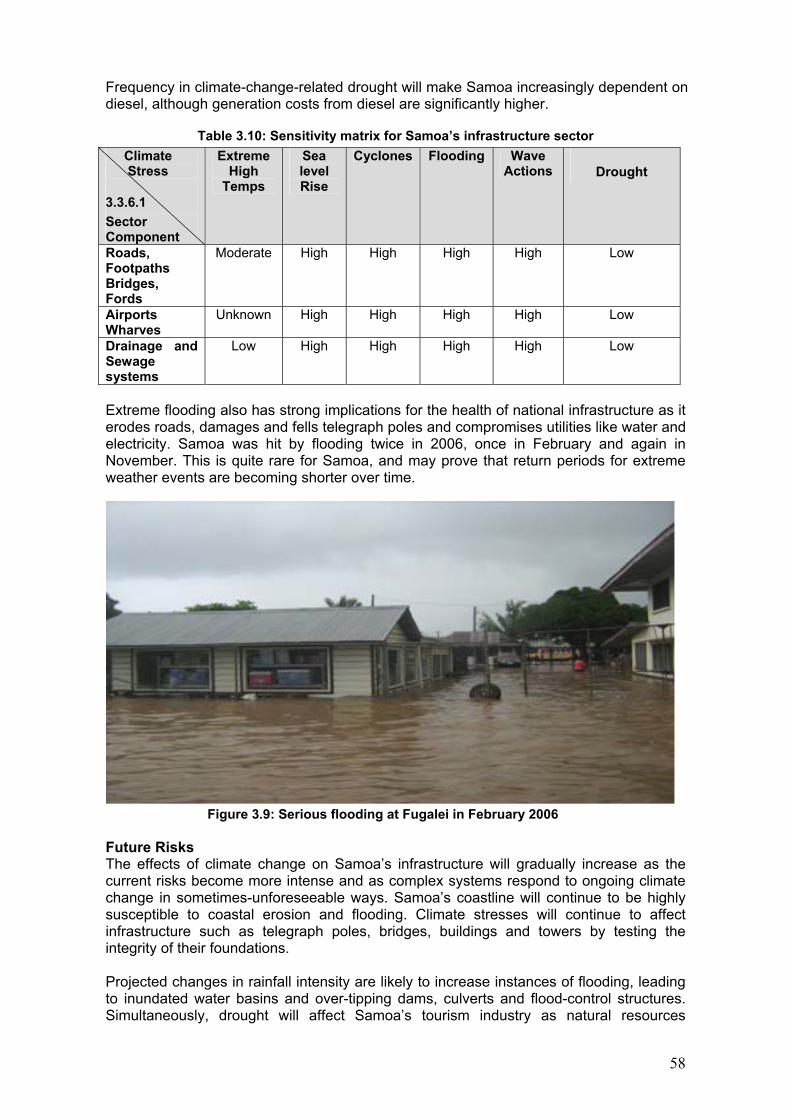
Frequency in climate-change-related drought will make Samoa increasingly dependent on diesel, although generation costs from diesel are significantly higher.
Table 3.10: Sensitivity matrix for Samoa�s infrastructure sector Climate Stress
3.3.6.1 Sector Component
Extreme High
Temps
Sea level Rise
Cyclones Flooding Wave Actions Drought
Roads, Footpaths Bridges, Fords
Moderate High High High High Low
Airports Wharves
Unknown High High High High Low
Drainage and Sewage systems
Low High High High High Low
Extreme flooding also has strong implications for the health of national infrastructure as it erodes roads, damages and fells telegraph poles and compromises utilities like water and electricity. Samoa was hit by flooding twice in 2006, once in February and again in November. This is quite rare for Samoa, and may prove that return periods for extreme weather events are becoming shorter over time.
Figure 3.9: Serious flooding at Fugalei in February 2006
Future Risks The effects of climate change on Samoa�s infrastructure will gradually increase as the current risks become more intense and as complex systems respond to ongoing climate change in sometimes-unforeseeable ways. Samoa�s coastline will continue to be highly susceptible to coastal erosion and flooding. Climate stresses will continue to affect infrastructure such as telegraph poles, bridges, buildings and towers by testing the integrity of their foundations. Projected changes in rainfall intensity are likely to increase instances of flooding, leading to inundated water basins and over-tipping dams, culverts and flood-control structures. Simultaneously, drought will affect Samoa�s tourism industry as natural resources
58
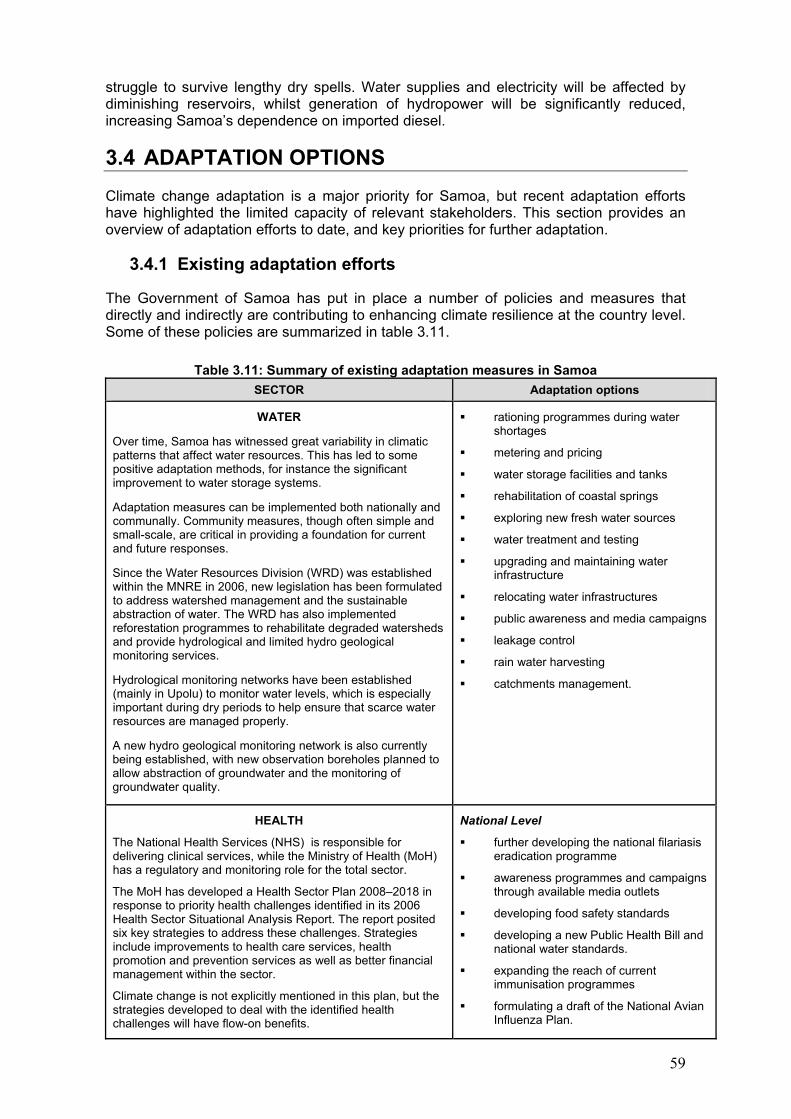
struggle to survive lengthy dry spells. Water supplies and electricity will be affected by diminishing reservoirs, whilst generation of hydropower will be significantly reduced, increasing Samoa�s dependence on imported diesel.
3.4 ADAPTATION OPTIONS Climate change adaptation is a major priority for Samoa, but recent adaptation efforts have highlighted the limited capacity of relevant stakeholders. This section provides an overview of adaptation efforts to date, and key priorities for further adaptation.
3.4.1 Existing adaptation efforts
The Government of Samoa has put in place a number of policies and measures that directly and indirectly are contributing to enhancing climate resilience at the country level. Some of these policies are summarized in table 3.11.
Table 3.11: Summary of existing adaptation measures in Samoa SECTOR Adaptation options
WATER
Over time, Samoa has witnessed great variability in climatic patterns that affect water resources. This has led to some positive adaptation methods, for instance the significant improvement to water storage systems.
Adaptation measures can be implemented both nationally and communally. Community measures, though often simple and small-scale, are critical in providing a foundation for current and future responses.
Since the Water Resources Division (WRD) was established within the MNRE in 2006, new legislation has been formulated to address watershed management and the sustainable abstraction of water. The WRD has also implemented reforestation programmes to rehabilitate degraded watersheds and provide hydrological and limited hydro geological monitoring services.
Hydrological monitoring networks have been established (mainly in Upolu) to monitor water levels, which is especially important during dry periods to help ensure that scarce water resources are managed properly.
A new hydro geological monitoring network is also currently being established, with new observation boreholes planned to allow abstraction of groundwater and the monitoring of groundwater quality.
! rationing programmes during water shortages
! metering and pricing
! water storage facilities and tanks
! rehabilitation of coastal springs
! exploring new fresh water sources
! water treatment and testing
! upgrading and maintaining water infrastructure
! relocating water infrastructures
! public awareness and media campaigns
! leakage control
! rain water harvesting
! catchments management.
HEALTH
The National Health Services (NHS) is responsible for delivering clinical services, while the Ministry of Health (MoH) has a regulatory and monitoring role for the total sector.
The MoH has developed a Health Sector Plan 2008�2018 in response to priority health challenges identified in its 2006 Health Sector Situational Analysis Report. The report posited six key strategies to address these challenges. Strategies include improvements to health care services, health promotion and prevention services as well as better financial management within the sector.
Climate change is not explicitly mentioned in this plan, but the strategies developed to deal with the identified health challenges will have flow-on benefits.
National Level
! further developing the national filariasis eradication programme
! awareness programmes and campaigns through available media outlets
! developing food safety standards
! developing a new Public Health Bill and national water standards.
! expanding the reach of current immunisation programmes
! formulating a draft of the National Avian Influenza Plan.
59
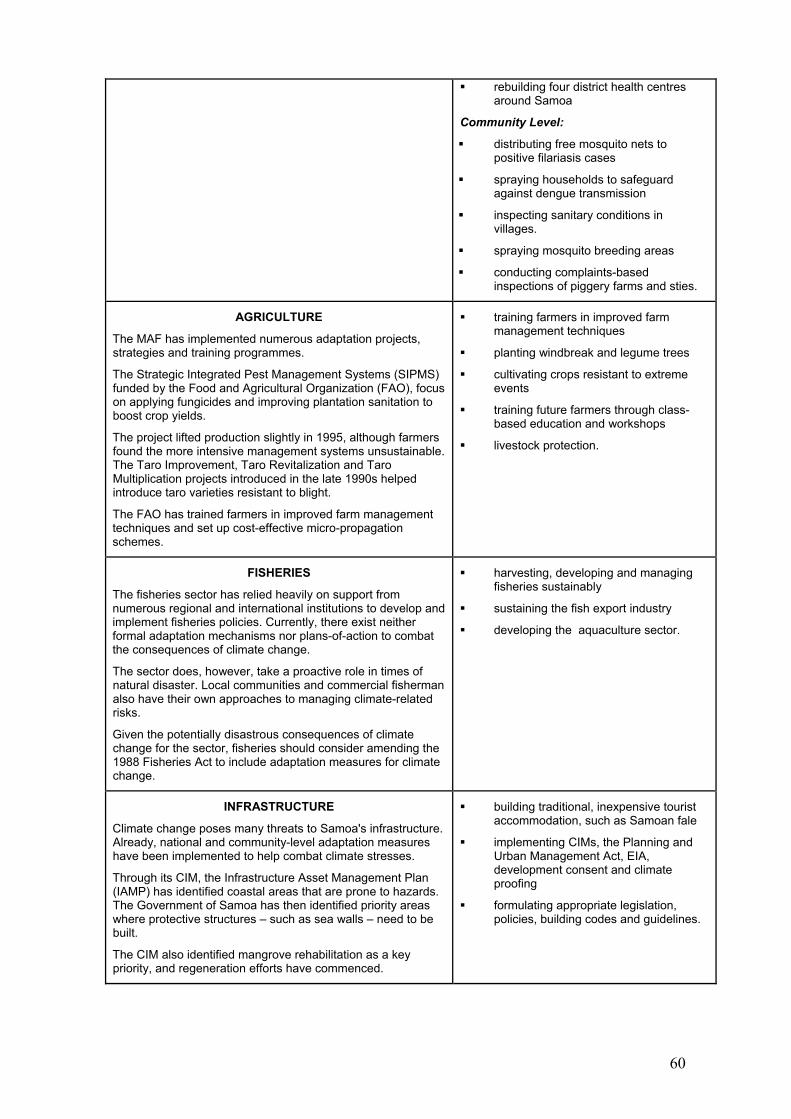
! rebuilding four district health centres around Samoa
Community Level:
! distributing free mosquito nets to positive filariasis cases
! spraying households to safeguard against dengue transmission
! inspecting sanitary conditions in villages.
! spraying mosquito breeding areas
! conducting complaints-based inspections of piggery farms and sties.
AGRICULTURE
The MAF has implemented numerous adaptation projects, strategies and training programmes.
The Strategic Integrated Pest Management Systems (SIPMS) funded by the Food and Agricultural Organization (FAO), focus on applying fungicides and improving plantation sanitation to boost crop yields.
The project lifted production slightly in 1995, although farmers found the more intensive management systems unsustainable. The Taro Improvement, Taro Revitalization and Taro Multiplication projects introduced in the late 1990s helped introduce taro varieties resistant to blight.
The FAO has trained farmers in improved farm management techniques and set up cost-effective micro-propagation schemes.
! training farmers in improved farm management techniques
! planting windbreak and legume trees
! cultivating crops resistant to extreme events
! training future farmers through class-based education and workshops
! livestock protection.
FISHERIES
The fisheries sector has relied heavily on support from numerous regional and international institutions to develop and implement fisheries policies. Currently, there exist neither formal adaptation mechanisms nor plans-of-action to combat the consequences of climate change.
The sector does, however, take a proactive role in times of natural disaster. Local communities and commercial fisherman also have their own approaches to managing climate-related risks.
Given the potentially disastrous consequences of climate change for the sector, fisheries should consider amending the 1988 Fisheries Act to include adaptation measures for climate change.
! harvesting, developing and managing fisheries sustainably
! sustaining the fish export industry
! developing the aquaculture sector.
INFRASTRUCTURE
Climate change poses many threats to Samoa's infrastructure. Already, national and community-level adaptation measures have been implemented to help combat climate stresses.
Through its CIM, the Infrastructure Asset Management Plan (IAMP) has identified coastal areas that are prone to hazards. The Government of Samoa has then identified priority areas where protective structures � such as sea walls � need to be built.
The CIM also identified mangrove rehabilitation as a key priority, and regeneration efforts have commenced.
! building traditional, inexpensive tourist accommodation, such as Samoan fale
! implementing CIMs, the Planning and Urban Management Act, EIA, development consent and climate proofing
! formulating appropriate legislation, policies, building codes and guidelines.
60
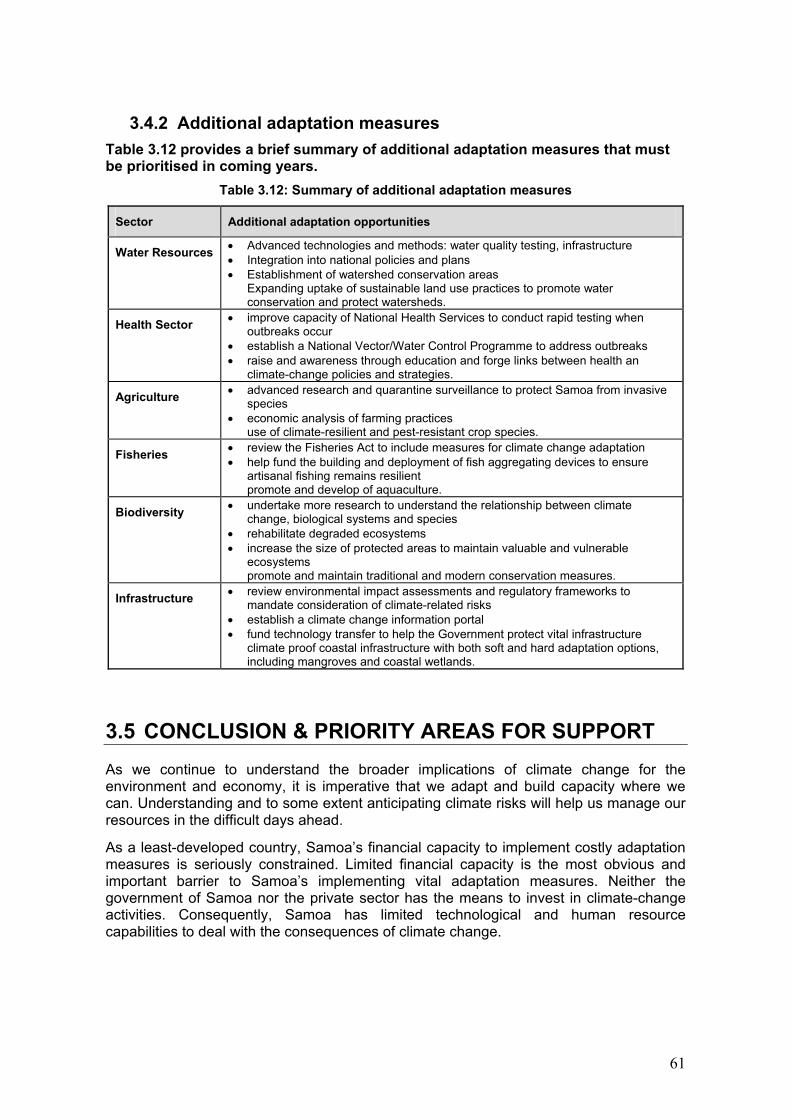
3.4.2 Additional adaptation measures Table 3.12 provides a brief summary of additional adaptation measures that must be prioritised in coming years.
Table 3.12: Summary of additional adaptation measures
Sector Additional adaptation opportunities
Water Resources • Advanced technologies and methods: water quality testing, infrastructure • Integration into national policies and plans • Establishment of watershed conservation areas
Expanding uptake of sustainable land use practices to promote water conservation and protect watersheds.
Health Sector • improve capacity of National Health Services to conduct rapid testing when outbreaks occur
• establish a National Vector/Water Control Programme to address outbreaks • raise and awareness through education and forge links between health an
climate-change policies and strategies.
Agriculture • advanced research and quarantine surveillance to protect Samoa from invasive species
• economic analysis of farming practices use of climate-resilient and pest-resistant crop species.
Fisheries • review the Fisheries Act to include measures for climate change adaptation • help fund the building and deployment of fish aggregating devices to ensure
artisanal fishing remains resilient promote and develop of aquaculture.
Biodiversity • undertake more research to understand the relationship between climate change, biological systems and species
• rehabilitate degraded ecosystems • increase the size of protected areas to maintain valuable and vulnerable
ecosystems promote and maintain traditional and modern conservation measures.
Infrastructure • review environmental impact assessments and regulatory frameworks to mandate consideration of climate-related risks
• establish a climate change information portal • fund technology transfer to help the Government protect vital infrastructure
climate proof coastal infrastructure with both soft and hard adaptation options, including mangroves and coastal wetlands.
3.5 CONCLUSION & PRIORITY AREAS FOR SUPPORT As we continue to understand the broader implications of climate change for the environment and economy, it is imperative that we adapt and build capacity where we can. Understanding and to some extent anticipating climate risks will help us manage our resources in the difficult days ahead.
As a least-developed country, Samoa�s financial capacity to implement costly adaptation measures is seriously constrained. Limited financial capacity is the most obvious and important barrier to Samoa�s implementing vital adaptation measures. Neither the government of Samoa nor the private sector has the means to invest in climate-change activities. Consequently, Samoa has limited technological and human resource capabilities to deal with the consequences of climate change.
61
4. MITIGATION
62
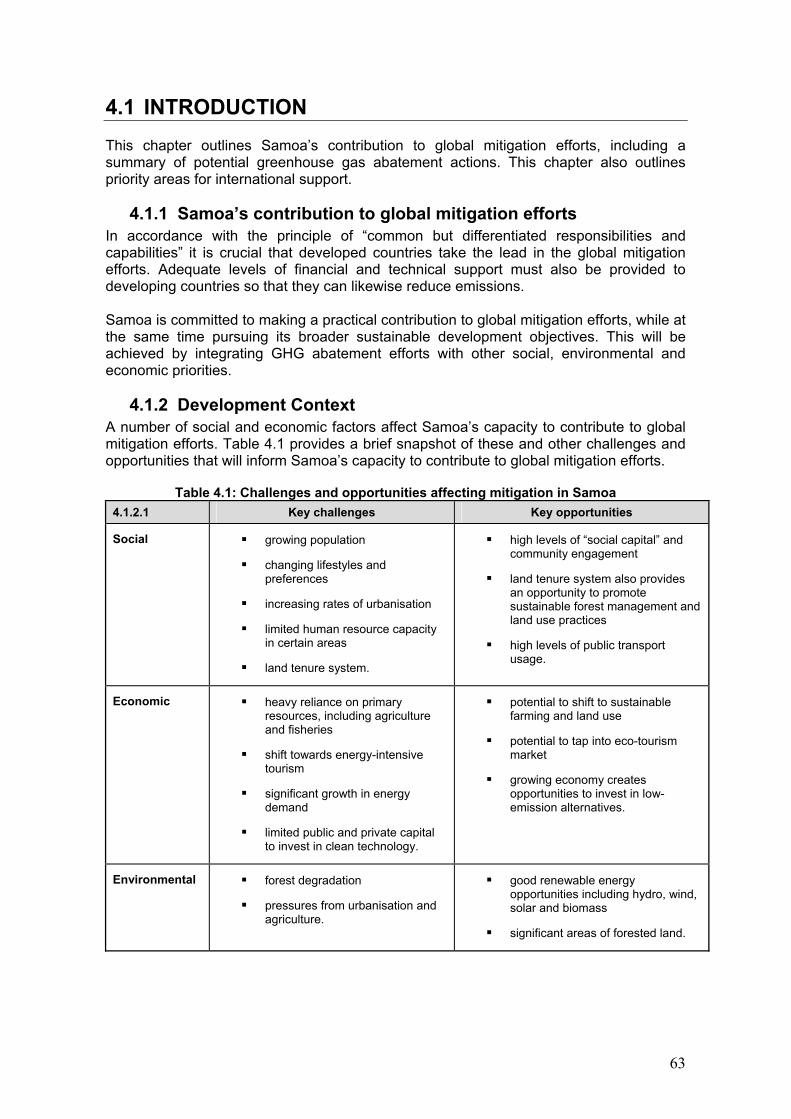
4.1 INTRODUCTION This chapter outlines Samoa�s contribution to global mitigation efforts, including a summary of potential greenhouse gas abatement actions. This chapter also outlines priority areas for international support.
4.1.1 Samoa�s contribution to global mitigation efforts In accordance with the principle of �common but differentiated responsibilities and capabilities� it is crucial that developed countries take the lead in the global mitigation efforts. Adequate levels of financial and technical support must also be provided to developing countries so that they can likewise reduce emissions. Samoa is committed to making a practical contribution to global mitigation efforts, while at the same time pursuing its broader sustainable development objectives. This will be achieved by integrating GHG abatement efforts with other social, environmental and economic priorities.
4.1.2 Development Context A number of social and economic factors affect Samoa�s capacity to contribute to global mitigation efforts. Table 4.1 provides a brief snapshot of these and other challenges and opportunities that will inform Samoa�s capacity to contribute to global mitigation efforts.
Table 4.1: Challenges and opportunities affecting mitigation in Samoa 4.1.2.1 Key challenges Key opportunities
Social ! growing population
! changing lifestyles and preferences
! increasing rates of urbanisation
! limited human resource capacity in certain areas
! land tenure system.
! high levels of �social capital� and community engagement
! land tenure system also provides an opportunity to promote sustainable forest management and land use practices
! high levels of public transport usage.
Economic ! heavy reliance on primary resources, including agriculture and fisheries
! shift towards energy-intensive tourism
! significant growth in energy demand
! limited public and private capital to invest in clean technology.
! potential to shift to sustainable farming and land use
! potential to tap into eco-tourism market
! growing economy creates opportunities to invest in low-emission alternatives.
Environmental ! forest degradation
! pressures from urbanisation and agriculture.
! good renewable energy opportunities including hydro, wind, solar and biomass
! significant areas of forested land.
63
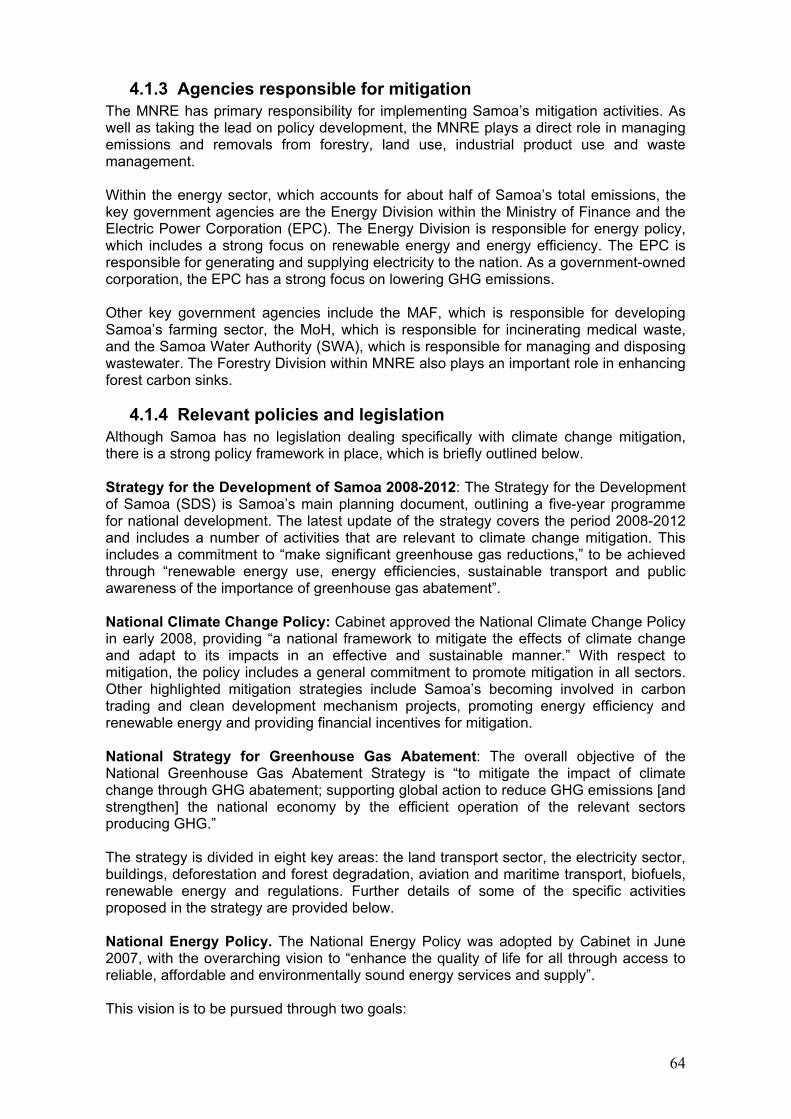
4.1.3 Agencies responsible for mitigation The MNRE has primary responsibility for implementing Samoa�s mitigation activities. As well as taking the lead on policy development, the MNRE plays a direct role in managing emissions and removals from forestry, land use, industrial product use and waste management. Within the energy sector, which accounts for about half of Samoa�s total emissions, the key government agencies are the Energy Division within the Ministry of Finance and the Electric Power Corporation (EPC). The Energy Division is responsible for energy policy, which includes a strong focus on renewable energy and energy efficiency. The EPC is responsible for generating and supplying electricity to the nation. As a government-owned corporation, the EPC has a strong focus on lowering GHG emissions. Other key government agencies include the MAF, which is responsible for developing Samoa�s farming sector, the MoH, which is responsible for incinerating medical waste, and the Samoa Water Authority (SWA), which is responsible for managing and disposing wastewater. The Forestry Division within MNRE also plays an important role in enhancing forest carbon sinks.
4.1.4 Relevant policies and legislation Although Samoa has no legislation dealing specifically with climate change mitigation, there is a strong policy framework in place, which is briefly outlined below. Strategy for the Development of Samoa 2008-2012: The Strategy for the Development of Samoa (SDS) is Samoa�s main planning document, outlining a five-year programme for national development. The latest update of the strategy covers the period 2008-2012 and includes a number of activities that are relevant to climate change mitigation. This includes a commitment to �make significant greenhouse gas reductions,� to be achieved through �renewable energy use, energy efficiencies, sustainable transport and public awareness of the importance of greenhouse gas abatement�. National Climate Change Policy: Cabinet approved the National Climate Change Policy in early 2008, providing �a national framework to mitigate the effects of climate change and adapt to its impacts in an effective and sustainable manner.� With respect to mitigation, the policy includes a general commitment to promote mitigation in all sectors. Other highlighted mitigation strategies include Samoa�s becoming involved in carbon trading and clean development mechanism projects, promoting energy efficiency and renewable energy and providing financial incentives for mitigation. National Strategy for Greenhouse Gas Abatement: The overall objective of the National Greenhouse Gas Abatement Strategy is �to mitigate the impact of climate change through GHG abatement; supporting global action to reduce GHG emissions [and strengthen] the national economy by the efficient operation of the relevant sectors producing GHG.� The strategy is divided in eight key areas: the land transport sector, the electricity sector, buildings, deforestation and forest degradation, aviation and maritime transport, biofuels, renewable energy and regulations. Further details of some of the specific activities proposed in the strategy are provided below. National Energy Policy. The National Energy Policy was adopted by Cabinet in June 2007, with the overarching vision to �enhance the quality of life for all through access to reliable, affordable and environmentally sound energy services and supply�. This vision is to be pursued through two goals:
64
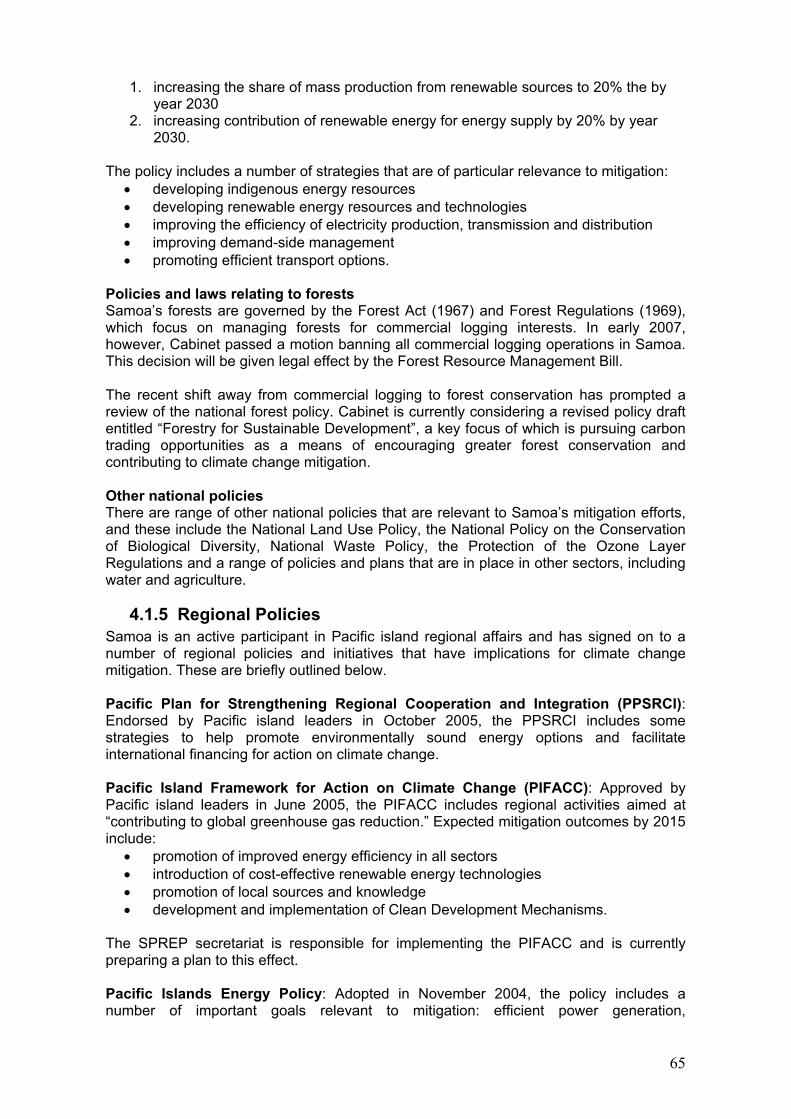
1. increasing the share of mass production from renewable sources to 20% the by year 2030
2. increasing contribution of renewable energy for energy supply by 20% by year 2030.
The policy includes a number of strategies that are of particular relevance to mitigation:
• developing indigenous energy resources • developing renewable energy resources and technologies • improving the efficiency of electricity production, transmission and distribution • improving demand-side management • promoting efficient transport options.
Policies and laws relating to forests Samoa�s forests are governed by the Forest Act (1967) and Forest Regulations (1969), which focus on managing forests for commercial logging interests. In early 2007, however, Cabinet passed a motion banning all commercial logging operations in Samoa. This decision will be given legal effect by the Forest Resource Management Bill. The recent shift away from commercial logging to forest conservation has prompted a review of the national forest policy. Cabinet is currently considering a revised policy draft entitled �Forestry for Sustainable Development�, a key focus of which is pursuing carbon trading opportunities as a means of encouraging greater forest conservation and contributing to climate change mitigation. Other national policies There are range of other national policies that are relevant to Samoa�s mitigation efforts, and these include the National Land Use Policy, the National Policy on the Conservation of Biological Diversity, National Waste Policy, the Protection of the Ozone Layer Regulations and a range of policies and plans that are in place in other sectors, including water and agriculture.
4.1.5 Regional Policies Samoa is an active participant in Pacific island regional affairs and has signed on to a number of regional policies and initiatives that have implications for climate change mitigation. These are briefly outlined below. Pacific Plan for Strengthening Regional Cooperation and Integration (PPSRCI): Endorsed by Pacific island leaders in October 2005, the PPSRCI includes some strategies to help promote environmentally sound energy options and facilitate international financing for action on climate change. Pacific Island Framework for Action on Climate Change (PIFACC): Approved by Pacific island leaders in June 2005, the PIFACC includes regional activities aimed at �contributing to global greenhouse gas reduction.� Expected mitigation outcomes by 2015 include:
• promotion of improved energy efficiency in all sectors • introduction of cost-effective renewable energy technologies • promotion of local sources and knowledge • development and implementation of Clean Development Mechanisms.
The SPREP secretariat is responsible for implementing the PIFACC and is currently preparing a plan to this effect. Pacific Islands Energy Policy: Adopted in November 2004, the policy includes a number of important goals relevant to mitigation: efficient power generation,
65
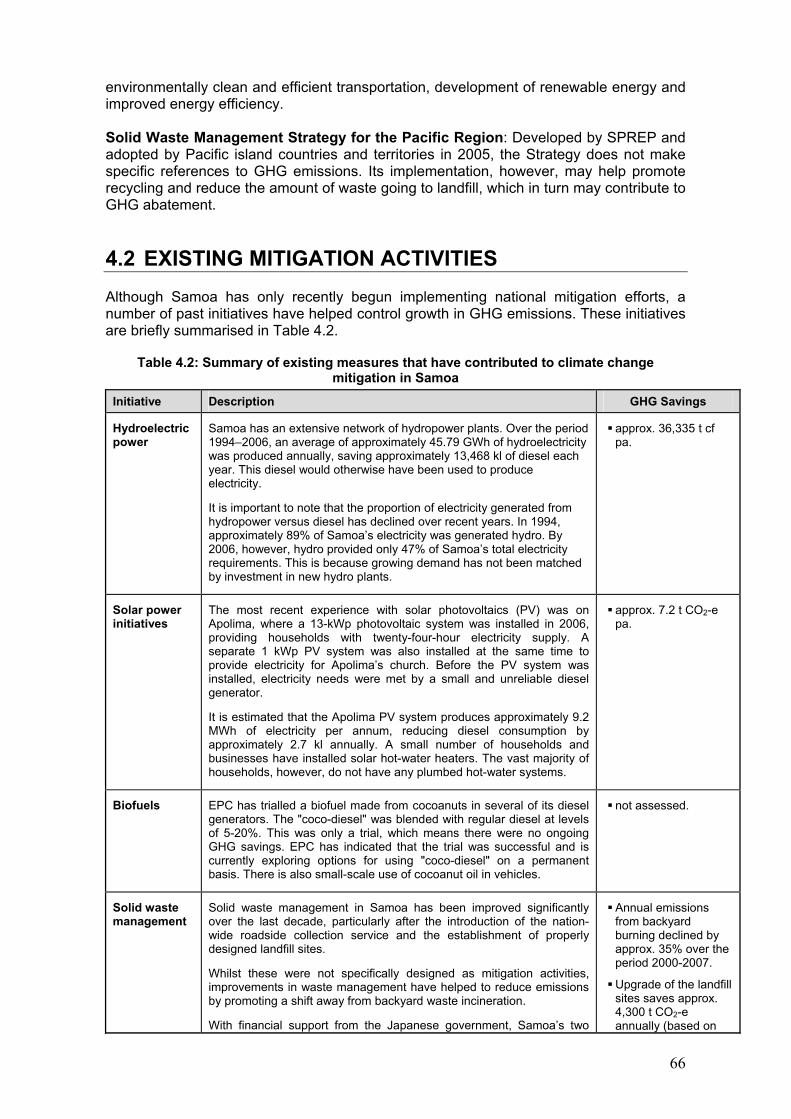
environmentally clean and efficient transportation, development of renewable energy and improved energy efficiency. Solid Waste Management Strategy for the Pacific Region: Developed by SPREP and adopted by Pacific island countries and territories in 2005, the Strategy does not make specific references to GHG emissions. Its implementation, however, may help promote recycling and reduce the amount of waste going to landfill, which in turn may contribute to GHG abatement.
4.2 EXISTING MITIGATION ACTIVITIES Although Samoa has only recently begun implementing national mitigation efforts, a number of past initiatives have helped control growth in GHG emissions. These initiatives are briefly summarised in Table 4.2.
Table 4.2: Summary of existing measures that have contributed to climate change mitigation in Samoa
Initiative Description GHG Savings
Hydroelectric power
Samoa has an extensive network of hydropower plants. Over the period 1994�2006, an average of approximately 45.79 GWh of hydroelectricity was produced annually, saving approximately 13,468 kl of diesel each year. This diesel would otherwise have been used to produce electricity.
It is important to note that the proportion of electricity generated from hydropower versus diesel has declined over recent years. In 1994, approximately 89% of Samoa�s electricity was generated hydro. By 2006, however, hydro provided only 47% of Samoa�s total electricity requirements. This is because growing demand has not been matched by investment in new hydro plants.
! approx. 36,335 t cf pa.
Solar power initiatives
The most recent experience with solar photovoltaics (PV) was on Apolima, where a 13-kWp photovoltaic system was installed in 2006, providing households with twenty-four-hour electricity supply. A separate 1 kWp PV system was also installed at the same time to provide electricity for Apolima�s church. Before the PV system was installed, electricity needs were met by a small and unreliable diesel generator.
It is estimated that the Apolima PV system produces approximately 9.2 MWh of electricity per annum, reducing diesel consumption by approximately 2.7 kl annually. A small number of households and businesses have installed solar hot-water heaters. The vast majority of households, however, do not have any plumbed hot-water systems.
! approx. 7.2 t CO2-e pa.
Biofuels EPC has trialled a biofuel made from cocoanuts in several of its diesel generators. The "coco-diesel" was blended with regular diesel at levels of 5-20%. This was only a trial, which means there were no ongoing GHG savings. EPC has indicated that the trial was successful and is currently exploring options for using "coco-diesel" on a permanent basis. There is also small-scale use of cocoanut oil in vehicles.
! not assessed.
Solid waste management
Solid waste management in Samoa has been improved significantly over the last decade, particularly after the introduction of the nation-wide roadside collection service and the establishment of properly designed landfill sites.
Whilst these were not specifically designed as mitigation activities, improvements in waste management have helped to reduce emissions by promoting a shift away from backyard waste incineration.
With financial support from the Japanese government, Samoa�s two
! Annual emissions from backyard burning declined by approx. 35% over the period 2000-2007.
! Upgrade of the landfill sites saves approx. 4,300 t CO2-e annually (based on
66
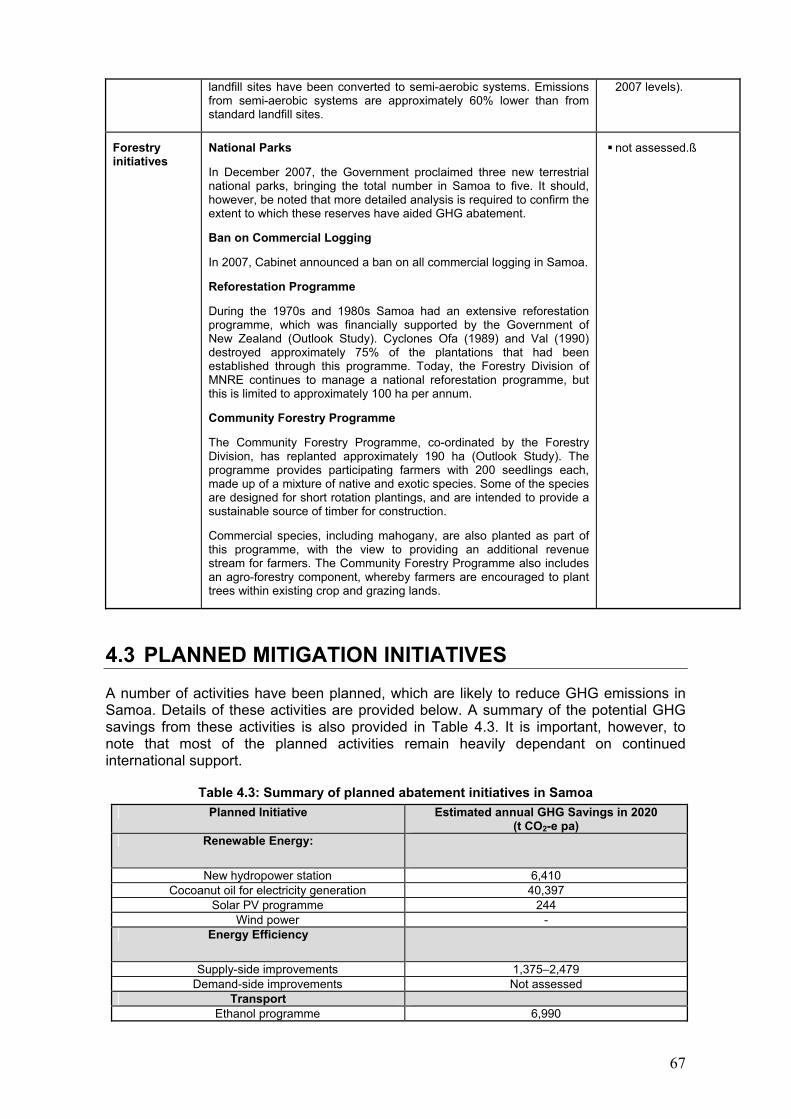
landfill sites have been converted to semi-aerobic systems. Emissions from semi-aerobic systems are approximately 60% lower than from standard landfill sites.
2007 levels).
Forestry initiatives
National Parks
In December 2007, the Government proclaimed three new terrestrial national parks, bringing the total number in Samoa to five. It should, however, be noted that more detailed analysis is required to confirm the extent to which these reserves have aided GHG abatement.
Ban on Commercial Logging
In 2007, Cabinet announced a ban on all commercial logging in Samoa.
Reforestation Programme
During the 1970s and 1980s Samoa had an extensive reforestation programme, which was financially supported by the Government of New Zealand (Outlook Study). Cyclones Ofa (1989) and Val (1990) destroyed approximately 75% of the plantations that had been established through this programme. Today, the Forestry Division of MNRE continues to manage a national reforestation programme, but this is limited to approximately 100 ha per annum.
Community Forestry Programme
The Community Forestry Programme, co-ordinated by the Forestry Division, has replanted approximately 190 ha (Outlook Study). The programme provides participating farmers with 200 seedlings each, made up of a mixture of native and exotic species. Some of the species are designed for short rotation plantings, and are intended to provide a sustainable source of timber for construction.
Commercial species, including mahogany, are also planted as part of this programme, with the view to providing an additional revenue stream for farmers. The Community Forestry Programme also includes an agro-forestry component, whereby farmers are encouraged to plant trees within existing crop and grazing lands.
! not assessed.ß
4.3 PLANNED MITIGATION INITIATIVES A number of activities have been planned, which are likely to reduce GHG emissions in Samoa. Details of these activities are provided below. A summary of the potential GHG savings from these activities is also provided in Table 4.3. It is important, however, to note that most of the planned activities remain heavily dependant on continued international support.
Table 4.3: Summary of planned abatement initiatives in Samoa Planned Initiative Estimated annual GHG Savings in 2020
(t CO2-e pa) Renewable Energy:
New hydropower station 6,410
Cocoanut oil for electricity generation 40,397 Solar PV programme 244
Wind power - Energy Efficiency
Supply-side improvements 1,375�2,479
Demand-side improvements Not assessed Transport
Ethanol programme 6,990
67
4.3.1 Renewable energy In recent years, the level of attention given to renewable energy in Samoa has increased substantially, reflecting a number of factors. The main driver behind the push for renewable energy in Samoa is to reduce the country�s dependence on imported petroleum products. Reducing GHG emissions, however, has also become a central goal of Samoa�s renewable energy programme. A brief summary of renewable energy initiatives planned for the coming years is provided below. Hydroelectric Power As part of the Asian Development Bank (ADB) -supported Power Sector Expansion Programme, finances have been allocated to invest in a hydropower scheme, with work to begin in 2012. It is envisioned that a 2.0 MW hydropower station will be built with an average annual energy output of 8,600 MWh. This will result in annual GHG savings of approximately 6,410 t CO2-e from 2014 onwards. In 2008, the EPC initiated stream-flow monitoring to provide the hydrological data needed to assess the viability of other proposed hydropower schemes. This monitoring work is being supported by the Global Environment Facility, as part of the Pacific Island Greenhouse Gas Abatement through Renewable Energy Project (PIGGAREP). Biofuels Petroleum Products Supplies (PPS), a privately owned company, has announced plans to begin production of a cocoanut-oil substitute for regular diesel. The short-term target is to produce 3.5 million litres of coconut oil per annum, with the longer-term goal (within ten years) of 15 million litres. Assuming PSP can reach its target of 15 million litres and that no blending is required, this initiative has the potential to save 40,397 tonnes of CO2-e per annum by 2018. Solar Energy Building on the experience gained through the Apolima solar project, the EPC plans to roll out a photovoltaic (PV) electrification programme, targeting households that are not currently connected to the electricity grid. According to the EPC, it is likely that 300 stand-alone systems will be installed through this programme. The anticipated ongoing GHG savings will be approximately 234 tonnes of CO2-e per annum. Wind Energy With funding from UNDP, the EPC has installed two wind-monitoring masts on Upolu, with the intention of assessing the viability of wind energy for Samoa. The data collected will be used to prepare a wind atlas for Samoa, which will help to identify suitable locations for wind generators. Depending on the findings of this work, more detailed feasibility studies will be prepared for each potential site to assess its technical, institutional, environmental, economic and financial viability. While this preparatory work does not generate any GHG savings, it is hoped that it will lead to the installation of wind turbines in Samoa, which will displace the need for diesel generation.
4.3.2 Energy Efficiency The efficient generation, distribution and use of electricity helps to minimise diesel consumption, which in turn helps reduce GHG emissions. To date, there has been very little emphasis on energy efficiency in Samoa. There are, however, a number of plans to improve both supply- and demand-side efficiency in the coming years, and these are outlined below.
68
Supply-side efficiency Overall system losses for Samoa�s electricity grid were estimated to be approximately 20% in 2006. As part of the Power Sector Expansion Programme, the EPC aims to reduce technical system losses by 10% by 2010 and 20% by 2012 through improving the efficiency of the transmission and distribution system. Assuming these targets are met, resulting annual GHG savings will be approximately 1,300�2500 tonnes CO2-e by 2020, depending on the share of renewable energy sources in the generation mix. Demand-side efficiency MNRE�s proposed Greenhouse Gas Abatement in Samoa�s Electricity Sector project will implement demonstration projects to showcase opportunities for demand-side energy efficiency. It will focus on the following areas: domestic-end users, industrial-end users, peak-time electricity utilisation and building systems. As mentioned above, the details of these projects are yet to be finalised and no targets for GHG abatement have been set. The Power Sector Expansion Programme will include the development of a demand-side management and energy conservation strategy for Samoa. According to the ADB, this strategy will �focus on the policy environment and tax incentives to promote energy efficiency�. Exactly how this will translate into actual energy savings remains to be seen.
4.3.3 Transport Initiatives Biofuels The Research and Development Institute of Samoa (RDIS) has established a research programme aimed at producing ethanol as a fuel source. Although the Government of Samoa is currently funding this research, the MNRE has also applied for funding from the Government of Italy to support this initiative. The research programme will explore the viability of producing ethanol from breadfruit, cassava and other food crops that are readily available in Samoa. The preliminary intention is to blend the ethanol with unleaded petrol at a ratio of 10:90 (�E10�) for use in cars. The RDIS aims to produce 3 million litres or ethanol per annum within five years. Assuming this target is met, the associated GHG savings would be approximately 6,963 tonnes of CO2-e per annum. Other initiatives The Government of Samoa is seeking to reduce emissions in the transport sector. Measures include public awareness programmes, vehicle emission standards, promoting fuel-efficient and alternative fuel vehicles, improving public transport services, introducing financial incentives to encourage energy efficiency and promoting non-motorised transport. The potential GHG abatement from these activities has not been calculated. The South Pacific Applied Geosciences Commission (SOPAC) has designed the Promotion of Environmentally Sustainable Transportation in the Pacific Islands (PESTRAN) project, which has been submitted to the Global Environment Facility (GEF) for consideration as part of the Pacific Alliance for Sustainability. If this regional project receives GEF approval, it will include a number of activities to promote sustainable transport in Samoa.
4.3.4 Other initiatives planned for the energy Sector Other planned initiatives that will contribute to GHG abatement in the energy sector include:
! Legal Reforms: The Ministry of Finance has prepared a Renewable Energy Bill and the MNRE has introduced energy-efficient standards for electrical equipment and buildings.
69
! Clean Energy Fund: As part of the ADB-funded Power Sector Expansion
Programme, the Government plans to establish a Clean Energy Fund (CEF). The aim of the CEF is to �improve the coordination of financing sources for clean energy resources in Samoa [and also act] a revolving fund�. Exact details of how the CEF will operate remain unclear, but the fund holds significant promise as a means of financing renewable energy activities.
! Energy Data Management: The Ministry of Finance has developed an electronic
database to manage all energy import, sales and consumption data, including data on renewable energy. While the energy database will not directly contribute to GHG abatement, it will provide an important tool for monitoring overall GHG emissions.
! Education and Public Awareness: The Energy Division plans to hold an annual
National Energy Awareness campaign, and co-ordinate annual public awareness campaigns on renewable energy and fuel efficiency. The two energy projects proposed by MNRE (see above) include significant public awareness activities.
4.4 ADDITIONAL MITIGATION OPPORTUNITIES In 2008, the Government of Samoa conducted an assessment of additional mitigation options, which identified a range of opportunities to reduce greenhouse gas emissions beyond what is likely to be achieved through current planned initiatives. The key findings of this mitigation assessment are presented here.
4.4.1 Methodology The Government of Samoa assessed mitigation options for the period 2009 to 2020, taking into account the following criteria:
• Technical feasibility: is the option technically viable in Samoa within the assessment timeframe?
• Economic efficiency: is the option an economically efficient way to reduce greenhouse gas emissions? Are there cheaper options?
• Sustainable development: will the option help achieve Samoa�s other social, economic and environmental objectives?
• Social and cultural appropriateness: is the option consistent with Samoa�s social and cultural norms and priorities?
• Environmental consequences: are there likely to be unavoidable environmental consequences?
4.4.2 Summary of additional mitigation opportunities A summary of the additional mitigation opportunities that are available to Samoa is presented in Table 4.4, with further details presented below. The most promising option is the expansion of Samoa�s hydropower generation capacity, while fuel-efficiency improvements for vehicles and greater demand-side energy efficiency also hold significant abatement potential. As discussed in more detail below, Samoa will depend on financial and technical support to implement these abatement opportunities.
70
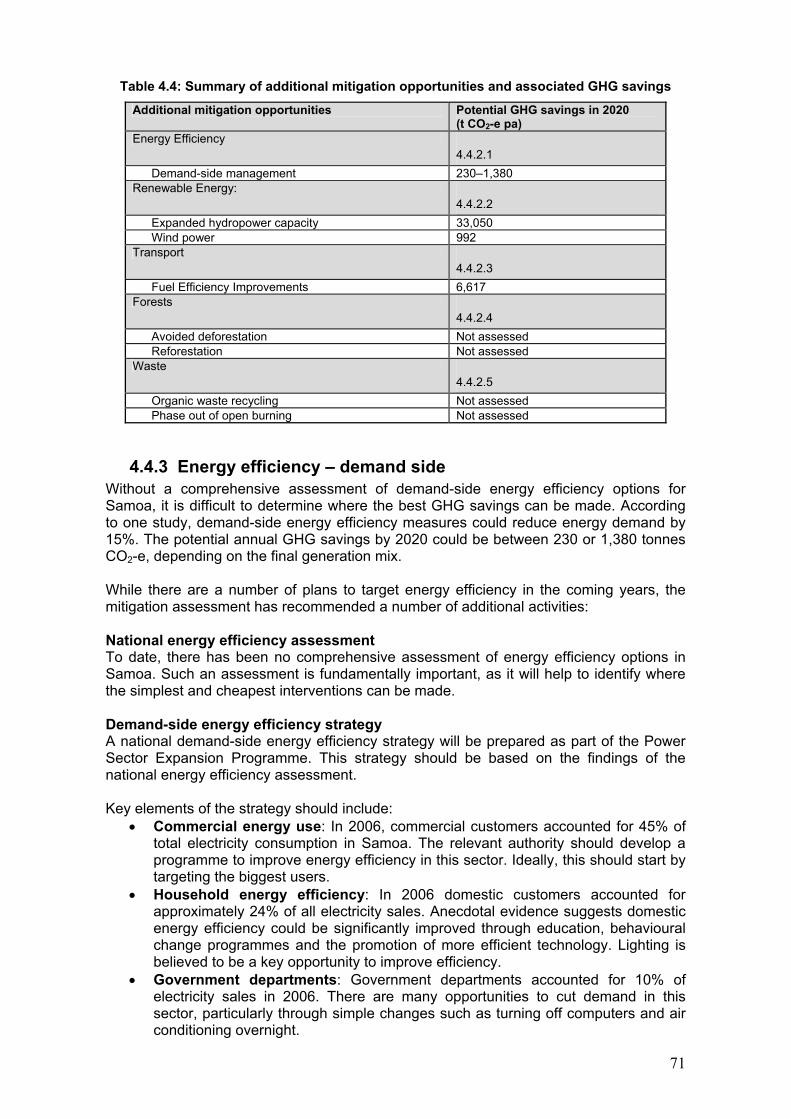
Table 4.4: Summary of additional mitigation opportunities and associated GHG savings
Additional mitigation opportunities Potential GHG savings in 2020 (t CO2-e pa)
Energy Efficiency 4.4.2.1
Demand-side management 230�1,380 Renewable Energy:
4.4.2.2 Expanded hydropower capacity 33,050 Wind power 992
Transport 4.4.2.3
Fuel Efficiency Improvements 6,617 Forests
4.4.2.4 Avoided deforestation Not assessed Reforestation Not assessed
Waste 4.4.2.5
Organic waste recycling Not assessed Phase out of open burning Not assessed
4.4.3 Energy efficiency � demand side Without a comprehensive assessment of demand-side energy efficiency options for Samoa, it is difficult to determine where the best GHG savings can be made. According to one study, demand-side energy efficiency measures could reduce energy demand by 15%. The potential annual GHG savings by 2020 could be between 230 or 1,380 tonnes CO2-e, depending on the final generation mix. While there are a number of plans to target energy efficiency in the coming years, the mitigation assessment has recommended a number of additional activities: National energy efficiency assessment To date, there has been no comprehensive assessment of energy efficiency options in Samoa. Such an assessment is fundamentally important, as it will help to identify where the simplest and cheapest interventions can be made. Demand-side energy efficiency strategy A national demand-side energy efficiency strategy will be prepared as part of the Power Sector Expansion Programme. This strategy should be based on the findings of the national energy efficiency assessment. Key elements of the strategy should include:
• Commercial energy use: In 2006, commercial customers accounted for 45% of total electricity consumption in Samoa. The relevant authority should develop a programme to improve energy efficiency in this sector. Ideally, this should start by targeting the biggest users.
• Household energy efficiency: In 2006 domestic customers accounted for approximately 24% of all electricity sales. Anecdotal evidence suggests domestic energy efficiency could be significantly improved through education, behavioural change programmes and the promotion of more efficient technology. Lighting is believed to be a key opportunity to improve efficiency.
• Government departments: Government departments accounted for 10% of electricity sales in 2006. There are many opportunities to cut demand in this sector, particularly through simple changes such as turning off computers and air conditioning overnight.
71
• Other electricity users: Hotels, industrial customers, churches and schools account for the remaining 21% of electricity users in Samoa. Energy efficiency programmes may be particularly effective by targeting these customers.
4.4.4 Improving supply-side efficiencies The relevant authorities must expand plans to reduce system losses, and short-term goals should be complemented by long-term improvement plans that aim to keep system losses continuously low. A system should also be implemented to monitor losses and implement response measures. Strategic planning and monetary investment will help minimise future losses.
4.4.5 Renewable energy The Government�s mitigation assessment reviewed all renewable energy technologies to assess their suitability to Samoa over the coming decade. Hydroelectric power is currently the dominant source of renewable energy in Samoa and has significant potential for expansion. Wind energy may also offer some diversification opportunities, along with small-scale solar operations. Beyond large expansions already planned, it is unlikely that biofuels will be a significant source of abatement before 2020. Specific details of the potential for renewable energy are outline below. Expanding the hydropower network Beyond the additional 2.0-megawatt system, which will be built as part of the Power Sector Expansion Project, preliminary studies estimate that there is potential for the installation of an additional 11.9 megawatts of hydropower. This would produce approximately 41.56 gigawatt hours of electricity annually. Assuming that all of these potential locations are indeed viable, and could be installed within the next decade, the potential GHG savings would be 33,050 tonnes CO2-e per annum by 2020. Wind Energy Whilst there is significant optimism about the future of wind energy generation in Samoa, much depends upon the outcome of the wind-monitoring programme currently being conducted by the EPC. Yet despite this uncertainty, at least one report has put a figure on the potential contribution of wind energy in Samoa. A previous study indicated that it would be realistic to expect five 250-kilowatt wind turbines to be installed in Samoa by 2012, contributing approximately 1.25 gigawatt hours per annum. This is equivalent to GHG savings of approximately 992 tonnes of CO2-e per annum. Solar power Beyond the planned rural electrification programme, solar is unlikely to make a significant contribution to GHG abatement in Samoa before 2020. Solar PV systems may, however, be viable for some tourist developments, where grid connexion costs are high or where the scale is large enough to justify the investment. Biofuels The current plans to produce cocoanut oil for electricity production will place substantial pressure of Samoa�s cocoanut industry. Further expansion of cocoanut oil production is unlikely before 2020. Moreover, if the proposed hydro scheme is developed in full, this will offset any need for additional cocoanut oil for electricity generation. Other renewable energy options Previous studies have noted the potential for a range of other renewable energy options for Samoa, including geothermal and ocean energy. The viability of these options, however, remains unknown and they are unlikely to contribute to GHG abatement in the short to medium term.
72
4.4.6 TRANSPORT If all of the actions that are currently planned can be implemented successfully, this will go some way towards reducing GHG emissions from Samoa�s transport sector. In the longer term, however, the aim should be to ensure that these short-term activities are adopted as ongoing strategies for controlling fuel use and minimising GHG emissions. Options for additional GHG abatement in the transport sector are discussed below. Fuel efficiency A key element that is missing from the current plans is an analysis of potential fuel and emissions savings that can be achieved in the transport sector. According to one study, energy efficiency measures could reduce fuel consumption in the road transport sector by approximately 10%. Savings of this magnitude are unlikely to be achieved in the short term, but are possible through incremental progress between now and 2020. If this target is achieved, the corresponding GHG savings in 2020 will be 6,617 tonnes of CO2-e per annum. Improving the efficiency of existing vehicle stock Many vehicles on Samoa�s roads are performing well below optimal levels of fuel efficiency. This is due to a range of factors including poor maintenance and servicing, the condition of the roads and limited driver awareness about fuel-efficient driving practices. The fuel-efficiency activities planned for the coming years should improve this situation. Stricter testing and enforcement as part of warrant-of-fitness inspections provides a further opportunity to enhance existing vehicles� fuel efficiency. Efficiency of vehicle imports Samoa has limited influence on the design of new vehicles, which is largely controlled by manufacturers in Asia, the U.S., Europe and Australia. The Government can, however, aim to influence the purchasing decisions of local consumers by implementing measures that favour fuel-efficient vehicles. Import duties, registration fees and other Government taxes can be structured to provide incentives for people and organisations to purchase cars with high fuel-efficiency ratings. Public Transport, carpooling and non-motorised transport Public transport, carpooling and walking and bicycling are already widely-used modes of transport in Samoa. The vast majority of households do not own a car, and rely exclusively on local bus networks and taxis, as well as walking and sharing rides with neighbours, friends and relatives. It is unlikely that further promotion of these transport options will lead to higher usage. Instead, the challenge for the Government will be to maintain the high usage of these low-emission transport options. Under the business-as-usual scenario, emissions from road transport are projected to increase by 44% between 2007 and 2020. The extent to which public transport usage, carpooling and non-motorised modes of transport will help slow this growth is unknown. The best-case scenario is that the current high rates of public transport patronage can be maintained, which will help to minimise growth in emissions. Low-emissions vehicles At this stage, it is unclear when low-emission vehicles (such as hybrids) will start to be seen in Samoa, and what proportion of the new car market they will occupy. In the short to medium term, it is unlikely that low-emissions vehicles will make a significant contribution to Samoa�s GHG abatement. Depending on international trends, it is however conceivable that low-emission vehicles may be available in Samoa in the later stages of the assessment period (2018-2020). The most effective means of promoting low-emission vehicles is to provide consumer incentives, for example reduced import duties or registration fees. Whilst in the short term
73
such incentives may not be sufficient to make low-emission vehicles competitive, they may become more persuasive as the base price of low-emission vehicles decreases. Biofuels In theory, switching to biofuels offers significant abatement potential for transport emissions. At this point, however, the viability of biofuels for Samoa�s transport needs remains unclear. Whether or not production of biofuels, such ethanol and cocoanut oil, can be increased depends on a number of factors, including supply of local crops, the cost of production and demand for the end product. A key issue will also be food security, as current plans to produce large volumes of cocoanut oil for electricity generation exist alongside strong local reliance on cocoanut by-products for sustenance.
4.4.7 INDUSTRIAL PROCESSES AND PRODUCT USE Emissions from industrial processes and product use are relatively small in Samoa, and are derived mainly from the use of HFC gases in refrigerators and air conditioners. There are three main abatement options: reducing demand for equipment that uses HFC gases, improving maintenance and disposal and substitution with alternative gases, all of which are viable options for Samoa. The potential contribution of these abatement options has not been quantified.
4.4.8 AGRICULTURE Surveys carried out by the MAF show that between 1999 and 2005, the number of cattle farmed in Samoa grew by 74%, from 28,000 to more than 48,500. This large increase in stock numbers has put upward pressure on methane emissions from livestock farming, as well and nitrous oxide emissions from agricultural soils. International efforts to reduce livestock emissions are still in their infancy. Other than restricting livestock numbers, various other potential options have been identified, including selective breeding, vaccinations and alterations to livestock diet. Whether or not these options are viable for Samoa will depend largely on the findings of research currently being undertaken in other countries. There may, however, exist significant barriers to some research findings being implemented, particularly in light of Samoa�s technological and economic limitations.
4.4.9 FORESTS Because current data is often out-of-date or inaccurate, it is difficult to gauge the contribution forests make to Samoa�s emissions profile. From the available data, Samoa�s forests appear to be a net carbon sink, but this cannot be confirmed until recent land clearing can be accounted for in the GHG inventory. It is critical that a system for regularly monitoring forest coverage be implemented before the true abatement potential of Samoa�s forests can be confirmed. Ideally, forest cover should be assessed on an annual basis through satellite imagery and on-the-ground assessments. As well as confirming past emissions, this monitoring system would also help to establish a baseline from which future abatement could be measured. Samoa does not, unfortunately, have the financial or technical capacity to implement such a system and would rely on development partners to provide support. This would include purchasing satellite imagery and training and equipping local staff. Reforestation Samoa has extensive areas of previously cleared land, which could be reforested to sequester carbon from the atmosphere. Samoa�s land tenure system presents some difficulties in terms of guaranteeing the long-term success of such a programme. The
74
challenge is to provide sufficient incentive for communal landholders to agree to participate in reforestation programmes and to protect these forests in perpetuity. The Government of Samoa lacks funds to implement a large-scale reforestation programme and to provide an ongoing financial incentive for landholders to protect these forests. This problem could, however, be overcome if a revenue stream could be established through the sale of carbon credits to international buyers. This option is considered an important opportunity for Samoa to contribute to global mitigation efforts, whilst at the same time providing an income for local communities and protecting Samoa�s biodiversity. It is important to note that a large share of previously cleared land is currently under-utilised, which suggests that there is ample land to sustain a large reforestation programme without compromising food security. Avoiding further deforestation Despite large tracts of land being cleared in the past, Samoa still has extensive forested areas that store large amounts of carbon. Maintaining these carbon stores could perhaps be Samoa�s most important contribution to global mitigation efforts. Based on the limited available data, there has been no net change in Samoa�s forests in recent years. Yet anecdotal evidence suggests that some forested areas continue to be cleared for livestock farming. If the anecdotal evidence is correct, and improved satellite imagery shows a net downward trend in Samoa�s forest cover, there may be opportunities for Samoa to participate in international initiatives aimed at reducing emissions from deforestation and degradation (REDD). At this time, however, the exact rules for REDD are yet to be developed.
4.4.10 WASTE Emissions from waste management and disposal account for approximately 9% of Samoa�s total emissions, with the bulk of this being methane from wastewater. Most wastewater is treated on site in septic tanks, which means there is little scope for GHG abatement. However, there are several options for reducing emissions from the disposal of solid waste. Minimising organic waste going to landfill Samoa could reduce the amount of organic material that is sent to landfill through a national home-composting programme or a roadside collection service. Experience with home-composting programmes in the past has shown very little success, but this could be improved with greater resources and sustained education campaigns. It would be extremely expensive to implement a roadside collection service for organic waste. Stopping open burning of waste The second GHG inventory estimates that annual emissions from open-waste incineration declined by approximately 35% in the period 2000-2007. This reflects significant improvements in solid waste management in Samoa over the last decade, particularly through the introduction of the nation-wide roadside collection service and the establishment of properly designed landfill sites. Whether or not this trend will continue in the coming years is uncertain. Anecdotal evidence suggests that a significant number of households continue to burn plastics and other waste containing fossil carbon, which contributes to GHG emissions. This occurs even as most households have access to the roadside collection service.
75
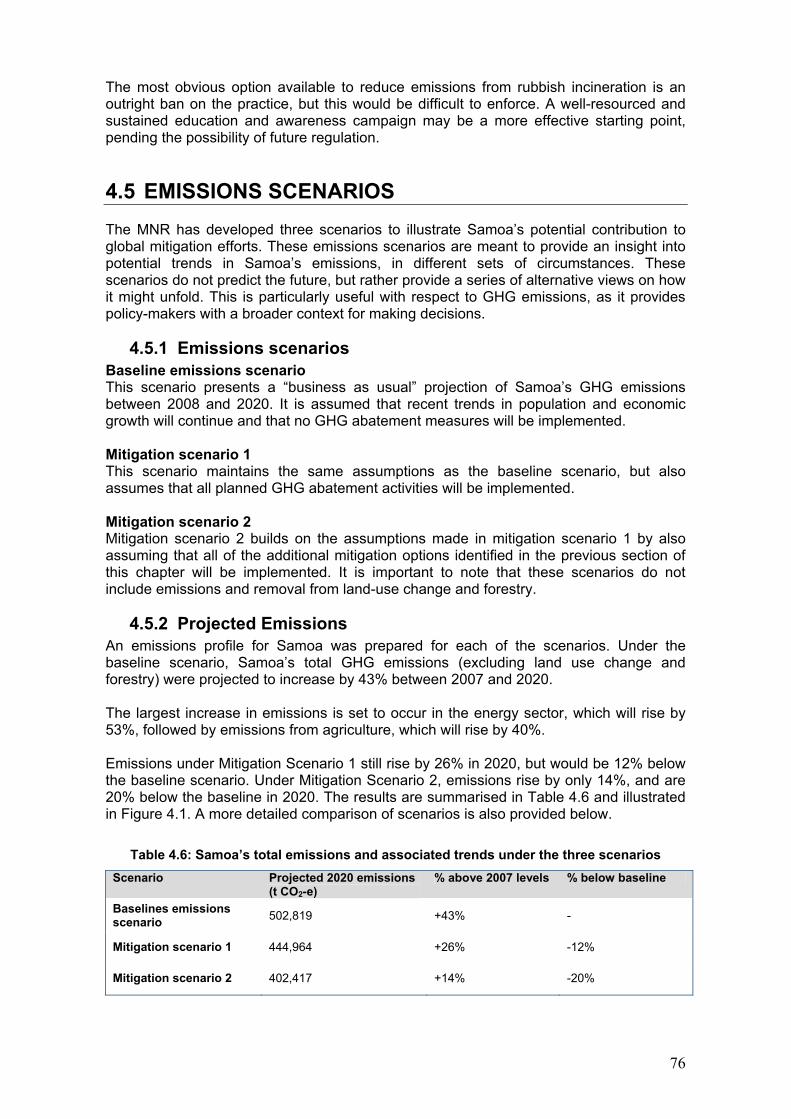
The most obvious option available to reduce emissions from rubbish incineration is an outright ban on the practice, but this would be difficult to enforce. A well-resourced and sustained education and awareness campaign may be a more effective starting point, pending the possibility of future regulation.
4.5 EMISSIONS SCENARIOS The MNR has developed three scenarios to illustrate Samoa�s potential contribution to global mitigation efforts. These emissions scenarios are meant to provide an insight into potential trends in Samoa�s emissions, in different sets of circumstances. These scenarios do not predict the future, but rather provide a series of alternative views on how it might unfold. This is particularly useful with respect to GHG emissions, as it provides policy-makers with a broader context for making decisions.
4.5.1 Emissions scenarios Baseline emissions scenario This scenario presents a �business as usual� projection of Samoa�s GHG emissions between 2008 and 2020. It is assumed that recent trends in population and economic growth will continue and that no GHG abatement measures will be implemented. Mitigation scenario 1 This scenario maintains the same assumptions as the baseline scenario, but also assumes that all planned GHG abatement activities will be implemented. Mitigation scenario 2 Mitigation scenario 2 builds on the assumptions made in mitigation scenario 1 by also assuming that all of the additional mitigation options identified in the previous section of this chapter will be implemented. It is important to note that these scenarios do not include emissions and removal from land-use change and forestry.
4.5.2 Projected Emissions An emissions profile for Samoa was prepared for each of the scenarios. Under the baseline scenario, Samoa�s total GHG emissions (excluding land use change and forestry) were projected to increase by 43% between 2007 and 2020. The largest increase in emissions is set to occur in the energy sector, which will rise by 53%, followed by emissions from agriculture, which will rise by 40%. Emissions under Mitigation Scenario 1 still rise by 26% in 2020, but would be 12% below the baseline scenario. Under Mitigation Scenario 2, emissions rise by only 14%, and are 20% below the baseline in 2020. The results are summarised in Table 4.6 and illustrated in Figure 4.1. A more detailed comparison of scenarios is also provided below.
Table 4.6: Samoa�s total emissions and associated trends under the three scenarios Scenario Projected 2020 emissions
(t CO2-e) % above 2007 levels % below baseline
Baselines emissions scenario 502,819 +43% -
Mitigation scenario 1 444,964 +26% -12%
Mitigation scenario 2 402,417 +14% -20%
76
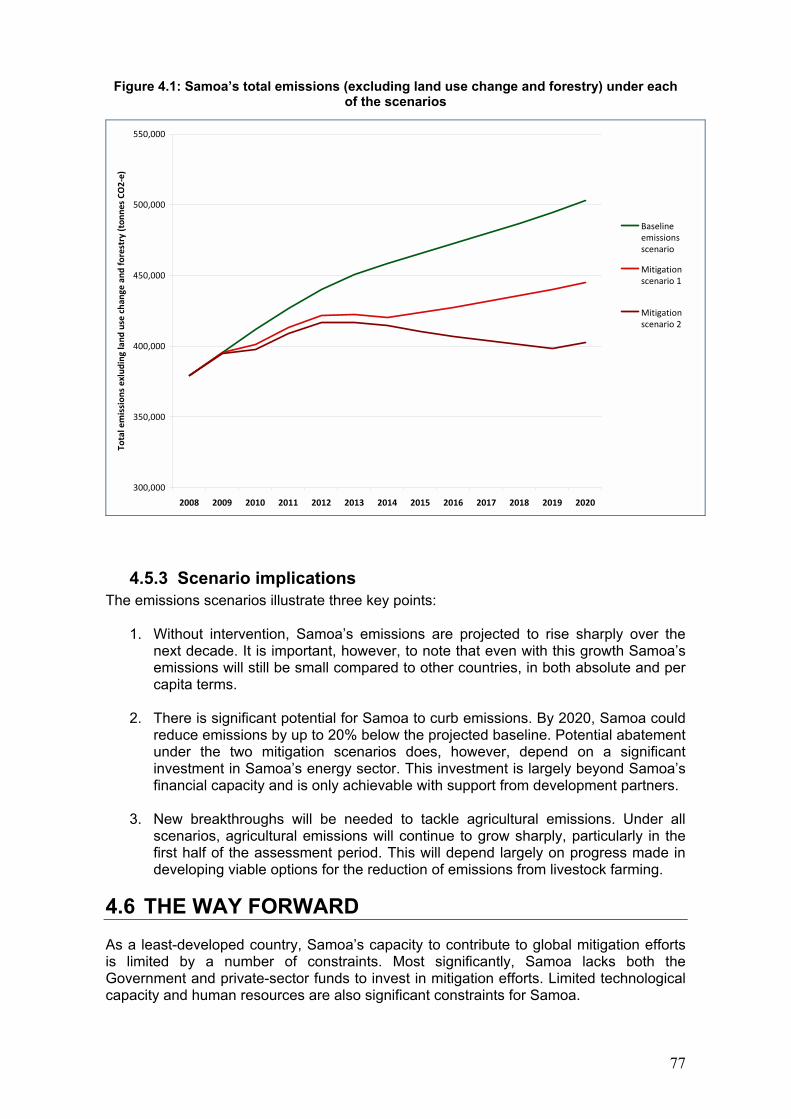
Figure 4.1: Samoa�s total emissions (excluding land use change and forestry) under each of the scenarios
300,000
350,000
400,000
450,000
500,000
550,000
2008 2009 2010 2011 2012 2013 2014 2015 2016 2017 2018 2019 2020
Total emission
s exluding
land
use cha
nge an
d forestry (ton
nes CO
2‐e)
Baselineemissionsscenario
Mitigationscenario 1
Mitigationscenario 2
4.5.3 Scenario implications The emissions scenarios illustrate three key points:
1. Without intervention, Samoa�s emissions are projected to rise sharply over the next decade. It is important, however, to note that even with this growth Samoa�s emissions will still be small compared to other countries, in both absolute and per capita terms.
2. There is significant potential for Samoa to curb emissions. By 2020, Samoa could
reduce emissions by up to 20% below the projected baseline. Potential abatement under the two mitigation scenarios does, however, depend on a significant investment in Samoa�s energy sector. This investment is largely beyond Samoa�s financial capacity and is only achievable with support from development partners.
3. New breakthroughs will be needed to tackle agricultural emissions. Under all
scenarios, agricultural emissions will continue to grow sharply, particularly in the first half of the assessment period. This will depend largely on progress made in developing viable options for the reduction of emissions from livestock farming.
4.6 THE WAY FORWARD As a least-developed country, Samoa�s capacity to contribute to global mitigation efforts is limited by a number of constraints. Most significantly, Samoa lacks both the Government and private-sector funds to invest in mitigation efforts. Limited technological capacity and human resources are also significant constraints for Samoa.
77
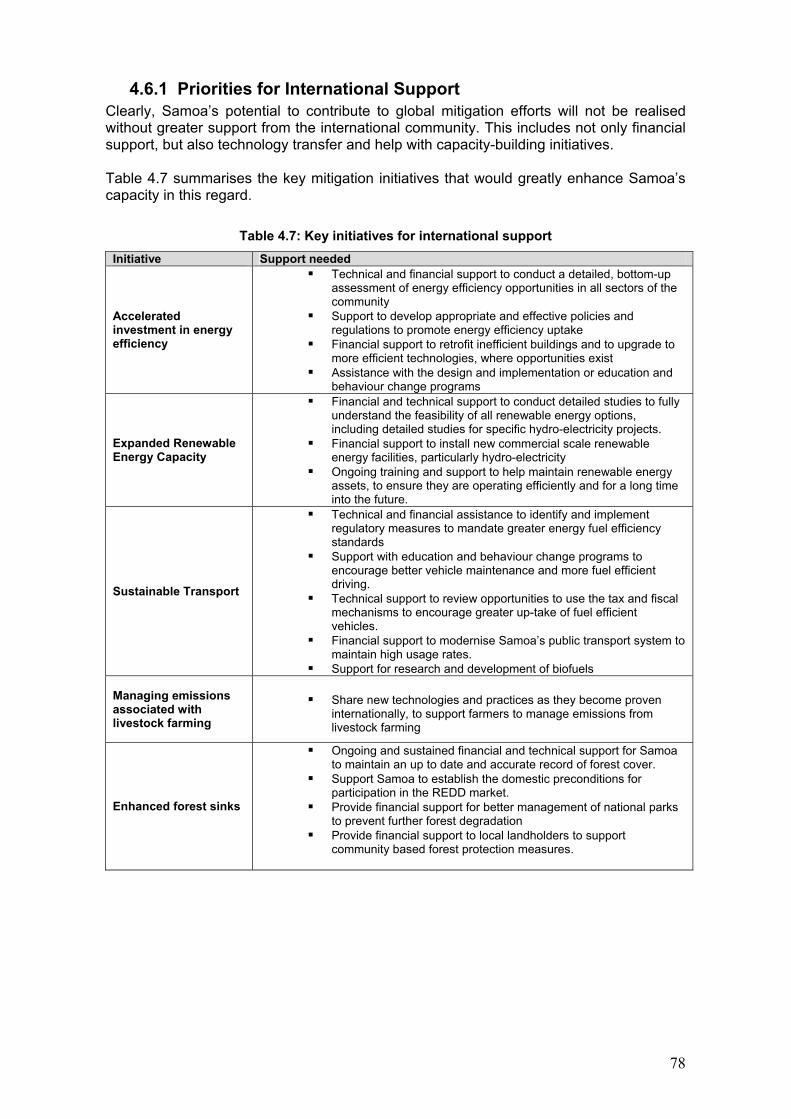
4.6.1 Priorities for International Support Clearly, Samoa�s potential to contribute to global mitigation efforts will not be realised without greater support from the international community. This includes not only financial support, but also technology transfer and help with capacity-building initiatives. Table 4.7 summarises the key mitigation initiatives that would greatly enhance Samoa�s capacity in this regard.
Table 4.7: Key initiatives for international support Initiative Support needed
Accelerated investment in energy efficiency
! Technical and financial support to conduct a detailed, bottom-up assessment of energy efficiency opportunities in all sectors of the community
! Support to develop appropriate and effective policies and regulations to promote energy efficiency uptake
! Financial support to retrofit inefficient buildings and to upgrade to more efficient technologies, where opportunities exist
! Assistance with the design and implementation or education and behaviour change programs
Expanded Renewable Energy Capacity
! Financial and technical support to conduct detailed studies to fully understand the feasibility of all renewable energy options, including detailed studies for specific hydro-electricity projects.
! Financial support to install new commercial scale renewable energy facilities, particularly hydro-electricity
! Ongoing training and support to help maintain renewable energy assets, to ensure they are operating efficiently and for a long time into the future.
Sustainable Transport
! Technical and financial assistance to identify and implement regulatory measures to mandate greater energy fuel efficiency standards
! Support with education and behaviour change programs to encourage better vehicle maintenance and more fuel efficient driving.
! Technical support to review opportunities to use the tax and fiscal mechanisms to encourage greater up-take of fuel efficient vehicles.
! Financial support to modernise Samoa�s public transport system to maintain high usage rates.
! Support for research and development of biofuels
Managing emissions associated with livestock farming
! Share new technologies and practices as they become proven internationally, to support farmers to manage emissions from livestock farming
Enhanced forest sinks
! Ongoing and sustained financial and technical support for Samoa to maintain an up to date and accurate record of forest cover.
! Support Samoa to establish the domestic preconditions for participation in the REDD market.
! Provide financial support for better management of national parks to prevent further forest degradation
! Provide financial support to local landholders to support community based forest protection measures.
78

5. OTHER INFORMATION
79
5.1 TECHNOLOGY TRANSFER
5.1.1 Background Decision 4CP/7 defines the technology needs assessment process as a set of country-driven activities that identify mitigation and adaptation technology priorities for developing countries. Technology transfer concerns the flow of information and technology between and within countries. Technology transfer is a priority action under the UNFCCC. Decision 4/CP7 of the UNFCCC notes that technology transfer has five key elements:
1. assessing technology 2. improving access to technology information 3. strengthening local capacity 4. creating enabling environments 5. instituting technology-transfer mechanisms.
The MNRE has conducted an assessment of technology needs for Samoa as part of this Second National Communication. This is the first time Samoa has undertaken such an assessment. Purpose of the technology needs assessment The purpose of a technology needs assessment (TNA) is to help identify and analyse priority technology needs, practices, and policy reforms. This is in turn underpins a portfolio of environmentally sound technologies programmes, which can facilitate knowledge and technology transfer in line with Article 4, paragraph 5, of the UNFCC. A TNA involves consulting different stakeholders about potential barriers to technology transfer, and trying to address these barriers through sectoral analyses. It addresses soft and hard technologies such as mitigation and adaptation technologies and identifies regulatory options; it also helps develop fiscal incentives and capacity building. TNA approach To conduct the TNA, the MNRE reviewed numerous relevant policies and plans, including Samoa�s initial National Communications, the NAPA and the UNCCD Country Report. The MNRE also considered other vulnerability and adaptation assessments, mitigation studies, energy planning studies and national or sectoral development plans. Most of the documentation that the MNRE reviewed was developed in the last fifteen years, either in keeping with Samoa�s convention obligations or as part of various projects funded by the GEF. The MNRE paid particular attention to GHG emission volumes, rates of emissions for Samoa over time, sectoral vulnerabilities to climate change and the types of technology used by principal GHG emitters. The UNFCCC TNA Process Guidance The TNA for Samoa followed the �Handbook for Conducting Technology Needs Assessments for Climate Change�, which was developed by UNDP in collaboration with the Climate Technology Initiative (CTI), the Expert Group on Technology Transfer (EGTT) and the UNFCCC secretariat. Six activities or steps are proposed in the UNDP TNA process and are presented in Figure 5.1. Because of time constraints, the main steps in the TNA process were followed but with limited group consultation. All of the key documents used as the basis of the TNA come from fully consultative assessments to establish baselines. Discussions with
80
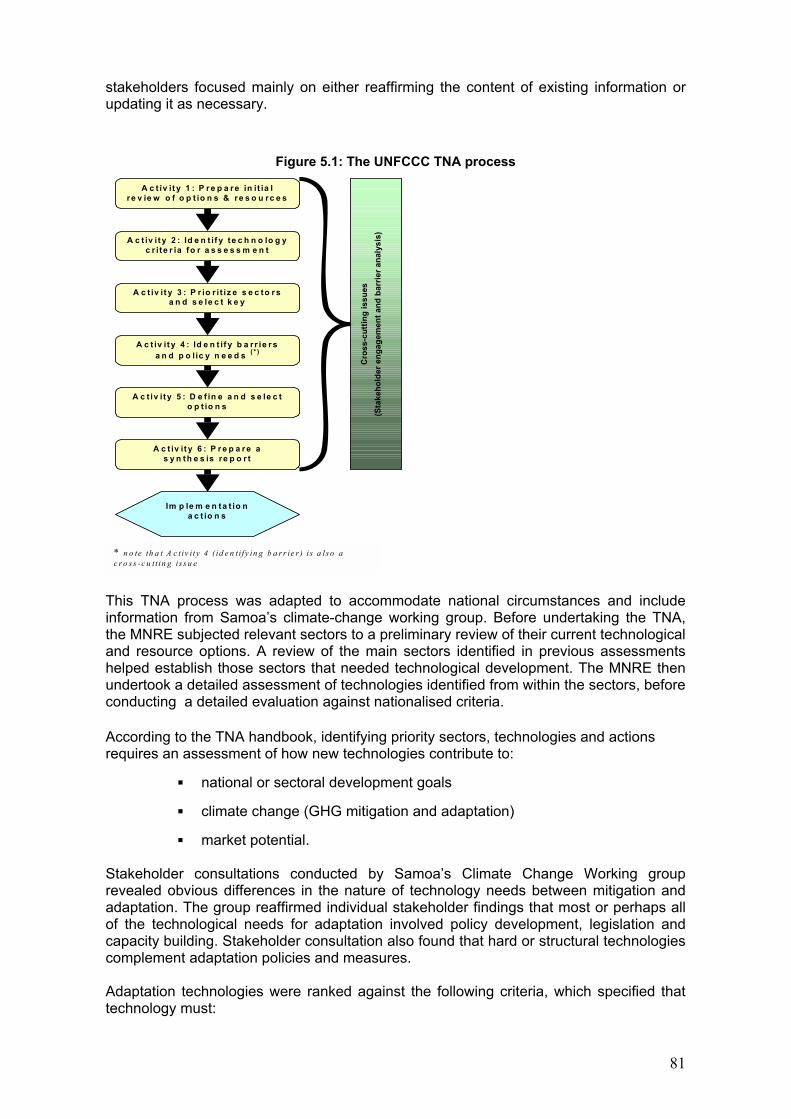
stakeholders focused mainly on either reaffirming the content of existing information or updating it as necessary.
Figure 5.1: The UNFCCC TNA process A c t iv it y 1 : P r e p a re in it ia l
re v ie w o f o p t io n s & re s o u rc e s
A c t iv i t y 2 : Id e n t if y te c h n o lo g y c r ite r ia fo r a s s e s s m e n t
A c t iv it y 3 : P r io r i t iz e s e c to r s a n d s e le c t k e y
t h l ( i )
A c t iv it y 4 : Id e n t if y b a r r ie r s a n d p o lic y n e e d s ( * )
A c t iv it y 5 : D e f in e a n d s e le c t o p t io n s
A c t iv it y 6 : P r e p a r e a s y n th e s is re p o r t
Im p le m e n ta t io n a c t io n s
Cro
ss-c
uttin
g is
sues
(S
take
hold
er e
ngag
emen
t and
bar
rier a
naly
sis)
* n o te th a t A c t iv i ty 4 ( id e n t i fy in g b a r r ie r ) i s a l s o a c r o s s - c u t t in g i s s u e
This TNA process was adapted to accommodate national circumstances and include information from Samoa�s climate-change working group. Before undertaking the TNA, the MNRE subjected relevant sectors to a preliminary review of their current technological and resource options. A review of the main sectors identified in previous assessments helped establish those sectors that needed technological development. The MNRE then undertook a detailed assessment of technologies identified from within the sectors, before conducting a detailed evaluation against nationalised criteria. According to the TNA handbook, identifying priority sectors, technologies and actions requires an assessment of how new technologies contribute to:
! national or sectoral development goals
! climate change (GHG mitigation and adaptation)
! market potential. Stakeholder consultations conducted by Samoa�s Climate Change Working group revealed obvious differences in the nature of technology needs between mitigation and adaptation. The group reaffirmed individual stakeholder findings that most or perhaps all of the technological needs for adaptation involved policy development, legislation and capacity building. Stakeholder consultation also found that hard or structural technologies complement adaptation policies and measures. Adaptation technologies were ranked against the following criteria, which specified that technology must:
81
1. be proven, and fit for commercial applications 2. strengthen, not diminish community resilience 3. rely on local resources and promote local industry and employment 4. be culturally appropriate and promote gender equality 5. comply with locally adopted infrastructure standards 6. be cost-effective and self-financed over its life cycle
Meanwhile, the technological needs that were identified as part of mitigation efforts included developing local fuels and importing more energy-efficient technology, or indeed technology that could run on renewable energy. Based on these findings, various technologies for mitigation were evaluated against four criteria, which specified that technology must:
1. be proven, and fit for commercial applications 2. reduce, not increase emissions 3. rely on local resources and promote local industry and employment 4. be culturally appropriate and promote gender equality.
Stakeholders considered these four criteria and resolved that all are applicable to technology that is locally developed, particularly the fourth criterion that relates to cultural appropriateness. Foreign technology will therefore need to incorporate local capacity if it is to meet this criterion. Key consideration was also given to strengthening the national economy by operating high GHG sectors more efficiently. It is anticipated that future developments in mitigating technologies will be mainly in the energy sector, particularly land transportation and electricity generation, where dual global and national benefits could be achieved. Trade-offs in the agriculture, land-use and forestry sectors may also provide national benefits in key sectors like tourism and manufacturing.
5.1.2 Technologies for mitigation Using the four key criteria alongside the expert knowledge of relevant stakeholders, the MNRE was able to compile a list of mitigating technologies. Energy efficiency Energy efficiency is a central consideration in the electricity sector, with whose help the MNRE has identified the following priority needs: energy auditing and assessment procedures, policies and regulations to promote energy-efficiency uptake and the deployment of energy-efficient technologies. In the land transportation sector, energy efficiency is also a top priority in the motorised subsector, as the use of non-motorised transport would help further reduce GHG emissions. There is a strong need for public awareness programmes on energy efficiency, conservation and appliance energy consumption ratings. Promoting energy audits and showing ways to minimise electricity usage will promote further energy savings, and generate greater consumer awareness about cost-saving measures in terms of household and business usage. Developing renewable energy According to the National Energy Policy, renewable energy sources should be heavily promoted as alternatives to imported fossil fuels; in Samoa, this will mean investment in new hydro capacity. The EPC has also prioritised solar power, particularly for its rural electrification programme.
82
The EPC is also developing the use of cocoanut oil for electricity generation, although meagre profits for growers mean that this project faces certain problems with respect to cocoanut supply. Wind power has also been identified as a potentially significant contributor to Samoa�s future energy supplies, pending the results of current assessments. Further financial and technical support will be needed for Samoa to develop and deploy these technologies. Forest conservation programmes The critical issue facing Samoan forestry is the inevitable depletion of native forests and the absence of plantation forests to sustain the local industry. Without such resources, indigenous forests will continue to be felled to meet growing local demand. Recent reviews of the National Forestry Policy, and the drafting of the new Forestry Bill are both responses to criticisms of the 1967 Forest Act and 1969 Forest Regulations. Both these acts contained conflicting requirements with respect to the allocation of forests on customary land and resource pricing. With these new measures, the MNRE seeks to manage forests in a more holistic manner. These measures promote the private sector as the driver of forest-resource development, and position the Forestry Division as regulatory and research body, providing technical expertise to tree-planters in the private sector. The Forestry Division was transferred from the MAF to the MNRE in 2005. The MNRE�s most recent corporate plan (2008) sets out the strategies and policies for forest conservation and management. Biogas from piggeries, livestock and poultry Stronger relations between China and Samoa have reinvigorated grassroots-level research into agricultural production. Experiences of livestock farmers in China have been shared with local agricultural officers, leading to the development of a biogas project that uses piggery and livestock waste. This is a proven technology that provides electricity for rural farmers in China but the transfer of this kind of technology would require extensive financial investment. Raising pigs and chickens remains an integral part of village farming in Samoa, and communities could play an integral role in developing community-based biogas projects. In its 2008�2012 corporate plan, the MAF created a strategy to promote appropriate technologies like the biogas project. The MAF�s extension services, which are nationwide, will encourage partnerships with NGOs, where pilots of this technology could be trialled. Biofuel cultivation The trialling of cocoanut fuel as a substitute for diesel is ongoing. A local company, Paradise Oil, currently runs its diesel vehicles on processed cocoanut oil, after initial trials of the same fuel by the EPC. This technology needs further development to perfect its application for energy generation. Other biofuels currently being tested by Samoa�s Research and Development Institute include bio ethanol. Other plants with bio fuel potential also need to be explored and trialled. Forest fire prevention programmes The National Disaster Management Strategy provides a framework for emergency responses to extreme events. Forest fires are common in the western side of Savai�i, particularly during the dry season and after prolonged periods of drought. The National Disaster Management Office already has a fire disaster response plan in place, but will need better awareness of preventive measures to ensure that forest fires aren�t started by agricultural clearing or carelessness. Prevention measures include the acquisition of data to measure historic fire patterns, community awareness programmes and building a network of warning signs to indicate fire-prone areas.
83
Sustainable forest management Samoa should focus on plantation forestry development. The national planting target is currently 100 ha per annum but should be increased to 400 ha for the next ten years. Cornwall Estate on the western side of Savai�i should be fully replanted to expand Samoa�s forest coverage and serve as the core of the forest estate for a future, integrated forestry industry. A key priority for Samoa is technical support to allow more accurate and regular monitoring of forest cover and associated carbon storages. Creating conservation areas A number of conservation programmes are currently being implemented by the MNRE. Of most importance is Samoa�s protected area system, which includes areas of high conservation value previously identified in Samoa�s National Biodiversity Strategy and Action Plan (NBSAP). Two national parks were established in 2006: Lake Lanuto�o on Upolu and Mauga o Salafa�i on Savai�i. Smaller reserves have also been established throughout the islands. The conservation of these areas, alongside those areas of little economic interest to communities, needs to be reinforced through nationwide awareness-raising programmes. Steam sterilisers for quarantine The MAF is already using its steam steriliser to quarantine crops, vegetables and fruits for export. The system replaces older sterilisers, many of which contained ozone-depleting substances (ODS) and chlorofluorocarbon (CFC). The operation of this technology, however, requires highly specialised technical knowledge, besides which the machinery consists of parts that are expensive to replace and which require constant maintenance. While the focus of this change in technology is to reduce the use of ODS, it also eliminates the use of CFC and hydrofluorocarbon- (HFC) based quarantine gases that are also GHG. Containment landfills to collect methane as biogas The MNRE operates a semi-aerobic landfill through a contractor. The landfill�s design follows the Fukuoka method, and while the problems of vermin and odour are greatly reduced by the constant covering of solid waste, leachate continues to seep through the soil and methane is allowed to escape unabated into the atmosphere. Methane needs to be contained so that it can be flamed to reduce its global-warming potential. This could be done by creating a system where the sub-surface liner and waste cover is contained and collected through pipe works to one exit point. Discourage waste incineration The national waste management policy and the 2008 draft Waste Management Bill both discourage the burning of solid waste. The burning of solid waste has been reduced substantially as reflected in the drop of emissions from burning between 1994 and 2005. This is the result both of improved solid-waste collection services and extensive national awareness programmes on the dangers of burning and Persistent Organic Pollutants (POPs). These awareness-raising programmes need to be continued, as they have been proven to help reduce GHG emissions. Biogas generation from waste decomposition The MNRE conducted a pilot for the generation of biogas with the help of New Zealand Aid in 2004. The project was designed to generate biogas from enhanced anaerobic decomposition of solid waste. The technology design depended on good quality of the feedstock to include animal derived waste. For instance food waste and abattoir discharge were targeted as the main catalysts for decomposition to generate good quality methane. However food waste is normally fed to domesticated animals and the abattoir never materialised.
84
This technology has potential for connexion with a containment-type landfill. Once the abattoir is established, which is now certain in the next three years, this technology could be revamped. The technology set-up was decommissioned in 2005 and stored with a local contractor. National waste bill (NWB) The MNRE has recently released for public comment a draft NWB (2008). The Bill provides for better waste management in Samoa and takes the current provisions of the LSE Act 1989 on waste management further, by imposing revised fines on wasteful companies and individuals. This piece of legislation needs further development, and its enforcement will require resources for both the MNRE and also the private sector, which will need to invest in environmentally friendly waste disposal technology and management practices.
5.1.3 ADAPTATION TECHNOLOGIES Water purification programmes for communities The Samoan Water Authority (SWA) has recently begun to chlorinate and disinfect water. The SWA laboratory is able to manage tests for water quality, but will need to be upgraded to test for a wider range of contaminants. The quality of water resources in coast areas is threatened by sea-level rise and salt-water intrusion into ground water reserves. All of the freshwater intakes are located in the highlands, an area already prone to higher rainfall and where large-scale clearing has caused problems with water erosion and salinisation. Watershed management In line with a number of watershed management programmes, the Water Resources Management Unit of the MNRE is actively monitoring resources within the watersheds and identifying new sources for future protection. These activities need monetary and human resources and frequently encounter problems with customary land disputes. The technology implications of these initiatives are mainly in the form of policies, measures and regulations. The 1992 Watershed and Management Regulations have been revised as well as the 1991 Forests Regulations, with a view to improving the adaptive capacity of watersheds and the communities that dwell near them. Alternative water storage programmes A number of agencies, including the Cyclone Emergency Recovery Programme (CERP), AusAid and GEF-Small Grants (SGP) are currently providing financial support for community initiatives to rehabilitate freshwater springs and establish water-storage tanks. Water tanks are Samoa�s principal means of water-storage. Historically, these have come in the form of 10,000�20,000-litre concrete tanks. Recently, however, there has been a move towards smaller 3,000�5,000-litre plastic tanks, which are easier to transport, install and maintain. With the European Union�s help, the Samoan Government has started a national project to improve school water storage by providing schools with plastic tanks. Integrated crop selection and taro development programmes The MAF research station at Nu�u continues to research pest- and disease-resistant crops, with an increasing emphasis on developing crops that can withstand hot and dry weather. Pest- and disease-resistant taro varieties are also being developed alongside those varieties capable of withstanding hot and arid conditions, and some pilot specimens have been trialled amongst growers and the general public. The MAF has also worked to promote short-term crops by employing traditional knowledge of weather and climate variability to plan cultivation. With a shortened planting season, the technology response is more efficient, and the MAF has overseen the
85
introduction of more efficient machinery, i.e. tractors, to help accelerate the tilling of the land. Disaster response plan An emergency and disaster response management plan has been developed for the agriculture sector as part of the National Disaster Management Strategy and Plan and is reviewed annually. Testing of imported livestock Current conditions frequently dictate that imported animals need to be tested fully before they can enter the country, a situation which places disproportionate trust in external systems. Priority technologies for health Top priorities for this sector include spraying mosquito breeding grounds, national filariasis treatment and education and improving the state of sanitation systems to prevent water-borne diseases. All have been assessed as medium to high priority in terms of technology improvement. Education also plays a key role in preventing the spread of disease. Emergency and injury-prevention methods are also regarded as highly important. Coastal zone management Since 2000, the Samoan Government has received financial help from the World Bank and the Australian Government for an IAMP. The project is in its second phase, which has enabled the Government to develop a Coastal Infrastructure Management Plan (CIMPS) for all villages to set out plans to respond to extreme events, particularly tropical cyclones and flooding. Technologies for Government to implement include structural rehabilitation of roads, bridges and coastal protection, while the community develops management plans and rules for resources management. Relocation of roads Stakeholder consultation has recommended that utilities and most of the transport structures located along vulnerable stretches of the coast be shifted inland. Regulators are also encouraged to ensure that new buildings be built outside hazardous areas. Building seawalls For the protection of infrastructure that cannot be moved, the building of seawalls is encouraged as a viable short-term protective measure. All the CIMPs have provisions for evaluating the appropriateness of coastal revetments and these recommendations should be followed closely.
5.1.4 Barriers to technology transfer Samoa's capacity to develop, implement and evaluate policies and practices is crucial to the success of technology transfer. Without appropriate local expertise, imported technologies face an uncertain future. Samoa must ensure that it is able to maintain and develop the technological and intellectual property it has received from overseas partners. Insufficient local resources, be they monetary or intellectual, is a key barrier to successful technology transfer. Mitigation Barriers to the transfer of mitigating technologies are:
• Lack of coordination between policy-makers and policy-implementers with respect to renewable energy projects.
• Single-desk electricity provider, the EPC, whose role in electricity generation and maintenance has effectively discouraged private-sector technological investment and development.
86
• Absence of incentives for the development of clean energy technologies and measures.
• Lack of awareness about energy efficiency and alternative energy sources. • High monetary cost of technology transfer, i.e. equipment, transportation,
training etc. • High cost of fossil fuels. • Potential costs to the environment if hydro-scheme designs prove to be poorly
conceived. • A labour force that requires significant up-skilling to match the demands of
operating and maintaining new technologies. • Energy efficiency is not taken seriously as a consideration for new building
projects. • Variable weather conditions present uncertainties for some sources of
renewable energy, e.g. solar and hydro. • Insufficient firewood for gasification technology. • Public apprehension about the use of biogas for domestic applications • Inconsistencies between Government and customary priorities, leading to
stalled developments. • Disputes between technology owners and growers over uncompetitive prices
offered for cocoanuts intended for biofuel. • Insufficient data on energy sources, technology tests and quality control
mechanisms for technology. • Insufficient data on fisheries schooling; poor data and information-
management systems.
Adaptation The key to implementing adaptation technologies successfully is creating community ownership of the technology. This can be achieved through education and involving stakeholders in the formulation of policies relevant to adaptation technology. Education and raising public awareness remain challenges for successful adaptation technology transfer. Both require expertise and financial resources that currently neither Government nor responsible agencies possess.
5.1.5 Conclusion The process of technology transfer has allowed Samoa to assess its needs in terms of environmentally sound technologies for both mitigation and adaptation efforts. The collation of Samoa�s technological needs has again highlighted the nation�s vulnerability to the effects of climate change. Barriers to technology transfer can seem, at times, as numerous as the benefits. Barriers include a lack of private investment in technical development, systemic or monetary limitations in Government and a lack of coordination between Government the private sector with respect to developing alternative energy technologies.
87
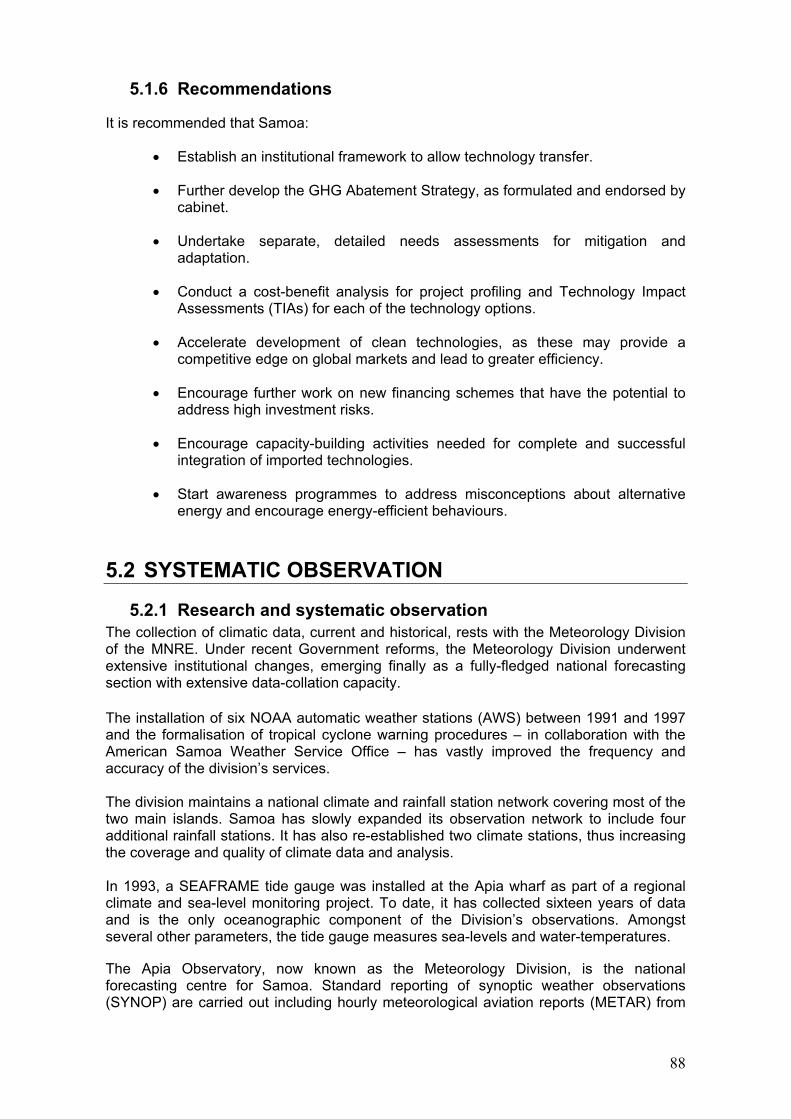
5.1.6 Recommendations
It is recommended that Samoa:
• Establish an institutional framework to allow technology transfer.
• Further develop the GHG Abatement Strategy, as formulated and endorsed by cabinet.
• Undertake separate, detailed needs assessments for mitigation and adaptation.
• Conduct a cost-benefit analysis for project profiling and Technology Impact Assessments (TIAs) for each of the technology options.
• Accelerate development of clean technologies, as these may provide a competitive edge on global markets and lead to greater efficiency.
• Encourage further work on new financing schemes that have the potential to address high investment risks.
• Encourage capacity-building activities needed for complete and successful integration of imported technologies.
• Start awareness programmes to address misconceptions about alternative energy and encourage energy-efficient behaviours.
5.2 SYSTEMATIC OBSERVATION
5.2.1 Research and systematic observation The collection of climatic data, current and historical, rests with the Meteorology Division of the MNRE. Under recent Government reforms, the Meteorology Division underwent extensive institutional changes, emerging finally as a fully-fledged national forecasting section with extensive data-collation capacity. The installation of six NOAA automatic weather stations (AWS) between 1991 and 1997 and the formalisation of tropical cyclone warning procedures � in collaboration with the American Samoa Weather Service Office � has vastly improved the frequency and accuracy of the division�s services. The division maintains a national climate and rainfall station network covering most of the two main islands. Samoa has slowly expanded its observation network to include four additional rainfall stations. It has also re-established two climate stations, thus increasing the coverage and quality of climate data and analysis. In 1993, a SEAFRAME tide gauge was installed at the Apia wharf as part of a regional climate and sea-level monitoring project. To date, it has collected sixteen years of data and is the only oceanographic component of the Division�s observations. Amongst several other parameters, the tide gauge measures sea-levels and water-temperatures. The Apia Observatory, now known as the Meteorology Division, is the national forecasting centre for Samoa. Standard reporting of synoptic weather observations (SYNOP) are carried out including hourly meteorological aviation reports (METAR) from
88
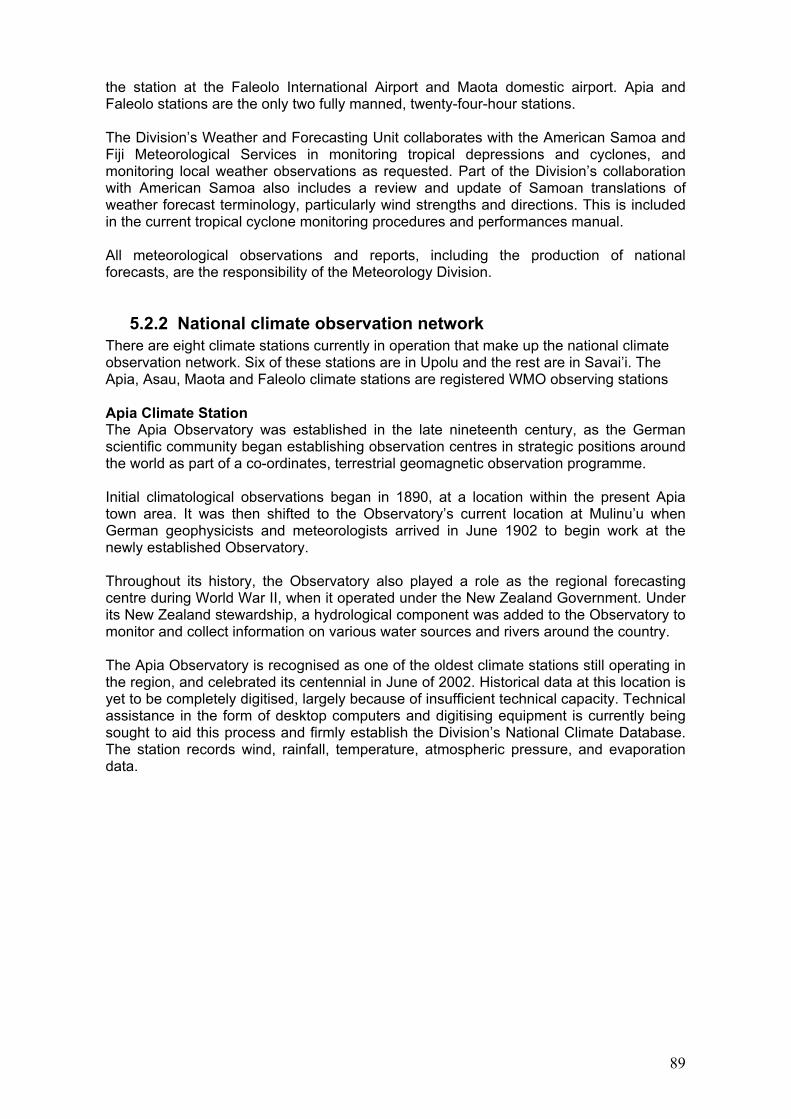
the station at the Faleolo International Airport and Maota domestic airport. Apia and Faleolo stations are the only two fully manned, twenty-four-hour stations. The Division�s Weather and Forecasting Unit collaborates with the American Samoa and Fiji Meteorological Services in monitoring tropical depressions and cyclones, and monitoring local weather observations as requested. Part of the Division�s collaboration with American Samoa also includes a review and update of Samoan translations of weather forecast terminology, particularly wind strengths and directions. This is included in the current tropical cyclone monitoring procedures and performances manual. All meteorological observations and reports, including the production of national forecasts, are the responsibility of the Meteorology Division.
5.2.2 National climate observation network There are eight climate stations currently in operation that make up the national climate observation network. Six of these stations are in Upolu and the rest are in Savai�i. The Apia, Asau, Maota and Faleolo climate stations are registered WMO observing stations Apia Climate Station The Apia Observatory was established in the late nineteenth century, as the German scientific community began establishing observation centres in strategic positions around the world as part of a co-ordinates, terrestrial geomagnetic observation programme. Initial climatological observations began in 1890, at a location within the present Apia town area. It was then shifted to the Observatory�s current location at Mulinu�u when German geophysicists and meteorologists arrived in June 1902 to begin work at the newly established Observatory. Throughout its history, the Observatory also played a role as the regional forecasting centre during World War II, when it operated under the New Zealand Government. Under its New Zealand stewardship, a hydrological component was added to the Observatory to monitor and collect information on various water sources and rivers around the country. The Apia Observatory is recognised as one of the oldest climate stations still operating in the region, and celebrated its centennial in June of 2002. Historical data at this location is yet to be completely digitised, largely because of insufficient technical capacity. Technical assistance in the form of desktop computers and digitising equipment is currently being sought to aid this process and firmly establish the Division�s National Climate Database. The station records wind, rainfall, temperature, atmospheric pressure, and evaporation data.
89
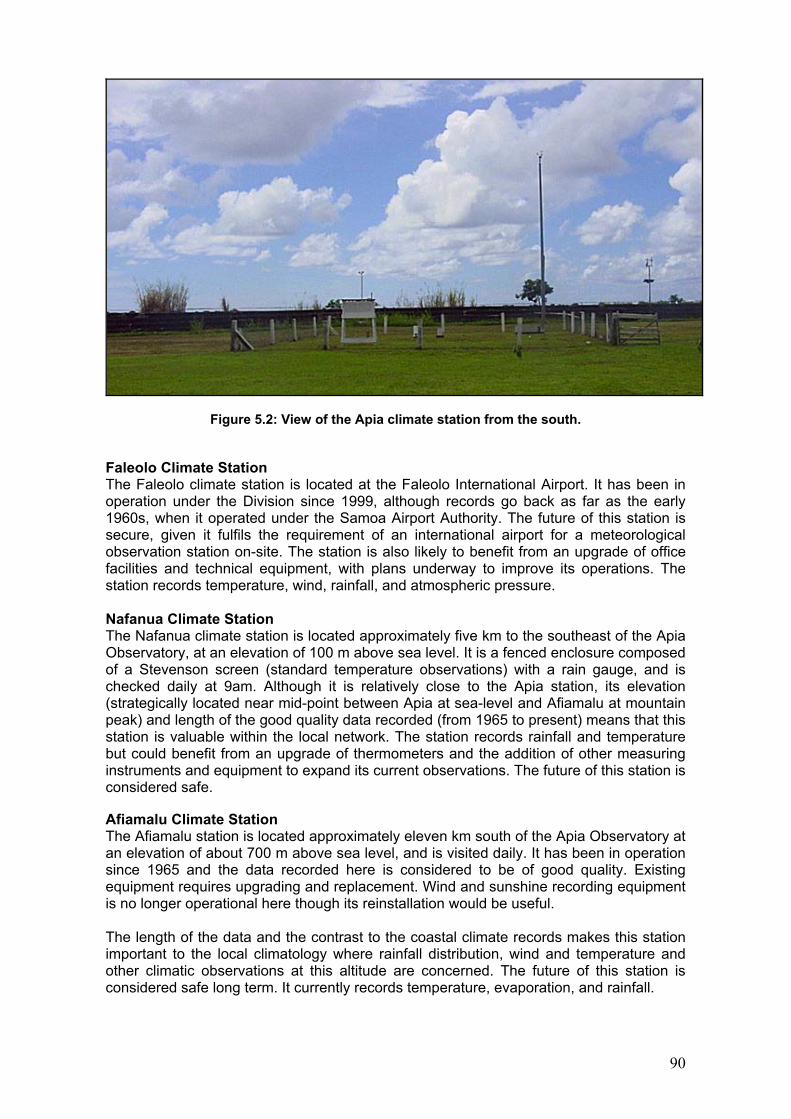
Figure 5.2: View of the Apia climate station from the south. Faleolo Climate Station The Faleolo climate station is located at the Faleolo International Airport. It has been in operation under the Division since 1999, although records go back as far as the early 1960s, when it operated under the Samoa Airport Authority. The future of this station is secure, given it fulfils the requirement of an international airport for a meteorological observation station on-site. The station is also likely to benefit from an upgrade of office facilities and technical equipment, with plans underway to improve its operations. The station records temperature, wind, rainfall, and atmospheric pressure. Nafanua Climate Station The Nafanua climate station is located approximately five km to the southeast of the Apia Observatory, at an elevation of 100 m above sea level. It is a fenced enclosure composed of a Stevenson screen (standard temperature observations) with a rain gauge, and is checked daily at 9am. Although it is relatively close to the Apia station, its elevation (strategically located near mid-point between Apia at sea-level and Afiamalu at mountain peak) and length of the good quality data recorded (from 1965 to present) means that this station is valuable within the local network. The station records rainfall and temperature but could benefit from an upgrade of thermometers and the addition of other measuring instruments and equipment to expand its current observations. The future of this station is considered safe.
Afiamalu Climate Station The Afiamalu station is located approximately eleven km south of the Apia Observatory at an elevation of about 700 m above sea level, and is visited daily. It has been in operation since 1965 and the data recorded here is considered to be of good quality. Existing equipment requires upgrading and replacement. Wind and sunshine recording equipment is no longer operational here though its reinstallation would be useful. The length of the data and the contrast to the coastal climate records makes this station important to the local climatology where rainfall distribution, wind and temperature and other climatic observations at this altitude are concerned. The future of this station is considered safe long term. It currently records temperature, evaporation, and rainfall.
90
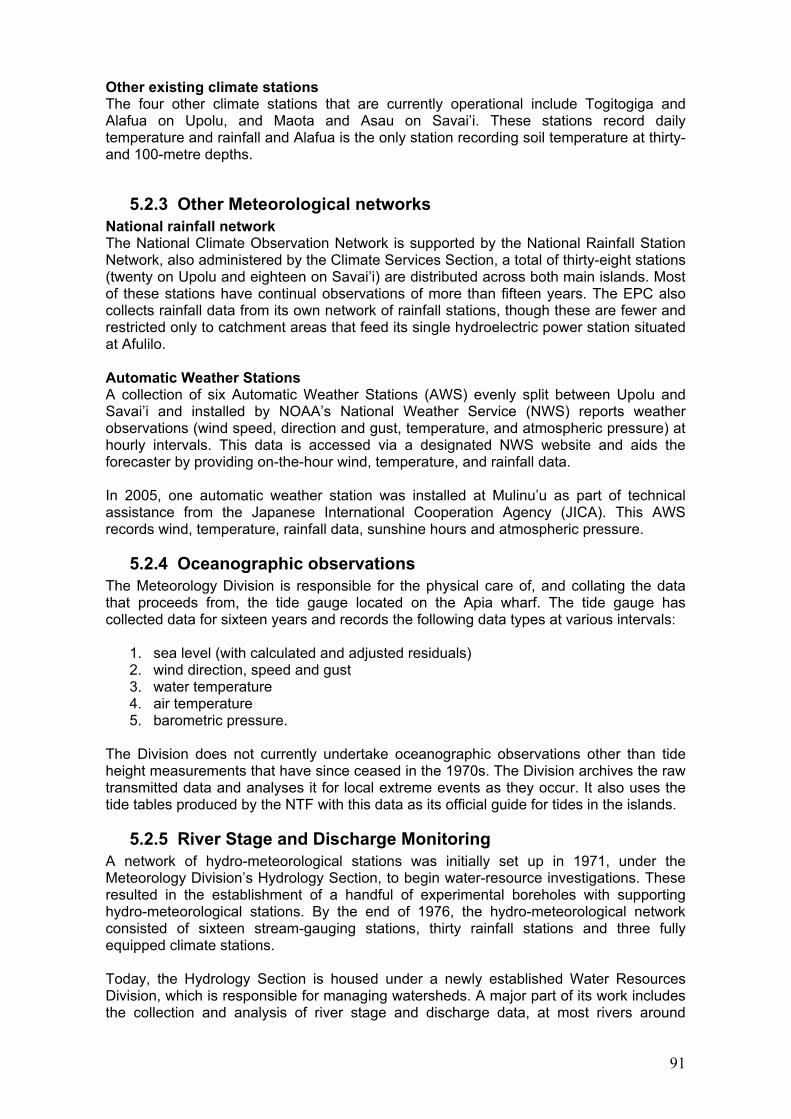
Other existing climate stations The four other climate stations that are currently operational include Togitogiga and Alafua on Upolu, and Maota and Asau on Savai�i. These stations record daily temperature and rainfall and Alafua is the only station recording soil temperature at thirty- and 100-metre depths.
5.2.3 Other Meteorological networks National rainfall network The National Climate Observation Network is supported by the National Rainfall Station Network, also administered by the Climate Services Section, a total of thirty-eight stations (twenty on Upolu and eighteen on Savai�i) are distributed across both main islands. Most of these stations have continual observations of more than fifteen years. The EPC also collects rainfall data from its own network of rainfall stations, though these are fewer and restricted only to catchment areas that feed its single hydroelectric power station situated at Afulilo.
Automatic Weather Stations A collection of six Automatic Weather Stations (AWS) evenly split between Upolu and Savai�i and installed by NOAA�s National Weather Service (NWS) reports weather observations (wind speed, direction and gust, temperature, and atmospheric pressure) at hourly intervals. This data is accessed via a designated NWS website and aids the forecaster by providing on-the-hour wind, temperature, and rainfall data. In 2005, one automatic weather station was installed at Mulinu�u as part of technical assistance from the Japanese International Cooperation Agency (JICA). This AWS records wind, temperature, rainfall data, sunshine hours and atmospheric pressure.
5.2.4 Oceanographic observations The Meteorology Division is responsible for the physical care of, and collating the data that proceeds from, the tide gauge located on the Apia wharf. The tide gauge has collected data for sixteen years and records the following data types at various intervals:
1. sea level (with calculated and adjusted residuals) 2. wind direction, speed and gust 3. water temperature 4. air temperature 5. barometric pressure.
The Division does not currently undertake oceanographic observations other than tide height measurements that have since ceased in the 1970s. The Division archives the raw transmitted data and analyses it for local extreme events as they occur. It also uses the tide tables produced by the NTF with this data as its official guide for tides in the islands.
5.2.5 River Stage and Discharge Monitoring A network of hydro-meteorological stations was initially set up in 1971, under the Meteorology Division�s Hydrology Section, to begin water-resource investigations. These resulted in the establishment of a handful of experimental boreholes with supporting hydro-meteorological stations. By the end of 1976, the hydro-meteorological network consisted of sixteen stream-gauging stations, thirty rainfall stations and three fully equipped climate stations. Today, the Hydrology Section is housed under a newly established Water Resources Division, which is responsible for managing watersheds. A major part of its work includes the collection and analysis of river stage and discharge data, at most rivers around
91
Samoa. It is also responsible for undertaking hydrological surveys to establish water table depths and elevation profiles for borehole site investigations. There is no direct operational link between the Hydrology Section and the SWA, aside from requests for hydrological surveys or occasional data requests made by the SWA of the WRD. The WRD Hydrology Section maintains a rainfall station network (installed at key catchment areas) based on monthly measurements of rainfall (versus the daily rainfall measurements recorded at stations under the Meteorology Division�s Climate Section).
5.2.6 Water Quality Monitoring The SWA�s Environmental Business Unit (EBU) conducts quality monitoring of surface and ground water. Three treatment plants for surface water exist at the Fuluasou, Alaoa and Malololelei intakes on Upolu. These plants use a slow sand filtration and chlorination process. Nineteen boreholes around the island supplement the surface intakes for water supply. Savai�i has a lone surface intake, with a treatment plant at Palauli and the rest of its supply is supplemented by twenty-three boreholes. Testing is undertaken both on site and at end points to monitor both chlorine and bacteria levels. The range of chlorination of 0.1�0.25 mg per litre is assured to maintain zero per cent presence of bacteria, e-coli, and coliform. While the EBU is responsible for the monitoring of water quality at these stations, it also extends its professional services to local commercial water vendors. One other commercial water vendor also offers water quality analysis services. As far as water quality is concerned, the SWA�s role as a utility provider is strictly regulated by the MoH. The establishment of the Water Quality Section and National Drinking Water Standards has allowed Samoa to provide its people with cleaner and better water.
5.3 EDUCATION, TRAINING AND PUBLIC AWARENESS Education and public awareness are important as they help build Samoa�s adaptation capacity by making people aware of climate change issues. The MNRE is the key agency responsible for Samoa�s national climate change work, including education and public awareness. Since Samoa ratified the UNFCCC and Kyoto Protocol, a number of programmes have been conducted both at the national and local level to help promote public awareness. The National Policy on Combating Climate Change and the NAPA have highlighted key strategies on awareness. The Canadian-funded project Capacity Building for the Development of Adaptation Measures (CBDAMPIC) 2002�2005 also helped highlight climate-change issues at the local level, particularly in two vulnerable communities Saoluafata and Lano.
5.3.1 Level of Public Awareness The establishment of the Climate Change Unit within MNRE has helped disseminate locally produced information that caters to the growing needs of the general public, schools and universities. Since ratifying the UNFCC, relevant authorities have co-ordinated numerous educational programmes and activities. These include the National Environment Management Strategies (NEMS), which mainly focused on environmental concerns.
92
For the last ten years, the MNRE has been promoting awareness through national environment events such as the National Environment Week and the Annual Climate Change Awareness day, which focuses primarily on promoting awareness and disseminating information about climate change to the public and schools. National efforts have focused mainly on compiling reports such as the initial National Communication, NCSA, NAPA, CRP which have documented information that has helped improve the level of awareness and knowledge on climate change issues, leading to more informed decision-making at the national level.
5.3.2 Education and training The current primary school curriculum does not contain any specific subjects on climate change, but there are related subjects under the science and social-science curricula. The secondary curriculum for Years 9 to 11 (Forms 3 to lower 5) also covers related topics within the science and social science subject areas. In Years 12 to 13 (Forms 5 to 6) the geography curriculum covers related topics (several strands are available) about environmental issues. In this strand, students can learn about climate change as a consequence of interactions between cultural environments and the atmospheric systems, and the different perspectives and responses to climate change. Resource materials, for instance climate-change booklets, mangrove information and other cultural resources, have been developed and distributed to schools to help supplement teaching materials. Cooperation amongst different ministries and agencies has helped foster the values and behaviours that the young will need to build a sustainable future. The completion of the �Environment Resource Education Guide for Years 7 to 10� has helped support the implementation of environment education initiatives in Samoan schools. It is a compilation of instructional resource materials developed to enhance general understanding of key issues, information-sharing and learning at the primary and secondary levels. A key focus of this guide is the need to integrate �education for sustainable development� (ESD) into national curricula. This will promote learning to empower the young, encouraging them to assume responsibility for their environment. The guide will also be used as a supplementary material for schools to introduce related topics on marine ecosystems, biodiversity, water resources, waste management, mangroves and climate change. The national reports prepared by the MNRE such as the First National Communication, NAPA, NCSA Climate Change Thematic Report, CRP etc. have also been used for research purposes, with other information available through the MNRE�s website: www.mnre.gov.ws At the national level, the MNRE continues to promote awareness through consultation, seminars and workshops that engage communities and vulnerable settlements. As a pilot demonstration under CBDAMPIC, education activities were held at two selected communities at Lano and Saoluafata, targeting primary-school students and village leaders. This initiative involved presentations from the Meteorology Office, the MNRE�s capacity-building section, Red Cross and other members of the NCCT. A key outcome of this project was a documentary that focuses on the climate-change vulnerabilities of different communities. In terms of staff development, a number of individuals from the MNRE, not only within the Climate Change Section, have been sent overseas to benefit from external training. Local media training has also helped increase awareness and understanding of the media,
93
allowing Government and responsible agencies to communicate more effectively about climate-change issues. In the process of completing Samoa�s SNC, the NCCCT is the main driving force in the formation of the working Groups from the different SNC components. This has resulted in the output of many reports from the different experts from each ministry, which also shows the high level of awareness and knowledge of climate-change issues within the different ministries.
5.3.3 Implemented and planned initiatives Cabinet has endorsed public-sector observance of environmental events like "National Climate Change Awareness Day" in July and the "National Environment Week" in November. These events are an opportunity for Government � and the MNRE � to engage the public in education and awareness-raising activities, seminars and workshops that focus on all aspects of adaptation, mitigation and vulnerability. Key educational activities that support these events are often competitions aimed at young people, for example essay-writing and poster competitions. The PIFACC, to which Samoa is a party, provides for training and workshops as a means to strengthen regional partnerships. Samoa has participated in other regional climate-change projects, such as the Pacific Islands Climate Change Assistance Programme (PICCAP) between 1997 and 2000. This was a capacity-building project designed to help Pacific island countries to develop their first national communication. In collaboration with SPREP, the Government has also funded training workshops for the media as a means of building partnerships with the media and thus engaging it more fully on climate-change issues. A number of media agencies as well as the NCCCT were involved in formulating a climate change communication strategy, which was compiled in collaboration with SPREP in December of 2006. As part of its media strategy, the MNRE prepares a children's environment column "Our Environment, Our Heritage", which is published weekly in the local newspapers � the Samoan Observer and Newsline � each Sunday. This column covers a broad range of environmental subjects and has received contributions from every division within the MNRE. The MNRE also publishes regularly in Tapu, a regional magazine based in Samoa and distributed throughout Hawai'i, Australia, New Zealand, Niue, American Samoa, Tokelau and the USA. The Meteorology Division sometimes has open house, when school children are able to visit climate stations and engage with environmental issues in an interactive manner.
5.3.4 Public access to information The MNRE's Climate-Change Section is the primary source of information for all climate-related issues in Samoa. The Capacity-Building Section also houses a library in which some locally produced information can be obtained. The SPREP and UNDP offices also have publicly available material on relevant environmental issues, but as yet there exists no single database in Samoa. Information is also available from other stakeholders, including the agricultural, health, fisheries, forestry and water sectors. Currently, the broad dissemination of vital climate-change information is hampered by poor facilities for data storage, poor networking and coordination systems and inadequate expertise in the area of database management. Also, there tends, amongst certain agencies both Government and NGO, to be a general reluctance to share information with others.
94
5.4 CONTRIBUTION OF NGOS AND ACADEMIC INSTITUTIONS
5.4.1 Non-governmental organisations (NGOs) NGOs with an environment focus continue to be involved in the implementation of government-led environment activities. Their role lies in advocacy for environmental management in areas of education and public awareness and highlighting local environmental issues. There are only three NGOs that take part in Samoa�s climate change programme and all of them are members of the NCCCT. The NCCCT acts as a steering committee for all the climate change activities in Samoa, and is made up of all relevant stakeholders. Below are some of the responsibilities and interests of the three NGOs: Matua-i-le-o�o Environment Trust Inc (METI) METI is an independent Samoan Environment Trust that was set up in June 2000, and which provides valuable support to the Climate Change Projects, especially to the CBDAMPIC and NAPA projects. METI was one of the leading organisers of the awareness and education component of the CBDAMPIC Project, conducting awareness and demonstration activities, particularly with respect to coral gardening in Saoludafata and Lano. METI has also collaborated extensively with the NAPA team, and is an active member of the NCCCT. O le Siosiomaga Society Inc (OLSSI) OLSSI is an active environmental NGO and an important stakeholder for all climate change activities in Samoa. Samoa Red Cross Society Inc Samoa�s Red Cross Society Inc is involved in pre-disaster planning and post-disaster relief work, and is an active member of the NCCCT. In collaboration with MNRE, it conducts disaster preparedness and climate change training in village communities.
5.4.2 Academic Institutions Academic institutions play a major role in raising public awareness about climate change. These are the main institutions in Samoa: The National University of Samoa (NUS) The NUS provides a number education programmes relevant to climate change and the environment. The NUS has also provided support for the preparation of Samoa�s SNC, in terms of research assistance with air and water monitoring. The University of the South Pacific USP provides research and training courses for all regional and international students wishing to widen their knowledge on issues affecting the Pacific region. The USP centre in Alafua focuses primarily on agricultural training, and has a strong agriculture research and training programme that is highly relevant to the adaptation component of the SNC. The Institute of Research, Extension Training and Agriculture (IRETA) is part of this campus. Institute of Higher Learning (IHL) The Institute of Higher Learning is responsible for delivering tertiary education and training to prescribed standards. The IHL has integrated climate-change and environmental education into its courses on horticulture and land management.
95
5.5 GAPS, NEEDS AND PRIORITIES IN CLIMATE CHANGE INFORMATION
5.5.1 Gaps In 2007, the MNRE documented the obstacles that Samoa continues to face as it strives to meet its UNFCCC and the Kyoto Protocol obligations. Obstacles include insufficient funds, lack of data and poor information management and inadequate physical and human resources. More must be done to build awareness both in Government and the community about Samoa's vulnerability to climate change. More must be done to feed information, knowledge and technologies into improved decision-making and environmental management. Furthermore, climate change issues must be integrated into the national curriculum so that students at all levels can gain familiarity with key issues. Currently, climate change is a supplementary, not a core subject, and there is room here for collaboration between the MNRE and the Ministry of Education, Sports and Culture. Finally, there are barriers in the dissemination of the right information to the right target audience, alongside complications that can arise when specialised English terminology is used during consultation and awareness programmes. To reach out to the most vulnerable � i.e. people in rural or coastal communities whose English education might not be comprehensive � all relevant environmental terminology must be translated into Samoan. Only then can local stakeholders gain a full understanding of the relevant issues.
5.5.2 Needs and Priorities Efforts should be focussed on making climate-change information available to a wider audience. The MNRE must continue its current fruitful partnerships with media outlets, schools and community groups to promote awareness and support its existing programmes. Current awareness programmes should be evaluated for their effectiveness, and the only way to ascertain just how effective these progammes have been is through a national survey that gauges local awareness about climate change. The MNRE must co-operate with the Statistics Division of the Ministry of Finance to streamline this survey, as it also works to improve existing information networks. Funding is urgently required to help build the necessary physical networks for information storage and dissemination. Funding is also needed to produce education materials in both English and Samoan, and to train qualified staff in environmental education. Ultimately, climate change information needs to be stored in a central database that the public can access via the Web. Funding should be allocated to train staff to manage and update this data. Departments needs also to develop protocols about how data is shared between stakeholders, to ensure that information is handled sensitively and in a way that does not compromise privacy or other legal agreements.
96

REFERENCES (To be Included)
97

98
ANNEX 1: GHG INVENTORY REPORTING TABLES To be reported

99