Rising Aspirations Dampen Satisfaction* · - 1 - Rising Aspirations Dampen Satisfaction* Andrew E....
24
- 1 - Rising Aspirations Dampen Satisfaction* Andrew E. Clark † (Paris School of Economics - CNRS) Akiko Kamesaka ‡§ (Aoyama Gakuin University and ESRI) Teruyuki Tamura ** (Sophia University) June 2014 Abstract It is commonly-believed that education is a good thing. Yet its correlation with subjective well-being is most often only weakly positive, or even negative. How can this be when education is associated with many better individual outcomes? We here square the circle by appealing to novel Japanese data showing that education also raises aspirations. If reported happiness comes from a comparison of the outcome to aspirations, then any phenomenon raising both at the same time will have only a muted or even zero effect on reported well-being. We find that around half of the happiness effect of education is cancelled out by higher aspirations, and suggest a similar dampening effect for income. These findings underline the importance of changing aspiration levels in determining individual subjective well-being. Keywords: Education, Satisfaction, Aspirations, Income. JEL codes: D31, D63, I3, J31. * A former version of this paper was presented at the 2013 Autumn Meeting of the Japanese Economic Association, and the 7th Annual Meeting of the Association of Behavioral Economics and Finance. We are very grateful to Yukinobu Kitamura, Fumio Ohtake, Tadashi Yagi, and session participants for comments. We also thank Susumu Kuwahara for supporting this research project at the Economic and Social Research Institute (ESRI), Cabinet Office, Government of Japan. The second author’s research is partly supported by Grants-in-Aid for Scientific Research (C) 24530358 from the Japan Society for the Promotion of Science. † PSE, 48 Boulevard Jourdan, 75014 Paris, France. Tel.: +33-1-43-13-63-29. E-mail: [email protected] . ‡ Aoyama Gakuin University, 4-4-25 Shibuya, Shibuya-ku, Tokyo, Japan. Tel.: +81-3- 3409-6269. E-mail: [email protected] . § Economic and Social Research Institute (ESRI), Cabinet Office, Government of Japan. ** Sophia University, 7-1 Kioi-Cho, Chiyoda-ku, Tokyo, Japan. E-mail: [email protected].
Transcript of Rising Aspirations Dampen Satisfaction* · - 1 - Rising Aspirations Dampen Satisfaction* Andrew E....
- 1 -
Rising Aspirations Dampen Satisfaction*
Andrew E. Clark† (Paris School of Economics - CNRS)
Akiko Kamesaka‡§
(Aoyama Gakuin University and ESRI)
Teruyuki Tamura**
(Sophia University)
June 2014
Abstract
It is commonly-believed that education is a good thing. Yet its correlation with
subjective well-being is most often only weakly positive, or even negative. How can
this be when education is associated with many better individual outcomes? We here
square the circle by appealing to novel Japanese data showing that education also raises
aspirations. If reported happiness comes from a comparison of the outcome to
aspirations, then any phenomenon raising both at the same time will have only a muted
or even zero effect on reported well-being. We find that around half of the happiness
effect of education is cancelled out by higher aspirations, and suggest a similar
dampening effect for income. These findings underline the importance of changing
aspiration levels in determining individual subjective well-being.
Keywords: Education, Satisfaction, Aspirations, Income.
JEL codes: D31, D63, I3, J31.
* A former version of this paper was presented at the 2013 Autumn Meeting of the
Japanese Economic Association, and the 7th Annual Meeting of the Association of
Behavioral Economics and Finance. We are very grateful to Yukinobu Kitamura, Fumio
Ohtake, Tadashi Yagi, and session participants for comments. We also thank Susumu
Kuwahara for supporting this research project at the Economic and Social Research
Institute (ESRI), Cabinet Office, Government of Japan. The second author’s research is
partly supported by Grants-in-Aid for Scientific Research (C) 24530358 from the Japan
Society for the Promotion of Science.
† PSE, 48 Boulevard Jourdan, 75014 Paris, France. Tel.: +33-1-43-13-63-29. E-mail:
‡ Aoyama Gakuin University, 4-4-25 Shibuya, Shibuya-ku, Tokyo, Japan. Tel.: +81-3-
3409-6269. E-mail: [email protected].
§ Economic and Social Research Institute (ESRI), Cabinet Office, Government of Japan. **
Sophia University, 7-1 Kioi-Cho, Chiyoda-ku, Tokyo, Japan. E-mail:
- 2 -
Rising Aspirations Dampen Satisfaction
Andrew E. Clark, Akiko Kamesaka and Teruyuki Tamura
1. Introduction
There has been a great deal of empirical work literature on the correlates of self-
reported happiness or subjective well-being over the past two decades. One potential
mystery in this fast-growing literature is why the correlation between satisfaction and
education is often found to be only weakly positive, or even negative.
A number of explanations have been proposed. One possibility is that of sorting,
whereby “naturally” unhappy people are more likely to choose to become educated. In
principle, this hypothesis can be tested using panel data.1 In practice, many of the adults
who appear in large-scale panel data sets do not change their levels of education. We
would require data providing information on children’s initial levels of subjective well-
being, and then be able to follow the same individuals until their education is completed.
The British Household Panel Survey (BHPS)2, for example, has from Wave 4 included
information on children of household members aged 11 to 15. A more complete picture
of childhood development is provided, for example, in ALSPAC (Avon Longitudinal
Study of Parents and Children) data3, in which children in the Avon area who were born
between April 1991 and December 1992 have been closely and frequently followed.
This data includes a variety of information on child emotional health.
A second common proposed solution of the satisfaction-education relationship is
that education does indeed provide better outcomes, but also raises the individual’s
expectations. This is an attractive solution to the mystery. Unfortunately it is nigh-on
1 An alternative, which provides a local estimate of the effect of education, is to appeal to the natural
experiment of the raising of the compulsory minimum school leaving age. Oreopoulos and Salvanes
(2011) conclude that this directly raised the average happiness of those affected by the change, mainly via
the effect of education on income.
2 See https://www.iser.essex.ac.uk/bhps/.
3 See http://www.bristol.ac.uk/alspac/.
- 3 -
impossible to test in the data sets upon which research in this field typically relies, as we
do not believe that these include useful information on individuals’ expectations or
aspirations. In some broad sense, we would like to know not only how well people do in
terms of outcomes, but also how well that they think that they should be doing. It is the
gap between these two that will arguably determine the individual’s subjective well-
being outcomes.
We here make some progress regarding expectations using novel data from the
Economic and Social Research Institute (ESRI), Cabinet Office of Japan. This data set
includes many of the common socio-demographic variables that have been analysed in
the is literature, as well as self-reported happiness. In this sense, the data set is entirely
standard. Where we believe it adds new information to the literature is that respondents
are also asked about how happy they think that they should be.
Stutzer (2004) focused on the link between income aspirations and self-reported
happiness, finding that both higher income aspirations reduce self-reported happiness,
and higher average income in the community is associated with higher aspired levels of
income. We are here broadly along the same lines, but instead of considering
expectations with respect to income, house or job, we consider expectations over well-
being itself. Our hypothesis is that the level of well-being that individuals report will
depend on the comparison of the “pure” level of happiness that the individual feels to
her happiness aspirations. Individuals' ideal levels of happiness arguably reflect such
aspirations.
That individual aspirations may play a central role in determining self-reported
happiness is arguably reasonably commonplace in the subjective well-being literature.
Following Gilboa and Schmeidler (2001), individual aspirations can usefully be though
thought to be formed in two different ways. The first is based on social comparisons
theory, whereby individuals often care not only about the absolute level of income (say)
that they receive, but also how their income shapes up compared to some group of
others. Interpersonal comparisons are argued to affect the individual's level of
aspirations (as in Stutzer), in that seeing that others earn more may lead the individual
to aspire to a higher level of income. In the same context, adaption (comparisons to
oneself in the past) may play a role, in that individuals often seem to become used to
- 4 -
any higher level of income. Here, aspirations may rise with the individual's own level of
past income: rather than involving a comparison to others, here the individual compares
to her own past experience. Aspirations will then track the individual's own income
(potentially with a lag).
The second channel that Gilboa and Schmeidler (2001) relies on reasoning, whereby
direct information is used to provide a justification for what the individual could or
should expect. We can imagine these aspirations referring to all kinds of different
aspects of the individual's life: their income, their job, their house etc. One of the few
contributions which has been able to appeal to direct evidence of expectations, here with
respect to income, is McBride (2010). Here, an experimental approach is adopted which
changes the amount of money the individual expects to win in a simple matching-
pennies game via manipulations (about which the subject is informed) of the playing
behavior of the individual’s (computerized) partner. Conditional on both the amount the
individual does win and the amount other players playing the same game win, McBride
shows that higher expectations of winnings significantly reduce satisfaction.
Our paper is in this spirit, although in a non-experimental setting. We here
demonstrate that certain variables are correlated in the same direction with both self-
reported subjective well-being and aspirations. We concentrate in particular on the role
of education in this respect. Higher education increases both outcomes and expectations,
and as such its final effect on subjective well-being is muted.
The remainder of this paper is organized as follows. Section 2 briefly reviews the
literature related to the relationship between education and subjective well-being.
Section 3 then describes the characteristics of our data set and presents the estimation
model. Section 4 discusses the empirical results and, last, Section 5 concludes.
2. Aspirations, Education and Happiness
We concentrate in this paper on the empirical relationship between education, on the
one hand, and reported and aspired happiness on the other. Previous work has
underlined the existence of both direct and indirect effects of education on happiness
- 5 -
(see for example, Castriota, 2006, and Cunado and Gracia, 2012). The direct effect is
that the higher-educated have more self-confidence, self-esteem and so on than do the
lower-educated. In addition, there is likely a direct effect of the acquisition of
knowledge on subjective well-being. There are three main types of indirect effects. First,
better education brings higher incomes and better opportunities on the labour market in
general. Second, education is a signal of quality, and the higher-educated obtain indirect
well-being from prestige. Third, the more educated on average have better habits and
health behaviors.
With regard to existing empirical work, a number of authors find a positive
correlation between education and subjective well-being (Di Tella et al., 2001, Easterlin,
2005, Layard, 2005, Albert and Davia, 2005, Becchetti et al., 2006, Castriota, 2006,
Oreopoulos, 2007, and Florida et al. 2013). However, other work has rather concludes
as to an ambiguous relationship between education and happiness (Veenhoven, 1996,
Inglehart and Klingemann, 2000, and Hickson and Dockery, 2008). Layard et al. (2012)
find a positive correlation in SOEP and World Values Survey data, but not in the BHPS
or the Gallup World Poll.
Early results in Klein and Maher (1966) and Warr (1992) reveal a negative
relationship between education and satisfaction. Equally, in both Clark and Oswald
(1996) and Clark (1999), the analysis of BHPS data reveals that the higher-educated
report lower levels of job satisfaction, ceteris paribus, than do the less-educated. In
Blanchflower and Oswald (1998), the respondents in the National Child Development
Study with college degrees are the least satisfied with their work. An intriguing recent
take on this finding appears in Binder and Coad (2011), who analyse BHPS data and
show that life satisfaction is positively correlated with education at the lower end of the
well-being distribution. This correlation turns negative at the top end of the well-being
distribution.
The proposed explanation for the a priori counter-intuitive result of a zero or
negative correlation between subjective well-being and education is that the higher-
educated likely have higher expectations. We assume here that individual utility
depends on the gap between outcomes and aspirations. Education will on the one hand
increase aspirations or expectations regarding wages and job quality in general. Of
- 6 -
course, it on average is indeed associated with better labour-market outcomes. The sign
of the unconditional correlation between education and happiness will then depend on
whether it is aspirations or outcomes which rise the fastest. If aspirations outstrip
outcomes, then education will be negatively correlated with happiness; if both rise at the
same rate then the unconditional correlation will be zero. It is worth noting that much of
the empirical analysis of the relation between subjective well-being and education
actually controls for some of the outcome variables that are arguably caused by
education (notably income): these are the indirect effects of education on well-being.
This will yield a conditional correlation coefficient which is lower than the
unconditional coefficient.
We here test the hypothesis that education affects aspirations directly. In particular,
we ask whether education is correlated in the same way with self-reported happiness but
also the individual's aspirations. This will help us to better understand the relationship
between education and happiness.
3. Data and Model
Our empirical analysis appeals to Japanese cross-section data from the Economic
and Social Research Institute (ESRI), Cabinet Office. The sample covers 6,236 (47%
male and 53% female) Japanese respondents in early 2013. In this questionnaire,
individuals are asked about both their current level of happiness and about how happy
they wish to be. The wording of these happiness questions is as follows: “Currently,
how happy do you feel? Score the degree of your happiness between 10 (very happy)
and 0 (very unhappy)"; and “What is your desired condition, where 10 is very happy
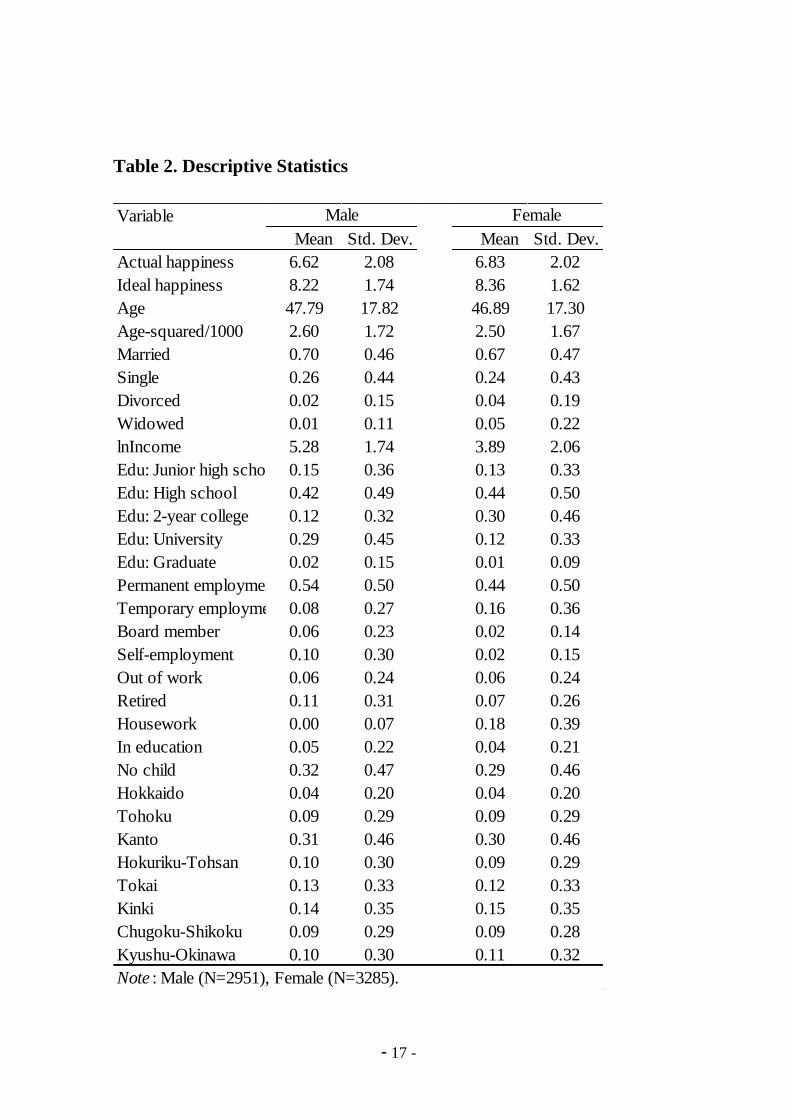
and 0 is very unhappy”. The mean of these two happiness variables for men are 6.6 and
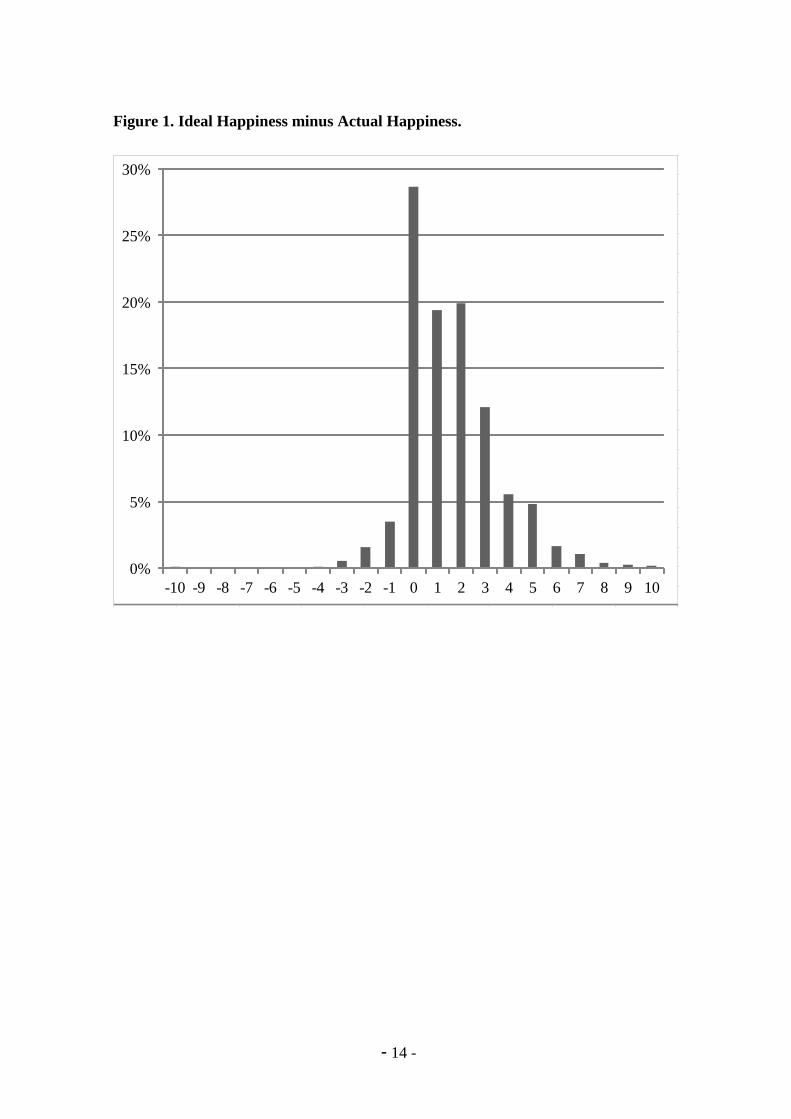
8.2 respectively, and for women 6.8 and 8.4. Around thirty per cent of individuals are as
happy as they wish to be (in the sense that their two happiness scores coincide), and 65
per cent of individuals are less happy than they wish to be. This leaves just 6 per cent
who are “too happy” in this sense. When differences exist between actual and ideal
happiness, they are most often of one or two points on the zero to ten scale. The full
distribution of ideal minus actual happiness is illustrated in Figure 1.
- 7 -
[Figure 1 about here]
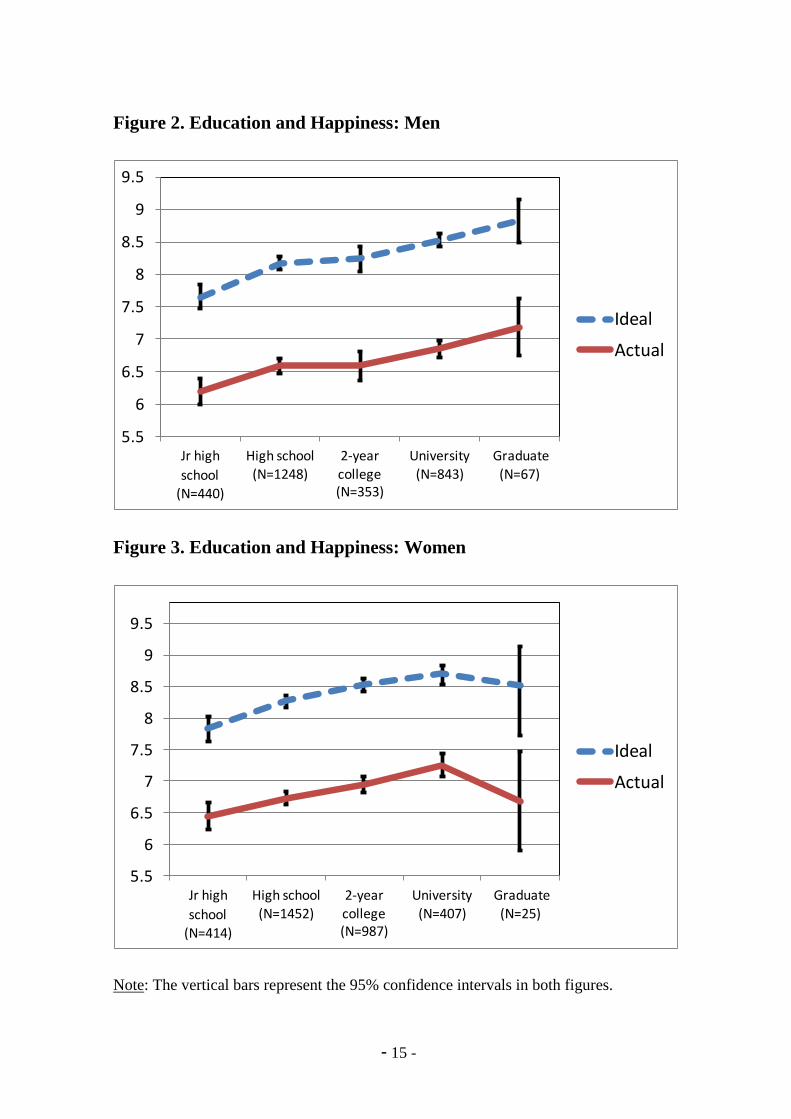
With respect to education, respondents’ highest educational attainment is captured
by a number of dummy variables: junior high school (junior high school graduates or
high-school dropouts); high school (high-school graduates, 2-year college dropouts or
4-year college dropouts); 2-year college (vocational, junior or technical junior college
graduates); university (4-year college graduates and graduate dropouts); and graduate
school graduates. Figures 2 and 3 show the relationship between actual and ideal
happiness, on the one hand, and education on the other. Both actual and ideal happiness
rise with education for men; for women there is something of a downturn for those with
postgraduate qualifications, although the cell size is small here, and this drop could
simply represent sample variability.
[Figure 2 about here]
[Figure 3 about here]
The data also includes other personal characteristics such as age, marital status,
income,4 labor-force status, number of children, and region of residence. These will be
introduced as control variables in the regression analysis of the two happiness measures.
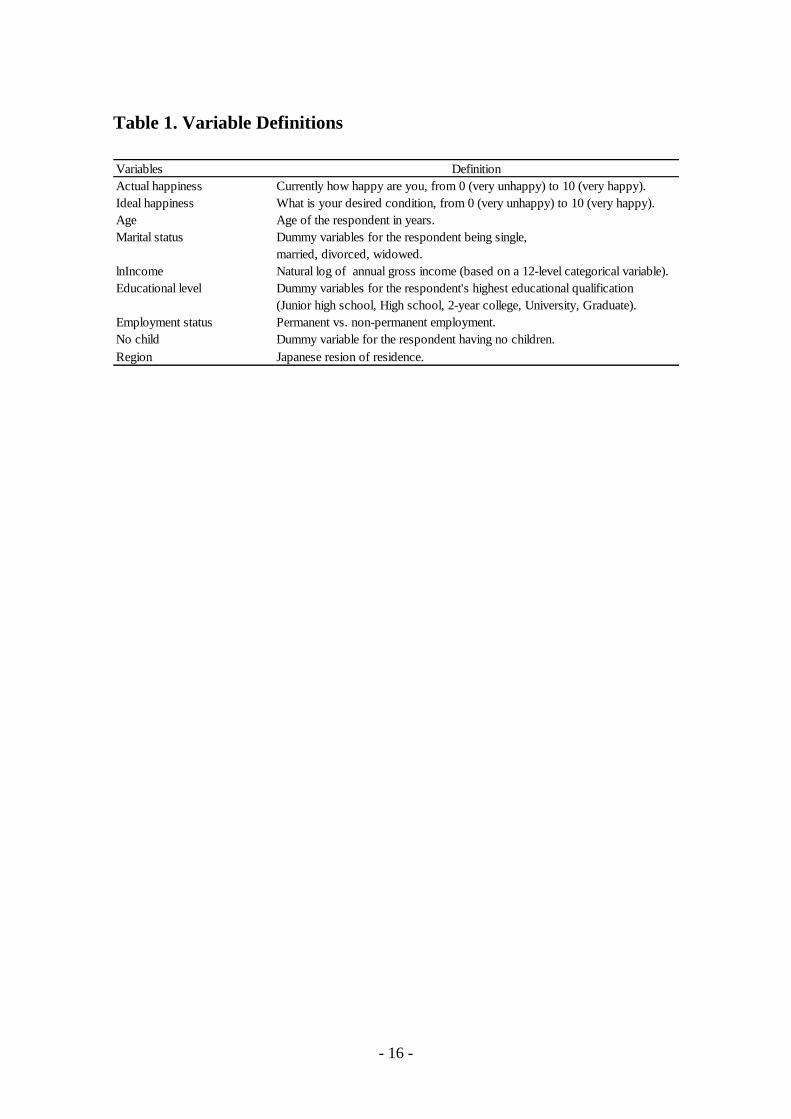
The definitions of these different variables appear in Table, and their descriptive
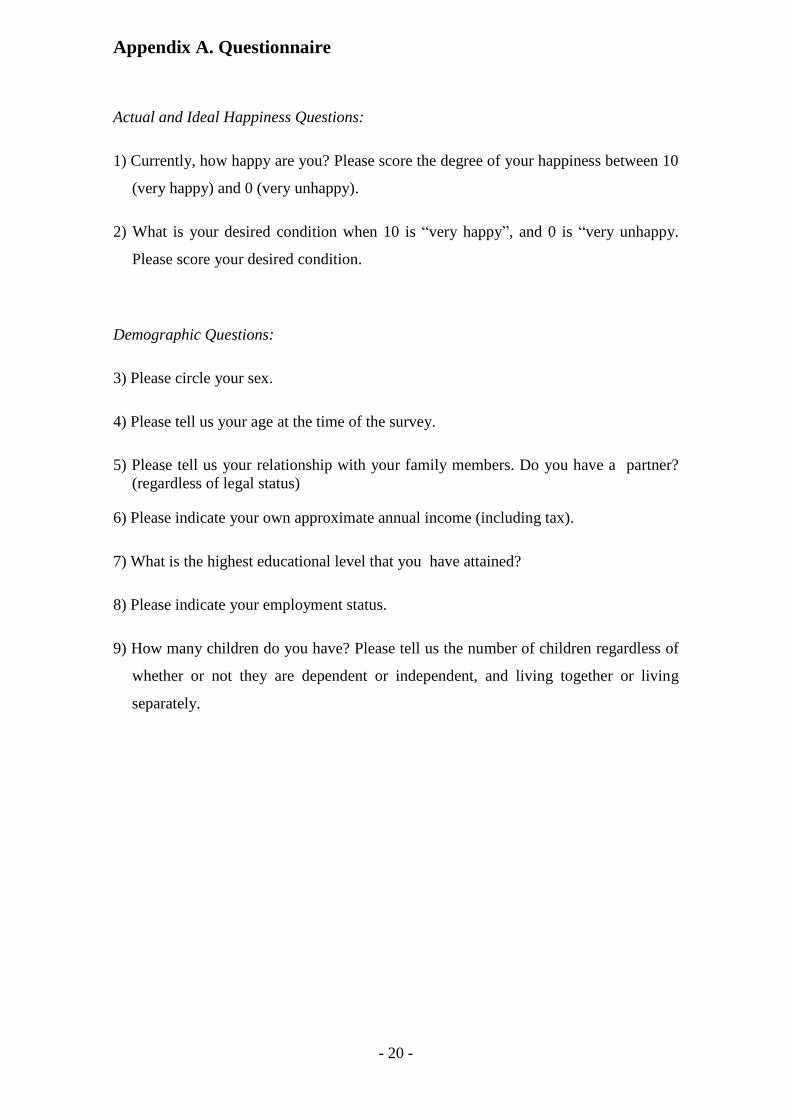
statistics appear in Table 2. The actual questionnaire items appear in Appendix A.
4 Gross annual income is measured on a twelve-point scale. We use the median value of each category in
order to convert the answers into a continuous variable. We use a value of 20M Yen for the last open-
ended 15M Yen or over category, as is common in Japan.
- 8 -
[Table 1 about here]
[Table 2 about here]
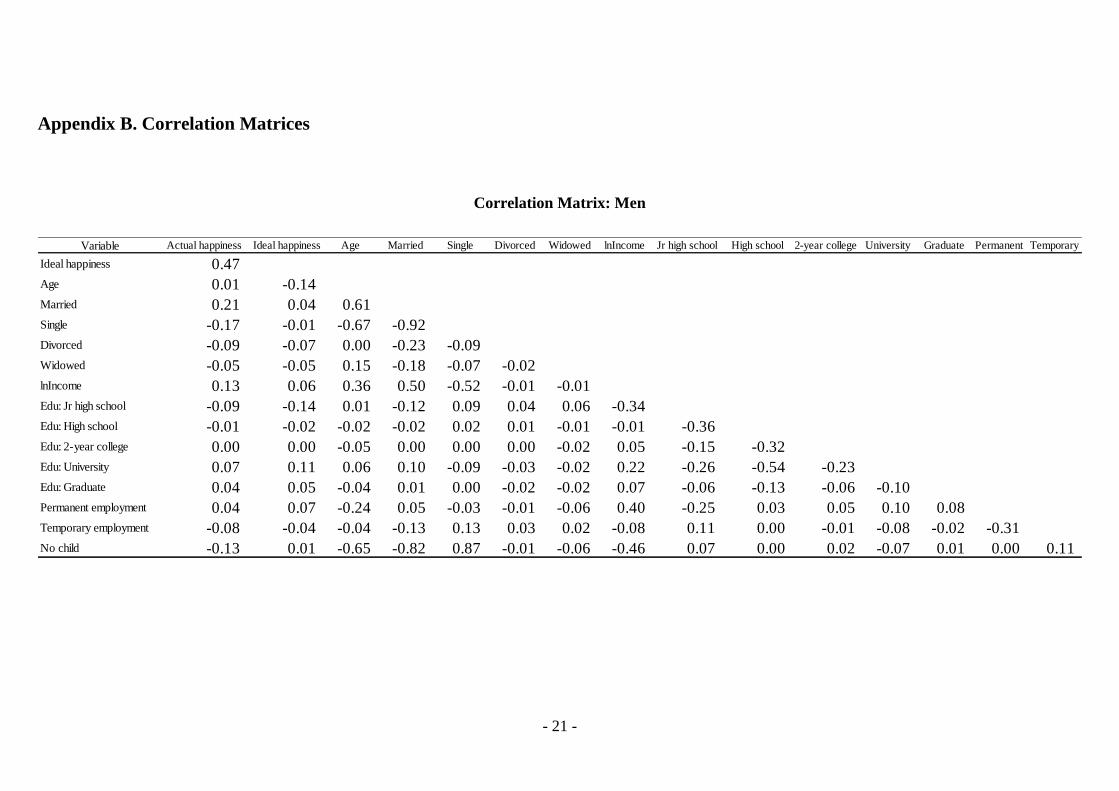
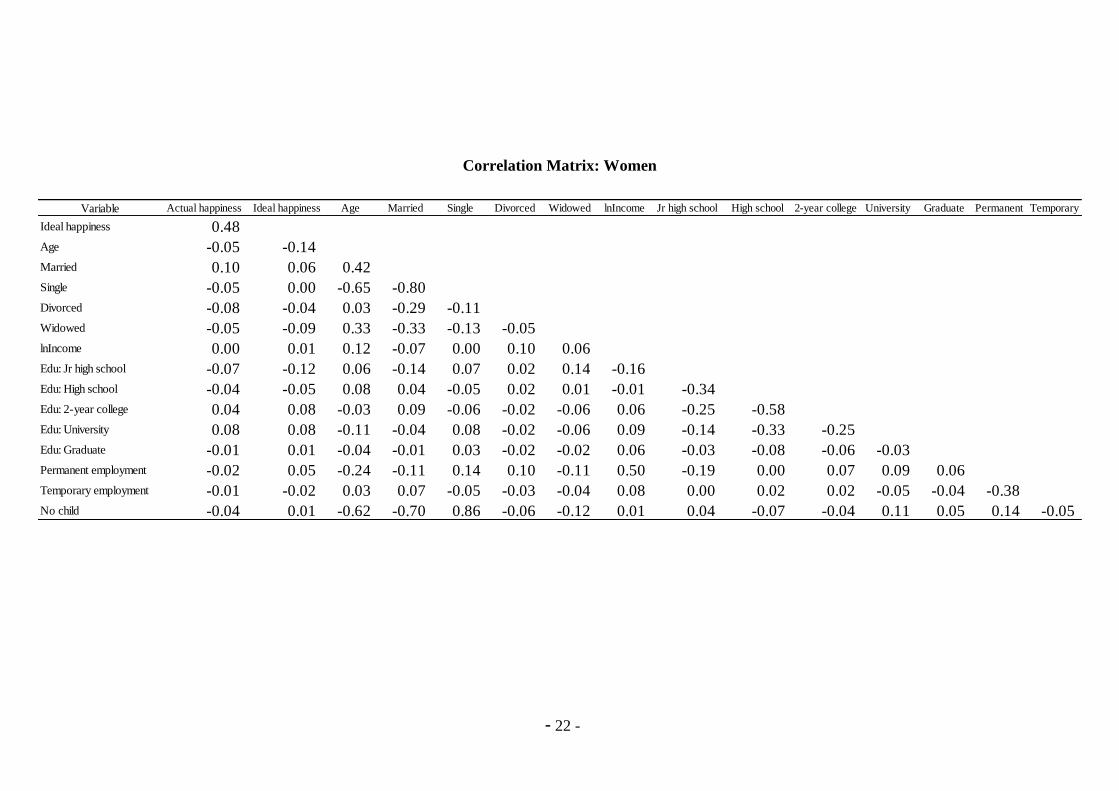
The two tables in Appendix B present the correlation matrices between all of our
variables, separately for men and women. The correlation coefficient between actual
happiness and ideal happiness is very similar for men (0.47) and women (0.48).
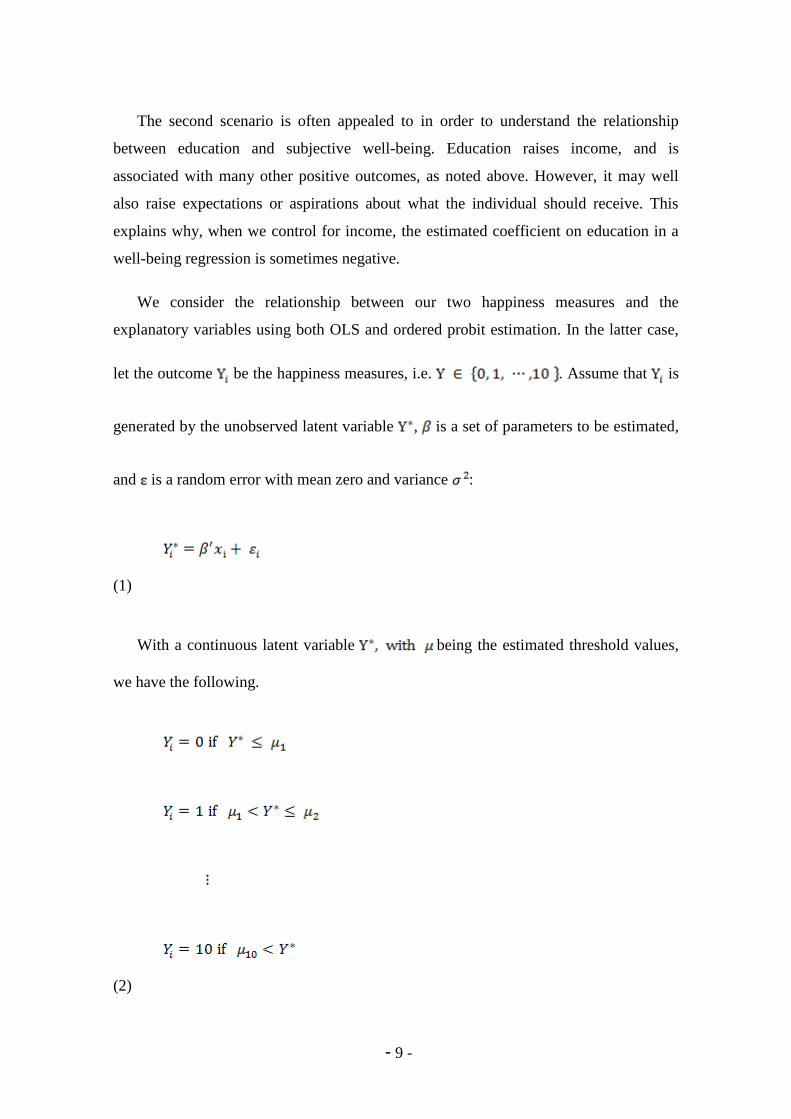
The main idea to which we appeal is that, in line with a great deal of work across the
social sciences, individuals' reported happiness levels will reflect the gap between what
they receive (their outcome) and their aspirations or expectations. For an individual i we
denote reported happiness by HRi, and the aspired level of happiness by HAi. The “pure”
level of happiness (before individual i’s compares the outcome to aspirations) can be
denoted by HPi. Both of HPi and HAi will likely depend on some explanatory variables,
Xi. We then imagine a relationship of the form
HRi = f(HPi (Xi) - HAi (Xi))
Many surveys contain what are now becoming standard subjective well-being
questions: these can be thought of as providing some measure of HRi. These variables
are then used as dependent variables in regressions, relating them to some set of
explanatory variables, Xi. The above equation makes clear that an insignificant
relationship between HR and a variable X1, say, can actually reflect two very different
scenarios.
1) The variable X1 has no effect on either pure and aspired well-being: dHP/dX1 = 0 and
dHA/dX1 = 0.
2) The variable X1 does affect pure well-being, but its effect is cancelled out by
changing aspirations: dHP/dX1 = dHA/dX1, so that dHR/dX1 = 0
- 9 -
The second scenario is often appealed to in order to understand the relationship
between education and subjective well-being. Education raises income, and is
associated with many other positive outcomes, as noted above. However, it may well
also raise expectations or aspirations about what the individual should receive. This
explains why, when we control for income, the estimated coefficient on education in a
well-being regression is sometimes negative.
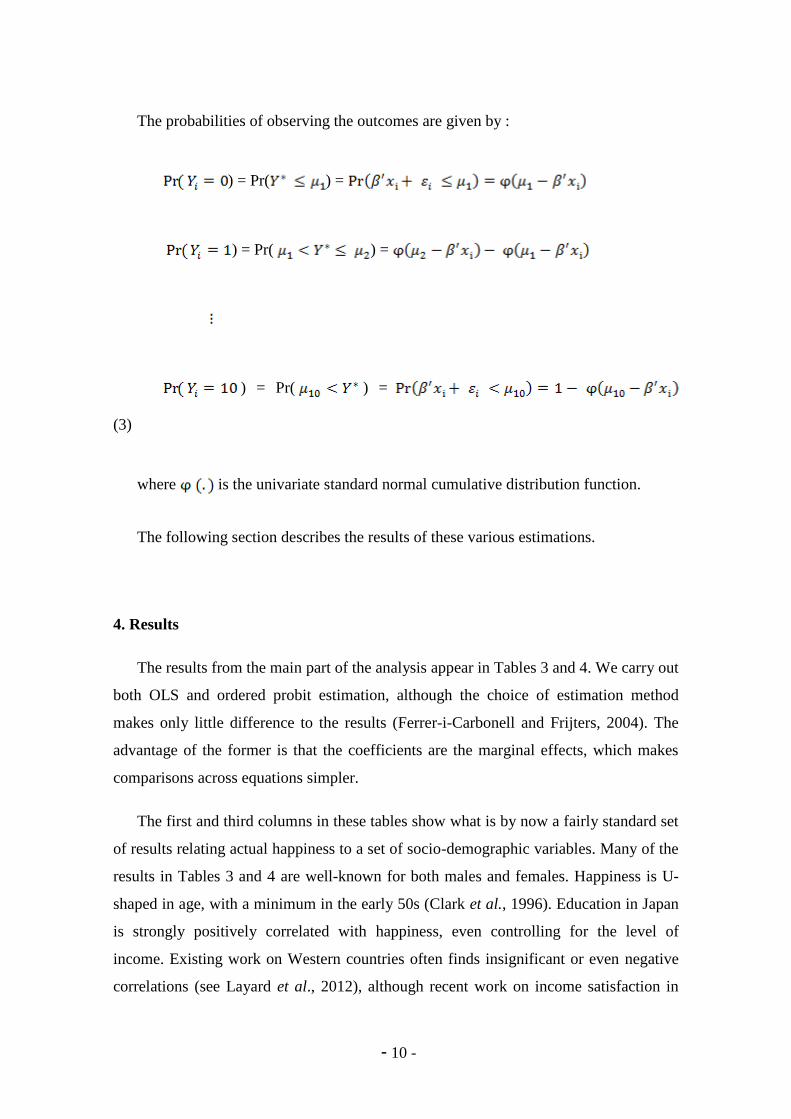
We consider the relationship between our two happiness measures and the
explanatory variables using both OLS and ordered probit estimation. In the latter case,
let the outcome be the happiness measures, i.e. . Assume that is
generated by the unobserved latent variable , is a set of parameters to be estimated,
and is a random error with mean zero and variance :
(1)
With a continuous latent variable being the estimated threshold values,
we have the following.
(2)
- 10 -
The probabilities of observing the outcomes are given by :
) = Pr( ) =
) = Pr( ) =
) = Pr( ) =
(3)
where is the univariate standard normal cumulative distribution function.
The following section describes the results of these various estimations.
4. Results
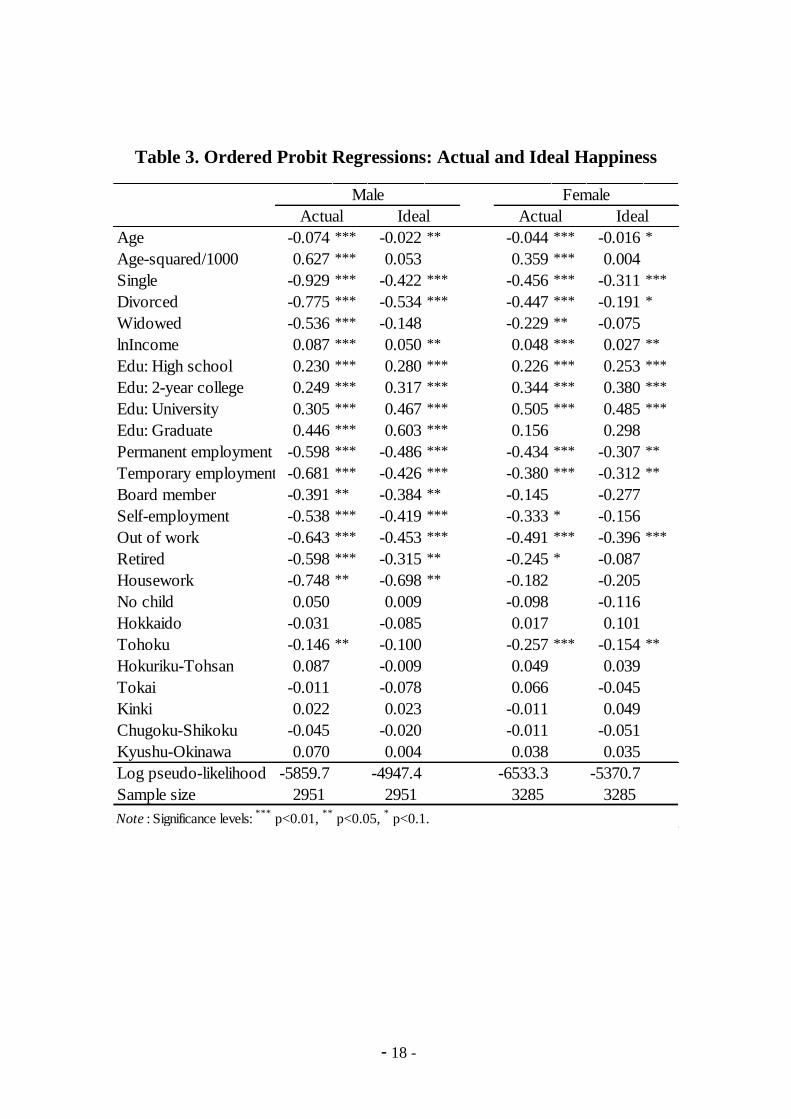
The results from the main part of the analysis appear in Tables 3 and 4. We carry out
both OLS and ordered probit estimation, although the choice of estimation method
makes only little difference to the results (Ferrer-i-Carbonell and Frijters, 2004). The
advantage of the former is that the coefficients are the marginal effects, which makes
comparisons across equations simpler.
The first and third columns in these tables show what is by now a fairly standard set
of results relating actual happiness to a set of socio-demographic variables. Many of the
results in Tables 3 and 4 are well-known for both males and females. Happiness is U-
shaped in age, with a minimum in the early 50s (Clark et al., 1996). Education in Japan
is strongly positively correlated with happiness, even controlling for the level of
income. Existing work on Western countries often finds insignificant or even negative
correlations (see Layard et al., 2012), although recent work on income satisfaction in
- 11 -
Japan also uncovered positive coefficients on education (Clark et al., 2013). This strong
correlation of education with subjective well-being, even when controlling for income,
may therefore be something of a Japanese specificity as compared to other OECD
countries, and doubtless merits further investigation.
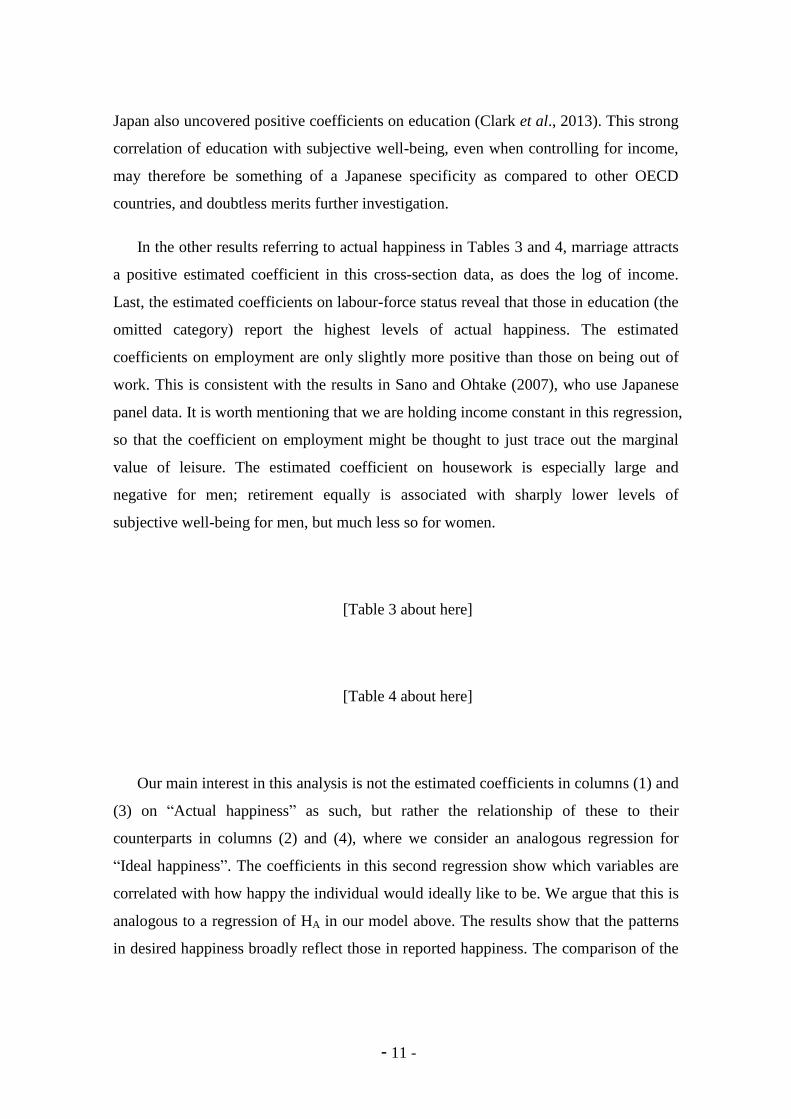
In the other results referring to actual happiness in Tables 3 and 4, marriage attracts
a positive estimated coefficient in this cross-section data, as does the log of income.
Last, the estimated coefficients on labour-force status reveal that those in education (the
omitted category) report the highest levels of actual happiness. The estimated
coefficients on employment are only slightly more positive than those on being out of
work. This is consistent with the results in Sano and Ohtake (2007), who use Japanese
panel data. It is worth mentioning that we are holding income constant in this regression,
so that the coefficient on employment might be thought to just trace out the marginal
value of leisure. The estimated coefficient on housework is especially large and
negative for men; retirement equally is associated with sharply lower levels of
subjective well-being for men, but much less so for women.
[Table 3 about here]
[Table 4 about here]
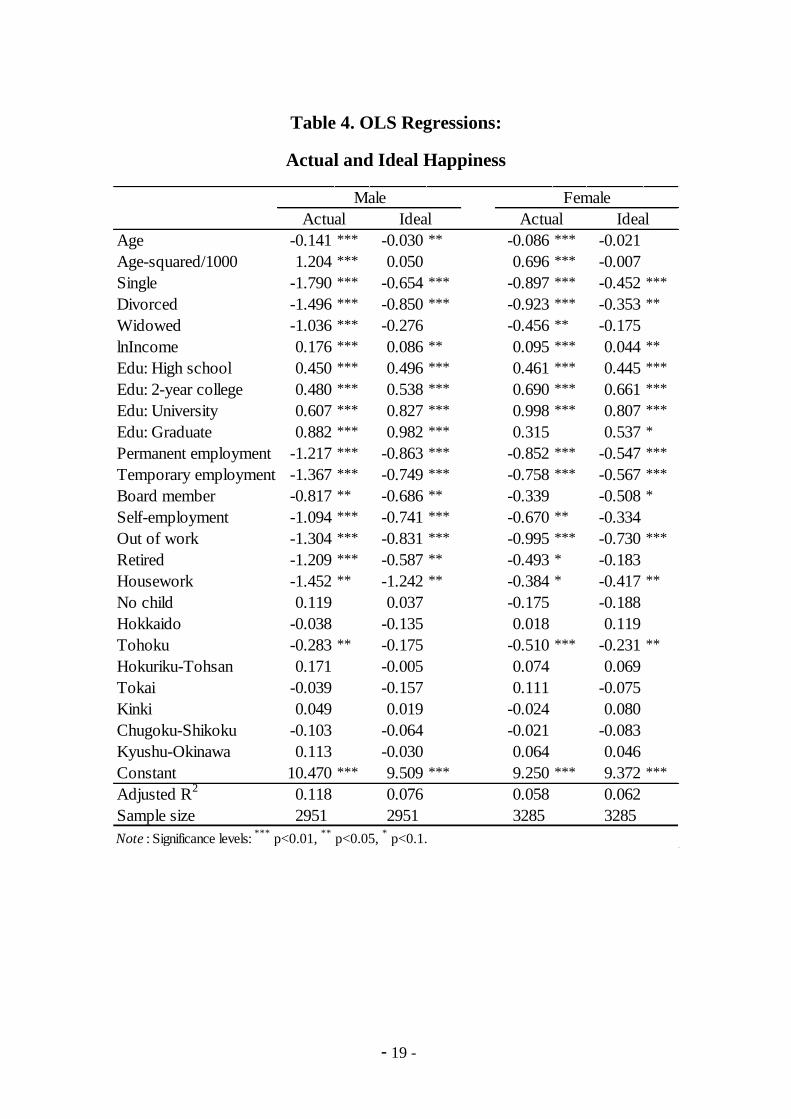
Our main interest in this analysis is not the estimated coefficients in columns (1) and
(3) on “Actual happiness” as such, but rather the relationship of these to their
counterparts in columns (2) and (4), where we consider an analogous regression for
“Ideal happiness”. The coefficients in this second regression show which variables are
correlated with how happy the individual would ideally like to be. We argue that this is
analogous to a regression of HA in our model above. The results show that the patterns
in desired happiness broadly reflect those in reported happiness. The comparison of the
- 12 -
two estimated coefficients then allows us to calculate what the pure “non-dampened”
relationship between the explanatory variables and subjective well-being would be.
Comparing the determinants of actual and ideal happiness, the coefficients on age
are negative and statistically significant in both sets of estimation results. Equally, the
estimated coefficients on single and divorced are negative and significant for both
outcome measures, being associated with both actual and ideal happiness. Both actual
and ideal happiness increase with education (although, again, not significantly so for
“graduate” for women). It is notable that the level of ideal happiness is higher amongst
the high-educated relative to the lower-educated. This finding could be considered as
providing support for the argument developed in Clark (1999), that the lower-educated
report higher levels of job satisfaction than do the higher-educated in part due to their
lower expectations. In our regression results, education does lead to higher reported
happiness, but with an effect that would have been twice as large or more had
aspirations not risen at the same time.
We can see the same broad type of result for the income variable: this is associated
with both higher actual and desired happiness. Evidence from the MIQ (Stutzer, 2004)
and more generally from the Leyden Welfare Function of Income has suggested that
income and education may well act to raise aspirations (see van Praag, 1971, and van
Praag and Kapteyn, 1973). The argument is analogous to that proposed for education.
Income is associated with greater reported well-being in the cross-section, but the
correlation would have been even higher had aspirations not risen at the same time.
With regard to labor-force status, the estimated coefficients in the actual and ideal
happiness always agree with each other. According to our interpretation, the correlation
between labour-force status and pure happiness (HP) is then larger than that revealed in
the actual happiness regressions. In the OLS regressions in Table 4, we can calculate the
pure effect as the sum of the estimated coefficients in the actual and ideal happiness
regressions. This calculation reveals that the worst labour-force status (holding income
constant) is housework, followed by unemployment for men. For women, it is rather
unemployment, with housework being ranked as somewhat better than working.
- 13 -
Last, we include region dummies in our estimations. The control group here is the
“Kanto” region, which includes the Tokyo metropolis and ten prefectures. The
“Tohoku” region attracts the lowest estimated coefficient for actual happiness for men,
and for both actual and ideal happiness for women.
Overall, the effect of education and employment is similar in sign, size and
significance across the two happiness measures. As such, our reading is that the
correlation between “pure” subjective well-being and these two variables is twice as
large as that which is revealed the reported level of subjective well-being; the other half
is attenuated by changes in aspirations.5 With respect to marital status and income, the
coefficient in the ideal happiness equation is smaller than that in the reported happiness
equation. There is therefore still some attenuation, but it is much smaller in size than
that with respect to education.
5. Conclusion
This paper has used novel Japanese cross-section data including information on both
actual happiness and the individual's ideal level of happiness. The main idea put
forward here is that the individual's reported level of happiness will reflect the gap
between what they actually receive and what the expected to receive. We estimate both
reported happiness and happiness aspirations equations, and the OLS and Ordered
Probits yield very similar results. We find in particular that education leads to both
higher reported happiness and desired happiness. This suggests that a significant part of
the happiness effect of education is cancelled out by higher aspirations: education then
does raise actual happiness but also raises expectations or aspirations about what the
individual should receive. The same pattern of results is found for income, although the
happiness attenuation effect here is smaller. We believe that these regression results
underline the importance of changing aspiration levels in determining individual
subjective well-being.
5 We have experimented with a number of different specifications here. In one, we included the log of
household income, as well as individual income. In another, we estimated actual and ideal happiness
jointly in a SURE estimation, dropping the region dummies in the ideal happiness regression. The results
(available upon request) were very similar in both of these new specifications.
- 14 -
Figure 1. Ideal Happiness minus Actual Happiness.
0%
5%
10%
15%
20%
25%
30%
-10 -9 -8 -7 -6 -5 -4 -3 -2 -1 0 1 2 3 4 5 6 7 8 9 10
- 15 -
Figure 2. Education and Happiness: Men
5.5
6
6.5
7
7.5
8
8.5
9
9.5
Jr high
school(N=440)
High school
(N=1248)2-year
college (N=353)
University
(N=843)Graduate
(N=67)
Ideal
Actual
Figure 3. Education and Happiness: Women
5.5
6
6.5
7
7.5
8
8.5
9
9.5
Jr high
school
(N=414)
High school (N=1452)
2-year college (N=987)
University (N=407)
Graduate (N=25)
Ideal
Actual
Note: The vertical bars represent the 95% confidence intervals in both figures.
- 16 -
Table 1. Variable Definitions
Variables Definition
Actual happiness Currently how happy are you, from 0 (very unhappy) to 10 (very happy).
Ideal happiness What is your desired condition, from 0 (very unhappy) to 10 (very happy).
Age Age of the respondent in years.
Marital status Dummy variables for the respondent being single,
married, divorced, widowed.
lnIncome Natural log of annual gross income (based on a 12-level categorical variable).
Educational level Dummy variables for the respondent's highest educational qualification
(Junior high school, High school, 2-year college, University, Graduate).
Employment status Permanent vs. non-permanent employment.
No child Dummy variable for the respondent having no children.
Region Japanese resion of residence.
- 17 -
Table 2. Descriptive Statistics
Variable
Mean Std. Dev. Mean Std. Dev.
Actual happiness 6.62 2.08 6.83 2.02
Ideal happiness 8.22 1.74 8.36 1.62
Age 47.79 17.82 46.89 17.30
Age-squared/1000 2.60 1.72 2.50 1.67
Married 0.70 0.46 0.67 0.47
Single 0.26 0.44 0.24 0.43
Divorced 0.02 0.15 0.04 0.19
Widowed 0.01 0.11 0.05 0.22
lnIncome 5.28 1.74 3.89 2.06
Edu: Junior high school 0.15 0.36 0.13 0.33
Edu: High school 0.42 0.49 0.44 0.50
Edu: 2-year college 0.12 0.32 0.30 0.46
Edu: University 0.29 0.45 0.12 0.33
Edu: Graduate 0.02 0.15 0.01 0.09
Permanent employment 0.54 0.50 0.44 0.50
Temporary employment 0.08 0.27 0.16 0.36
Board member 0.06 0.23 0.02 0.14
Self-employment 0.10 0.30 0.02 0.15
Out of work 0.06 0.24 0.06 0.24
Retired 0.11 0.31 0.07 0.26
Housework 0.00 0.07 0.18 0.39
In education 0.05 0.22 0.04 0.21
No child 0.32 0.47 0.29 0.46
Hokkaido 0.04 0.20 0.04 0.20
Tohoku 0.09 0.29 0.09 0.29
Kanto 0.31 0.46 0.30 0.46
Hokuriku-Tohsan 0.10 0.30 0.09 0.29
Tokai 0.13 0.33 0.12 0.33
Kinki 0.14 0.35 0.15 0.35
Chugoku-Shikoku 0.09 0.29 0.09 0.28
Kyushu-Okinawa 0.10 0.30 0.11 0.32
Note : Male (N=2951), Female (N=3285).
Male Female
- 18 -
Table 3. Ordered Probit Regressions: Actual and Ideal Happiness
Age -0.074 *** -0.022 ** -0.044 *** -0.016 *
Age-squared/1000 0.627 *** 0.053 0.359 *** 0.004
Single -0.929 *** -0.422 *** -0.456 *** -0.311 ***
Divorced -0.775 *** -0.534 *** -0.447 *** -0.191 *
Widowed -0.536 *** -0.148 -0.229 ** -0.075
lnIncome 0.087 *** 0.050 ** 0.048 *** 0.027 **
Edu: High school 0.230 *** 0.280 *** 0.226 *** 0.253 ***
Edu: 2-year college 0.249 *** 0.317 *** 0.344 *** 0.380 ***
Edu: University 0.305 *** 0.467 *** 0.505 *** 0.485 ***
Edu: Graduate 0.446 *** 0.603 *** 0.156 0.298
Permanent employment -0.598 *** -0.486 *** -0.434 *** -0.307 **
Temporary employment -0.681 *** -0.426 *** -0.380 *** -0.312 **
Board member -0.391 ** -0.384 ** -0.145 -0.277
Self-employment -0.538 *** -0.419 *** -0.333 * -0.156
Out of work -0.643 *** -0.453 *** -0.491 *** -0.396 ***
Retired -0.598 *** -0.315 ** -0.245 * -0.087
Housework -0.748 ** -0.698 ** -0.182 -0.205
No child 0.050 0.009 -0.098 -0.116
Hokkaido -0.031 -0.085 0.017 0.101
Tohoku -0.146 ** -0.100 -0.257 *** -0.154 **
Hokuriku-Tohsan 0.087 -0.009 0.049 0.039
Tokai -0.011 -0.078 0.066 -0.045
Kinki 0.022 0.023 -0.011 0.049
Chugoku-Shikoku -0.045 -0.020 -0.011 -0.051
Kyushu-Okinawa 0.070 0.004 0.038 0.035
Log pseudo-likelihood -5859.7 -4947.4 -6533.3 -5370.7
Sample size 2951 2951 3285 3285
Note : Significance levels: ***
p<0.01, **
p<0.05, * p<0.1.
Male Female
Actual Ideal Actual Ideal
- 19 -
Table 4. OLS Regressions:
Actual and Ideal Happiness
Age -0.141 *** -0.030 ** -0.086 *** -0.021
Age-squared/1000 1.204 *** 0.050 0.696 *** -0.007
Single -1.790 *** -0.654 *** -0.897 *** -0.452 ***
Divorced -1.496 *** -0.850 *** -0.923 *** -0.353 **
Widowed -1.036 *** -0.276 -0.456 ** -0.175
lnIncome 0.176 *** 0.086 ** 0.095 *** 0.044 **
Edu: High school 0.450 *** 0.496 *** 0.461 *** 0.445 ***
Edu: 2-year college 0.480 *** 0.538 *** 0.690 *** 0.661 ***
Edu: University 0.607 *** 0.827 *** 0.998 *** 0.807 ***
Edu: Graduate 0.882 *** 0.982 *** 0.315 0.537 *
Permanent employment -1.217 *** -0.863 *** -0.852 *** -0.547 ***
Temporary employment -1.367 *** -0.749 *** -0.758 *** -0.567 ***
Board member -0.817 ** -0.686 ** -0.339 -0.508 *
Self-employment -1.094 *** -0.741 *** -0.670 ** -0.334
Out of work -1.304 *** -0.831 *** -0.995 *** -0.730 ***
Retired -1.209 *** -0.587 ** -0.493 * -0.183
Housework -1.452 ** -1.242 ** -0.384 * -0.417 **
No child 0.119 0.037 -0.175 -0.188
Hokkaido -0.038 -0.135 0.018 0.119
Tohoku -0.283 ** -0.175 -0.510 *** -0.231 **
Hokuriku-Tohsan 0.171 -0.005 0.074 0.069
Tokai -0.039 -0.157 0.111 -0.075
Kinki 0.049 0.019 -0.024 0.080
Chugoku-Shikoku -0.103 -0.064 -0.021 -0.083
Kyushu-Okinawa 0.113 -0.030 0.064 0.046
Constant 10.470 *** 9.509 *** 9.250 *** 9.372 ***
Adjusted R2
0.118 0.076 0.058 0.062
Sample size 2951 2951 3285 3285
Note : Significance levels: ***
p<0.01, **
p<0.05, * p<0.1.
Male Female
Actual Ideal Actual Ideal
- 20 -
Appendix A. Questionnaire
Actual and Ideal Happiness Questions:
1) Currently, how happy are you? Please score the degree of your happiness between 10
(very happy) and 0 (very unhappy).
2) What is your desired condition when 10 is “very happy”, and 0 is “very unhappy.
Please score your desired condition.
Demographic Questions:
3) Please circle your sex.
4) Please tell us your age at the time of the survey.
5) Please tell us your relationship with your family members. Do you have a partner?
(regardless of legal status)
6) Please indicate your own approximate annual income (including tax).
7) What is the highest educational level that you have attained?
8) Please indicate your employment status.
9) How many children do you have? Please tell us the number of children regardless of
whether or not they are dependent or independent, and living together or living
separately.
- 21 -
Appendix B. Correlation Matrices
Correlation Matrix: Men
Variable Actual happiness Ideal happiness Age Married Single Divorced Widowed lnIncome Jr high school High school 2-year college University Graduate Permanent Temporary
Ideal happiness 0.47
Age 0.01 -0.14
Married 0.21 0.04 0.61
Single -0.17 -0.01 -0.67 -0.92
Divorced -0.09 -0.07 0.00 -0.23 -0.09
Widowed -0.05 -0.05 0.15 -0.18 -0.07 -0.02
lnIncome 0.13 0.06 0.36 0.50 -0.52 -0.01 -0.01
Edu: Jr high school -0.09 -0.14 0.01 -0.12 0.09 0.04 0.06 -0.34
Edu: High school -0.01 -0.02 -0.02 -0.02 0.02 0.01 -0.01 -0.01 -0.36
Edu: 2-year college 0.00 0.00 -0.05 0.00 0.00 0.00 -0.02 0.05 -0.15 -0.32
Edu: University 0.07 0.11 0.06 0.10 -0.09 -0.03 -0.02 0.22 -0.26 -0.54 -0.23
Edu: Graduate 0.04 0.05 -0.04 0.01 0.00 -0.02 -0.02 0.07 -0.06 -0.13 -0.06 -0.10
Permanent employment 0.04 0.07 -0.24 0.05 -0.03 -0.01 -0.06 0.40 -0.25 0.03 0.05 0.10 0.08
Temporary employment -0.08 -0.04 -0.04 -0.13 0.13 0.03 0.02 -0.08 0.11 0.00 -0.01 -0.08 -0.02 -0.31
No child -0.13 0.01 -0.65 -0.82 0.87 -0.01 -0.06 -0.46 0.07 0.00 0.02 -0.07 0.01 0.00 0.11
- 22 -
Correlation Matrix: Women
Variable Actual happiness Ideal happiness Age Married Single Divorced Widowed lnIncome Jr high school High school 2-year college University Graduate Permanent Temporary
Ideal happiness 0.48
Age -0.05 -0.14
Married 0.10 0.06 0.42
Single -0.05 0.00 -0.65 -0.80
Divorced -0.08 -0.04 0.03 -0.29 -0.11
Widowed -0.05 -0.09 0.33 -0.33 -0.13 -0.05
lnIncome 0.00 0.01 0.12 -0.07 0.00 0.10 0.06
Edu: Jr high school -0.07 -0.12 0.06 -0.14 0.07 0.02 0.14 -0.16
Edu: High school -0.04 -0.05 0.08 0.04 -0.05 0.02 0.01 -0.01 -0.34
Edu: 2-year college 0.04 0.08 -0.03 0.09 -0.06 -0.02 -0.06 0.06 -0.25 -0.58
Edu: University 0.08 0.08 -0.11 -0.04 0.08 -0.02 -0.06 0.09 -0.14 -0.33 -0.25
Edu: Graduate -0.01 0.01 -0.04 -0.01 0.03 -0.02 -0.02 0.06 -0.03 -0.08 -0.06 -0.03
Permanent employment -0.02 0.05 -0.24 -0.11 0.14 0.10 -0.11 0.50 -0.19 0.00 0.07 0.09 0.06
Temporary employment -0.01 -0.02 0.03 0.07 -0.05 -0.03 -0.04 0.08 0.00 0.02 0.02 -0.05 -0.04 -0.38
No child -0.04 0.01 -0.62 -0.70 0.86 -0.06 -0.12 0.01 0.04 -0.07 -0.04 0.11 0.05 0.14 -0.05
- 23 -
References
Albert, C., and Davia, M. A. (2005). “Education, wages and job satisfaction”. Paper
presented at the Epunet Conference 2005, Colchester.
Becchetti, L., Castriota, S., and Londono, D. (2006). “Climate, happiness and the Kyoto
protocol”, CEIS Working Paper.
Binder, M., and Coad, A. (2011). “From Average Joe's happiness to Miserable Jane and
Cheerful John: Using quantile regressions to analyze the full subjective well-being
distribution”. Journal of Economic Behavior and Organization, 79, 275-290.
Blanchflower, D.G., and Oswald, A.J. (1998). “What Makes an Entrepreneur?” Journal
of Labor Economics, 16, 26-60.
Castriota, S., (2006). “Education and happiness: A further explanation to the Easterlin
Paradox”, mimeo.
Clark, A., (1999). “Are wages habit-forming? Evidence from micro data”. Journal of
Economic Behavior and Organization, 39, 179–200.
Clark, A.E., Frijters, P., and Shields, M. (2008). “Relative Income, Happiness and
Utility: An Explanation for the Easterlin Paradox and Other Puzzles”. Journal of
Economic Literature, 46, 95-144.
Clark, A. E., & Oswald, A. J. (1996). “Satisfaction and Comparison Income”. Journal
of Public Economics, 61, 359–381.
Clark, A.E., Oswald, A.J., and Warr, P.B. (1996). “Is Job Satisfaction U-shaped in
Age?” Journal of Occupational and Organizational Psychology, 69, 57-81.
Clark, A.E., Senik, C., and Yamada, K. (2013). “The Joneses in Japan: Income
Comparisons and Financial Satisfaction”. University of Osaka, ISER Discussion
Paper No. 0866.
Cunado,J., and Gracia F. P., (2012). “Does Education Affect Happiness? Evidence for
Spain”, Social Indicators Research, 108, 185–196.
Di Tella, R., MacCulloch, R. J., and Oswald, A. J. (2001). “Preferences over inflation
and unemployment: Evidence from surveys of happiness”. American Economic
Review, 91, 335–341.
Florida, R., Mellander, C., and Rentfow, P. J. (2013). “The happiness of cities”.
Regional Studies, 47, 613-627.
Ferrer-i-Carbonell, A. and Frijters, P. (2004). “How important is methodology for the
estimates of the determinants of happiness?”, Economic Journal, 114, 641–59.
Gilboa, I., and Schmeidler, D. (2001). “A Cognitive Model of Individual Well-Being”.
- 24 -
Social Choice and Welfare, 18, 269-288.
Hickson, H., and Dockery, A. M. (2008). “Is ignorance bliss: Exploring the links
between education, expectations and happiness”, 37th Australian Conference of
Economists, Gold Coast.
Inglehart, R., and Klingemann, H. (2000). “Genes, culture, democracy and happiness”.
In E. Diener and E. Suh (Eds.), Subjective well-being across cultures. Cambridge,
MA: MIT Press.
Klein, S.M. and Maher, J.R. (1966). “Education Level and Satisfaction with Pay”.
Personnel Psychology, 19, 195-208.
Layard, R. (2005). “Happiness: Lessons From a New Science”. New York and London:
Penguin.
Layard, R., Clark, A.E., and Senik, C. (2012). “The causes of happiness and misery”. In
J. Helliwell, R. Layard, and J. Sachs (Eds.), World Happiness Report. New York:
Columbia Earth Institute.
McBride, M. (2010). “Money, Happiness and Aspirations: An Experimental Study”.
Journal of Economic Behavior & Organization, 74, 262-276.
Nolen-Hoeksema, S., and Rusting, C.L. (1999). “Gender differences in well-being”. In
D. Kahneman, E. Diener, and N. Schwartz (Eds.), Well-being: The foundations of
hedonic psychology. New York: Russell Sage Foundation.
Oreopoulos, P. (2007). “Do dropouts drop out too soon? Wealth, health and happiness
from compulsory schooling.” Journal of Public Economics, 91, 2213-2229.
Oreopoulos, P., and Salvanes, K. (2011). “Priceless: the Nonpecuniary Benefits of
Schooling”. Journal of Economic Perspectives, 25, 159-184.
Sano, S., and Ohtake, F. (2007). Rôdô to Kôfukudo (Employment and Happiness). Nihon
Rôdô Kenkyû Zasshi, 558, 4–18.
Stutzer, A. (2004). “The role of income aspirations in individual happiness”. Journal of
Economic Behavior and Organization, 54, 89-109.
van Praag, B.M. (1971). “The Welfare Function of Income in Belgium: An Empirical
Investigation”. European Economic Review, 2, 337-369.
van Praag, B.M., and Kapteyn, A. (1973). “Further Evidence on the Individual Welfare
Function of Income: An Empirical Investigation in the Netherlands”. European
Economic Review, 4, 33-62.
Veenhoven, R. (1996). “Developments in satisfaction research”. Social Indicators
Research, 37, 101–160.
Warr, P. (1992). “Age and Occupational Well-Being”. Psychology and Aging, 7, 37-45.