Rideau River
16
2012 A report on the environmental condition of the Lower Rideau River LOWER RIDEAU Subwatershed Report
Transcript of Rideau River
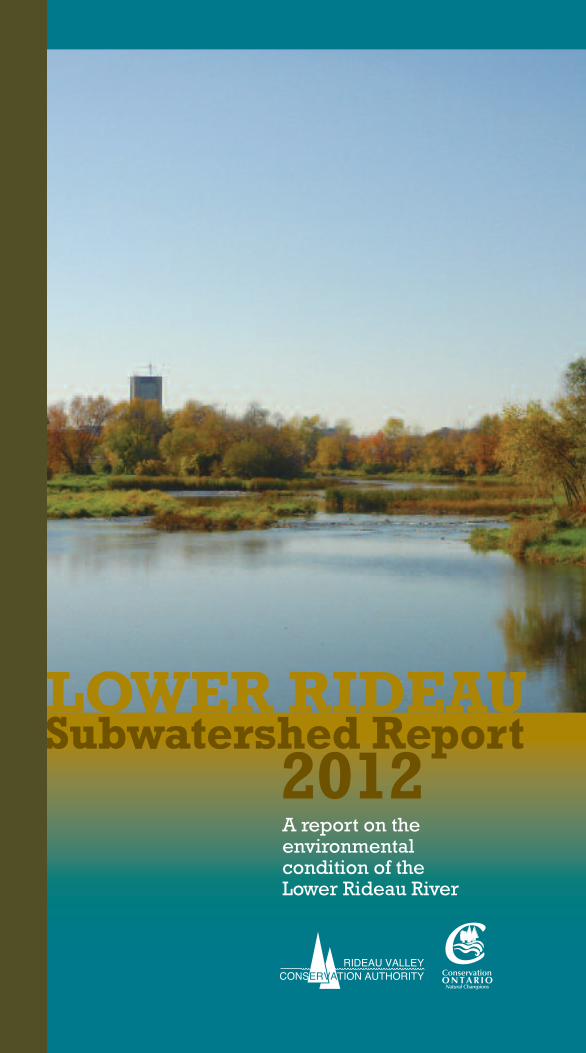
2012A report on theenvironmentalcondition of theLower Rideau River
LOWER RIDEAUSubwatershed Report

2
Welcome to the Lower Rideau Subwatershed
Drainage Area765 square kilometres
Length of River70.6 kilometres
Length of tributarystreams/creeks: 1,149 kilometres
Catchment areas• Arcand Drain
27.0 km2
• Barrhaven Creek 7.0 km2
• Black Rapids Creek 16.7 km2
• Brassils Creek 67.5 km2
• Cranberry Creek 52.0 km2
• McDermott Drain 14.4 km2
• Mosquito Creek 41.1 km2
• Mud Creek 57.6 km2
• Murphy Drain 43.1 km2
• Nepean Creek 10.7 km2
• Rideau River — Hogs Back 37.5 km2
• Rideau River – Kars 108.8 km2
• Rideau River – Long Island 66.7 km2
• Rideau River – Rideau Falls 28.4 km2
• Sawmill Creek 20.7 km2
• Stevens Creek 165.5 km2
A watershed isan area of landthat drains to a
river, lake or stream. Inthe larger Rideauwatershed, there are sixmajor subwatersheds:Jock River, KemptvilleCreek, Lower Rideau,Middle Rideau, RideauLakes and Tay River.
This report looks atone subwatershed –the Lower Rideau which
is the final subwatershed through which the Rideau flows. The City ofOttawa occupies the confluence of the Rideau River and the OttawaRiver. Consequently, the Lower Rideau is the most densely-populatedand urban of all the Rideau subwatersheds. It shows the full array oftransportation, housing, hard surfaces and land uses — all of which putpressures on our local streams. Starting at Burritts Rapids (and the junction with the Middle Rideau
subwatershed), the Lower Rideau flows gently through the farmingcommunities in North Grenville and the former Osgoode and RideauTownships, past the burgeoning suburbs of Manotick, Barrhaven, andRiverside South before splitting from the Rideau Canal at Hogs Back. Withthe force of the Hogs Back Falls behind it, the river pushes through theheart of the city and over the Rideau Falls to the Ottawa River andeventually the St. Lawrence and the Atlantic Ocean.
What We Monitor and Why?The Rideau Valley Conservation Authority (RVCA) goal is for clean water,healthy shorelines and sustainable land use. Monitoring helps us seetrends over time, focus resource management actions where they can dothe most good and evaluate the effectiveness of watershed managementpolicies and programs. This report, together with more detailed catchment reports prepared
for each of the 16 catchments of the Lower Rideau (available atwww.rvca.ca), is a snapshot of 2011 conditions, using four key indicatorsof watershed health: water quality, forest cover, riparian cover andwetlands. Previous data on water quality and forest cover is used, whereapplicable, for comparison with current conditions.
Lower Rideau SubwatershedThe RideauWatershed

3

4
Water Quality

5
How is water quality measured?Our water quality ratings are made up of many water quality parameters blended together to allowwater quality to be communicated by a single rating of “very poor, poor, fair, good or very good.”This is based on the Canadian Council of Ministers of the Environment Water Quality Index (CCMEWQI). Ratings are based on how often, how many and by how much sample results for eachparameter exceed established water quality guidelines.
What is measured?The final water quality rating is based on analysis of 24 of the following parameters from manywater samples taken at the same point along the Lower Rideau River and its tributaries over a sixto12 year period.
• Nutrients (total phosphorus, total Kjeldahl nitrogen and nitrate); excessive nutrients may resultin excessive vegetation and reduced dissolved oxygen available for the aquatic community
• E. coli as an indicator of the presence of bacteria originating from human or animal waste• Metals (including lead, iron and copper) which may pose a health risk to aquatic life andindicate the presence of pollution
• Additional chemical/physical parameters (such as pH, alkalinity and total suspended solids)which may indicate stresses to aquatic life and stream function
The change in the water quality rating over time arrows on the map compare Water Quality Indexvalues for the period from 2006 to 2011 with values from the 2000 to 2005 period.
Water Quality
1. Water quality sampling on Sawmill Creek 2. Water quality sampling on Stevens Creek
1 2
6
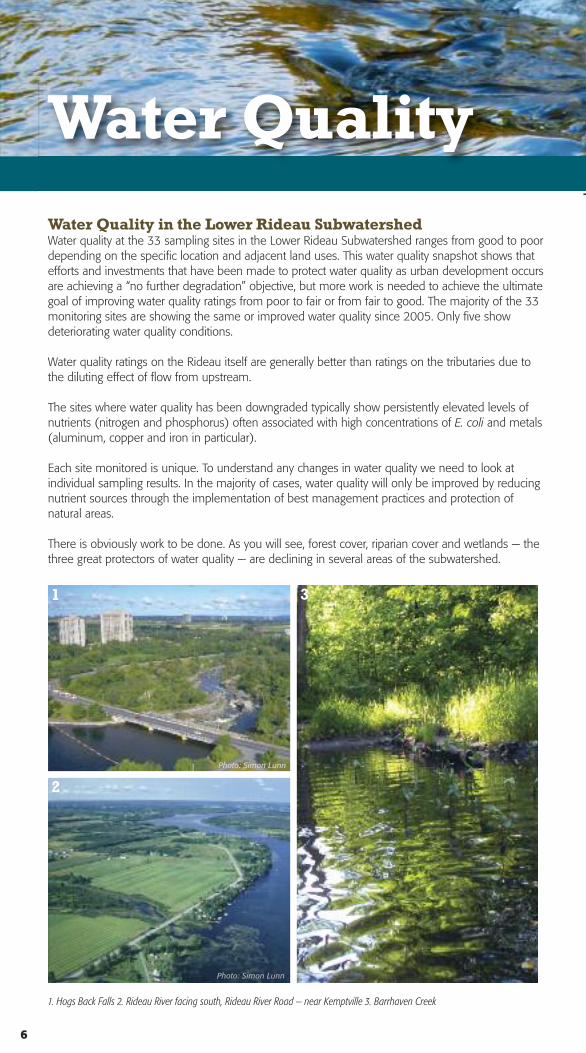
Water QualityWater Quality in the Lower Rideau SubwatershedWater quality at the 33 sampling sites in the Lower Rideau Subwatershed ranges from good to poordepending on the specific location and adjacent land uses. This water quality snapshot shows thatefforts and investments that have been made to protect water quality as urban development occursare achieving a “no further degradation” objective, but more work is needed to achieve the ultimategoal of improving water quality ratings from poor to fair or from fair to good. The majority of the 33monitoring sites are showing the same or improved water quality since 2005. Only five showdeteriorating water quality conditions.
Water quality ratings on the Rideau itself are generally better than ratings on the tributaries due tothe diluting effect of flow from upstream.
The sites where water quality has been downgraded typically show persistently elevated levels ofnutrients (nitrogen and phosphorus) often associated with high concentrations of E. coli and metals(aluminum, copper and iron in particular).
Each site monitored is unique. To understand any changes in water quality we need to look atindividual sampling results. In the majority of cases, water quality will only be improved by reducingnutrient sources through the implementation of best management practices and protection ofnatural areas.
There is obviously work to be done. As you will see, forest cover, riparian cover and wetlands — thethree great protectors of water quality — are declining in several areas of the subwatershed.
Photo: Simon Lunn
1. Hogs Back Falls 2. Rideau River facing south, Rideau River Road — near Kemptville 3. Barrhaven Creek
1
2
3
Photo: Simon Lunn

7
Settlement areas will likely increase. The poor water quality ratings are in predominantly agriculturalcatchments showing us where water quality restoration efforts should be focused. The ratings in themore recently-urbanized portions of the subwatershed (north of Manotick) are unchanged, possiblyindicating that stormwater management policies and practices in new development have been effective.
Our more detailed catchment reports give us a more precise idea of where stewardship efforts attree planting, wetland restoration and shoreline naturalization could make a difference in turning thedown arrows around (see page 4 for details).
Why maintain good water quality?
Four main reasons: 1. Healthy water is fundamental to healthy families and communities2. A lot of individuals and businesses (particularly agricultural) rely on a natural source of goodclean water for farming, fishing, boating, water sports, wildlife viewing and hiking/walking besidethe river
3. Good water quality promotes a diverse and healthy aquatic ecosystem 4. In addition, the Rideau flows through the Nation’s Capital and is a key piece of the identity andthe look of the City of Ottawa
Water quality sampling
8
Forest Cover

The Benefits of Forest CoverForests are important parts of a healthy subwatershed because of their critical role in the watercycle. Runoff from forested lands into streams after a rain or snowmelt is significantly less in bothvolume and peak flow than runoff from an unforested area. Trees help protect streams from stormor runoff erosion and make subwatersheds more resilient to climate change’s expected heavy,irregular storms and unseasonal precipitation.
In addition, forests:• Clean the air• Clean water seeping into the ground• Encourage infiltration of stormwater• Harbour wildlife habitat• Give us wood and wood products• Create natural buffers for wind and noise in urban settings
Each tree is a little environmental cleaning station that keeps on providing huge ecological andeconomic services for the people of the Lower Rideau for up to 80 years and more.
Experts believe that a minimum forest cover of 30 percent is needed to sustain the naturalbiodiversity and environmental services mentioned above. Since the middle of the last century, thegeneral trend across much of Eastern Ontario has been an increase in forest cover (partly natural,partly reforestation) mainly on large sections of marginal farmlands that have since been abandoned.
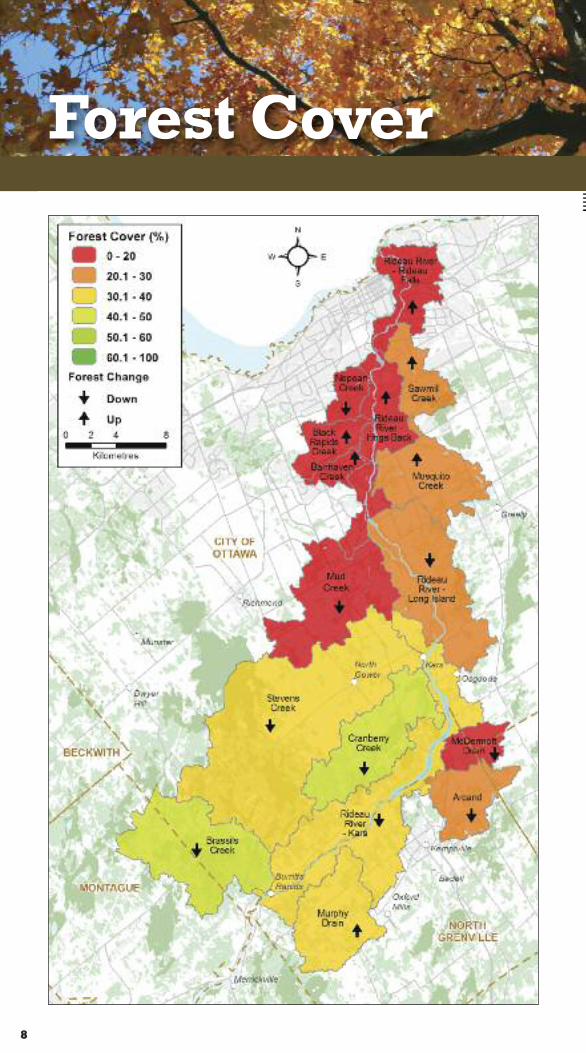
Existing Forest Cover in the Lower Rideau SubwatershedForest cover in the catchments of the Lower Rideau have been calculated from 2008 DRAPEimagery and compared to previous work done by MNR in 2002. Forest cover ranges from a high ofabout 45 percent in the Brassils Creek catchment and 42 percent in the Cranberry Creek
catchment to a low of less than 20 percent in seven catchments.For the Lower Rideau as a whole, forest cover was calculated tobe 245 square kilometres (32 percent) in 2002 and 220 squarekilometres (28.7 percent) in 2008 (representing a 3.3 percentdecrease in forest cover). The Lower Rideau Watershed Strategy(2005) recommends maintaining or increasing forest cover witha long-term target of between 35 to 40 percent forest cover inthe Lower Rideau Subwatershed. The largest percentagedeclines in forest cover occurred in the Cranberry Creekcatchment (-10.4 percent), the Arcand catchment (-8.6 percent)and the Stevens Creek catchment (-5.6 percent) and the RideauRiver-Kars catchment (-5.3 percent). The noticeable decline inforest cover and its relation to water quality over a relatively shortperiod of time in all but one catchment south of Manotick is atrend to watch.
Greatest increases in forest cover were in Sawmill Creek (+2.5 percent), Mosquito Creek (+2.4 percent) and RideauRiver – Hogs Back catchment (+2.4 percent).
9
Forest Cover
Forest Cover by Catchment
Arcand Drain 23.3%Barrhaven Creek 7.8%Black Rapids Creek 10.3%Brassils Creek 44.5%Cranberry Creek 41.6%McDermott Drain 11.1%Mosquito Creek 20.7%Mud Creek 19.7%Murphy Drain 39.6%Nepean Creek 16.2%Rideau River — Hogs Back 13.3%Rideau River – Kars 30.1%Rideau River – Long Island 21.8%Rideau River — Rideau Falls 7.1%Sawmill Creek 24.8%Stevens Creek 36.5%

10
Wetlands

The Benefits of WetlandsWetlands are nature’s flood control and water supply reservoirs — places for the temporary storageof runoff from rain and snowmelt. Thanks to our Rideau wetlands, peak flows during floods arelower and low flows are sustained during dry weather. Groundwater supplies are replenished.
RVCA hydrologists estimate that the existing wetlands across the entire Rideau watershed areresponsible for a peak flow (and its resulting flood damage) that is about 10 percent lower thanwhat we would see without the wetlands!
Wetlands provide habitat for many common and rare plants and animals as well as fishing, huntingand recreational opportunities like canoeing and bird watching. And wetlands are becomingincreasingly valued for the ecological goods and services they provide such as water supply, waterregulation, water cleansing and climate regulation. These services have been valued at $247 perperson per year in a recent Ontario study (Natural Credit — Estimating the Value of Natural Capitalin the Credit River Watershed, November 2009). In other words, wetlands do for free what wewould otherwise have to pay millions of dollars to do through technology and infrastructure.
Wetlands are important green infrastructure that provide major benefits. Conserving or restoringwetlands is right up there with tree planting and shoreline naturalization as simple, cost-effectivemeasures with huge watershed management benefits.
Existing Wetlands in the Lower Rideau SubwatershedArcand, Brassils, Stevens and Cranberry catchments are the only four with more than 15 percent
wetland cover. The other 12 catchments are below 15 percentwith most below 10 percent and five at one percent or less.
Wetlands in the Lower Rideau (apart from larger wetlands likethose in the Marlborough Forest) are mainly small, oftenisolated and vulnerable lowlands either along a watercourse orin small pockets upstream. Land development of many kindscan threaten the future of small, isolated wetlands. Because oftheir inherent value to the watershed and the community,existing wetlands wherever they occur in the Lower Rideau areprime candidates for protection and rehabilitation.
The 2005 Lower Rideau Watershed Strategy suggests a target of“no net loss of wetland cover” on an individual catchment basis.The balancing act is to work towards retaining as much wetlandas possible using a combination of regulations, incentives andwilling landowners. These wetland statistics will be reviewed in2018 in our next report.
11
Wetlands
Wetland Cover by Catchment
Arcand Drain 16.0%Barrhaven Creek 0.4%Black Rapids Creek 1.3%Brassils Creek 38.1%Cranberry Creek 28.3%McDermott Drain 5.9%Mosquito Creek 6.7%Mud Creek 2.0%Murphy Drain 5.8%Nepean Creek 0.3%Rideau River — Hogs Back 0.5%Rideau River – Kars 14.9%Rideau River – Long Island 5.1%Rideau River — Rideau Falls 0.1%Sawmill Creek 10.7%Stevens Creek 25.6%

12
Riparian Cover

13
Riparian CoverThe Benefits of Riparian CoverThe riparian or shoreline zone is that special area where the land meets the water. Keeping well-vegetated shorelines is a primary goal because of their importance in preserving water quality andsupporting healthy aquatic habitats. Natural shorelines intercept runoff-borne sediments, pesticidesand fertilizers that could reduce water quality and harm fish habitat in streams. Well-establishedvegetative cover protects streambanks from erosion, improves habitat for fish by shading andcooling the water and provides protective cover for birds and other wildlife that feed and rearyoung near water.
A recommended riparian cover target in the Great Lakes region is 30 metres of natural vegetationon both sides of a stream for at least 75 percent of its length. This is obviously not achievable onshorelines with established agricultural, residential or commercial uses adjacent to the stream. The
Lower Rideau Strategy (2005) set riparian cover targets for theRideau tributaries at 50 percent of the riparian corridor with a15 to 30 metre band of woody vegetation (catchments wherethis target is being met are shown in green on the map).
Existing Riparian Cover in the Lower Rideau SubwatershedRiparian cover indices (expressed as a percentage of thecatchment streams with 30-metre wide buffers of naturalvegetative cover) are given for each of the 16 catchments ofthe Lower Rideau. Cover varies from a high of 88 percent in theBrassils Creek catchment to less than 30 percent in a couple ofcatchments in the Long Reach. The red and orange zonescoincide with zones of high residential development and heavyshoreline disturbance. Riparian cover increases again throughthe urban core of Ottawa due in large measure to the significantamount of public land (municipal and federal) that is kept in asemi-natural state as parkland.
Riparian cover on 1. Mud Creek 2. Mosquito Creek
1 2
Riparian Cover by Catchment
Arcand Drain 41.2%Barrhaven Creek 52.7%Black Rapids Creek 35.2%Brassils Creek 87.9%Cranberry Creek 62.6%McDermott Drain 26.5%Mosquito Creek 36.4%Mud Creek 26.6%Murphy Drain 44.3%Nepean Creek 44.3%Rideau River — Hogs Back 35.4%Rideau River – Kars 55.3%Rideau River – Long Island 25.7%Rideau River — Rideau Falls 44.0%Sawmill Creek 60.4%Stevens Creek 53.1%

14
We’re lucky in the Lower Rideau subwatershed — there is little heavy industry or major pointsource pollution. What we are up against is a slow, cumulative loss of woodland, natural shorelineand wetland as a result of the wear and tear of suburban life and riparian property management.We’re lucky because these losses can slowly turn into gains by giving landowners andcommunities the means to add these missing elements back into the landscape.
Working TogetherRVCA and other environmental groups are eager to work with you to make your part of the LowerRideau more environmentally friendly and less susceptible to natural hazards (flooding, erosion,climate change). Working together, we can combine technical expertise and experience with grantprograms and personnel to create real, tangible, on-the-ground improvements for your local streams.
The types of projects that have worked well in the past include:
Lower Rideau
Working Together — We are all part of the solution!
• Sustainable erosion control using natural materials
• Shoreline planting of native trees and shrubs
• Large scale tree planting onretired/abandoned land
• Shoreline buffers for habitat and erosion control
• Wetland protection buffers
• Wetland restoration • Invasive species removal• Garbage clean ups• Livestock restriction/alternate watering systems
• Land retirement • Fish habitat enhancement projects• Migratory fish obstruction removals
1. Shoreline planting 2. Mosquito Creek 3. Fish habitat enhancement at Chapman Mills Conservation Area 4. Sawmill Creek 5. Young seedling from RVCA’s tree planting program
1
2
3 4
5

15
How can you get involved?This report identifies some areas of the Lower Rideau subwatershed where water quality andnatural habitat conditions are less than ideal. These areas, along with others across thesubwatershed, can be improved through work by community associations, environmental groups,families, individuals and collaboratives of all sorts. The following stewardship programs may be ofinterest to Lower Rideau municipalities and residents:
• For shoreline naturalization, contact the RVCA Shoreline Naturalization Program Manager at613-692-3571
• For tree planting, contact the RVCA Forestry Manager at 613-692-3571 • For farm and clean water projects, contact the RVCA Rural Clean Water Manager at 613-692-3571 • For environmental farm projects, contact Ontario Soil & Crop Improvement Association at 1-800-265-9751
• For wetland care projects, contact Ducks Unlimited Canada at 1-866-389-0418• For fish and wildlife projects, contact MNR Kemptville at 613-258-8426• To volunteer for City Stream Watch (stream assessment/restoration activities), [email protected]
• For possible donation of land to an environmental agency for keeping in its natural state inperpetuity, contact the Executive Director, Rideau Valley Conservation Foundation at 613-692-3571
• For carbon neutral projects, contact the Executive Director, Rideau Valley ConservationFoundation at 613-692-3571
If you are planning projects on your property, be sure to check with RVCA to see if permits arerequired. Checking first can save you from making costly mistakes. If you are thinking of buyingproperty, we can let you know if the property is likely to be affected by Authority policies andregulations. Working together, we can save a lot of stress, time and money.
1. Rideau Falls 2. Water quality sampling at Black Rapids Creek 3. Brassils Creek 4. Water quality monitoring
1
2 3 4
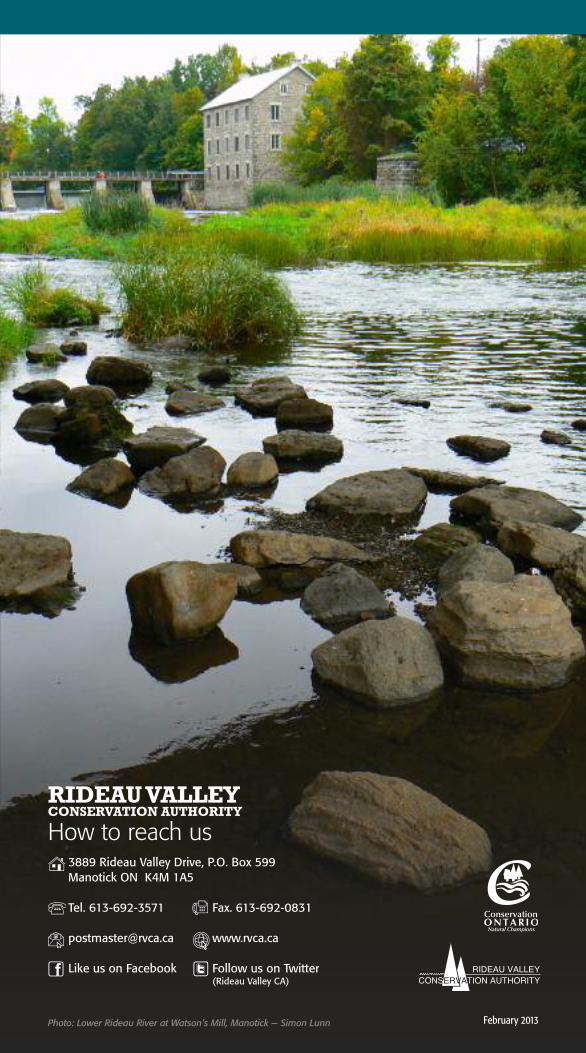
February 2013
3889 Rideau Valley Drive, P.O. Box 599Manotick ON K4M 1A5
Tel. 613-692-3571 Fax. 613-692-0831
[email protected] www.rvca.ca
Like us on Facebook Follow us on Twitter (Rideau Valley CA)
How to reach us
RIDEAU VALLEYCONSERVATION AUTHORITY
Photo: Lower Rideau River at Watson’s Mill, Manotick — Simon Lunn


![The bridge on the river Kwaï : film · The Bridge of the river Kwaï (1990) Paris : Hatier ; Paris : distrib. Hatier , 1990 (cop) Enregistrements (2) The river Kwai march. - [24]](https://static.fdocuments.fr/doc/165x107/611a5384e2db5310c917d28a/the-bridge-on-the-river-kwa-film-the-bridge-of-the-river-kwa-1990-paris.jpg)