· -rpp (ñîfã) TPP) TPP 1951 1964 MOSS Y 1997 1980 TPP 1981 03 ( rtB (titl ( 2009 2,500 fib)

RESEARCH ARTICLE
Quantitative analysis of fine dust particles on moss surfacesunder laboratory conditions using the exampleof Brachythecium rutabulum
Bilitis Désirée Vanicela1 & Martin Nebel2 & Marielle Stephan1& Christoph Riethmüller1 & Götz Theo Gresser1
Received: 3 July 2020 /Accepted: 27 April 2021# The Author(s) 2021
AbstractThe identification of a model organism for investigations of fine dust deposits on moss leaflets was presented. An optical methodwith SEM enabled the quantitative detection of fine dust particles in two orders of magnitude. Selection criteria were developedwith which further moss species can be identified in order to quantify the number of fine dust particles onmoss surfaces using thepresented method. Among the five moss species examined, B. rutabulum had proven to be the most suitable model organism forthe method presented here. The number of fine dust particles on the moss surface of B. rutabulum was documented during 4weeks of cultivation in the laboratory using SEM images and a counting method. The fine dust particles were recorded in theorder of 10 μm–0.3 μm, divided into two size classes and counted. Under laboratory conditions, the number of particles of thefine fraction 2.4 μm–0.3 μm decreased significantly.
Keywords Moss . Bryophytes . Brachythecium rutabulum . Particle counting . Fine dust particle . SEM
Introduction
Particulate matter (PM) is a contributing factor, responsiblefo r up to 45 ,000 dea th s pe r yea r i n Ge rmany(Umweltbundesamt 2018). It describes all particles smallerthan 10.0 μm. The particulate matter is divided into fractions,according to the size of the particles: the “coarse fraction”(10.0 μm > PM 10 >2.5 μm), the “fine fraction” (2.5 μm >PM 2.5 > 0.1 μm), and the “ultrafine fraction” (< 0.1 μm)(Umweltbundesamt 2018). The main sources of particulatematter are traffic (exhaust gases, tire, brake, and road surfaceabrasion), heating, industrial emissions and agriculture(Umweltbundesamt 2018). The measurement method inGermany is carried out via so-called active collectors, accord-ing to the standard method established by the EuropeanCommittee for Standardisation (CEM). The outside air is
passed through a size-selective sample inlet at a known con-stant flow rate. The PM fraction of interest is collected on afilter for a known nominal duration of 24 h. The mass of thePM material is determined by weighing the filter before andafter collection of the dust under predetermined constant con-ditions (DIN EN 12341 2014). The measuring stations in ur-ban environments collect only data about PM 10 and PM 2.5without further differentiation. Data about the weight and notabout the number of particles is recorded (Stadtklima-Stuttgart2020). The limit value recommended by the WHO only takesinto account the weight and not the number of particles pervolume (Umweltbundesamt 2020a, 2020b, 2020c). Althoughthe weight of the small fraction and ultra-fine fraction particlesis much lower, the total number of particles is much highercompared to the particles of the coarse fraction (Tittarelli et al.2008). The fine and ultra-fine particles in particular are re-sponsible for the health consequences of particulate pollution(Spektrum.de 2020). The available scientific data is still veryincomplete today.
Particulate matter is deposited on the surfaces of plants, main-ly on the leaves (Zheng and Li 2019;Kappis et al. 2007).Mosses,unlike flowering plants, have only a very thin layer of wax(cuticle) on the surface of their leaflets; therefore, they are ableto absorb water and nutrients over the whole surface area. Theyaremore exposed to environmental influences on account of their
Responsible Editor: Philippe Garrigues
* Bilitis Désirée [email protected]
1 German Institutes of Textile and Fiber Research, Körschtalstraße 26,73770 Denkendorf, Germany
2 University of Bonn, Regina-Pacis-Weg 3, D-53113 Bonn, Germany
https://doi.org/10.1007/s11356-021-14218-5
/ Published online: 15 May 2021
Environmental Science and Pollution Research (2021) 28:51763–51771

very thin cuticle and have therefore been used as biomonitors forair quality for over 40 years (Ares et al. 2012). Spagnuolo et al.(2011) showed that mosses have a better ability to intercept andaccumulate airborne elements compared to other biomonitors.Adamo et al. (2007) suggested surface structures of mosses toexplain this observation. This simple and efficient method ofmoss bag monitoring which was widely used allowed the mon-itoring of a large number of pollutants. However, there is a lack ofuniform standard protocols for moss bag monitoring (Ares et al.2012). Besides the problem of missing standard protocols, theelements found in the moss samples are the result of additiveuptake and also the loss of accumulated elements throughleaching. Therefore, it is not possible to establish a linear relation-ship with the atmospheric deposition values (Ares et al. 2012).
A lot of publications show that extensive data sets were col-lected and evaluated, which show a relationship between theatmospheric concentration of numerous heavy metals and otherchemical compounds and the corresponding concentration inmoss samples. Some of the samples were collected and exam-ined in high numbers across Europe (Schröder et al. 2010a,2010b; Harmens et al. 2010, 2011, 2012). The binding and up-take of fine dust particles is facilitated by their high ion exchangecapacity (Frahm 2001; Fabian et al. 2011; Maxhuni et al. 2015).While the penetration mechanism remains unknown, Canivetet al. (2014) demonstrated the uptake of iron nanoparticle ag-glomeration as mineral water suspension with Aphanorrhegmapatens. The particles were detected inside the cell.
Observations of particulate matter deposited on moss leaf-lets have seldom been presented using SEM micrographs,until now (Hofman et al. 2017; Di Palma et al. 2017;Tretiach et al. 2011; Weinbruch 2010). Studies onBrachythecium rutabulum show a high number of fine dustparticles on the leaflets (Nebel, unpubl.).
Di Palma and colleagues investigated particulate matterdeposition on Pseudoscleropodium purum at rural, urban,and industrial sites at three locations in Europe. The sampleswere examined using SEM/EDX and evaluated, among otherfactors, with regard to the number and size of particles (DiPalma et al. 2017). Tretiach et al. (2011) investigated particu-late matter with respect to the composition and distribution ofsize fractions. This study includes particle counts on mosssurfaces for a small random sample size.
The aim of this paper is to present a method for the selec-tion of a suitable moss and the quantitative analysis of theaccount of particulate matter on its leaflet surfaces.
Methods
Collection sites of the examined mosses
Five mosses were taken from nature and examined. Themosses were all collected on the site of the German
Institutes of Textile and Fiber Research in Denkendorf(see Fig. 1) except for R. canescens, which was purchasedcommercially and had been cultivated in Kirchzarten,Germany.
Examination of particulate matter deposits on mosssurface
In preparation for the investigation with the scanning electronmicroscope (SEM), moss samples were taken turgescent di-rectly from the cultivation status in the laboratory and theindividual leaflets removed with tweezers, as completely aspossible (Dumont No. 5) and stuck onto a sample plate. Thispreparation was carried out under a binocular microscope(Wild, photomacroscopeM400). The moss leaflets were alter-nately fixed with the top and underside facing up. After dry-ing, they were coated with gold palladium (Balzers Union,SCD 040, sputtering time 40 s). Images of the moss leafletswere taken with the scanning electron microscope (HitachiTabletop Microscope TM-1000). A position in the middle ofthe leaf blade was chosen to record the image and an imagewas taken of each moss leaflet at 2000- and 3000-foldmagnification.
Cultivation of B. rutabulum in the laboratory
The moss cushion was applied to a textile surface under lab-oratory conditions (23 °C ± 1 °C, 43% ± 5% humidity, venti-lation 550 m3/h, ventilation system with filter class F9) and
Fig. 1 Locations of sample collection: (1) C. purpureus, (2)H. cupressiforme, (3) S. convolutum, and (4) B. rutabulum for part 1and (4.1) B. rutabulum for part 2; the map was derived from GoogleMaps and edited withMS Power Point, scale: 50 m. A B. rutabulummosscushion was taken from a tree trunk at 0.2-m height and distance of 21 mof a busy country road (see Fig. 2). It was on the side of the tree trunkfacing the country road in a northwesterly direction
51764 Environ Sci Pollut Res (2021) 28:51763–51771

moistened from above every 2 to 3 h, for 6 to 8 s, using veryfinely atomized demineralized water. According to EMW(2021), the ventilation system used here filters out particlesof the size range considered here with an average efficiency of95% and a minimum efficiency of 70%. As a reference, mossleaves grown in the laboratory were examined for particles(PM 10 and PM 2.5) on their surface (see Table 5). Thegrowth of the moss plants was photographed during the courseof the experiment (see Fig. 3). SEM samples were taken on theday of collection and after 2, 7, 14, 21, and 28 days of culti-vation under laboratory conditions. The sample size variesbetween 15 and 48 for the coarse fraction and 12–15 for thefine fraction (see Tables 3 and 4). The multi-stage samplepreparation process has as a consequence that the actual sam-ple size of the respective sampling is only known with a timedelay.
Counting of particulate matter particles on surfaces ofB. rutabulum in two orders of magnitude
The number of particles was determined as follows. The quan-titative evaluation was carried out manually using an image
processing program (analySIS Digital Image Analysis,Olympus Soft Imaging Solutions GmbH). The particles ofthe respective fraction were marked manually and the numberrecorded by the image processing program. The coarse andfine fractions were assessed separately.
To quantify the coarse fraction, a grid with an edge lengthof 2.5 μmwas placed over the SEM image. All particles largerthan the spaces created by the grid were counted. The imagefield was set to 100 × 100 μm.
To count the fine fraction, a grid with edge length of 10 μmwas used to delimit the field in the SEM image of 84 × 84 μmin order to find a 20 × 20μm field in which the moss surface issharply defined and the fine particles could be counted cor-rectly (see Figs. 4, 5, and 6).
The results of the count were examined statistically. Singlefactor variance analysis (ANOVA) was done with MicrosoftOffice Excel 2010.
In order to record the basic load with particulate matter inthe laboratory during the experiment, newly grown leafletswere removed from the moss cushion in the laboratory andsubjected to the same procedure (see Fig. 7). Samples weretaken on cultivation day 14, 21, and 28.
Results
Moss selection
Since the quantification of the particles is time-consuming andexpensive, a suitable moss species must be identified beforethe quantification procedure can be carried out. For this pur-pose, five moss species were identified with regard to thecriteria surface condition, preparation of the sample for mi-croscopy, visibility, and frequency of the particles on the sur-face. In the bottom row of Tables 1 and 2, the selection pro-cedure was evaluated in terms of suitability for the method.SEM micrographs were created of the surfaces of these spe-cies (see Figs. 8, 9, 10, 11, and 12). The following species
Fig. 2 Collection site of B. rutabulum. The photo was edited with MSPower Point
Table 1 Moss selection
Species C. purpureus S. convolutum R. canescens
Surface Cells quadrate, smooth, with smalllumen and thick walls, leavessmall, with recurved margin
Cells small, rounded, with papillae,very small leaves with recurvedmargin
Cells elongate quadrate, with numerouslarge papillae, medium sized leaveswith recurved margin
Preparation Difficult Difficult Easy
Particles Clearly visible, few Particles are difficult to detect dueto papillae
Particles are difficult to detect due topapillae
SEM image Fig. 8 Fig. 9 Fig. 10
Suitability for presented method →moderate suited → not suited → not suited
51765Environ Sci Pollut Res (2021) 28:51763–51771

were investigated: Ceratodon purpureus, Streblotrichumconvolutum, Racomitrium canescens,Hypnum cupressiforme,Brachythecium rutabulum.
The selection process has shown that B. rutabulum (seeFig. 12) is best suited as a model organism for the methodpresented here. Based on the results shown in Tables 1 and 2,the investigations to quantify the fine dust particles were car-ried out for B. rutabulum. In particular, the most importantpoint for the method, namely the visibility of the particles onthe moss surface, justifies this approach.
Quantification of particulate matter in two orders ofmagnitude
The results of the quantitative analysis of the particles areshown in Figs. 13 and 14. The results of the coarse and fineparticles were shown separately. The sample size showed thenumber of counted leaflets (see Tables 3 and 4).
ANOVA showed no significant difference of average num-bers of particles over the duration of the laboratory cultivation(p = 0.63 >> 0.05; F = 2.28 >> 0.7).
ANOVA showed a significant difference between themean values over the duration of the cultivation (p = 0.011>> 0.05; F = 2.33 < 3.21).
The basic load during the test in the laboratory showed thevalues in Table 5:
Discussion
The method showed both the properties of the moss leaf sur-faces and the structure and size of the fine dust particles.
The SEM images were produced using dry moss leavesthat were not turgescent. The possibility of working with
liquid nitrogen or performing critical freezing drying wasnot available. The cell walls are therefore shown arched onthe SEMmicrographs of B. rutabulum, H. cupressiforme, andC. purpureus, and the originally water-filled cell lumina havecollapsed. In R. canescens and S. convolutum, the papillae aremuch closer together than in the turgescent state (see Figs. 8,9, 10, 11, and 12).
The selection procedure revealed that due to its growthhabit, size, and shape of the leaflets, B. rutabulum was bestsuited as a model organism for the method presented here.Three of the f ive spec ies of moss inves t iga ted(C. purpureus, S. convolutum, R. canescens) showed moder-ate loads of particulate matter. In two of these species(S. convolutum, R. canescens), the fine particles are difficultto detect between the papillae, making the assessment morecomplicated. The smooth leaflets of H. cupressiforme wereeasy to examine for fine particles, but the preparation for ex-amination is difficult because the leaflets are hollow andmuchsmaller than those of B. rutabulum. The leaflets ofB. rutabulum are large and flat, with a smooth surface thatwas easy to examine under a SEM. The surface properties ofB. rutabulummade it possible to carry out a quantitative anal-ysis of the fine dust particles on the moss surface using themethod presented here. It was not possible to do the quantita-tive analysis of particles on the surfaces for the other fourmoss species with the same quality for the reasons mentionedabove. Therefore, no comparative studies on the occurrence offine dust particles on the leaflet surfaces could be carried outin this work.
The SEM that was used only guaranteed a good resolutionup to 3000-fold magnification. At this magnification, particlesof up to 0.3 μm could still be reliably identified as particulatematter. Even with microscopes that allow a higher magnifica-tion, with a particle size of less than 0.1 μm, possible
Table 2 Moss selection
Species H. cupressiforme B. rutabulum
Surface Cells elongate, narrow, smooth, leaves mediumsized, concave, weakly falcate
Cells elongate, narrow, smooth, leaves mediumsized to large, smooth to slightly plicate
Preparation Easy Easy
Particles Clearly visible, moderate number Clearly visible, numerous
SEM image Fig. 11 Fig. 12
Suitability for presented method → suited → best suited
Table 3 Sample sizes of the quantitative analysis of the coarse particles(2.5 μm–10.0 μm)
Days of cultivation Start 2 7 14 21 28
Sample size (n) 23 21 48 15 25 20
Table 4 Sample sizes of the quantitative analysis of the fine particles(0.3 μm–2.4 μm)
Days of cultivation Start 2 7 14 21 28
Sample size (n) 14 14 15 12 14 15
51766 Environ Sci Pollut Res (2021) 28:51763–51771
particulate matter cannot be clearly distinguished from cellwall formations (Nebel, unpublished).
Aboal et al. (2011) showed that particles on the moss sur-face of Pseudoscleropodium purum cannot be washed offeven by soaking and shaking with water. The irrigation ofthe moss culture in the present work was performed with finenebulization. Therefore, a possible effect of washing off theparticles by irrigation was not investigated.
No comparative study on particulate matter deposits ondifferent moss species with smooth or papillate surfaces hasbeen published to date. The assumption that papillae, whichincrease the surface area and structural strength of the leafsurface, would promote the uptake of particulate matter couldnot be confirmed within the scope of this study.
The studies conducted by Di Palma et al. (2017) and byTretiach et al. (2011) do not address the counting and degra-dation of particulate matter on living mosses. Other publica-tions include SEMmicrographs of individual moss leaves, butprovide no quantitative analyses (Fabian et al. 2011; Hofmanet al. 2017; Weinbruch 2010).
Manual counting, with the aid of the image processingprogram, reduces errors in the system and increases the reli-ability of subjective counting.
Fig. 3 Extract from the photo documentation of the cultivation ofB. rutabulum in the laboratory, scale: 2 cm
Fig. 4 Schematic representation of the counted area. The SEM imageswere always taken in the area of the leaf blades (hatched area here). TheSEM images for counting the coarse particles are 100 × 100 μm. TheSEM images for counting the fine particles were 84 × 84 μm; here thecounted area was further limited to 20 × 20 μm (square with thick frameline). The graphic was designed with inkscape and MS Power Point
Fig. 5 SEM image of 2000 timesmagnification ofB. rutabulum. The gridwith an edge length of 2.5 μm is shown in light blue. The coarse particlescounted are marked with a red marking. Scale: 20 μm. The photo wasedited with MS Power Point
Fig. 6 SEM image of ×3000 magnification of B. rutabulum. The areamarked in purple shows a 20 × 20μm area that was counted. The countedfine particles marked with red. Scale: 20 μm. The photo was edited withMS Power Point
51767Environ Sci Pollut Res (2021) 28:51763–51771

The SEM images were taken in the area of the leaf blade(see Fig. 4), because the cells are relatively homogeneous inthis area (Smith 2004). Peripheral influences on the conditionsfor deposition of particles are least expected here. The sameprocedure was used as for species identification. The leafblade is also used to ensure better comparability and clearexpression of the features characteristic of the species.
The decrease in the number of particles on the moss surfaceof B. rutabulum may have several causes. Since the mossculture was kept permanently moist, a biofilm formed on theleaf surfaces. The fine dust particles could be broken down by
physical-chemical processes of the microorganisms in the bio-film (Bai et al. 2021; Frahm 2001). Because mosses feed fromfine dust on their leaf surface, particles may also have beeninternalized and metabolically processed inside the cell(Canivet et al. 2014). Under lab conditions, the moss plantswere largely isolated from other nutrient sources.Mosses havefew storage compartments; they are poikilohydry and cannotcreate consistent conditions (Frahm 2001). The close-meshedphoto documentation showed an increase in biomass andproved metabolic activity for the duration of the study (seeFig. 7).
Based on the data collected, it cannot be answered whetheronly one or both hypotheses are correct.
Fig. 7 The marked area shows the newly grown leaves in the laboratory.They differ from the existing leaves in that they are significantly smallerand lighter. These sheets were examined to determine the basic load in thelaboratory while the experiment was being carried out. Scale: 1 cm. Thephoto was edited with MS Power Point
Fig. 8 SEM images, 3000-fold from C. purpureus, scale: 10 μm
Fig. 9 SEM images, 3000-fold from S. convolutum, scale: 10 μm
Fig. 10 SEM images, 3000-fold from R. canescens, scale: 10 μm
51768 Environ Sci Pollut Res (2021) 28:51763–51771

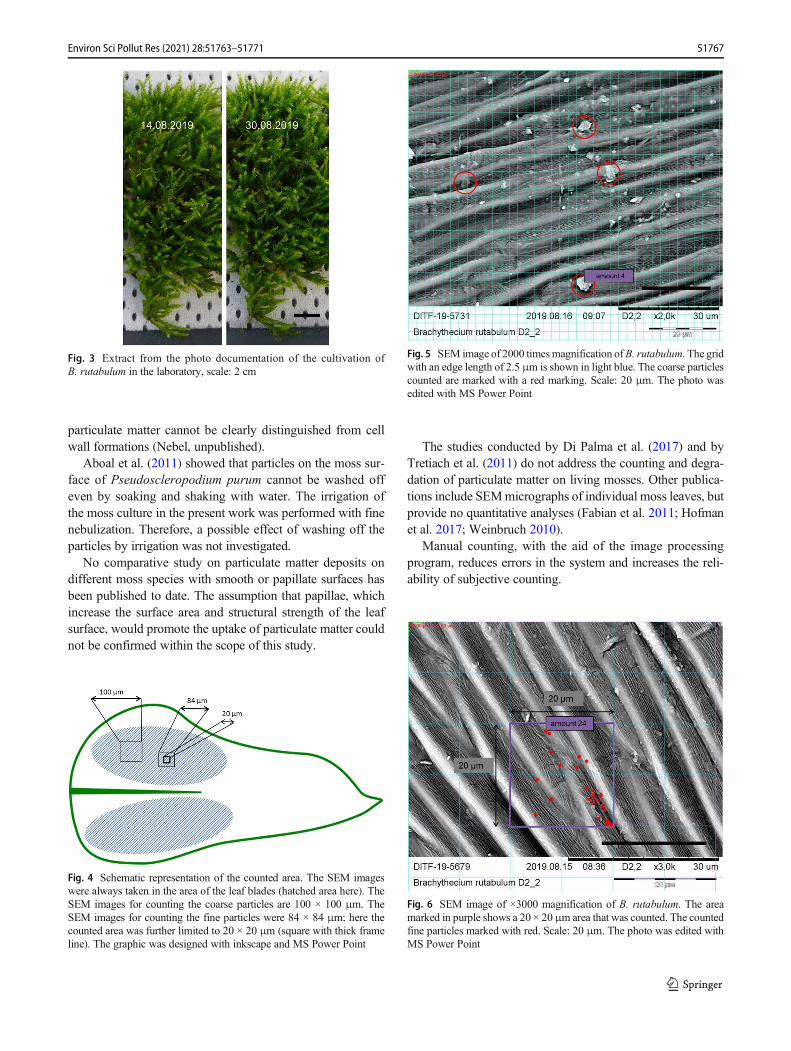
The quantitative analysis of the fine particles (2.5μm–0.3μm) showed a significant decrease (p = 0.011 >> 0.05; F= 2.33 < 3.21) of 16.9 ± 2.1 particles to 8.6 ± 2.4 particlesin the course of the investigations.The quantitative evaluation of the coarse particlesshowed no significant decrease. The initial value was4.0 ± 0.7 particles, and the basic exposure to coarse par-ticles in a laboratory environment of 1.5 ± 0.4 particles isonly slightly below the initial value.
Fine dust concentrations can locally fluctuate very muchand depend, among other things, on the weather and micro-climate. Further investigations with higher initial numbers arenecessary here in order to be able to make a qualified state-ment about the decrease in coarse particles under laboratoryconditions.
The investigations were carried out on living mosses. Deadmosses are also able to absorb substances, as the work ofGonzález et al. (2016) has shown, in this case, heavy metalcompounds. To date, no experiments have been done on par-ticulate matter uptake and reduction by dead mosses.
The present work shows a possibility to quantify the actualnumber of particles divided into two size categories on mosssurfaces.
A weak point of the method used here is the determinationof the lower limit of the structures that can be clearly identifiedas particulate matter particles. Below this limit, it is only par-tially possible to clearly assign structures on the moss surface.The evaluation of the fine particles is also particularly time-consuming and requires a large sample size.
The work carried out enables the collection of data andobservations that are not possible with the moss bag monitor-ing method (Ares et al. 2012).
Fig. 12 SEM images, 3000-fold B. rutabulum, scale: 10 μm
Fig 11 SEM images, 3000-fold from H. cupressiforme, scale: 10 μm
Fig. 13 The number of coarseparticles of the counted area (100× 100 μm) is plotted over thecultivation period. The markingsshow the mean with the standarderror of the mean plotted up anddown. The graphic was createdwith MS Excel
51769Environ Sci Pollut Res (2021) 28:51763–51771
Conclusion
Reliable data is required to put the discussion about particulatematter on a factual level. This in turn requires various mea-suring methods. The more reliable measurement data is avail-able, the more precisely the fine dust problems of many urbanareas can be analyzed. This also includes taking into accountdata on the number of particles. This is the basis for the de-velopment of solution concepts for the reduction of particulatematter at the urban hot spots. Mosses can make a contributionhere due to their physiological properties.
A selection procedure makes it possible to find further mossspecies that are suitable for a quantitative analysis of the partic-ulate matter load on their leaves with the method presented here.The evaluation criteria for the suitability of moss species arepreparation of the moss leaflets for microscopy, visibility, andoccurrence of the particles and the most important point theproperties of the moss surface (see Tables 1 and 2).
Author contribution Mrs. Vanicela and Mr. Nebel wrote the main text.Mr. Nebel prepared the tables. Mrs. Vanicela and Mrs. Stephan preparedall figures. Mrs. Vanicela, Mrs. Stephan, and Mr. Riethmüller developedthe methods. Mrs. Vanicela, Mr. Nebel, Mrs. Stephan, Mr. Riethmüller,and Mr. Gresser discussed the method and the main text.
Funding Open Access funding enabled and organized by Projekt DEAL.The work was supported by the Central Innovation Programme for smalland medium-sized enterprises of the Federal Ministry for Economic
Affairs and Energy on the basis of a decision of the German Bundestag.Grant number: ZF4060031SA7.
Data availability All authors assure that all data and materials as well assoftware application support their published claims and comply with fieldstandards.
Declarations
Ethical approval All authors affirm that objectivity and transparency inresearch have been ensured and ensure that accepted principles of ethicaland professional conduct have been followed.
Consent All authors agree with the content and have given their explicitconsent to submit the paper.
Research involving human participants and/or animals Not applicable.
Conflict of interests The authors declare no competing interests.
Open Access This article is licensed under a Creative CommonsAttribution 4.0 International License, which permits use, sharing, adap-tation, distribution and reproduction in any medium or format, as long asyou give appropriate credit to the original author(s) and the source, pro-vide a link to the Creative Commons licence, and indicate if changes weremade. The images or other third party material in this article are includedin the article's Creative Commons licence, unless indicated otherwise in acredit line to the material. If material is not included in the article'sCreative Commons licence and your intended use is not permitted bystatutory regulation or exceeds the permitted use, you will need to obtainpermission directly from the copyright holder. To view a copy of thislicence, visit http://creativecommons.org/licenses/by/4.0/.
References
Aboal JR, Pérez-Llamazares A, Carballeira A, Giordano S, Fernández JA(2011) Should moss samples used as biomonitors of atmosphericcontamination be washed? Atmos Environ 45:6837–6840
Adamo P, Crisafulli P, Giordano S, Minganti V, Modenesi P, Monaci F,Pittao E, Tretiach M, Bargagli R (2007) Lichen and moss bags as
Table 5 Values of basic load (coarse and fine fraction)
Mean coarse particles 1.5
SEM 0.4
Sample size (n) 46
Mean fine particles 5.8
SEM 1.2
Sample size (n) 24
Fig. 14 The number of fineparticles of the counted area (20 ×20 μm) is plotted over thecultivation period. The markingsshow the mean with the standarderror of the mean plotted up anddown. The graphic was createdwith MS Excel
51770 Environ Sci Pollut Res (2021) 28:51763–51771

monitoring devices in urban areas. Part II: trace element content inliving and dead biomonitors and comparison with synthetic mate-rials. Environ Pollut 146:392–399
Ares A, Aboal JR, Carballeira A, Giordano S, Adamo P, Fermández JA(2012) Moss bag biomonitoring: a methodological review. Sci TotalEnviron 432:143–158
Bai FY, Chen XP, Huang JZ, Lu YS, Dong HY,Wu YH, Song SL, Yu J,Bai S, Chen Z, Yang TY, Peng XY (2021) Microbial biofilms on agiant monolithic statue of Buddha: The symbiosis of microorgan-isms and mosses and implications for bioweathering. Int BiodeteriorBiodegrad 156(105):106
Canivet L, Dubot P, Denayer F-O (2014) Uptake of nanoparticles byAphanorrhegma patens (Hedw.) Lindb. J Bryol 36(2): 104–109
Di Palma A, Capozzi F, Spagnuolo V, Giordano S, Adamo P (2017)Atmospheric particulate matter intercepted by moss-bags:Relations to moss trace element uptake and land use.Chemosphere 176:361–368
DIN EN 12341, (2014) –Ambient air Standard gravimetric measurementmethod for the determination of the PM10 or PM2,5 mass concentra-tion of suspended particulate matter; German version EN 12341:2014, This European Standard was approved by CEN (EuropeanCommittee for Standardisation) on 10 April 2014. https://www.emw.de/de/filter-campus/filterklassen.html, access 15.02.2021 (inGerman)
EMW (2021) https://www.emw.de/de/filter-campus/filterklassen.html.Accessed 15 Feb 2021 (in German).
Fabian K, Reimann C, McEnroe SA, Willemoes-Wissing B (2011)Magnetic properties of the terrestrial moss (Hylocomium splendens)along a north-south profile crossing the city of Oslo, Norway. SciTotal Environ 409:2252–2260
Frahm JP (2001) Biology of the mosses. SpektrumAkademischer Verlag,Heidelberg (in German)
González AG, Jimenez-Villacorta F, Beike AK, Reski R, Adamo P,Pokrovsky OS (2016) Chemical and structural characterization ofcopper adsorbed on mosses (Bryophyta). J Hazard Mater 308:343–354
Harmens H, Norris DA, Steinnes E, Kubin E, Piispanen J, Alber R,Aleksiayenak Y, Blum O, Coşkun M, Dam M, de Temmerman L,Fernández JA, Frolova M, Frontasyeva M, González-Miqueo L,Grodzińska K, Jeran Z, Korzekwa S, Krmar M, Kvietkus K,Leblond S, Liiv S, Magnússon SH, Maňkovská B, Pesch R,Rühling Å, Santamaria JM, Schröder W, Spiric Z, Suchara I,Thöni L, Urumov V, Yurukova L, Zechmeister HG (2010)Mosses as biomonitors of atmospheric heavy metal deposition: spa-tial patterns and temporal trends in Europe. Environ Pollut 158:3144–3156
Harmens H, Norris DA, Cooper DM, Mills G, Steinnes E, Kubin E,Thöni L, Aboal JR, Alber R, Carballeira A, Coşkun M, deTemmerman L, Frolova M, González-Miqueo L, Jeran Z, LeblondS, Liiv S, Maňkovská B, Pesch R, Poikolainen J, Rühling Å,Santamaria JM, Simonèiè P, Schröder W, Suchara I, Yurukova L,Zechmeister HG (2011) Nitrogen concentrations in mosses indicatethe spatial distribution of atmospheric nitrogen deposition inEurope. Environ Pollut 159:2852–2860
Harmens H et al (2012) Country-specific correlations across Europe be-tween modelled atmospheric cadmium and lead deposition and con-centrations in mosses. Environ Pollut 166:1–9
Hofman J, Maher BA, Muxworthy AR, Wuyts K, Castanheiro A,Samson R (2017) Biomagnetic monitoring of atmosphere pollution:a review ofmagnetic signatures from biological sensors. Environ SciTechnol 51:6648–6664
Kappis C et al. (2007) Study on the state of scientific knowledge about thefine dust filtering potential (qualitative and quantitative) of plants.Study, University of Berlin (in German)
Maxhuni A, Lazo P, Kane S, Qarri F, Marku E, Harmens H (2015) Firstsurvey of atmospheric heavy metal deposition in Kosovo usingmoss biomonitoring. Environ Sci Pollut Res 23:744–755
Schröder W, Holy M, Pesch R, Harmens H, Fagerli H, Alber R, CoşkunM, de Temmerman L, Frolova M, González-Miqueo L, Jeran Z,Kubin E, Leblond S, Liiv S, Maňkovská B, Piispanen J,Santamaría JM, Simonèiè P, Suchara I, Yurukova L, Thöni L,Zechmeister HG (2010a) First Europe-wide correlation analysisidentifying factors best explaining the total nitrogen concentrationin mosses. Atmos Environ 44:3485–3491
Schröder W, Holy M, Pesch R, Harmens H, Ilyin I, Steinnes E, Alber R,Aleksiayenak Y, Blum O, Coşkun M, Dam M, de Temmerman L,Frolova M, Frontasyeva M, Miqueo LG, Grodzińska K, Jeran Z,Korzekwa S, Krmar M, Kubin E, Kvietkus K, Leblond S, Liiv S,Magnússon S, Maňkovská B, Piispanen J, Rühling Å, Santamaria J,Spiric Z, Suchara I, Thöni L, Urumov V, Yurukova L, ZechmeisterHG (2010b) Are cadmium, lead and mercury concentrations inmosses across Europe primarily determined by atmospheric deposi-tion of these metals? J. Soils Sediments 10:1572–1584
Smith AJE (2004) The moss flora of Britain and Ireland. CambridgeUniversity Press, Cambridge
Spagnuolo V, Zampella M, Giordano S, Adamo P (2011) Cytologicalstress and element uptake in moss and lichen exposed in bags inurban area. Ecotoxicol Environ Saf 74:1434–1443
SPEKTRUM.DE (2020) https://www.spektrum.de/wissen/feinstaub-ist-gesundheitsschaedlich-und-noch-nicht-hinreichend-erforscht/1639880, Accessed 19.02.20 (in German)
Stadtklima-Stuttgart.de (2020) https://www.stadtklima-stuttgart.de/index.php?luft_messdaten_feinstaubwerte, Accessed 19.02.20 (inGerman)
Tittarelli A, Borgini A, Bertoldi M, De Saeger E, Ruprecht A, StefanoniR, Tagliabue G, Contiero P, Crosignani P (2008) Estimation ofparticle mass concentration in ambient air using a particle counter.Atmos Environ 42:8543–8548
Tretiach M, Pittao E, Crisafulli P, Adamo P (2011) Influence of exposuresites on trace element enrichment in moss-bags and characterizationof particles deposited on the biomonitor surface. Sci Total Environ409:822–830
Umweltbundesamt (2018). https://www.umweltbundesamt.de/sites/default/files/medien/384/bilder/dateien/2_abb_staub-pm10-emi-quellkat_2018.pdf Accessed 15.11.18 (in German)
Umweltbundesamt (2020a). https://www.umweltbundesamt.de/en/topics/air/particulate-matter-pm10 Accessed 19.02.20
Umweltbundesamt (2020B). https://www.umweltbundesamt.de/daten/umwelt-gesundheit/gesundheitsrisiken-der-bevoelkerung-durch-feinstaub. Accessed 19.05.20 (in German)
Umweltbundesamt (2020c). https://www.umweltbundesamt.de/service/uba-fragen/was-ist-feinstaub. Accessed 19.05.20 (in German)
Weinbruch S (2010) Characterisation of individual aerosol particles onmoss surfaces: implications for source apportionment. J EnvironMonit 12:1064–1071
Zheng G, Li P (2019) Resuspension of settled atmospheric particulate onplant leaves determined by wind and leaf surface characteristics.Environ Sci Pollut Res 26:19606–19614
Publisher’s note Springer Nature remains neutral with regard to jurisdic-tional claims in published maps and institutional affiliations.
51771Environ Sci Pollut Res (2021) 28:51763–51771

![Strictly Biphasic Janus Structures DOI: 10.1002/anie.201309352 …nanofm.mse.gatech.edu/Papers/Strictly Biphasic Soft and... · 2014. 7. 3. · Janus particles,[35,37,38] the synthetic](https://static.fdocuments.fr/doc/165x107/60b8fa7bb2d0ae72b367ee44/strictly-biphasic-janus-structures-doi-101002anie201309352-biphasic-soft-and.jpg)