Polit ln ch11
47
Copyright ©2010 by Pearson Education, Inc. Upper Saddle River, New Jersey 07458 All rights reserved. Statistics and Data Analysis for Nursing Research, Second Edition Denise F. Polit Statistics and Data Analysis for Nursing Research Second Edition CHAPTER Analysis of Covariance, Multivariate ANOVA, and Related Multivariate Analyses 11
-
Upload
stanbridge -
Category
Documents
-
view
138 -
download
1
Transcript of Polit ln ch11
Copyright ©2010 by Pearson Education, Inc.Upper Saddle River, New Jersey 07458
All rights reserved.
Statistics and Data Analysis for Nursing Research, Second EditionDenise F. Polit
Statistics and Data Analysisfor Nursing Research
Second Edition
CHAPTER
Analysis of Covariance, Multivariate ANOVA, and Related Multivariate Analyses
11
Copyright ©2010 by Pearson Education, Inc.Upper Saddle River, New Jersey 07458
All rights reserved.
Statistics and Data Analysis for Nursing Research, Second EditionDenise F. Polit
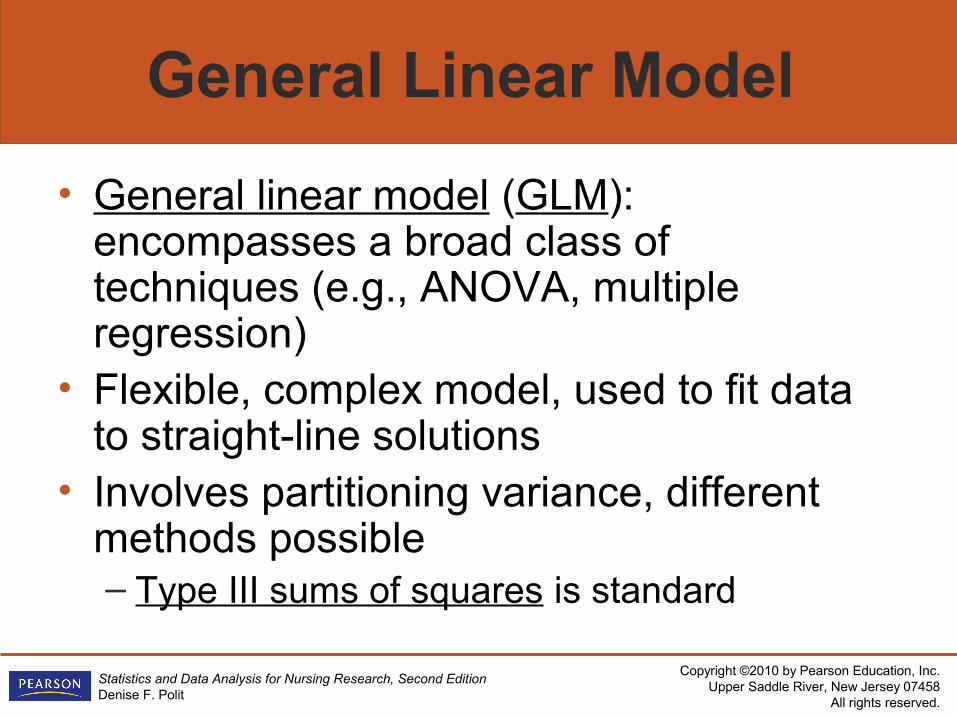
General Linear Model
• General linear model (GLM): encompasses a broad class of techniques (e.g., ANOVA, multiple regression)
• Flexible, complex model, used to fit data to straight-line solutions
• Involves partitioning variance, different methods possible– Type III sums of squares is standard
Copyright ©2010 by Pearson Education, Inc.Upper Saddle River, New Jersey 07458
All rights reserved.
Statistics and Data Analysis for Nursing Research, Second EditionDenise F. Polit
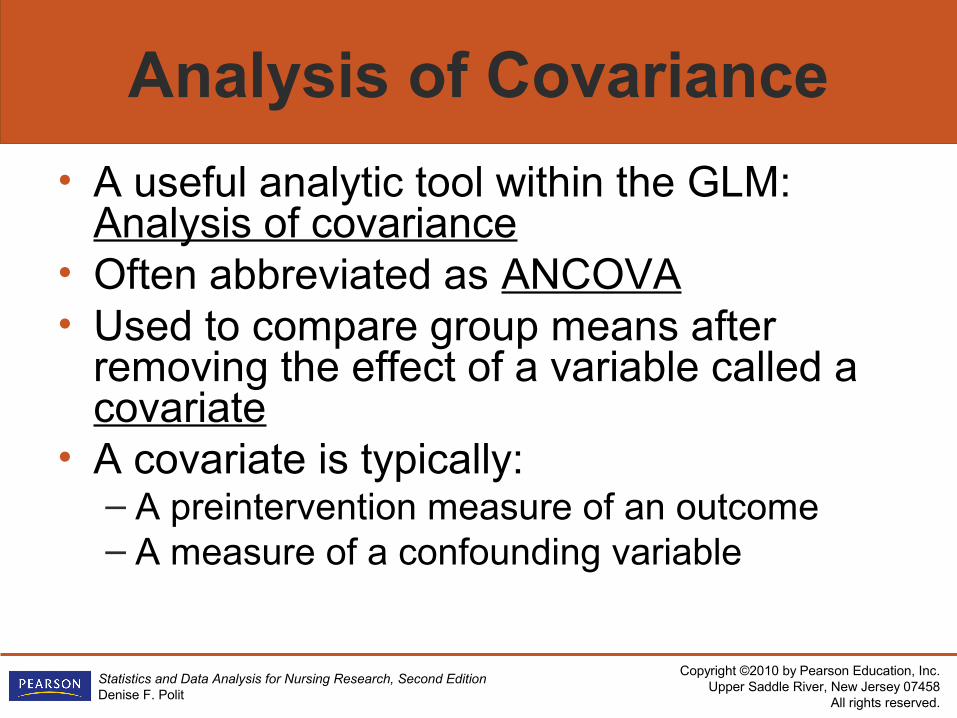
Analysis of Covariance
• A useful analytic tool within the GLM: Analysis of covariance
• Often abbreviated as ANCOVA• Used to compare group means after
removing the effect of a variable called a covariate
• A covariate is typically:– A preintervention measure of an outcome– A measure of a confounding variable
Copyright ©2010 by Pearson Education, Inc.Upper Saddle River, New Jersey 07458
All rights reserved.
Statistics and Data Analysis for Nursing Research, Second EditionDenise F. Polit
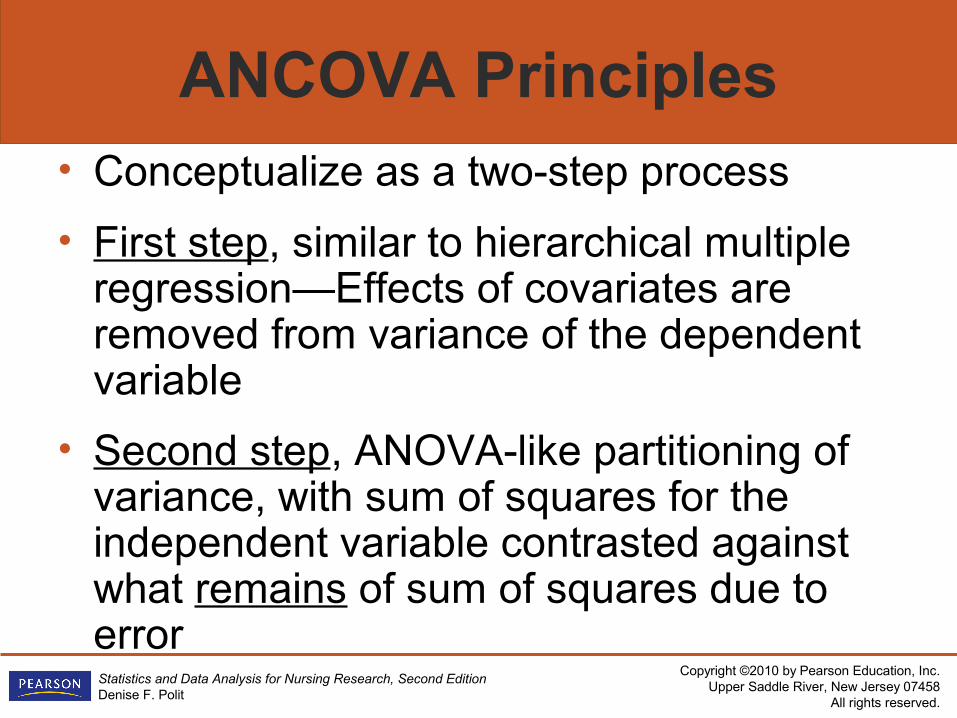
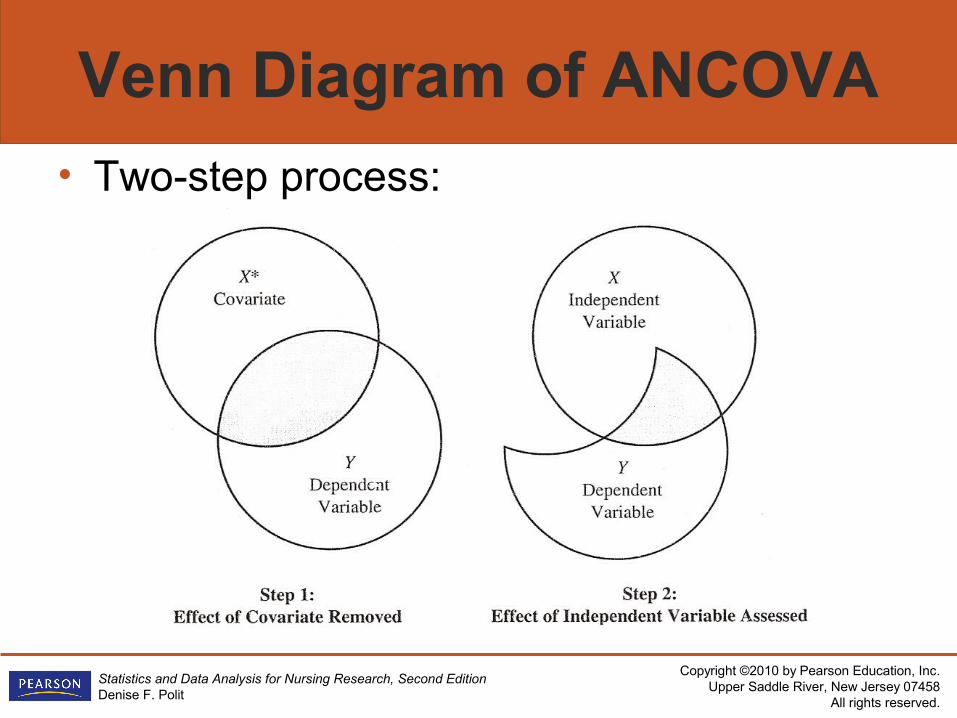
ANCOVA Principles• Conceptualize as a two-step process
• First step, similar to hierarchical multiple regression—Effects of covariates are removed from variance of the dependent variable
• Second step, ANOVA-like partitioning of variance, with sum of squares for the independent variable contrasted against what remains of sum of squares due to error
Copyright ©2010 by Pearson Education, Inc.Upper Saddle River, New Jersey 07458
All rights reserved.
Statistics and Data Analysis for Nursing Research, Second EditionDenise F. Polit
Venn Diagram of ANCOVA
• Two-step process:
Copyright ©2010 by Pearson Education, Inc.Upper Saddle River, New Jersey 07458
All rights reserved.
Statistics and Data Analysis for Nursing Research, Second EditionDenise F. Polit
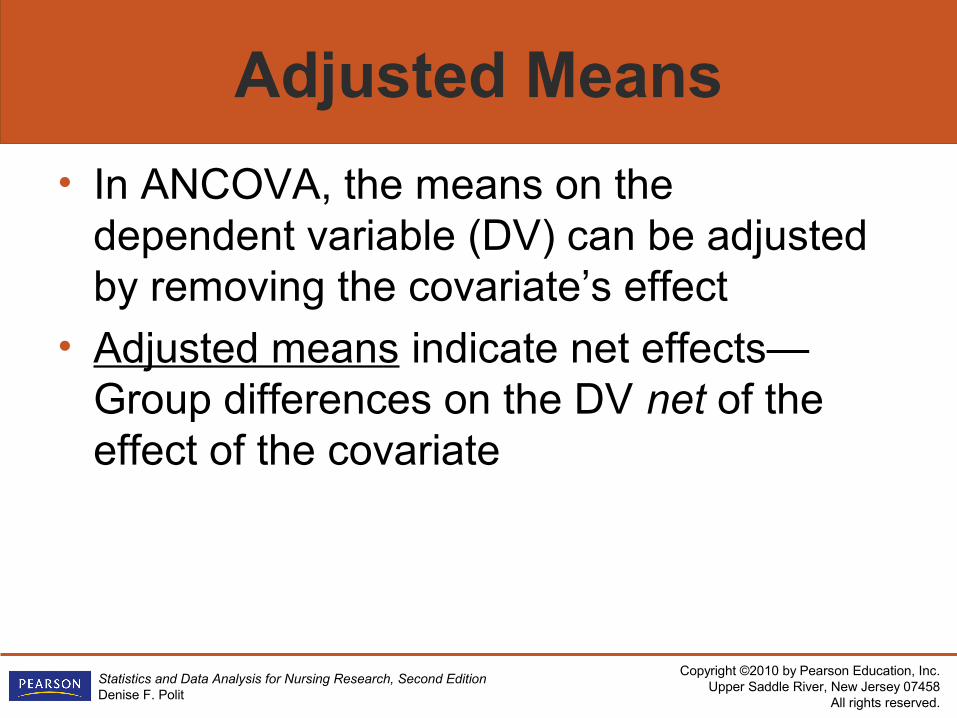
Adjusted Means
• In ANCOVA, the means on the dependent variable (DV) can be adjusted by removing the covariate’s effect
• Adjusted means indicate net effects—Group differences on the DV net of the effect of the covariate
Copyright ©2010 by Pearson Education, Inc.Upper Saddle River, New Jersey 07458
All rights reserved.
Statistics and Data Analysis for Nursing Research, Second EditionDenise F. Polit
ANCOVA Hypotheses
• Similar to ANOVA, tested via the F statistic
• The null hypothesis: The adjusted group means are equal
• The alternative hypothesis: At least some of the adjusted group means are not equal
Copyright ©2010 by Pearson Education, Inc.Upper Saddle River, New Jersey 07458
All rights reserved.
Statistics and Data Analysis for Nursing Research, Second EditionDenise F. Polit
Multiple Comparisons
• Like ANOVA, if there is a significant overall group difference, pairwise multiple comparisons must be done when there are three or more groups
• Purpose of these post hoc tests is to identify which pairs of adjusted group means are significantly different from one another
Copyright ©2010 by Pearson Education, Inc.Upper Saddle River, New Jersey 07458
All rights reserved.
Statistics and Data Analysis for Nursing Research, Second EditionDenise F. Polit
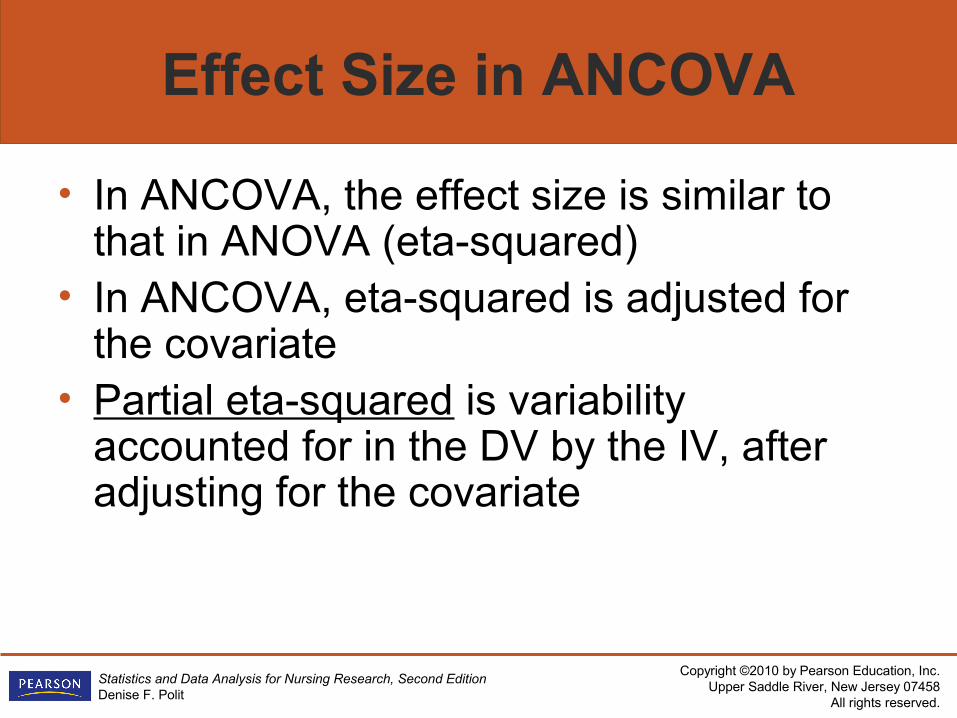
Effect Size in ANCOVA
• In ANCOVA, the effect size is similar to that in ANOVA (eta-squared)
• In ANCOVA, eta-squared is adjusted for the covariate
• Partial eta-squared is variability accounted for in the DV by the IV, after adjusting for the covariate
Copyright ©2010 by Pearson Education, Inc.Upper Saddle River, New Jersey 07458
All rights reserved.
Statistics and Data Analysis for Nursing Research, Second EditionDenise F. Polit
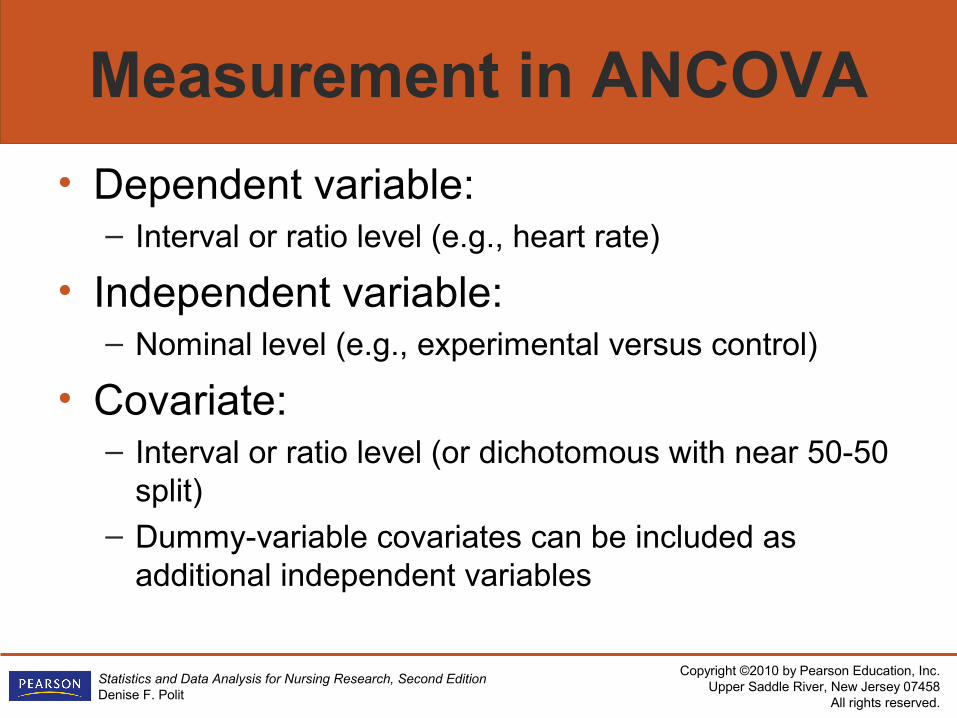
Measurement in ANCOVA
• Dependent variable:– Interval or ratio level (e.g., heart rate)
• Independent variable:– Nominal level (e.g., experimental versus control)
• Covariate:– Interval or ratio level (or dichotomous with near 50-50
split)– Dummy-variable covariates can be included as
additional independent variables
Copyright ©2010 by Pearson Education, Inc.Upper Saddle River, New Jersey 07458
All rights reserved.
Statistics and Data Analysis for Nursing Research, Second EditionDenise F. Polit
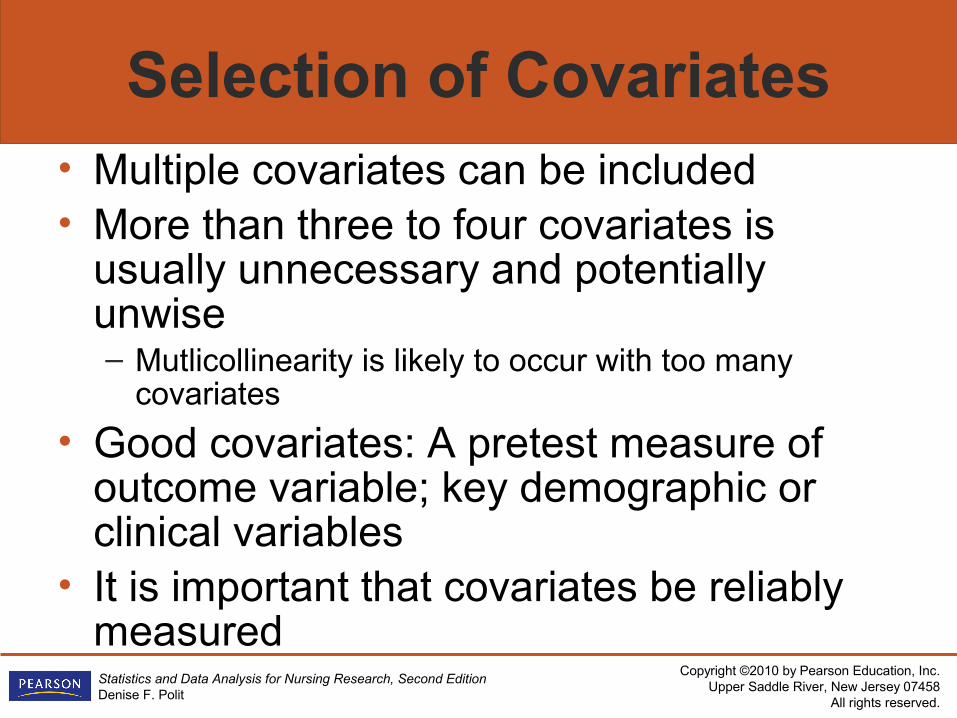
Selection of Covariates• Multiple covariates can be included• More than three to four covariates is
usually unnecessary and potentially unwise – Mutlicollinearity is likely to occur with too many
covariates
• Good covariates: A pretest measure of outcome variable; key demographic or clinical variables
• It is important that covariates be reliably measured
Copyright ©2010 by Pearson Education, Inc.Upper Saddle River, New Jersey 07458
All rights reserved.
Statistics and Data Analysis for Nursing Research, Second EditionDenise F. Polit
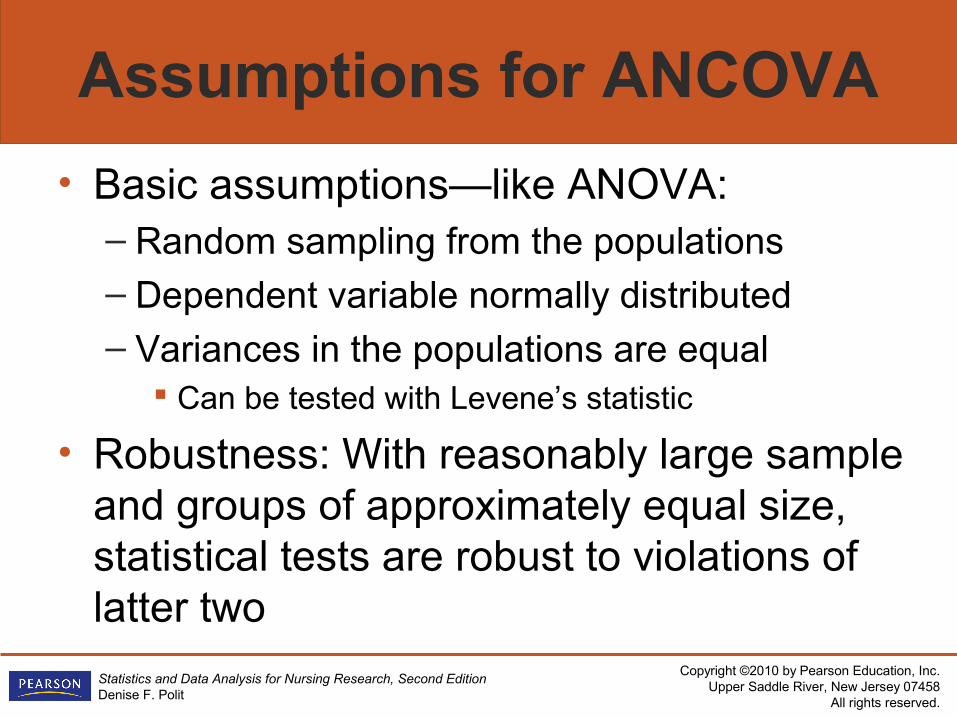
Assumptions for ANCOVA
• Basic assumptions—like ANOVA:– Random sampling from the populations– Dependent variable normally distributed– Variances in the populations are equal
Can be tested with Levene’s statistic
• Robustness: With reasonably large sample and groups of approximately equal size, statistical tests are robust to violations of latter two
Copyright ©2010 by Pearson Education, Inc.Upper Saddle River, New Jersey 07458
All rights reserved.
Statistics and Data Analysis for Nursing Research, Second EditionDenise F. Polit
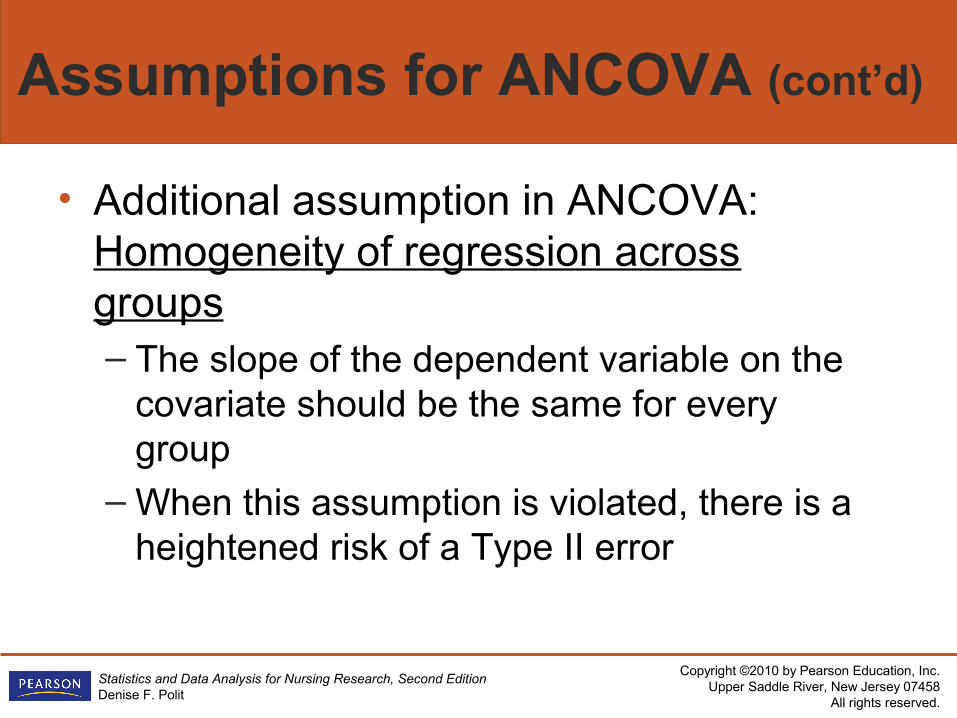
Assumptions for ANCOVA (cont’d)
• Additional assumption in ANCOVA: Homogeneity of regression across groups– The slope of the dependent variable on the
covariate should be the same for every group
– When this assumption is violated, there is a heightened risk of a Type II error
Copyright ©2010 by Pearson Education, Inc.Upper Saddle River, New Jersey 07458
All rights reserved.
Statistics and Data Analysis for Nursing Research, Second EditionDenise F. Polit
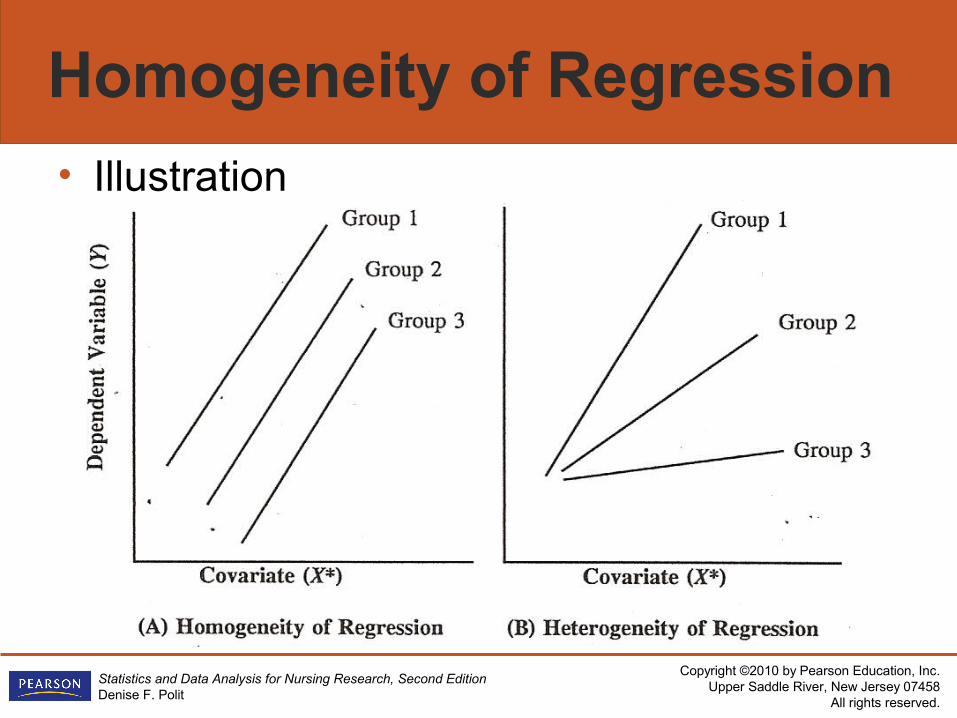
Homogeneity of Regression
• Illustration
Copyright ©2010 by Pearson Education, Inc.Upper Saddle River, New Jersey 07458
All rights reserved.
Statistics and Data Analysis for Nursing Research, Second EditionDenise F. Polit
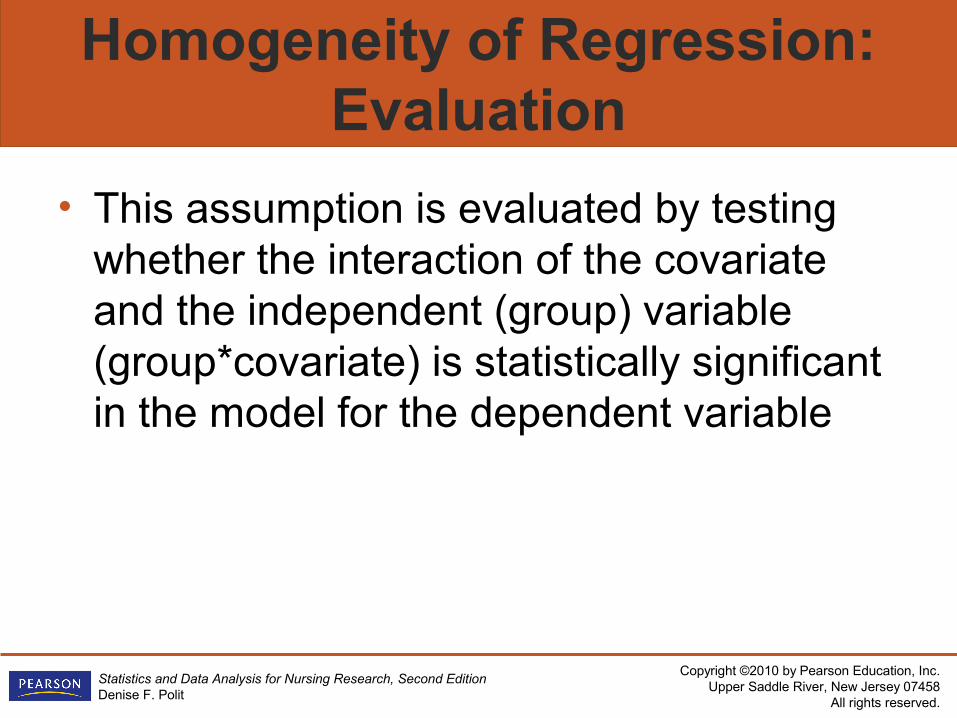
Homogeneity of Regression: Evaluation
• This assumption is evaluated by testing whether the interaction of the covariate and the independent (group) variable (group*covariate) is statistically significant in the model for the dependent variable
Copyright ©2010 by Pearson Education, Inc.Upper Saddle River, New Jersey 07458
All rights reserved.
Statistics and Data Analysis for Nursing Research, Second EditionDenise F. Polit
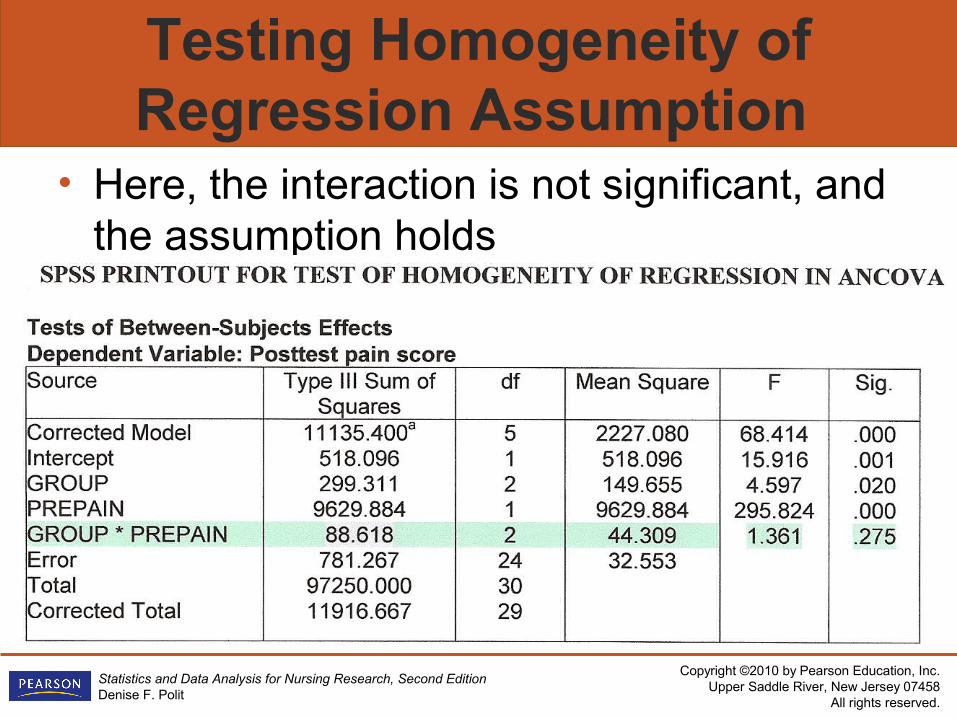
Testing Homogeneity of Regression Assumption
• Here, the interaction is not significant, and the assumption holds
Copyright ©2010 by Pearson Education, Inc.Upper Saddle River, New Jersey 07458
All rights reserved.
Statistics and Data Analysis for Nursing Research, Second EditionDenise F. Polit
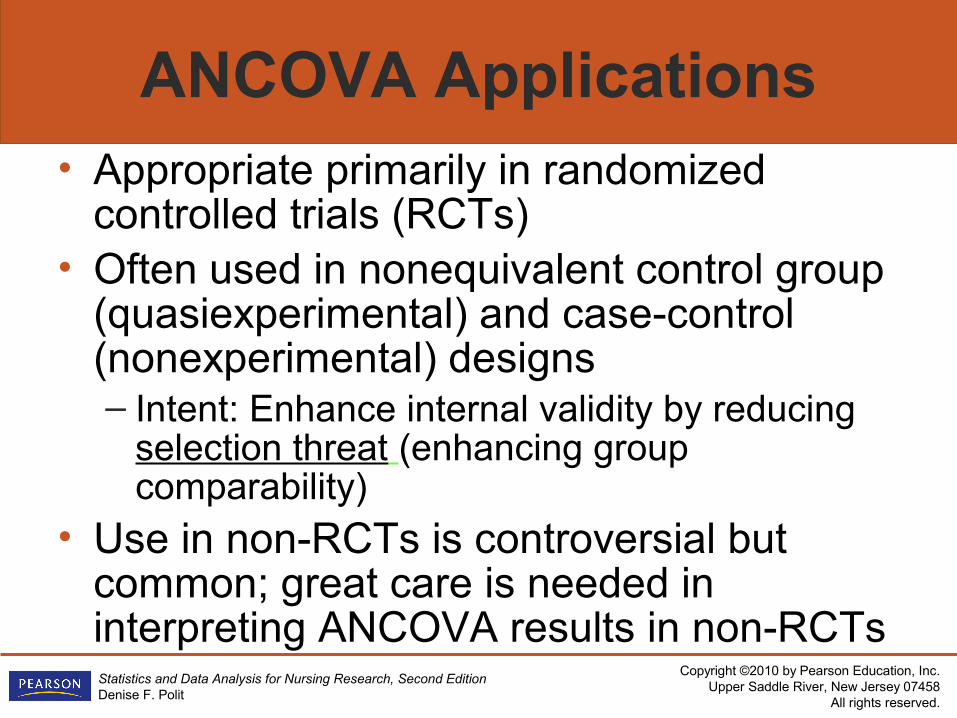
ANCOVA Applications• Appropriate primarily in randomized
controlled trials (RCTs)• Often used in nonequivalent control group
(quasiexperimental) and case-control (nonexperimental) designs– Intent: Enhance internal validity by reducing
selection threat (enhancing group comparability)
• Use in non-RCTs is controversial but common; great care is needed in interpreting ANCOVA results in non-RCTs
Copyright ©2010 by Pearson Education, Inc.Upper Saddle River, New Jersey 07458
All rights reserved.
Statistics and Data Analysis for Nursing Research, Second EditionDenise F. Polit
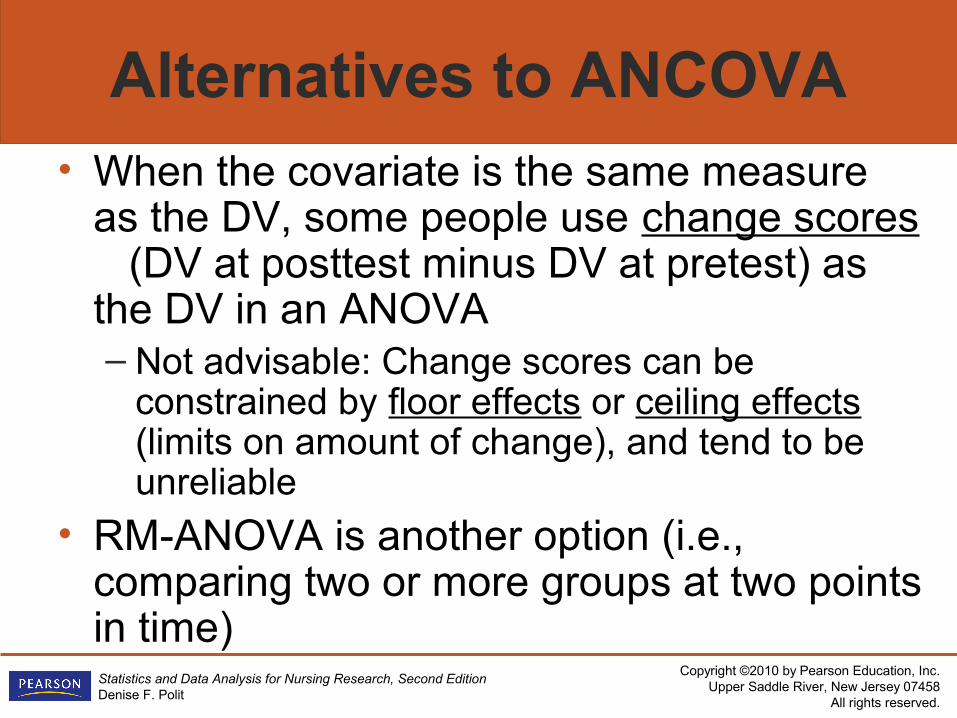
Alternatives to ANCOVA• When the covariate is the same measure
as the DV, some people use change scores (DV at posttest minus DV at pretest) as the DV in an ANOVA– Not advisable: Change scores can be
constrained by floor effects or ceiling effects (limits on amount of change), and tend to be unreliable
• RM-ANOVA is another option (i.e., comparing two or more groups at two points in time)
Copyright ©2010 by Pearson Education, Inc.Upper Saddle River, New Jersey 07458
All rights reserved.
Statistics and Data Analysis for Nursing Research, Second EditionDenise F. Polit
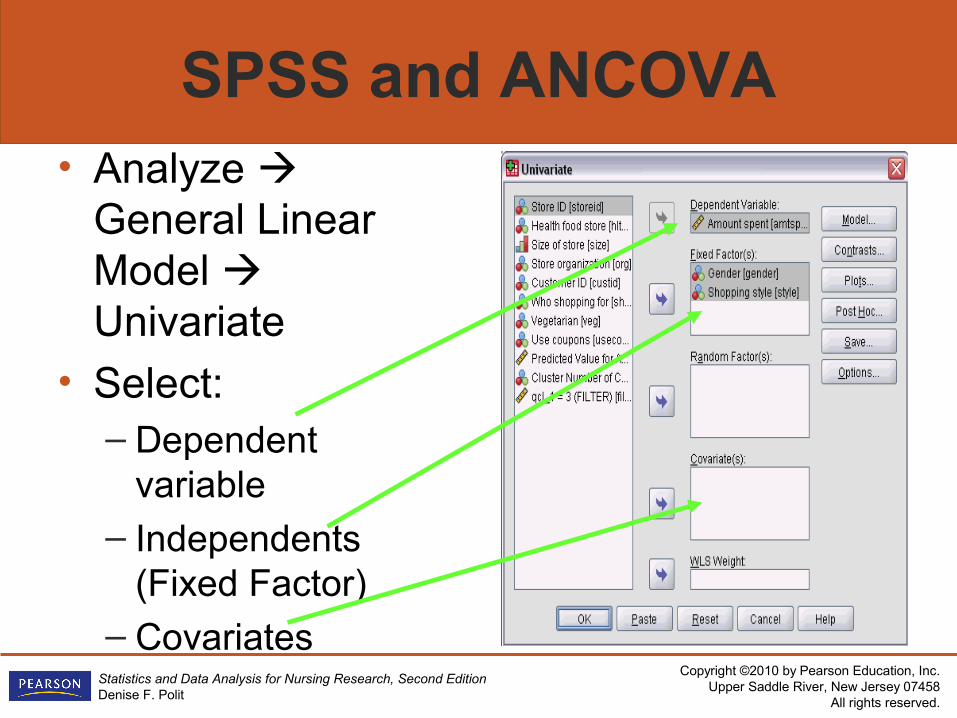
SPSS and ANCOVA• Analyze
General Linear Model Univariate
• Select:– Dependent
variable– Independents
(Fixed Factor)– Covariates
Copyright ©2010 by Pearson Education, Inc.Upper Saddle River, New Jersey 07458
All rights reserved.
Statistics and Data Analysis for Nursing Research, Second EditionDenise F. Polit
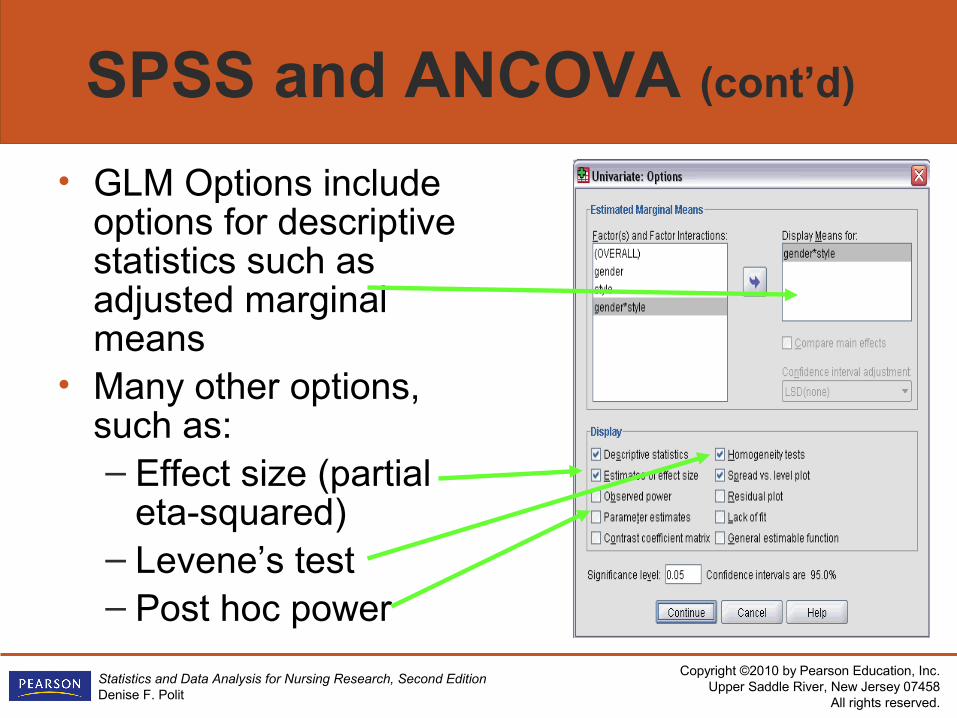
SPSS and ANCOVA (cont’d)
• GLM Options include options for descriptive statistics such as adjusted marginal means
• Many other options, such as:– Effect size (partial
eta-squared)– Levene’s test– Post hoc power
Copyright ©2010 by Pearson Education, Inc.Upper Saddle River, New Jersey 07458
All rights reserved.
Statistics and Data Analysis for Nursing Research, Second EditionDenise F. Polit
Multivariate ANOVA
• Multivariate analysis of variance (MANOVA) is another extension of ANOVA
• Used to test mean group differences on two or more dependent variables

Copyright ©2010 by Pearson Education, Inc.Upper Saddle River, New Jersey 07458
All rights reserved.
Statistics and Data Analysis for Nursing Research, Second EditionDenise F. Polit
MANOVA Concepts
• MANOVA involves the creation of a new dependent variable that is a linear combination (composite) of the original DVs
• Like ANOVA, MANOVA involves partitioning variance (of the composite DV) into different sources

Copyright ©2010 by Pearson Education, Inc.Upper Saddle River, New Jersey 07458
All rights reserved.
Statistics and Data Analysis for Nursing Research, Second EditionDenise F. Polit
MANOVA Composite DV
• A composite of two DVs (Y1 and Y2) for three groups (A, B, C)
Copyright ©2010 by Pearson Education, Inc.Upper Saddle River, New Jersey 07458
All rights reserved.
Statistics and Data Analysis for Nursing Research, Second EditionDenise F. Polit
MANOVA Applications
• MANOVA is most often used in RCTs with multiple outcome measures
• MANOVA works best when DVs are highly negatively correlated or moderately positively correlated
• Not necessary if DVs are uncorrelated
Copyright ©2010 by Pearson Education, Inc.Upper Saddle River, New Jersey 07458
All rights reserved.
Statistics and Data Analysis for Nursing Research, Second EditionDenise F. Polit
Extensions of MANOVA
• MANOVA can be extended to have multiple independent variables—e.g., a two-way MANOVA (more generally, a multi-factor MANOVA)
• MANOVA can also include covariate adjustments, in which case it is a multivariate analysis of covariance (MANCOVA)
Copyright ©2010 by Pearson Education, Inc.Upper Saddle River, New Jersey 07458
All rights reserved.
Statistics and Data Analysis for Nursing Research, Second EditionDenise F. Polit
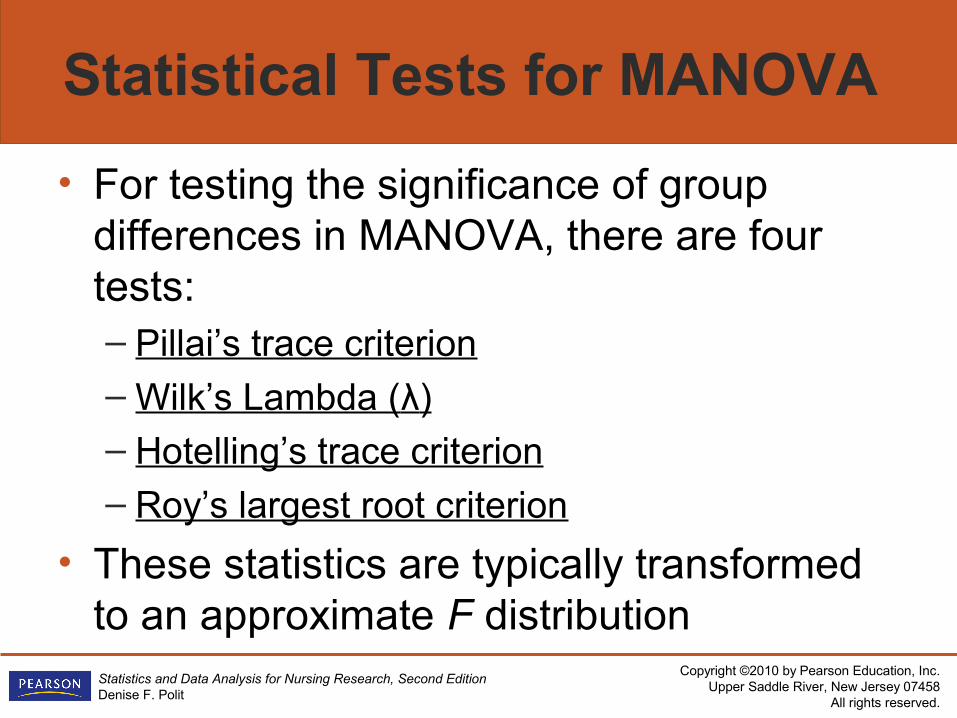
Statistical Tests for MANOVA
• For testing the significance of group differences in MANOVA, there are four tests: – Pillai’s trace criterion– Wilk’s Lambda (λ)– Hotelling’s trace criterion– Roy’s largest root criterion
• These statistics are typically transformed to an approximate F distribution
Copyright ©2010 by Pearson Education, Inc.Upper Saddle River, New Jersey 07458
All rights reserved.
Statistics and Data Analysis for Nursing Research, Second EditionDenise F. Polit
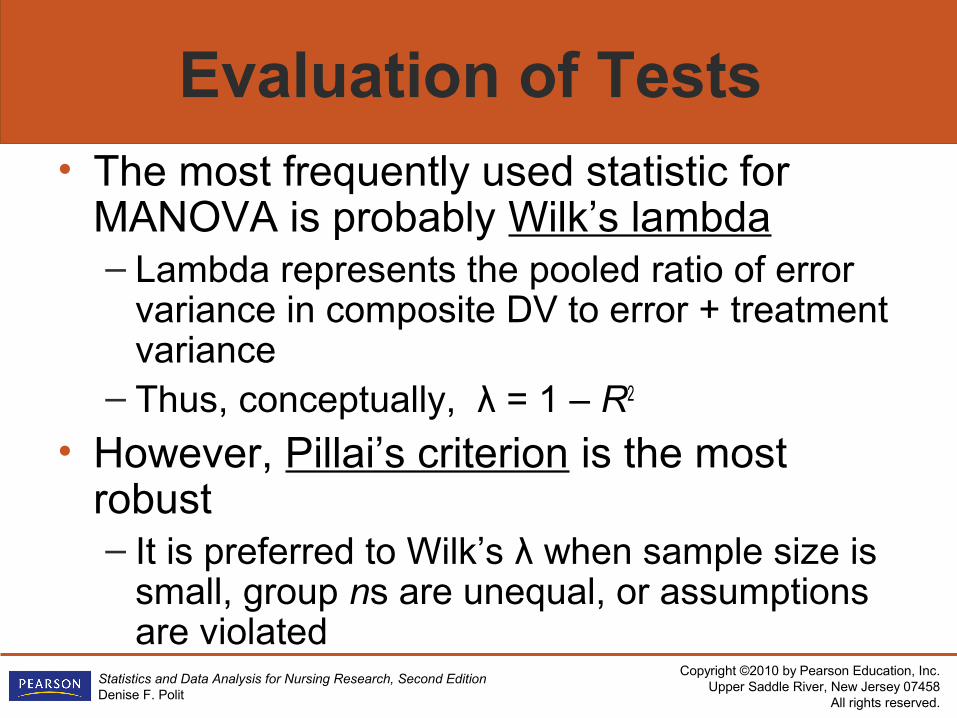
Evaluation of Tests
• The most frequently used statistic for MANOVA is probably Wilk’s lambda– Lambda represents the pooled ratio of error
variance in composite DV to error + treatment variance
– Thus, conceptually, λ = 1 – R2
• However, Pillai’s criterion is the most robust– It is preferred to Wilk’s λ when sample size is
small, group ns are unequal, or assumptions are violated
Copyright ©2010 by Pearson Education, Inc.Upper Saddle River, New Jersey 07458
All rights reserved.
Statistics and Data Analysis for Nursing Research, Second EditionDenise F. Polit
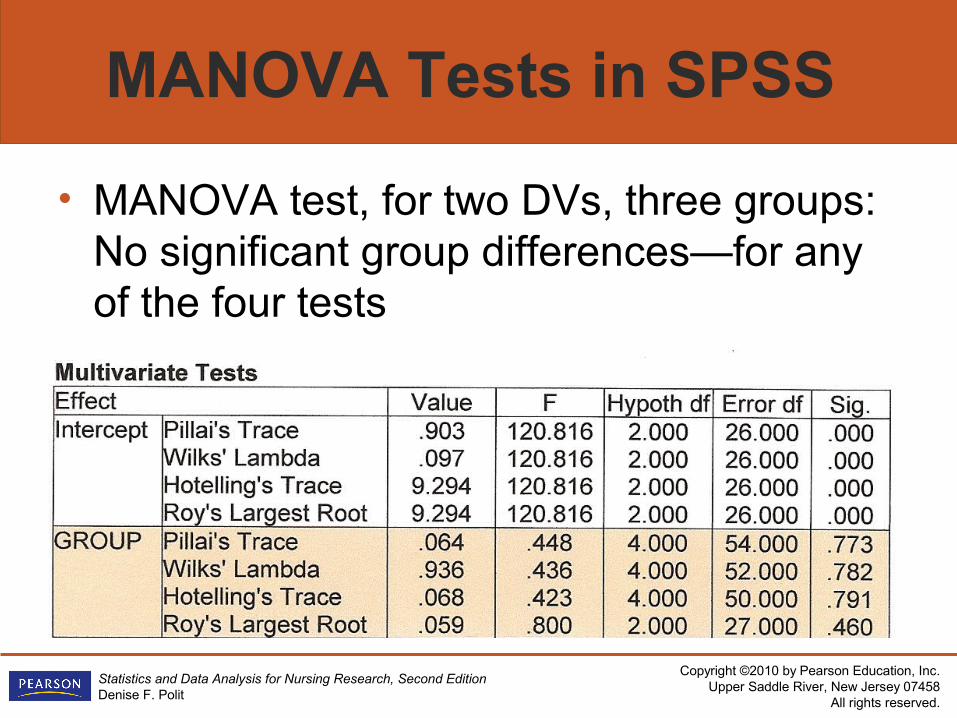
MANOVA Tests in SPSS
• MANOVA test, for two DVs, three groups: No significant group differences—for any of the four tests
Copyright ©2010 by Pearson Education, Inc.Upper Saddle River, New Jersey 07458
All rights reserved.
Statistics and Data Analysis for Nursing Research, Second EditionDenise F. Polit
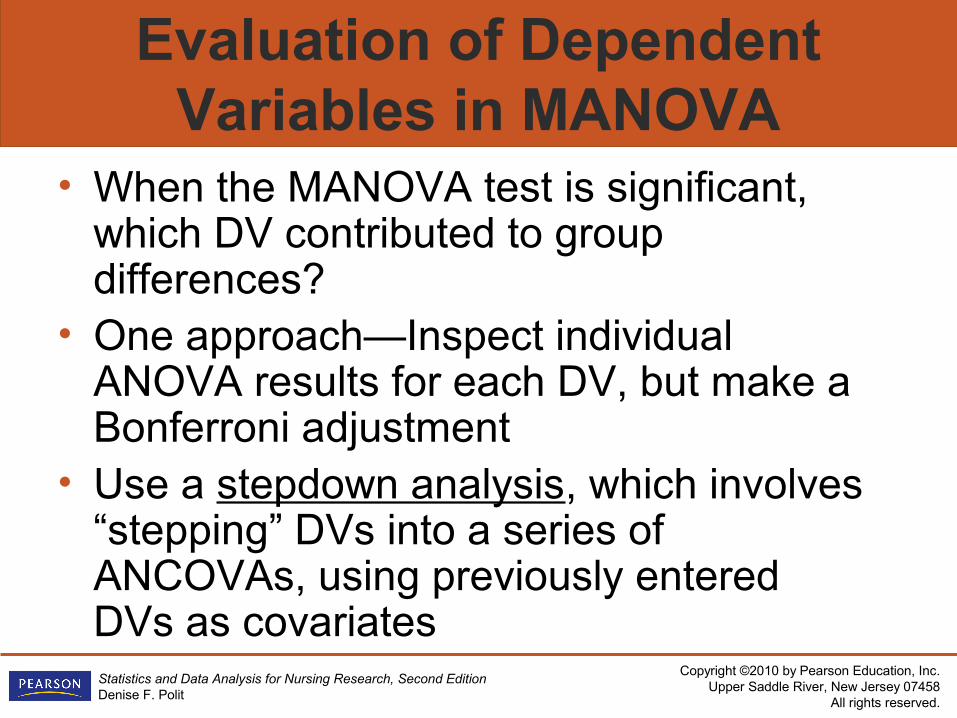
Evaluation of Dependent Variables in MANOVA
• When the MANOVA test is significant, which DV contributed to group differences?
• One approach—Inspect individual ANOVA results for each DV, but make a Bonferroni adjustment
• Use a stepdown analysis, which involves “stepping” DVs into a series of ANCOVAs, using previously entered DVs as covariates
Copyright ©2010 by Pearson Education, Inc.Upper Saddle River, New Jersey 07458
All rights reserved.
Statistics and Data Analysis for Nursing Research, Second EditionDenise F. Polit
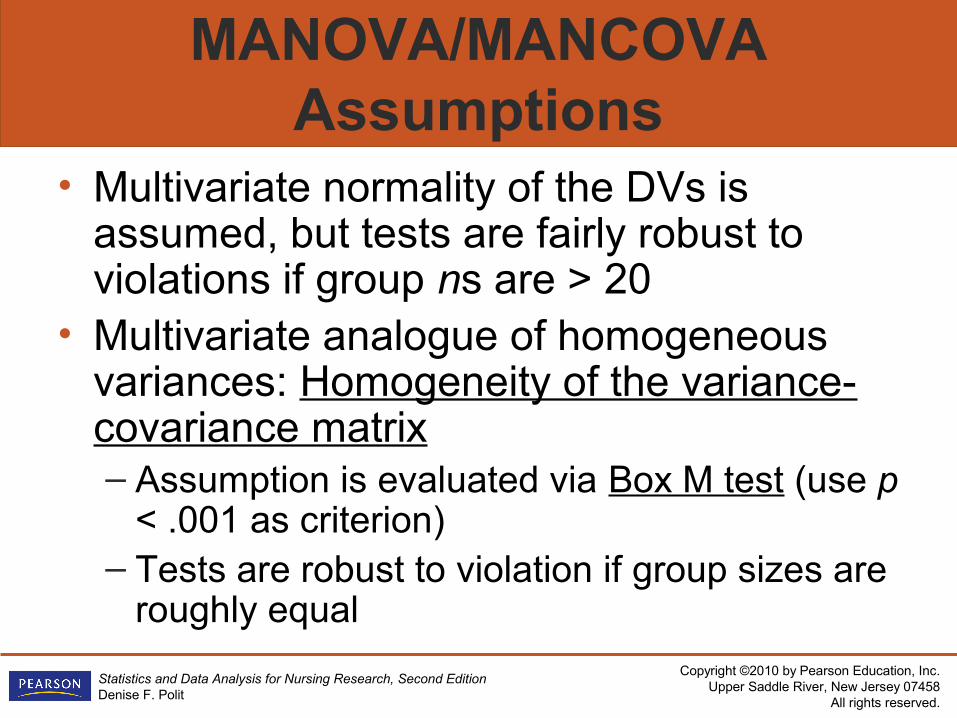
MANOVA/MANCOVA Assumptions
• Multivariate normality of the DVs is assumed, but tests are fairly robust to violations if group ns are > 20
• Multivariate analogue of homogeneous variances: Homogeneity of the variance-covariance matrix– Assumption is evaluated via Box M test (use p
< .001 as criterion)– Tests are robust to violation if group sizes are
roughly equal
Copyright ©2010 by Pearson Education, Inc.Upper Saddle River, New Jersey 07458
All rights reserved.
Statistics and Data Analysis for Nursing Research, Second EditionDenise F. Polit
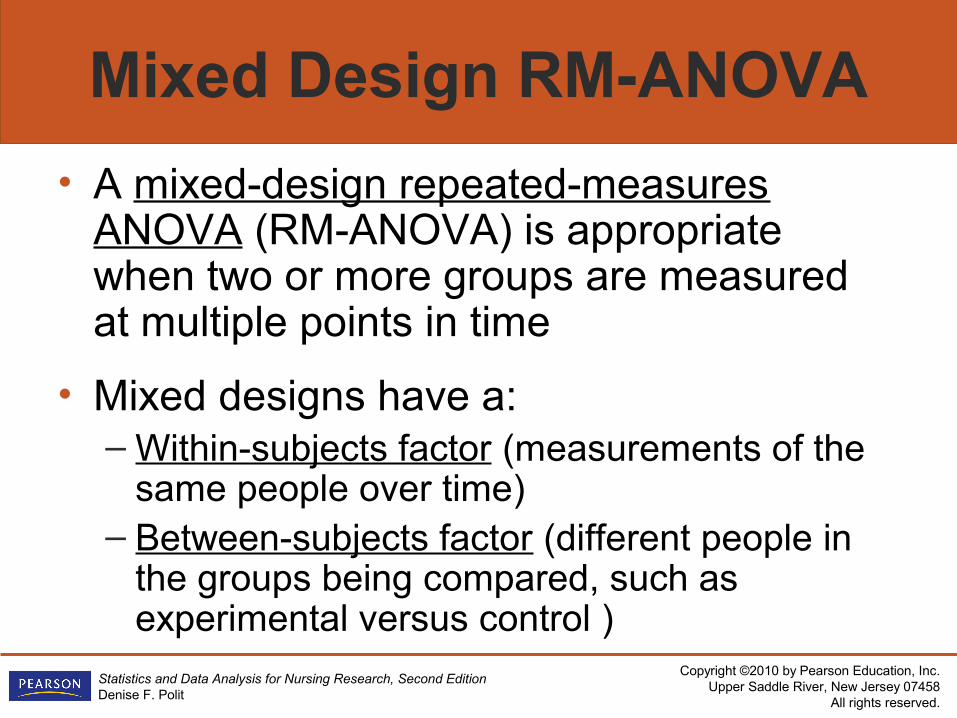
Mixed Design RM-ANOVA
• A mixed-design repeated-measures ANOVA (RM-ANOVA) is appropriate when two or more groups are measured at multiple points in time
• Mixed designs have a:– Within-subjects factor (measurements of the
same people over time)– Between-subjects factor (different people in
the groups being compared, such as experimental versus control )
Copyright ©2010 by Pearson Education, Inc.Upper Saddle River, New Jersey 07458
All rights reserved.
Statistics and Data Analysis for Nursing Research, Second EditionDenise F. Polit
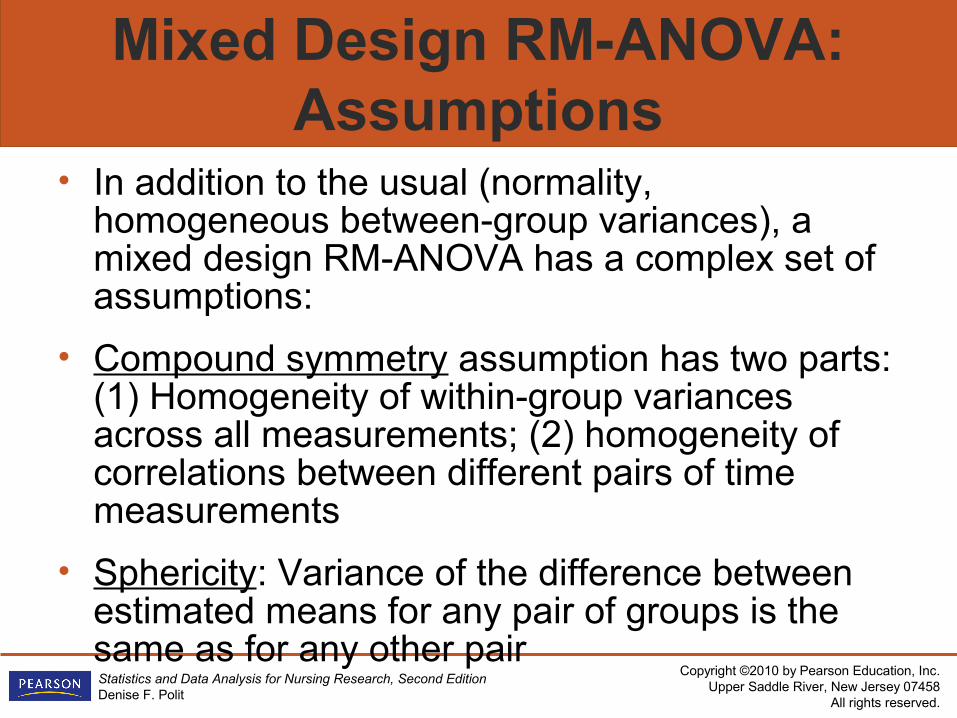
Mixed Design RM-ANOVA: Assumptions
• In addition to the usual (normality, homogeneous between-group variances), a mixed design RM-ANOVA has a complex set of assumptions:
• Compound symmetry assumption has two parts: (1) Homogeneity of within-group variances across all measurements; (2) homogeneity of correlations between different pairs of time measurements
• Sphericity: Variance of the difference between estimated means for any pair of groups is the same as for any other pair
Copyright ©2010 by Pearson Education, Inc.Upper Saddle River, New Jersey 07458
All rights reserved.
Statistics and Data Analysis for Nursing Research, Second EditionDenise F. Polit
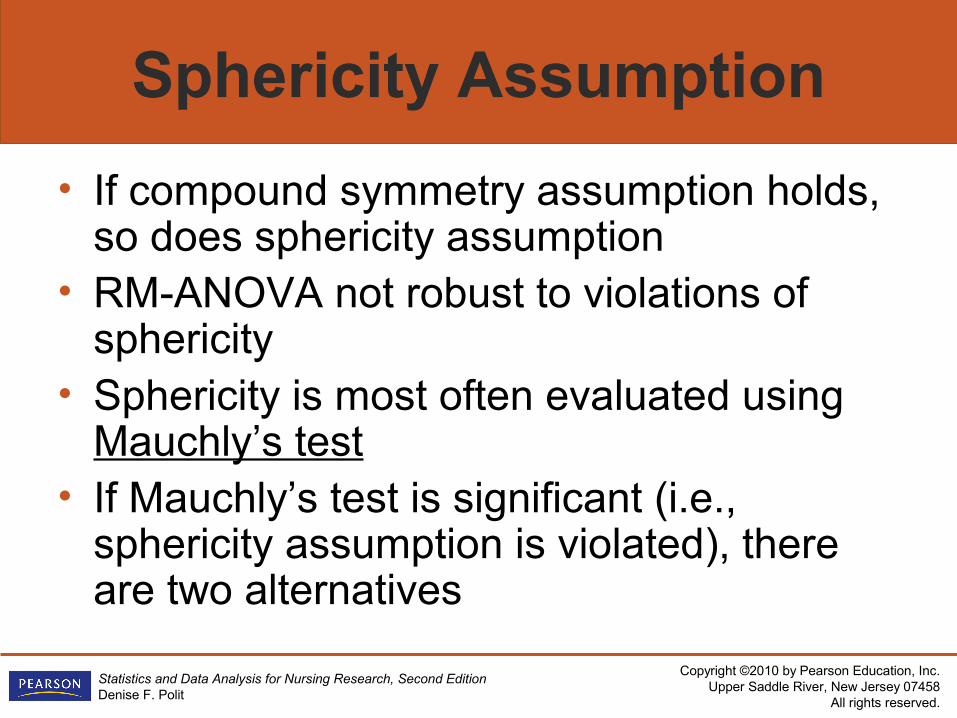
Sphericity Assumption
• If compound symmetry assumption holds, so does sphericity assumption
• RM-ANOVA not robust to violations of sphericity
• Sphericity is most often evaluated using Mauchly’s test
• If Mauchly’s test is significant (i.e., sphericity assumption is violated), there are two alternatives
Copyright ©2010 by Pearson Education, Inc.Upper Saddle River, New Jersey 07458
All rights reserved.
Statistics and Data Analysis for Nursing Research, Second EditionDenise F. Polit
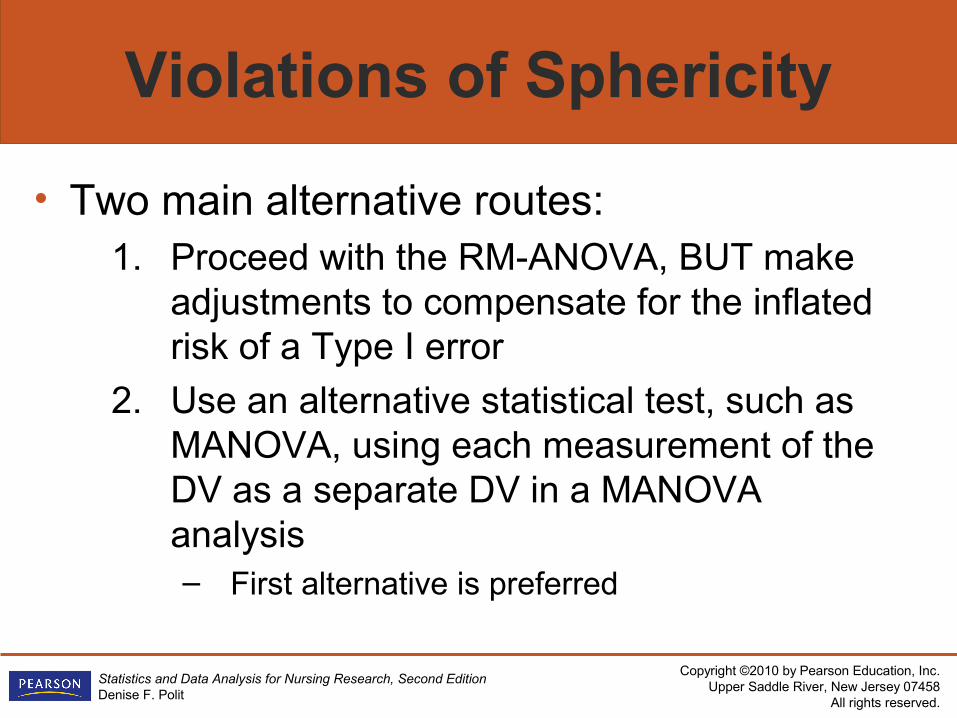
Violations of Sphericity
• Two main alternative routes:1. Proceed with the RM-ANOVA, BUT make
adjustments to compensate for the inflated risk of a Type I error
2. Use an alternative statistical test, such as MANOVA, using each measurement of the DV as a separate DV in a MANOVA analysis– First alternative is preferred
Copyright ©2010 by Pearson Education, Inc.Upper Saddle River, New Jersey 07458
All rights reserved.
Statistics and Data Analysis for Nursing Research, Second EditionDenise F. Polit
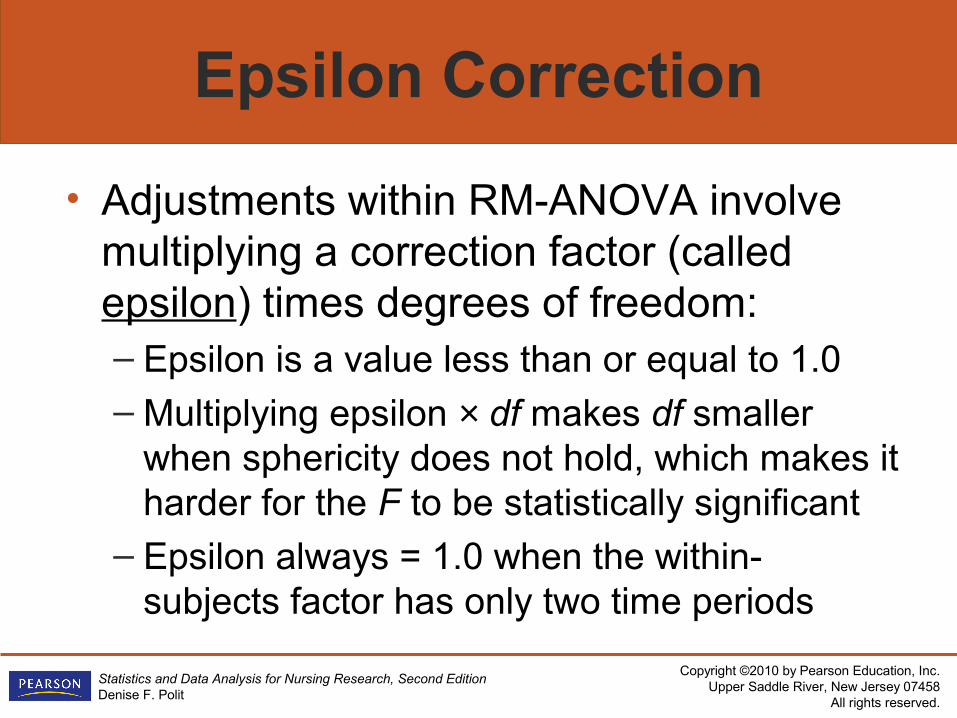
Epsilon Correction
• Adjustments within RM-ANOVA involve multiplying a correction factor (called epsilon) times degrees of freedom:– Epsilon is a value less than or equal to 1.0– Multiplying epsilon × df makes df smaller
when sphericity does not hold, which makes it harder for the F to be statistically significant
– Epsilon always = 1.0 when the within-subjects factor has only two time periods
Copyright ©2010 by Pearson Education, Inc.Upper Saddle River, New Jersey 07458
All rights reserved.
Statistics and Data Analysis for Nursing Research, Second EditionDenise F. Polit
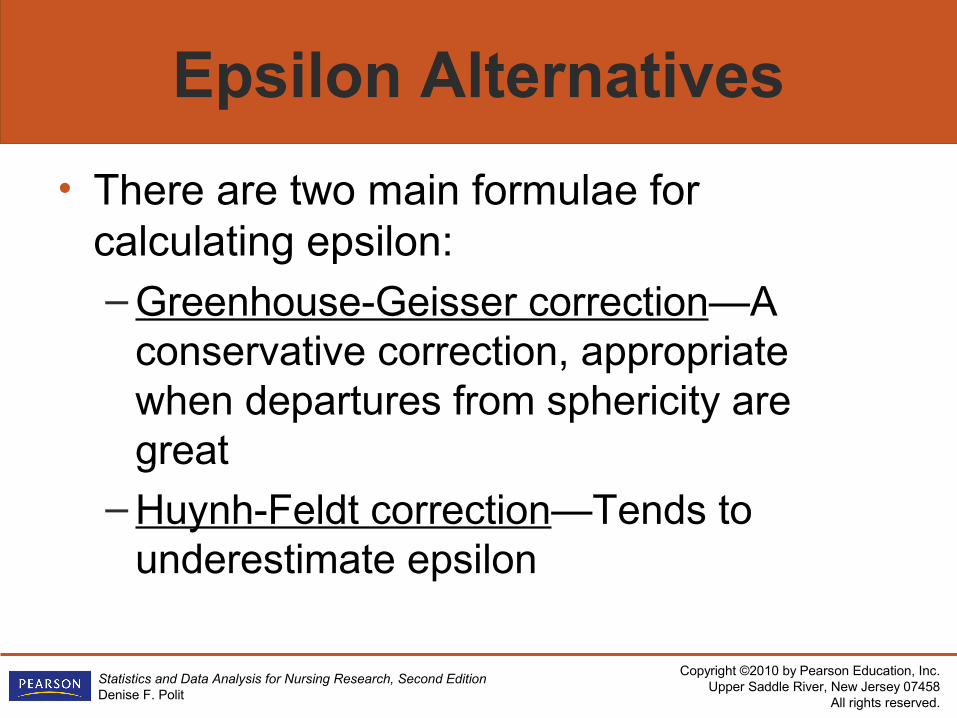
Epsilon Alternatives
• There are two main formulae for calculating epsilon:– Greenhouse-Geisser correction—A
conservative correction, appropriate when departures from sphericity are great
– Huynh-Feldt correction—Tends to underestimate epsilon
Copyright ©2010 by Pearson Education, Inc.Upper Saddle River, New Jersey 07458
All rights reserved.
Statistics and Data Analysis for Nursing Research, Second EditionDenise F. Polit
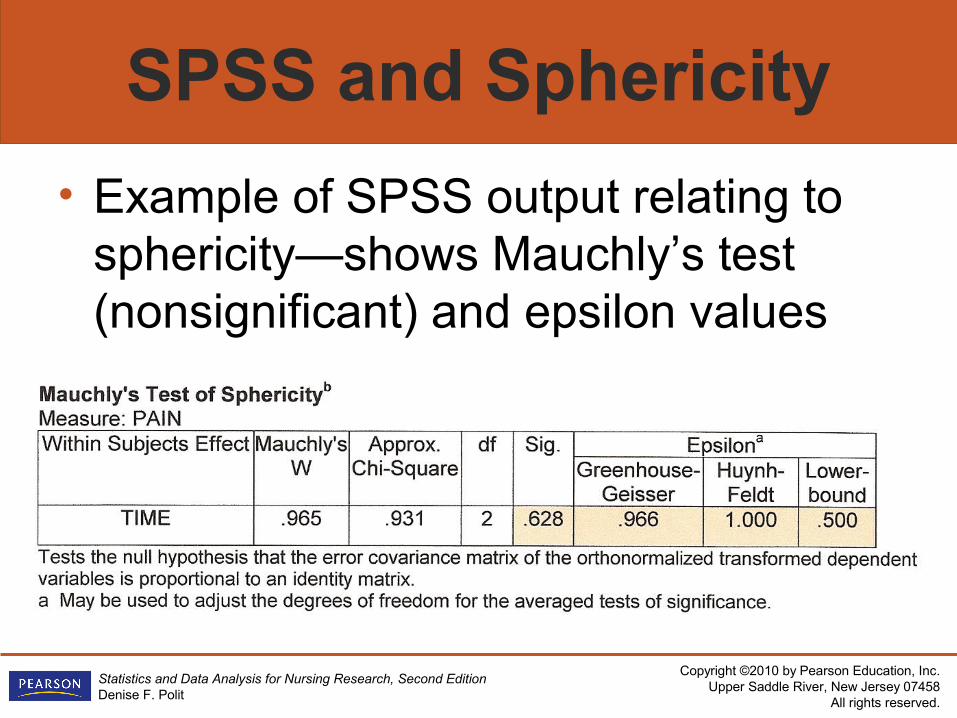
SPSS and Sphericity
• Example of SPSS output relating to sphericity—shows Mauchly’s test (nonsignificant) and epsilon values
Copyright ©2010 by Pearson Education, Inc.Upper Saddle River, New Jersey 07458
All rights reserved.
Statistics and Data Analysis for Nursing Research, Second EditionDenise F. Polit
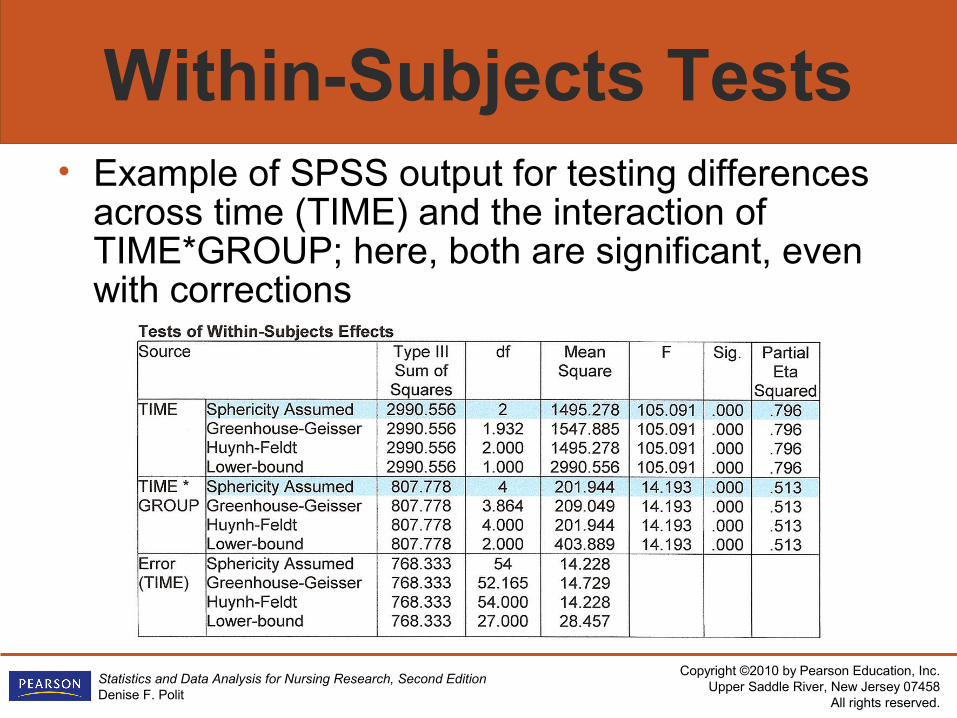
Within-Subjects Tests• Example of SPSS output for testing differences
across time (TIME) and the interaction of TIME*GROUP; here, both are significant, even with corrections
Copyright ©2010 by Pearson Education, Inc.Upper Saddle River, New Jersey 07458
All rights reserved.
Statistics and Data Analysis for Nursing Research, Second EditionDenise F. Polit
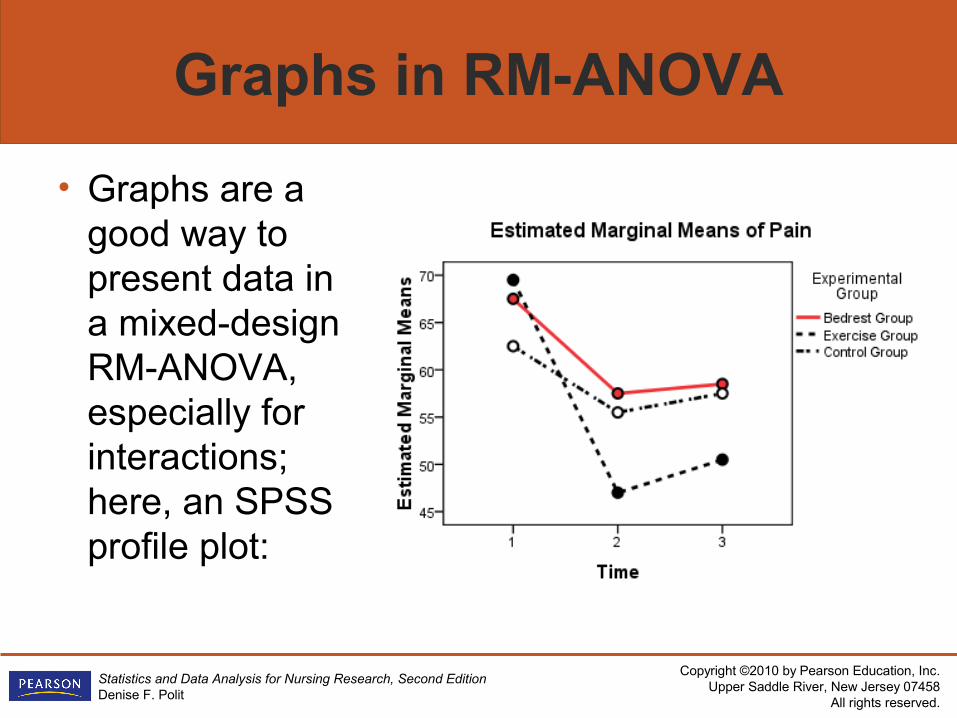
Graphs in RM-ANOVA
• Graphs are a good way to present data in a mixed-design RM-ANOVA, especially for interactions; here, an SPSS profile plot:
Copyright ©2010 by Pearson Education, Inc.Upper Saddle River, New Jersey 07458
All rights reserved.
Statistics and Data Analysis for Nursing Research, Second EditionDenise F. Polit
Canonical Analysis
• Canonical analysis—Used to examine the relationship between two sets of variables, each of which has two or more variables (e.g., two IVs and two DVs)
• Rarely used in nursing research• Analysis involves creating two linear
composites (canonical variates)• Correlations between pairs of canonical
variates are canonical correlations (Rc)
Copyright ©2010 by Pearson Education, Inc.Upper Saddle River, New Jersey 07458
All rights reserved.
Statistics and Data Analysis for Nursing Research, Second EditionDenise F. Polit
Canonical Analysis (cont’d)
• Bartlett’s test of Wilk’s lambda is used to test whether Rc (or a set of Rcs) is significantly different from 0
• Structure coefficients (loadings) are used to interpret canonical correlation results—They show correlations between the original variables and the canonical variate
Copyright ©2010 by Pearson Education, Inc.Upper Saddle River, New Jersey 07458
All rights reserved.
Statistics and Data Analysis for Nursing Research, Second EditionDenise F. Polit
Discriminant Analysis
• Discriminant analysis (aka Discriminant function analysis)—Used to examine relationship between a sets of predictor variables, and a categorical dependent variable
• Similar to multiple regression, except for measurement level of the DV:– DV = Nominal-level variable– IVs = Interval- or ratio-level variables (or
dummy-coded dichotomous variables)
Copyright ©2010 by Pearson Education, Inc.Upper Saddle River, New Jersey 07458
All rights reserved.
Statistics and Data Analysis for Nursing Research, Second EditionDenise F. Polit
Discriminant Functions
• When there are more than two categories (groups) of the DV, separate linear combinations (discriminant functions) are formed
• The number of discriminant function = – Number of categories (groups) minus one, or– Number of predictor variables
Whichever is smaller
Copyright ©2010 by Pearson Education, Inc.Upper Saddle River, New Jersey 07458
All rights reserved.
Statistics and Data Analysis for Nursing Research, Second EditionDenise F. Polit
Discriminant Equation
• Discriminant analysis yields a discriminant equation (like a regression equation)
• Equation consists of intercept constant (a) and b weights for each predictor
• Equation can be used to predict a discriminant score (D) for each study participant
Copyright ©2010 by Pearson Education, Inc.Upper Saddle River, New Jersey 07458
All rights reserved.
Statistics and Data Analysis for Nursing Research, Second EditionDenise F. Polit
Structure Coefficients
• The correlation between D scores and individual predictors are structure coefficients (loadings), as in canonical analysis
• Loadings are important for understanding the dimensions along which groups can be differentiated when there are more than two groups
Copyright ©2010 by Pearson Education, Inc.Upper Saddle River, New Jersey 07458
All rights reserved.
Statistics and Data Analysis for Nursing Research, Second EditionDenise F. Polit
Significance Tests
• Main null hypothesis in discriminant analysis is that the discriminant functions reflect chance sampling fluctuations
• Test of significance is usually based on Wilk’s lambda
• In discriminant analysis, predictors can be entered simultaneously, in a hierarchical fashion (under researcher’s decision), or in a stepwise fashion (statistical decision)
Copyright ©2010 by Pearson Education, Inc.Upper Saddle River, New Jersey 07458
All rights reserved.
Statistics and Data Analysis for Nursing Research, Second EditionDenise F. Polit
Classification
• Based on discriminant scores, people in the original sample can be classified into groups—which permits inspection of how good a job the analysis did in predicting group membership:– Predicted group can be compared to actual
group membership, to see how good the analysis is at predicting a person’s status