Polit ln ch06
41
Copyright ©2010 by Pearson Education, Inc. Upper Saddle River, New Jersey 07458 All rights reserved. Statistics and Data Analysis for Nursing Research, Second Edition Denise F. Polit Statistics and Data Analysis for Nursing Research Second Edition CHAPTER t-Tests: Testing Two Mean Differences 6
-
Upload
stanbridge -
Category
Documents
-
view
141 -
download
5
Transcript of Polit ln ch06

Copyright ©2010 by Pearson Education, Inc.Upper Saddle River, New Jersey 07458
All rights reserved.
Statistics and Data Analysis for Nursing Research, Second EditionDenise F. Polit
Statistics and Data Analysisfor Nursing Research
Second Edition
CHAPTER
t-Tests: Testing Two Mean Differences
6
Copyright ©2010 by Pearson Education, Inc.Upper Saddle River, New Jersey 07458
All rights reserved.
Statistics and Data Analysis for Nursing Research, Second EditionDenise F. Polit
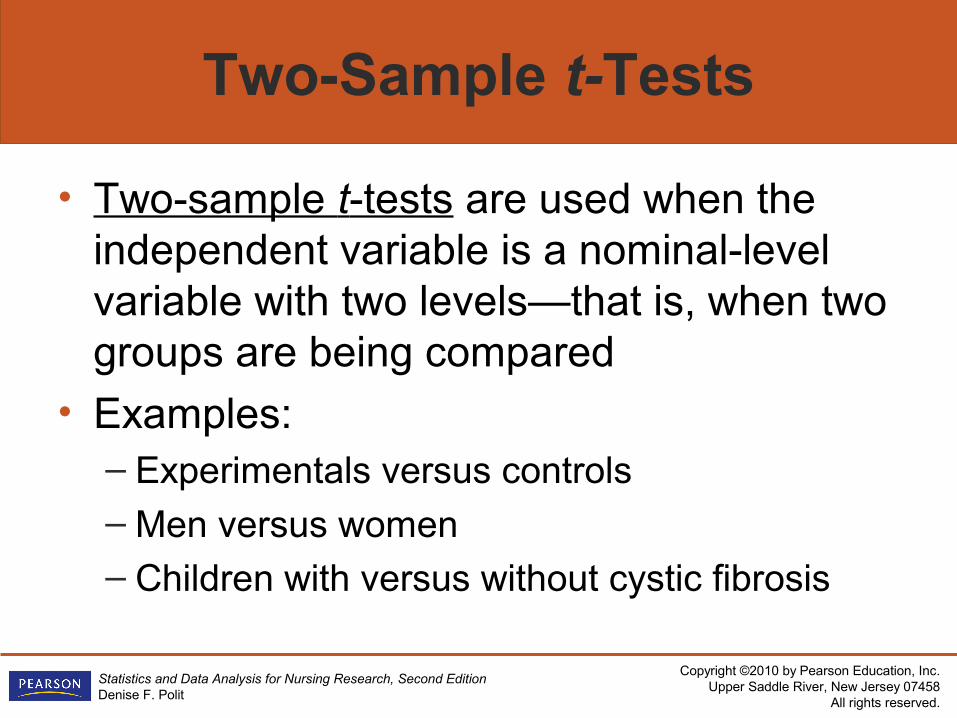
Two-Sample t-Tests
• Two-sample t-tests are used when the independent variable is a nominal-level variable with two levels—that is, when two groups are being compared
• Examples:– Experimentals versus controls– Men versus women– Children with versus without cystic fibrosis

Copyright ©2010 by Pearson Education, Inc.Upper Saddle River, New Jersey 07458
All rights reserved.
Statistics and Data Analysis for Nursing Research, Second EditionDenise F. Polit
Two-Sample t-Tests (cont’d)
• Two-sample t-tests are used when the dependent variable is an interval- or ratio-level variable—that is, a variable for which it is appropriate to compute a mean
• Examples:– Weight (pounds or kilos)– Scores on a stress scale– Fatigue (measured on a 100-point visual analog
scale)
Copyright ©2010 by Pearson Education, Inc.Upper Saddle River, New Jersey 07458
All rights reserved.
Statistics and Data Analysis for Nursing Research, Second EditionDenise F. Polit
Null Hypotheses for t-Tests
• The null hypothesis is that the two group means are the same—i.e., that the independent variable and dependent variable are not related
• Formally stated:– H0: µ1 = µ2 where
– µ1 = the mean for Group 1 and
– µ2 = the mean for Group 2
Copyright ©2010 by Pearson Education, Inc.Upper Saddle River, New Jersey 07458
All rights reserved.
Statistics and Data Analysis for Nursing Research, Second EditionDenise F. Polit
Alternative Hypotheses for t-Tests
• The alternative (research) hypothesis is that the two group means are different—that is, that the independent variable and dependent variable are related
• Formally stated (nondirectional):– H0: µ1 ≠ µ2 where
– µ1 = the mean for Group 1 and
– µ2 = the mean for Group 2

Copyright ©2010 by Pearson Education, Inc.Upper Saddle River, New Jersey 07458
All rights reserved.
Statistics and Data Analysis for Nursing Research, Second EditionDenise F. Polit
Testing the Null Hypothesis
• In a two-sample t-test, testing the null hypothesis involves computing a test statistic and comparing it to values of what is “improbable,” if the null hypothesis were true – What is “improbable” lies in the tails of a theoretical
sampling distribution
• Here, the relevant distribution is the sampling distribution of the difference between two means
Copyright ©2010 by Pearson Education, Inc.Upper Saddle River, New Jersey 07458
All rights reserved.
Statistics and Data Analysis for Nursing Research, Second EditionDenise F. Polit
Sampling Distribution
• The mean of this sampling distribution of the difference between two means always equals the population mean difference
• The standard error of this distribution is the standard error of the difference (SED) and is a key component in computing the t statistic
Copyright ©2010 by Pearson Education, Inc.Upper Saddle River, New Jersey 07458
All rights reserved.
Statistics and Data Analysis for Nursing Research, Second EditionDenise F. Polit
Assumptions for t-Tests
• To use a t-test, it is assumed that:– Cases have been independently and
randomly sampled from the two populations– The outcome variable is normally distributed
in the two populations– The two population variances are equal: This
is the assumption of the homogeneity of variance
Copyright ©2010 by Pearson Education, Inc.Upper Saddle River, New Jersey 07458
All rights reserved.
Statistics and Data Analysis for Nursing Research, Second EditionDenise F. Polit
Assumptions for t-Tests (cont’d)
• Robustness of the t-test—violations of the last two assumptions do not affect statistical decision making if:– Sample sizes are large (40+ per group)– Sample sizes in the two groups are similar
(less than 1.5 times the number in one group as in the other group)
Copyright ©2010 by Pearson Education, Inc.Upper Saddle River, New Jersey 07458
All rights reserved.
Statistics and Data Analysis for Nursing Research, Second EditionDenise F. Polit
Tests for Assumptions
• With small samples, or severely unequal group sizes, violation of assumptions should be tested
• Test for normality: the Kolgomorov-Smirnov test
• Test for equal variances: Levene’s F test
Copyright ©2010 by Pearson Education, Inc.Upper Saddle River, New Jersey 07458
All rights reserved.
Statistics and Data Analysis for Nursing Research, Second EditionDenise F. Polit
Types of t-Tests
• There are three different formulas for computing a t statistic, all of which share the goal of testing mean differences between two groups:– Independent groups t-test
Pooled variance formula Separate variance formula
– Dependent groups t-test
Copyright ©2010 by Pearson Education, Inc.Upper Saddle River, New Jersey 07458
All rights reserved.
Statistics and Data Analysis for Nursing Research, Second EditionDenise F. Polit
Independent Groups t-Tests
• Independent groups t-test: Used to test the difference between means for two unrelated groups
• Examples: Men versus women Teenagers versus adults Lung cancer patients versus pancreatic cancer
patients
• The people in the two groups are not the same people, and they are not related to each other in any systematic way

Copyright ©2010 by Pearson Education, Inc.Upper Saddle River, New Jersey 07458
All rights reserved.
Statistics and Data Analysis for Nursing Research, Second EditionDenise F. Polit
Pooled Variance Formula
• The basic formula for the independent groups t-test uses a pooled variance estimate for the standard error of the difference– The numerator in the equation to compute t is the
difference in sample means (M1 – M2)
– The denominator is the estimated SED
– Degrees of freedom = n1 + n2 – 2
• If calculated t (absolute value) > tabled t (for appropriate df and α), the result is statistically significant
Copyright ©2010 by Pearson Education, Inc.Upper Saddle River, New Jersey 07458
All rights reserved.
Statistics and Data Analysis for Nursing Research, Second EditionDenise F. Polit
Pooled Variance Formula (cont’d)
• The pooled variance formula can be used if the population variances are equal–tested via Levene’s test– If the F from this test is significant, the pooled
variance formula should not be used
• Levene’s test is automatically run within SPSS when doing an independent groups t-test
Copyright ©2010 by Pearson Education, Inc.Upper Saddle River, New Jersey 07458
All rights reserved.
Statistics and Data Analysis for Nursing Research, Second EditionDenise F. Polit
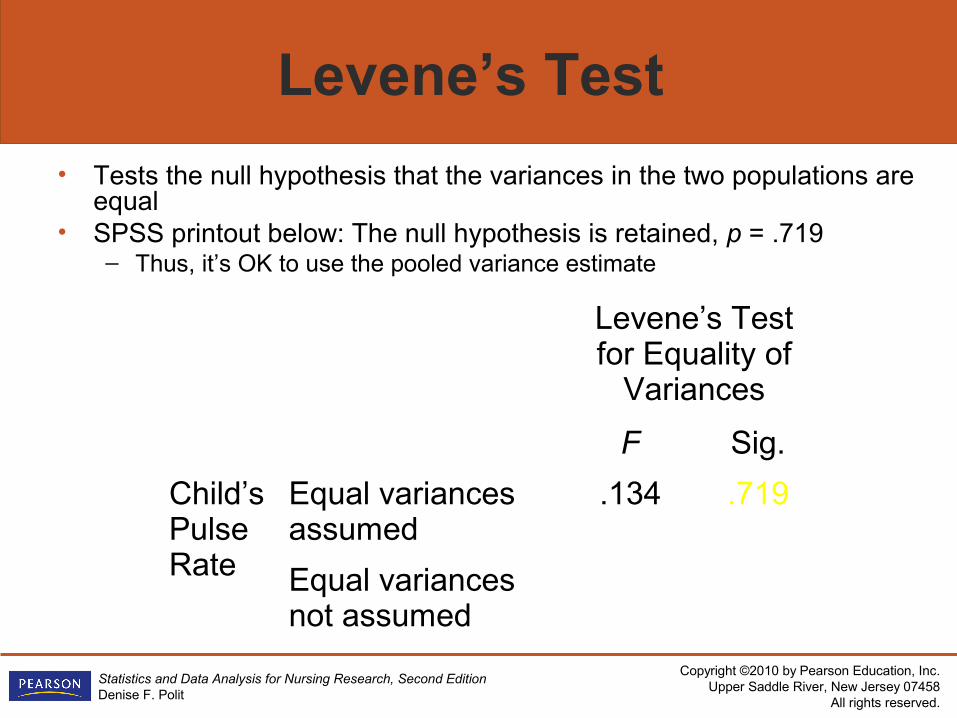
Levene’s Test
• Tests the null hypothesis that the variances in the two populations are equal
• SPSS printout below: The null hypothesis is retained, p = .719– Thus, it’s OK to use the pooled variance estimate
Levene’s Test for Equality of
Variances
F Sig.
Child’s Pulse Rate
Equal variances assumed
.134 .719
Equal variances not assumed
Copyright ©2010 by Pearson Education, Inc.Upper Saddle River, New Jersey 07458
All rights reserved.
Statistics and Data Analysis for Nursing Research, Second EditionDenise F. Polit
Separate Variance Formula
• If Levene’s test indicates statistically significant differences in variances, the separate variance formula should be used to estimate SED in computing the t statistic
Copyright ©2010 by Pearson Education, Inc.Upper Saddle River, New Jersey 07458
All rights reserved.
Statistics and Data Analysis for Nursing Research, Second EditionDenise F. Polit
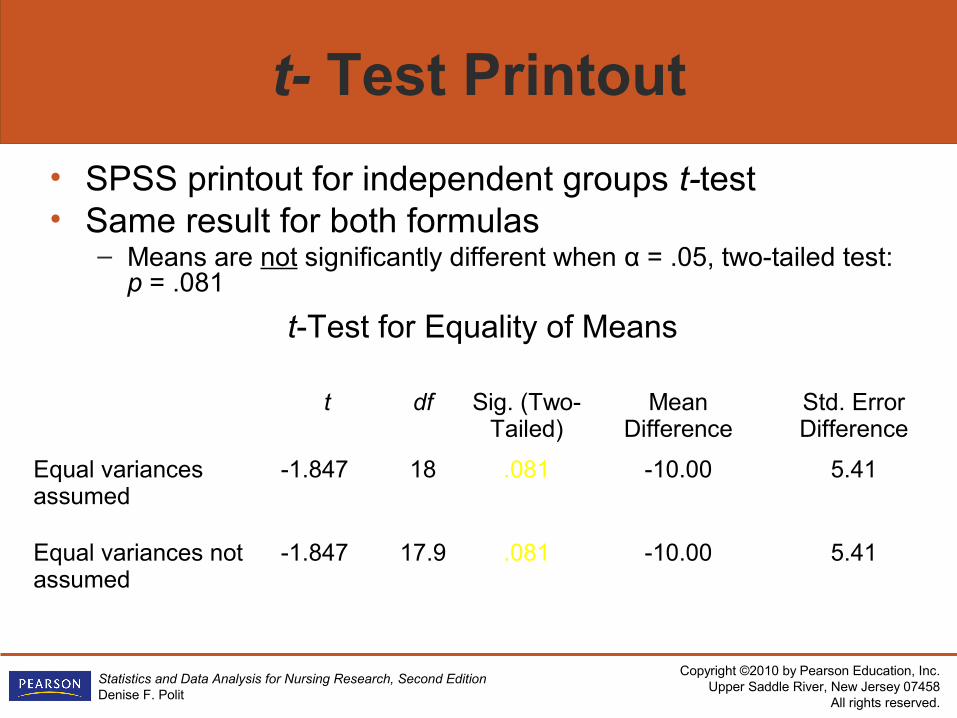
t- Test Printout
• SPSS printout for independent groups t-test• Same result for both formulas
– Means are not significantly different when α = .05, two-tailed test: p = .081
t-Test for Equality of Means
t df Sig. (Two-Tailed)
Mean Difference
Std. Error Difference
Equal variances assumed
-1.847 18 .081 -10.00 5.41
Equal variances not assumed
-1.847 17.9 .081 -10.00 5.41

Copyright ©2010 by Pearson Education, Inc.Upper Saddle River, New Jersey 07458
All rights reserved.
Statistics and Data Analysis for Nursing Research, Second EditionDenise F. Polit
Dependent Groups t-Tests
• Dependent groups t-test: Used to test the difference between means for two related groups, or for the same people measured twice – Also called a paired t-test or correlated groups t-test
• Examples: Preintervention versus postintervention Husbands and wives Twins
• The people in the two groups are systematically connected, which lowers variability (the SED)
Copyright ©2010 by Pearson Education, Inc.Upper Saddle River, New Jersey 07458
All rights reserved.
Statistics and Data Analysis for Nursing Research, Second EditionDenise F. Polit
Dependent Groups t-Tests (cont’d)
• Dependent groups t-test formula for computing t :– Numerator: The mean difference between
pairs of values (MD)
– Denominator: Estimated standard error of the difference
– df = number of pairs - 1
Copyright ©2010 by Pearson Education, Inc.Upper Saddle River, New Jersey 07458
All rights reserved.
Statistics and Data Analysis for Nursing Research, Second EditionDenise F. Polit
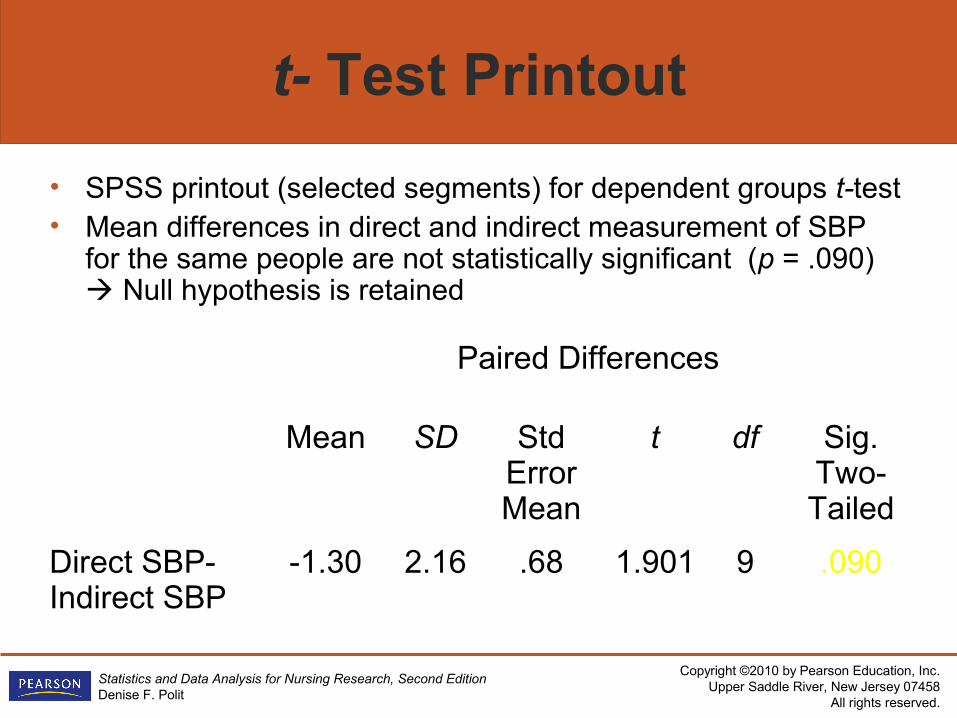
t- Test Printout
• SPSS printout (selected segments) for dependent groups t-test• Mean differences in direct and indirect measurement of SBP
for the same people are not statistically significant (p = .090) Null hypothesis is retained
Paired Differences
Mean SD Std Error Mean
t df Sig. Two-Tailed
Direct SBP-Indirect SBP
-1.30 2.16 .68 1.901 9 .090
Copyright ©2010 by Pearson Education, Inc.Upper Saddle River, New Jersey 07458
All rights reserved.
Statistics and Data Analysis for Nursing Research, Second EditionDenise F. Polit
Other Statistical Issues
• Existence of a relationship: t-tests
• Nature of relationship: Direct comparison of the two means
• Precision of estimates: Confidence intervals around the mean difference
• Magnitude of estimates: Effect size
Copyright ©2010 by Pearson Education, Inc.Upper Saddle River, New Jersey 07458
All rights reserved.
Statistics and Data Analysis for Nursing Research, Second EditionDenise F. Polit
Confidence Intervals
• A CI can be constructed around the difference between the two group means, to indicate precision of sample estimate
• Formula for CIs: – Compute the mean group difference (M1 – M2)
– Then add/subtract SED × the tabled value of t for correct CI (e.g., 95%) and df

Copyright ©2010 by Pearson Education, Inc.Upper Saddle River, New Jersey 07458
All rights reserved.
Statistics and Data Analysis for Nursing Research, Second EditionDenise F. Polit
Effect Size
• Effect size is a measure of the strength (magnitude) of the relationship between variables in the population– When calculated with sample data, an effect size is an
estimate of “how wrong” the null hypothesis is
• Effect size is a critical construct in meta-analyses—analyses that integrate the results of multiple studies on a given question statistically

Copyright ©2010 by Pearson Education, Inc.Upper Saddle River, New Jersey 07458
All rights reserved.
Statistics and Data Analysis for Nursing Research, Second EditionDenise F. Polit
Cohen’s d
• In a two-group mean-difference situation (like when a t-test is called for), the effect size is Cohen’s d– Sometimes called the standardized mean
difference (SMD)
• The d statistic captures the amount of difference in the two means, in standard deviation units– d = (M1 – M2) ÷ pooled SD

Copyright ©2010 by Pearson Education, Inc.Upper Saddle River, New Jersey 07458
All rights reserved.
Statistics and Data Analysis for Nursing Research, Second EditionDenise F. Polit
Cohen’s Guidelines
• Cohen provided these qualitative descriptors for d: d = .20 = Small effect
d = .50 = Moderate effect
d = .80 = Large effect
Most effect sizes in nursing research are in the vicinity of .35 (small to moderate)

Copyright ©2010 by Pearson Education, Inc.Upper Saddle River, New Jersey 07458
All rights reserved.
Statistics and Data Analysis for Nursing Research, Second EditionDenise F. Polit
Effect Size and Power
• Effect size strongly affects the power of a statistical test—i.e., the power to correctly reject the null hypothesis when it is false
• Power is the inverse of β, the risk of a Type II error– Power = 1 – β

Copyright ©2010 by Pearson Education, Inc.Upper Saddle River, New Jersey 07458
All rights reserved.
Statistics and Data Analysis for Nursing Research, Second EditionDenise F. Polit
Power Analysis
• Power analysis is most often used during the planning phase of a study to estimate how many participants are needed to minimize the risk of a Type II error
• Just as .05 is the standard acceptable risk for a Type I error, .20 is the standard for a Type II error– So, minimum acceptable power = .80
Copyright ©2010 by Pearson Education, Inc.Upper Saddle River, New Jersey 07458
All rights reserved.
Statistics and Data Analysis for Nursing Research, Second EditionDenise F. Polit
Power Analysis Components
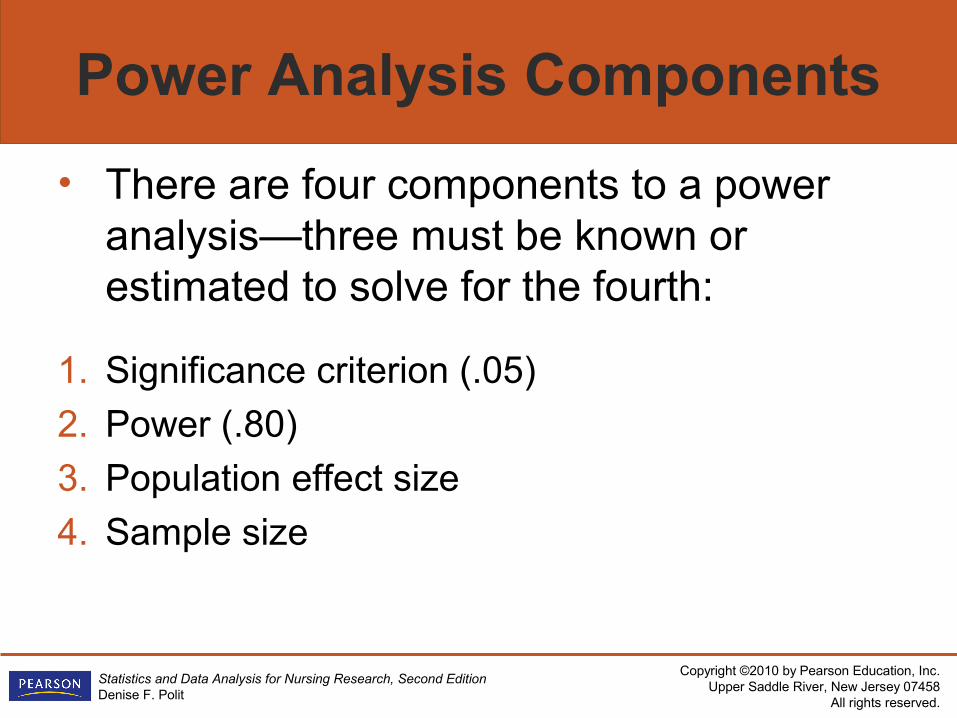
• There are four components to a power analysis—three must be known or estimated to solve for the fourth:
1. Significance criterion (.05)
2. Power (.80)
3. Population effect size
4. Sample size
Copyright ©2010 by Pearson Education, Inc.Upper Saddle River, New Jersey 07458
All rights reserved.
Statistics and Data Analysis for Nursing Research, Second EditionDenise F. Polit
Sample Size Estimation
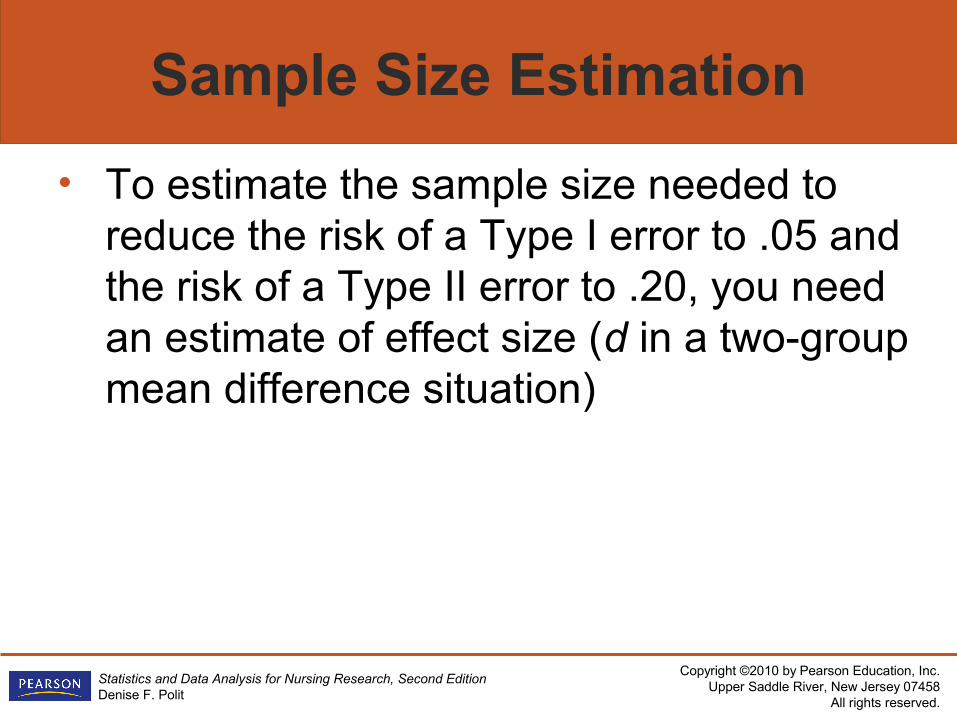
• To estimate the sample size needed to reduce the risk of a Type I error to .05 and the risk of a Type II error to .20, you need an estimate of effect size (d in a two-group mean difference situation)
Copyright ©2010 by Pearson Education, Inc.Upper Saddle River, New Jersey 07458
All rights reserved.
Statistics and Data Analysis for Nursing Research, Second EditionDenise F. Polit
Sample Size Estimation (cont’d)
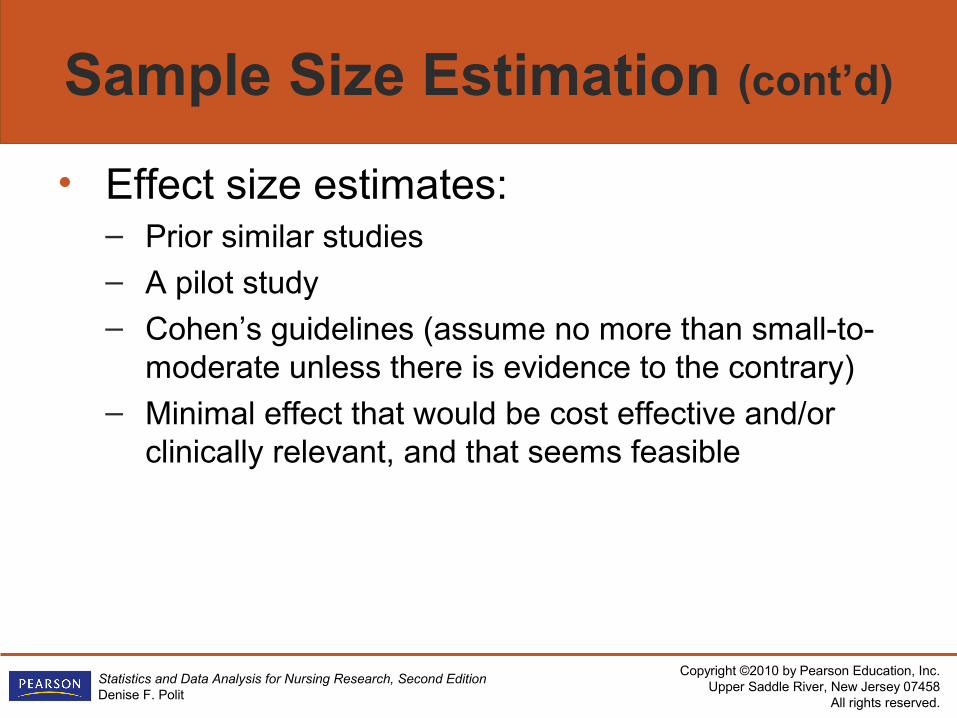
• Effect size estimates:– Prior similar studies– A pilot study
– Cohen’s guidelines (assume no more than small-to-moderate unless there is evidence to the contrary)
– Minimal effect that would be cost effective and/or clinically relevant, and that seems feasible
Copyright ©2010 by Pearson Education, Inc.Upper Saddle River, New Jersey 07458
All rights reserved.
Statistics and Data Analysis for Nursing Research, Second EditionDenise F. Polit
Power Analysis Examples
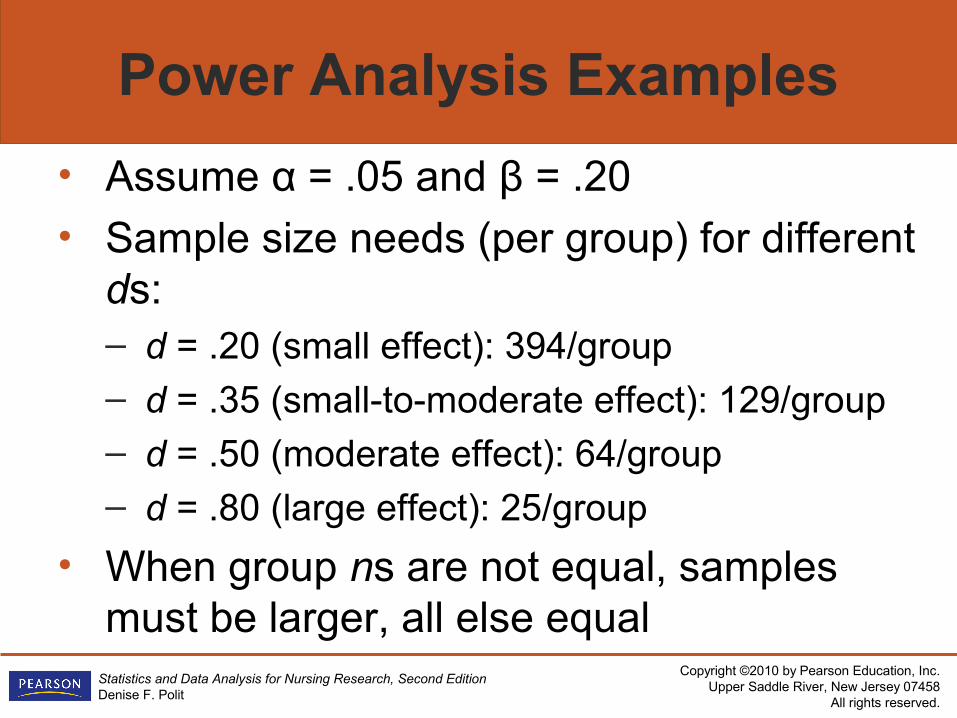
• Assume α = .05 and β = .20• Sample size needs (per group) for different
ds:– d = .20 (small effect): 394/group– d = .35 (small-to-moderate effect): 129/group– d = .50 (moderate effect): 64/group– d = .80 (large effect): 25/group
• When group ns are not equal, samples must be larger, all else equal

Copyright ©2010 by Pearson Education, Inc.Upper Saddle River, New Jersey 07458
All rights reserved.
Statistics and Data Analysis for Nursing Research, Second EditionDenise F. Polit
Post Hoc Power Analysis
• It is sometimes useful to estimate what power actually was in a study, especially if results are not significant– Somewhat controversial, but can be useful in
interpretation and in thinking about “next steps” for moving an area of research forward
• Here, effect size and sample size are known, and so the analysis solves for power
Copyright ©2010 by Pearson Education, Inc.Upper Saddle River, New Jersey 07458
All rights reserved.
Statistics and Data Analysis for Nursing Research, Second EditionDenise F. Polit
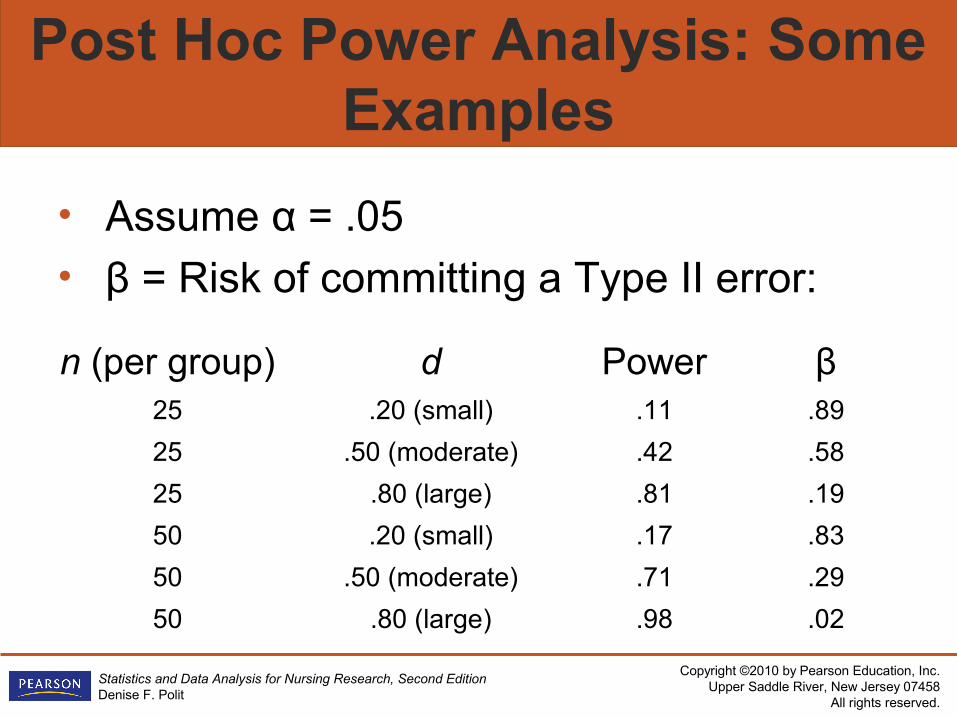
Post Hoc Power Analysis: Some Examples
• Assume α = .05 • β = Risk of committing a Type II error:
n (per group) d Power β25 .20 (small) .11 .89
25 .50 (moderate) .42 .58
25 .80 (large) .81 .19
50 .20 (small) .17 .83
50 .50 (moderate) .71 .29
50 .80 (large) .98 .02
Copyright ©2010 by Pearson Education, Inc.Upper Saddle River, New Jersey 07458
All rights reserved.
Statistics and Data Analysis for Nursing Research, Second EditionDenise F. Polit
Uses of t-Tests
• Primary use of t-tests—Substantive:– To answer research questions and test
substantive research hypotheses involving comparisons between two groups
• Other uses—Methodologic
Copyright ©2010 by Pearson Education, Inc.Upper Saddle River, New Jersey 07458
All rights reserved.
Statistics and Data Analysis for Nursing Research, Second EditionDenise F. Polit
Uses of t-Tests (cont’d)
• Evaluations of a study’s internal validity through bias assessment– Internal validity concerns the strength of inferences
about the degree to which the independent variable really affected the dependent variable
Copyright ©2010 by Pearson Education, Inc.Upper Saddle River, New Jersey 07458
All rights reserved.
Statistics and Data Analysis for Nursing Research, Second EditionDenise F. Polit
Uses of t-Tests (cont’d)
• Bias assessment examples:– Selection bias: Are groups being compared
really comparable (e.g., experimentals and controls)?
– Attrition bias: Are people who dropped out similar to those who stayed in a study?
Copyright ©2010 by Pearson Education, Inc.Upper Saddle River, New Jersey 07458
All rights reserved.
Statistics and Data Analysis for Nursing Research, Second EditionDenise F. Polit
Uses of t-Tests (cont’d)
• To contribute evidence about the construct validity of a scale, through the use of the known-groups technique– Involves comparing two groups who are
hypothesized, based on theory or prior research, to differ on the new instrument

Copyright ©2010 by Pearson Education, Inc.Upper Saddle River, New Jersey 07458
All rights reserved.
Statistics and Data Analysis for Nursing Research, Second EditionDenise F. Polit
t-Tests in SPSS: Independent Groups
• Select Analyze Compare Means Independent Samples T Test
• Move dependent variable from list into slot for Test Variables
Copyright ©2010 by Pearson Education, Inc.Upper Saddle River, New Jersey 07458
All rights reserved.
Statistics and Data Analysis for Nursing Research, Second EditionDenise F. Polit
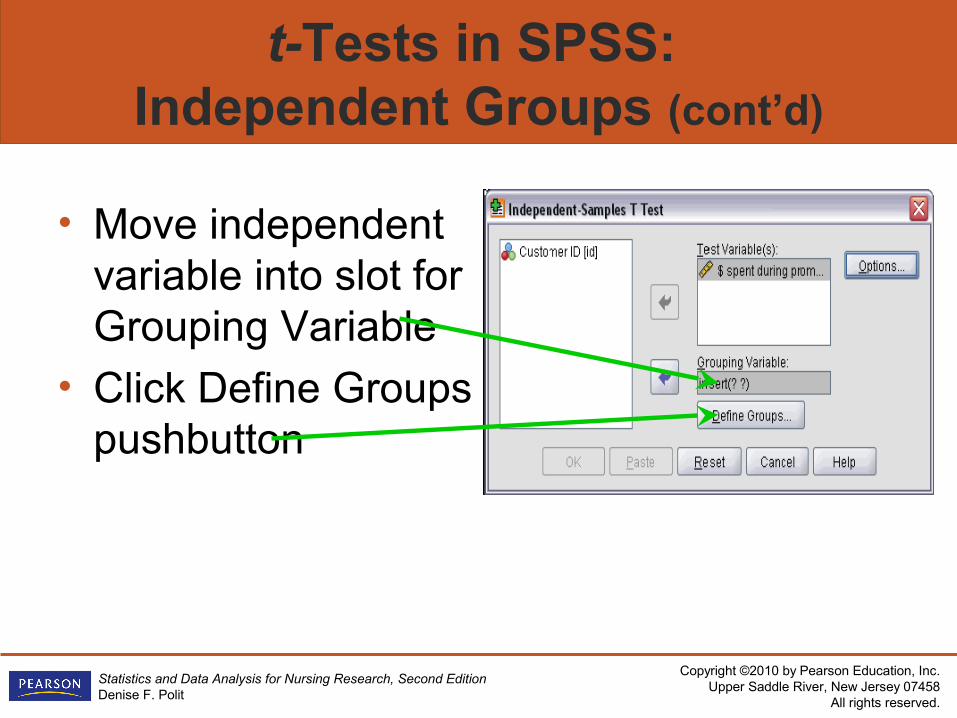
t-Tests in SPSS: Independent Groups (cont’d)
• Move independent variable into slot for Grouping Variable
• Click Define Groups pushbutton
Copyright ©2010 by Pearson Education, Inc.Upper Saddle River, New Jersey 07458
All rights reserved.
Statistics and Data Analysis for Nursing Research, Second EditionDenise F. Polit
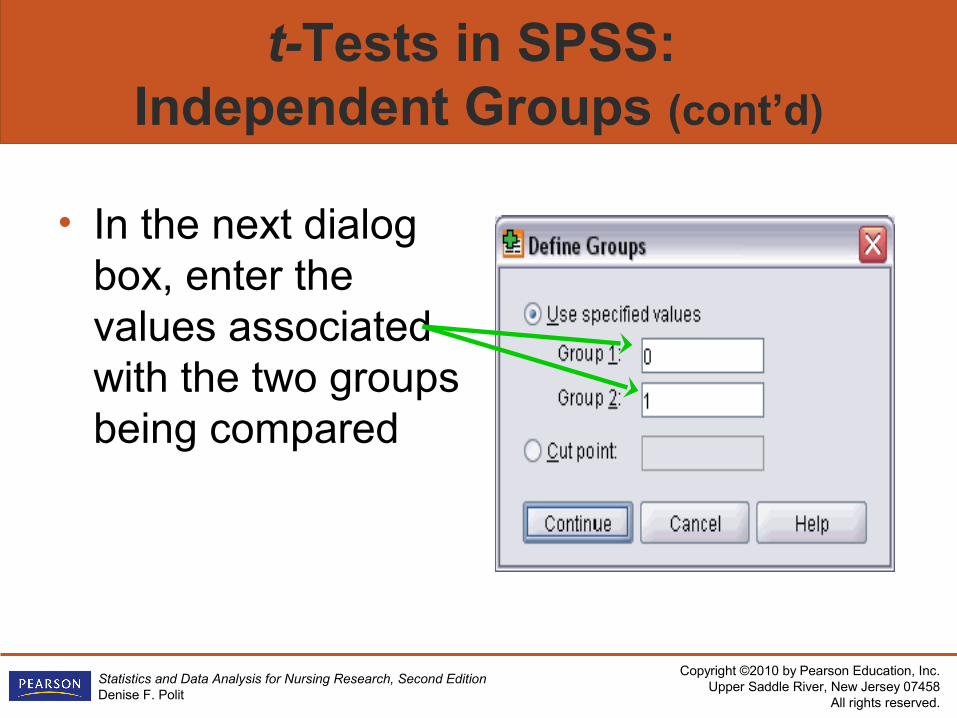
t-Tests in SPSS: Independent Groups (cont’d)
• In the next dialog box, enter the values associated with the two groups being compared

Copyright ©2010 by Pearson Education, Inc.Upper Saddle River, New Jersey 07458
All rights reserved.
Statistics and Data Analysis for Nursing Research, Second EditionDenise F. Polit
t-Tests in SPSS: Dependent Groups
• Select Analyze Compare Means Paired Samples T Test
• Select one or more pairs of variables, moving them from list into Paired Variables slot