![FONCTION LOGARITHME NEPERIEN - maths et tiques · On la note lna. La fonction logarithme népérien, notée ln, est la fonction : ln: 0;] +∞ ...](https://static.fdocuments.fr/doc/165x107/5b2ccd807f8b9ad76e8b7629/fonction-logarithme-neperien-maths-et-tiques-on-la-note-lna-la-fonction-logarithme.jpg)
Polit ln ch05
63
Copyright ©2010 by Pearson Education, Inc. Upper Saddle River, New Jersey 07458 All rights reserved. Statistics and Data Analysis for Nursing Research, Second Edition Denise F. Polit Statistics and Data Analysis for Nursing Research Second Edition CHAPTER Statistical Inference 5
-
Upload
stanbridge -
Category
Documents
-
view
52 -
download
5
Transcript of Polit ln ch05
Copyright ©2010 by Pearson Education, Inc.Upper Saddle River, New Jersey 07458
All rights reserved.
Statistics and Data Analysis for Nursing Research, Second EditionDenise F. Polit
Statistics and Data Analysisfor Nursing Research
Second Edition
CHAPTER
Statistical Inference
5
Copyright ©2010 by Pearson Education, Inc.Upper Saddle River, New Jersey 07458
All rights reserved.
Statistics and Data Analysis for Nursing Research, Second EditionDenise F. Polit
Inferential Statistics
• Descriptive statistics—for describing samples
• Inferential statistics—for coming to conclusions about what is probably true in a population, based on sample values
• Inferential statistics uses the laws of probability to provide guidance on what is probably true

Copyright ©2010 by Pearson Education, Inc.Upper Saddle River, New Jersey 07458
All rights reserved.
Statistics and Data Analysis for Nursing Research, Second EditionDenise F. Polit
The Probability of an Event
• Probability of an event (p) is expressed as a proportion
• The probability of drawing a red card from a normal shuffled deck:Ways “red” event can occur = 26Total number of possibilities = 52
• p = .50: There is a 50-50 chance that the card will be a red suit
Copyright ©2010 by Pearson Education, Inc.Upper Saddle River, New Jersey 07458
All rights reserved.
Statistics and Data Analysis for Nursing Research, Second EditionDenise F. Polit
Probability of Consecutive Events
• Multiplicative law provides this formula:
p (A then B) = p (A) × p (B)
• The probability of drawing two red cards consecutively:– p (red, then red) = p (red) × p (red)
– p (red, then red) = .50 × .50 = .25
• p = .25: There is a one in four chance of drawing two red cards in a row
Copyright ©2010 by Pearson Education, Inc.Upper Saddle River, New Jersey 07458
All rights reserved.
Statistics and Data Analysis for Nursing Research, Second EditionDenise F. Polit
Probability and Hypothesis Testing
• Null hypothesis (H0) is that the deck is fair—not “rigged”
• Alternative hypothesis (H1): Deck is rigged
• What is the probability of drawing 10 red cards in a row if the null hypothesis of a fair deck is true?
• p = .50 × .50 × .50 × .50 × .50 × .50 × .50 × .50 × .50 × .50 = .001
• Only 1 in 1,000 draws of 10 cards from a fair deck would yield all red cards
Copyright ©2010 by Pearson Education, Inc.Upper Saddle River, New Jersey 07458
All rights reserved.
Statistics and Data Analysis for Nursing Research, Second EditionDenise F. Polit
Probability as an Area
• Probability distributions are similar to frequency polygons (or histograms)
• They graph the probabilities of all events that could occur– So, the total area of a probability distribution
= 1.0
Copyright ©2010 by Pearson Education, Inc.Upper Saddle River, New Jersey 07458
All rights reserved.
Statistics and Data Analysis for Nursing Research, Second EditionDenise F. Polit
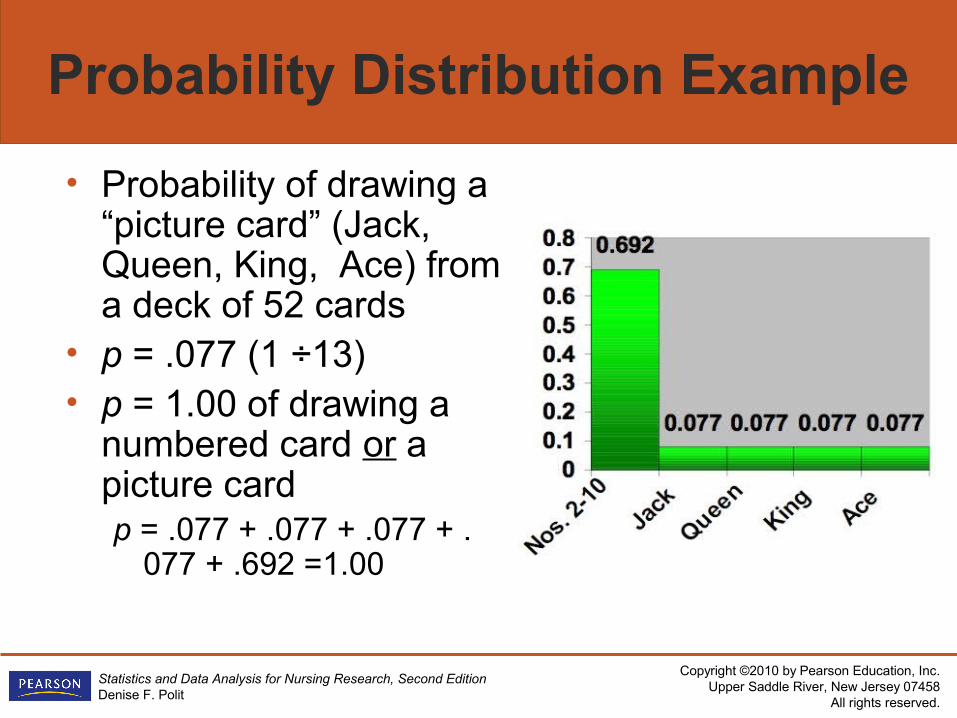
Probability Distribution Example
• Probability of drawing a “picture card” (Jack, Queen, King, Ace) from a deck of 52 cards
• p = .077 (1 ÷13)• p = 1.00 of drawing a
numbered card or a picture cardp = .077 + .077 + .077 + .
077 + .692 =1.00
Copyright ©2010 by Pearson Education, Inc.Upper Saddle River, New Jersey 07458
All rights reserved.
Statistics and Data Analysis for Nursing Research, Second EditionDenise F. Polit
Probability Density Functions
• Probability density function = Probability distribution for continuous variables
• Example: A distribution of IQ scores for a population of 10,000 10-year-old children– Population mean = 100.0 = μ– Population SD = 15.0 = σ
Copyright ©2010 by Pearson Education, Inc.Upper Saddle River, New Jersey 07458
All rights reserved.
Statistics and Data Analysis for Nursing Research, Second EditionDenise F. Polit
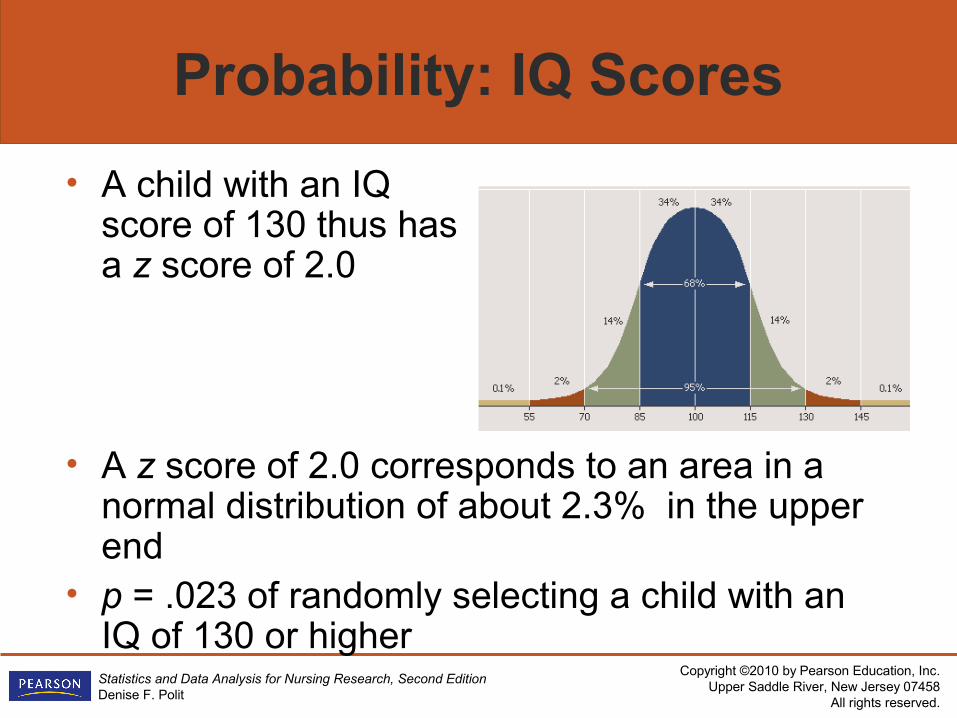
Probability: IQ Scores
• A child with an IQ score of 130 thus has a z score of 2.0
• A z score of 2.0 corresponds to an area in a normal distribution of about 2.3% in the upper end
• p = .023 of randomly selecting a child with an IQ of 130 or higher
Copyright ©2010 by Pearson Education, Inc.Upper Saddle River, New Jersey 07458
All rights reserved.
Statistics and Data Analysis for Nursing Research, Second EditionDenise F. Polit
Sampling Error
• If we sampled 25 10-year-old children from the population, would the mean IQ score be exactly 100.0?– Unlikely!
• Sample means from a population tend to fluctuate from one sample to another because of sampling error – The sample mean might be 98.2 or
101.6 or 99.7
Copyright ©2010 by Pearson Education, Inc.Upper Saddle River, New Jersey 07458
All rights reserved.
Statistics and Data Analysis for Nursing Research, Second EditionDenise F. Polit
Sampling Distributions
• A sampling distribution of the mean is the distribution of an infinite number of sample means from the population, for samples of a given size (e.g., 25)
• A sampling distribution is a theoretical (not an actual) distribution of values
Copyright ©2010 by Pearson Education, Inc.Upper Saddle River, New Jersey 07458
All rights reserved.
Statistics and Data Analysis for Nursing Research, Second EditionDenise F. Polit
Central Limit Theorem
• The central limit theorem, a mathematic formulation, shows that the mean of a sampling distribution of the mean always equals the population mean
• If population values are normally distributed, so is the sampling distribution of the mean– With large Ns, sampling distributions are
normally distributed even when population values are not
Copyright ©2010 by Pearson Education, Inc.Upper Saddle River, New Jersey 07458
All rights reserved.
Statistics and Data Analysis for Nursing Research, Second EditionDenise F. Polit
Standard Error of the Mean
• The standard error of the mean (SEM) is the standard deviation of a theoretical sampling distribution
• The larger the SEM, the less likely it is that a sample mean is a good estimate of the population mean
• SEMs are never known, but can be estimated
Copyright ©2010 by Pearson Education, Inc.Upper Saddle River, New Jersey 07458
All rights reserved.
Statistics and Data Analysis for Nursing Research, Second EditionDenise F. Polit
Formula for SEM Estimate
• The estimated SEM = the samples’ standard deviation (amount of variation) divided by the square root of the sample size, or:
SEM = SD ÷ √N• The larger the sample size the
smaller the SEM the more accurate the sample mean is likely to be
Copyright ©2010 by Pearson Education, Inc.Upper Saddle River, New Jersey 07458
All rights reserved.
Statistics and Data Analysis for Nursing Research, Second EditionDenise F. Polit
Example of SEM Estimate
• In our sample, let’s say the sample mean (M) = 101.0, SD = 10.5, and N = 25:– Estimated SEM = 10.5 ÷ √25 = 2.1
• BUT if the sample was larger (e.g., 225 children), the SEM would be smaller:– Estimated SEM = 10.5 ÷ √225 = 0.7
Copyright ©2010 by Pearson Education, Inc.Upper Saddle River, New Jersey 07458
All rights reserved.
Statistics and Data Analysis for Nursing Research, Second EditionDenise F. Polit
SEMs and Probabilities
• With a sample IQ mean of 101.0 (the estimated population mean), and an SEM = 2.1, we could construct a distribution around the mean to estimate the likelihood of obtaining a sample mean within a given range– Assumption: Scores are normally
distributed, and thus we know how many SDs are above/below the mean
Copyright ©2010 by Pearson Education, Inc.Upper Saddle River, New Jersey 07458
All rights reserved.
Statistics and Data Analysis for Nursing Research, Second EditionDenise F. Polit
SEMs and Probabilities (cont’d)
• In this scenario, the probability is about .95 that all sample IQ means from the population of 10-year-old children would be no more than two SDs below and two SDs above the mean of 101.0 (i.e, between 96.8 and 105.2)– With a sample of 225 (SEM = 0.7), the range
would be between 99.6 and 102.4– Larger sample size Greater precision in
estimates of the population mean
Copyright ©2010 by Pearson Education, Inc.Upper Saddle River, New Jersey 07458
All rights reserved.
Statistics and Data Analysis for Nursing Research, Second EditionDenise F. Polit
Statistical Inference Approaches
• Two basic approaches:– Parameter estimation– Hypothesis testing
• Hypothesis testing approach has predominated in nursing research, but that is changing– The medical community has embraced
parameter estimation because it provides information about the precision of estimates, which may have clinical relevance
Copyright ©2010 by Pearson Education, Inc.Upper Saddle River, New Jersey 07458
All rights reserved.
Statistics and Data Analysis for Nursing Research, Second EditionDenise F. Polit
Parameter Estimation
• Parameter estimation is used to estimate a population value—e.g., a mean, percentage, or odds ratio
• An estimate can be: – A point estimate
– An interval estimate
Copyright ©2010 by Pearson Education, Inc.Upper Saddle River, New Jersey 07458
All rights reserved.
Statistics and Data Analysis for Nursing Research, Second EditionDenise F. Polit
Point Estimates
• A point estimate involves the calculation of a single value as the estimate of the parameter– A point estimate is thus simply the
value of the descriptive statistic, like a mean
Copyright ©2010 by Pearson Education, Inc.Upper Saddle River, New Jersey 07458
All rights reserved.
Statistics and Data Analysis for Nursing Research, Second EditionDenise F. Polit
Interval Estimates
• An interval estimate provides a range of values within which the population value has a specified probability of lying
• Interval estimation involves constructing confidence intervals around the point estimate
Copyright ©2010 by Pearson Education, Inc.Upper Saddle River, New Jersey 07458
All rights reserved.
Statistics and Data Analysis for Nursing Research, Second EditionDenise F. Polit
Confidence Intervals
• A 95% confidence interval (95% CI) designates the range of values within which the parameter has a 95% probability of lying
• Constructing a CI involves calculating confidence limits (the upper and lower limit of what is probable, at the specified probability level)– The most commonly reported CIs are 95%
and 99%
Copyright ©2010 by Pearson Education, Inc.Upper Saddle River, New Jersey 07458
All rights reserved.
Statistics and Data Analysis for Nursing Research, Second EditionDenise F. Polit
Confidence Limits
• The formula for confidence limits around a mean involves three components: – The sample mean– The estimated SEM– The value corresponding to the area from a
theoretical distribution for the desired CI (e.g., 95%)
• For sample means, the appropriate theoretical distribution is the t distribution
Copyright ©2010 by Pearson Education, Inc.Upper Saddle River, New Jersey 07458
All rights reserved.
Statistics and Data Analysis for Nursing Research, Second EditionDenise F. Polit
t Distribution
• The t distribution is similar to a normal distribution—bell shaped and symmetric
• As the sample size increases, the t distribution is very close to a normal distribution
• For small samples, the tails of a t distribution are “fatter”
Copyright ©2010 by Pearson Education, Inc.Upper Saddle River, New Jersey 07458
All rights reserved.
Statistics and Data Analysis for Nursing Research, Second EditionDenise F. Polit
Calculation of CIs Around Means
• Formula for a 95% CI around a mean:95% CI = M ± (t × SEM)
• Earlier example of IQs: N = 225 children, M = 101.0, SEM = 0.7, and t (from a theoretical table) = 1.96, which is more accurate than earlier estimate of 2.0
• 95% CI = 101.0 (99.63, 102.37) – There is a 95% probability that the true
population mean lies between 99.63 and 102.37
Copyright ©2010 by Pearson Education, Inc.Upper Saddle River, New Jersey 07458
All rights reserved.
Statistics and Data Analysis for Nursing Research, Second EditionDenise F. Polit
CIs around Proportions
• CIs can be developed around any statistic• CIs are frequently computed around
proportions/percentages and risk indexes like Relative Risk and the Odds Ratio
• The theoretical distribution for constructing CIs in these scenarios is the binomial distribution
• Calculation is not straightforward, and is almost always done by computer
Copyright ©2010 by Pearson Education, Inc.Upper Saddle River, New Jersey 07458
All rights reserved.
Statistics and Data Analysis for Nursing Research, Second EditionDenise F. Polit
CIs around Proportions (cont’d)
• CIs around proportions and risk indexes are rarely symmetric (i.e., distance below the point estimate ≠ distance above it)
• Like the CI around a mean, the larger the sample size, the smaller the CI
• The closer the proportion is to .50, the wider the CI
Copyright ©2010 by Pearson Education, Inc.Upper Saddle River, New Jersey 07458
All rights reserved.
Statistics and Data Analysis for Nursing Research, Second EditionDenise F. Polit
Graphic Presentation of CIs
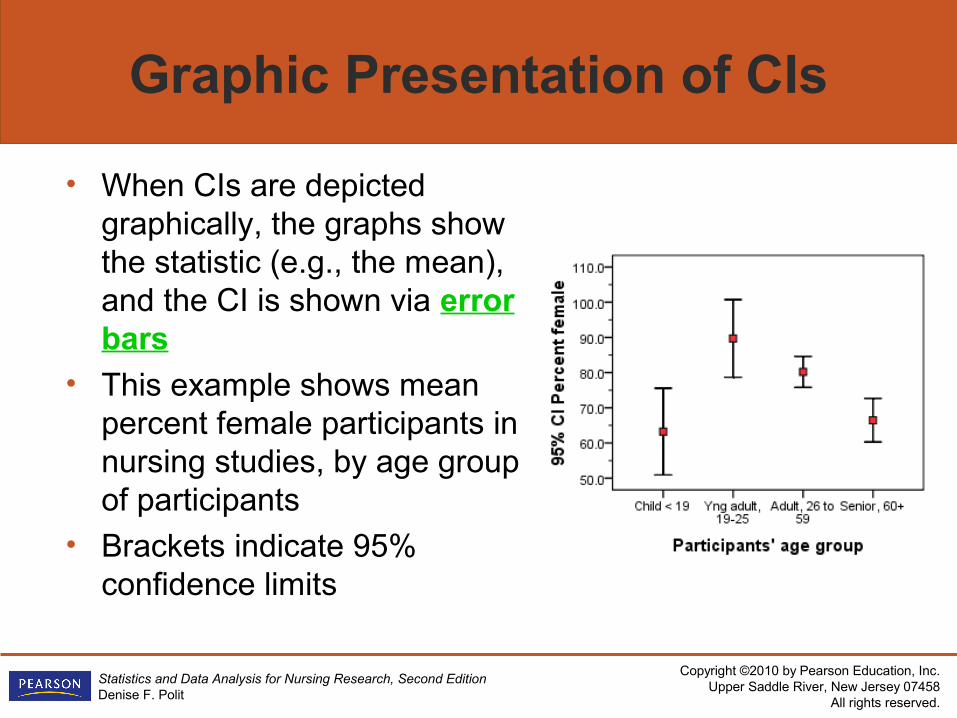
• When CIs are depicted graphically, the graphs show the statistic (e.g., the mean), and the CI is shown via error bars
• This example shows mean percent female participants in nursing studies, by age group of participants
• Brackets indicate 95% confidence limits
Copyright ©2010 by Pearson Education, Inc.Upper Saddle River, New Jersey 07458
All rights reserved.
Statistics and Data Analysis for Nursing Research, Second EditionDenise F. Polit
Hypothesis Testing
• Hypothesis testing (second broad approach to statistical inference) uses laws of probability to help researchers make objective decisions about accepting or rejecting a null hypothesis
Copyright ©2010 by Pearson Education, Inc.Upper Saddle River, New Jersey 07458
All rights reserved.
Statistics and Data Analysis for Nursing Research, Second EditionDenise F. Polit
Null Hypotheses
• In most cases, a null hypothesis states a prediction that variables in the study are NOT related, e.g.:– Cigarette smoking is unrelated to lung
cancer
– Turning patients is unrelated to the incidence of pressure ulcers
Copyright ©2010 by Pearson Education, Inc.Upper Saddle River, New Jersey 07458
All rights reserved.
Statistics and Data Analysis for Nursing Research, Second EditionDenise F. Polit
Research Hypotheses
• The null hypothesis contrasts with researchers’ actual research hypothesis, which typically states a prediction that variables in the study ARE related, e.g.:– Cigarette smoking is related to lung cancer– Turning patients is related to the incidence of
pressure ulcers
Copyright ©2010 by Pearson Education, Inc.Upper Saddle River, New Jersey 07458
All rights reserved.
Statistics and Data Analysis for Nursing Research, Second EditionDenise F. Polit
Hypothesis Testing Logic
• Hypothesis testing is similar to English-based criminal justice system– The accused is assumed to be innocent
• Variables are assumed to be “innocent” of any relationship (i.e., the null hypothesis is assumed to be true) until evidence from sample data indicate a high probability that the null is NOT true
Copyright ©2010 by Pearson Education, Inc.Upper Saddle River, New Jersey 07458
All rights reserved.
Statistics and Data Analysis for Nursing Research, Second EditionDenise F. Polit
Hypothesis Testing Logic (cont’d)
• Researchers cannot “prove” their research hypotheses are correct or incorrect
• They use laws of probability to make decisions about whether the null hypothesis is probably incorrect, at specified levels of probability
• Rejection of the null hypothesis lends support to the alternative (research) hypothesis
Copyright ©2010 by Pearson Education, Inc.Upper Saddle River, New Jersey 07458
All rights reserved.
Statistics and Data Analysis for Nursing Research, Second EditionDenise F. Polit
Error Risk in Hypothesis Tests
• Without data from the population, researchers make decisions about accepting or rejecting the null hypothesis based on incomplete information
• There is always a risk of error
Copyright ©2010 by Pearson Education, Inc.Upper Saddle River, New Jersey 07458
All rights reserved.
Statistics and Data Analysis for Nursing Research, Second EditionDenise F. Polit
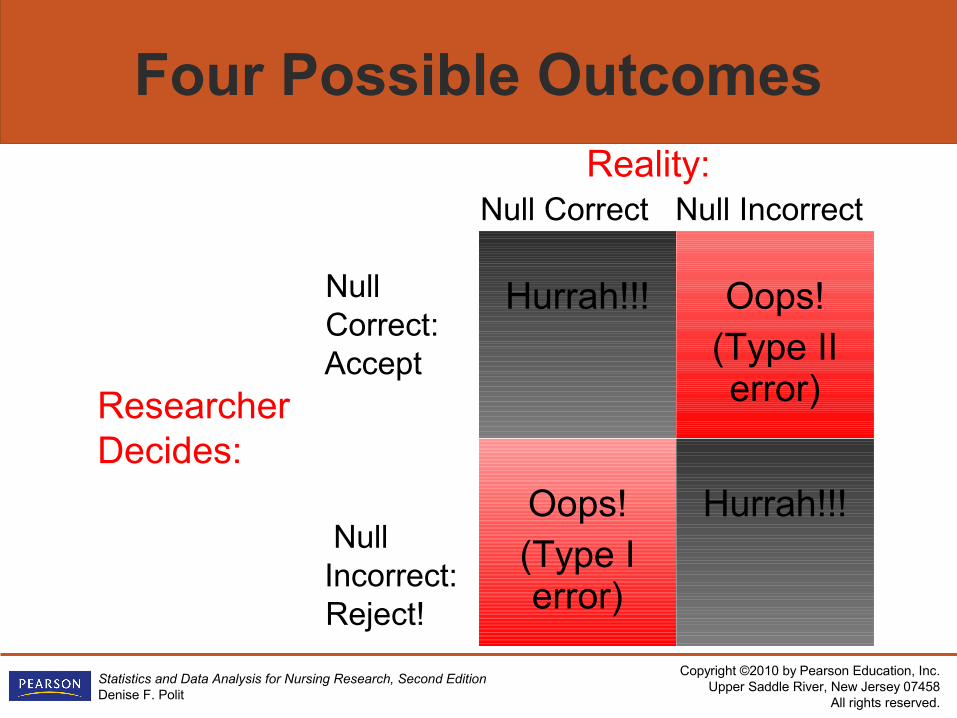
Four Possible Outcomes Reality:
Null Correct Null Incorrect
Null Correct: Accept
ResearcherDecides:
Null Incorrect: Reject!
Hurrah!!! Oops!(Type II error)
Oops!(Type I error)
Hurrah!!!
Copyright ©2010 by Pearson Education, Inc.Upper Saddle River, New Jersey 07458
All rights reserved.
Statistics and Data Analysis for Nursing Research, Second EditionDenise F. Polit
Correct Outcomes in Statistical Decision Making
• Correct decisions:– The null hypothesis is really true in the
population, and the researcher accepts it as true (true negative)
– The null hypothesis is really false in the population, and the researcher rejects it (true positive)
Copyright ©2010 by Pearson Education, Inc.Upper Saddle River, New Jersey 07458
All rights reserved.
Statistics and Data Analysis for Nursing Research, Second EditionDenise F. Polit
Type I and Type II Errors
• Two types of error in statistical decisions:– Type I error: The null hypothesis is really true
in the population, but the researcher rejects it (a false positive) E.g., an ineffective intervention is erroneously
considered effective
– Type II error: The null hypothesis is really false in the population, but the researcher accepts it (a false negative) E.g., an effective intervention is erroneously
considered ineffective
Copyright ©2010 by Pearson Education, Inc.Upper Saddle River, New Jersey 07458
All rights reserved.
Statistics and Data Analysis for Nursing Research, Second EditionDenise F. Polit
Controlling Type I Error Risk
• Type I errors are controlled through the level of significance, the probability accepted as the risk of a false positive– The level of significance or alpha (α) is the
area in the theoretical probability distribution corresponding to a rejection of the null hypothesis
– In most cases, α = .05, which is a 5% risk of a Type I error; this is analogous to a 95% CI
Copyright ©2010 by Pearson Education, Inc.Upper Saddle River, New Jersey 07458
All rights reserved.
Statistics and Data Analysis for Nursing Research, Second EditionDenise F. Polit
Type II Error Risks
• The probability of committing a Type II error is called beta (β)
• The power of a statistical test to correctly reject a false null is 1 - β
• Researchers cannot control β like they can control α, but they can take steps to reduce the risk of β (to increase power)
• The most straightforward way to increase power is to increase sample size
Copyright ©2010 by Pearson Education, Inc.Upper Saddle River, New Jersey 07458
All rights reserved.
Statistics and Data Analysis for Nursing Research, Second EditionDenise F. Polit
Critical Regions
• Researchers calculate a test statistic using their sample data
• They reject the null hypothesis if the test statistic falls at or beyond a critical region on the theoretical distribution for their test statistic; they accept the null hypothesis otherwise
Copyright ©2010 by Pearson Education, Inc.Upper Saddle River, New Jersey 07458
All rights reserved.
Statistics and Data Analysis for Nursing Research, Second EditionDenise F. Polit
One-Sample t Tests
• To illustrate statistical tests and critical regions, consider the one-sample t-test, a statistical test that tests the null hypothesis that the population mean is a specific value
Copyright ©2010 by Pearson Education, Inc.Upper Saddle River, New Jersey 07458
All rights reserved.
Statistics and Data Analysis for Nursing Research, Second EditionDenise F. Polit
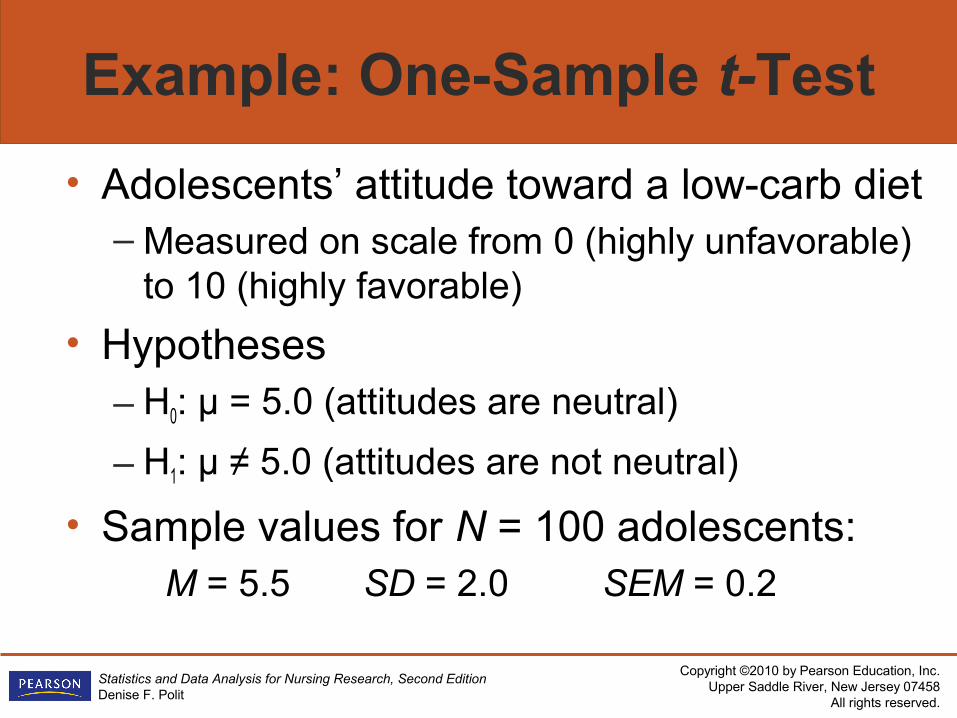
Example: One-Sample t-Test
• Adolescents’ attitude toward a low-carb diet – Measured on scale from 0 (highly unfavorable)
to 10 (highly favorable)
• Hypotheses– H0: μ = 5.0 (attitudes are neutral)
– H1: μ ≠ 5.0 (attitudes are not neutral)
• Sample values for N = 100 adolescents: M = 5.5 SD = 2.0 SEM = 0.2

Copyright ©2010 by Pearson Education, Inc.Upper Saddle River, New Jersey 07458
All rights reserved.
Statistics and Data Analysis for Nursing Research, Second EditionDenise F. Polit
t Statistic Calculation for One-Sample t-Test
• Calculated t = (M – μ) ÷ SEM– In this example, t = (5.5 – 5.0) ÷ 0.2
t = 2.50
• Tabled t = Value of t from theoretical distribution – For α = .05 with 100 cases: 1.99
Copyright ©2010 by Pearson Education, Inc.Upper Saddle River, New Jersey 07458
All rights reserved.
Statistics and Data Analysis for Nursing Research, Second EditionDenise F. Polit
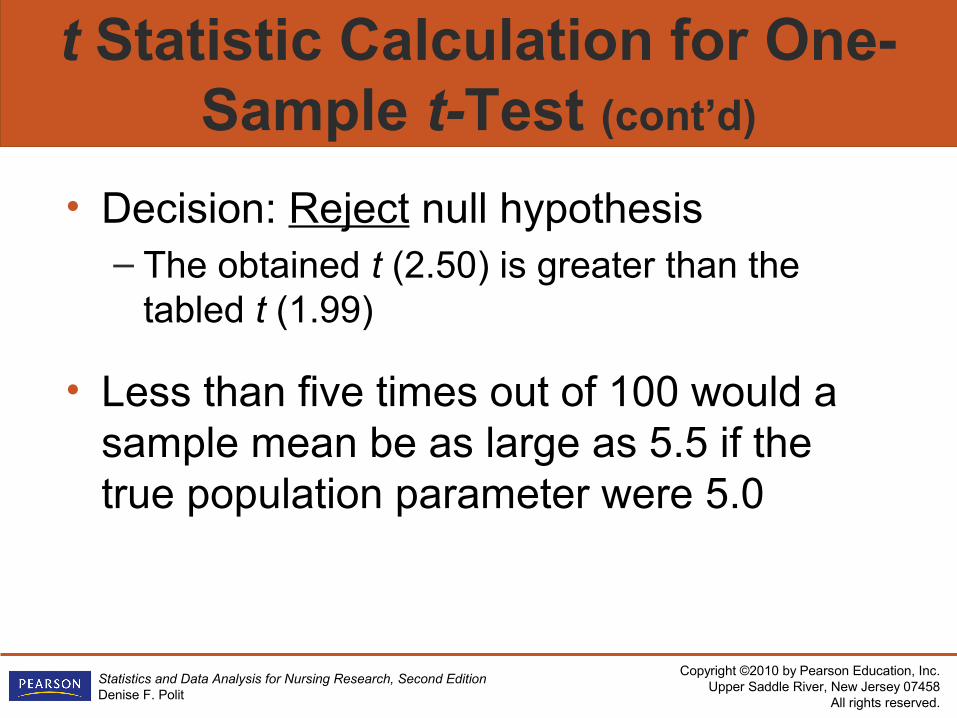
t Statistic Calculation for One-Sample t-Test (cont’d)
• Decision: Reject null hypothesis– The obtained t (2.50) is greater than the
tabled t (1.99)
• Less than five times out of 100 would a sample mean be as large as 5.5 if the true population parameter were 5.0
Copyright ©2010 by Pearson Education, Inc.Upper Saddle River, New Jersey 07458
All rights reserved.
Statistics and Data Analysis for Nursing Research, Second EditionDenise F. Polit
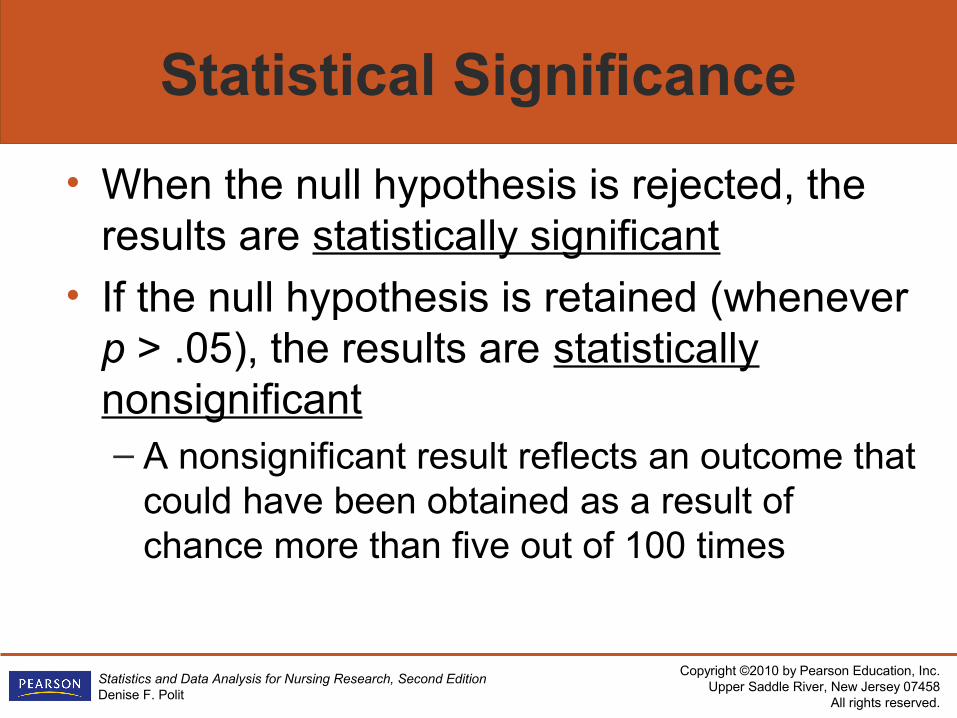
Statistical Significance
• When the null hypothesis is rejected, the results are statistically significant
• If the null hypothesis is retained (whenever p > .05), the results are statistically nonsignificant– A nonsignificant result reflects an outcome that
could have been obtained as a result of chance more than five out of 100 times
Copyright ©2010 by Pearson Education, Inc.Upper Saddle River, New Jersey 07458
All rights reserved.
Statistics and Data Analysis for Nursing Research, Second EditionDenise F. Polit
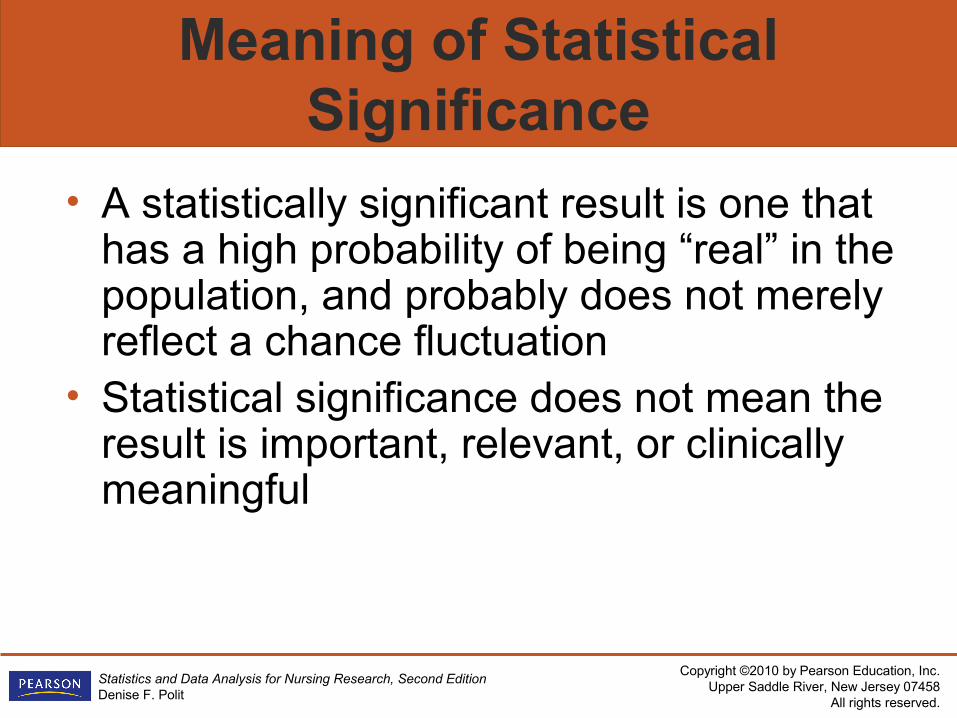
Meaning of Statistical Significance
• A statistically significant result is one that has a high probability of being “real” in the population, and probably does not merely reflect a chance fluctuation
• Statistical significance does not mean the result is important, relevant, or clinically meaningful
Copyright ©2010 by Pearson Education, Inc.Upper Saddle River, New Jersey 07458
All rights reserved.
Statistics and Data Analysis for Nursing Research, Second EditionDenise F. Polit
Two-Tailed Statistical Tests
• A two-tailed test is one that uses both tails of a sampling distribution to determine the critical region (the region for rejecting the null hypothesis)
• In our example of adolescents’ neutrality to a low-carb diet, we had a nondirectional alternative hypothesis (μ ≠ 5.0) that implied the need to look at both tails

Copyright ©2010 by Pearson Education, Inc.Upper Saddle River, New Jersey 07458
All rights reserved.
Statistics and Data Analysis for Nursing Research, Second EditionDenise F. Polit
Critical Region for Two-Tailed Test
• The sample mean of 5.5 fell in the upper critical region for a two-tailed test
Copyright ©2010 by Pearson Education, Inc.Upper Saddle River, New Jersey 07458
All rights reserved.
Statistics and Data Analysis for Nursing Research, Second EditionDenise F. Polit
One-Tailed Statistical Tests
• A one-tailed test is one that uses only one tail of a sampling distribution in determining the critical region
• A one-tailed test may be appropriate if the alternative hypothesis is directional
• For example, we might hypothesize that adolescents, on average, would have positive attitudes toward a low-carb diet (μ > 5.0), suggesting we look only in the upper tail
Copyright ©2010 by Pearson Education, Inc.Upper Saddle River, New Jersey 07458
All rights reserved.
Statistics and Data Analysis for Nursing Research, Second EditionDenise F. Polit
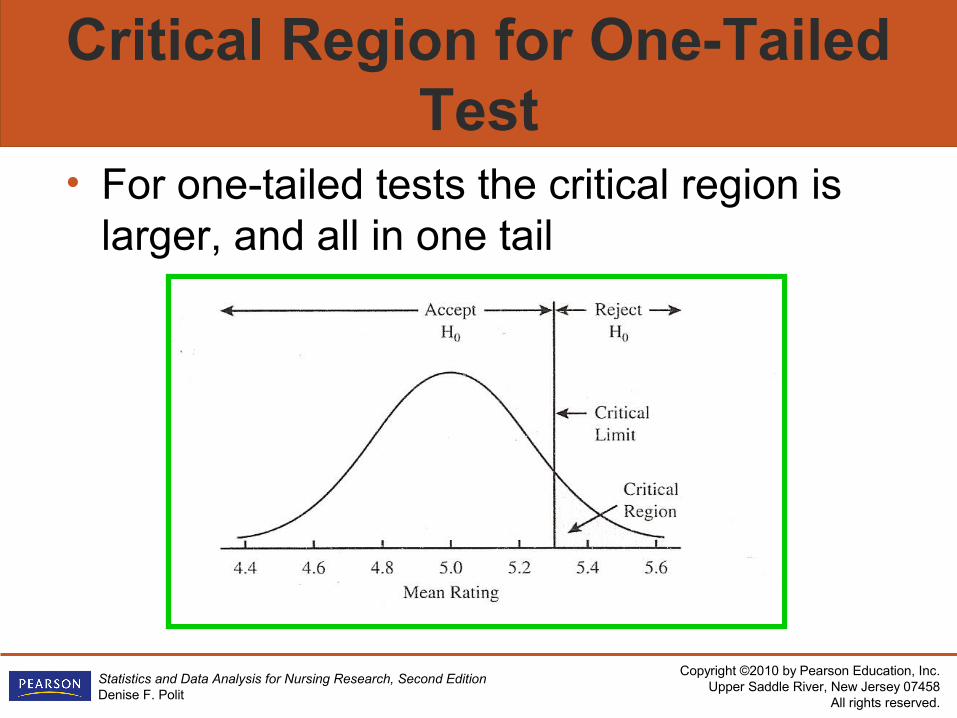
Critical Region for One-Tailed Test
• For one-tailed tests the critical region is larger, and all in one tail
Copyright ©2010 by Pearson Education, Inc.Upper Saddle River, New Jersey 07458
All rights reserved.
Statistics and Data Analysis for Nursing Research, Second EditionDenise F. Polit
Use of One-Tailed Tests
• Two-tailed tests are the norm
• Two-tailed tests are more conservative (have less statistical power) than one-tailed tests, but researchers should have a strong justification for looking in only one tail
Copyright ©2010 by Pearson Education, Inc.Upper Saddle River, New Jersey 07458
All rights reserved.
Statistics and Data Analysis for Nursing Research, Second EditionDenise F. Polit
Statistical Tests and Assumptions
• An assumption for statistical tests is a condition relating to the population that is accepted as being true without proof
• Most tests assume random sampling from a population– This assumption is widely ignored– Ideally, though, samples are reasonably
representative of the populations from which they are drawn
Copyright ©2010 by Pearson Education, Inc.Upper Saddle River, New Jersey 07458
All rights reserved.
Statistics and Data Analysis for Nursing Research, Second EditionDenise F. Polit
One-Tailed t-Test Assumptions
• It is assumed that the values of the variable in the t-test are normally distributed in the population
• The t-test is robust to moderate violations of this assumption (especially if sample size is large)– With very small Ns or severely skewed sample
data, the t-test should not be used
Copyright ©2010 by Pearson Education, Inc.Upper Saddle River, New Jersey 07458
All rights reserved.
Statistics and Data Analysis for Nursing Research, Second EditionDenise F. Polit
Parametric Statistical Tests
• A parametric test:– Involves estimating a population parameter– Typically assumes the dependent variable is
normally distributed in the population– Has a dependent variable that is measured on
an interval (or approximately interval) or ratio scale
Copyright ©2010 by Pearson Education, Inc.Upper Saddle River, New Jersey 07458
All rights reserved.
Statistics and Data Analysis for Nursing Research, Second EditionDenise F. Polit
Nonparametric Statistical Tests
• A nonparametric test:– Does not involves estimating a population
parameter– Makes no assumptions about how the
dependent variable is distributed in the population (so they are sometimes called distribution-free statistics)
– Often involves a dependent variable that is measured on an ordinal or nominal scale
Copyright ©2010 by Pearson Education, Inc.Upper Saddle River, New Jersey 07458
All rights reserved.
Statistics and Data Analysis for Nursing Research, Second EditionDenise F. Polit
Parametric Versus Nonparametric
• Nonparametric tests:– Easier to compute, no need to worry about
distributional assumptions
• Parametric tests:– More powerful (all else equal, they have lower
probability of a Type II error)
Copyright ©2010 by Pearson Education, Inc.Upper Saddle River, New Jersey 07458
All rights reserved.
Statistics and Data Analysis for Nursing Research, Second EditionDenise F. Polit
Parametric Versus Nonparametric (cont’d)
• Some purists insist on nonparametric tests when assumptions are violated, but because parametric tests are robust and more powerful they are often preferred when violations of assumptions are modest
Copyright ©2010 by Pearson Education, Inc.Upper Saddle River, New Jersey 07458
All rights reserved.
Statistics and Data Analysis for Nursing Research, Second EditionDenise F. Polit
Between-Subjects Statistical Tests
• Between-subjects tests: Used when groups being compared are different, unrelated people– E.g., an experimental group getting a new
treatment versus a control group that gets “usual care”
– Sometimes called a test for independent groups
Copyright ©2010 by Pearson Education, Inc.Upper Saddle River, New Jersey 07458
All rights reserved.
Statistics and Data Analysis for Nursing Research, Second EditionDenise F. Polit
Within-Subjects Statistical Tests
• Within-subjects tests: Used when groups being compared are the same people (or are related, like twins)– E.g., one group is compared on outcomes
before versus after an intervention; or in a crossover design, in which everyone gets multiple treatments
– Sometimes called a test for dependent groups
Copyright ©2010 by Pearson Education, Inc.Upper Saddle River, New Jersey 07458
All rights reserved.
Statistics and Data Analysis for Nursing Research, Second EditionDenise F. Polit
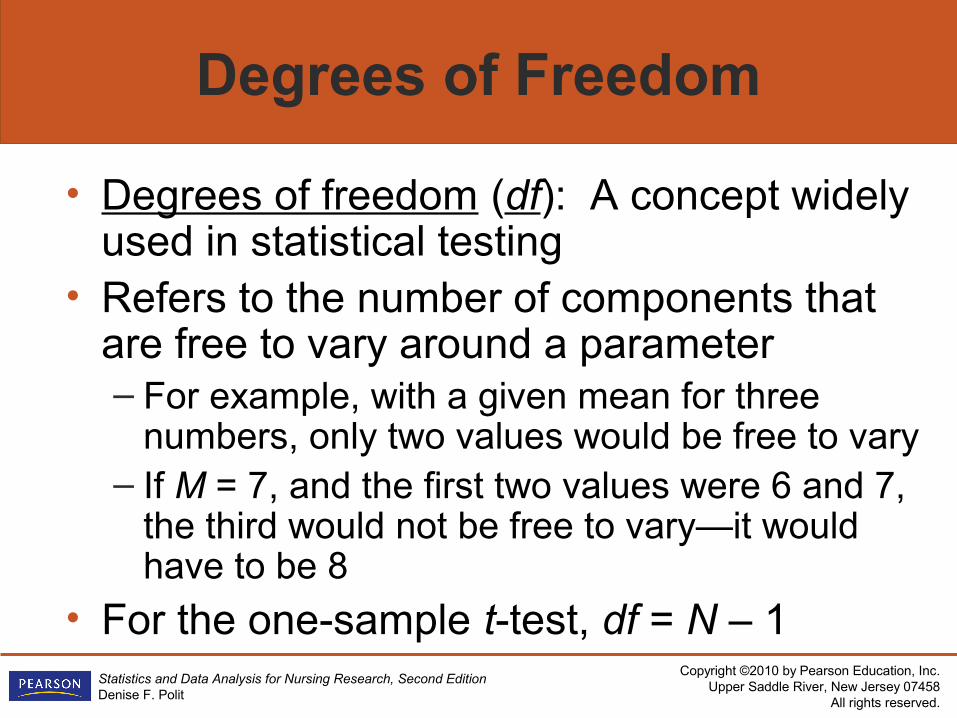
Degrees of Freedom
• Degrees of freedom (df): A concept widely used in statistical testing
• Refers to the number of components that are free to vary around a parameter – For example, with a given mean for three
numbers, only two values would be free to vary– If M = 7, and the first two values were 6 and 7,
the third would not be free to vary—it would have to be 8
• For the one-sample t-test, df = N – 1
Copyright ©2010 by Pearson Education, Inc.Upper Saddle River, New Jersey 07458
All rights reserved.
Statistics and Data Analysis for Nursing Research, Second EditionDenise F. Polit
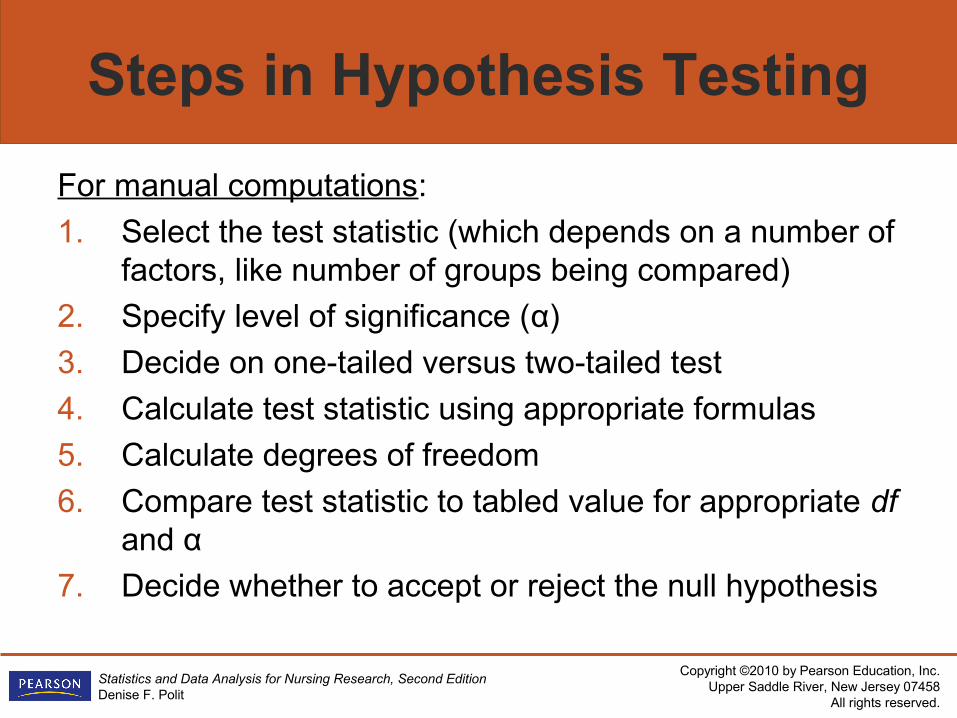
Steps in Hypothesis Testing
For manual computations:
1. Select the test statistic (which depends on a number of factors, like number of groups being compared)
2. Specify level of significance (α)
3. Decide on one-tailed versus two-tailed test
4. Calculate test statistic using appropriate formulas
5. Calculate degrees of freedom
6. Compare test statistic to tabled value for appropriate df and α
7. Decide whether to accept or reject the null hypothesis
Copyright ©2010 by Pearson Education, Inc.Upper Saddle River, New Jersey 07458
All rights reserved.
Statistics and Data Analysis for Nursing Research, Second EditionDenise F. Polit
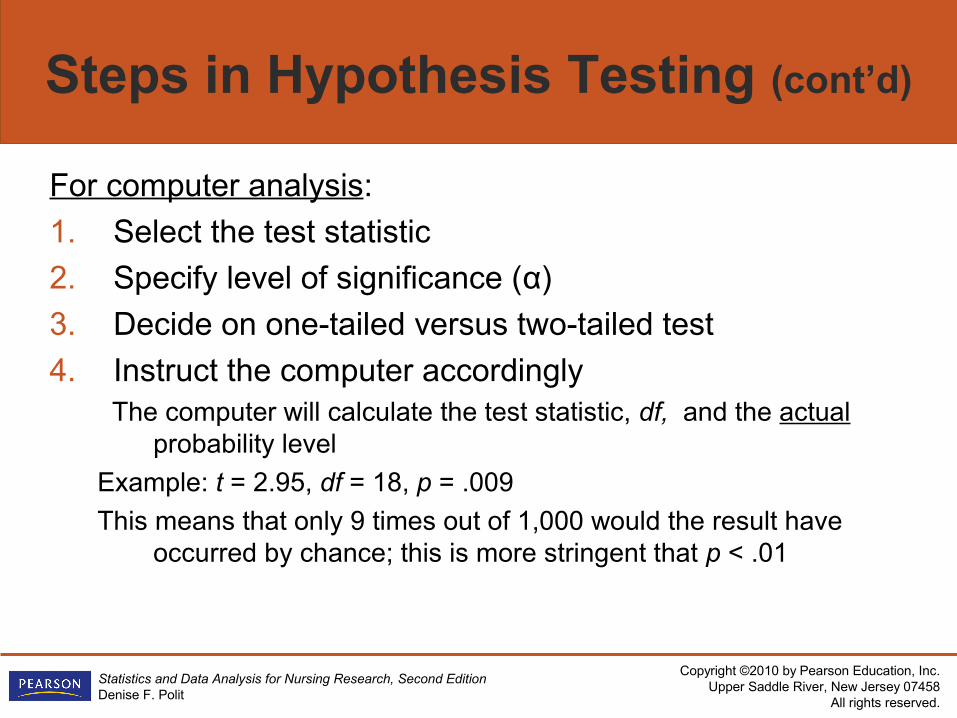
Steps in Hypothesis Testing (cont’d)
For computer analysis:
1. Select the test statistic
2. Specify level of significance (α)
3. Decide on one-tailed versus two-tailed test
4. Instruct the computer accordingly The computer will calculate the test statistic, df, and the actual
probability level
Example: t = 2.95, df = 18, p = .009
This means that only 9 times out of 1,000 would the result have occurred by chance; this is more stringent that p < .01

Copyright ©2010 by Pearson Education, Inc.Upper Saddle River, New Jersey 07458
All rights reserved.
Statistics and Data Analysis for Nursing Research, Second EditionDenise F. Polit
One-Sample t-Test in SPSS
• Select Analyze Compare Means One Sample T Test
• Enter Variable • Enter a value
against which to test the sample mean