Physical, chemical and sensory properties of cassava ...
14
─── Food Technologies ─── ─── Ukrainian Journal of Food Science. 2016. Volume 4. Issue 2 ─── 276 Physical, chemical and sensory properties of cassava (Manihot esculenta) – sweet potato (Ipomoea batatas) gari Olayinka Ramota Karim 1 , Balogun Mutiat Adebanke 1 , Olaide Akinwunmi Akintayo 1 , Wasiu Awoyale 2 1 – University of Ilorin, Ilorin, Kwara State, Nigeria. 2 – Kwara State University, Malete-Ilorin, Kwara State Nigeria. 2 – International Institue of Tropical Agriculture, Oyo Road, Ibadan, Oyo State. Abstract Keywords: Sweet potato Cassava Gari Physical Chemical Article history: Received 04.11.2016 Received in revised form 19.12.2016 Accepted 30.12.2016 Corresponding author: Olayinka Ramota Karim E-mail: olayinkakarim@ yahoo.com DOI: 10.24263/2310- 1008-2016-4-2-9 Introduction. Food safety is one of the problems facing sub-Sahara African countries like Nigeria. The use of wholesome indigenous crops and improved methods of production of major foods is a way forward. Materials and methods. A factorial research design was used to obtain eight samples of cassava and sweet potato gari from three modifications of the traditional production method for gari. Effects of these methods on the physical, chemical and sensory properties of the gari were evaluated using standard methods. Results and discussion. The results revealed that the inclusion of sweet potato significantly (p<0.05) influenced the proximate composition of the cassava-sweet potato gari and the values are also within the recommended levels for quality gari. Moisture content ranged from 10.10 to 12.30%, crude fibre 1.93 to 1.98%, ash content 1.13 to 1.31%, protein content 1.43 to 4.29%, and carbohydrate content 78.11 – 83.59%. The cyanide contents ranged from 0.58 to 2.16 mg/100 g, with 100% cassava gari having the highest while 100% sweet potato gari recorded the lowest. A decrease in porosity from 40 ± 2 % for the 100% cassava gari to 27.33 ± 2 % for sweet-potato gari was observed. The particle size of the sweet potato gari had the highest angle of repose of 38° while 100% cassava gari recorded the lowest angle of repose (29°). The swelling index of the samples ranged from 330 to 450% and100% sweet potato gari had the highest loose and packed densities. The sensory evaluation results showed that the cassava sweet potato (10%) gari was rated the best for colour (8.07), texture (7.67), and aroma (6.87), while 100% cassava gari had highest value for taste (7.47), and both shared the highest value (7.60) in overall acceptability. Conclusions. The study showed that 10% sweet potato can traditionally be added to cassava for quality gari production.
Transcript of Physical, chemical and sensory properties of cassava ...

─── Food Technologies ───
─── Ukrainian Journal of Food Science. 2016. Volume 4. Issue 2 ─── 276
Physical, chemical and sensory properties of cassava (Manihot esculenta) – sweet potato (Ipomoea batatas) gari
Olayinka Ramota Karim1, Balogun Mutiat Adebanke1, Olaide Akinwunmi Akintayo1, Wasiu Awoyale2
1 – University of Ilorin, Ilorin, Kwara State, Nigeria. 2 – Kwara State University, Malete-Ilorin, Kwara State Nigeria. 2 – International Institue of Tropical Agriculture, Oyo Road, Ibadan, Oyo State.
Abstract
Keywords: Sweet potato Cassava Gari Physical Chemical
Article history: Received 04.11.2016 Received in revised form 19.12.2016 Accepted 30.12.2016
Corresponding author: Olayinka Ramota Karim E-mail: olayinkakarim@ yahoo.com
DOI: 10.24263/2310-1008-2016-4-2-9
Introduction. Food safety is one of the problems facing sub-Sahara African countries like Nigeria. The use of wholesome indigenous crops and improved methods of production of major foods is a way forward.
Materials and methods. A factorial research design was used to obtain eight samples of cassava and sweet potato gari from three modifications of the traditional production method for gari. Effects of these methods on the physical, chemical and sensory properties of the gari were evaluated using standard methods.
Results and discussion. The results revealed that the inclusion of sweet potato significantly (p<0.05) influenced the proximate composition of the cassava-sweet potato gari and the values are also within the recommended levels for quality gari. Moisture content ranged from 10.10 to 12.30%, crude fibre 1.93 to 1.98%, ash content 1.13 to 1.31%, protein content 1.43 to 4.29%, and carbohydrate content 78.11 – 83.59%. The cyanide contents ranged from 0.58 to 2.16 mg/100 g, with 100% cassava gari having the highest while 100% sweet potato gari recorded the lowest. A decrease in porosity from 40 ± 2 % for the 100% cassava gari to 27.33 ± 2 % for sweet-potato gari was observed. The particle size of the sweet potato gari had the highest angle of repose of 38° while 100% cassava gari recorded the lowest angle of repose (29°). The swelling index of the samples ranged from 330 to 450% and100% sweet potato gari had the highest loose and packed densities. The sensory evaluation results showed that the cassava sweet potato (10%) gari was rated the best for colour (8.07), texture (7.67), and aroma (6.87), while 100% cassava gari had highest value for taste (7.47), and both shared the highest value (7.60) in overall acceptability.
Conclusions. The study showed that 10% sweet potato can traditionally be added to cassava for quality gari production.

─── Food Technologies ───
─── Ukrainian Journal of Food Science. 2016. Volume 4. Issue 2 ─── 277
Introduction Cassava is a tropical root crop, requiring at least eight months of warm weather to
produce [21]. In sub-Saharan Africa, cassava is processed using methods which improve its food safety limitations. It is mainly a subsistence food crop grown for food by small-scale farmers; the surplus is sold. Roots can be harvested between 6 months and 3 years after planting [15]. Cassava has multiple uses: it is consumed in many processed forms, used in the industry and also as livestock feed [5]. Its roots are made into granular flours. Flours are of three types, yellow gari, white gari, or intermediate colour, with yellow gari considered the best product in Nigeria. Gari is a granulated product, made from the lactic acid fermentation of cassava roots, and cherished by urban consumer because of its convenience, long shelf life and its ready-to-eat form [17, 25, 6]. Unit operations involved include peeling, washing, grating, dewatering, fermentation, and roasting [29]. The resulting dry granular gari can be stored for a long period. It may be pound or ground to make fine flour. It comes in various particle size, categorized as: rough, medium, and fine.
Sweet potato (Ipomoea batatas) is a hardy and nutritious staple food crop, which is grown throughout the humid tropical and subtropical regions of the world, from sea level to 2,700m altitude [32]. It has short growing period of 90-120 days [31]. The crop requires just sufficient water and attention for their cultivation. The tuberous root features oblong/elongated shape with tapering ends and has smooth outer skin whose color ranges from red, purple, brown, and white, depending on the variety [34]. Sweet potato does not have the cyanogenic limitation associated with cassava, yet less recognised than the latter. This can be attributed to its relatively lower level of utilization. Nutritionally, sweet potato is one of very high caloric foods (provides 90 calories/100g vs. 70 calories/100g of potato), a rich source of dietary fibre, antioxidants, vitamins, and minerals. It is a good source of vitamin A [28]. However, sweet potato is yet to be recognized as a vital ingredient in food production and safety.
The use of sweet potato and cassava to produce gari has been discovered to be technically feasible [18, 24]. However, there still lies a drawback in the area of sensory properties of the obtained product. This problem can be attributed to the enzymatic browning of the polyphenolic compounds in the tubers of sweet potato. This is yet the main limitation in the acceptability of sweet potato gari by the potential consumers [24]. There have been efforts to solve this problem but with little or no success. Therefore, the aim of this work was to study the effect of different production methods on the physical, chemical and sensory properties of gari produced from cassava roots and sweet potato tubers.
Materials and methods The bitter cassava TS53201 (Manihot esculenta crantz) and yellow fleshed sweet
potato tubers roots were obtained from the Teaching and Research Farm, Faculty of Agriculture, University of Ilorin. They were processed few hours after harvesting.
Preparation of Lime-Sodium Metabisulphite Solution Fresh lime (Citrus aurantifolia) fruits were cut into halves to extract the juice. The
juice was then clarified using a sieve and 160 ml of this was made to 5 litres with water. A solution containing 35 g of sodium metabisulphite (food grade) in 5 litres was prepared. The lime and sodium metabisulphite solutions were mixed together and then further diluted with water up to 20 litres.
─── Food Technologies ───
─── Ukrainian Journal of Food Science. 2016. Volume 4. Issue 2 ─── 278
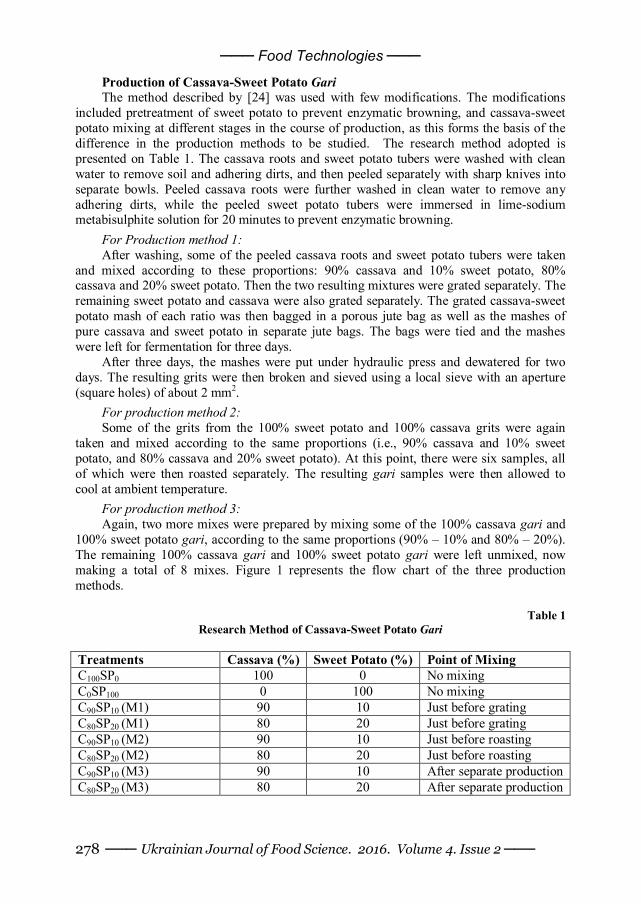
Production of Cassava-Sweet Potato Gari The method described by [24] was used with few modifications. The modifications
included pretreatment of sweet potato to prevent enzymatic browning, and cassava-sweet potato mixing at different stages in the course of production, as this forms the basis of the difference in the production methods to be studied. The research method adopted is presented on Table 1. The cassava roots and sweet potato tubers were washed with clean water to remove soil and adhering dirts, and then peeled separately with sharp knives into separate bowls. Peeled cassava roots were further washed in clean water to remove any adhering dirts, while the peeled sweet potato tubers were immersed in lime-sodium metabisulphite solution for 20 minutes to prevent enzymatic browning.
For Production method 1: After washing, some of the peeled cassava roots and sweet potato tubers were taken
and mixed according to these proportions: 90% cassava and 10% sweet potato, 80% cassava and 20% sweet potato. Then the two resulting mixtures were grated separately. The remaining sweet potato and cassava were also grated separately. The grated cassava-sweet potato mash of each ratio was then bagged in a porous jute bag as well as the mashes of pure cassava and sweet potato in separate jute bags. The bags were tied and the mashes were left for fermentation for three days.
After three days, the mashes were put under hydraulic press and dewatered for two days. The resulting grits were then broken and sieved using a local sieve with an aperture (square holes) of about 2 mm2.
For production method 2: Some of the grits from the 100% sweet potato and 100% cassava grits were again
taken and mixed according to the same proportions (i.e., 90% cassava and 10% sweet potato, and 80% cassava and 20% sweet potato). At this point, there were six samples, all of which were then roasted separately. The resulting gari samples were then allowed to cool at ambient temperature.
For production method 3: Again, two more mixes were prepared by mixing some of the 100% cassava gari and
100% sweet potato gari, according to the same proportions (90% – 10% and 80% – 20%). The remaining 100% cassava gari and 100% sweet potato gari were left unmixed, now making a total of 8 mixes. Figure 1 represents the flow chart of the three production methods.
Table 1 Research Method of Cassava-Sweet Potato Gari
Treatments Cassava (%) Sweet Potato (%) Point of Mixing C100SP0 100 0 No mixing C0SP100 0 100 No mixing C90SP10 (M1) 90 10 Just before grating C80SP20 (M1) 80 20 Just before grating C90SP10 (M2) 90 10 Just before roasting C80SP20 (M2) 80 20 Just before roasting C90SP10 (M3) 90 10 After separate production C80SP20 (M3) 80 20 After separate production

─── Food Technologies ───
─── Ukrainian Journal of Food Science. 2016. Volume 4. Issue 2 ─── 279
Figure 1. Flow Chart for the production of Cassava-Sweet Potato Gari
Percentage yield of Cassava and Sweet Potato Gari The method described by [23] was used to determine the percentage yield of the
products. Cassava and sweet potato roots were weighed prior to peeling. Immediately after roasting and cooling, the gari samples from both 100% cassava and 100% sweet potato were weighed, and the percentage yields were calculated using this formula 1 below:
% Yield of gari from cassava and sweet potato = weightof obtained 100%weightof rootsbefore peeling
gari (1)

─── Food Technologies ───
─── Ukrainian Journal of Food Science. 2016. Volume 4. Issue 2 ─── 280
Determination of chemical properties of Cassava-Sweet Potato Gari
Prosimate composition Moisture content. This was determined by drying 2 g of each of the gari samples in
an oven at 105oC for about 2 hours. The difference between the weights before and after drying was calculated as the moisture content [1].
Crude fibre content. The crude fibre content of the various gari samples was determined by defatting (with petroleum ether) and boiling (with H2SO4 and NaOH) 2 g of the gari samples followed by incineration in a murfle furnace. The incinerated sample was thereafter cooled in a desiccator [1].
Ash content. Gari sample (2 g) was incinerated in a murfle furnace to burn off all organic components present. The residue left after the ashing was the ash content [1].
Crude protein. The protein content of the gari samples was determined by digestion of 2 g of the sample followed by distillation and titration as described by [1].
Carbohydrate content. This was calculated by subtracting the sum of the percentage contents of moisture, crude fibre, ash, crude protein and crude fat from 100%.
i.e., carbohydrate content = 100% – %(moisture + crude fibre + ash + crude protein +fat) (2)
Crude fat content. This involved the extraction of 2 g of each of the gari samples in a soxhlet apparatus with a petroleum ether, after which the samples were dried in an oven and cooled in a desiccator. The weight lost during extraction was the fat content of the gari samples [1].
pH Determination. The pH of the gari sample was determined using the method of [2]. Each of the gari samples (10 g) was put into a 100 ml beaker and 100 ml of distilled water was added to it. This was allowed to stay for a few minutes after which it was filtered with a whatmann filter paper. The filtrate was then taken and tested using a standardized pH meter. Triplicate values were obtained, the mean of which was then calculated.
Determination of total titratable acidity. The percentage total titratable acidity of the gari samples was determined using the method described by [12]. Five grams of each of the samples was dissolved in a beaker and made up to 100 ml with distilled water, then allowed to stand for about 30 mins. The resulting suspension was filtered with a filter paper, and 25 ml of the filtrate was taken and titrated against 0.1 M NaOH, using phenolphthalein as indicator. The end point was obtained when the colour became pink. The mean (TTA) was then calculated from triplicate values.
TTA (%) = 0.005X x 100 = 0.01X, where X is the mean titre value. Determination of hydrogen cyanide content. The residual hydrogen cyanide (HCN)
content of gari was determined using the method of [10]. Using this metod, thirty grams (30 g) of gari was milled and homogenized with 250 ml of 0.1 M orthophosphoric acid. The homogenate was centrifuged. The supernatant was taken as the extract; 0.1 ml of the enzyme (linamarase prepared from the freshly harvested cassava roots) was added into 0.6 ml of the extract. The 3.4 ml of the acetate buffer (pH 4.5) was added and stirred to mix. After which 0.2 ml of 0.5% chloramin-T and 0.6 ml of colour reagent were added and allowed to stand for 15 min. for colour development. The absorbance value was obtained at 605 nm against a blank similarly prepared containing all reagents and 0.1 ml phosphate buffer added instead of KCN.
Calculation. The data from the standard were used to obtain a standard curve and its slope (b) by plotting absorbance values (Y-axis) against standard concentrations (X-axis).
The unknown mean absorbance (A) and the weight of the sample (w) were used to calculate the residual hydrogen cyanide, using the formula:

─── Food Technologies ───
─── Ukrainian Journal of Food Science. 2016. Volume 4. Issue 2 ─── 281
Residual cyanide = A x 250 x 0.4151 b x W and the unit in mg HCN equivalent kg-1 sample (formula 3). Where A is absorbance, b is the slope, and W is weight of sample.
Determination of Physical and Technological Properties
Swelling index. The method of [33] was used for the determination of swelling index (SI) with slight modification. Ten grams (10 g) of the garisample was transferred into a clean, dried, calibrated measuring cylinder. The gari was gently leveled by tapping the cylinder and the initial volume recorded. Fifty milliliter (50 ml) of distilled water was poured into the cylinder and allowed to stand for 4 h. The value for SI was taken as the multiples of the original volume.
Water Absorption Capacity. The method of [30] as described by [3] was followed for the determination of water absorption capacity. One gram (1 g) of gari was weighed into an already weighed clean dried centrifuge tube. Twenty milliliter (20 ml) of distilled water was poured into the centrifuge tube and stirred thoroughly; centrifuge at a speed of 3500 rpm for 45 min. The supernatant was discarded and the tube and its content reweighed. The gain in mass was taken as the water absorption capacity.
Bulk density. The method of [8] was used for bulk density (BD) determination. Ten grams (10 g) of the gari were transferred into 50 ml measuring cylinder. The cylinder was tapped repeatedly for 5 min. The BD of the gari sample was calculated as the mass of gari over the volume at the end of tapping. The mean value was recorded from triplicate determinations
Sensory evaluation
A multiple – paired comparison test as described by [14] was used. Panelists were selected from among gariconsumers. Fifteen panelists were made to assess the gari samples in the dry particulate form for taste, colour, aroma, sourness, texture, and overall acceptability. The cassava-sweet potato gari samples were made into “eba” and were assessed by twenty panelists for aroma, taste, texture, colour, mouldability, and overall acceptability. The gari samples were also assessed in soaked form for aroma, taste, texture, colour, soakability and overall acceptability. In each case, the samples were rated according to a 9-point hedonic scale of preference with ratings ranging from 1 (dislike extremely) and 9 (like extremely). The results of the evaluation were then subjected to statistical analysis.
Statistical Analysis The Statistical Package for Social Sciences (SPSS version 16.0) was used to
statistically analyze the data generated from the experiments. The data were further subjected to analysis of variance (ANOVA) to determine significant differences among the samples, and the means were separated with a Tukey test.
Results and discussion Percentage Yield of Cassava-Sweet Potato Gari Production
The percentage yields of the various cassava-sweet potato gari samples ranged from 20 to 28%, with 100% cassava gari having 20%, 100% sweet potato gari having 28% while 10% and 20% substitution level of sweet potato had 20.8% and 21.6%, respectively. [13] reported 15-20 % conversion rate for cassava gari, while [24] reported 40-42% for sweet potato gari. The difference between the 28% conversion rate obtained in this research work and the 42% reported by [24] could be attributed to the difference in the moisture contents
─── Food Technologies ───
─── Ukrainian Journal of Food Science. 2016. Volume 4. Issue 2 ─── 282
of the products which were 6.28-7.10% and 7.95-8.8% respectively. The difference could also be as a result of factors ranging from tuber varieties, time of harvesting, age of plant, to other environmental factors [13].
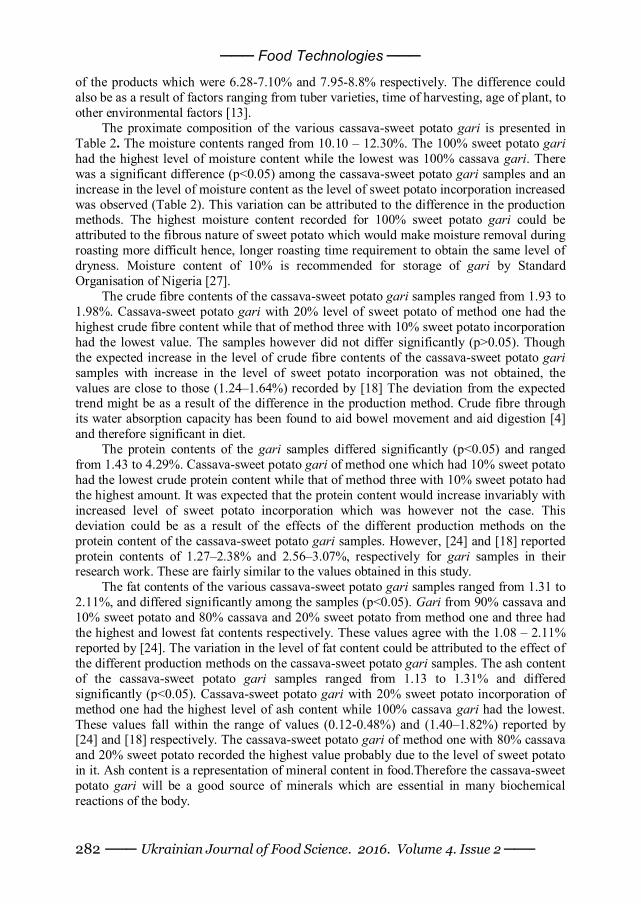
The proximate composition of the various cassava-sweet potato gari is presented in Table 2. The moisture contents ranged from 10.10 – 12.30%. The 100% sweet potato gari had the highest level of moisture content while the lowest was 100% cassava gari. There was a significant difference (p<0.05) among the cassava-sweet potato gari samples and an increase in the level of moisture content as the level of sweet potato incorporation increased was observed (Table 2). This variation can be attributed to the difference in the production methods. The highest moisture content recorded for 100% sweet potato gari could be attributed to the fibrous nature of sweet potato which would make moisture removal during roasting more difficult hence, longer roasting time requirement to obtain the same level of dryness. Moisture content of 10% is recommended for storage of gari by Standard Organisation of Nigeria [27].
The crude fibre contents of the cassava-sweet potato gari samples ranged from 1.93 to 1.98%. Cassava-sweet potato gari with 20% level of sweet potato of method one had the highest crude fibre content while that of method three with 10% sweet potato incorporation had the lowest value. The samples however did not differ significantly (p>0.05). Though the expected increase in the level of crude fibre contents of the cassava-sweet potato gari samples with increase in the level of sweet potato incorporation was not obtained, the values are close to those (1.24–1.64%) recorded by [18] The deviation from the expected trend might be as a result of the difference in the production method. Crude fibre through its water absorption capacity has been found to aid bowel movement and aid digestion [4] and therefore significant in diet.
The protein contents of the gari samples differed significantly (p<0.05) and ranged from 1.43 to 4.29%. Cassava-sweet potato gari of method one which had 10% sweet potato had the lowest crude protein content while that of method three with 10% sweet potato had the highest amount. It was expected that the protein content would increase invariably with increased level of sweet potato incorporation which was however not the case. This deviation could be as a result of the effects of the different production methods on the protein content of the cassava-sweet potato gari samples. However, [24] and [18] reported protein contents of 1.27–2.38% and 2.56–3.07%, respectively for gari samples in their research work. These are fairly similar to the values obtained in this study.
The fat contents of the various cassava-sweet potato gari samples ranged from 1.31 to 2.11%, and differed significantly among the samples (p<0.05). Gari from 90% cassava and 10% sweet potato and 80% cassava and 20% sweet potato from method one and three had the highest and lowest fat contents respectively. These values agree with the 1.08 – 2.11% reported by [24]. The variation in the level of fat content could be attributed to the effect of the different production methods on the cassava-sweet potato gari samples. The ash content of the cassava-sweet potato gari samples ranged from 1.13 to 1.31% and differed significantly (p<0.05). Cassava-sweet potato gari with 20% sweet potato incorporation of method one had the highest level of ash content while 100% cassava gari had the lowest. These values fall within the range of values (0.12-0.48%) and (1.40–1.82%) reported by [24] and [18] respectively. The cassava-sweet potato gari of method one with 80% cassava and 20% sweet potato recorded the highest value probably due to the level of sweet potato in it. Ash content is a representation of mineral content in food.Therefore the cassava-sweet potato gari will be a good source of minerals which are essential in many biochemical reactions of the body.

─── Food Technologies ───
─── Ukrainian Journal of Food Science. 2016. Volume 4. Issue 2 ─── 283
There was a significant difference (p<0.05) in the carbohydrate contents of the cassava-sweet potato gari samples. Gari from 10% sweet potato of method one (mixing just before grating) had the highest carbohydrate content while 10% sweet potato gari of method three (mixing just before roasting after grating) had the lowest. The carbohydrate content of the cassava-sweet potato gari (78.11 – 83.59%) are close to the 82.53 – 87.10% reported by [24]. Except for method 3, there was a decrease in the carbohydrate content of the cassava-sweet potato gari with increased level of sweet potato incorporation which suggests that the cassava roots used had more carbohydrate content than the sweet potato used, or sweet potato incorporation increased level of fermentation which consequently resulted to higher level of carbohydrate break down. This might be as a result of higher sugar content in sweet potato which is the main substrate for fermentation. Sweet potatoes contain simple sugars such as glucose, fructose, sucrose and maltose which make up about 32% of its carbohydrate content [20]
The values obtained for the total titratible acidity (TTA) and pH are shown in Table 3. There was a significant (p<0.05) difference among the samples in terms of TTA. The values ranged from 1.36 to 1.70%. Sweet potato gari (100%) had the highest TTA while 10% sweet potato gari of method 3 had the lowest. This could be attributed to the high level of free sugar in sweet potato which increased its tendency to readily undergo lactic acid fermentation. There was a significant (p<0.05) difference in the pH values obtained for the cassava-sweet potato gari samples (Table 3). The values ranged from 4.65 to 4.90. These were within the range of values (4.42–5.98) reported by [27] for gari samples. The pH of gari is also a function of the extent of fermentation. The lower the pH, the better will be the keeping quality of gari.
There was a significant (p<0.05) difference among the cassava-sweet potato gari samples in terms of hydrogen cyanide (HCN) content (Table 3). Cassava gari (100%) had the highest HCN content while that of 100% sweet potato had the lowest. Table 5 shows the HCN contents of the various cassava-sweet potato gari samples. The highest level of HCN obtained for 100% cassava gari could be attributed to the high content in the raw cassava root. Sweet cultivars of cassava can produce as little as 20 mg of HCN per kg of fresh roots, while bitter ones may produce more than 50 times as much [14] The value obtained would be far less than what was in the raw cassava root as a result of the detoxification brought about by fermentation [22] tissue disintegration (Hahn et al., 1987), dewatering, roasting, etc., in the course of production.
The physical and technological properties of cassava-sweet potato gari samples are shown in Table 4. The swelling index of the samples ranged from 330 to 450%, with 20% cassava-sweet potato gari of method 2 having the highest value and that of 100% sweet potato had the least. These values agreed with those (301–430%) reported by [24] The high values can be attributed to the dryness of the gari samples as indicated by the low moisture content (6.28–7.01%). Swelling index indicates the ability of the gari to swell and this is influenced by the quantity and starch components (amylose and amylopectin) present in the gari. Swelling index has been shown to give a greater volume and more feeling of satiety per unit weight of gari to a consumer and a swelling index of at least 3.0 (300%) was recommended to be preferred by consumers [9, 7).
─── Food Technologies ───
─── Ukrainian Journal of Food Science. 2016. Volume 4. Issue 2 ─── 284
Table 2 Chemical Properties of Cassava-Sweet Potato Gari
Samples
Moisture (%)
Crude Fibre (%)
Ash (%)
Protein (%)
Fat (%)
CHO (%)
C100SP0
10.10a
±0.01 1.95a
±0.01 1.13a
±0.01 1.84a
±0.02 1.41a
±0.01 83.57e
±0.25 C0SP100 12.30e
±0.01 1.93a
±0.01 1.19ab
±0.02 1.81a
±0.01 1.42a
±0.01 81.30b
±0.54 C90SP10(M1) 10.50c
±0.02 1.96a ±0.01
1.18abc
±0.02 1.43 a
±0.03 1.34ab
±0.02 83.59e
±0.01 C80SP20(M1)
11.20d
±0.01 1.98a
±0.01 1.15abc
±0.01 2.05a
±0.04 1.31bc
±0.01 82.49c
±0.05 C90SP10(M2) 10.16ab
±0.01 1.95a
±0.01 1.14bc
±0.01 2.01a
±0.02 1.33c
±0.01 83.41e
±0.16 C80SP20(M2) 10.90d
±0.01 1.96a
±0.01 1.30c
±0.02 1.56a
±0.03 1.44c
±0.05 82.84d
±0.41 C90SP10(M3) 12.25e
±0.01 1.93a
±0.02 1.31d
±0.01 4.29b
±0.01 2.11d
±0.05 78.11a
±0.01 C80SP20(M3) 10.24bc
±0.04 1.97a
±0.01 1.20d
±0.01 3.14c
±0.02 1.88c
±0.03 81.57bc
±0.02 In each of the columns, any means not followed by the same superscripts are significantly
different (p<0.05) KEYS: C100SP0: 100% cassava gari C0SP100: 100% sweet potato gari C90SP10 (M1): 90% cassava, 10% sweet potato gari mixed before grating C80SP20 (M1): 80% cassava, 20% sweet potato gari mixed before grating C90SP10 (M2): 90% cassava, 10% sweet potato gari mixed before roasting C80SP20 (M2): 80% cassava, 20% sweet potato gari mixed before roasting C90SP10 (M3): 90% cassava, 10% sweet potato gari mixed after roasting C80SP20 (M3): 80% cassava, 20% sweet potato gari mixed after roasting
Table 3 Other Chemical Properties of Cassava-Sweet Potato Gari
Samples
TTA (%)
pH
HCN (mg/100 g)
C100SP0 1.60e±0.05 4.75ab±0.05 2.16 e±0.01 C0SP100 1.70e±0.05 4.90b±0.00 0.56 b±0.05
C90SP10 (M1) 1.49bcd±0.04 4.70 a±4.65 2.11 e±0.01
C80SP20(M1) 1.41abc±0.01 4.65a±0.05 1.07 e±0.01 C90SP10(M2) 1.36ab±0.01 4.65a±0.05 1.22 c±0.01 C80SP20(M2) 1.54cd±0.01 4.70a±0.00 1.31d±0.01 C90SP10(M3) 1.27a±0.03 4.70a±0.00 0.74b±0.01 C80SP20(M3) 1.46bcd±0.00 4.70a±0.00 0.58a±0.04
In each of the columns, any means not followed by the same superscripts are significantly different (p<0.05)

─── Food Technologies ───
─── Ukrainian Journal of Food Science. 2016. Volume 4. Issue 2 ─── 285
Table 4 Physical andTechnological Properties of Cassava Sweet Potato Gari
Samples Swelling index (%)
Loose Bulk Density (g/cm3)
Packed Bulk Density (g/cm3)
Water Holding Capacity
(ml/g) C100SP0 370 0.50 0.53 7.2 C0SP100 330 0.63 0.67 6.6 C90SP10 (M1) 340 0.48 0.53 6.3 C80SP20 (M1) 400 0.53 0.56 6.8 C90SP10 (M2) 380 0.53 0.59 5.7 C80SP20 (M2) 450 0.56 0.59 7.5 C90SP10 (M3) 400 0.53 0.56 7.1 C80SP20 (M3) 390 0.50 0.53 6.8
The loose and packed densities of the gari samples fell within 0.50–0.63 g/ml and
0.53–0.67 g/ml, respectively. The highest bulk density was obtained for 100% sweet potato gari sample while the lowest was recorded for 10% sweet potato substituted gari sample of method one. These can be compared with the values (0.50 – 0.58 g/ml) reported by [18]. Sweet potato gari (100%) had the highest loose and packed densities. This can be attributed to its finer particle size, as was observed from the hand feels of the various gari samples. This resulted to lesser space between the particles and more compactness, thereby reducing the volume; and the lesser the volume, the more the density. Except for method three, there was increase in the level of bulk density with increased level of sweet potato incorporation, which once again suggests the effect of the different production methods on the cassava-sweet potato gari. Higher packed bulk and loose bulk densities mean that more quantity of gari can be packed than for the same specific volume of lower densities [11].
Cassava-sweet potato gari of method two with 20% sweet potato had the highest water absorption capacity of 7.5 ml/g while that of method two with 10% sweet potato had the lowest (5.7 ml/g). The values are close to the values (7.70 – 8.16 ml/g) reported by [18]. The 80% cassava and 20% sweet potato gari from method two which had the highest water absorption capacity also recorded the highest swelling index.
The results of the sensory evaluation are presented in Tables 5, 6 and 7.
Table 5 Results of Sensory Evaluation of Cassava- Sweet Potato Gari
Sample Aroma Sourness Taste Texture Colour Overall Acceptability C100SP0 6.60b 6.67b 7.47b 7.20bc 7.40e 7.60b C0SP100 3.93a 4.13a 4.47a 5.33a 2.60a 4.00a C90SP10 (M1) 6.87b 6.87b 7.20b 7.67c 8.07e 7.60b C80SP20 (M1) 6.00b 5.53ab 6.33b 6.67abc 6.87cde 6.67b C90SP10 (M2) 6.33b 5.93b 6.33b 6.20abc 5.93bcd 6.33b C80SP20 (M2) 6.33b 6.07b 6.93b 6,73abc 5.47bc 6.93b C90SP10 (M3) 6.53b 6.53b 7.07b 6.53abc 6.73bcde 7.13b C80SP20 (M3) 6.13b 5.67ab 6.20b 6.00ab 5.20b 6.33b In each of the columns, the samples whose means are not followed by the same superscripts are significantly different (at p<0.05)

─── Food Technologies ───
─── Ukrainian Journal of Food Science. 2016. Volume 4. Issue 2 ─── 286
Table 6 Results of Sensory Evaluation of Cassava-Sweet Potato Eba
Samples Aroma Taste Texture Colour Mouldability Overall
Acceptability C100SP0 6.75b 6.95b 6.85bc 6.90bc 6.65ab 7.05bc C0SP100 4.10a 4.65a 5.45a 3.20a 5.55a 4.20a C90SP10 (M1) 6.95b 7.05b 7.30c 8.10c 7.45b 7.90c C80SP20 (M1) 6.20b 6.35b
6.45abc 6.05b 6.20ab 6.45b
C90SP10 (M2) 7.10b 6.85b 6.50abc
6,75bc 6.80ab 6.60b
C80SP20 (M2) 5.85b 6.05ab 6.90ab 5.70b 6.15ab 5.90b C90SP10 (M3) 6.50b 6.65b
6.60abc 6.15b 5.95a 6.30b
C80SP20 (M3) 6.20b 6.50b 6.25abc 6.60b 6.65ab 6.65bc In each of the columns, the samples whose means are not followed by the same superscripts are significantly different (at p <0.05)
Table 7
Results of Sensory Evaluation of Soaked Cassava–Sweet Potato Gari
Samples Aroma Taste Soak ability
Texture Colour Overall Acceptability
C100SP0 7.00b 6.90b 7.10b 6.90b 6.70ab 7.10b C0SP100 5.10a 4.80a 4.80a 5.10a 3.60b 4.90a
C90SP10(M1) 6.10ab 6.80b 7.50c 6.80ab 7.90c 7.40b C80SP20(M1) 5.90ab 6.30ab 6.30abc 6.50ab 6.80bc 6.80b C90SP10(M2) 7.00b 7.00a 6.70bc 6.70ab 6.90bc 6.90b
C80SP20(M2) 6.10ab 6.60b 5.40ab 6.60ab 5.90b 6.20ab C90SP10(M3) 6.90b 7.10a 6.90bc 6.90b 7.00bc 7.10b C80SP20(M3) 6.30ab 6.80b 5.90bc 6.50ab 6.60bc 6.60ab In each of the columns, the samples whose means are not followed by the same superscripts are significantly different (at p<0.05)
The cassava-sweet potato gari samples when assessed in their dry particulate form differed significantly (p<0.05) in all the sensory attributes evaluated. Least rated in all attributes was 100% sweet potato gari, with mean scores of 3.93 (dislike slightly) in aroma, 4.13 (dislike slightly) in sourness, 5.33 (neither like, nor dislike) in texture, 2.60 (dislike moderately) in colour, and 4.00 (dislike slightly) in overall acceptability. Most preferred in aroma, sourness, texture and colour was 10% sweet potato substituted gari sample of method one, with preference ratings falling within the range of “like moderately” and “like very much”. Both 10% sweet potato substituted gari of method one and 100% cassava gari shared the highest mean score in overall acceptability and this corresponds to “like very much” on the hedonic scale of preference (Iwe, 2003). When the gari samples were made into eba and evaluated, there were also significant (p<0.05) differences in all the sensory attributes. In terms of mouldability and overall acceptability, 10% sweet potato substituted gari was liked moderately and very much, respectively. In soaked forms, the cassava-sweet
─── Food Technologies ───
─── Ukrainian Journal of Food Science. 2016. Volume 4. Issue 2 ─── 287
potato gari samples differed (p<0.05) significantly in all the sensory attributes, with 10% sweet potato substituted gari sample of method 1 having the highest rating (corresponding to “like very much”) in soakability.
The difference in level of preference can be attributed to the effect of the different production methods as well as the different levels of sweet potato incorporation. Gari from 90% cassava and 10% sweet potato from method one was most preferred due to the presence of sweet potato in moderate level in the product.
Conclusions The study revealed that the different methods of cassava-sweet potato gari production
have significant effects on the physical, chemical and sensory qualities of cassava-sweet potato gari.
It can be concluded that the inclusion of sweet potato in the production of gari by 10% is acceptable as attested to by the responses of the panelists selected for the sensory evaluation of the products.
The method involving mixing of 90% cassava and 10% sweet potato just before grating gave a gari product of the highest overall acceptability.
Gari produced from the three methods had good proximate coompositions; the various cassava-sweet potato gari products had protein, fat, carbohydrate and ash contents that compared favourably well with those of 100% cassava gari.
The study has also shown that through modifications of traditional method, the physical and technological properties of gari, such as swelling index, bulk density and water absorbtion capacity, could be well improved.
References
1. A.O.A.C (2000), Official Methods of Analysis, 17th Edition, Association of Official
Analytical Chemists, Washington D.C. 2. A.O.A.C (1990), Official Methods of Analysis, 15th Edition. Association of Official
Analytical Chemists, Washington D.C. 3. Abbey B.W., Ibeh G.O. (1988), Functional properties of raw and heat processed
cowpea (Vigna unguiculata, Walp) flour, Journal of Food Science, 53, pp. 1775–1777. 4. Abu J.O., Badifu G.T.O., Akpapunam M.A. (2006), Effect of Crude palm oil inclusion
on some physicochemical properties of gari – a fermented cassava Food product.Nigerian, Food Journal, 24(1), pp. 73–75.
5. Adeniji A.A., Adeniyi B.O., Akoroda M.O., Balogun A., Ega L.A., Ugwu A.A. (2005), "Cassava Development in Nigeria", Department of Agriculture Federal Ministry of Agricultureand Natural Resources Nigeria, FAO Africa`s Best Kept Secret, Michigan State University Press, USA, pp. 7–206.
6. Ajala A.S., Adejuyitan J.A., Babarinde G.O., Adeola F.D. (2008), “Some physicochemical properties of gari obtained from some cottage/household processing locations in Ogbomosho, Southwest, Nigeria”, Proceeding 32ndAnnual Conference/General Meeting of Nigerian Institute of Food Science and Technology, pp. 272-273.
─── Food Technologies ───
─── Ukrainian Journal of Food Science. 2016. Volume 4. Issue 2 ─── 288
7. Akingbala O.J., Oyewole B.O., Uzo-Peters I.P., Karim O.R., Baccus-Taylor H.G.S. (2005), Evaluating stored cassava quality in gari production, Journal of Food, Agriculture and Environment, 3 (1), pp. 75–80.
8. Akpapunam M.A., Markakis P. (1981), “Physicochemical and nutritional aspects of cowpea flour”, Journal of Food Science, 46, pp. 972–973.
9. Almazan (1992), Influence of cassava variety and storage on gari quality. Tropical. Agriculture.(Trinidad), 69 (4), pp. 386–390.
10. Essier A.J.A., Bosveld A.G.J., Vander C. (1993), Studies on the Quantification of Specific Cyanogens in Cassava Products and Introduction of New Chromogen, Journal of Science of Food and Agric., 63, pp. 288–290.
11. Fagbemi, T. N. (1999), Effect of blanching and ripening on functional properties of Plantain (Musa aab) Flour. Plant Food for Human Nutrition, 54 (2), pp. 261–269.
12. FAO (1970), Food and Agricultural and Organization Year Book FAO, Rome 13. Hahn N.D., Ekpere J.A., Ezumah H., Gebremeskel T., Ikpi, A.E. (1986), Cassava, a
crop for household food security, A 1986 situation analysis from Oyo Local Government Area.
14. Ihekoronye A. I., Ngoddy P.O. (1985), Integrated Food Science and Technology for the Tropics. Macmillan Publisher, London.
15. IITA (2003), Assessment of Nigeria’s Agricultural Policy, USAID – Nigeria 16. Iwe M. O., Onadipe O.O. (2001), Effect of addition of extruded full fat soy flour into
sweet potato flour on functional properties of the mixture, Journal of Sustainable Agriculture and Environment, 3(1), pp. 109–117.
17. Karim O.R., Oluwole O.B, Olatunji O.A., Odunfa S.A. (2004), Production and Quality Attributes of Gari from Dried cassava chips. Journal of Sustainable Tropical Agricultural Research, 10, pp. 71–75.
18. Kure O.A, Nwankwo L., Nyasu G. (2012), Production and quality evaluation of gari-like products from sweet potato, Scholars Research Library.
19. Nozipho M. M., Albert T. M. (2015), Sweet Potato (Ipomoea batatas L.) as a Draught Tolerant and Food Security Crop. S Afr J Sci.,111 (11/12), p. 8
20. Remya M., Subha, S. (2014), Sweet Potato – A Valuable Medicinal Food: A Review Journal of Medicinal Food 17 (7), pp. 733–741.
21. O’Hair, Stephen K. (1993), Cassava Research and Education Centre, University Florida
22. Odunfa S.A. (1985), African fermented foods, In: Microbiology of fermented foods, 2, Elsevier, pp. 155–191,
23. Oduro I., Ellis W.O., Dziedzoave N.T. (2000), Quality of Gari from selected processing zones in Ghana, Food Contro, 2, pp. 297–303
24. Ojo A., Akande E.A. (2013), Quality evaluation of gari produced from cassava and sweet potato tuber mixes, African Journal of Biotechnology, 12(31), pp. 4920–4924.
25. Onabolu A., (2001), Cassava Processing, Consumption and Dietary Cyanide Exposure, IHCAR Karohnska Institute, Sweden, pp. 6–7.
26. Sanni L. O., Babajide J. M., Ojerinde M. W. (2007), Effect of Chemical Pretreatments on the Physico-Chemical and Sensory Attributes of Sweet Potato-Gari, International Journal of Agricultural Sciences, Sciences, Environment and Technology. 6(1), pp. 41–49
27. Sanni L.O., Maziya-Dixon B., Akanya J., Okoro C.I., Alaya Y., Egwuonwu, C.V., Okechukwu R., Ezedinma C., Akoroda M., Lemchi J., Okoro E., Dixon A. (2005), Standards for Cassava Products and Guidelines for Export, IITA, Ibadan, Nigeria.

─── Food Technologies ───
─── Ukrainian Journal of Food Science. 2016. Volume 4. Issue 2 ─── 289
28. Sobukola O.P., Akinpelu O.O., Awonorin S.O. (2010), Functional and sensory properties of a sweet potato based extruded snack. 34th Annual conference General meeting Nigerian Institute of Food Science and Technology, pp. 132–133.
29. Sokari T.G., Karibo P.S. (1992), Changes in cassava toxicity during processing into gari and ijapu two fermented food products, Food Additive Contaminants, 9, pp. 379–384.
30. Sosulski F.W. (1962), The centrifuge methods for determining flour absorption in hard red spring wheat, Cereal Chemistry 39, pp. 344–350.
31. Southern Exposure Seed Exchange (2016), Sweet Potato Growing Guide. 32. Sullivan J.N., Asher C.J., Blamey F.P.C. (1997), Nutrient disorders of sweet potato,
Austriallian Centre for International Agricultural Research, Canberra, pp. 9–14. 33. Ukpabi U.J., Ndimele C. (1990), Evaluation of gari production in Imo State Nigeria,
Nigeria Food Journal, 8, pp. 105–110. 34. Umesh R. (2009), Sweet potato nutrition facts, Your guide to healthier nutrition,
available at: www.nutrition-and-you.com.