Phylogenetic analyses of mitochondrial and nuclear …Phylogenetic analyses of mitochondrial and...
27
Phylogenetic analyses of mitochondrial and nuclear data in haematophagous flies support the paraphyly of the genus Stomoxys (Diptera: Muscidae). Najla Dsouli, Fr´ ed´ eric Delsuc, Johan Michaux, Eric De Stordeur, Arnaud Couloux, Michel Veuille, G´ erard Duvallet To cite this version: Najla Dsouli, Fr´ ed´ eric Delsuc, Johan Michaux, Eric De Stordeur, Arnaud Couloux, et al.. Phylogenetic analyses of mitochondrial and nuclear data in haematophagous flies support the paraphyly of the genus Stomoxys (Diptera: Muscidae).. Infection, Genetics and Evolution, Elsevier, 2011, 11 (3), pp.663-70. <10.1016/j.meegid.2011.02.004>. <halsde-00588147> HAL Id: halsde-00588147 https://hal.archives-ouvertes.fr/halsde-00588147 Submitted on 22 Apr 2011 HAL is a multi-disciplinary open access archive for the deposit and dissemination of sci- entific research documents, whether they are pub- lished or not. The documents may come from teaching and research institutions in France or abroad, or from public or private research centers. L’archive ouverte pluridisciplinaire HAL, est destin´ ee au d´ epˆ ot et ` a la diffusion de documents scientifiques de niveau recherche, publi´ es ou non, ´ emanant des ´ etablissements d’enseignement et de recherche fran¸cais ou ´ etrangers, des laboratoires publics ou priv´ es.
Transcript of Phylogenetic analyses of mitochondrial and nuclear …Phylogenetic analyses of mitochondrial and...
Phylogenetic analyses of mitochondrial and nuclear data
in haematophagous flies support the paraphyly of the
genus Stomoxys (Diptera: Muscidae).
Najla Dsouli, Frederic Delsuc, Johan Michaux, Eric De Stordeur, Arnaud
Couloux, Michel Veuille, Gerard Duvallet
To cite this version:
Najla Dsouli, Frederic Delsuc, Johan Michaux, Eric De Stordeur, Arnaud Couloux, et al..Phylogenetic analyses of mitochondrial and nuclear data in haematophagous flies support theparaphyly of the genus Stomoxys (Diptera: Muscidae).. Infection, Genetics and Evolution,Elsevier, 2011, 11 (3), pp.663-70. <10.1016/j.meegid.2011.02.004>. <halsde-00588147>
HAL Id: halsde-00588147
https://hal.archives-ouvertes.fr/halsde-00588147
Submitted on 22 Apr 2011
HAL is a multi-disciplinary open accessarchive for the deposit and dissemination of sci-entific research documents, whether they are pub-lished or not. The documents may come fromteaching and research institutions in France orabroad, or from public or private research centers.
L’archive ouverte pluridisciplinaire HAL, estdestinee au depot et a la diffusion de documentsscientifiques de niveau recherche, publies ou non,emanant des etablissements d’enseignement et derecherche francais ou etrangers, des laboratoirespublics ou prives.

1
Phylogenetic analyses of mitochondrial and nuclear data in haematophagous flies support the paraphyly of the genus Stomoxys (Diptera: Muscidae).
Najla DSOULI-AYMES1, Frédéric DELSUC2, Johan MICHAUX3, Eric DE STORDEUR1,
Arnaud COULOUX4, Michel VEUILLE5 and Gérard DUVALLET1
1 Centre d’Ecologie fonctionnelle et évolutive UMR 5175 CEFE, Université Montpellier 3,
Montpellier, France. 2 Institut des Sciences de l’Evolution, UMR 5554-CNRS, Université Montpellier 2, Montpellier,
France. 3 Centre de Biologie et de Gestion des Populations, Montpellier, France 4 Centre National de Séquençage, Evry cedex, France 5 Biologie Intégrative des Populations, Muséum National d’Histoire Naturelle, Paris, France
Correspondence: Najla Dsouli-Aymes, Centre d’Ecologie Fonctionnelle et Evolutive (UMR
5175-CNRS), Université Montpellier 3, Route de Mende, 34199 Montpellier Cedex 5, France.
E-mail: [email protected]
Short title: Phylogeny of Stomoxys flies
2
Abstract
The genus Stomoxys Geoffroy (Diptera; Muscidae) contains species of parasitic flies that are
of medical and economic importance. We conducted a phylogenetic analysis including ten
representative species of the genus including multiple exemplars, together with the closely
related genera Prostomoxys Zumpt, Haematobosca Bezzi, and Haematobia Lepeletier &
Serville. Phylogenetic relationships were inferred using Maximum Likelihood and Bayesian
methods from DNA fragments from the cytochrome c oxidase subunit I (COI, 753 bp) and
cytochrome b (CytB, 587 bp) mitochondrial genes, and the nuclear ribosomal internal
transcribed spacer 2 (ITS2, 426 bp). The combination of mitochondrial and nuclear data
strongly supports the paraphyly of the genus Stomoxys because of the inclusion of
Prostomoxys saegerae Zumpt. This unexpected result suggests that Prostomoxys should be
renamed into Stomoxys. Also, the deep molecular divergence observed between the
subspecies Stomoxys niger niger Macquart and S. niger bilineatus Grünbreg led us to
propose that they should rather be considered as distinct species, in agreement with
ecological data. Bayesian phylogenetic analyses support three distinct lineages within the
genus Stomoxys with a strong biogeographical component. The first lineage consists solely
of the divergent Asian species S. indicus Picard which appears as the sister-group to all
remaining Stomoxys species. The second clade groups the strictly African species S.
inornatus Grünbreg, S. transvittatus Villeneuve, S. omega Newstead, and S. pallidus
Roubaud. Finally, the third clade includes both African occurring and more widespread
species such as the livestock pest S. calcitrans Linnaeus. Divergence time estimates indicate
that the genus Stomoxys originated in the late Oligocene around 30 million years ago, with
the major lineages diversifying in the Early Miocene between 20 and 15 million years ago at
a time when temperate forests developed in the Northern Hemisphere.

3
1. Introduction
Stomoxys flies are principally haematophagous, and are associated with livestock
and wildlife throughout the world. The most studied species, Stomoxys calcitrans, is an
economically important pest of cattle and several studies have attempted to estimate its
impact on cattle production (Miller et al., 1973; Campbell et al., 1977; 2001). These flies
represent a serious nuisance not only because of their painful bites and blood predation, but
also because they are involved in the mechanical transmission of several pathogens, such
as the Capripoxvirus causing a cattle disease (Lumpy skin disease), Anaplasma marginale
the causative agent of severe bovine anaplosmosis, and Dermatophilus congolensis the
causative agent of dermotophilosis (Zumpt, 1973; D’Amico et al., 1996; Foil & Gorham,
2000).
The genus Stomoxys belongs to the tribe Stomoxyini in the subfamily Muscinae (De
Carvalho, 1989; Couri & De Carvalho, 2003). This subfamily is part of the large family
Muscidae comprising about 4,500 described species classified in 180 genera (De Carvalho
et al., 2005). Within Muscidae, phylogenetic analyses have been conducted at several
taxonomic levels to assess the relationships among constitutive species (Couri & Pont, 2000;
Couri & De Carvalho 2003; Schuhli & De Carvalho 2005; De Carvalho & Pont 2006; Schuhli
et al. 2007). Recently, Nihei & De Carvalho (2007) carried out a cladistic analysis to assess
the monophyly of the Muscini tribe. However, since the monograph of Zumpt (1973) who
proposed the monophyly of Stomoxyini on the basis of morphological characters, and despite
the medical and economic importance of these parasitic flies, no phylogenetic analysis has
been carried out to assess the relationships within Stomoxyini. The flies of this tribe are
easily recognized by their typical piercing/sucking mouthparts which differentiate them from
the common housefly (Musca domestica) and relatives from the Muscini tribe. The
Stomoxyini tribe consists of 10 genera and about 39 species reviewed by Zumpt (1973), the
most medically and economically important species are members of the genera
Haematobosca, Haematobia and Stomoxys.
The genus Stomoxys, which originated from the Old World, includes 18 species
(Zumpt, 1973). Among these species, only S. calcitrans has a worldwide distribution and is a
synanthropic fly. All other species are exclusively tropical, twelve of which are located on the
African continent, four on the Asian continent, and one species, S. sitiens Rondani, has been
reported in both Africa and Asia (Zumpt, 1973) (Table 1).
In this study, we address the phylogenetic relationships of the Stomoxys genus using
mitochondrial (COI, CytB) and nuclear ribosomal (ITS2) nucleotide sequences. Mitochondrial
DNA (mtDNA) has been widely used in systematic and many universal PCR primers are
available for genes like COI and CytB (Avise, 2004). The ITS2 region is easy to amplify and
have been used in previous phylogenetic studies of Diptera (Hwang, 2007; Thanwisai et al.,

4
2006). This work explores congruence and information content within the different molecular
datasets analysed using probabilistic methods of phylogenetic reconstruction. Phylogenetic
results are discussed and taken into consideration to propose a taxonomic revision of the
group. Also, we propose estimations of divergence times for major clades within Stomoxyini
based on a relaxed molecular clock approach. This allowed discussing the evolutionary
history of Stomoxys species in its biogeographical context.
2. Materials and methods
2.1. Taxon sampling
The material used in this study belongs to the Laboratoire de Zoogéographie of the
Université Paul-Valéry in Montpellier (France), and to the Department of Entomology of the
Natural History Museum in London (United-Kingdom). For Stomoxys we sampled 11
representative species or subspecies. As outgroups, we incorporated Prostomoxys
saegerae, the unique representative species of Prostomoxys, and Haematobosca
croceicornis, a newly described species from Gabon (Pont & Dsouli, 2008). For this study,
we also included sequences of Haematobia irritans and Musca domestica (Muscidae), as
well as species belonging to the more distantly related Drosophilidae, Syrphidae and
Dolichopodidae families in order to provide calibration points for molecular dating analyses
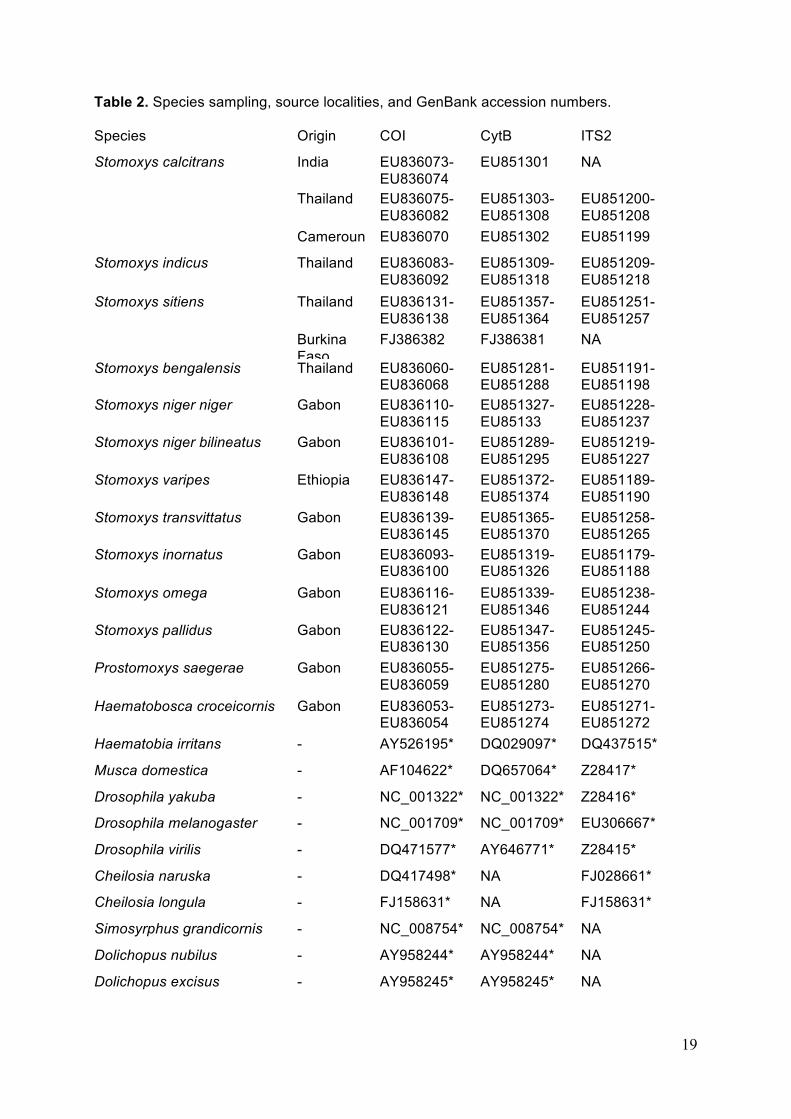
(Wiegmann et al., 2003). Geographical origins of studied specimens and sequences
accession numbers are listed in Table 2. Specimens are available upon request from the
corresponding author and are stored in the Laboratoire de Zoogéographie of the Université
Paul-Valéry in Montpellier (France).
2.2. DNA extraction, amplification and sequencing
Genomic DNA was extracted using the DNAeasy tissue Kit (QIAGEN) to a final
volume of 180 µl. Amplifications by PCR, using the specific primer pairs described in Table 3,
led to amplicons of different lengths for the COI (753 bp), CytB (587 bp) and ITS2 (~ 430 bp)
regions. All PCR amplifications were performed in a 30µl reaction volume containing, at final
concentrations, 200 µM dNTPs (diNucleotide Tri Phosphate), 10X buffer, 25µM of each
primers and 0.5µl of Taq polymerase (Eurogentec Red GoldStar®), and 3 µl of purified DNA.
Thermal cycling conditions for PCR were as followed: initial denaturation at 94°C for 4 min.,
35 cycles of denaturation at 94°C for 40 sec., annealing at 48-50°C for COI, 57-58°C for
CytB, and 60-62°C for ITS2, and extension at 72°C for 1 min. A final elongation step at 72°C
for 10 min completed the DNA amplification process. Ten specimens for each species were
5
sequenced using Sanger sequencing on an ABI 3730 automatic sequencer at the Centre
National de Séquençage (Génoscope) in Evry (France).
2.3. Phylogenetic analyses
The nucleotide sequences from COI, CytB, and ITS2 were automatically aligned
using the multiple alignment program ClustalW 1.4 (Thompson et al., 1994) using default
parameters. Multiple sequence alignments were then adjusted by visual inspection, taking
the sequences of S. calcitrans available in GenBank as a reference for each gene portion.
Alignments were cleaned from problematic alignment blocks using Gblocks 0.91
(Castresana, 2000) using the following parameters: Minimum number of sequences for a
conserved position = 38; Minimum number of sequences for a flanking position = 38;
Maximum number of contiguous nonconserved positions = 8; Minimum length of a block = 5;
Allowed gap positions = with half.
Probabilistic analyses were carried out on each individual datasets (COI, CytB, and
ITS2). Maximum likelihood (ML) reconstruction was conducted using PAUP* 4.0b10
(Swofford, 2002). The best-fitting models of sequence evolution for different partitions were
determined based on the Akaike Information Criterion (AIC) as implemented in jModelTest
(Posada, 2008) using PHYML (Guindon & Gascuel, 2003) for calculating likelihood scores.
ML heuristic searches were conducted with PAUP* using Tree Bisection Reconnection (TBR)
branch-swapping on a Neighbor-Joining (NJ) starting tree using the best-fitting model and
associated parameters selected by jModelTest. ML bootstrap proportions were obtained by
repeating the same ML heuristic search on 100 pseudo-replicated datasets in order to
evaluate the confidence for each node of the tree topology.
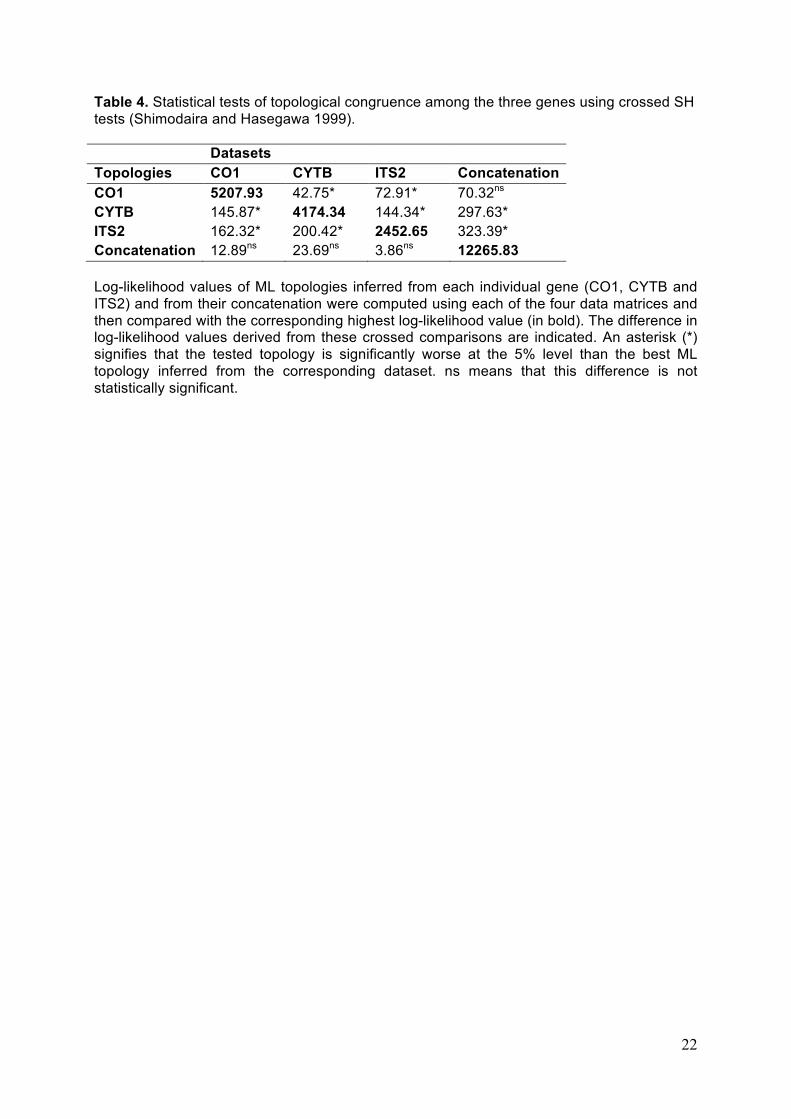
Crossed statistical SH tests (Shimodaira & Hasegawa 1999) of congruence between
the three genes were performed in PAUP* by testing the best ML topology obtained from
each gene against the topology inferred from their concatenation. These tests were run using
each individual gene dataset and the concatenated dataset (see Table 4 for details).
Bayesian phylogenetic inference was conducted using MrBayes 3.1.2 (Ronquist &
Huelsenbeck, 2003). Three a priori partition schemes were tested for analyzing the
concatenation of the three genes (COI, CytB, and ITS2): one single partition, a 3 gene
partition, and a 7 partition scheme distinguishing 6 partitions for each codon position of the
two coding genes (COI and CytB) plus a single partition for ITS2. For each partition, we used
the best-fitting model selected by jModelTest. Bayesian inference under each partition
scheme was conducted with two independent runs of four incrementally-heated Metropolis
Coupled Markov Chain Monte Carlo (MCMCMC) starting from a random tree. MCMCMC
were run for 3,000,000 generations with trees and associated model parameters being
sampled every 300 generations. The initial 2,000 trees in each run were discarded as burn-in
6
samples and the harmonic mean of the likelihood was calculated by combining the two
independent runs. The harmonic means were then used to compute the Bayes factor for the
three possible partition comparisons (no partition versus 3 partitions by gene, no partition
versus 7 partitions by codon and gene, and 3 partitions by gene versus 7 partitions by codon
and gene). The best partition strategy was then determined by the 2ln Bayes factor criterion
as recommended by Brandley et al. (2005). The 50% majority-rule consensus tree was then
computed from the 16,000 trees sampled in the two independent runs under the best model.
Posterior probabilities greater than or equal to 95 % are generally regarded as strong support
for a clade (Wilcox et al., 2002), but the correspondence with bootstrap support values is not
exact (Douady et al., 2003).
2.4. Molecular datings
Bayesian estimation of divergence times under relaxed-clock models was conducted
using the Multidivtime package (Thorne & Kishino, 2002). We used the previously estimated
Bayesian topology as the best hypothesis for Stomoxys phylogeny onto which divergence
dates were estimated. The inclusion of species belonging to Drosophilidae (Drosophila virilis,
D. melanogaster and D. yakuba), Syrphidae (Simosyrphus grandicornis, Cheilosia longula
and C. naruska) and Dolichopodidae (Dolichopus longula and D. nubilus), which represent
other brachyceran groups, allowed calibrating the tree. Indeed, based on a previously
established timescale for brachyceran flies from Bayesian analyses of 28S rRNA data
(Wiegmann et al., 2003), our tree was calibrated by using (1) the occurrence of Schizophora
87 million years ago (Mya) as the a priori expected number of time units between tip and
root, and (2) the estimated date of the Drosophila/Musca split between 48 and 51 Mya as the
calibration constraint. This previous molecular estimate was used in the absence of any
relevant fossil calibration for Stomoxyini.
First, the program Baseml of the PAML package version 4.2b (Yang, 2007) was used
to estimate the nucleotide frequencies, transition/transversion ratio, and rate heterogeneity
among sites for the concatenated dataset. These values parameterize the F84+G nucleotide
substitution model. Second, we calculated the branch lengths of the constrained topology
and the associated variance-covariance matrix under this model using with the program
Estbranches. Finally, the program Multidivtime was used to run a Markov chain Monte Carlo
(MCMC) for estimating mean posterior divergence times on nodes with associated standard
deviations and 95% credibility intervals (95% CredI) from the variance–covariance matrix
produced by Estbranches. The MCMC was sampled 10,000 times every 100 cycles after a
burn-in stage of 100,000 cycles. The prior for the expected number of time units between tip
and root was set at 87 Mya (SD = 43 Mya). The estimated branch lengths obtained by
Estbranches were used to estimate the median amount of evolution between the root and all
7
the tips of the ingroup. Other priors for gamma distribution of the rate at root node (rtrate and
rtratesd) and the Brownian motion constant describing the rate variation (brownmean and
brownsd) were derived from the median branch length of the phylogram. The highest
possible number of time units between tip and root (Bigtime) was set to 119 Mya which
corresponds to the upper bound of the 95% CredI for Schizophora as estimated by
Wiegmann et al. (2003). The age of the node Musca/Drosophila was constrained using an
upper bound of 51 Mya and a lower bound of 48 Mya (Wiegmann et al., 2003).
3. Results
3.1. Sequence characteristics
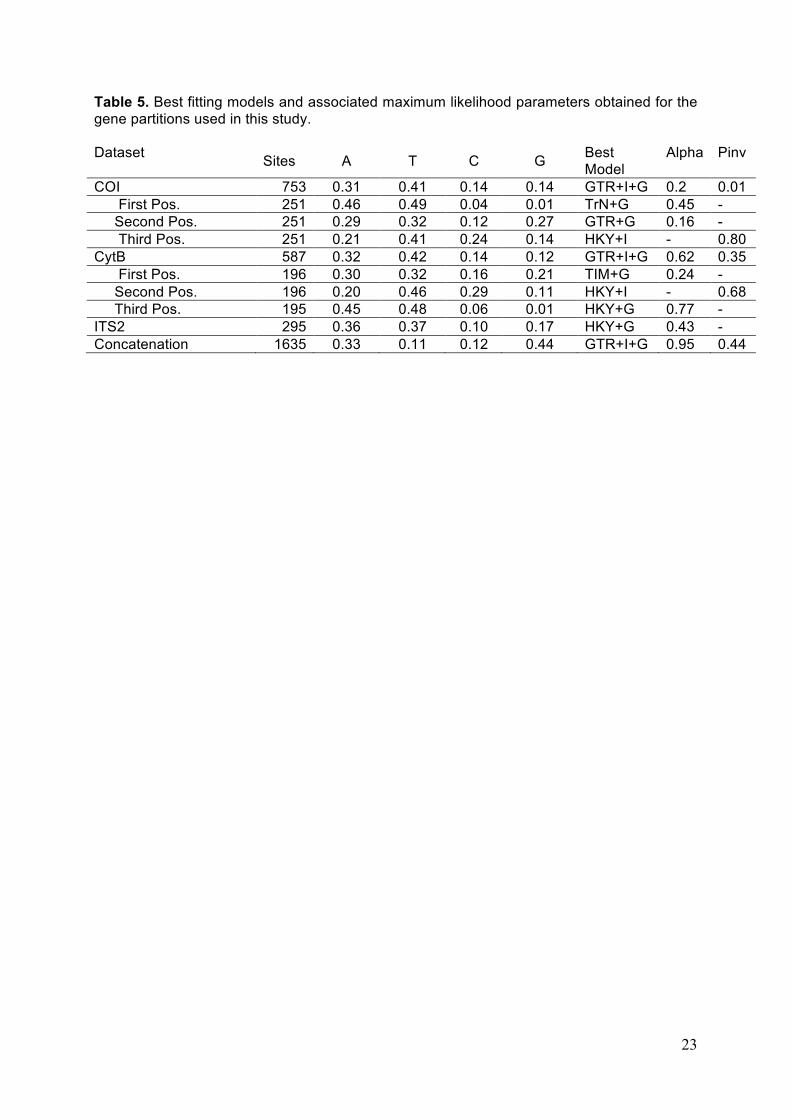
Alignment statistics and models selected for phylogenetic analyses for each data
partitions are summarized in Table 5. Alignment of the mitochondrial genes was
straightforward, as no indels were introduced. The alignment of COI sequences resulted in
753 nucleotide sites of which 228 (30.3%) are variable, and 198 (26.3 %) are parsimony
informative. jModelTest identified the GTR+G+I model as the best-fitting model for the COI
gene (lnL= -3610.24) based on the AIC. The gamma distribution shape parameter (alpha)
was estimated to 0.2 which reveals strong among-site rate heterogeneity in this barcoding
gene. The CytB alignment contained 587 sites of which 204 (34.8%) are variable and 161
(27.4 %) are informative. jModelTest also identified the GTR+G+I model as the best-fitting
nucleotide substitution model for the CytB gene (lnL= -3121.46) with an estimated alpha of
0.62. Finally, the initial alignment of ITS2 sequences totalized 426 sites including indels. 131
sites corresponding to ambiguously aligned hypervariable regions were excluded from
subsequent analyses by applying Gblocks. The remaining 295 sites contain 168 (57 %)
variable sites of which 147 (50 %) are parsimony informative which makes this marker the
most variable of our study. jModelTest identified the HKY+G model as the best-fitting model
for the ITS2 marker (lnL= -2454.70). The gamma distribution shape parameter alpha was
estimated to 0.43 in this ribosomal internal transcribed spacer.
3.2. Phylogenetic relationships
We evaluated topological congruence among the individual genes by computing
crossed SH tests in which the highest-likelihood topologies obtained with each individual
datasets and their concatenation were compared against each other (Table 4). While there is
apparent incongruence among the individual markers, none of the three individual datasets
in fact significantly rejects the ML topology supported by their concatenation (see last line of
Table 4). This indicates that combining the three individual gene datasets leads to a
8
phylogenetic estimate that is compatible with the signal contributed by each individual gene.
We therefore decided to concatenate the three datasets in order to maximize the number of
characters analysed and to enhance the phylogenetic signal as advocated by Delsuc et al.
(2002).
The total number of nucleotide positions in the concatenation was 1635. Bayes factor
comparisons showed that the best-fitting model for the whole concatenation was the use of a
single GTR+G model. Indeed, the 2ln Bayes factor criterion (Brandley et al., 2005) was
always in favour of H0 in the three partition scheme comparisons (2lnBF < 0.03) indicating
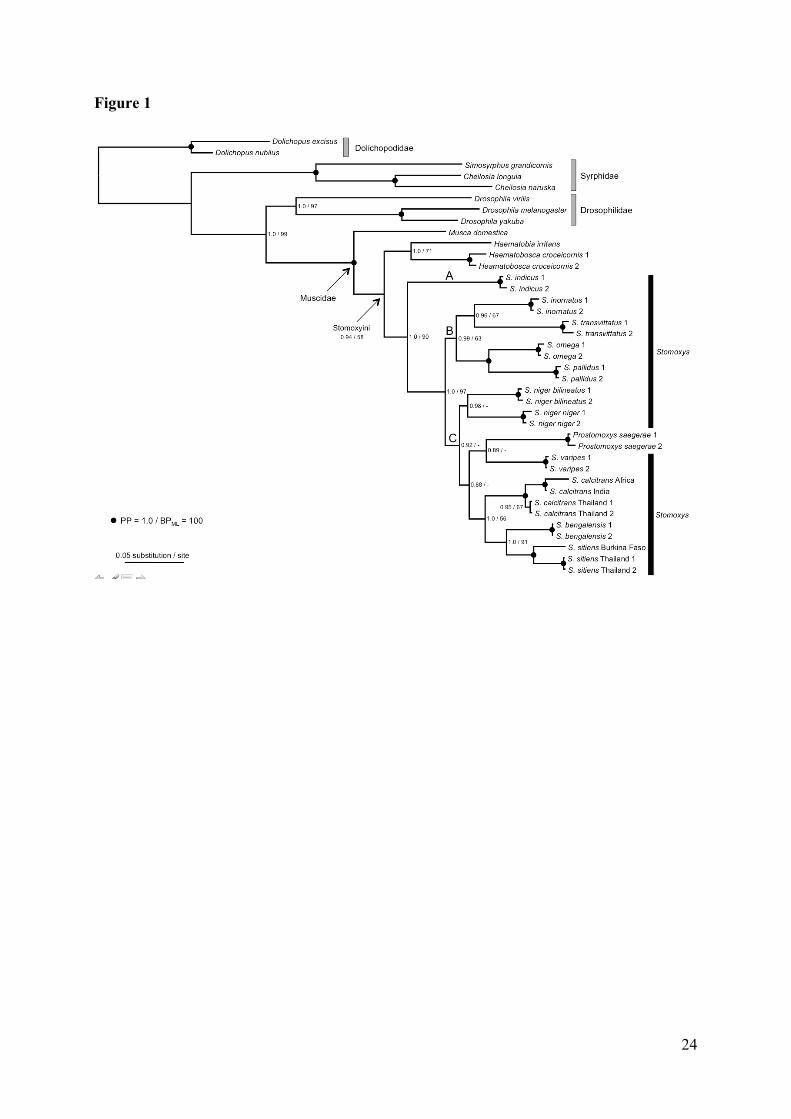
that it was not worth partitioning in our case. The phylogenies obtained from ML and
Bayesian methods under a single GTR+G were identical, but the Bayesian analysis provided
higher support values for most of the nodes (Fig. 1). Our results support the monophyly of
Haematobia and Haematobosca (PP = 1.0; BPML = 71), and this clade appears as the sister-
group to the remaining Stomoxyini. The genus Stomoxys is rendered paraphyletic with strong
support (PP = 1.0; BPML = 90) due to the inclusion of Prostomoxys saegerae within it, as a
sister-group to S. varipes (Fig. 1). Strong support is obtained (PP = 1.00; BPML = 97) for S.
indicus as representing the sister-group to all remaining species within the Stomoxys group
(Fig. 1). Three major clades can be distinguished according to the Bayesian consensus tree
within Stomoxyini. The first clade (clade A) is represented by S. indicus alone which is an
Asian species. The second clade (clade B) is well supported (PP = 0.99 and BPML = 63) and
groups species from African origin (S. pallidus, S. omega, S. transvittatus, and S. inornatus).
Finally, the third clade (clade C), only supported by the Bayesian analysis (PP = 0.92),
regroups all the remaining species containing cosmopolitan, African, and Asian species. This
clade can be further divided into three subclades. The first subclade associates the two
subspecies S. niger niger and S. niger bilineatus (PP = 0.98), the second subclade
associates P. saegerae and S. varipes (PP = 0.89), and the third subclade composed of S.
calcitrans, S. sitiens, and S. bengalensis (PP = 1.0; BPML = 56) with S. sitiens and S.
bengalensis being sister-groups (PP = 1.0; BPML = 91) (Fig. 1).
3.3. Estimation of Divergence times
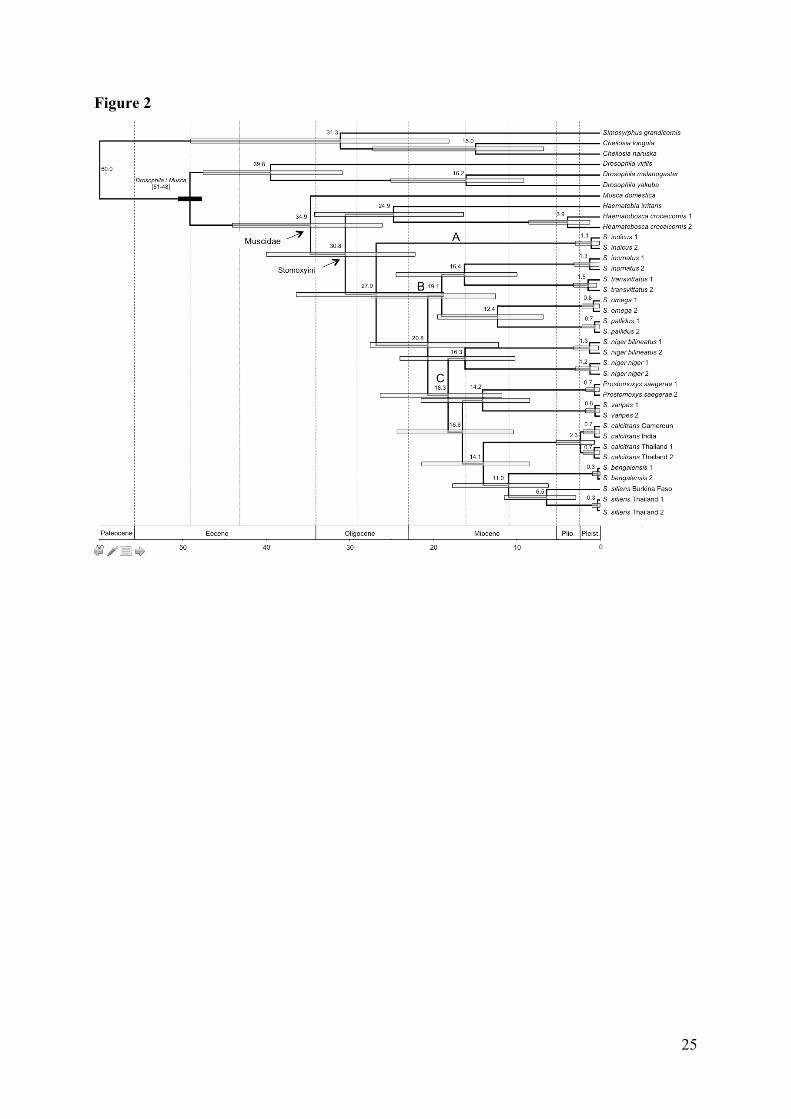
The divergence time estimates are presented as a chronogram where branching
nodes correspond to the mean age estimated from the posterior distribution and its
associated 95% CredI (Fig. 2). The divergence time between the Stomoxys genus and its
Haematobia + Haematobosca sister-clade is estimated around 30.8 Mya (95% CredI: 40.3-
22.3). The age estimate for the early emergence of S. indicus (clade A) within the genus
Stomoxys is estimated at about 27 Mya (36.6-18.9). The divergence between clade B and
clade C occurred around 20.8 Mya (29.6-13.6). According to this inferred timescale, the
major lineages within the genus Stomoxys were present by the late Oligocene, whilst the
9
greatest amount of cladogenesis occurred during the Early Miocene. The two subspecies of
S. niger (S. niger niger and S. niger bilineatus) separated around 16.3 Mya (24.2-10.3), a
divergence time almost exactly similar to the one inferred for the separation between the
species S. inornatus and S. transvittatus estimated at 16.4 Mya (24.6-10.0). Finally, the
divergence between P. saegerae and S. varipes is estimated to have occurred 14.2 Mya
(21.6-8.5) concomitantly with the separation of S. calcitrans from its S. bengalensis/S. sitiens
sister-clade at 14.1 Mya (21.5-8.5).
4. Discussion
4.1. Phylogenetic relationships and taxonomy of the Stomoxys group
The phylogenetic analyses performed in the present study allowed reconstructing a
phylogenetic framework for the major constitutive species of the genus Stomoxys and closely
related genera. Our analyses strongly support the monophyly of Stomoxyini including a
monophyletic group consisting of Haematobia and Haematobosca as a sister-clade to all
remaining Stomoxyini. However, according to our results the genus Stomoxys sensu stricto
is found to be paraphyletic due to the unexpected position of Prostomoxys saegerae which
appears to be well nested within the Stomoxys group as a sister-group to S. varipes (Fig. 1).
Zumpt (1973) created the genus Prostomoxys for the sole species P. saegerae. According to
Zumpt’s identification key for Stomoxyini, Prostomoxys is characterized by maxillary palps
that are as long as the proboscis, whereas Stomoxys is characterized by palps that are
shorter than half the length of the proboscis. This key includes no other diagnostic character
for the distinction of this genus from Stomoxys. Zumpt (1973) mentioned that the
plesiomorphic form of the Stomoxyini mouthparts can be accepted as the maxillary palps
being about as long as the proboscis. Based on our phylogenetic study there appears to be
no reason to incorporate this species in a separate genus as P. saegerae is in fact closely
related to Stomoxys species. Prostomoxys should thus be synonymised with Stomoxys, and
the species Prostomoxys saegerae must be renamed into Stomoxys saegerae. The long
palp characters would be better considered as mere specific traits, since they are likely to be
plesiomorphic.
Within Stomoxys lato sensu (including P. saegerae), our phylogenetic analyses
strongly support the placement of S. indicus as the sister-group to the remaining Stomoxys
species. Taxonomically, S. indicus is considered to be highly variable, with a number of
synonyms used in the entomological literature. As mentioned by Zumpt (1973): “it is possible
that a numerical taxonomic study based on great numbers of specimens from various
populations may reveal that several subspecies may be retained in the future”. This species
10
is described as the most common Stomoxys species in the Oriental region after S. calcitrans
and has been recorded from India to the Pacific islands of Fiji and Samoa, including China
and Japan. Its geographic range also reaches the Palaearctic region on the occidental side.
Moreover, it has also been recorded in a number of South-East Asian countries such as
Thailand (Masmeatathip et al., 2006), Malaysia, Viet Nam, Taiwan, Borneo, Sumatra, and
Java (Zumpt, 1973). Since both of our samples are from Thailand origin, they provide no
information on the genetic diversity among populations of the species, but they reveal its
evolutionary distinctiveness from other members of the genus Stomoxys.
The remaining Stomoxys species included in our study can be divided in two main
clades. Clade B contains only African species and clade C groups both African and more
geographically widespread species (Fig. 1). Clade B regroups S. inornatus, S. transvitattus,
S. omega and S. pallidus sampled from different parts of the Ethiopian region. These species
are ubiquitous and are restricted mainly to forest ecotones where they feed especially on
wildlife fauna (Mavoungou et al., 2008). This large clade appears to be divided in two main
subclades associating S. inornatus and S. transvittatus on one side, and S. omega and S.
pallidus, on the other side. S. inornatus and S. transvittatus have a diurnal activity whereas
S. omega and S. pallidus have a crepuscular activity (Duvallet, unpublished data). These
observations would fit well with the proposed phylogeny. However, the information content of
ecological data for phylogeny is probably limited since activity levels in Stomoxys have been
shown to be highly dependent upon geographical origin (primary forest, secondary forest and
human-modified area) (Mavoungou et al., 2008), climate (temperature, humidity, and solar
radiation level) (Kangwagye, 1974; Charlwood & Lopes, 1980), trapping method, and
physiological state of individuals (Simmond, 1944; La Breque et al., 1975).
The third clade C can be divided into three subclades, two of them being exclusively
African, and one being more geographically widespread. The first subclade groups S. niger
niger and S. niger bilineatus, considered as two subspecies of S. niger according to Zumpt
(1973), whereas the second subclade associates P. saegerae and S. varipes. Solving
species boundaries between closely related species is notoriously difficult in these parasitic
flies. Based on the tree topology, S. niger niger and S. niger bilineatus sequences form
distinct phylogenetic clusters. The pairwise distance between S. niger niger and S. niger
bilineatus based on COI sequences is 8.2%. The use of DNA sequences for species
delimitation has been widely criticized (Tautz et al., 2002; DeSalle et al., 2005; Meier et al.,
2006). The wide overlap between intraspecific and interspecific variability observed in
Diptera COI sequences (0% to 15.5%) (Meier et al. 2006) is especially problematic here,
since the pairwise distance for these subspecies falls into this overlapping area. However,
the genetic distance between S. niger niger and S. niger bilineatus based on the nuclear
ITS2 is also quite large with 14.3 %. Moreover, our molecular dating analysis estimates the

11
separation between the two subspecies around 16.3 Mya (Fig. 2). This is almost as old as
the separation between S. inornatus and S. transvittatus (c.a. 16.4 Mya) and is comparable
with the divergence observed between D. melanogaster and D. yakuba (c.a 16.2 Mya). It is
also more ancient than the divergence between S. omega and S. pallidus (c.a. 12.4 Mya),
and even more ancient than the split between S. varipes and P. saegerae (c.a. 14.2 Mya)
(Fig. 2).
Morphologically, S. niger niger and S. niger bilineatus are distinguished only by the
colour of their tibiae and tarsi. Mavoungou et al. (2008) described S. niger bilineatus and S.
niger niger as sympatric species, the former being abundant in savannas with abundant wild
fauna, while the latter is more associated with anthropized area. Mihok et al. (1996) also
pointed out differences in habitat affinities, sex ratio and activity patterns between these
species. Given morphological observations, ecological isolation and molecular data, it
appears very likely that S. niger niger and S. niger bilineatus belong to different species.
Consequently, we suggest raising them to full specific status and to use S. niger and S.
bilineatus as species names.
Finally, the third subclade within clade C associates S. calcitrans, S. sitiens and S.
bengalensis Picard. S. bengalensis occurs only in Asia, S. sitiens is found in both the African
and Asian continents, while the livestock pest S. calcitrans has a worldwide distribution. S.
calcitrans and S. sitiens appeared to be strictly human commensals since they have
invariably been found in association with human activity, including inside buildings.
4.2. Molecular timescale and biogeography of the Stomoxys group
Our molecular estimate of the separation between Stomoxyini and Muscini falls into
the Late Eocene epoch (c.a. 34.9 Mya) (Fig. 2). This divergence time is compatible with the
record of the oldest Muscidae fossils in the Eocene and the Lower Miocene, 50-20 Mya
(Evenhuis, 1994). The oldest Muscini fossil (about 20-15 Mya) was described from
Dominican amber (Pont & De Carvalho, 1997), whereas no Stomoxyini fossil has been
reported yet. The results presented here show that the radiation of the major Stomoxyini
groups largely overlaps with the hypothetical time span (mid-Oligocene to mid-Miocene)
during which temperate forests developed in the Northern Hemisphere (Guo et al., 2002).
The genus Stomoxys appears to diverge from other Stomoxyini genera in the
Oligocene (c.a. 30 Mya). An Oriental origin of the Stomoxys genus lato sensu is tentatively
suggested, owing to the strong support obtained for the basal branching of S. indicus (Clade
A) and its absence from Africa. Under such a scenario, the common ancestor of the
remaining Stomoxys members would have then split into two groups in the Early Miocene
(c.a. 21 Mya), with one group being distributed in the Ethiopian region (Clade B), while the
other colonized Asia (Clade C). The collision between Eurasia and the Arabo-African plate
12
was initiated by the Oligocene, but the Early Miocene period seems to have been key for the
establishment of intercontinental pathways permitting faunal exchanges between the Afro-
Arabian and Asia plates (Bernor et al., 1987). This biogeographical event fits well with our
estimates of the split between clades B and C occurring within this period. Continental
exchanges through migration events continued until the Late Miocene and could explained
the occurrence of S. calcitrans and S. sitiens in both the African and Asian continents.
Migration until the Late Miocene may have been facilitated by a forest connection that
existed between the African and Oriental regions at this epoch (Moreau, 1963).
Our study is a first step into the molecular phylogenetic analysis of the Stomoxys
genus. Yet, our results point to the need for a taxonomic revision of the Stomoxyini tribe.
Since very few data on the biology and ecology of this group are currently available it would
be necessary to advance the knowledge in these basic research areas. This is a prerequisite
for better understanding how these species originated and diversified in a biogeographical
context.
Acknowledgements
We thank Jacques-François Mavoungou (Gabon), Roundthip Masmeatathip
(Thailand), Alekaw Sinshaw Tegegne (Ethiopia) and the British Museum for providing some
Stomoxys samples. We extend our thanks to Gwenaëlle Mondor (CBGP) for technical
assistance. We also thank two anonymous reviewers for constructive comments. This study
was partially supported by Agence Nationale de la Recherche through the ANR-Biodiv grant
IFORA (Iles Forestières Africaines) and by the CNS-Genoscope “Barcoding insects for
identification” sequencing grant to Michel Veuille. During the course of this research, N. D.-A.
was partially supported by a grant from Société Entomologique de France. This is
contribution ISEM 2011-XXX of the Institut des Sciences de l’Evolution (UMR 5554-CNRS).
References
Avise, J.C. (2004) Molecular Markers, Natural History and Evolution. Chapman & Hall, New
York.
Bernor, R. L., Brunet, M., Ginsburg, L., Mein, P., Pickford, M., Rögl, R., Sen S., Steininger,
F., & Thomas, H. (1987) A consideration of some major topics concerning Old World
Miocene mammalian chronology, migrations and paleogeography. Geobios, 20, 431-
439.
13
Brandley, M.C., Schmitz, A., & Reeder TW. (2005) Partitioned Bayesian analyses, partition
choice, and the phylogenetic relationships of scincid lizards. Systematic Biology 54,
373-390.
Campbell, J.B., White, R.G., Wright, J.E., Crookshank, R. & Clanton, D.C. (1977) Effects of
stable flies (Diptera-Muscidae) on weight gains and feed-efficiency of calves on
growing and finishing rations. Journal of Economic Entomology, 70, 592-594.
Campbell, J.B., Skoda, S.R., Berkerile, D.R., Boxler, D.J., Thomas, G.D., Adams, D.C. &
Davis, R. (2001) Effects of stable flies (Diptera: Muscidae) on weight gains of grazing
yearling cattle. Journal of Economic Entomology, 94, 780-783.
Charlwood, J.D. & Lopes, J. (1980) The age-structure and biting behaviour of Stomoxys
calcitrans (L.) (Diptera: Muscidae) from Manaus, Brazil. Bulletin of Entomological
Research, 70, 549-555.
Castresana, J. (2000). Selection of conserved blocks from multiple alignments for their use in
phylogenetic analysis. Molecular Biology and Evolution, 17, 540-552.
Couri, M.S. & De Carvalho, C.J.B. (2003) Systematic relations among Philornis Meinert,
Passeromyia Rodhain & Villeneuve and allied genera (Diptera, Muscidae). Brazilian
Journal of Biology, 63, 223–232.
Couri, M.S. & Pont, A.C. (2000) Cladistic analysis of Coenosiini (Diptera: Muscidae:
Coenosiinae). Systematic Entomology, 25, 373-392.
D’Amico, F., Gouteux, J.P., Le Gall, F. & Cuisance, D. (1996) Are stable fly (Diptera:
Stomoxyinae) vectors of Trypanosoma vivax in the Central African Republic. Veterinary
Research, 27, 161-170
De Carvalho, C.J.B. (1989) Classificação de Muscidae (Diptera): una proposta através da
análise cladística. Revista Brasileira de Zoologia, 6, 627–648.
De Carvalho, C.J.B., Couri, M.S., Pont, A.C., Pamplona, D.M. & Lopes S.M. (2005) A
catalogue of the Muscidae (Diptera) of the Neotropical region. Zootaxa, 860, 1–282.
De Carvalho, C.J.B. & Pont, A.C. (2006) Taxonomy, cladistics and biogeography of the
South American Brachygasterina Macquart (Diptera: Muscidae). Zootaxa, 1151, 1-26.
Delsuc, F., Scally, M., Madsen, O., Stanhope, M.J., de Jong, W.W., Catzeflis, F.M., Springer,
M.S. & Douzery, E.J.P. (2002) Molecular phylogeny of living xenarthrans and the
impact of character and taxon sampling on the placental tree rooting. Molecular Biology
and Evolution, 19, 1656-1671.
14
DeSalle, R., Egan, M.G. & Siddal, M. (2005) The unholy trinity: taxonomy, species
delimitation and DNA barcoding. Philosophical Transactions of the Royal Society B:
Biological Sciences, 360, 1905-1916.
Douady, C.J, Delsuc F., Boucher Y., Doolittle, W.F. & Douzery E.J.P. (2003). Comparison of
Bayesian and maximum likelihood bootstrap measures of phylogenetic reliability.
Molecular Biology and Evolution, 20, 248-254.
Evenhuis, N.L. (1994) Catalogue of the fossil flies of the world (Insecta: Diptera), Backhuys,
Leiden.
Foil, L.D. & Gorham, J.R. (2000) Mechanical transmission of disease agents by arthropods.
In: B.F. Eldridge and J.D. Edman, Medical Entomology. Dordrecht, The Netherlands,
Kluwer Academic Publishers: 461-514.
Gradstein, F.M., Ogg, J.G. & Smith, A.G. (2004) A Geologic Timescale 2004. Cambridge
University Press, New York.
Guindon, S. & Gascuel, O. (2003) A simple, fast and accurate algorithm to estimate large
phylogenies by maximum likelihood. Systematic Biology, 52, 696–704.
Guo, Z.T., Ruddiman, W.F., Hao, Q.Z., Wu, H.B., Qiao, Y.S., Zhu, R.X., Peng, S.Z., Wei,
J.J., Yuan, B.Y. & Liu, T.S. (2002) Onset of Asian desertification by 22 Myr ago inferred
from loess deposits in China. Nature, 416, 159-163.
Hwang, U. W. (2007) Revisited ITS2 phylogeny of Anopheles (Anopheles) Hyrcanus group
mosquitoes: re-examination of unidentified and misidentified ITS sequences.
Parasitology Research, 101 (41), 885-894.
Kangwagye, T.N. (1974) The seasonal incidence of biting flies (Diptera) in Rwenzori National
Park and Kigezi Game Reserve, Uganda. Bulletin of Entomological Research, 63, 535-
549.
La Breque, G.C., Weidhaas, D.E. & Whitfield, T.L. (1975) Graphic models as intermediate
steps to computerized simulations of stable fly populations. Mosquito News. 35, 316-
321.
Masmeatathip, R., Gilles, J., Ketavan, C. & Duvallet, G. (2006) First survey of seasonal
abundance and daily activity of Stomoxys spp. (Diptera: Muscidae) in Kamphaengsaen
campus, Nakornpathom Province Thailand. Parasite, 13, 245-250.
Mavoungou, J.F., Jay-Robert P., Gilles J., Atsame E.A. & Duvallet, G. (2008) Ecology of
Stomoxys flies (Diptera: Muscidae) in Gabon. First survey in different ecological areas.
Parasite, 15, 27-34.
15
Meier, R., Shiyang, K., Vaidya, G. & Ng, P.K.L. (2006) DNA Barcoding and taxonomy in
Diptera: a tale of high intraspecific variability and low identification success. Systematic
Biology, 55 (5), 715-728.
Mihok, S., Opiyo, M., Eli, M. & Khalfan, S. (1996) Phenology of Stomoxinae in a Kenya
forest. Medical and Veterinary Entomology, 10, 305-316.
Miller, R. W., Pickens, L. G., Morgan, N. O., Thimijan, R. W. & Wilson, R. L. (1973) Effect of
stable flies on feed intake and milk production of dairy cows. Journal of Economic
Entomology, 66, 711 – 713.
Moreau, R.E. (1963) Vicissitudes of the African biomes in the late Pliocene. Proceedings of
the Zoological Society of London, 141, 395.
Nihei, S.S. & De Carvalho, C.J.B. (2007) Phylogeny and classification of Muscini (Diptera,
Muscidae). Zoological Journal of the Linnean Society, 149, 493–532.
Pont, A.C. & De Carvalho, C.J.B. (1997) Three species of Muscidae (Diptera) from
Dominican amber. Studia Dipterologica, 4, 173–181.
Pont, A.C. & Dsouli, N. (2008) A new species of Haematobosca Bezzi from Gabon (Diptera:
Muscidae). Studia dipterologica, 15 (1-2), 259-266.
Posada, D. (2008) jModelTest: phylogenetic model averaging. Molecular Biology and
Evolution, 25, 1253–1256.
Ronquist, F. & Huelsenbeck, J.P. (2003) MrBayes 3: Bayesian phylogenetic inference under
mixed models. Bioinformatics, 19, 1572–1574.
Schuhli, G.S. & De Carvalho, C.J.B. (2005). Revision and cladistics of the Neotropical genus
Pseudoptilolepis Snyder (Diptera, Muscidae). Revista Brasileira de Zoologia, 22, 23–
34.
Schuhli, G.S., De Carvalho, C.J.B. & Wiegmann, B.M. (2007). Molecular phylogenetics of the
Muscidae (Diptera:Calyptratae): new ideas in a congruence context. Invertebrate
Systematics, 21, 263-278.
Sharpe, R. G., Harbach, R.E. & Butlin, R.K. (2000) Molecular variation and phylogeny of
members of the Minimus group of Anopheles subgenus Cellia (Diptera: Culicidae).
Systematic Entomology, 25, 263-272.
Shimodaira, H., & Hasegawa, M. (1999). Multiple comparisons of log-likelihoods with
applications to phylogenetic inference. Molecular Biology and Evolution, 16,1114–
1116.
16
Simon, C., Frati, F., Beckenbach, A., Crespi, B., Lui, H. & Flook, P. (1994) Evolution,
weighting and phylogenetic unity of mitochondrial gene sequences and a compilation of
conserved polymerase chain reaction primers. Annals of Entomological Society of
America, 87, 651-701.
Simon, C., Buckley, T.R., Frati, F., Stewart, J.B. & Beckenbach, A.T. (2006) Incorporating
Molecular Evolution into Phylogenetic Analysis, and a New Compilation of Conserved
Polymerase Chain Reaction Primers for Animal Mitochondrial DNA. Supplemental
Material. Annals of Entomological Society of America, 37, 545-79.
Swofford, D.L. (2002) PAUP*: Phylogenetic Analysis Using Parsimony (*and Other Methods).
Sinauer Associates, Sunderland MA.
Tautz, D., Arctander, P., Minelli, A., Thomas, R. H. & Vogler A.P. (2002) DNA points the way
ahead in taxonomy. Nature, 418, 479.
Thanwisai, A., Kuvangkadilok, C., Baimai, V. (2006) Molecular phylogeny of black flies
(Diptera: Simuliidae) from Thailand, using ITS2rDNA. Genetica, 128 (1-3), 177-204.
Thompson, J.D., Higgins, D.G. & Gibson, T.J. (1994) CLUSTAL W: improving the sensitivity
of progressive multiple sequence alignment through sequence weighting, position
specific gap penalties and weight matrix choice. Nucleic Acids Research, 22, 4673–
4680.
Thorne, J.L. & Kishino, H. (2002) Divergence time and evolutionary rate estimation with
multilocus data. Systematic Biology, 51, 689-702.
Wiegmann, B.M., Yeates, D. K., Thorne, J.L. & Kishino, H. (2003) Time Flies, a New
Molecular Time-Scale for Brachyceran Fly Evolution without a Clock. Systematic
Biology, 52, 745-756.
Wilcox, T.P.D., Zwickl, J., Heath, T. & Hillis, D.M. (2002) Phylogenetic relationships of the
dwarf boas and a comparison of Bayesian and bootstrap measures of phylogenetic
support. Molecular Phylogenetics and Evolution, 25, 361–371.
Yang, Z. (2007) PAML 4: a program package for phylogenetic analysis by maximum
likelihood. Molecular Biology and Evolution 24, 1586-1591
(http://abacus.gene.ucl.ac.uk/software/paml.html).
Zumpt, F. (1973) The Stomoxyinae biting flies of the world. Taxonomy, biology, economic
importance and control measures. Gustav Fischer Verlag, Stuttgart, 175pp.
17
Figure legends
Fig. 1. Phylogenetic relationships among 33 dipteran species inferred from the concatenation
of COI, CytB and ITS2 (1635 nucleotide sites). This phylogram is the 50% majority rule
consensus tree obtained with Bayesian inference under the GTR+G model. Numbers at
nodes indicate Posterior Probabilities (PP) / Maximum Likelihood Bootstrap Proportions
(BPML). Black circles indicate nodes receiving maximum values of PP and BP and dashes
mark nodes above the 50% level. The three main lineages identified within the Stomoxys
group are labeled A, B, and C.
Fig. 2. Chronogram resulting from the relaxed molecular clock Bayesian analysis of the
concatenation of COI, CytB and ITS2 (1635 nucleotide sites). Mean divergence times are
indicated at nodes and node bars represent 95% Credibility Intervals. Scale is in Millions of
years before present. Species names belonging to the genus Stomoxys have been
abbreviated (S.). The Drosophila/Musca calibration constraint is shown in black. Tertiary
Epochs are indicated following the geologic timescale 2004 of the Geological Society of
America (Gradstein et al., 2004). Plio.: Pliocene; Pleist.: Pleistocene.

18
Table 1. Stomoxys species distributions as mentioned by Zumpt (1973). Species Distribution S. bengalensis Picard India to Java S. boueti Roubaud Benin (ex-Dahomey), Congo S. calcitrans (Linnaeus) Cosmopolitan S. indicus Picard Oriental region and neighbouring Paleartic territories S. inornatus Grünberg Tropical Africa S. luteolus Villeneuve Central and East Africa S. niger Macquart
S. niger niger Ethiopian and Madagascan regions
S. niger bilineatus Ethiopian and Madagascan regions
S. ochrosoma Speiser Central and East Africa S. omega Newstead Ethiopian Region S. pallidus Roubaud Tropical Africa S. pullus Austen India S. sitiens Rondani Ethiopian and Oriental regions, in Egypt it reaches the
Palearctic region S. stigma Van Emden Uganda – Congo S. taeniatus Bigot Ethiopian region S. transvittatus Villeneuve Southern and Central Africa S. uruma Shinonaga & Kano Oriental region S. varipes Bezzi East and Central Africa southward to Rhodesia S. xanthomelas Roubaud Congo – Tanzania – Uganda
19
Table 2. Species sampling, source localities, and GenBank accession numbers. Species Origin COI CytB ITS2
Stomoxys calcitrans India EU836073-EU836074
EU851301 NA
Thailand EU836075-EU836082
EU851303-EU851308
EU851200-EU851208
Cameroun EU836070 EU851302 EU851199
Stomoxys indicus Thailand EU836083-EU836092
EU851309-EU851318
EU851209-EU851218
Stomoxys sitiens Thailand EU836131-EU836138
EU851357-EU851364
EU851251-EU851257
Burkina Faso
FJ386382 FJ386381 NA
Stomoxys bengalensis Thailand EU836060-EU836068
EU851281-EU851288
EU851191-EU851198
Stomoxys niger niger Gabon EU836110-EU836115
EU851327-EU85133
EU851228-EU851237
Stomoxys niger bilineatus Gabon EU836101-EU836108
EU851289-EU851295
EU851219-EU851227
Stomoxys varipes Ethiopia EU836147-EU836148
EU851372-EU851374
EU851189-EU851190
Stomoxys transvittatus Gabon EU836139-EU836145
EU851365-EU851370
EU851258-EU851265
Stomoxys inornatus Gabon EU836093-EU836100
EU851319-EU851326
EU851179-EU851188
Stomoxys omega Gabon EU836116-EU836121
EU851339-EU851346
EU851238-EU851244
Stomoxys pallidus Gabon EU836122-EU836130
EU851347-EU851356
EU851245-EU851250
Prostomoxys saegerae Gabon EU836055-EU836059
EU851275-EU851280
EU851266-EU851270
Haematobosca croceicornis Gabon EU836053-EU836054
EU851273-EU851274
EU851271-EU851272
Haematobia irritans - AY526195* DQ029097* DQ437515*
Musca domestica - AF104622* DQ657064* Z28417*
Drosophila yakuba - NC_001322* NC_001322* Z28416*
Drosophila melanogaster - NC_001709* NC_001709* EU306667*
Drosophila virilis - DQ471577* AY646771* Z28415*
Cheilosia naruska - DQ417498* NA FJ028661*
Cheilosia longula - FJ158631* NA FJ158631*
Simosyrphus grandicornis - NC_008754* NC_008754* NA
Dolichopus nubilus - AY958244* AY958244* NA
Dolichopus excisus - AY958245* AY958245* NA

20
The sequences marked with an asterisk (*) were obtained from GenBank, (NA) no available data.

21
Table 3. COI, CytB and ITS2 Primers used for amplifications and sequencing. Primers Sequences (5’->3’) Reference C1-J-2813 (direct) TL2-N-3014 (reverse)
CAACATTTATTTTGATTTTTTGG TCCATTGCACTAATCTGCCATATTA
Simon et al.,1994; 2006
CB-J10933 (direct) CB-N11526 (reverse)
GTTTTACCTTGAGGACAAATATC TTCAACTGGTCGAGCTCCAATTCA Simon et al., 1994
ITS2A (direct) ITS2B (reverse)
TGTGAACTGCAGGACACAT TATGCTTAAATTCAGGGGGT Sharpe et al., 2000
22
Table 4. Statistical tests of topological congruence among the three genes using crossed SH tests (Shimodaira and Hasegawa 1999). Datasets Topologies CO1 CYTB ITS2 Concatenation CO1 5207.93 42.75* 72.91* 70.32ns CYTB 145.87* 4174.34 144.34* 297.63* ITS2 162.32* 200.42* 2452.65 323.39* Concatenation 12.89ns 23.69ns 3.86ns 12265.83 Log-likelihood values of ML topologies inferred from each individual gene (CO1, CYTB and ITS2) and from their concatenation were computed using each of the four data matrices and then compared with the corresponding highest log-likelihood value (in bold). The difference in log-likelihood values derived from these crossed comparisons are indicated. An asterisk (*) signifies that the tested topology is significantly worse at the 5% level than the best ML topology inferred from the corresponding dataset. ns means that this difference is not statistically significant.
23
Table 5. Best fitting models and associated maximum likelihood parameters obtained for the gene partitions used in this study. Dataset Sites A T C G Best
Model Alpha Pinv
COI 753 0.31 0.41 0.14 0.14 GTR+I+G 0.2 0.01 First Pos. 251 0.46 0.49 0.04 0.01 TrN+G 0.45 - Second Pos. 251 0.29 0.32 0.12 0.27 GTR+G 0.16 - Third Pos. 251 0.21 0.41 0.24 0.14 HKY+I - 0.80 CytB 587 0.32 0.42 0.14 0.12 GTR+I+G 0.62 0.35 First Pos. 196 0.30 0.32 0.16 0.21 TIM+G 0.24 - Second Pos. 196 0.20 0.46 0.29 0.11 HKY+I - 0.68 Third Pos. 195 0.45 0.48 0.06 0.01 HKY+G 0.77 - ITS2 295 0.36 0.37 0.10 0.17 HKY+G 0.43 - Concatenation 1635 0.33 0.11 0.12 0.44 GTR+I+G 0.95 0.44
24
Figure 1
25
Figure 2