![LAPIERRE GF MONT VENTOUX 2020Notice (8): iconv(): Detected an illegal character in input string [APP/Plugin/PhpExcel/Vendor/PHPExcel/Shared/String.php, line 490] Notice (8): iconv()](https://static.fdocuments.fr/doc/165x107/60b60828208a3415de3d821d/lapierre-gf-mont-ventoux-2020-notice-8-iconv-detected-an-illegal-character.jpg)
On the Effective Earthquake Early Warning and its ... · Function of UrEDAS (1985) is to estimate...
28
1 System and Data Research Co., Ltd. Tokyo Institute of Technology Yutaka NAKAMURA, Dr. Eng. System and Data Research, Co., Ltd. Visiting Professor, Tokyo Institute of Technology On the Effective Earthquake Early Warning and its Verifications 8 th Annual Meeting, Asia Oceania Geosciences Society, August 2011, Taiwan. SE85 / Earthquake Early Warning, SE85-D3-PM1-201C-003, Invited.
Transcript of On the Effective Earthquake Early Warning and its ... · Function of UrEDAS (1985) is to estimate...
1 System and Data Research Co., Ltd. Tokyo Institute of Technology
Yutaka NAKAMURA, Dr. Eng.
System and Data Research, Co., Ltd.Visiting Professor, Tokyo Institute of Technology
On the Effective Earthquake Early Warning
and its Verifications
8th Annual Meeting, Asia Oceania Geosciences Society, August 2011, Taiwan.
SE85 / Earthquake Early Warning, SE85-D3-PM1-201C-003, Invited.
3 System and Data Research Co., Ltd. Tokyo Institute of Technology
We can see from this video as follows;
EEW can get only short time margin.
It is extremely necessary and important to prepare and exercise for EEW in advance.
In any case, only the immediate and proper warning can be useful.
And one of the lessons from the 3.11 Earthquake is
Avoid that Warning becomes crying Wolf.
4 System and Data Research Co., Ltd. Tokyo Institute of Technology
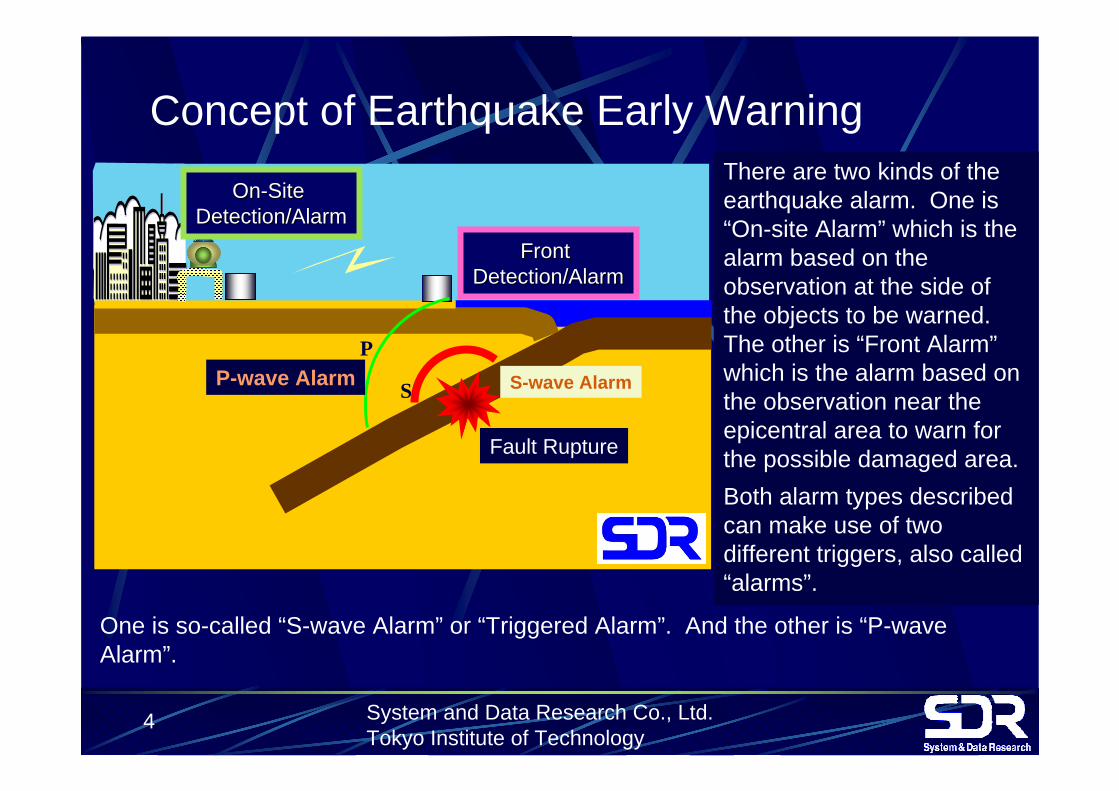
Concept of Earthquake Early Warning
P
S
Front Front Detection/AlarmDetection/Alarm
OnOn--Site Site Detection/AlarmDetection/Alarm
Fault Rupture
P-wave Alarm S-wave Alarm
There are two kinds of the earthquake alarm. One is “On-site Alarm” which is the alarm based on the observation at the side of the objects to be warned. The other is “Front Alarm”which is the alarm based on the observation near the epicentral area to warn for the possible damaged area.Both alarm types described can make use of two different triggers, also called “alarms”.
One is so-called “S-wave Alarm” or “Triggered Alarm”. And the other is “P-wave Alarm”.
5 System and Data Research Co., Ltd. Tokyo Institute of Technology
FaultFault
EpicenterEpicenter
Alarm SeismometerAlarm Seismometer
AlartAlartSan Francisco San Francisco Daily Evening Daily Evening Bulletin, 3 Bulletin, 3 November 1868November 1868
Wave Propagation
Wave Propagation
Wave PropagationWave Propagation
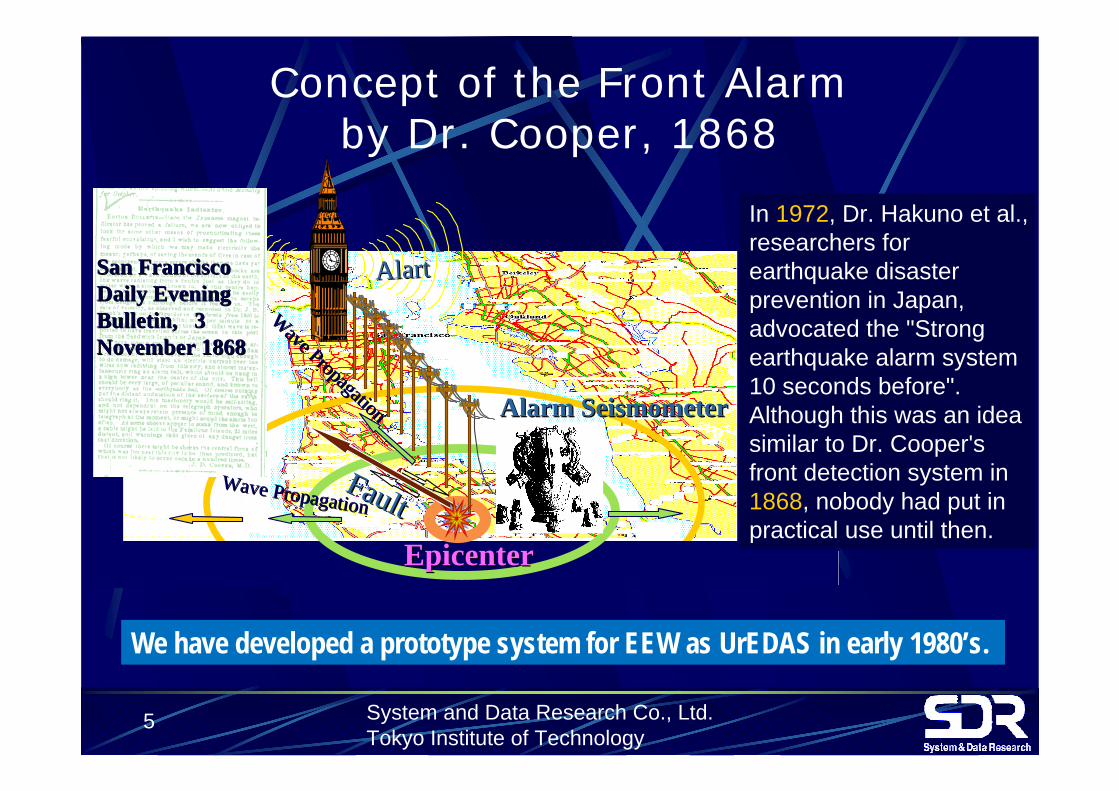
Concept of the Front Alarm by Dr. Cooper, 1868
In 1972, Dr. Hakuno et al., researchers for earthquake disaster prevention in Japan, advocated the "Strong earthquake alarm system 10 seconds before". Although this was an idea similar to Dr. Cooper's front detection system in 1868, nobody had put in practical use until then.
We have developed a prototype system for EEW as UrEDAS in early 1980’s.
6 System and Data Research Co., Ltd. Tokyo Institute of Technology
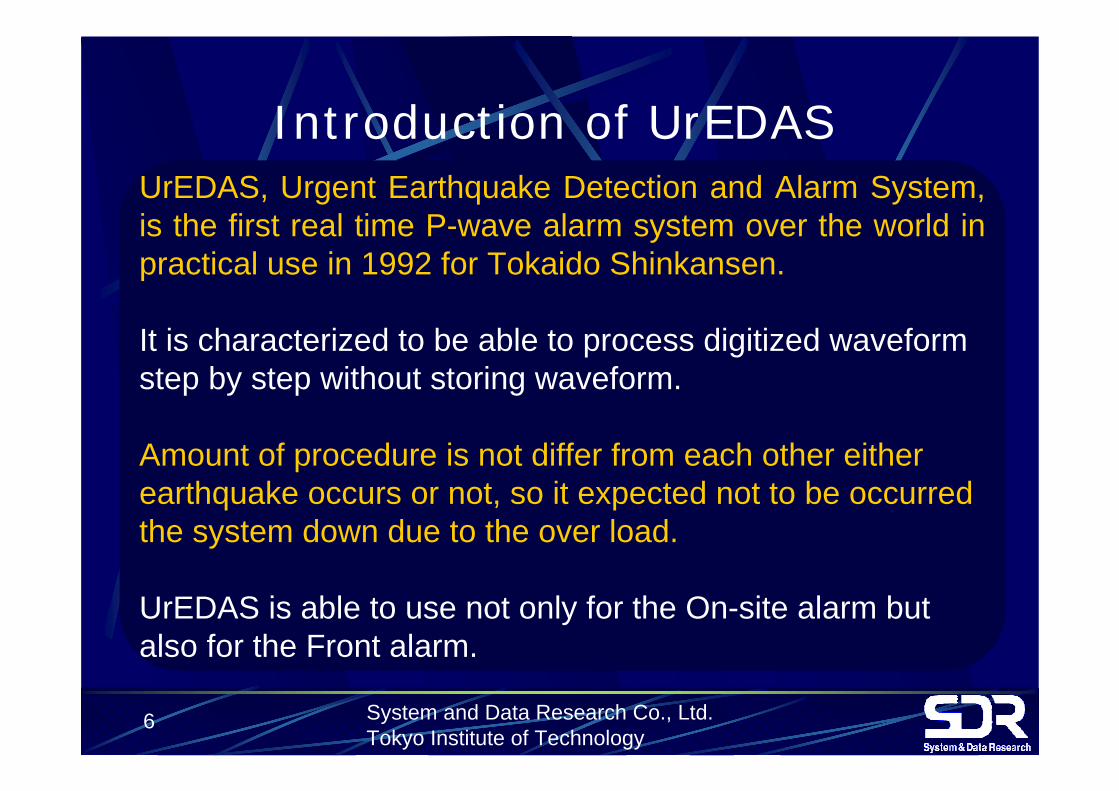
UrEDAS, Urgent Earthquake Detection and Alarm System, is the first real time P-wave alarm system over the world in practical use in 1992 for Tokaido Shinkansen.
It is characterized to be able to process digitized waveform step by step without storing waveform.
Amount of procedure is not differ from each other either earthquake occurs or not, so it expected not to be occurred the system down due to the over load.
UrEDAS is able to use not only for the On-site alarm but also for the Front alarm.
Introduction of UrEDAS
7 System and Data Research Co., Ltd. Tokyo Institute of Technology
There are two types of UrEDAS; “UrEDAS” and “Compact UrEDAS”.
Function of UrEDAS (1985) is to estimate the magnitude and the location of detected earthquake in three seconds after initial P-wave detection and issuing the alarm for expected damage area.
On the other hand, Compact UrEDAS (1998) can evaluate whether the earthquake will be destructive or not using Destructive Intensity DI and issues alarm one second after P-wave detection if needed.
Functions of the UrEDAS
8 System and Data Research Co., Ltd. Tokyo Institute of Technology
M<3 M<4 M<5 M<6M<3 M<4 M<5 M<6
KongoKongo--San San
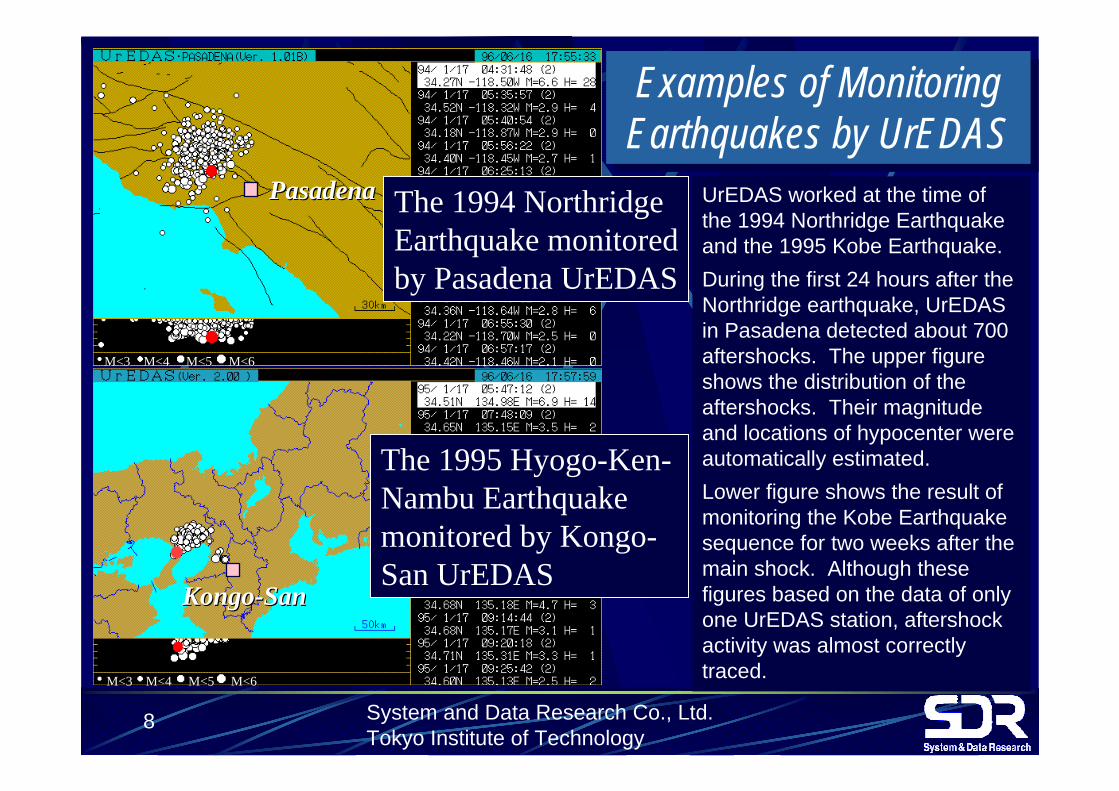
Examples of Monitoring Earthquakes by UrEDASExamples of Monitoring Earthquakes by UrEDAS
The 1995 Hyogo-Ken-Nambu Earthquake monitored by Kongo-San UrEDAS
M<3 M<4 M<5 M<6M<3 M<4 M<5 M<6
PasadenaPasadena The 1994 Northridge Earthquake monitored by Pasadena UrEDAS
UrEDAS worked at the time of the 1994 Northridge Earthquake and the 1995 Kobe Earthquake. During the first 24 hours after the Northridge earthquake, UrEDAS in Pasadena detected about 700 aftershocks. The upper figure shows the distribution of the aftershocks. Their magnitude and locations of hypocenter were automatically estimated.Lower figure shows the result of monitoring the Kobe Earthquake sequence for two weeks after the main shock. Although these figures based on the data of only one UrEDAS station, aftershock activity was almost correctly traced.
9 System and Data Research Co., Ltd. Tokyo Institute of Technology
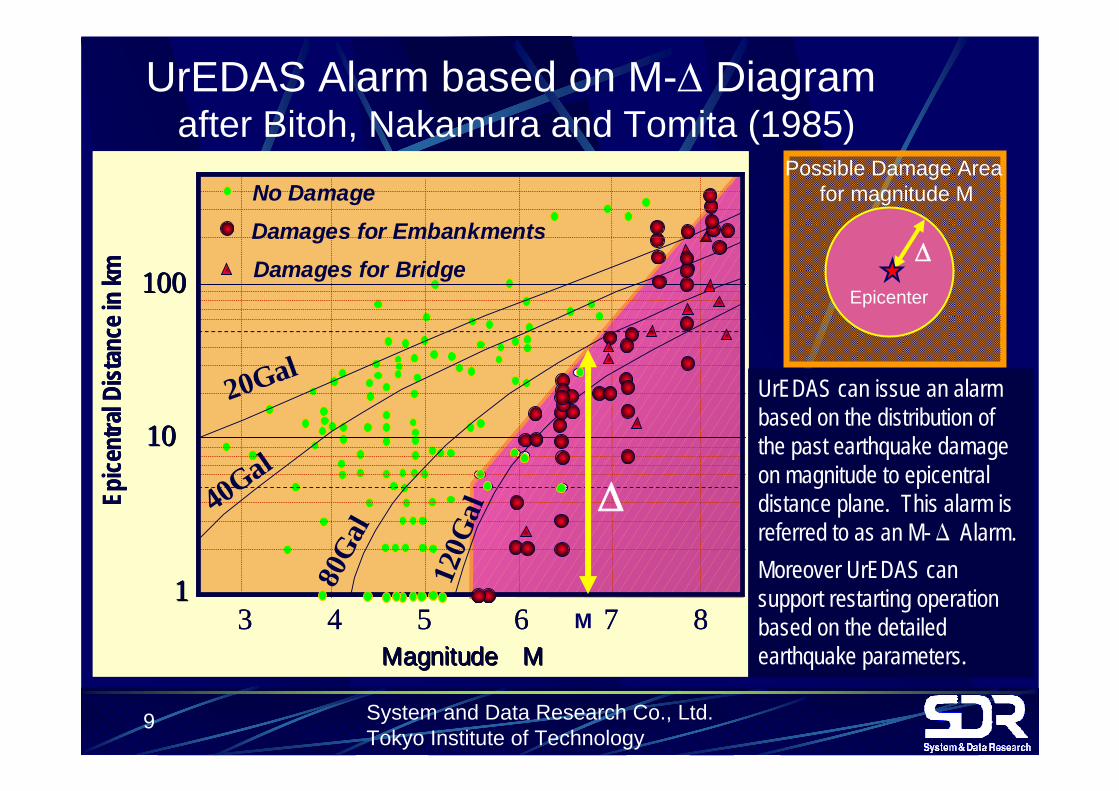
UrEDAS Alarm based on M-∆ Diagram after Bitoh, Nakamura and Tomita (1985)
MagnitudeMagnitude MM3 4 5 6 7 8
Epice
ntra
l Dist
ance
in km
11
1010
100100
20Gal
40Gal
80G
al
120G
al
No DamageDamages for EmbankmentsDamages for Bridge
MagnitudeMagnitude MM3 4 5 6 7 8
Epice
ntra
l Dist
ance
in km
11
1010
100100
20Gal
40Gal
80G
al
120G
al
No DamageDamages for EmbankmentsDamages for Bridge
M
∆
Possible Damage Area for magnitude M
∆
Epicenter
UrEDAS can issue an alarm based on the distribution of the past earthquake damage on magnitude to epicentral distance plane. This alarm is referred to as an M-Δ Alarm. Moreover UrEDAS can support restarting operation based on the detailed earthquake parameters.
10 System and Data Research Co., Ltd. Tokyo Institute of Technology
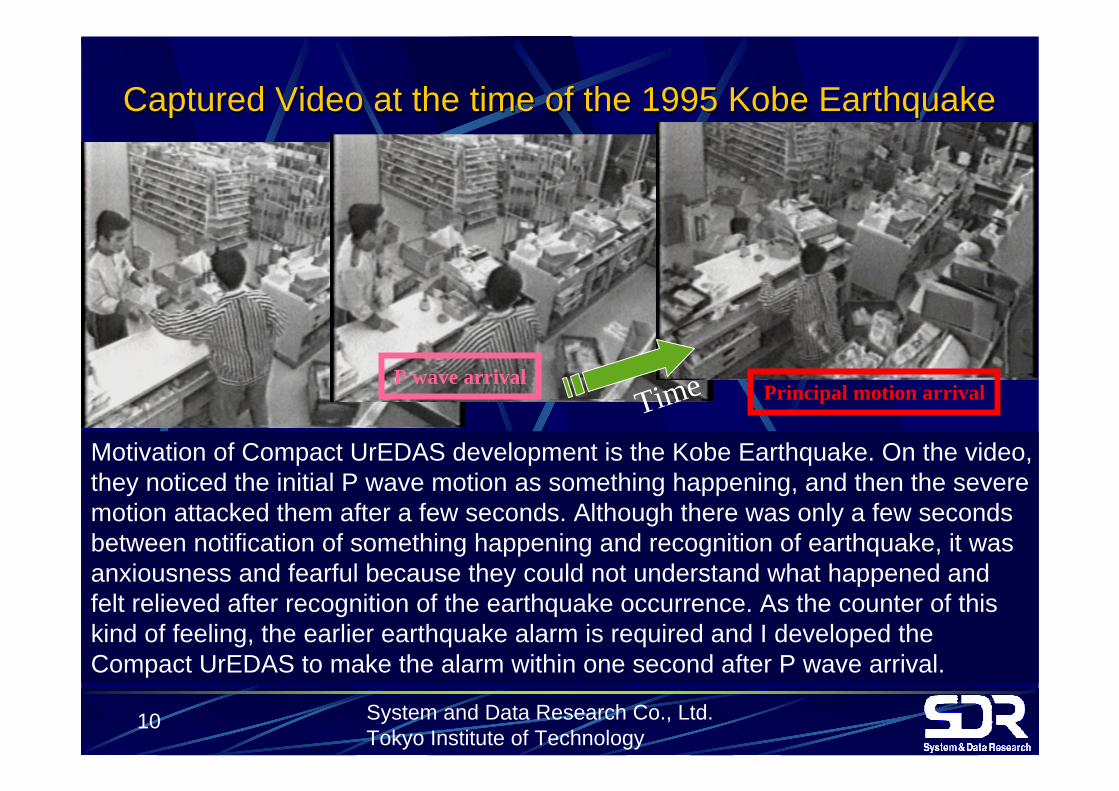
Captured Video at the time of the 1995 Kobe EarthquakeCaptured Video at the time of the 1995 Kobe Earthquake
P wave arrivalPrincipal motion arrivalTime
Motivation of Compact UrEDAS development is the Kobe Earthquake. On the video, they noticed the initial P wave motion as something happening, and then the severe motion attacked them after a few seconds. Although there was only a few seconds between notification of something happening and recognition of earthquake, it was anxiousness and fearful because they could not understand what happened and felt relieved after recognition of the earthquake occurrence. As the counter of this kind of feeling, the earlier earthquake alarm is required and I developed the Compact UrEDAS to make the alarm within one second after P wave arrival.
11 System and Data Research Co., Ltd. Tokyo Institute of Technology
mm
F = ma v
Definition of DI, Destructive Intensity,andSeismic Intensities RI (corresponding to JMA
Instrumental Intensity) and MMI
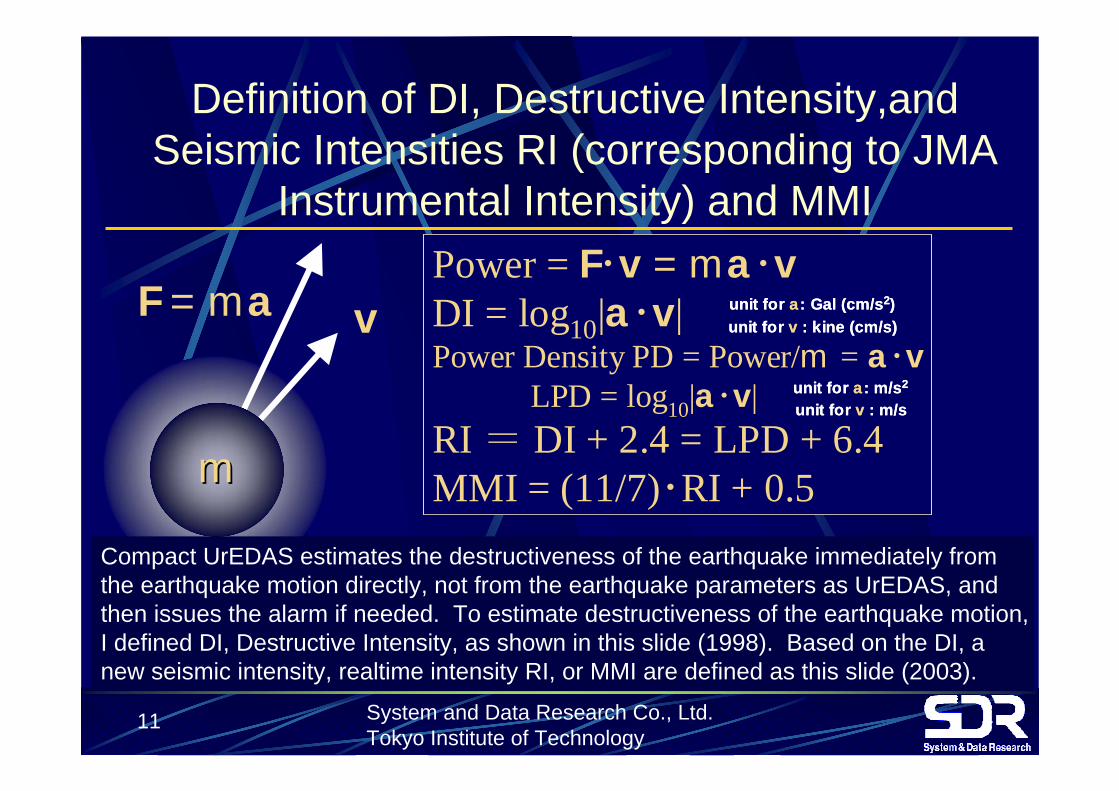
Compact UrEDAS estimates the destructiveness of the earthquake immediately from the earthquake motion directly, not from the earthquake parameters as UrEDAS, and then issues the alarm if needed. To estimate destructiveness of the earthquake motion, I defined DI, Destructive Intensity, as shown in this slide (1998). Based on the DI, a new seismic intensity, realtime intensity RI, or MMI are defined as this slide (2003).
Power = F・v = ma・vDI = log10|a・v| Power Density PD = Power/m = a・v
LPD = log10|a・v|RI = DI + 2.4 = LPD + 6.4MMI = (11/7)・RI + 0.5
unit for a: Gal (cm/s2)unit for v : kine (cm/s)
unit for a: m/s2
unit for v : m/s
Power = F・v = ma・vDI = log10|a・v| Power Density PD = Power/m = a・v
LPD = log10|a・v|RI = DI + 2.4 = LPD + 6.4MMI = (11/7)・RI + 0.5
unit for a: Gal (cm/s2)unit for v : kine (cm/s)unit for a: Gal (cm/s2)unit for v : kine (cm/s)
unit for a: m/s2
unit for v : m/sunit for a: m/s2
unit for v : m/s
12 System and Data Research Co., Ltd. Tokyo Institute of Technology
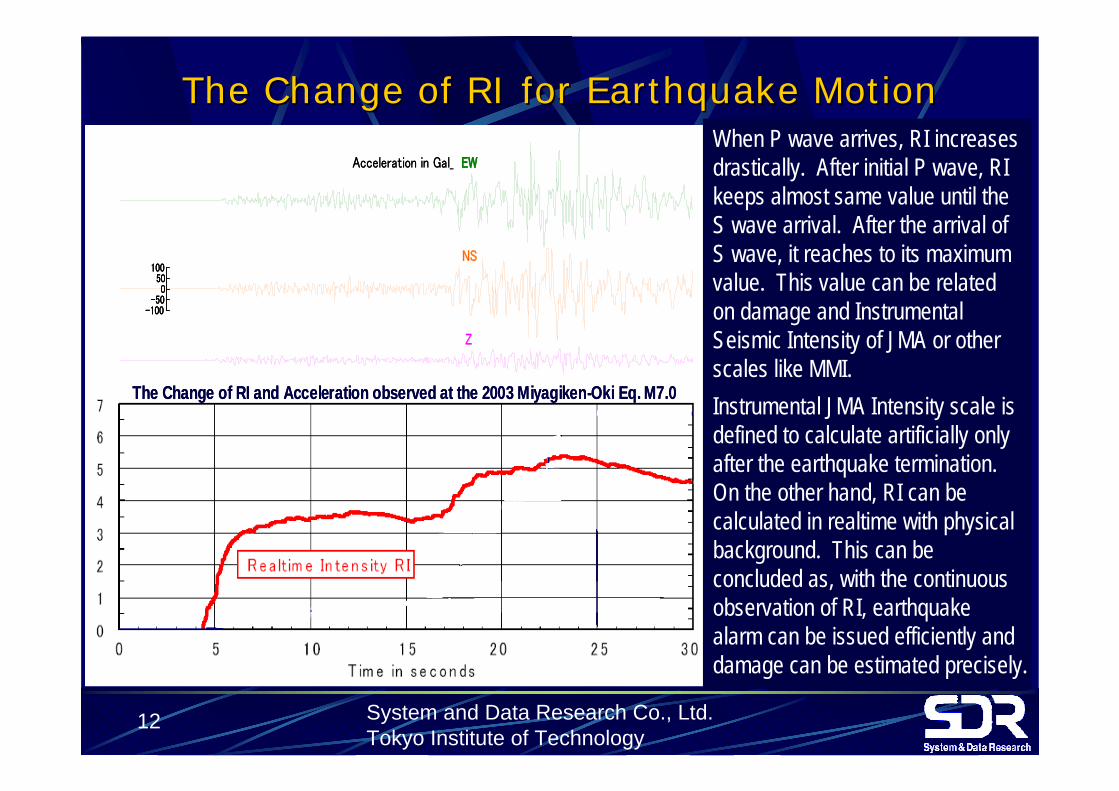
The Change of RI for Earthquake MotionThe Change of RI for Earthquake Motion
The Change of RI and Acceleration observed at the 2003 Miyagiken-Oki Eq. M7.0
Z
Acceleration in Gal_ EW
NS
-100-50
050
100
The Change of RI and Acceleration observed at the 2003 Miyagiken-Oki Eq. M7.0The Change of RI and Acceleration observed at the 2003 Miyagiken-Oki Eq. M7.0
Z
Acceleration in Gal_ EW
NS
-100-50
050
100
Z
Acceleration in Gal_ EWAcceleration in Gal_ EW
NS
-100-50
050
100
-100-50
050
100
-100-50
050
100
When P wave arrives, RI increases drastically. After initial P wave, RI keeps almost same value until the S wave arrival. After the arrival of S wave, it reaches to its maximum value. This value can be related on damage and Instrumental Seismic Intensity of JMA or other scales like MMI.Instrumental JMA Intensity scale is defined to calculate artificially only after the earthquake termination. On the other hand, RI can be calculated in realtime with physical background. This can be concluded as, with the continuous observation of RI, earthquake alarm can be issued efficiently and damage can be estimated precisely.
13 System and Data Research Co., Ltd. Tokyo Institute of Technology
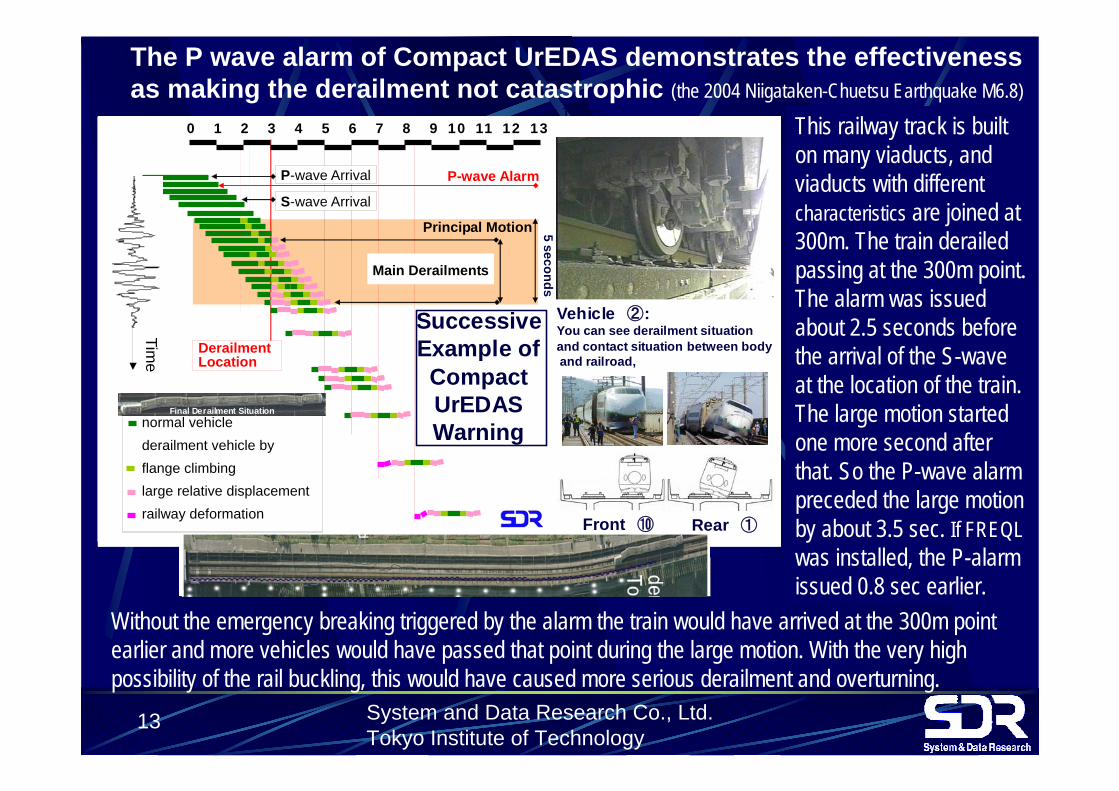
The P wave alarm of Compact UrEDAS demonstrates the effectiveness as making the derailment not catastrophic (the 2004 Niigataken-Chuetsu Earthquake M6.8)
This railway track is built on many viaducts, and viaducts with different characteristics are joined at 300m. The train derailed passing at the 300m point. The alarm was issued about 2.5 seconds before the arrival of the S-wave at the location of the train. The large motion started one more second after that. So the P-wave alarm preceded the large motion by about 3.5 sec. If FREQLwas installed, the P-alarm issued 0.8 sec earlier.
Without the emergency breaking triggered by the alarm the train would have arrived at the 300m point earlier and more vehicles would have passed that point during the large motion. With the very high possibility of the rail buckling, this would have caused more serious derailment and overturning.
×100m
A Success Example of Compact UrEDAS Warning
Tunnel Exit
P-wave Alarm
Time
Principal Motion
Main Derailments
Derailment Location
normal vehiclederailment vehicle by flange climbing large relative displacement railway deformation
0 1 2 3 4 5 6 7 8 9 10 11 12 13
P-wave Arrival
S-wave Arrival
P-wave Alarm
Time
Principal Motion
Main Derailments
Derailment Location
normal vehiclederailment vehicle by flange climbing large relative displacement railway deformation
0 1 2 3 4 5 6 7 8 9 10 11 12 13
P-wave Arrival
S-wave Arrival
5 seconds
Final Situation Final Derailment Situation
Vehicle ②: You can see derailment situationand contact situation between bodyand railroad,
(a)先頭車 (b)最後尾車 Front ⑩ Rear ①
Successive Example of Compact UrEDAS Warning
Tunnel Exit
P-wave Alarm
Time
Principal Motion
Main Derailments
Derailment Location
normal vehiclederailment vehicle by flange climbing large relative displacement railway deformation
0 1 2 3 4 5 6 7 8 9 10 11 12 13
P-wave Arrival
S-wave Arrival
P-wave Alarm
Time
Principal Motion
Main Derailments
Derailment Location
normal vehiclederailment vehicle by flange climbing large relative displacement railway deformation
0 1 2 3 4 5 6 7 8 9 10 11 12 13
P-wave Arrival
S-wave Arrival
5 seconds
Final Situation Final Derailment Situation
Vehicle ②: You can see derailment situationand contact situation between bodyand railroad,
(a)先頭車 (b)最後尾車 Front ⑩ Rear ①Tunnel Exit
P-wave Alarm
Time
Principal Motion
Main Derailments
Derailment Location
normal vehiclederailment vehicle by flange climbing large relative displacement railway deformation
0 1 2 3 4 5 6 7 8 9 10 11 12 13
P-wave Arrival
S-wave Arrival
P-wave Alarm
Time
Principal Motion
Main Derailments
Derailment Location
normal vehiclederailment vehicle by flange climbing large relative displacement railway deformation
0 1 2 3 4 5 6 7 8 9 10 11 12 13
P-wave Arrival
S-wave Arrival
5 seconds
Final Situation Final Derailment Situation
Vehicle ②: You can see derailment situationand contact situation between bodyand railroad,
(a)先頭車 (b)最後尾車 Front ⑩ Rear ①
Vehicle ②: You can see derailment situationand contact situation between bodyand railroad,
(a)先頭車 (b)最後尾車 Front ⑩ Rear ①
(a)先頭車 (b)最後尾車 Front ⑩ Rear ①
Successive Example of Compact UrEDAS Warning

14 System and Data Research Co., Ltd. Tokyo Institute of Technology
FREQL(Fast Response Equipment against Quake Load)
FREQL is developed for the earthquake warning system based on the experiences of development and operation of the world first P wave alarm system UrEDAS.FREQL integrates the functions of UrEDAS, Compact UrEDAS and AcCo.P wave alarm is available 0.2 seconds in minimum after P wave detection ( the fastest time was shortened to 0.1 seconds in 2009).S wave alarm is also available. (Based on acceleration and realtime seismic intensity RI)
15 System and Data Research Co., Ltd. Tokyo Institute of Technology
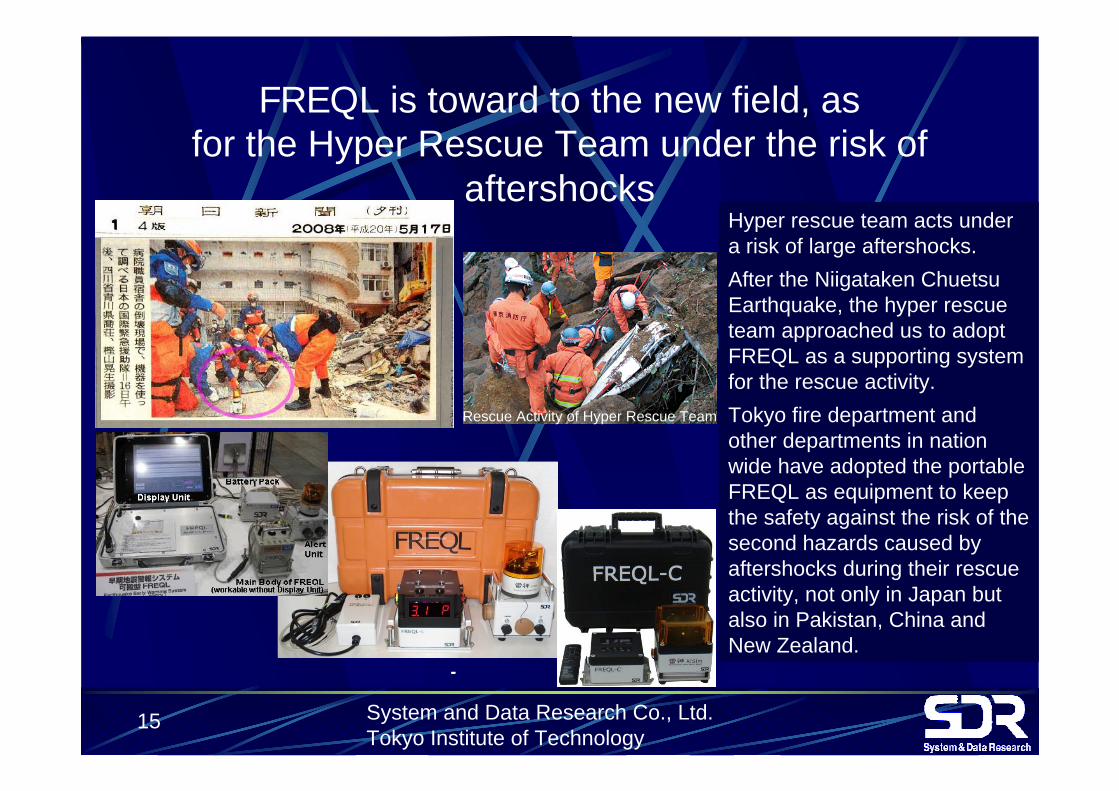
FREQL is toward to the new field, as for the Hyper Rescue Team under the risk of
aftershocksHyper rescue team acts under a risk of large aftershocks. After the Niigataken Chuetsu Earthquake, the hyper rescue team approached us to adopt FREQL as a supporting system for the rescue activity.Tokyo fire department and other departments in nation wide have adopted the portable FREQL as equipment to keep the safety against the risk of the second hazards caused by aftershocks during their rescue activity, not only in Japan but also in Pakistan, China and New Zealand.
--
Rescue Activity of Hyper Rescue Team
16 System and Data Research Co., Ltd. Tokyo Institute of Technology
0.1
1
10
1980 1985 1990 1995 2000 2005 2010
警
報処
理時
間(
秒) UrEDAS
Test observation
UrEDAS 3 sec. JR Tokaido Shinkansen Tsunami warning system
for Wakayama Prefecture
Compact UrEDAS 1 sec.Tohoku Shinkansen
Tokyo Metro
FREQL Minimum 0.2 sec.
Tokyo Metro, OdakyuFire Departments of Tokyo, Osaka and so on
cf. Equipment developed by JMA
Average 5.4 sec.
Minimum 2.0 sec.
0.2
0.5
5
3
2
SDR products
Pro
cess
ing
Tim
e fo
r P-w
ave
Alar
m in
sec
.
Year
Development of Processing Time
Min. 0.1 sec.
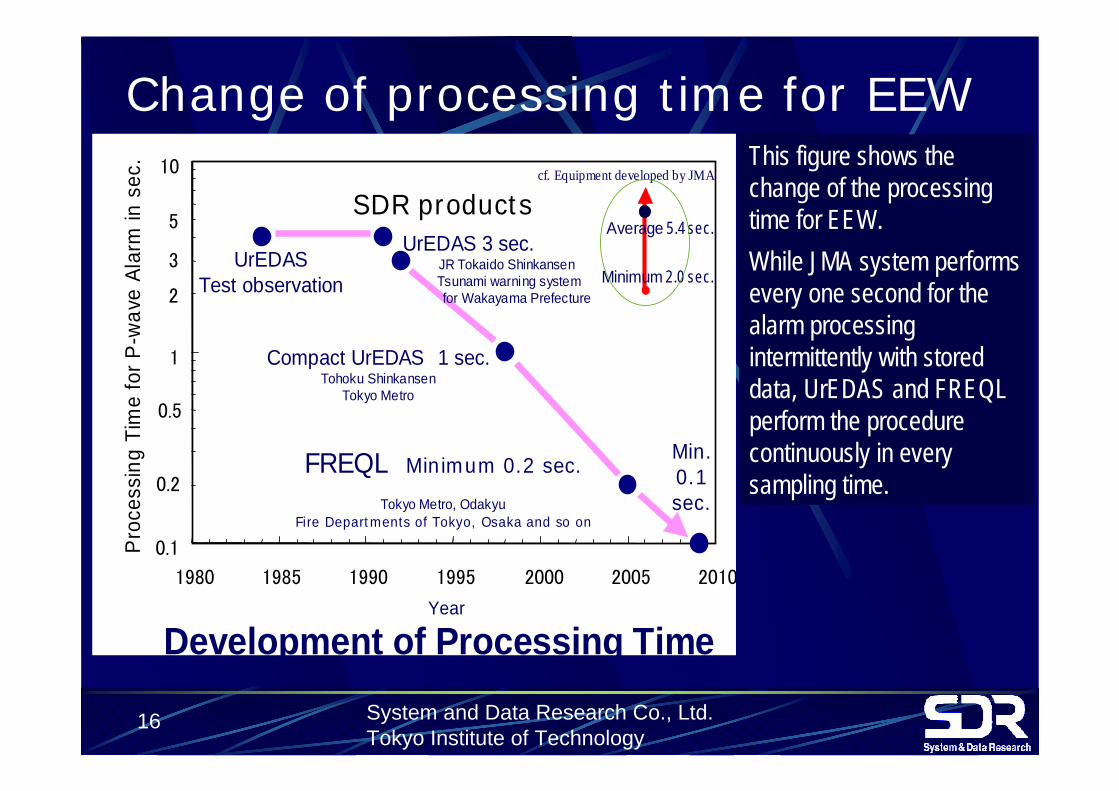
Change of processing time for EEWThis figure shows the change of the processing time for EEW.While JMA system performs every one second for the alarm processing intermittently with stored data, UrEDAS and FREQL perform the procedure continuously in every sampling time.
18
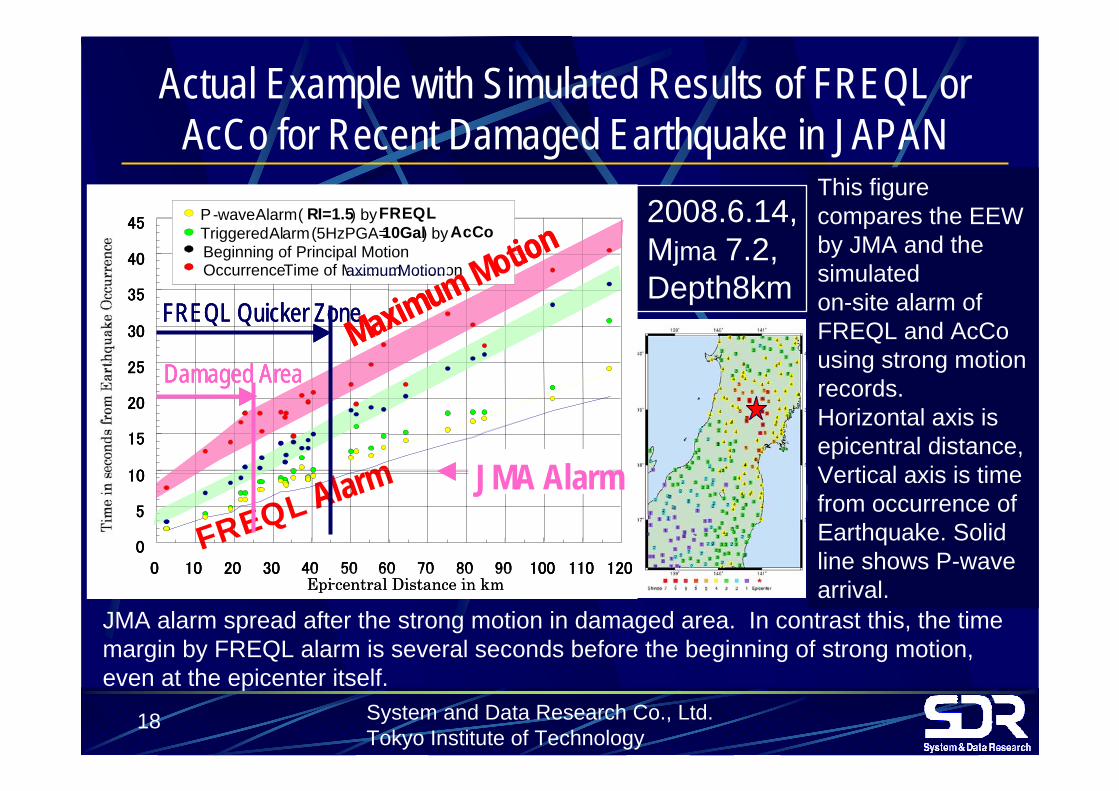
This figure compares the EEW by JMA and the simulatedon-site alarm of FREQL and AcCo using strong motion records. Horizontal axis is epicentral distance, Vertical axis is timefrom occurrence ofEarthquake. Solid line shows P-wave arrival.
System and Data Research Co., Ltd. Tokyo Institute of Technology
Actual Example with Simulated Results of FREQL or AcCo for Recent Damaged Earthquake in JAPAN
2008.6.14, Mjma 7.2, Depth8km
0
5
10
15
20
25
30
35
40
45
0 10 20 30 40 50 60 70 80 90 100 110 120Epi-central Distance in km
Alarm by JMA
P-wave Alarm ( RI=1.5) by FREQLTriggered Alarm (5HzPGA=10Gal) by AcCoBeginning of Principal MotionOccurrenceTime of Maximum Motion
FREQL Quicker Zone
Damaged Area
JMA AlarmFREQL Alarm
Maximum MotionaximumMotion
0
5
10
15
20
25
30
35
40
45
0 10 20 30 40 50 60 70 80 90 100 110 120Epi-central Distance in km
Alarm by JMA
P-wave Alarm ( RI=1.5) by FREQLTriggered Alarm (5HzPGA=10Gal) by AcCoBeginning of Principal MotionOccurrenceTime of Maximum Motion
FREQL Quicker Zone
Damaged Area
0
5
10
15
20
25
30
35
40
45
0 10 20 30 40 50 60 70 80 90 100 110 120Epi-central Distance in km
Alarm by JMA
P-wave Alarm ( RI=1.5) by FREQLTriggered Alarm (5HzPGA=10Gal) by AcCoBeginning of Principal MotionOccurrenceTime of Maximum Motion
FREQL Quicker Zone
Damaged Area
JMA Alarm
Maximum MotionaximumMotion
JMA alarm spread after the strong motion in damaged area. In contrast this, the time margin by FREQL alarm is several seconds before the beginning of strong motion, even at the epicenter itself.
20 System and Data Research Co., Ltd./ Tokyo Institute of Technology
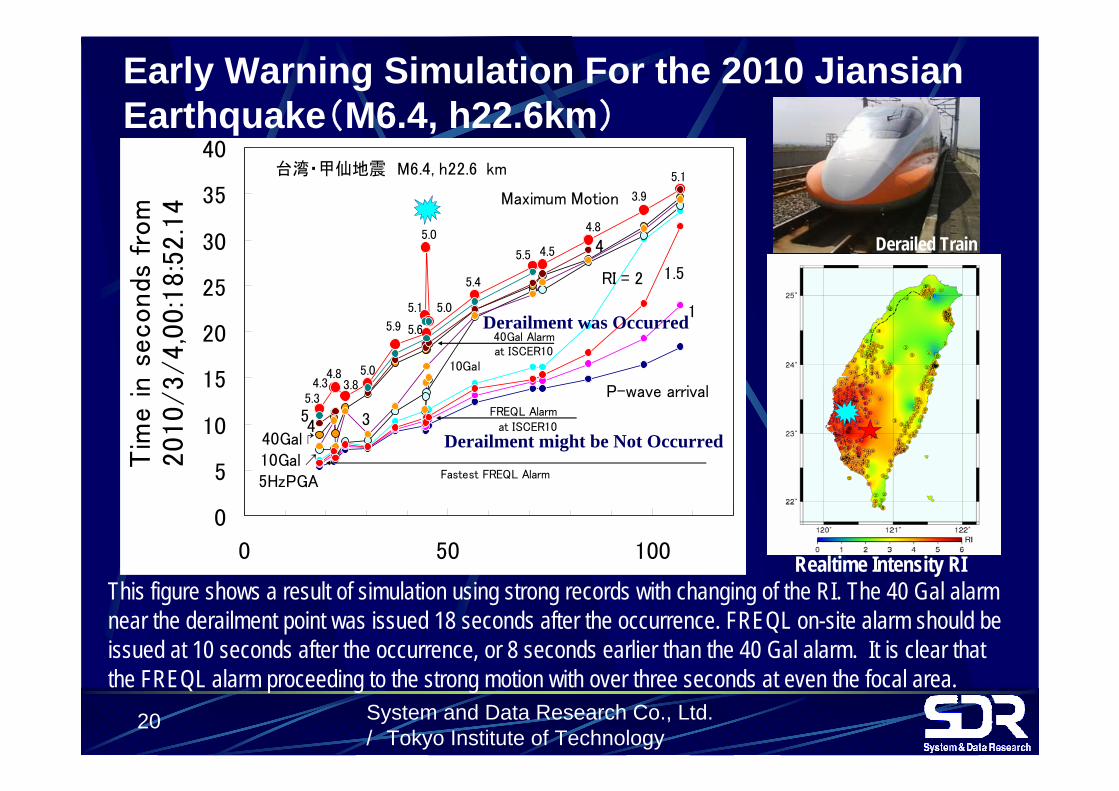
Early Warning Simulation For the 2010 Jiansian Earthquake(M6.4, h22.6km)
Realtime Intensity RIThis figure shows a result of simulation using strong records with changing of the RI. The 40 Gal alarm near the derailment point was issued 18 seconds after the occurrence. FREQL on-site alarm should be issued at 10 seconds after the occurrence, or 8 seconds earlier than the 40 Gal alarm. It is clear that the FREQL alarm proceeding to the strong motion with over three seconds at even the focal area.
Derailed Train
0
5
10
15
20
25
30
35
40
0 50 100
Tim
e in s
econds
fro
m2010/3/4,0
0:1
8:5
2.1
4
P-wave arrival
Maximum Motion
1
1.5RI = 2
3
10Gal
40Gal ↱10Gal ↗5HzPGA
5.3
4
45
4.34.8
3.85.0
5.9 5.6
5.1
5.0
5.0
5.4
5.5 4.5
4.8
3.9
5.1
40Gal Alarm
FREQL Alarm
at ISCER10
at ISCER10
Fastest FREQL Alarm
台湾・甲仙地震 M6.4, h22.64km
Derailment was Occurred
Derailment might be Not Occurred
23
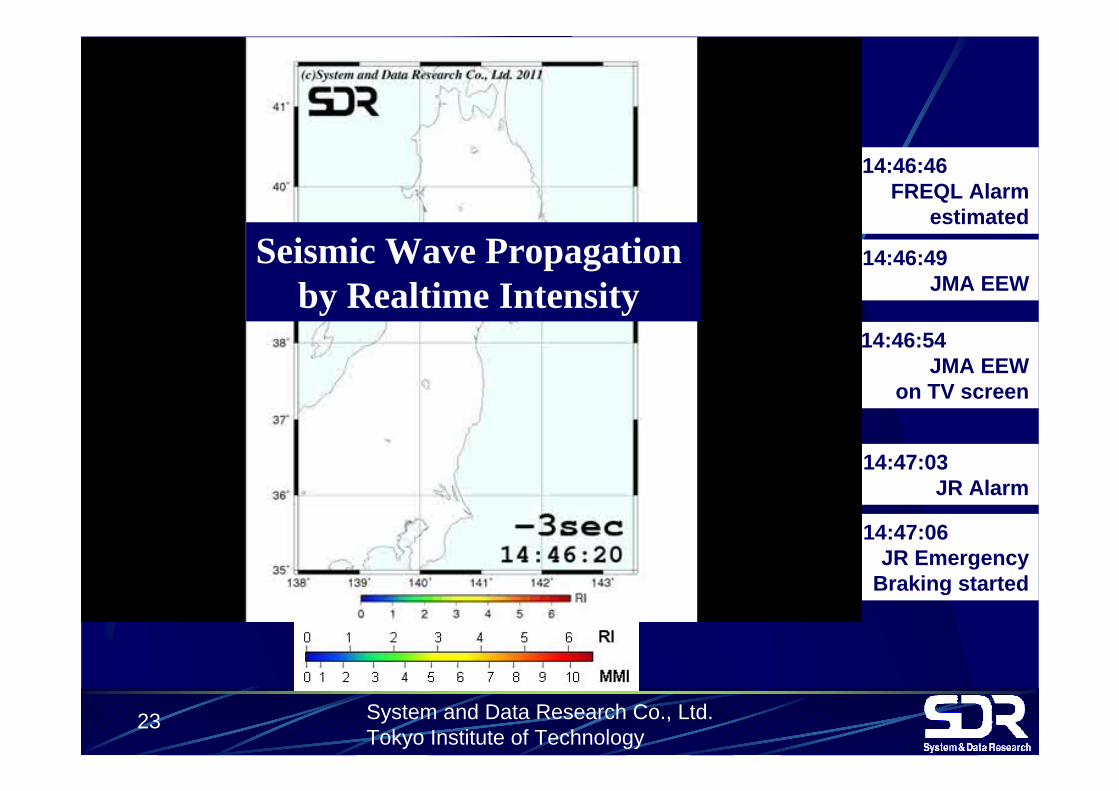
14:46:46 FREQL Alarm
estimated
14:46:49 JMA EEW
14:46:54JMA EEW
on TV screen
14:47:03 JR Alarm
14:47:06 JR Emergency
Braking started
System and Data Research Co., Ltd. Tokyo Institute of Technology
Seismic Wave Propagation by Realtime Intensity
24
3.0
4.0
5.0
6.0
7.0
-400 -300 -200 -100 0 100 200 300 400
0
60
120
180
240
300
360
-400 -300 -200 -100 0 100 200 300 400
south side Epicentral Distance in km minus 127km north side
Tim
e in s
econds
fro
m 2
011/03/11,1
4:4
6:2
6 J
ST
Real
tim
e Inte
nsi
ty
Rim
ax
Yoko
ham
a
Shin
juku
Tsu
kuba
Mito
Senda
i
Tsu
kida
te
Morioka
Mis
awa
Aom
ori
①23s: EEW o f JMA
②36s③44s
28s: EEW via NHK
④79s
20s: First EEW of FREQL
…
Fuku
shim
a
RI P eak M ax 6.5 6.0 5.5 5.0 4.5 4.0 3.5 2.5 2.0 1.5 0.5 0.0
P-arrival
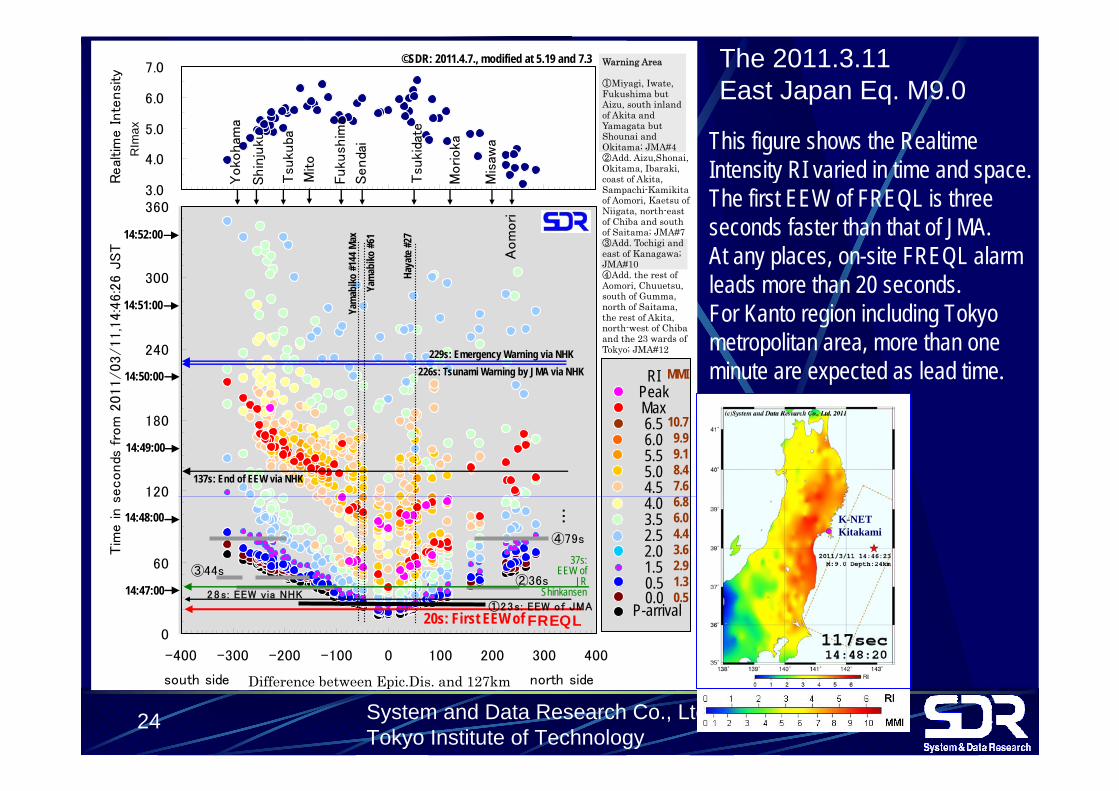
Warning Area ①Miyagi, Iwate, Fukushima but Aizu, south inland of Akita and Yamagata but Shounai and Okitama; JMA#4 ②Add. Aizu,Shonai, Okitama, Ibaraki, coast of Akita, Sampachi-Kamikita of Aomori, Kaetsu of Niigata, north-east of Chiba and south of Saitama; JMA#7 ③Add. Tochigi and east of Kanagawa; JMA#10 ④Add. the rest of Aomori, Chuuetsu, south of Gumma, north of Saitama, the rest of Akita, north-west of Chiba and the 23 wards of Tokyo; JMA#12
37s: EEW of
JR Shinkansen
226s: Tsunami Warning by JMA via NHK 229s: Emergency Warning via NHK
Yam
abiko
#61
Yam
abiko
#144
Max
14:47:00
14:48:00
14:49:00
14:50:00
14:51:00
14:52:00
©SDR: 2011.4.7., modified at 5.19 and 7.3
Hay
ate #
27
Difference between Epic.Dis. and 127km
137s: End of EEW via NHK
RIm
ax
The 2011.3.11East Japan Eq. M9.0
MMI
10.79.99.18.47.66.86.04.43.62.91.30.5
This figure shows the Realtime Intensity RI varied in time and space. The first EEW of FREQL is three seconds faster than that of JMA. At any places, on-site FREQL alarm leads more than 20 seconds. For Kanto region including Tokyo metropolitan area, more than one minute are expected as lead time.
K-NET Kitakami
System and Data Research Co., Ltd. Tokyo Institute of Technology
25
0
60
120
-400 -300 -200 -100 0 100 200 300 400
①23s: EEW o f JMA
②36s③44s
28s: EEW via NHK
④79s
20s: First EEW of FREQL
…
37s: EEW of
JR Shinkansen 14:47:00
14:48:00
0
60
120
-400 -300 -200 -100 0 100 200 300 400
①23s: EEW o f JMA
②36s③44s
28s: EEW via NHK
④79s
20s: First EEW of FREQL
…
37s: EEW of
JR Shinkansen 14:47:00
14:48:00
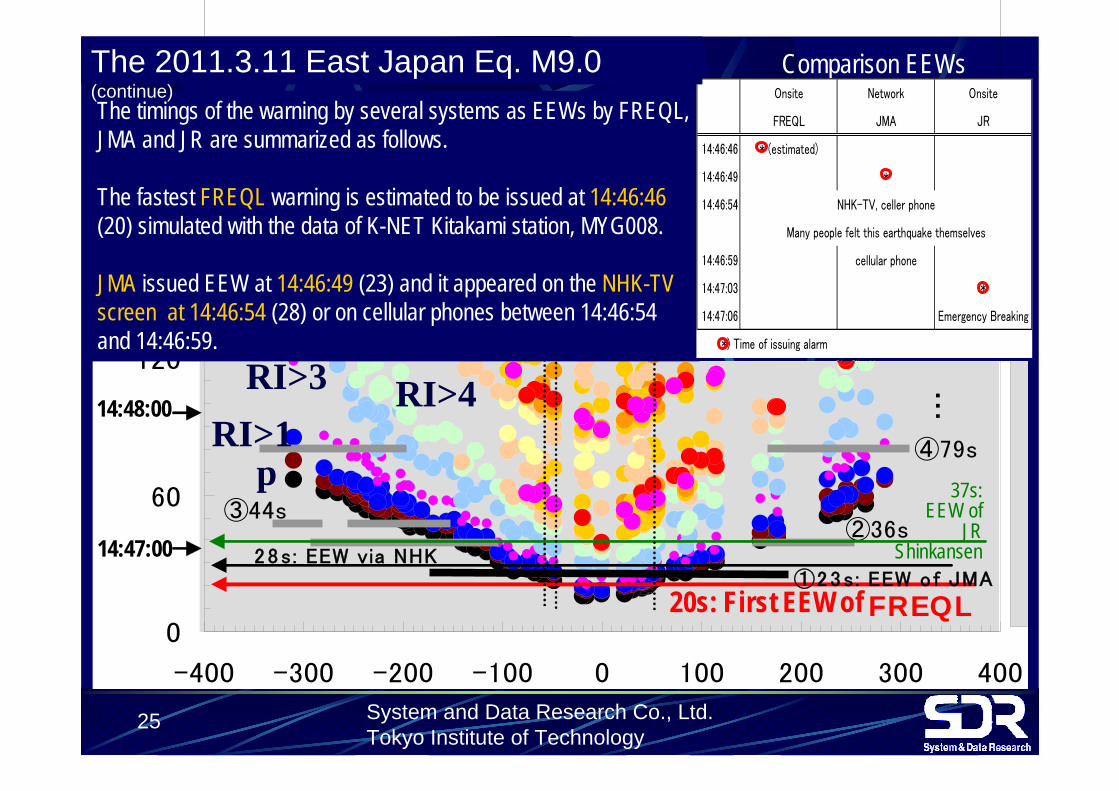
Comparison EEWsThe timings of the warning by several systems as EEWs by FREQL, JMA and JR are summarized as follows.
The fastest FREQL warning is estimated to be issued at 14:46:46 (20) simulated with the data of K-NET Kitakami station, MYG008.
JMA issued EEW at 14:46:49 (23) and it appeared on the NHK-TV screen at 14:46:54 (28) or on cellular phones between 14:46:54 and 14:46:59.
Onsite Network Onsite
FREQL JMA JR
14:46:46 * (estimated)
14:46:49 *
14:46:54 NHK-TV, celler phone
Many people felt this earthquake themselves
14:46:59 cellular phone
14:47:03 *
14:47:06 Emergency Breaking
*) Time of issuing alarm
The 2011.3.11 East Japan Eq. M9.0 (continue)
System and Data Research Co., Ltd. Tokyo Institute of Technology
pRI>1
RI>3 RI>4
26
Comparison EEWs
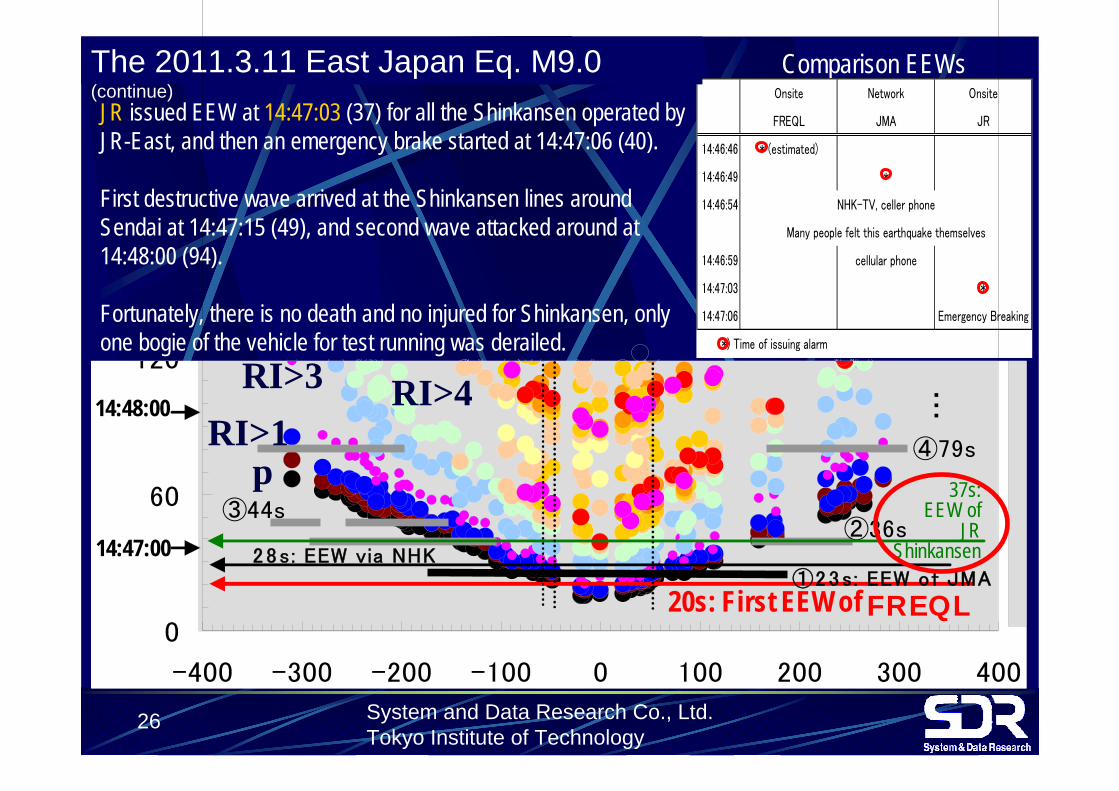
JR issued EEW at 14:47:03 (37) for all the Shinkansen operated by JR-East, and then an emergency brake started at 14:47:06 (40).
First destructive wave arrived at the Shinkansen lines around Sendai at 14:47:15 (49), and second wave attacked around at 14:48:00 (94).
Fortunately, there is no death and no injured for Shinkansen, only one bogie of the vehicle for test running was derailed.
Onsite Network Onsite
FREQL JMA JR
14:46:46 * (estimated)
14:46:49 *
14:46:54 NHK-TV, celler phone
Many people felt this earthquake themselves
14:46:59 cellular phone
14:47:03 *
14:47:06 Emergency Breaking
*) Time of issuing alarm
The 2011.3.11 East Japan Eq. M9.0 (continue)
System and Data Research Co., Ltd. Tokyo Institute of Technology
0
60
120
-400 -300 -200 -100 0 100 200 300 400
①23s: EEW o f JMA
②36s③44s
28s: EEW via NHK
④79s
20s: First EEW of FREQL
…
37s: EEW of
JR Shinkansen 14:47:00
14:48:00
0
60
120
-400 -300 -200 -100 0 100 200 300 400
①23s: EEW o f JMA
②36s③44s
28s: EEW via NHK
④79s
20s: First EEW of FREQL
…
37s: EEW of
JR Shinkansen 14:47:00
14:48:00
pRI>1
RI>3 RI>4

27
Comparison EEWs
On the system of JR-East, their instruments for early warning has been replaced some other system based on JMA system instead of our Compact UrEDAS.
The early warning system of JR could not issue alarm and they were failed. Only ordinal 40Gal alarm systems along Shinkansen or 120Gal alarm system for front detection sites were issued alarm.
This is a reason of too late alarm of JR.
Onsite Network Onsite
FREQL JMA JR
14:46:46 * (estimated)
14:46:49 *
14:46:54 NHK-TV, celler phone
Many people felt this earthquake themselves
14:46:59 cellular phone
14:47:03 *
14:47:06 Emergency Breaking
*) Time of issuing alarm
The 2011.3.11 East Japan Eq. M9.0 (continue)
System and Data Research Co., Ltd. Tokyo Institute of Technology
0
60
120
-400 -300 -200 -100 0 100 200 300 400
①23s: EEW o f JMA
②36s③44s
28s: EEW via NHK
④79s
20s: First EEW of FREQL
…
37s: EEW of
JR Shinkansen 14:47:00
14:48:00
0
60
120
-400 -300 -200 -100 0 100 200 300 400
①23s: EEW o f JMA
②36s③44s
28s: EEW via NHK
④79s
20s: First EEW of FREQL
…
37s: EEW of
JR Shinkansen 14:47:00
14:48:00
pRI>1
RI>3 RI>4

28 System and Data Research Co., Ltd. Tokyo Institute of Technology
Quick Response Using On-Site Alarm
against Sudden Quake
5 2.
AcCo
Escape to Safety Zone
Before and During Quake
# Escape to Safety Zone based on Each Feeling or On-Site Alarm
# Check the Safety Zone Constantly
# Imagine and Train to Escape actually
What is necessary for earthquake disaster prevention?
It is clear that the primary preventative action by the people at the time of the earthquake is to keep away from places where they could be hit by falling or loose objects. Obviously to make possible this requires a timely and immediate warning to be issued.
29 System and Data Research Co., Ltd. Tokyo Institute of Technology
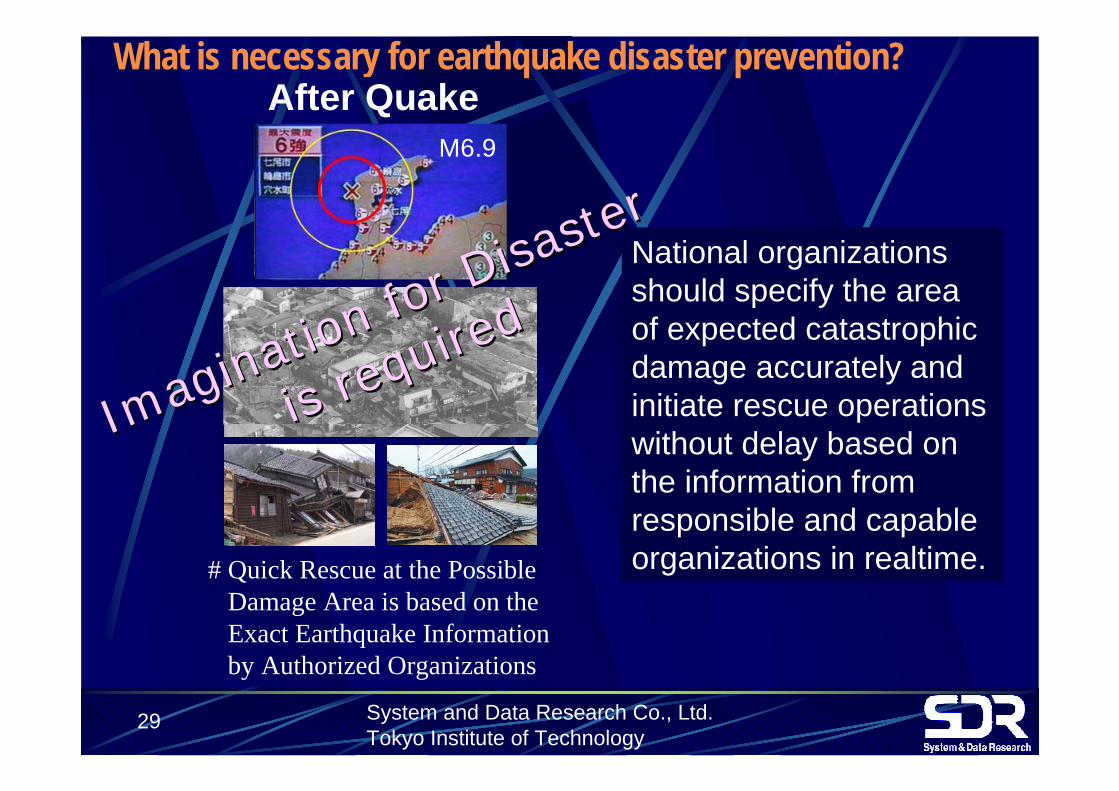
After Quake
# Quick Rescue at the PossibleDamage Area is based on the Exact Earthquake Information by Authorized Organizations
M6.9M6.9
Imagination for Disaster
Imagination for Disaster
is required
is required
What is necessary for earthquake disaster prevention?
National organizations should specify the area of expected catastrophic damage accurately and initiate rescue operations without delay based on the information from responsible and capable organizations in realtime.
30 System and Data Research Co., Ltd. Tokyo Institute of Technology
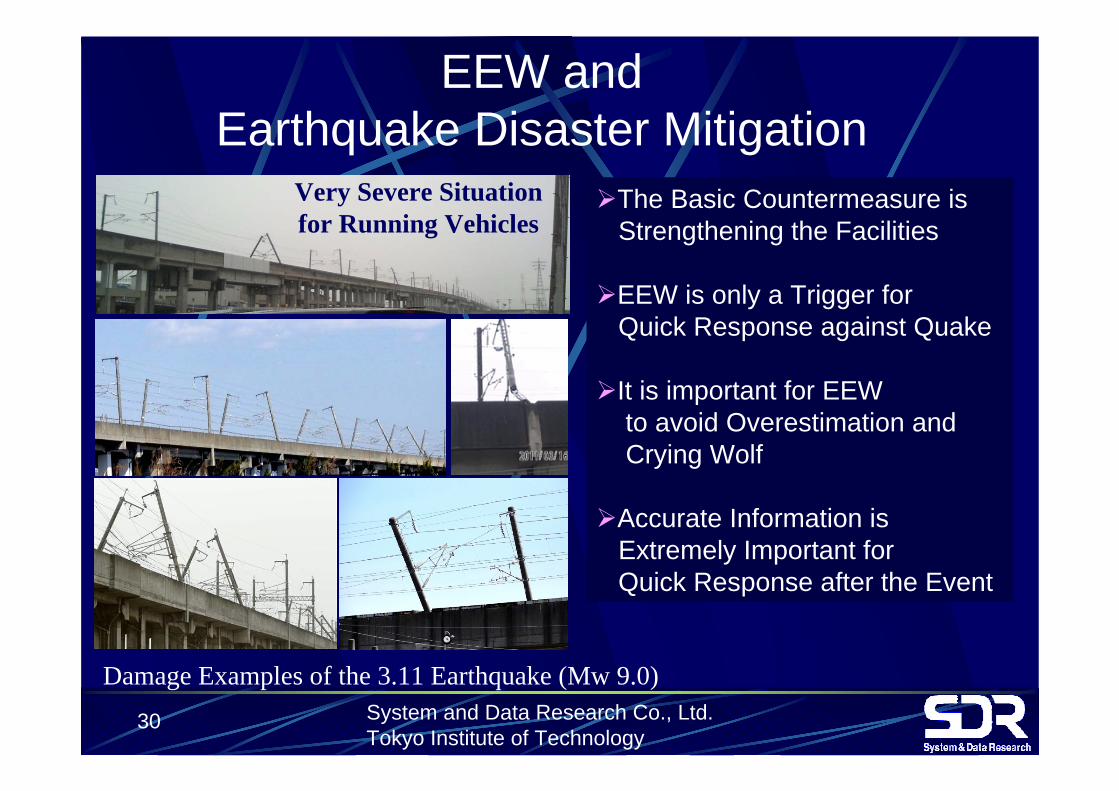
Damage Examples of the 3.11 Earthquake (Mw 9.0)
The Basic Countermeasure isStrengthening the Facilities
EEW is only a Trigger forQuick Response against Quake
It is important for EEW to avoid Overestimation and Crying Wolf
Accurate Information isExtremely Important forQuick Response after the Event
EEW andEarthquake Disaster Mitigation
Very Severe Situation for Running Vehicles
31
Tsunami warning by JMA is quite early for the 3.11 Earthquake, three minutes and a half after detecting the P-wave, but is including many problems such as low accuracy for height estimation:
>Crying Wolf caused by frequent unnecessary warnings, >Loss tension and knowledge from both residences and local governors, because JMA has prohibited Tsunami warning by local governors after the Kobe earthquake.
The earthquake motion of the 3.11 Earthquake seems very strange and very long by all people themselves in unusually. This is the best signal for quick response against the tsunami. But almost all the people thought that the tsunami warning must be issued by JMA, just as JMA intend. But in practice, many people who could not receive warning took no action, then their evacuation delayed fatally. This is very important lesson from this event.
These problems are appeared not only for Tsunami warning but also for EEW .
Problems of JMA warning
System and Data Research Co., Ltd. Tokyo Institute of Technology
32
Urgent Craving for JMA at 2011 AOGS in Taipei
JMA must quit all restriction for warnings on earthquake, EEW and Tsunami warnings.
JMA must issue exact and detailed information
for main shock and aftershocks immediately, to support quick response.
33 System and Data Research Co., Ltd. Tokyo Institute of Technology
ENDThank you for your kind
attention!
For More Information Please Access Our Website
www.sdr.co.jp