Objective Voice and Speech Analysis of Persons with ...
19
1 Objective Voice and Speech Analysis of Persons with Chronic Hoarseness by Prosodic Analysis of Speech Samples Tino Haderlein 1,2 , Michael Döllinger 1,3 , Václav Matoušek 2 , Elmar Nöth 4,5 1 Universitätsklinikum Erlangen, Phoniatrische und pädaudiologische Abteilung, Bohlenplatz 21, 91054 Erlangen, Germany 2 Západočeská univerzita v Plzni, Katedra informatiky a výpočetní techniky, Univerzitní 8, 306 14 Plzeň, Czech Republic 3 Louisiana State University, Communication Sciences and Disorders Department, 63 Hatcher Hall, Baton Rouge, LA 70803, USA 4 Universität Erlangen-Nürnberg, Lehrstuhl für Mustererkennung, Martensstraße 3, 91058 Erlangen, Germany 5 King Abdulaziz University, Electrical & Computer Engineering Department, Faculty of Engineering, Jeddah 21589, Saudi Arabia Running title: Objective Voice and Speech Analysis of Hoarseness Corresponding author: Tino Haderlein Universitätsklinikum Erlangen Phoniatrische und pädaudiologische Abteilung Bohlenplatz 21 91054 Erlangen Germany E-Mail: [email protected] Phone: +49 9131 85 27872 Fax: +49 9131 303811 Abstract Automatic voice assessment is often performed using sustained vowels. In contrast, speech analysis of read-out texts can be applied to voice and speech assessment. Automatic speech recognition and prosodic analysis were used to find regression formulae between automatic and perceptual assessment of four voice and four speech criteria. The regression was trained with 21 men and 62 women (average age: 49.2 years) and tested with another set of 24 men and 49 women (48.3 years), all suffering from chronic hoarseness. They read the text “Der Nordwind und die Sonne” (“The North Wind and the Sun”). 5 voice and speech therapists evaluated the data on 5-point Likert scales. 10 prosodic and recognition accuracy measures (features) were identified which describe all the examined criteria. Inter-rater correlation within the expert group was between r=0.63 for the criterion “match of breath and sense units” and r=0.87 for the overall voice quality. Human-machine correlation was between r=0.40 for the match of breath and sense units and r=0.82 for intelligibility. The perceptual ratings of different criteria were highly correlated with each other. Likewise, the feature sets modeling the criteria were very similar. The automatic method is suitable for assessing chronic hoarseness in general and for subgroups of functional and organic dysphonia. In its current version, it is almost as reliable as a randomly picked rater from a group of voice and speech therapists.
Transcript of Objective Voice and Speech Analysis of Persons with ...
1
Objective Voice and Speech Analysis of Persons with Chronic Hoarseness by Prosodic
Analysis of Speech Samples
Tino Haderlein1,2, Michael Döllinger1,3, Václav Matoušek2, Elmar Nöth4,5
1Universitätsklinikum Erlangen, Phoniatrische und pädaudiologische Abteilung, Bohlenplatz
21, 91054 Erlangen, Germany 2Západočeská univerzita v Plzni, Katedra informatiky a výpočetní techniky, Univerzitní 8,
306 14 Plzeň, Czech Republic 3Louisiana State University, Communication Sciences and Disorders Department, 63 Hatcher
Hall, Baton Rouge, LA 70803, USA 4Universität Erlangen-Nürnberg, Lehrstuhl für Mustererkennung, Martensstraße 3, 91058
Erlangen, Germany 5King Abdulaziz University, Electrical & Computer Engineering Department, Faculty of
Engineering, Jeddah 21589, Saudi Arabia
Running title: Objective Voice and Speech Analysis of Hoarseness
Corresponding author:
Tino Haderlein
Universitätsklinikum Erlangen
Phoniatrische und pädaudiologische Abteilung
Bohlenplatz 21
91054 Erlangen
Germany
E-Mail: [email protected]
Phone: +49 9131 85 27872
Fax: +49 9131 303811
Abstract
Automatic voice assessment is often performed using sustained vowels. In contrast, speech
analysis of read-out texts can be applied to voice and speech assessment. Automatic speech
recognition and prosodic analysis were used to find regression formulae between automatic
and perceptual assessment of four voice and four speech criteria. The regression was trained
with 21 men and 62 women (average age: 49.2 years) and tested with another set of 24 men
and 49 women (48.3 years), all suffering from chronic hoarseness. They read the text “Der
Nordwind und die Sonne” (“The North Wind and the Sun”). 5 voice and speech therapists
evaluated the data on 5-point Likert scales. 10 prosodic and recognition accuracy measures
(features) were identified which describe all the examined criteria. Inter-rater correlation
within the expert group was between r=0.63 for the criterion “match of breath and sense
units” and r=0.87 for the overall voice quality. Human-machine correlation was between
r=0.40 for the match of breath and sense units and r=0.82 for intelligibility. The perceptual
ratings of different criteria were highly correlated with each other. Likewise, the feature sets
modeling the criteria were very similar. The automatic method is suitable for assessing
chronic hoarseness in general and for subgroups of functional and organic dysphonia. In its
current version, it is almost as reliable as a randomly picked rater from a group of voice and
speech therapists.
2
Key words: assessment, prosodic analysis, automatic speech recognition, technology, voice
disorders
Introduction
Subjective-perceptual voice and speech assessment cannot fulfill the requirements of
evidence-based medicine (1). It is problematic with respect to different degrees of experience
among the examiners (2). Objective, automated evaluation methods are often restricted to
voice quality measures which are computed from sustained vowels or phones but not from
longer segments of speech (3, 4, 5). Speech criteria cannot be processed in this way. They
require more elaborate solutions and are usually evaluated perceptually. Especially
intelligibility has been identified as one of the most important parameters for voice and
speech assessment (6, 7).
In this study, two types of automatic speech analysis were applied for objective evaluation of
voice and speech parameters from continuous speech. The first method is automatic speech
recognition which tries to identify the spoken words in an utterance. The second method is
prosodic analysis. The word “prosody” usually refers to suprasegmental phenomena in
speech, i.e. they are longer in effect than for one single phone which is regarded as the basic
unit of speech. They comprise linguistic aspects, such as word and phrasal accent, phrase
boundaries, sentence modality, and paralinguistic aspects, e.g. the speaker’s emotion. In the
context of automatic speech analysis, “prosodic analysis” means the computation of measures
from a speech sample, which help identify prosodic phenomena but also other aspects related
to speech.
In earlier studies, experimental diagnosis tools based on speech recognition were applied for
speech of adult patients who suffered from neurological diseases (8), in persons after
laryngectomy with tracheo-esophageal speech (9), and in children with cleft lip and palate
(10, 11). Correlations of up to r=0.9 and above were measured between subjective ratings of
intelligibility and automatic measures, e.g. word accuracy, word recognition rate, prosodic, or
phonological features (9, 11, 12, 13).
The aim of this study was modeling the average human perceptual rating of clinically relevant
voice and speech criteria by a combination of automatic speech recognition and prosodic
analysis. The study was performed in the frame of a project on the automatic evaluation of
chronic hoarseness with benign causes. One important aspect of the experiments was also that
no special hardware should be necessary in the clinics (14, 15). The following questions were
examined:
Can perceptual voice and speech criteria be modeled by automatic speech analysis
based on speech recordings?
Is a model that was designed for the entire group of chronically hoarse persons also
valid for the subgroups of functional and organic dysphonia?
Material
Patients
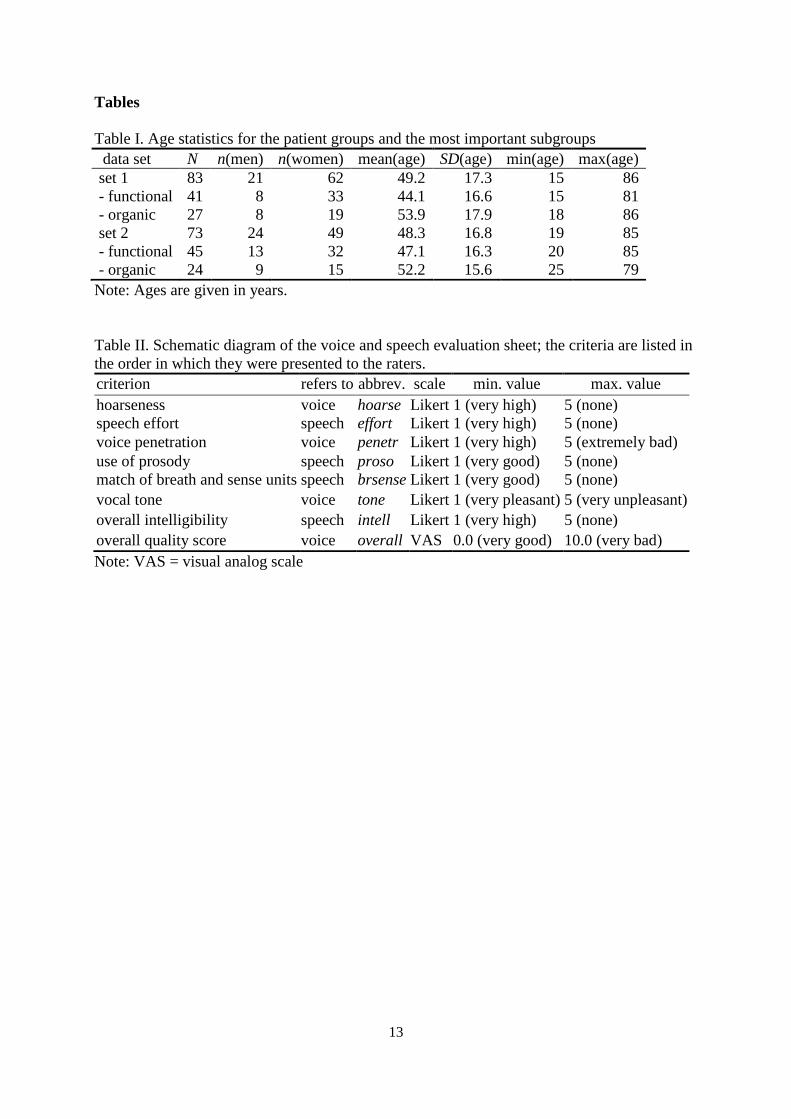
Two groups of persons with chronic hoarseness were used in this study. Speech samples of
one group, further denoted as set 1, were used to determine automatic measures that can
describe perceptual evaluation criteria. The second group – here called set 2 (16) – was used
to test whether the findings on set 1 also hold for other data with the same type of voice
3
disorder. For both sets, the most frequent disorders were grouped to functional and organic
dysphonia (table I).
[Insert table I about here.]
All persons were native German speakers who were asked to speak standard German while
being recorded. None of them had speech disorders caused by medical problems others than
hoarseness, none had psychological problems or any report of hearing impairment. Patients
suffering from cancer were excluded from the study. The study respected the principles of the
World Medical Association Declaration of Helsinki on ethical principles for medical research
involving human subjects and has been approved by the ethics committee of the university
clinics in Erlangen (approval no. 4223).
Speech Recordings
The data were assessed during regular out-patient examinations. Each person read the text
“Der Nordwind und die Sonne”, known as “The North Wind and the Sun” in the Anglo-
American language area (17). The German version is a phonetically rich text with 108 words
(71 disjunctive) and 172 syllables. It is widely used in medical speech evaluation. The texts
were recorded as one passage digitally with standard desktop computer equipment. A
sampling frequency of 16 kHz was used; the data were quantized with a resolution of 16 bit
linear. For set 1, a handheld microphone Sony F-V310 (Cardioid IMP6000 Dynamic Mic.;
Sony, Minato, Tokyo, Japan) was used, set 2 was recorded with an AKG C 420 (AKG
Acoustics, Vienna, Austria) headset. The distance between mouth and microphone was about
10 cm for set 1 and about 5 cm for set 2.
Methods
Subjective Evaluation
In order to achieve results comparable to our former experiments (9, 13, 18), an evaluation
sheet with four voice and four speech criteria was used (table II). It was based on literature
about clinically relevant criteria (6, 7). The voice penetration criterion was defined by Pahn et
al. as the voice capacity to penetrate background noise (19). The criteria were rated on a 5-
point Likert scale. For the purpose of automatic analysis, the scores were converted to integer
numbers. These were not printed on the evaluation sheet. As in the CAPE-V (20), the overall
quality score was not based on a Likert scale, but a 10 cm visual analog scale (VAS). The
raters were asked to mark their impression without regarding their results for the single
criteria before. The distance in centimeters from the left boundary to the drawn line was
measured with a precision of 0.1 cm, so possible overall quality scores were between 0.0 and
10.0.
[Insert table II about here.]
5 experienced voice and speech therapists evaluated each patient subjectively while listening
to a play-back of the text samples. They were played to the raters once in randomized order
via loudspeakers in a quiet seminar room without disturbing noise or echoes. Every sample
was played in full, and all respective raters listened and evaluated at the same time. Sets 1 and
2 were evaluated by two different rater groups. Two of the therapists were part of both
groups; however, set 2 had already been evaluated three years before set 1.
4
Automatic Speech Recognition System and Prosodic Analysis
A “prosody module” was used to find automatically computable counterparts for subjective
ratings. It computes features based on frequency, duration, and speech energy (intensity)
measures. Those are well-established in automatic speech analysis on normal voices (21, 22,
23, 24). Prosodic information is inherent in speech segments, such as syllables, words,
phrases, and whole utterances. To these segments, a human being assigns perceptual
properties, e.g. as pitch, loudness, articulation rate, voice quality, duration, pause or rhythm.
In general, there is no unique feature in the speech signal corresponding to them exactly, but
there are features which highly correlate with them; examples are the fundamental
frequency (F0), which correlates to pitch, and the signal energy correlating to loudness. The
F0-based features including jitter, and the amplitude-based shimmer are widely used in
automatic voice evaluation. In this study, however, they were obtained from speech instead of
vowel samples only. An algorithm for voiced-unvoiced decision detects the voiced sections of
the recording, and the perturbation-based measures are computed only on them.
The prosody module for the analysis of the read-out standard text requires a “word hypotheses
graph” (WHG) as input which contains the information where each word begins and ends in
the respective recording. This time-alignment is done by a speech recognition module on a
word-wise transliteration of the spoken text. For this study, the recordings were assumed to be
free of reading errors, and the text reference was used as transliteration. Previous studies had
shown that the reading errors that usually occur in such data do not on average deteriorate the
result of the evaluation (25).
The recognition system is based on semi-continuous Hidden Markov Models (HMMs) which
define a statistical model for each phoneme to be recognized. The recordings are analyzed in
segments (frames) of 16 ms length at a frame shift rate of 10 ms. The signal energy is
summed up in frequency bands equally spaced on an auditory-based Mel scale. The final
features are achieved by a discrete cosine transform; these measures are known as Mel-
Frequency Cepstrum Coefficients (26) or shortly MFCCs. Eleven MFCCs, an intensity
measure (speech energy), and the first derivative of each of these 12 measures form a 24-
dimensional feature vector that is the basis for phoneme classification. The recognized
phonemes are combined to words according to a given vocabulary list. The vocabulary of the
recognition system for the generation of the WHGs consisted of the 71 different words of the
text “Der Nordwind und die Sonne”. For more details, see (27).
Two measures of the word recognition module were used for the analysis. They are computed
from the comparison between the recognized word sequence and the reference text consisting
of nall=108 words. With the number of words that were wrongly substituted (nsub), deleted
(ndel) and inserted (nins) by the automatic speech recognizer, the word accuracy in percent is
given as
WA = [1 - (nsub + ndel + nins)/nall] ∙ 100 .
The word recognition rate omits the wrongly inserted words:
WR = [1 - (nsub + ndel)/nall] ∙ 100
We used a so-called unigram language model to weight the probability of appearance of each
word model. Hence, the frequency of occurrence for each single word in the text was known
to the system. In order to give more weight to the results of the acoustic analysis, statistic
5
information about sequences of words (which is usually applied in automatic speech
recognition) was not used. It would have corrected too many recognition errors and thus
distorted the good relation of human and machine recognition (28). This would make WA and
WR useless as measures for intelligibility and other criteria. The recognition module had been
trained with 27 hours of undistorted German speech. In that way, normal voices were the
reference for the acoustic evaluation. It was not adapted to the single speakers of the test set,
but stayed the same for each particular analysis.
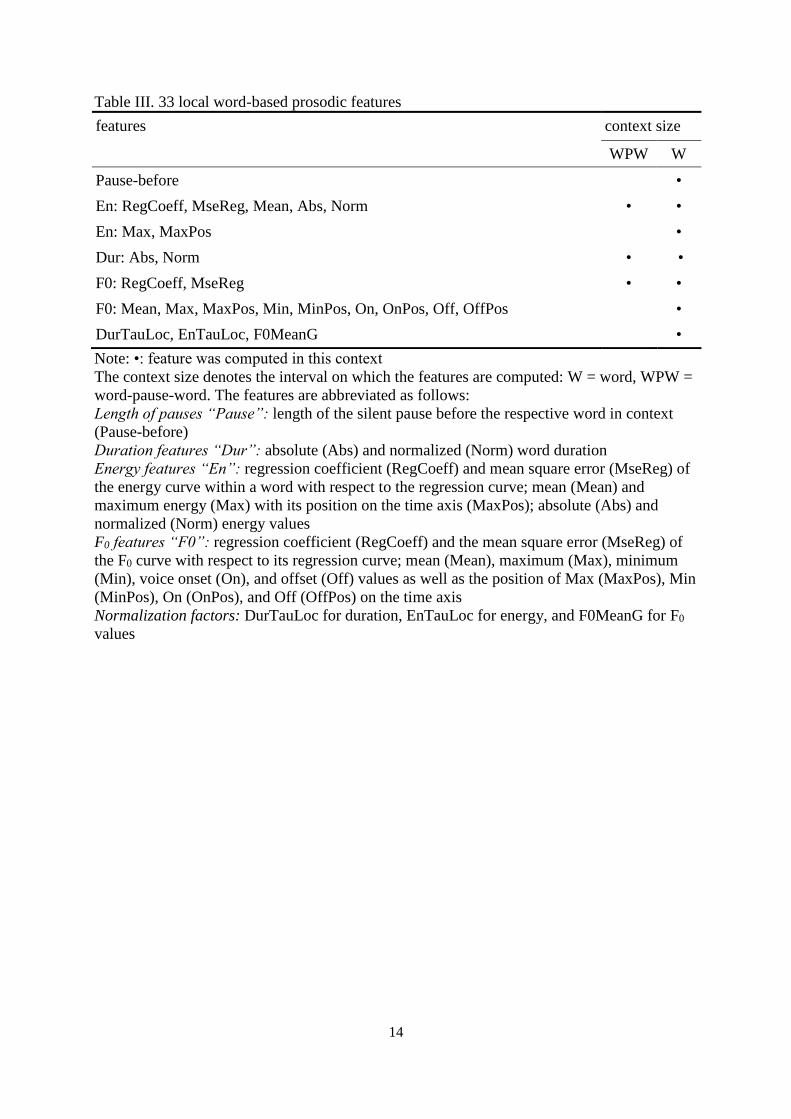
For each word provided by the recognition module, the prosody module computes three basic
groups of “local” prosodic features. Duration features represent word and pause durations.
Energy features contain information about maximum and minimum energy, their respective
positions in the word, the energy regression coefficient and mean-squared error. Similarly the
F0 features, based on the detected fundamental frequency, comprise information about the
extreme F0 values and their positions, voice onset and offset with their positions, and also the
regression coefficient and mean-squared error of the F0 trajectory. Duration, energy, and F0
values are stored as absolute and normalized values. The 24 basic prosodic features are
computed in different contexts where applicable, i.e. in intervals containing the single word or
pause only or a word-pause-word interval. In this way, 33 prosodic features are computed for
each word (table III). In former studies, up to 95 features had been used. The findings of those
experiments allowed the reduction of the original set to the more compact set in this study.
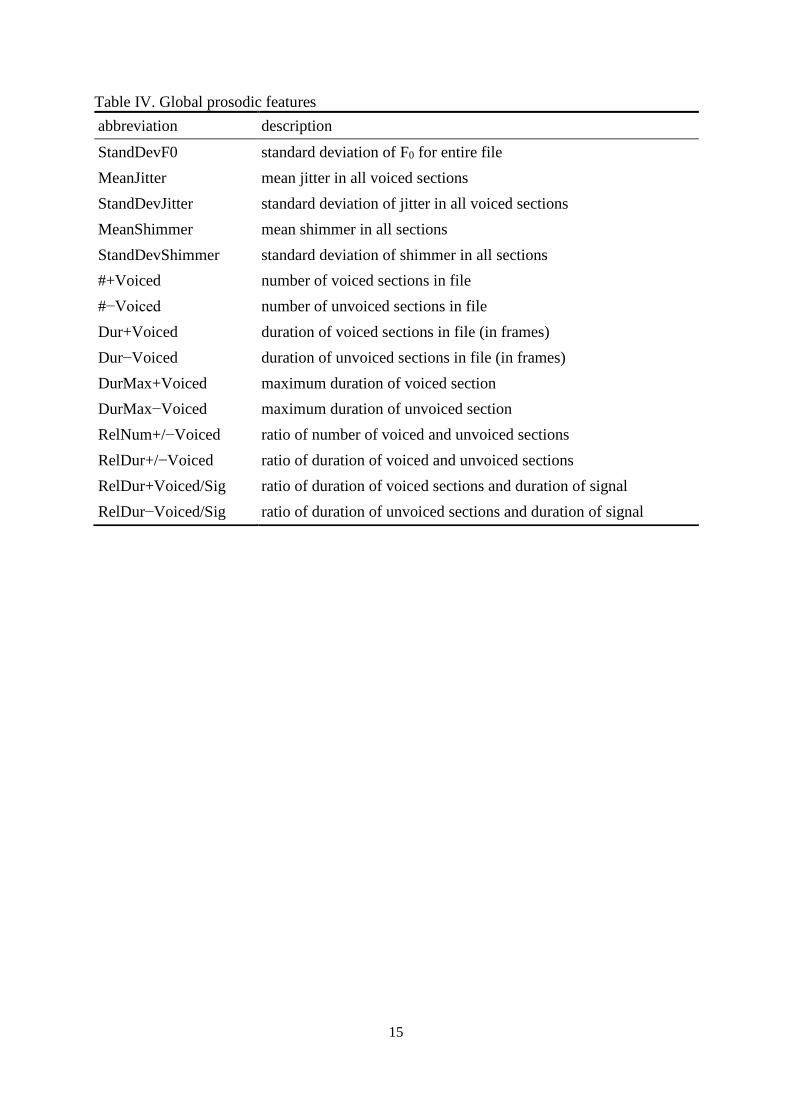
Besides the local features, 15 “global” features (table IV) are computed for intervals of 15
words length each. Details and further references of all features are given in (18, 22, 23).
The features are computed at each word position of the spoken text. The speech experts,
however, gave ratings not for each word but for the entire paragraph. In order to receive one
single value for each feature that can be compared to the human ratings, the average of each
word-based feature over the whole text served as the final feature value.
[Insert table III about here.]
[Insert table IV about here.]
Support Vector Regression
In order to find the best subset of word accuracy, word recognition rate, and the prosodic
features to model the subjective ratings for each criterion, a correlation-based feature selection
method was applied. Feature selection was performed for set 1 in a 10-fold cross-validation
manner using the CfsSubsetEval algorithm (29) of the Weka toolbox (30). The features with
the highest ranks were then used as input for a regression method based on Support Vector
Machines (SVM).
An SVM performs a binary classification based on a hyperplane separation. The separator is
chosen in order to maximize the distances (margin) between the hyperplane that separates the
two classes and the closest training vectors which are called support vectors. SVMs can also
be used for Support Vector Regression (31). The general idea of regression is to use the
vectors of the observed variables (training set) to approximate a function which predicts the
target value of a given vector of the predicted variable (test set). Due to the fact that no binary
classification has to be performed, the so-called ε-tube is defined where ε describes the
deviation which is allowed between the training vectors and the regression line. Similar to
SVM classification, not all training vectors are needed to select the most appropriate ε-tube,
but only a subset of them, i.e. the support vectors. For this study, the sequential minimal
optimization algorithm (31) of the Weka toolbox was applied. For the regression for a
6
respective rating criterion, the automatically computed measures (WA, WR, and all prosodic
features) served as the training set for the regression. The test set consisted of the subjective,
perceptual scores for the respective rating criterion.
All statistical computations for rater agreement or human-machine agreement were also
performed with the Weka toolbox (30). All correlations are given as Pearson’s correlation
coefficient r.
Results
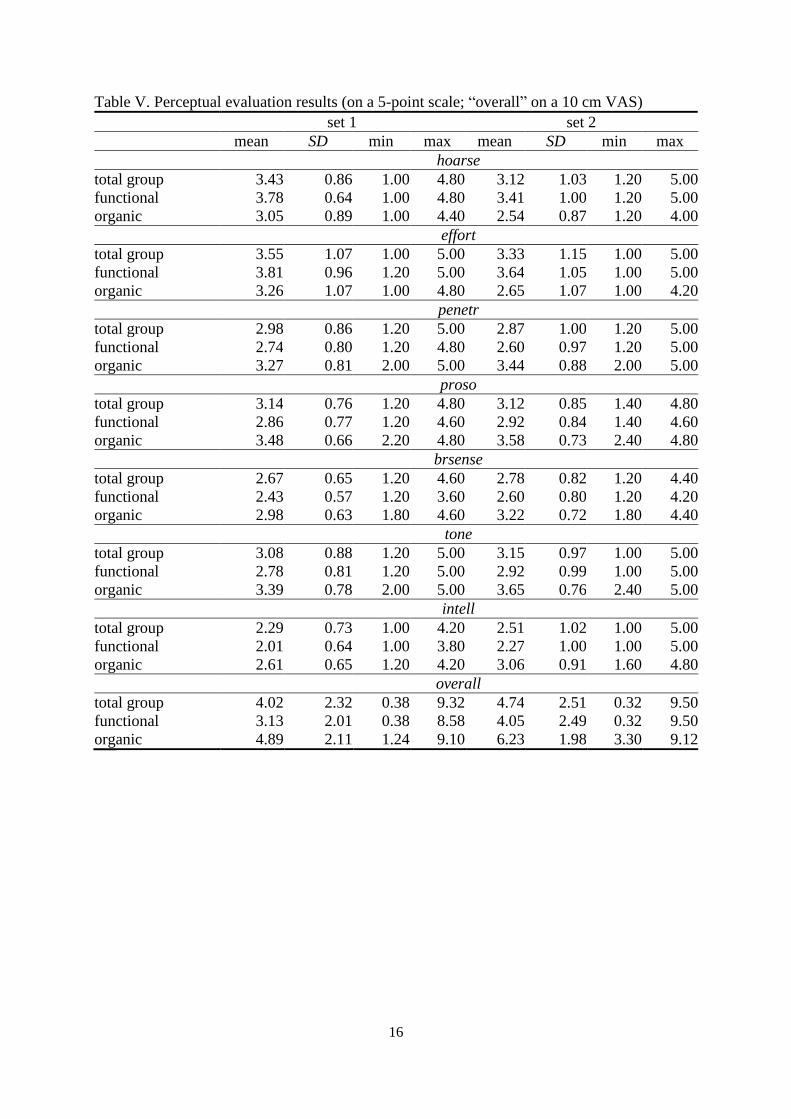
The perceptual evaluation (table V) shows mostly very similar results on sets 1 and 2.
Hoarseness and speaking effort were regarded better among set 2, while the match of breath
and sense units, the vocal tone, intelligibility, and overall quality were reported better in set 1.
There were also some significant differences between the two dysphonia subgroups. Voice
quality, voice penetration, use of prosody, match of breath and sense units, tone, and
intelligibility are remarkably worse in the organic dysphonia group whereas hoarseness and
effort are worse in the functional dysphonia group.
[Insert table V about here.]
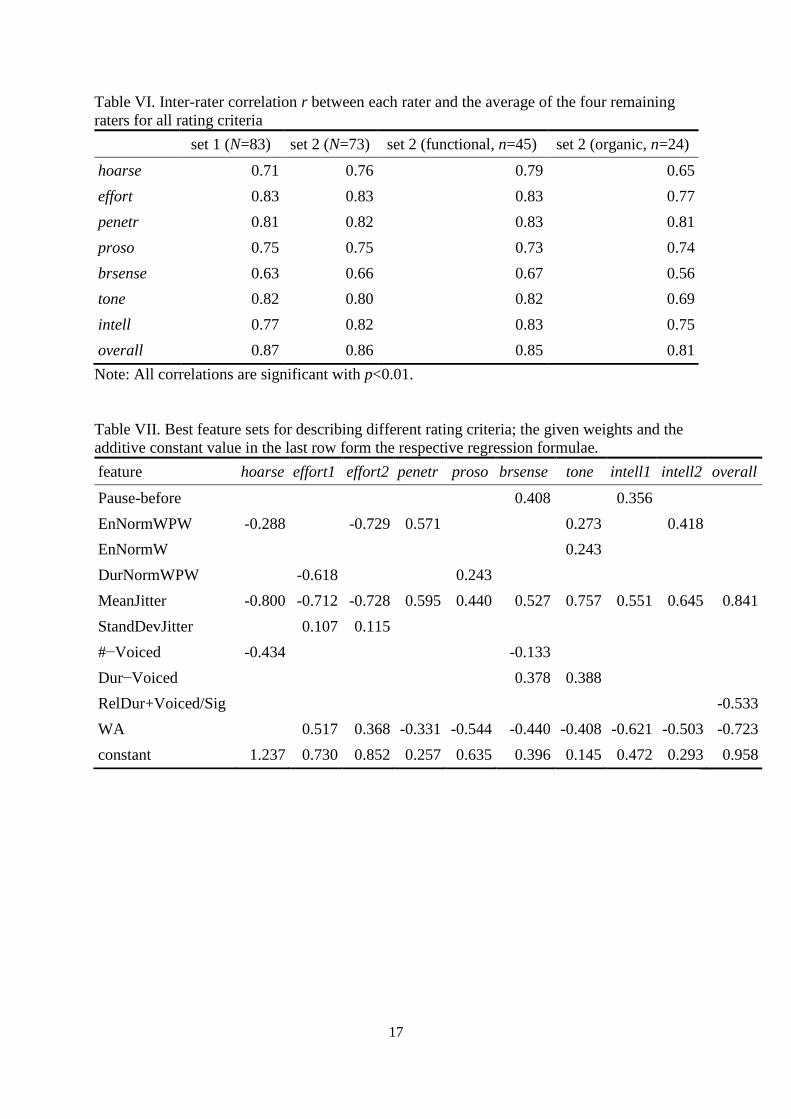
Table VI shows the inter-rater correlation among the rater groups for set 1 and 2 and the
subsets of set 2 with functional and organic dysphonia, respectively. Mostly, correlations
above r=0.7 are reached.
[Insert table VI about here.]
Table VII shows the sets of features that were obtained by the regression for each of the rating
criteria. Only 10 of the 33 local and 15 global features were found to describe all the
examined criteria. Two of them are energy-based, namely the normalized energy values in a
word (EnNormW) and a word-pause-word interval (EnNormWPW). MeanJitter and
StandDevJitter are F0-based. Four of them are duration features: the normalized duration of a
word-pause-word interval (DurNormWPW), the length of silent pause before a word (Pause-
before), the duration of the unvoiced sections (Dur−Voiced), and the ratio of the duration of
the voiced sections and the duration of the sample (RelDur+Voiced/Sig). The two remaining
features are the number of unvoiced sections determined in the sample (#−Voiced) and the
word accuracy (WA) of the speech recognition system.
MeanJitter is part of the best feature sets for every criterion. WA and EnNormWPW are also
part of almost every best feature set. For speech effort and intelligibility, two sets each
appeared to be best. The second set for effort contains EnNormWPW instead of
DurNormWPW. The second set for intelligibility contains EnNormWPW instead of Pause-
before.
[Insert table VII about here.]
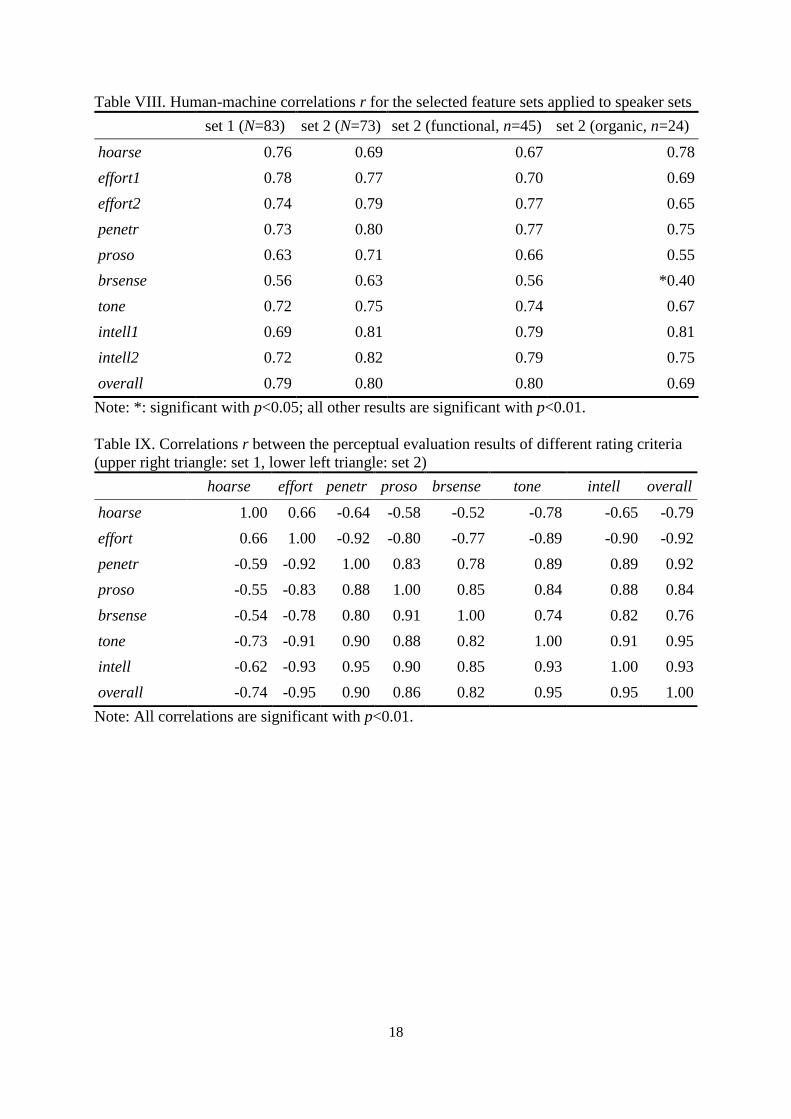
Table VIII contains the correlations between the automatic evaluation and the perceptual
reference for set 1, for the complete set 2, and for its two subsets with different kinds of
dysphonia. The best values reach r=0.8 for voice penetration, intelligibility, and overall
quality for the entire set 2.
7
[Insert table VIII about here.]
The correlations between the perceptual ratings of different criteria are larger than r=0.9 in
some cases (table IX). Especially penetr, effort, and overall correlate with each other and
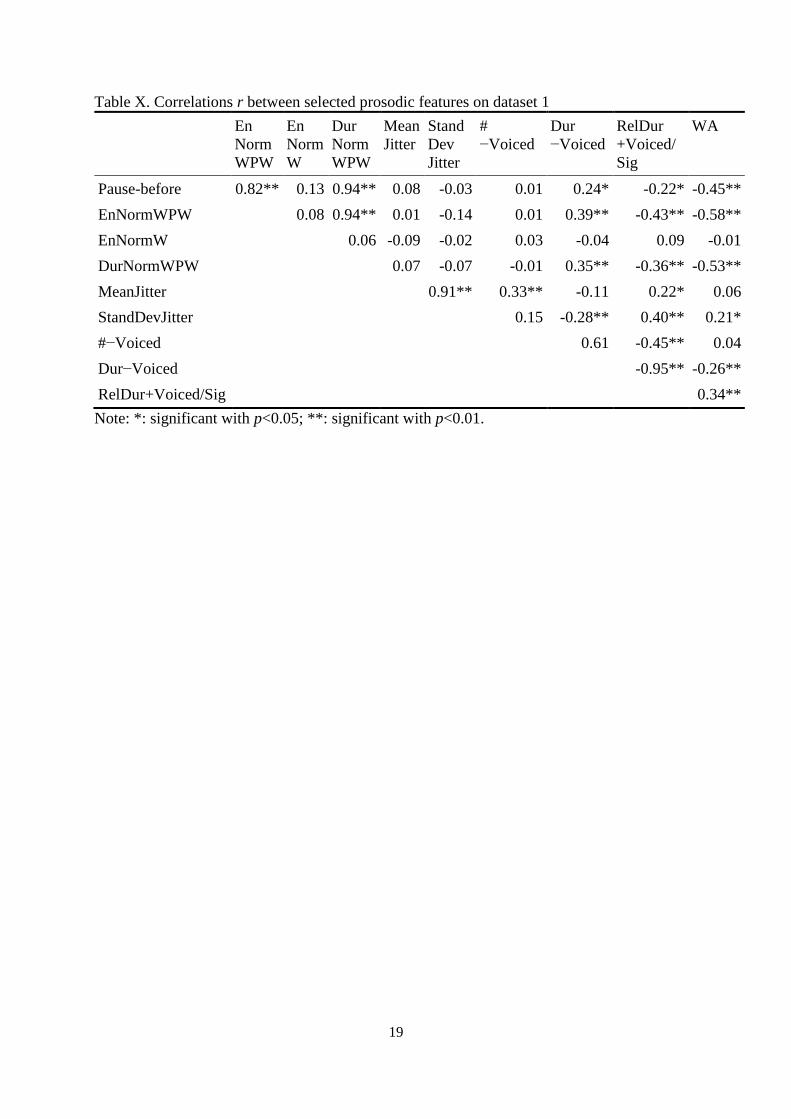
some other criteria to a very high degree. The correlations between the single automatically
computed features are given in table X. According to the definition of the features, high
values could be expected e.g. for DurNormWPW and Pause-before (r=0.94) or Dur−Voiced
and RelDur+Voiced/Sig (r=-0.95), but some other results were not that obvious in advance,
e.g. for EnNormWPW and DurNormWPW (r=0.94). Replacing the respective features in the
best feature sets by measures which were highly correlated did not improve human-machine
correlation in any case, however.
[Insert table IX about here.]
[Insert table X about here.]
Discussion
The human-machine correlation was in most cases slightly smaller than the human-human
agreement, but the general effectiveness of the automatic approach was clearly shown. Even
more, the agreement was in some cases even better on the previously unseen set 2 data than
on set 1, although the human-human correlation was not significantly different on both sets. A
human-machine correlation being equal to the human-human correlation means that the
machine evaluates voice and speech criteria as reliably as an average human rater. Hence, the
first research question of this study can be answered positively: perceptual voice and speech
criteria can be modeled by automatic speech analysis based on speech recordings.
Also the answer for the second question of this study is positive in general: the approach is
applicable to chronic hoarseness in general and also to further specific subclasses. However,
for some rating criteria, the human-machine correlation was smaller on the organic dysphonia
samples. On the other hand, this was also observable in the human-human correlation. One
possible source of this effect may be the different size of the set 2 data subsets which was
n=45 for the functional and n=24 for the organic dysphonia. This was caused by the
acquisition process: the data collection was supposed to be representative, and no pre-
selection for equally sized subsets was made. Specific regressions for the subsets were not
trained, because they are too small to create reliable models for the rating criteria.
Both sets 1 and 2 are representative collections. They are almost equal in the distribution of
gender, age, and subtypes of chronic hoarseness. The speech samples of both sets were
recorded with different microphones. However, no negative influence of the recording media
on the results was observed when dataset 2 was tested with the regression which was trained
with set 1. Hence, the success of the approach is not dependent on the microphone type.
Another aspect supporting the common usability of the method is that the perceptual
evaluation was performed by different raters for the two groups. No large differences in the
inter-rater correlation within the two groups were observed which also shows that, in general,
an average perceptual rating is a reliable reference. However, in clinical practice this is not
applicable since one patient is usually not evaluated by 5 therapists.
The procedure of perceptive evaluation, which was used for this study, may raise the question
whether the raters really evaluated intelligibility, for instance. The way of evaluation was
supposed to depict the methods that are usually applied in therapy sessions. The raters were
8
clearly instructed to evaluate intelligibility instead of voice quality, because it is known that
the degree of voice distortion influences the rating of intelligibility (32). It is very difficult,
however, to exclude this effect in clinical practice where intelligibility is often not evaluated
as a percentage of correctly understood words, because these exact tests are time-consuming.
Additionally, a percentage scale is too detailed to be relevant for therapy suggestions. The
percentage values would very likely be grouped into a small number of intervals with a
certain decision for therapy for each of them. For this reason, we decided to instruct the
therapists to rate intelligibility in five classes right from the beginning. It is obvious that these
labeled classes may not be assigned uniformly by the raters due to certain bottom or floor
effects, which actually makes the conversion to integer numbers a non-linear operation.
However, in the same way we regard it as very likely that the effect on communication
success by differences in percentage intelligibility is also not equally distributed. A
comprehensive study on these effects is not the topic of this work, but we believe that the
difference between 30% and 40% of understood words, for instance, will cause another
degree of information loss than between 90% and 100%. The average value of the ratings of
several raters was used in order to get a representative evaluation, not a single one with
personal bias. Some researchers prefer the consensus method, where the raters agree on a
common rating. But this does not reflect the average of independent ratings, since some of the
involved persons may neglect their own impression and rather choose a label which is more
consistent with the others.
The same acoustic properties, which influence different perceptual rating criteria, can
obviously also be found in their technical counterparts: the large similarity of the feature sets
for the different rating criteria may have also been caused by the agreement of the perceptual
ratings among different criteria (table IX); see also e.g. (33).
The composition of the best feature subsets for the rating criteria confirms the importance of
jitter for automatic voice assessment. Even more, also jitter extracted from all voiced
segments in a speech sample, not only from sustained vowels, can give important information
about voice and speech parameters. There is discussion whether jitter is reliable above 5%
(34), but it has been shown that taking into account also higher values for the comparison
between perceptual and automatic evaluation can improve human-machine correlation (16).
Additionally, a study with four automatic tools for voice analysis revealed that even jitter of
15% can be reliably detected by most of them. This was, however, measured on synthesized
sustained vowels (35).
It was also shown by the prosodic analysis that the normalized energy computed from words
and from word-pause-word intervals contributes to many high human-machine correlations. It
would be straightforward to assume that a louder speaker is more intelligible, for instance.
However, in the best prosodic feature set, the energy values are normalized so that a
continuously high energy level will have no effect. It is more likely that single phones or
phone classes, which cannot be uttered properly due to the speech impairment, appear in the
signal as more noisy and cause local changes in the energy distribution. Leinonen et al. have
shown that this effect occurs mainly in the 1-2 and 7-9 kHz area (36). This has an influence
on the vocal tone or the hoarseness, for instance. Durations of pauses, words, and word-pause-
word intervals contain information about the speaking rate or the duration of pauses for
breathing. Hence, they are indicators for speaking effort, the match of breath and sense units,
intelligibility, or the use of prosody. Features, like Dur−Voiced, #−Voiced, or
RelDur+Voiced/Sig, give information about the stability of phonation. It is currently not
clear, however, why for some criteria the unvoiced and for other criteria the voiced segments
9
are more important for the evaluation. Replacing them by their respective counterparts led to
drastically worse human-machine correlations, although especially the correlation of
Dur−Voiced and RelDur+Voiced/Sig is very high (r=-0.95).
The word accuracy and word recognition rate provided by a speech recognition system had
shown significantly high human-machine correlations for intelligibility in laryngectomees
with tracheo-esophageal speech (9), in children with cleft lip and palate (11), and patients
with oral squamous cell carcinoma (13). In this study, the WR was not part of the best feature
sets. The WA, however, proved to be a non-neglectable measure for almost all examined
voice and speech criteria.
This study took into account representative groups of persons with chronic hoarseness. Hence,
the results can currently be seen valid for this group of voice patients. In other kinds of
dysphonia, there may be effects that could especially cause other correlations between the
perceptual rating criteria and also between the human and machine evaluation. For example,
there can be aphonic voices which are very well intelligible. It is also not intuitive, why
features, such as DurNormWPW, can be related to voice or speech quality evaluation.
Because of high speaking effort due to functional or organic dysphonia, the speaking rate may
be lower. For other types of voice or speech problems, this may not necessarily hold. WA and
WR could be influenced by dialect or foreign accent. The present study was restricted to
native German speakers who were asked to speak standard German. The language spoken by
the patients and raters may also have an influence of the perceptual ratings. In a study by Ghio
et al. (37), there was a significant difference in the roughness evaluations of French and
Italian speakers. On the technical side, the sampling rate of the audio data could have an
influence on the accuracy of the automatic ratings. Due to conditions of some of the applied
programs, a sampling frequency of 16 kHz was chosen in this study which is high enough for
sufficient perturbation reliability (38).
Several studies of other groups speak also in favor of voice analysis from connected speech
(39, 40, 41, 42). Other groups state that sustained vowels are equally suitable (43), or they see
individual advantages in both methods (44). A combination of both may be a promising
solution. With the extension of the method by some additional features, which are known to
be valid indicators for voice quality, the results of the automatic analysis can be further
improved in the future. Among those features are the harmonicity-to-noise ratio HNR or the
cepstral peak prominence CPP, which can also be obtained from running speech (16, 45, 46,
47, 48). MFCCs have been used for speech recognition in this study, but they can also be used
for voice quality assessment (49).
Another important advantage of the presented method is that it does not just classify voices
into one of the two categories “normal” and “pathologic”. For quantification of a
communication disorder in clinical use, this is not sufficient. Instead, the experiments
provided regression formulae which can be used to translate the obtained measures onto the
whole range of perceptual ratings.
As a conclusion, the presented methods can serve as the basis for an automatic, objective
support for rehabilitation. The system is easily applicable, and it is able to evaluate a person’s
voice and speech at the same time. The overall time needed for the analysis of about 50
seconds of text read by one speaker is about one minute on a single-core machine with 2.4
GHz clock frequency. Hence, the system does also not slow down the process of a therapy
session.
10
Declaration of interest: This study was supported by the Else Kröner-Fresenius-Stiftung,
Bad Homburg v.d.H., Germany (grant no. 2011_A167). The responsibility for the content of
this article lies with the authors. The authors report no declarations of interest.
References
1. Biddle AK, Watson, LR, Hooper CR, Lohr KN, Sutton SF. Criteria for determining
disability in speech-language disorders. Summary, Evidence Report/Technology
Assessment: Number 52. AHRQ Publication No. 02-E009. Rockville, MD: Agency for
Healthcare Research and Quality, 2002.
2. Eadie TL, Kapsner M, Rosenzweig J, Waugh P, Hillel A, Merati A. The role of experience
on judgments of dysphonia. J Voice 2010; 24:564-73.
3. Awan SN, Roy N. Outcomes measurement in voice disorders: application of an acoustic
index of dysphonia severity. J Speech Lang Hear Res 2009; 52:482-99.
4. De Bruijn MJ, Ten Bosch L, Kuik DJ, Quené H, Langendijk JA, Leemans CR, Verdonck-
de Leeuw IM. Objective acoustic-phonetic speech analysis in patients treated for oral or
oropharyngeal cancer. Folia Phoniatr Logop 2009; 61:180-7.
5. Van Gogh C, Festen J, Verdonck-de Leeuw I, Parker A, Traissac L, Cheesman A, Mahieu
H. Acoustical analysis of tracheoesophageal voice. Speech Commun 2005; 47:160-68.
6. Van As CJ, Koopmans-van Beinum FJ, Pols LC, Hilgers FJ. Perceptual evaluation of
tracheoesophageal speech by naive and experienced judges through the use of semantic
differential scales. J Speech Lang Hear Res 2003; 46:947-59.
7. Moerman M, Pieters G, Martens J-P, Van der Borgt MJ, Dejonckere P. Objective
evaluation of the quality of substitution voices. Eur Arch Otorhinolaryngol 2004; 261:541-
7.
8. Sy BK, Horowitz DM. A statistical causal model for the assessment of dysarthric speech
and the utility of computer-based speech recognition. IEEE Trans Biomed Eng 1993;
40:1282-98.
9. Haderlein T, Riedhammer K, Nöth E, Toy H, Schuster M, Eysholdt U, Hornegger J,
Rosanowski, F. Application of automatic speech recognition to quantitative assessment of
tracheoesophageal speech with different signal quality. Folia Phoniatr Logop 2009; 61,
12-17.
10. Maier A. Speech of children with cleft lip and palate: Automatic assessment. Vol. 29 of
Studien zur Mustererkennung. Berlin: Logos Verlag, 2009.
11. Schuster M, Maier A, Haderlein T, Nkenke E, Wohlleben U, Rosanowski F, Eysholdt U,
Nöth E. Evaluation of speech intelligibility for children with cleft lip and palate by means
of automatic speech recognition. Int J Pediatr Otorhinolaryngol 2006; 70:1741-7.
12. Middag C. Automatic analysis of pathological speech. Dissertation, Electronics and
Information Systems (ELIS) department, Ghent University, Ghent, Belgium, 2012.
13. Windrich M, Maier A, Kohler R, Nöth E, Nkenke E, Eysholdt U, Schuster M. Automatic
quantification of speech intelligibility of adults with oral squamous cell carcinoma. Folia
Phoniatr Logop 2008; 60:151-6.
14. Ternström S, Granqvist S. Personal computers in the voice laboratory: Part two - audio
devices. Logoped Phoniatr Vocol 2010; 35:98-102.
15. Kitzing P, Maier A, Ahlander VL. Automatic speech recognition (ASR) and its use as a
tool for assessment or therapy of voice, speech, and language disorders. Logoped Phoniatr
Vocol 2009; 34:91-6.
16. Moers C, Möbius B, Rosanowski F, Nöth E, Eysholdt U, Haderlein T. Vowel- and text-
based cepstral analysis of chronic hoarseness. J Voice 2012; 26:416-24.
11
17. International Phonetic Association. Handbook of the International Phonetic Association.
Cambridge: Cambridge University Press, 1999.
18. Haderlein T, Nöth E, Toy H, Batliner A, Schuster M, Eysholdt U, Hornegger J,
Rosanowski F. Automatic evaluation of prosodic features of tracheoesophageal substitute
voice. Eur Arch Otorhinolaryngol 2007; 264:1315-21.
19. Pahn J, Dahl R, Pahn E. Beziehung zwischen Messung der stimmlichen
Durchdringungsfähigkeit, Stimmstatus nach Pahn und ausgewählten Parametern des
Stimmanalyseprogramms MDVP (Kay). Folia Phoniatr Logop 2001; 53:308-16.
20. Zraick RI, Kempster GB, Connor NP, Thibeault S, Klaben BK, Bursac Z, Thrush CR,
Glaze LE. Establishing validity of the Consensus Auditory-Perceptual Evaluation of Voice
(CAPE-V). Am J Speech Lang Pathol 2011; 20:14-22.
21. Ananthakrishnan S, Narayanan S. An automatic prosody recognizer using a coupled multi-
stream acoustic model and a syntactic-prosodic language model. In: Proc. Int. Conf. on
Acoustics, Speech, and Signal Processing (ICASSP). Philadelphia, PA: IEEE, 2005.
Vol. I, P.269-72.
22. Batliner A, Fischer K, Huber R, Spilker J, Nöth E. How to find trouble in communication.
Speech Commun 2003; 40:117-43.
23. Zeissler V, Adelhardt J, Batliner A, Frank C, Nöth E, Shi RP, Niemann, H. The prosody
module. In: Wahlster W, editor. SmartKom: Foundations of Multimodal Dialogue
Systems. New York: Springer, 2006. P.139-52.
24. Chen K, Hasegawa-Johnson M, Cohen A, Borys S, Kim S-S, Cole J, Choi J-Y. Prosody
dependent speech recognition on radio news corpus of American English. IEEE Trans
Audio Speech Lang Processing 2006; 14:232-45.
25. Haderlein T, Nöth E, Maier A, Schuster M, Rosanowski F. Influence of Reading Errors on
the Text-Based Automatic Evaluation of Pathologic Voices. In: Sojka P, Horák A,
Kopeček I, Pala K, editors. Text, Speech and Dialogue; 11th Int. Conf. (TSD 2008). Berlin,
Heidelberg: Springer, 2008. P.325-32.
26. Davis SB, Mermelstein P. Comparison of parametric representation for monosyllabic
word recognition in continuously spoken sentences. IEEE Transactions on Acoustics,
Speech, and Signal Processing 1980; 28:357-66.
27. Haderlein T, Nöth E, Batliner A, Eysholdt U, Rosanowski F. Automatic Intelligibility
Assessment of Pathologic Speech over the Telephone. Logoped Phoniatr Vocol 2011;
36:175-81.
28. Maier A, Haderlein T, Stelzle F, Nöth E, Nkenke E, Rosanowski F, Schützenberger A,
Schuster M. Automatic speech recognition systems for the evaluation of voice and speech
disorders in head and neck cancer. EURASIP Journal on Audio, Speech, and Music
Processing, 2010; 7 pages.
29. Hall MA. Correlation-based feature subset selection for machine learning. Dissertation,
Department of Computer Science, University of Waikato, Hamilton, New Zealand, 1999.
30. Witten I, Frank E. Data mining: Practical machine learning tools and techniques (2nd ed.).
San Francisco: Morgan Kaufmann Publishers, 2005.
31. Smola AJ, Schölkopf B. A tutorial on support vector regression. Statistics and Computing
2004; 14:199-222.
32. Weismer G, Martin R. Acoustic and perceptual approaches to the study of intelligibility.
In: Kent R, editor. Intelligibility in Speech Disorders. Philadelphia: John Benjamins
Publishing Co, 1992. P.67-118.
33. Preminger JE, Van Tasell DJ. Quantifying the relation between speech quality and speech
intelligibility. J Speech Hear Res 1995; 38:714-25.
34. Titze IR. Workshop on Acoustic Voice Analysis: Summary Statement. Denver: National
Center for Voice and Speech, 1995.
12
35. Manfredi C, Giordano A, Schoentgen J, Fraj S, Bocchi L, Dejonckere P. Validity of jitter
measures in non-quasi-periodic voices. Part II: The effect of noise. Logoped Phoniatr
Vocol 2011; 36:78-89.
36. Leinonen L, Hiltunen T, Kangas J, Juvas A, Rihkanen H. Detection of dysphonia by
pattern recognition of speech spectra. Logoped Phoniatr Vocol 1993; 18:159-67.
37. Ghio A, Cantarella G, Weisz F, Robert D, Woisard V, Fussi F, Giovanni A, Baracca G. Is
the perception of dysphonia severity language-dependent? A comparison of French and
Italian voice assessments. Logoped Phoniatr Vocol. Published online 1 Oct 2013.
38. Deliyski DD, Shaw HS, Evans MK. Influence of sampling rate on accuracy and reliability
of acoustic voice analysis. Logoped Phoniatr Vocol 2005, 30:55-62.
39. Bäckström T, Lehto L, Alku P, Vilkman E. Automatic pre-segmentation of running speech
improves the robustness of several acoustic voice measures. Logoped Phoniatr Vocol,
2003; 28:101-8.
40. Halberstam, B. Acoustic and perceptual parameters relating to connected speech are more
reliable measures of hoarseness than parameters relating to sustained vowels. ORL J
Otorhinolaryngol Relat Spec 2004; 66:70-73.
41. Vasilakis M, Stylianou Y. Voice pathology detection based eon [sic] short-term jitter
estimations in running speech. Folia Phoniatr Logop 2009; 61:153-70.
42. Godino-Llorente JI, Fraile R, Sáenz-Lechón N, Osma-Ruiz V, Gómez-Vilda P. Automatic
detection of voice impairments from text-dependent running speech. Biomedical Signal
Processing and Control 2009; 4:176-82.
43. Parsa V, Jamieson DG. Acoustic discrimination of pathological voice: Sustained vowels
versus continuous speech. J Speech Lang Hear Res 2001; 44:327-39.
44. Watts CR, Awan SN. Use of spectral/cepstral analyses for differentiating normal from
hypofunctional voices in sustained vowel and continuous speech contexts. J Speech Lang
Hear Res 2011; 54:1525-37.
45. Peterson EA, Roy N, Awan SN, Merrill RM, Banks R, Tanner K. Toward validation of the
cepstral spectral index of dysphonia (CSID) as an objective treatment outcomes measure. J
Voice 2013; 27:401-10.
46. Awan SN, Solomon NP, Helou LB, Stojadinovic A. Spectral-cepstral estimation of
dysphonia severity: external validation. Ann Otol Rhinol Laryngol 2013; 122:40-8.
47. Lowell SY, Kelley RT, Awan SN, Colton RH, Chan NH. Spectral- and cepstral-based
acoustic features of dysphonic, strained voice quality. Ann Otol Rhinol Laryngol. 2012;
121:539-48.
48. Heman-Ackah YD, Heuer RJ, Michael DD, Ostrowski R, Horman M, Baroody MM,
Hillenbrand J, Sataloff RT. Cepstral peak prominence: a more reliable measure of
dysphonia. Ann Otol Rhinol Laryngol 2003; 112:324-33.
49. Arias-Londoño JD, Godino-Llorente JI, Markaki M, Stylianou Y. On combining
information from modulation spectra and mel-frequency cepstral coefficients for
automatic detection of pathological voices. Logoped Phoniatr Vocol 2011; 36:60-9.
13
Tables
Table I. Age statistics for the patient groups and the most important subgroups
data set N n(men) n(women) mean(age) SD(age) min(age) max(age)
set 1 83 21 62 49.2 17.3 15 86
- functional 41 8 33 44.1 16.6 15 81
- organic 27 8 19 53.9 17.9 18 86
set 2 73 24 49 48.3 16.8 19 85
- functional 45 13 32 47.1 16.3 20 85
- organic 24 9 15 52.2 15.6 25 79
Note: Ages are given in years.
Table II. Schematic diagram of the voice and speech evaluation sheet; the criteria are listed in
the order in which they were presented to the raters.
criterion refers to abbrev. scale min. value max. value
hoarseness voice hoarse Likert 1 (very high) 5 (none)
speech effort speech effort Likert 1 (very high) 5 (none)
voice penetration voice penetr Likert 1 (very high) 5 (extremely bad)
use of prosody speech proso Likert 1 (very good) 5 (none)
match of breath and sense units speech brsense Likert 1 (very good) 5 (none)
vocal tone voice tone Likert 1 (very pleasant) 5 (very unpleasant)
overall intelligibility speech intell Likert 1 (very high) 5 (none)
overall quality score voice overall VAS 0.0 (very good) 10.0 (very bad)
Note: VAS = visual analog scale
14
Table III. 33 local word-based prosodic features
features context size
WPW W
Pause-before •
En: RegCoeff, MseReg, Mean, Abs, Norm • •
En: Max, MaxPos •
Dur: Abs, Norm • •
F0: RegCoeff, MseReg • •
F0: Mean, Max, MaxPos, Min, MinPos, On, OnPos, Off, OffPos •
DurTauLoc, EnTauLoc, F0MeanG •
Note: •: feature was computed in this context
The context size denotes the interval on which the features are computed: W = word, WPW =
word-pause-word. The features are abbreviated as follows:
Length of pauses “Pause”: length of the silent pause before the respective word in context
(Pause-before)
Duration features “Dur”: absolute (Abs) and normalized (Norm) word duration
Energy features “En”: regression coefficient (RegCoeff) and mean square error (MseReg) of
the energy curve within a word with respect to the regression curve; mean (Mean) and
maximum energy (Max) with its position on the time axis (MaxPos); absolute (Abs) and
normalized (Norm) energy values
F0 features “F0”: regression coefficient (RegCoeff) and the mean square error (MseReg) of
the F0 curve with respect to its regression curve; mean (Mean), maximum (Max), minimum
(Min), voice onset (On), and offset (Off) values as well as the position of Max (MaxPos), Min
(MinPos), On (OnPos), and Off (OffPos) on the time axis
Normalization factors: DurTauLoc for duration, EnTauLoc for energy, and F0MeanG for F0
values
15
Table IV. Global prosodic features
abbreviation description
StandDevF0 standard deviation of F0 for entire file
MeanJitter mean jitter in all voiced sections
StandDevJitter standard deviation of jitter in all voiced sections
MeanShimmer mean shimmer in all sections
StandDevShimmer standard deviation of shimmer in all sections
#+Voiced number of voiced sections in file
#−Voiced number of unvoiced sections in file
Dur+Voiced duration of voiced sections in file (in frames)
Dur−Voiced duration of unvoiced sections in file (in frames)
DurMax+Voiced maximum duration of voiced section
DurMax−Voiced maximum duration of unvoiced section
RelNum+/−Voiced ratio of number of voiced and unvoiced sections
RelDur+/−Voiced ratio of duration of voiced and unvoiced sections
RelDur+Voiced/Sig ratio of duration of voiced sections and duration of signal
RelDur−Voiced/Sig ratio of duration of unvoiced sections and duration of signal
16
Table V. Perceptual evaluation results (on a 5-point scale; “overall” on a 10 cm VAS)
set 1 set 2
mean SD min max mean SD min max
hoarse
total group 3.43 0.86 1.00 4.80 3.12 1.03 1.20 5.00
functional 3.78 0.64 1.00 4.80 3.41 1.00 1.20 5.00
organic 3.05 0.89 1.00 4.40 2.54 0.87 1.20 4.00
effort
total group 3.55 1.07 1.00 5.00 3.33 1.15 1.00 5.00
functional 3.81 0.96 1.20 5.00 3.64 1.05 1.00 5.00
organic 3.26 1.07 1.00 4.80 2.65 1.07 1.00 4.20
penetr
total group 2.98 0.86 1.20 5.00 2.87 1.00 1.20 5.00
functional 2.74 0.80 1.20 4.80 2.60 0.97 1.20 5.00
organic 3.27 0.81 2.00 5.00 3.44 0.88 2.00 5.00
proso
total group 3.14 0.76 1.20 4.80 3.12 0.85 1.40 4.80
functional 2.86 0.77 1.20 4.60 2.92 0.84 1.40 4.60
organic 3.48 0.66 2.20 4.80 3.58 0.73 2.40 4.80
brsense
total group 2.67 0.65 1.20 4.60 2.78 0.82 1.20 4.40
functional 2.43 0.57 1.20 3.60 2.60 0.80 1.20 4.20
organic 2.98 0.63 1.80 4.60 3.22 0.72 1.80 4.40
tone
total group 3.08 0.88 1.20 5.00 3.15 0.97 1.00 5.00
functional 2.78 0.81 1.20 5.00 2.92 0.99 1.00 5.00
organic 3.39 0.78 2.00 5.00 3.65 0.76 2.40 5.00
intell
total group 2.29 0.73 1.00 4.20 2.51 1.02 1.00 5.00
functional 2.01 0.64 1.00 3.80 2.27 1.00 1.00 5.00
organic 2.61 0.65 1.20 4.20 3.06 0.91 1.60 4.80
overall
total group 4.02 2.32 0.38 9.32 4.74 2.51 0.32 9.50
functional 3.13 2.01 0.38 8.58 4.05 2.49 0.32 9.50
organic 4.89 2.11 1.24 9.10 6.23 1.98 3.30 9.12
17
Table VI. Inter-rater correlation r between each rater and the average of the four remaining
raters for all rating criteria
set 1 (N=83) set 2 (N=73) set 2 (functional, n=45) set 2 (organic, n=24)
hoarse 0.71 0.76 0.79 0.65
effort 0.83 0.83 0.83 0.77
penetr 0.81 0.82 0.83 0.81
proso 0.75 0.75 0.73 0.74
brsense 0.63 0.66 0.67 0.56
tone 0.82 0.80 0.82 0.69
intell 0.77 0.82 0.83 0.75
overall 0.87 0.86 0.85 0.81
Note: All correlations are significant with p<0.01.
Table VII. Best feature sets for describing different rating criteria; the given weights and the
additive constant value in the last row form the respective regression formulae.
feature hoarse effort1 effort2 penetr proso brsense tone intell1 intell2 overall
Pause-before 0.408 0.356
EnNormWPW -0.288 -0.729 0.571 0.273 0.418
EnNormW 0.243
DurNormWPW -0.618 0.243
MeanJitter -0.800 -0.712 -0.728 0.595 0.440 0.527 0.757 0.551 0.645 0.841
StandDevJitter 0.107 0.115
#−Voiced -0.434 -0.133
Dur−Voiced 0.378 0.388
RelDur+Voiced/Sig -0.533
WA 0.517 0.368 -0.331 -0.544 -0.440 -0.408 -0.621 -0.503 -0.723
constant 1.237 0.730 0.852 0.257 0.635 0.396 0.145 0.472 0.293 0.958
18
Table VIII. Human-machine correlations r for the selected feature sets applied to speaker sets
set 1 (N=83) set 2 (N=73) set 2 (functional, n=45) set 2 (organic, n=24)
hoarse 0.76 0.69 0.67 0.78
effort1 0.78 0.77 0.70 0.69
effort2 0.74 0.79 0.77 0.65
penetr 0.73 0.80 0.77 0.75
proso 0.63 0.71 0.66 0.55
brsense 0.56 0.63 0.56 *0.40
tone 0.72 0.75 0.74 0.67
intell1 0.69 0.81 0.79 0.81
intell2 0.72 0.82 0.79 0.75
overall 0.79 0.80 0.80 0.69
Note: *: significant with p<0.05; all other results are significant with p<0.01.
Table IX. Correlations r between the perceptual evaluation results of different rating criteria
(upper right triangle: set 1, lower left triangle: set 2)
hoarse effort penetr proso brsense tone intell overall
hoarse 1.00 0.66 -0.64 -0.58 -0.52 -0.78 -0.65 -0.79
effort 0.66 1.00 -0.92 -0.80 -0.77 -0.89 -0.90 -0.92
penetr -0.59 -0.92 1.00 0.83 0.78 0.89 0.89 0.92
proso -0.55 -0.83 0.88 1.00 0.85 0.84 0.88 0.84
brsense -0.54 -0.78 0.80 0.91 1.00 0.74 0.82 0.76
tone -0.73 -0.91 0.90 0.88 0.82 1.00 0.91 0.95
intell -0.62 -0.93 0.95 0.90 0.85 0.93 1.00 0.93
overall -0.74 -0.95 0.90 0.86 0.82 0.95 0.95 1.00
Note: All correlations are significant with p<0.01.
19
Table X. Correlations r between selected prosodic features on dataset 1
En
Norm
WPW
En
Norm
W
Dur
Norm
WPW
Mean
Jitter
Stand
Dev
Jitter
#
−Voiced
Dur
−Voiced
RelDur
+Voiced/
Sig
WA
Pause-before 0.82** 0.13 0.94** 0.08 -0.03 0.01 0.24* -0.22* -0.45**
EnNormWPW 0.08 0.94** 0.01 -0.14 0.01 0.39** -0.43** -0.58**
EnNormW 0.06 -0.09 -0.02 0.03 -0.04 0.09 -0.01
DurNormWPW 0.07 -0.07 -0.01 0.35** -0.36** -0.53**
MeanJitter 0.91** 0.33** -0.11 0.22* 0.06
StandDevJitter 0.15 -0.28** 0.40** 0.21*
#−Voiced 0.61 -0.45** 0.04
Dur−Voiced -0.95** -0.26**
RelDur+Voiced/Sig 0.34**
Note: *: significant with p<0.05; **: significant with p<0.01.
![Voice over IP [JePartage]](https://static.fdocuments.fr/doc/165x107/5a6533127f8b9a5b558b5221/voice-over-ip-jepartage.jpg)