nlanguages in Europe
21
Massive migration from the steppe was a source for Indo- European languages in Europe Wolfgang Haak 1,* , Iosif Lazaridis 2,3,* , Nick Patterson 3 , Nadin Rohland 2,3 , Swapan Mallick 2,3,4 , Bastien Llamas 1 , Guido Brandt 5 , Susanne Nordenfelt 2,3 , Eadaoin Harney 2,3,4 , Kristin Stewardson 2,3,4 , Qiaomei Fu 2,3,6,7 , Alissa Mittnik 8 , Eszter Bánffy 9,10 , Christos Economou 11 , Michael Francken 12 , Susanne Friederich 13 , Rafael Garrido Pena 14 , Fredrik Hallgren 15 , Valery Khartanovich 16 , Aleksandr Khokhlov 17 , Michael Kunst 18 , Pavel Kuznetsov 17 , Harald Meller 13 , Oleg Mochalov 17 , Vayacheslav Moiseyev 16 , Nicole Nicklisch 5,13,19 , Sandra L. Pichler 20 , Roberto Risch 21 , Manuel A. Rojo Guerra 22 , Christina Roth 5 , Anna Szécsényi-Nagy 5,9 , Joachim Wahl 23 , Matthias Meyer 6 , Johannes Krause 8,12,24 , Dorcas Brown 25 , David Anthony 25 , Alan Cooper 1 , Kurt Werner Alt 5,13,19,20 , and David Reich 2,3,4 1 Australian Centre for Ancient DNA, School of Earth and Environmental Sciences & Environment Institute, University of Adelaide, Adelaide, South Australia, SA 5005, Australia 2 Department of Genetics, Harvard Medical School, Boston, MA, 02115, USA 3 Broad Institute of Harvard and MIT, Cambridge, MA, 02142, USA 4 Howard Hughes Medical Institute, Harvard Medical School, Boston, MA, 02115, USA 5 Institute of Anthropology, Johannes Gutenberg University of Mainz, D-55128 Mainz, Germany 6 Max Planck Institute for Evolutionary Anthropology, Leipzig, 04103, Germany 7 Key Laboratory of Vertebrate Evolution and Human Origins of Chinese Academy of Sciences, IVPP, CAS, Beijing, 100049, China 8 Institute for Archaeological Sciences, University of Tübingen, Tübingen, 72074, Germany 9 Institute of Archaeology, Research Centre for the Humanities, Hungarian Academy of Science, H-1014 Budapest, Hungary 10 Römisch Germanische Kommission (RGK) Frankfurt, D-60325 Frankfurt, Germany 11 Archaeological Research Laboratory, Stockholm University, 114 18, Sweden 12 Department of Paleoanthropology, Senckenberg Center for Human Evolution and Paleoenvironment, University of Tübingen, Tübingen, D-72070, Germany 13 State Office for Heritage Management and Archaeology Saxony- Anhalt and State Heritage Museum, D-06114 Halle, Germany 14 Departamento de Prehistoria y Arqueología, Facultad de Filosofía y Letras, Universidad Autónoma de Madrid, E-28049 Madrid, Reprints and permissions information is available at www.nature.com/reprints. To whom correspondence should be addressed: David Reich ([email protected]). * Contributed equally to this work Author contributions: WH, NP, NR, JK, KWA and DR supervised the study. WH, EB, CE, MF, SF, RGP, FH, VK, AK, MK, PK, HM, OM, VM, NN, SP, RR, MARG, CR, ASN, JW, JKr, DB, DA, AC, KWA and DR assembled archaeological material, WH, IL, NP, NR, SM, AM and DR analyzed genetic data. IL, NP and DR developed methods using f-statistics for inferring admixture proportions. WH, NR, BL, GB, SN, EH, KS and AM performed wet laboratory ancient DNA work. NR, QF, MM and DR developed the 390k capture reagent. WH, IL and DR wrote the manuscript with help from all co-authors. Author information: The aligned sequences are available through the European Nucleotide Archive under accession number PRJEB8448. The Human Origins genotype dataset including ancient individuals can be found at (http://genetics.med.harvard.edu/ reichlab/Reich_Lab/Datasets.html). The authors declare no competing financial interests. HHS Public Access Author manuscript Nature. Author manuscript; available in PMC 2016 October 04. Published in final edited form as: Nature. 2015 June 11; 522(7555): 207–211. doi:10.1038/nature14317. Author Manuscript Author Manuscript Author Manuscript Author Manuscript
Transcript of nlanguages in Europe
Massive migration from the steppe was a source for Indo-European languages in Europe
Wolfgang Haak1,*, Iosif Lazaridis2,3,*, Nick Patterson3, Nadin Rohland2,3, Swapan Mallick2,3,4, Bastien Llamas1, Guido Brandt5, Susanne Nordenfelt2,3, Eadaoin Harney2,3,4, Kristin Stewardson2,3,4, Qiaomei Fu2,3,6,7, Alissa Mittnik8, Eszter Bánffy9,10, Christos Economou11, Michael Francken12, Susanne Friederich13, Rafael Garrido Pena14, Fredrik Hallgren15, Valery Khartanovich16, Aleksandr Khokhlov17, Michael Kunst18, Pavel Kuznetsov17, Harald Meller13, Oleg Mochalov17, Vayacheslav Moiseyev16, Nicole Nicklisch5,13,19, Sandra L. Pichler20, Roberto Risch21, Manuel A. Rojo Guerra22, Christina Roth5, Anna Szécsényi-Nagy5,9, Joachim Wahl23, Matthias Meyer6, Johannes Krause8,12,24, Dorcas Brown25, David Anthony25, Alan Cooper1, Kurt Werner Alt5,13,19,20, and David Reich2,3,4
1Australian Centre for Ancient DNA, School of Earth and Environmental Sciences & Environment Institute, University of Adelaide, Adelaide, South Australia, SA 5005, Australia 2Department of Genetics, Harvard Medical School, Boston, MA, 02115, USA 3Broad Institute of Harvard and MIT, Cambridge, MA, 02142, USA 4Howard Hughes Medical Institute, Harvard Medical School, Boston, MA, 02115, USA 5Institute of Anthropology, Johannes Gutenberg University of Mainz, D-55128 Mainz, Germany 6Max Planck Institute for Evolutionary Anthropology, Leipzig, 04103, Germany 7Key Laboratory of Vertebrate Evolution and Human Origins of Chinese Academy of Sciences, IVPP, CAS, Beijing, 100049, China 8Institute for Archaeological Sciences, University of Tübingen, Tübingen, 72074, Germany 9Institute of Archaeology, Research Centre for the Humanities, Hungarian Academy of Science, H-1014 Budapest, Hungary 10Römisch Germanische Kommission (RGK) Frankfurt, D-60325 Frankfurt, Germany 11Archaeological Research Laboratory, Stockholm University, 114 18, Sweden 12Department of Paleoanthropology, Senckenberg Center for Human Evolution and Paleoenvironment, University of Tübingen, Tübingen, D-72070, Germany 13State Office for Heritage Management and Archaeology Saxony-Anhalt and State Heritage Museum, D-06114 Halle, Germany 14Departamento de Prehistoria y Arqueología, Facultad de Filosofía y Letras, Universidad Autónoma de Madrid, E-28049 Madrid,
Reprints and permissions information is available at www.nature.com/reprints.
To whom correspondence should be addressed: David Reich ([email protected]).*Contributed equally to this work
Author contributions: WH, NP, NR, JK, KWA and DR supervised the study. WH, EB, CE, MF, SF, RGP, FH, VK, AK, MK, PK, HM, OM, VM, NN, SP, RR, MARG, CR, ASN, JW, JKr, DB, DA, AC, KWA and DR assembled archaeological material, WH, IL, NP, NR, SM, AM and DR analyzed genetic data. IL, NP and DR developed methods using f-statistics for inferring admixture proportions. WH, NR, BL, GB, SN, EH, KS and AM performed wet laboratory ancient DNA work. NR, QF, MM and DR developed the 390k capture reagent. WH, IL and DR wrote the manuscript with help from all co-authors.
Author information: The aligned sequences are available through the European Nucleotide Archive under accession number PRJEB8448. The Human Origins genotype dataset including ancient individuals can be found at (http://genetics.med.harvard.edu/reichlab/Reich_Lab/Datasets.html).
The authors declare no competing financial interests.
HHS Public AccessAuthor manuscriptNature. Author manuscript; available in PMC 2016 October 04.
Published in final edited form as:Nature. 2015 June 11; 522(7555): 207–211. doi:10.1038/nature14317.
Author M
anuscriptA
uthor Manuscript
Author M
anuscriptA
uthor Manuscript
Spain 15The Cultural Heritage Foundation, Västerås, 722 12, Sweden 16Peter the Great Museum of Anthropology and Ethnography (Kunstkamera) RAS, St. Petersburg, Russia 17Volga State Academy of Social Sciences and Humanities, 443099 Russia, Samara, M. Gor'kogo, 65/67 18Deutsches Archaeologisches Institut, Abteilung Madrid, E-28002 Madrid, Spain 19Danube Private University, A-3500 Krems, Austria 20Institute for Prehistory and Archaeological Science, University of Basel, CH-4003 Basel, Switzerland 21Departamento de Prehistòria, Universitat Autonoma de Barcelona, E-08193 Barcelona, Spain 22Departamento de Prehistòria y Arqueolgia, Universidad de Valladolid, E-47002 Valladolid, Spain 23State Office for Cultural Heritage Management Baden-Württemberg, Osteology, Konstanz, D- 78467, Germany 24Max Planck Institute for the Science of Human History, D-07745 Jena, Germany 25Anthropology Department, Hartwick College, Oneonta, NY
Abstract
We generated genome-wide data from 69 Europeans who lived between 8,000–3,000 years ago by
enriching ancient DNA libraries for a target set of almost 400,000 polymorphisms. Enrichment of
these positions decreases the sequencing required for genome-wide ancient DNA analysis by a
median of around 250-fold, allowing us to study an order of magnitude more individuals than
previous studies1–8 and to obtain new insights about the past. We show that the populations of
Western and Far Eastern Europe followed opposite trajectories between 8,000–5,000 years ago. At
the beginning of the Neolithic period in Europe, 8,000–7,000 years ago, closely related groups of
early farmers appeared in Germany, Hungary and Spain, different from indigenous hunter-
gatherers, whereas Russia was inhabited by a distinctive population of hunter-gatherers with high
affinity to a 24,000-year-old Siberian6. By 6,000–5,000 years ago, farmers throughout much of
Europe had more hunter-gatherer ancestry than their predecessors, but in Russia, the Yamnaya
steppe herders of this time were descended not only from the preceding eastern European hunter-
gatherers, but also from a population of Near Eastern ancestry. Western and Eastern Europe came
into contact 4,500 years ago, as the Late Neolithic Corded Ware people from Germany traced 75%
of their ancestry to the Yamnaya, documenting a massive migration into the heartland of Europe
from its eastern periphery. This steppe ancestry persisted in all sampled central Europeans until at
least 3,000 years ago, and is ubiquitous in present-day Europeans. These results provide support
for a steppe origin9 of at least some of the Indo-European languages of Europe.
Genome-wide analysis of ancient DNA has emerged as a transformative technology for
studying prehistory, providing information that is comparable in power to archaeology and
linguistics. Realizing its promise, however, requires collecting genome-wide data from an
adequate number of individuals to characterize population changes over time, which means
not only sampling a succession of archaeological cultures2, but also multiple individuals per
culture. To make analysis of large numbers of ancient DNA samples practical, we used in-
solution hybridization capture10,11 to enrich next generation sequencing libraries for a target
set of 394,577 single nucleotide polymorphisms (SNPs) (‘390k capture’), 354,212 of which
are autosomal SNPs that have also been genotyped using the Affymetrix Human Origins
array in 2,345 humans from 203 populations4,12. This reduces the amount of sequencing
required to obtain genome-wide data by a minimum of 45-fold and a median of 262-fold
Haak et al. Page 2
Nature. Author manuscript; available in PMC 2016 October 04.
Author M
anuscriptA
uthor Manuscript
Author M
anuscriptA
uthor Manuscript
(Supplementary Data 1). This strategy allows us to report genomic scale data on more than
twice the number of ancient Eurasians as has been presented in the entire preceding
literature1–8 (Extended Data Table 1).
We used this technology to study population transformations in Europe. We began by
preparing 212 DNA libraries from 119 ancient samples in dedicated clean rooms, and testing
these by light shotgun sequencing and mitochondrial genome capture (Supplementary
Information section 1, Supplementary Data 1). We restricted the analysis to libraries with
molecular signatures of authentic ancient DNA (elevated damage in the terminal nucleotide),
negligible evidence of contamination based on mismatches to the mitochondrial consensus13
and, where available, a mitochondrial DNA haplogroup that matched previous results using
PCR4,14,15 (Supplementary Information section 2). For 123 libraries prepared in the
presence of uracil-DNA-glycosylase16 to reduce errors due to ancient DNA damage17, we
performed 390k capture, carried out paired-end sequencing and mapped the data to the
human genome. We restricted analysis to 94 libraries from 69 samples that had at least 0.06-
fold average target coverage (average of 3.8-fold) and used majority rule to call an allele at
each SNP covered at least once (Supplementary Data 1). After combining our data
(Supplementary Information section 3) with 25 ancient samples from the literature — three
Upper Paleolithic samples from Russia1,6,7, seven people of European hunter gatherer
ancestry2,4,5,8, and fifteen European farmers2,3,4,8—we had data from 94 ancient Europeans.
Geographically, these came from Germany (n=41), Spain (n=10), Russia (n=14), Sweden
(n=12), Hungary (n=15), Italy (n=1) and Luxembourg (n=1) (Extended Data Table 2).
Following the central European chronology, these included 19 hunter gatherers (∼43,000–
2,600 BC), 28 Early Neolithic farmers (∼6,000–4,000 BC), 11 Middle Neolithic farmers
(∼4,000–3,000 BC) including the Tyrolean Iceman3, 9 Late Copper/Early Bronze Age
individuals (Yamnaya:∼3,300–2,700 BC), 15 Late Neolithic individuals (∼2,500– 2,200
BC), 9 Early Bronze Age individuals (∼2,200–1,500 BC), two Late Bronze Age individuals
(∼1,200–1,100 BC) and one Iron Age individual (∼900 BC). Two individuals were excluded
from analyses as they were related to others from the same population. The average number
of SNPs covered at least once was 212,375 and the minimum was 22,869 (Fig. 1). We
determined that 34 of the 69 newly analysed individuals were male and used 2,258 Y
chromosome SNPs targets included in the capture to obtain high resolution Y chromosome
haplogroup calls (Supplementary Information section 4). Outside Russia, and before the
Late Neolithic period, only a single R1b individual was found (early Neolithic Spain) in the
combined literature (n=70). By contrast, haplogroups R1a and R1b were found in 60% of
Late Neolithic/Bronze Age Europeans outside Russia (n=10), and in 100% of the samples
from European Russia from all periods (7,500–2,700 BC; n=9). R1a and R1b are the most
common haplogroups in many European populations today18,19, and our results suggest that
they spread into Europe from the East after 3,000 BC. Two hunter-gatherers from Russia
included in our study belonged to R1a (Karelia) and R1b (Samara), the earliest documented
ancient samples of either haplogroup discovered to date. These two hunter gatherers did not
belong to the derived lineages M417 within R1a and M269 within R1b that are predominant
in Europeans today18,19, but all 7 Yamnaya males did belong to the M269 subclade18 of
haplogroup R1b. Principal components analysis (PCA) of all ancient individuals along with
777 present-day West Eurasians4 (Fig. 2a, Supplementary Information section 5) replicates
Haak et al. Page 3
Nature. Author manuscript; available in PMC 2016 October 04.
Author M
anuscriptA
uthor Manuscript
Author M
anuscriptA
uthor Manuscript
the positioning of present-day Europeans between the Near East and European hunter-
gatherers4,20, and the clustering of early farmers from across Europe with present day
Sardinians3,4, suggesting that farming expansions across the Mediterranean to Spain and via
the Danubian route to Hungary and Germany descended from a common stock. By adding
samples from later periods and additional locations, we also observe several new patterns.
All samples from Russia have affinity to the ∼24,000-year-old MA1(ref. 6), the type
specimen for the Ancient North Eurasians (ANE) who contributed to both Europeans4 and
Native Americans4,6,8. The two hunter-gatherers from Russia (Karelia in the northwest of
the country and Samara on the steppe near the Urals) form an ‘eastern European hunter-
gatherer’ (EHG) cluster at one end of a hunter-gatherer cline across Europe; people of
hunter-gatherer ancestry from Luxembourg, Spain, and Hungary sit at the opposite ‘western
European hunter-gatherer’4 (WHG) end, while the hunter-gatherers from Sweden4,8 (SHG)
are intermediate. Against this background of differentiated European hunter-gatherers and
homogeneous early farmers, multiple population turnovers transpired in all parts of Europe
included in our study. Middle Neolithic Europeans from Germany, Spain, Hungary, and
Sweden from the period, ∼4,000–3,000 BC are intermediate between the earlier farmers and
the WHG, suggesting an increase of WHG ancestry throughout much of Europe. By
contrast, in Russia, the later Yamnaya steppe herders of ∼3,000 BC plot between the EHG
and the present-day Near East/Caucasus, suggesting a decrease of EHG ancestry during the
same time period. The Late Neolithic and Bronze Age samples from Germany and Hungary2
are distinct from the preceding Middle Neolithic and plot between them and the Yamnaya.
This pattern is also seen in ADMIXTURE analysis (Fig. 2b, Supplementary Information
section 6), which implies that the Yamnaya have ancestry from populations related to the
Caucasus and South Asia that is largely absent in 38 Early or Middle Neolithic farmers but
present in all 25 Late Neolithic or Bronze Age individuals. This ancestry appears in Central
Europe for the first time in our series with the Corded Ware around 2,500 BC
(Supplementary Information section 6, Fig. 2b). The Corded Ware shared elements of
material culture with steppe groups such as the Yamnaya although whether this reflects
movements of people has been contentious21. Our genetic data provide direct evidence of
migration and suggest that it was relatively sudden. The Corded Ware are genetically closest
to the Yamnaya ∼2,600km away, as inferred both from PCA and ADMIXTURE (Fig. 2) and
FST (0.011±0.002) (Extended Data Table 3). If continuous gene flow from the east, rather
than migration, had occurred, we would expect successive cultures in Europe to become
increasingly differentiated from the Middle Neolithic, but instead, the Corded Ware are both
the earliest and most strongly differentiated from the Middle Neolithic population.
‘Outgroup’ f3 statistics6 (Supplementary Information section 7),which measure shared
genetic drift between a pair of populations (Extended Data Fig. 1), support the clustering of
hunter-gatherers, Early/Middle Neolithic, and Late Neolithic/Bronze Age populations into
different groups as in the PCA (Fig. 2a).We also analysed f4 statistics, which allow us to test
whether pairs of populations are consistent with descent from common ancestral
populations, and to assess significance using a normally distributed Z score. Early European
farmers from the Early and Middle Neolithic were closely related but not identical. This is
reflected in the fact that Loschbour, a WHG individual fromLuxembourg4, shared more
alleles with post-4,000 BC European farmers from Germany, Spain, Hungary, Sweden and
Italy than with early farmers of Germany, Spain, and Hungary, documenting an increase of
Haak et al. Page 4
Nature. Author manuscript; available in PMC 2016 October 04.
Author M
anuscriptA
uthor Manuscript
Author M
anuscriptA
uthor Manuscript
hunter-gatherer ancestry in multiple regions of Europe during the course of the Neolithic.
The two EHG form a clade with respect to all other present-day and ancient populations (|Z|
<1.9), and MA1 shares more alleles with them (|Z|>4.7) than with other ancient or modern
populations, suggesting that they may be a source for the ANE ancestry in present
Europeans4,12,22 as they are geographically and temporally more proximate than Upper
Paleolithic Siberians. The Yamnaya differ from the EHG by sharing fewer alleles with MA1
(|Z|=6.7) suggesting a dilution of ANE ancestry between 5,000–3,000 BC on the European
steppe. This was likely due to admixture of EHG with a population related to present-day
Near Easterners, as the most negative f3 statistic in the Yamnaya (giving unambiguous
evidence of admixture) is observed when we model them as a mixture of EHG and present-
day Near Eastern populations like Armenians (Z=-6.3); Supplementary Information section
7). The Late Neolithic/Bronze Age groups of central Europe share more alleles with
Yamnaya than the Middle Neolithic populations do (|Z|=12.4) and more alleles with the
Middle Neolithic than the Yamnaya do (|Z|=12.5), and have a negative f3 statistic with the
Middle Neolithic and Yamnaya as references (Z=-20.7), indicating that they were descended
from a mixture of the local European populations and new migrants from the east. Moreover,
the Yamnaya share more alleles with the CordedWare (|Z|≥3.6) than with any other Late
Neolithic/Early Bronze Age group with at least two individuals (Supplementary Information
section 7), indicating that they had more eastern ancestry, consistent with the PCA and
ADMIXTURE patterns (Fig. 2). Modelling of the ancient samples shows that while Karelia
is genetically intermediate between Loschbour and MA1, the topology that considers
Karelia as a mixture of these two elements is not the only one that can fit the data
(Supplementary Information section 8). To avoid biasing our inferences by fitting an
incorrect model, we developed new statistical methods that are substantial extensions of a
previously reported approach4, which allow us to obtain precise estimates of the proportion
of mixture in later Europeans without requiring a formal model for the relationship among
the ancestral populations. The method (Supplementary Information section 9) is based on
the idea that if a Test population has ancestry related to reference populations Ref1, Ref2 ,
…, RefN in proportions α1,α2,…,αN, and the references are themselves differentially related
to a triple of outgroup populations A, B, C, then:
By using a large number of outgroup populations we can fit the admixture coefficients αi
and estimate mixture proportions (Supplementary Information section 9, Extended Data Fig.
2). Using 15 outgroups from Africa, Asia, Oceania and the Americas, we obtain good fits as
assessed by a formal test (Supplementary Information section 10), and estimate that the
Middle Neolithic populations of Germany and Spain have ∼18–34% more WHG-related
ancestry than Early Neolithic populations and that the Late Neolithic and Early Bronze Age
populations of Germany have ∼22–39% more EHG-related ancestry than the Middle
Neolithic ones (Supplementary Information section 9). If we model them as mixtures of
Yamnaya-related and Middle Neolithic populations, the inferred degree of population
turnover is doubled to 48–80% (Supplementary Information sections 9 and 10). To
Haak et al. Page 5
Nature. Author manuscript; available in PMC 2016 October 04.
Author M
anuscriptA
uthor Manuscript
Author M
anuscriptA
uthor Manuscript
distinguish whether a Yamnaya or an EHG source fits the data better, we added ancient
samples as outgroups (Supplementary Information section 9). Adding any Early or Middle
Neolithic farmer results in EHG-related genetic input into Late Neolithic populations being
a poor fit to the data (Supplementary Information section 9); thus, Late Neolithic
populations have ancestry that cannot be explained by a mixture of EHG and Middle
Neolithic. When using Yamnaya instead of EHG, however, we obtain a good fit
(Supplementary Information sections 9 and 10). These results can be explained if the new
genetic material that arrived in Germany was a composite of two elements: EHG and a type
of Near Eastern ancestry different from that which was introduced by early farmers (also
suggested by PCA and ADMIXTURE; Fig. 2, Supplementary Information sections 5 and 6).
We estimate that these two elements each contributed about half the ancestry of the
Yamnaya (Supplementary Information sections 6 and 9), explaining why the population
turnover inferred using Yamnaya as a source is about twice as high compared to the
undiluted EHG. The estimate of Yamnaya related ancestry in the Corded Ware is consistent
when using either present populations or ancient Europeans as outgroups (Supplementary
Information sections 9 and 10), and is 73.1±2.2% when both sets are combined
(Supplementary Information section 10). The best proxies for ANE ancestry in Europe4
were initially Native Americans12,22, and then the Siberian MA1 (ref. 6), but both are
geographically and temporally too remote for what appears to be a recent migration into
Europe4. We can now add three new pieces to the puzzle of how ANE ancestry was
transmitted to Europe: first by the EHG, then the Yamnaya formed by mixture between EHG
and a Near Eastern related population, and then the Corded Ware who were formed by a
mixture of the Yamnaya with Middle Neolithic Europeans. We caution that the sampled
Yamnaya individuals from Samara might not be directly ancestral to Corded Ware
individuals from Germany. It is possible that a more western Yamnaya population, or an
earlier (pre-Yamnaya) steppe population may have migrated into central Europe, and future
work may uncover more missing links in the chain of transmission of steppe ancestry. By
extending our model to a three-way mixture of WHG, Early Neolithic and Yamnaya, we
estimate that the ancestry of the Corded Ware was 79% Yamnaya-like, 4% WHG, and 17%
Early Neolithic (Fig. 3). A small contribution of the first farmers is also consistent with
uniparentally inherited DNA: for example, mitochondrial DNA haplogroup N1a and Y
chromosome haplogroup G2a, common in early central European farmers14,23, almost
disappear during the Late Neolithic and Bronze Age, when they are largely replaced by Y
haplogroups R1a and R1b (Supplementary Information section 4)and mtDNA haplogroups
I,T1,U2,U4, U5a,W, and subtypes of H14,23,24 (Supplementary Information section 2). The
uniparental data not only confirm a link to the steppe populations but also suggest that both
sexes participated in the migrations (Supplementary Information sections 2 and 4 and
Extended Data Table 2). The magnitude of the population turnover that occurred becomes
even more evident if one considers the fact that the steppe migrants may well have mixed
with eastern European agriculturalists on their way to central Europe. Thus, we cannot
exclude a scenario in which the Corded Ware arriving in today's Germany had no ancestry at
all from local populations.
Our results support a view of European pre-history punctuated by two major migrations:
first, the arrival of the first farmers during the Early Neolithic from the Near East, and
Haak et al. Page 6
Nature. Author manuscript; available in PMC 2016 October 04.
Author M
anuscriptA
uthor Manuscript
Author M
anuscriptA
uthor Manuscript
second, the arrival of Yamnaya pastoralists during the Late Neolithic from the steppe. Our
data further show that both migrations were followed by resurgences of the previous
inhabitants: first, during the Middle Neolithic, when hunter-gatherer ancestry rose again
after its Early Neolithic decline, and then between the Late Neolithic and the present, when
farmer and hunter-gatherer ancestry rose after its Late Neolithic decline. This second
resurgence must have started during the Late Neolithic/Bronze Age period itself, as the Bell
Beaker and Unetice groups had reduced Yamnaya ancestry compared to the earlier Corded
Ware, and comparable levels to that in some present-day Europeans (Fig. 3). Today,
Yamnaya related ancestry is lower in southern Europe and higher in northern Europe, and all
European populations can be modelled as a three-way mixture of WHG, Early Neolithic,
and Yamnaya, whereas some outlier populations show evidence for additional admixture
with populations from Siberia and the Near East (Extended Data Fig. 3, Supplementary
Information section 9). Further data are needed to determine whether the steppe ancestry
arrived in southern Europe at the time of the Late Neolithic/Bronze Age, or is due to
migrations in later times from northern Europe25,26. Our results provide new data relevant to
debates on the origin and expansion of Indo-European languages in Europe (Supplementary
Information section 11). Although the findings from ancient DNA are silent on the question
of the languages spoken by preliterate populations, they do carry evidence about processes
of migration which are invoked by theories on Indo-European language dispersals. Such
theories make predictions about movements of people to account for the spread of languages
and material culture (Extended Data Fig. 4). The technology of ancient DNA makes it
possible to reject or confirm the proposed migratory movements, as well as to identify new
movements that were not previously known. The best argument for the ‘Anatolian
hypothesis’27 that Indo-European languages arrived in Europe from Anatolia ∼8,500 years
ago is that major language replacements are thought to require major migrations, and that
after the Early Neolithic when farmers established themselves in Europe, the population
base was likely to have been so large that later migrations would not have made much of an
impact27,28. However, our study shows that a later major turnover did occur, and that steppe
migrants replaced ∼75% of the ancestry of central Europeans. An alternative theory is the
‘steppe hypothesis’, which proposes that early Indo-European speakers were pastoralists of
the grasslands north of the Black and Caspian Seas, and that their languages spread into
Europe after the invention of wheeled vehicles9. Our results make a compelling case for the
steppe as a source of at least some of the Indo-European languages in Europe by
documenting a massive migration ∼4,500 years ago associated with the Yamnaya and
Corded Ware cultures, which are identified by proponents of the steppe hypothesis as
vectors for the spread of Indo-European languages into Europe. These results challenge the
Anatolian hypothesis by showing that not all Indo-European languages in Europe can
plausibly derive from the first farmer migrations thousands of years earlier (Supplementary
Information section 11). We caution that the location of the proto-Indo-European9,27,29,30
homeland that also gave rise to the Indo-European languages of Asia, as well as the Indo-
European languages of southeastern Europe, cannot be determined from the data reported
here (Supplementary Information section 11). Studying the mixture in the Yamnaya
themselves, and understanding the genetic relationships among a broader set of ancient and
present-day Indo- European speakers, may lead to new insight about the shared homeland.
Haak et al. Page 7
Nature. Author manuscript; available in PMC 2016 October 04.
Author M
anuscriptA
uthor Manuscript
Author M
anuscriptA
uthor Manuscript
Online Methods
Screening of libraries (shotgun sequencing and mitochondrial capture)
The 212 libraries screened in this study (Supplementary Information section 1) from a total
of 119 samples (Supplementary Information section 3) were produced at Adelaide (n=151),
Tübingen (n=16), and Boston (n=45) (Online Table 1).
The libraries from Adelaide and Boston had internal barcodes directly attached to both sides
of the molecules from the DNA extract so that each sequence begins with the barcode10. The
Adelaide libraries had 5 base pair (bp) barcodes on both sides, while the Boston libraries had
7 bp barcodes. Libraries from Tübingen had no internal barcodes, but were differentiated by
the sequence of the indexing primer31.
We adapted a reported protocol for enriching for mitochondrial DNA10, with the difference
that we adjusted the blocking oligonucleotides and PCR primers to fit our libraries with
shorter adapters. Over the course of this project, we also lowered the hybridization
temperature from 65°C to 60°C and performed stringent washes at 55°C instead of 60°C32.
We used an aliquot of approximately 500ng of each library for target enrichment of the
complete mitochondrial genome in two consecutive rounds32, using a bait set for human
mtDNA32. We performed enrichment in 96-well plates with one library per well, and used a
liquid handler (Evolution P3, Perkin Elmer) for the capture and washing steps33. We used
blocking oligonucleotides in hybridization appropriate to the adapters of the truncated
libraries. After either of the two enrichment rounds, we amplified the enriched library
molecules with the primer pair that keeps the adapters short (PreHyb) using Herculase
Fusion II PCR Polymerase. We performed an indexing PCR of the final capture product
using one or two indexing primers31. We cleaned up all PCR's using SPRI technology34 and
the liquid handler. Libraries from Tübingen were amplified with the primer pair IS5/IS631.
For libraries from Boston and Adelaide, we used a second aliquot of each library for shotgun
sequencing after performing an indexing PCR31. We used unique index combinations for
each library and experiment, allowing us to distinguish shotgun sequencing and
mitochondrial DNA capture data, even if both experiments were in the same sequencing run.
We sequenced shotgun libraries and mtDNA captured libraries from Tübingen in
independent sequencing runs since the index was already attached at the library preparation
stage.
We quantified the sequencing pool with the BioAnalyzer (Agilent) and/or the KAPA Library
Quantification kit (KAPA biosystems) and sequenced on Illumina MiSeq, HiSeq2500 or
NextSeq500 instruments for 2×75, 2×100 or 2×150 cycles along with the indexing read(s).
Enrichment for 394,577 SNP targets (“390k capture”)
The protocol for enrichment for SNP targets was similar to the mitochondrial DNA capture,
with the exception that we used another bait set (390k) and about twice as much library (up
to 1000ng) compared to the mtDNA capture.
Haak et al. Page 8
Nature. Author manuscript; available in PMC 2016 October 04.
Author M
anuscriptA
uthor Manuscript
Author M
anuscriptA
uthor Manuscript
The specific capture reagent used in this study is described for the first time here. To target
each SNP, we used a different oligonucleotide probe design compared to ref. 1. We used four
52 base pair probes for each SNP target. One probe ends just before the SNP, and one starts
just after.
Two probes are centered on the SNP, and are identical except for having the alternate alleles.
This probe design avoids systematic bias toward one SNP allele or another. For the template
sequence for designing the San and Yoruba panels baits, we used the sequence that was
submitted for these same SNPs during the design of the Affymetrix Human Origins SNP
array12. For SNPs that were both in the San and Yoruba panels, we used the Yoruba template
sequence in preference. For all other SNPs, we used the human genome reference sequence
as a template. Online Table 2 gives the list of SNPs that we targeted, along with details of
the probes used. The breakdown of SNPs into different classes is:
124,106 “Yoruba SNPs”: All SNPs in “Panel 5” of the Affymetrix Human Origins array (discovered as heterozygous in a Yoruba male: HGDP00927)12 that passed the probe design criteria specified in ref. 11.
146,135 “San SNPs”: All SNPs in “Panel 4” of the Affymetrix Human Origins array (discovered as heterozygous in a San male: HGDP01029)12 that passed probe design criteria11. The full Affymetrix Human Origins array Panel 4 contains several tens of thousands of additional SNPs overlapping those from Panel 5, but we did not wish to redundantly capture Panel 5 SNPs.
98,166 “Compatibility SNPs”: SNPs that overlap between the Affymetrix Human Origins the Affymetrix 6.0, and the Illumina 610 Quad arrays, which are not already included in the “Yoruba SNPs” or “San SNPs” lists12
and that also passed the probe design design criteria11.
26,170 “Miscellaneous SNPs”: SNPs that did not overlap the Human Origins array. The subset analyzed in this study were 2,258 Y chromosome SNPs (http://isogg.org/tree/ISOGG_YDNA_SNP_Index.html) that we used for Y haplogroup determination.
Processing of sequencing data
We restricted analysis to read pairs that passed quality control according to the Illumina
software (“PF reads”).
We assigned read pairs to libraries by searching for matches to the expected index and
barcode sequences (if present, as for the Adelaide and Boston libraries). We allowed no
more than 1 mismatch per index or barcode, and zero mismatches if there was ambiguity in
sequence assignment or if barcodes of 5 bp length were used (Adelaide libraries).
We used Seqprep (https://github.com/jstjohn/SeqPrep) to search for overlapping sequence
between the forward and reverse read, and restricted to molecules where we could identify a
minimum of 15 bp of overlap. We collapsed the two reads into a single sequence, using the
consensus nucleotide if both reads agreed, and the read with higher base quality in the case
of disagreement. For each merged nucleotide, we assigned the base quality to be the higher
of the two reads. We further used Seqprep to search for the expected adapter sequences at
either ends of the merged sequence, and to produce a trimmed sequence for alignment.
We mapped all sequences using BWA-0.6.135. For mitochondrial analysis we mapped to the
mitochondrial genome RSRS36. For whole genome analysis we mapped to the human
reference genome hg19. We restricted all analyses to sequences that had a mapping quality
of MAPQ≥37.
Haak et al. Page 9
Nature. Author manuscript; available in PMC 2016 October 04.
Author M
anuscriptA
uthor Manuscript
Author M
anuscriptA
uthor Manuscript
We sorted all mapped sequences by position, and used a custom script to search for mapped
sequences that had the same orientation and start and stop positions. We stripped all but one
of these sequences (keeping the best quality one) as duplicates.
Mitochondrial sequence analysis and assessment of ancient DNA authenticity
For each library for which we had average coverage of the mitochondrial genome of at least
10-fold after removal of duplicated molecules, we built a mitochondrial consensus sequence,
assigning haplogroups for each library as described in Supplementary Information section 2.
We used contamMix-1.0.9 to search for evidence of contamination in the mitochondrial
DNA13. This software estimates the fraction of mitochondrial DNA sequences that match
the consensus more closely than a comparison set of 311 worldwide mitochondrial genomes.
This is done by taking the consensus sequence of reads aligning to the RSRS mitochondrial
genome, and requiring a minimum coverage of 5 after filtering bases where the quality was
<30. Raw reads are then realigned to this consensus. In addition, the consensus is multiply
aligned with the other 311 mitochondrial genomes using kalign (2.0.4)37 to build the
necessary inputs for contamMix, trimming the first and last 5 bases of every read to mitigate
against the confounding factor of ancient damage. This software had difficulty running on
datasets with higher coverage, and for these datasets, we down-sampled to 50,000 reads,
which we found produced adequate contamination estimation.
For all sequences mapping to the mitochondrial DNA that had a cytosine at the terminal
nucleotide, we measured the proportion of sequences with a thymine at that position. For
population genetic analysis, we only used partially UDG-treated libraries with a minimum of
3% C→T substitutions as recommended by ref. 33. In cases where we used a fully UDG-
treated library for 390k analysis, we examined mitochondrial capture data from a non-UDG-
treated library made from the same extract, and verified that the non-UDG library had a
minimum of 10% C→T at the first nucleotide as recommended by ref. 38. Metrics for the
mitochondrial DNA analysis on each library are given in Online Table 1.
390k capture, sequence analysis and quality control
For 390k analysis, we restricted to reads that not only mapped to the human reference
genome hg19 but that also overlapped the 354,212 autosomal SNPs genotyped on the
Human Origins array4. We trimmed the last two nucleotides from each sequence because we
found that these are highly enriched in ancient DNA damage even for UDG-treated libraries.
We further restricted analyses to sites with base quality≥30.
We made no attempt to determine a diploid genotype at each SNP in each sample. Instead,
we used a single allele – randomly drawn from the two alleles in the individual – to
represent the individual at that site20,39. Specifically, we made an allele call at each target
SNP using majority rule over all sequences overlapping the SNP. When each of the possible
alleles was supported by an equal number of sequences, we picked an allele at random. We
set the allele to “no call” for SNPs at which there was no read coverage.
We restricted population genetic analysis to libraries with a minimum of 0.06-fold average
coverage on the 390k SNP targets, and for which there was an unambiguous sex
Haak et al. Page 10
Nature. Author manuscript; available in PMC 2016 October 04.
Author M
anuscriptA
uthor Manuscript
Author M
anuscriptA
uthor Manuscript
determination based on the ratio of X to Y chromosome reads (SI4) (Online Table 1). For
individuals for whom there were multiple libraries per sample, we performed a series of
quality control analysis. First, we used the ADMIXTURE software40,41 in supervised mode,
using Kharia, Onge, Karitiana, Han, French, Mbuti, Ulchi and Eskimo as reference
populations. We visually inspected the inferred ancestry components in each individual, and
removed individuals with evidence of heterogeneity in inferred ancestry components across
libraries. For all possible pairs of libraries for each sample, we also computed statistics of
the form D(Library1, Library2; Probe, Mbuti), where Probe is any of a panel of the same set
of eight reference populations), to determine whether there was significant evidence of the
Probe population being more closely related to one library from an ancient individual than
another library from that same individual. None of the individuals that we used had strong
evidence of ancestry heterogeneity across libraries. For samples passing quality control for
which there were multiple libraries per sample, we merged the sequences into a single BAM.
We called alleles on each merged BAM using the same procedure as for the individual
libraries. We used ADMIXTURE41 as well as PCA as implemented in EIGENSOFT42
(using the lsqproject: YES option to project the ancient samples) to visualize the genetic
relationships of each set of samples with the same culture label with respect to 777 diverse
present-day West Eurasians4. We visually identified outlier individuals, and renamed them
for analysis either as outliers or by the name of the site at which they were sampled
(Extended Data Table 1). We also identified two pairs of related individuals based on the
proportion of sites covered in pairs of ancient samples from the same population that had
identical allele calls using PLINK43. From each pair of related individuals, we kept the one
with the most SNPs.
Population genetic analyses
We determined genetic sex using the ratio of X and Y chromosome alignments44 (SI4), and
mitochondrial haplogroup for all samples (Supplementary Information section 2), and Y
chromosome haplogroup for the male samples (Supplementary Information section 4). We
studied population structure (Supplementary Information section 5, Supplementary
Information section 6). We used f-statistics to carry out formal tests of population
relationships (Supplementary Information section 6) and built explicit models of population
history consistent with the data (Supplementary Information section 7). We estimated
mixture proportions in a way that was robust to uncertainty about the exact population
history that applied (Supplementary Information section 8). We estimated the minimum
number of streams of migration into Europe needed to explain the data (Supplementary
Information section 9, Supplementary Information section 10). The estimated mixture
proportions shown in Fig. 3 were obtained using the lsqlin function of Matlab and the
optimization method described in Supplementary Information section 9 with 15 world
outgroups.
Haak et al. Page 11
Nature. Author manuscript; available in PMC 2016 October 04.
Author M
anuscriptA
uthor Manuscript
Author M
anuscriptA
uthor Manuscript
Extended Data
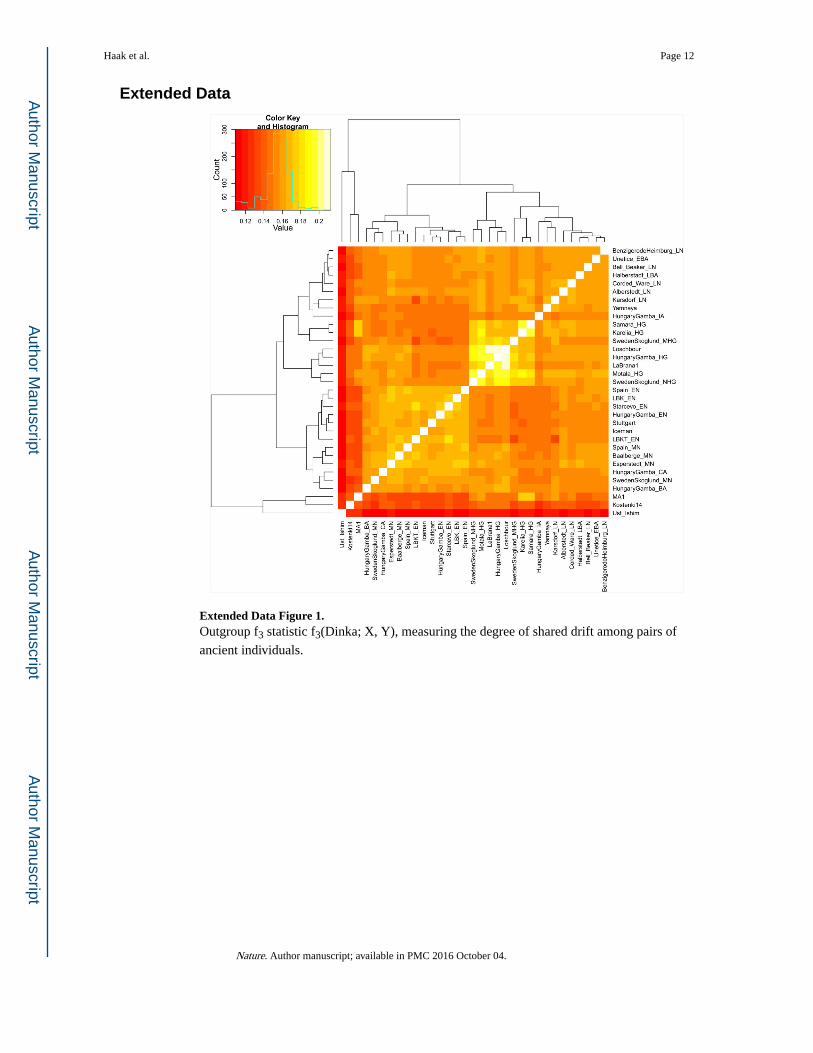
Extended Data Figure 1. Outgroup f3 statistic f3(Dinka; X, Y), measuring the degree of shared drift among pairs of
ancient individuals.
Haak et al. Page 12
Nature. Author manuscript; available in PMC 2016 October 04.
Author M
anuscriptA
uthor Manuscript
Author M
anuscriptA
uthor Manuscript
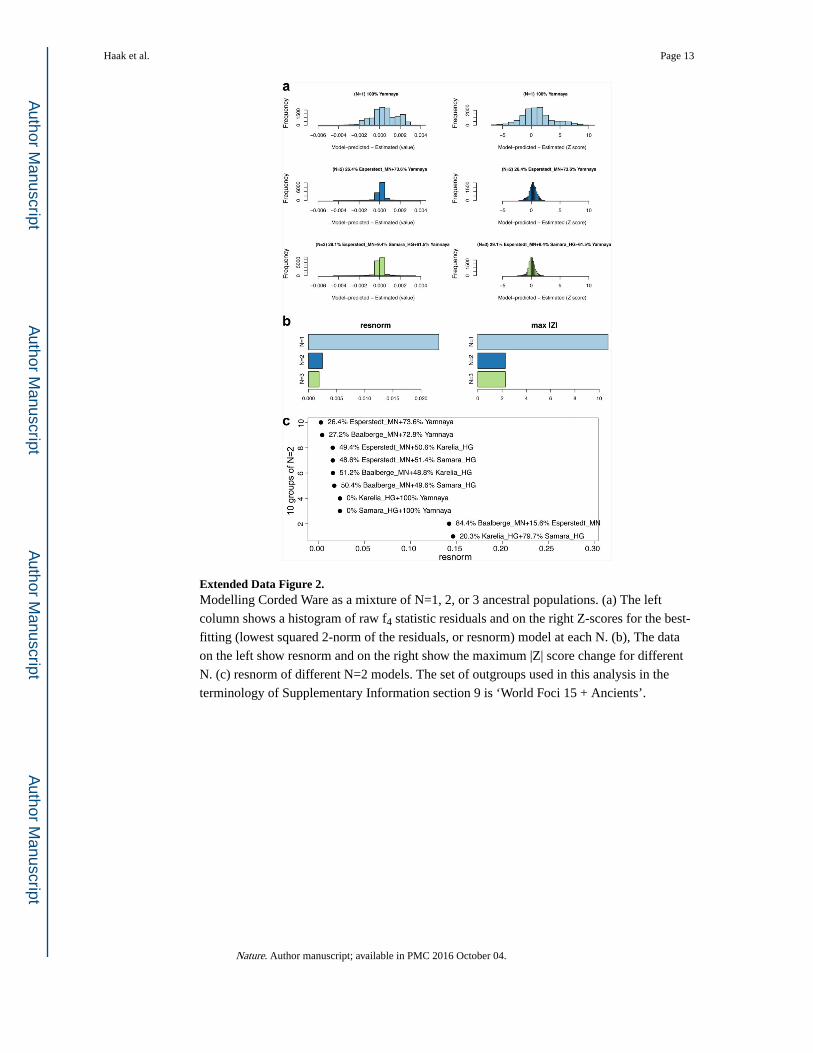
Extended Data Figure 2. Modelling Corded Ware as a mixture of N=1, 2, or 3 ancestral populations. (a) The left
column shows a histogram of raw f4 statistic residuals and on the right Z-scores for the best-
fitting (lowest squared 2-norm of the residuals, or resnorm) model at each N. (b), The data
on the left show resnorm and on the right show the maximum |Z| score change for different
N. (c) resnorm of different N=2 models. The set of outgroups used in this analysis in the
terminology of Supplementary Information section 9 is ‘World Foci 15 + Ancients’.
Haak et al. Page 13
Nature. Author manuscript; available in PMC 2016 October 04.
Author M
anuscriptA
uthor Manuscript
Author M
anuscriptA
uthor Manuscript
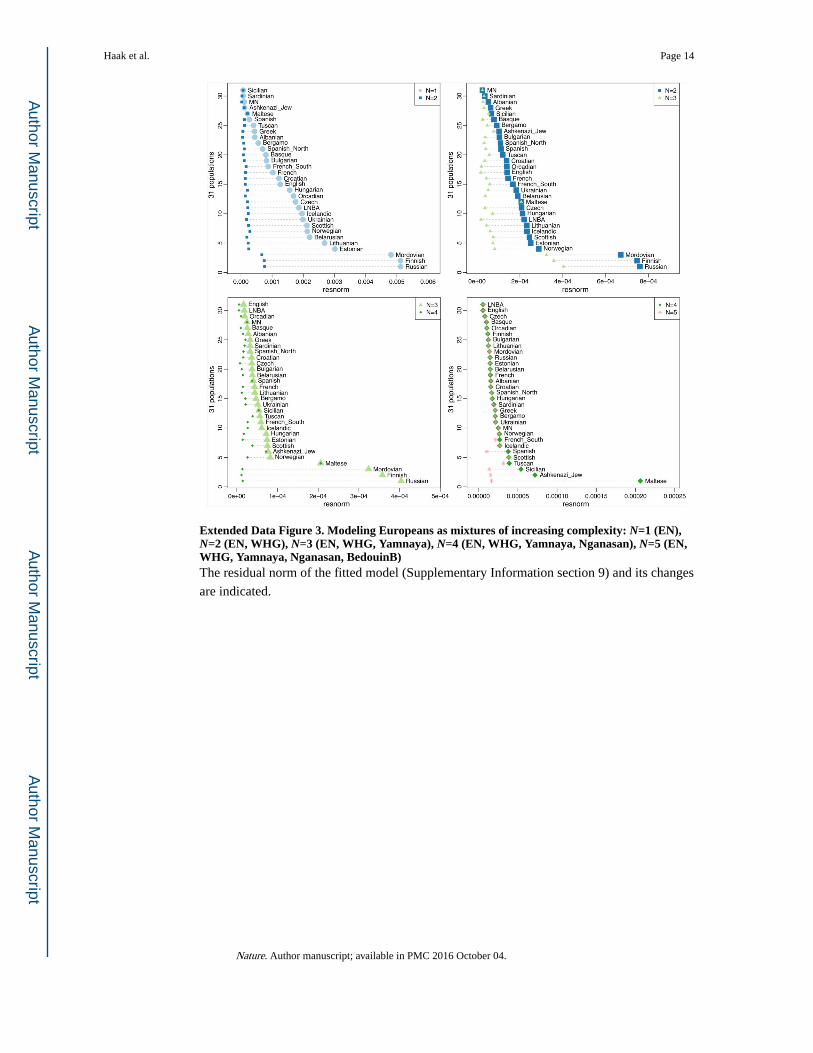
Extended Data Figure 3. Modeling Europeans as mixtures of increasing complexity: N=1 (EN), N=2 (EN, WHG), N=3 (EN, WHG, Yamnaya), N=4 (EN, WHG, Yamnaya, Nganasan), N=5 (EN, WHG, Yamnaya, Nganasan, BedouinB)The residual norm of the fitted model (Supplementary Information section 9) and its changes
are indicated.
Haak et al. Page 14
Nature. Author manuscript; available in PMC 2016 October 04.
Author M
anuscriptA
uthor Manuscript
Author M
anuscriptA
uthor Manuscript
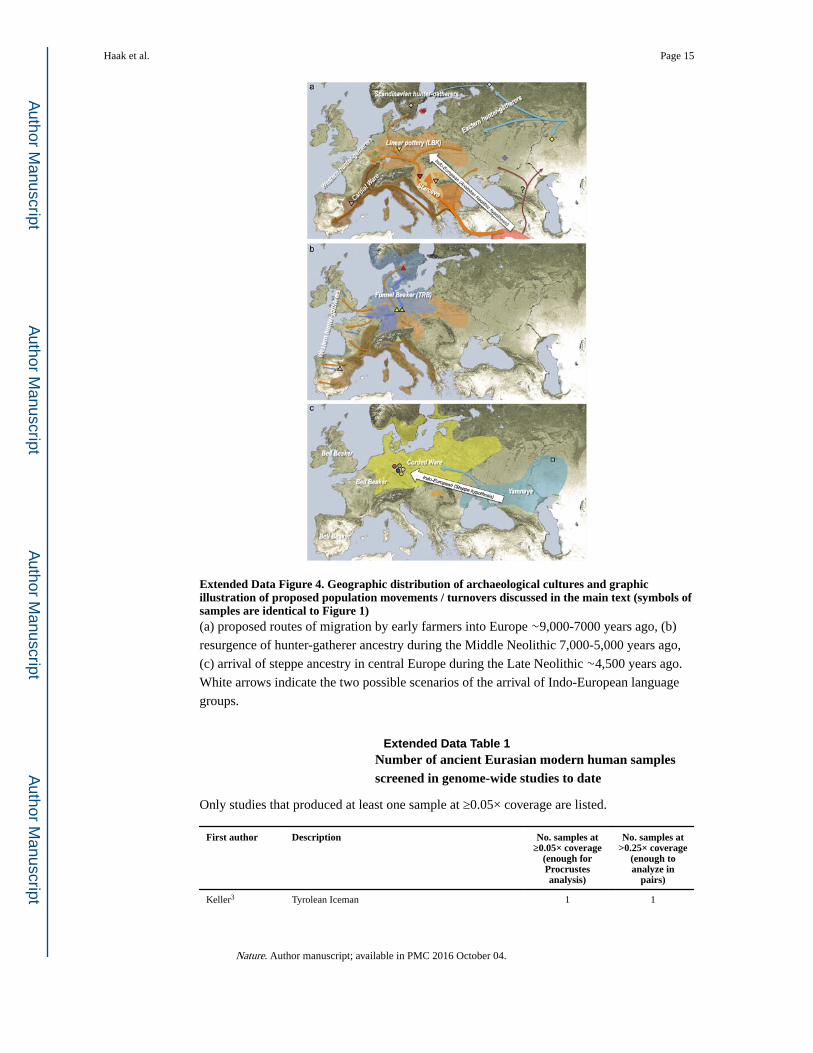
Extended Data Figure 4. Geographic distribution of archaeological cultures and graphic illustration of proposed population movements / turnovers discussed in the main text (symbols of samples are identical to Figure 1)(a) proposed routes of migration by early farmers into Europe ∼9,000-7000 years ago, (b)
resurgence of hunter-gatherer ancestry during the Middle Neolithic 7,000-5,000 years ago,
(c) arrival of steppe ancestry in central Europe during the Late Neolithic ∼4,500 years ago.
White arrows indicate the two possible scenarios of the arrival of Indo-European language
groups.
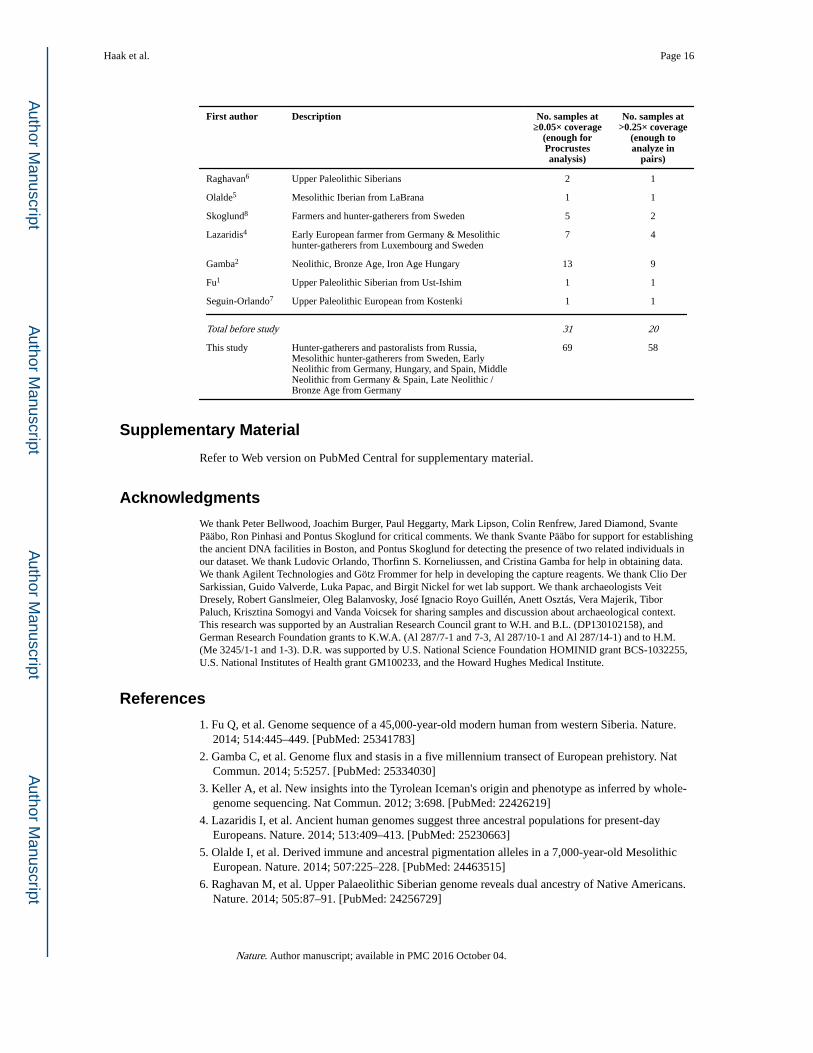
Extended Data Table 1Number of ancient Eurasian modern human samples screened in genome-wide studies to date
Only studies that produced at least one sample at ≥0.05× coverage are listed.
First author Description No. samples at ≥0.05× coverage
(enough for Procrustes analysis)
No. samples at >0.25× coverage
(enough to analyze in
pairs)
Keller3 Tyrolean Iceman 1 1
Haak et al. Page 15
Nature. Author manuscript; available in PMC 2016 October 04.
Author M
anuscriptA
uthor Manuscript
Author M
anuscriptA
uthor Manuscript
First author Description No. samples at ≥0.05× coverage
(enough for Procrustes analysis)
No. samples at >0.25× coverage
(enough to analyze in
pairs)
Raghavan6 Upper Paleolithic Siberians 2 1
Olalde5 Mesolithic Iberian from LaBrana 1 1
Skoglund8 Farmers and hunter-gatherers from Sweden 5 2
Lazaridis4 Early European farmer from Germany & Mesolithic hunter-gatherers from Luxembourg and Sweden
7 4
Gamba2 Neolithic, Bronze Age, Iron Age Hungary 13 9
Fu1 Upper Paleolithic Siberian from Ust-Ishim 1 1
Seguin-Orlando7 Upper Paleolithic European from Kostenki 1 1
Total before study 31 20
This study Hunter-gatherers and pastoralists from Russia, Mesolithic hunter-gatherers from Sweden, Early Neolithic from Germany, Hungary, and Spain, Middle Neolithic from Germany & Spain, Late Neolithic / Bronze Age from Germany
69 58
Supplementary Material
Refer to Web version on PubMed Central for supplementary material.
Acknowledgments
We thank Peter Bellwood, Joachim Burger, Paul Heggarty, Mark Lipson, Colin Renfrew, Jared Diamond, Svante Pääbo, Ron Pinhasi and Pontus Skoglund for critical comments. We thank Svante Pääbo for support for establishing the ancient DNA facilities in Boston, and Pontus Skoglund for detecting the presence of two related individuals in our dataset. We thank Ludovic Orlando, Thorfinn S. Korneliussen, and Cristina Gamba for help in obtaining data. We thank Agilent Technologies and Götz Frommer for help in developing the capture reagents. We thank Clio Der Sarkissian, Guido Valverde, Luka Papac, and Birgit Nickel for wet lab support. We thank archaeologists Veit Dresely, Robert Ganslmeier, Oleg Balanvosky, José Ignacio Royo Guillén, Anett Osztás, Vera Majerik, Tibor Paluch, Krisztina Somogyi and Vanda Voicsek for sharing samples and discussion about archaeological context. This research was supported by an Australian Research Council grant to W.H. and B.L. (DP130102158), and German Research Foundation grants to K.W.A. (Al 287/7-1 and 7-3, Al 287/10-1 and Al 287/14-1) and to H.M. (Me 3245/1-1 and 1-3). D.R. was supported by U.S. National Science Foundation HOMINID grant BCS-1032255, U.S. National Institutes of Health grant GM100233, and the Howard Hughes Medical Institute.
References
1. Fu Q, et al. Genome sequence of a 45,000-year-old modern human from western Siberia. Nature. 2014; 514:445–449. [PubMed: 25341783]
2. Gamba C, et al. Genome flux and stasis in a five millennium transect of European prehistory. Nat Commun. 2014; 5:5257. [PubMed: 25334030]
3. Keller A, et al. New insights into the Tyrolean Iceman's origin and phenotype as inferred by whole-genome sequencing. Nat Commun. 2012; 3:698. [PubMed: 22426219]
4. Lazaridis I, et al. Ancient human genomes suggest three ancestral populations for present-day Europeans. Nature. 2014; 513:409–413. [PubMed: 25230663]
5. Olalde I, et al. Derived immune and ancestral pigmentation alleles in a 7,000-year-old Mesolithic European. Nature. 2014; 507:225–228. [PubMed: 24463515]
6. Raghavan M, et al. Upper Palaeolithic Siberian genome reveals dual ancestry of Native Americans. Nature. 2014; 505:87–91. [PubMed: 24256729]
Haak et al. Page 16
Nature. Author manuscript; available in PMC 2016 October 04.
Author M
anuscriptA
uthor Manuscript
Author M
anuscriptA
uthor Manuscript
7. Seguin-Orlando A, et al. Genomic structure in Europeans dating back at least 36,200 years. Science. 2014; 346:1113–1118. [PubMed: 25378462]
8. Skoglund P, et al. Genomic Diversity and Admixture Differs for Stone-Age Scandinavian Foragers and Farmers. Science. 2014; 344:747–750. [PubMed: 24762536]
9. Anthony, DW. The Horse, the Wheel, and Language: How Bronze-Age Riders from the Eurasian Steppes Shaped the Modern World. Princeton University Press; 2007.
10. Fu Q, et al. DNA analysis of an early modern human from Tianyuan Cave, China. Proc Natl Acad Sci USA. 2013; 110:2223–2227. [PubMed: 23341637]
11. Rohland N, Harney E, Mallick S, Nordenfelt S, Reich D. Partial uracil–DNA–glycosylase treatment for screening of ancient DNA. Philosophical Transactions of the Royal Society of London B: Biological Sciences. 2014; 370
12. Patterson N, et al. Ancient admixture in human history. Genetics. 2012; 192:1065–1093. [PubMed: 22960212]
13. Fu Q, et al. A Revised Timescale for Human Evolution Based on Ancient Mitochondrial Genomes. Curr Biol. 2013; 23:553–559. [PubMed: 23523248]
14. Brandt G, et al. Ancient DNA reveals key stages in the formation of central European mitochondrial genetic diversity. Science. 2013; 342:257–261. [PubMed: 24115443]
15. Der Sarkissian C, et al. Ancient DNA reveals prehistoric gene-flow from Siberia in the complex human population history of North East Europe. PLoS Genet. 2013; 9:e1003296. [PubMed: 23459685]
16. Briggs AW, et al. Removal of deaminated cytosines and detection of in vivo methylation in ancient DNA. Nucleic Acids Res. 2010; 38:e87–e87. [PubMed: 20028723]
17. Briggs AW, et al. Patterns of damage in genomic DNA sequences from a Neandertal. Proceedings of the National Academy of Sciences. 2007; 104:14616–14621.
18. Myres NM, et al. A major Y-chromosome haplogroup R1b Holocene era founder effect in Central and Western Europe. Eur J Hum Genet. 2011; 19:95–101. [PubMed: 20736979]
19. Underhill PA, et al. The phylogenetic and geographic structure of Y-chromosome haplogroup R1a. Eur J Hum Genet. 2014
20. Skoglund P, et al. Origins and genetic legacy of Neolithic farmers and hunter-gatherers in Europe. Science. 2012; 336:466–469. [PubMed: 22539720]
21. Czebreszuk, J. Ancient Europe, 8000 BC to AD 1000: Encyclopedia of the Barbarian World. Bogucki, PI.; Crabtree, PJ., editors. Charles Scribners & Sons; 2003. p. 467-475.
22. Lipson M, et al. Efficient moment-based inference of admixture parameters and sources of gene flow. Mol Biol Evol. 2013; 30:1788–1802. [PubMed: 23709261]
23. Szécsényi-Nagy A, et al. Tracing the genetic origin of Europe's first farmers reveals insights into their social organization. bioRxiv. 2014
24. Haak W, et al. Ancient DNA from European early Neolithic farmers reveals their Near Eastern affinities. PLoS Biol. 2010; 8:e1000536. [PubMed: 21085689]
25. Hellenthal G, et al. A genetic atlas of human admixture history. Science. 2014; 343:747–751. [PubMed: 24531965]
26. Ralph P, Coop G. The geography of recent genetic ancestry across Europe. PLoS Biol. 2013; 11:e1001555. [PubMed: 23667324]
27. Renfrew, C. Archaeology and Language: The Puzzle of Indo-European Origins. Pimlico: 1987.
28. Bellwood, P. First Farmers: The Origins of Agricultural Societies. Wiley-Blackwell; 2004.
29. Gamkrelidze TV, Ivanov VV. The Early History of Indo-European Languages. Sci Am. 1990; 262:110–116.
30. Mallory, JP. In Search of the Indo-Europeans: Language, Archaeology and Myth. Thames and Hudson: 1991.
31. Kircher M, Sawyer S, Meyer M. Double indexing overcomes inaccuracies in multiplex sequencing on the Illumina platform. Nucleic Acids Res. 2012; 40:e3–e3. [PubMed: 22021376]
32. Meyer M, et al. A mitochondrial genome sequence of a hominin from Sima de los Huesos. Nature. 2014; 505:403–406. [PubMed: 24305051]
Haak et al. Page 17
Nature. Author manuscript; available in PMC 2016 October 04.
Author M
anuscriptA
uthor Manuscript
Author M
anuscriptA
uthor Manuscript
33. Rohland N, Harney E, Mallick S, Nordenfelt S, Reich D. Partial uracil–DNA–glycosylase treatment for screening of ancient DNA. Philosophical Transactions of the Royal Society of London B: Biological Sciences. 2014; 370
34. Rohland N, Reich D. Cost-effective, high-throughput DNA sequencing libraries for multiplexed target capture. Genome Res. 2012; 22:939–946. [PubMed: 22267522]
35. Li H, Durbin R. Fast and accurate short read alignment with Burrows–Wheeler transform. Bioinformatics. 2009; 25:1754–1760. [PubMed: 19451168]
36. Behar DM, et al. A “Copernican” Reassessment of the Human Mitochondrial DNA Tree from its Root. Am J Hum Genet. 2012; 90:675–684. [PubMed: 22482806]
37. Lassmann T, Sonnhammer ELL. Kalign – an accurate and fast multiple sequence alignment algorithm. BMC Bioinformatics. 2005; 6:298–298. [PubMed: 16343337]
38. Sawyer S, Krause J, Guschanski K, Savolainen V, Pääbo S. Temporal patterns of nucleotide misincorporations and DNA fragmentation in ancient DNA. PLoS ONE. 2012; 7:e34131. [PubMed: 22479540]
39. Green RE, et al. A Draft Sequence of the Neandertal Genome. Science. 2010; 328:710–722. [PubMed: 20448178]
40. Alexander D, Lange K. Enhancements to the ADMIXTURE algorithm for individual ancestry estimation. BMC Bioinformatics. 2011; 12:246. [PubMed: 21682921]
41. Alexander DH, Novembre J, Lange K. Fast model-based estimation of ancestry in unrelated individuals. Genome Res. 2009; 19:1655–1664. [PubMed: 19648217]
42. Reich D, Price AL, Patterson N. Principal component analysis of genetic data. Nat Genet. 2008; 40:491–492. [PubMed: 18443580]
43. Purcell S, et al. PLINK: a tool set for whole-genome association and population-based linkage analyses. Am J Hum Genet. 2007; 81:559–575. [PubMed: 17701901]
44. Skoglund P, Storå J, Götherström A, Jakobsson M. Accurate sex identification of ancient human remains using DNA shotgun sequencing. J Archaeol Sci. 2013; 40:4477–4482.
Haak et al. Page 18
Nature. Author manuscript; available in PMC 2016 October 04.
Author M
anuscriptA
uthor Manuscript
Author M
anuscriptA
uthor Manuscript
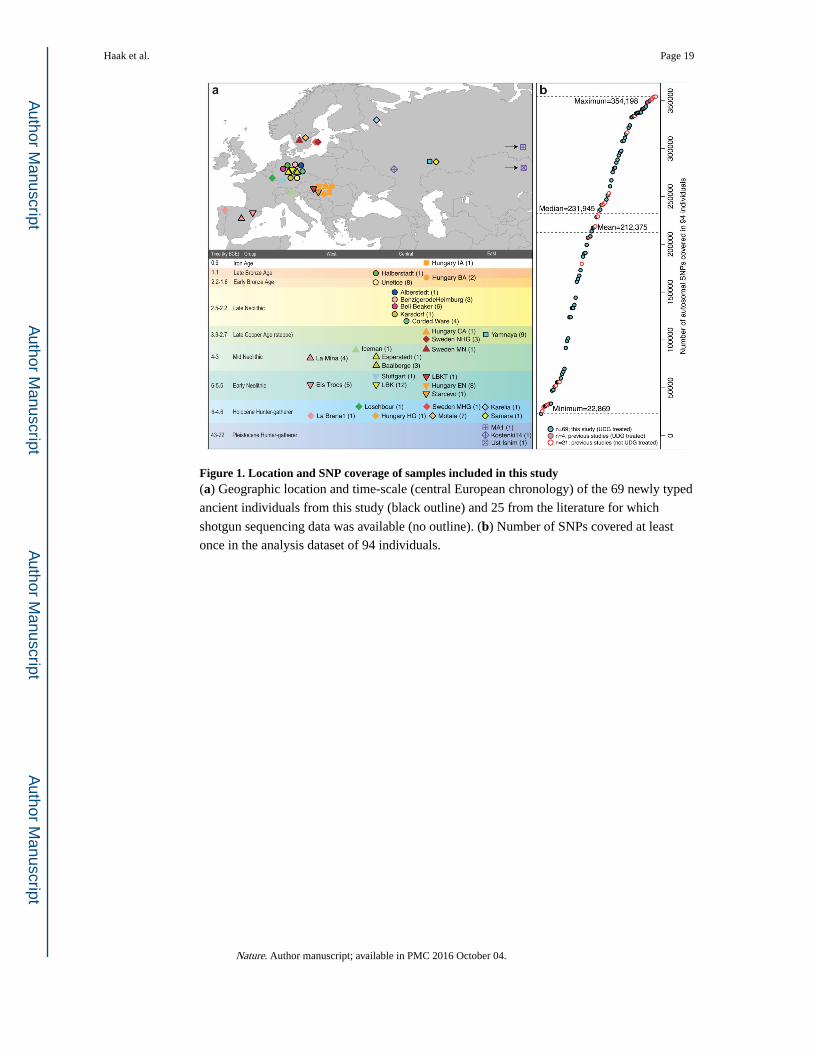
Figure 1. Location and SNP coverage of samples included in this study(a) Geographic location and time-scale (central European chronology) of the 69 newly typed
ancient individuals from this study (black outline) and 25 from the literature for which
shotgun sequencing data was available (no outline). (b) Number of SNPs covered at least
once in the analysis dataset of 94 individuals.
Haak et al. Page 19
Nature. Author manuscript; available in PMC 2016 October 04.
Author M
anuscriptA
uthor Manuscript
Author M
anuscriptA
uthor Manuscript
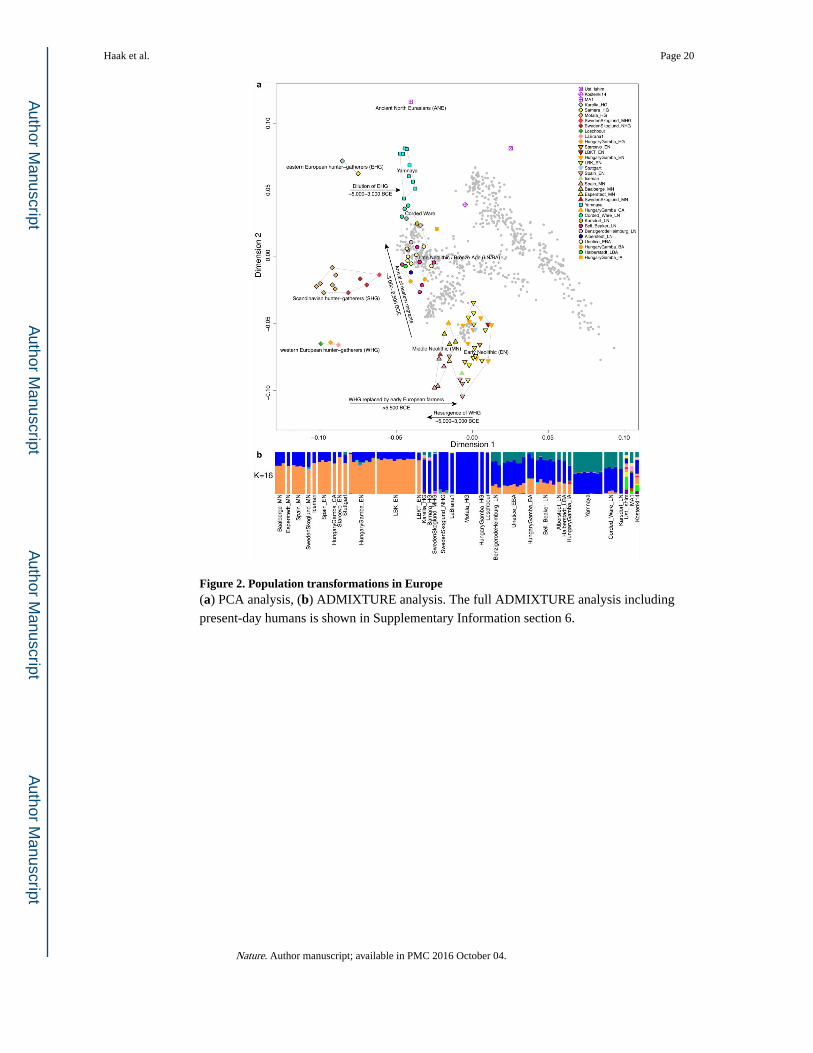
Figure 2. Population transformations in Europe(a) PCA analysis, (b) ADMIXTURE analysis. The full ADMIXTURE analysis including
present-day humans is shown in Supplementary Information section 6.
Haak et al. Page 20
Nature. Author manuscript; available in PMC 2016 October 04.
Author M
anuscriptA
uthor Manuscript
Author M
anuscriptA
uthor Manuscript
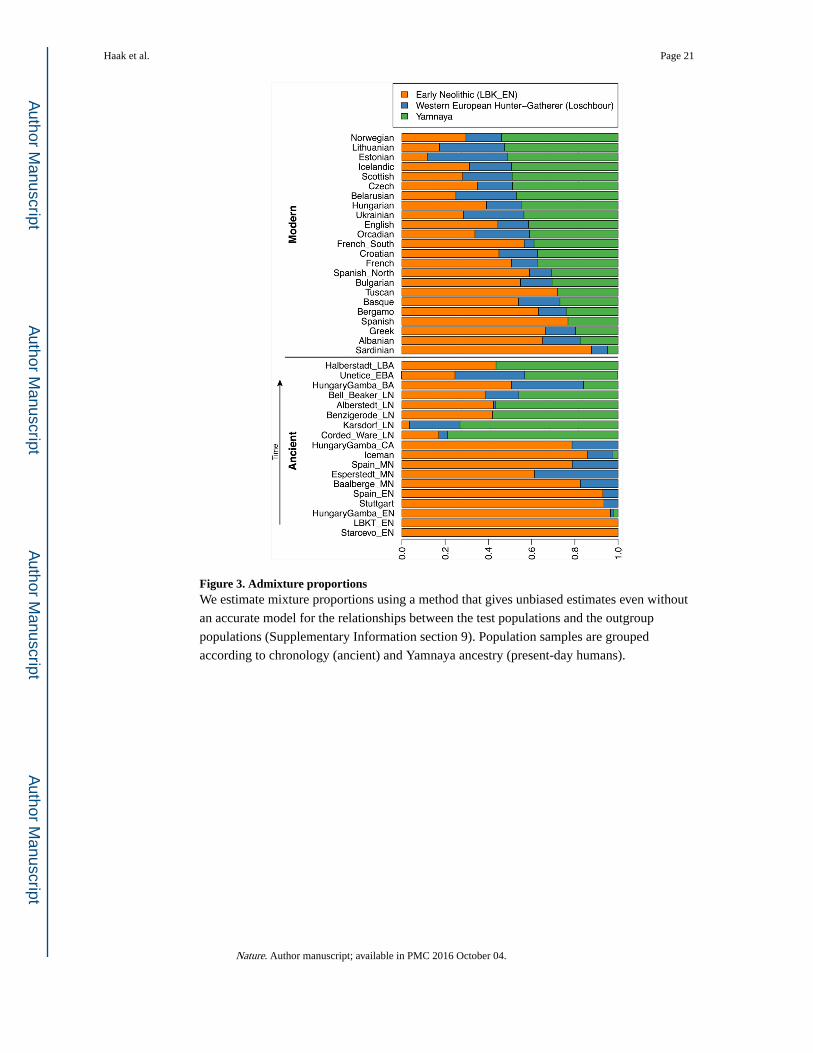
Figure 3. Admixture proportionsWe estimate mixture proportions using a method that gives unbiased estimates even without
an accurate model for the relationships between the test populations and the outgroup
populations (Supplementary Information section 9). Population samples are grouped
according to chronology (ancient) and Yamnaya ancestry (present-day humans).
Haak et al. Page 21
Nature. Author manuscript; available in PMC 2016 October 04.
Author M
anuscriptA
uthor Manuscript
Author M
anuscriptA
uthor Manuscript