MONTPELLIER SUPAGRO Institut des régions … · JIMÉNEZ ELIZONDO a bénéficié d’une bourse de...
217
MONTPELLIER SUPAGRO Institut des régions chaudes THÈSE Pour obtenir le grade de DOCTEUR DE MONTPELLIER SUPAGRO Formation doctorale : Génie des procédés École doctorale : Sciences des Procédés – Sciences des Aliments Présentée et soutenue publiquement par Nadiarid JIMÉNEZ ELIZONDO Le 13 décembre 2011 Titre Impact des opérations thermiques agroalimentaires à hautes températures sur la dégradation des anthocyanes : Caractérisation et modélisation des cinétiques réactionnelles Jury Mme. Xuân-Mi MEYER Professeur, ENSIACET, Toulouse Rapporteur M. Gilles TRYSTRAM Professeur, AgroParisTech, Massy Rapporteur M. Olivier DANGLES Professeur, Université d’Avignon Examinateur M. Philippe BOHUON Maître de conférences, Montpellier SupAgro Examinateur M. Fabrice VAILLANT Chercheur, CIRAD-CITA, Costa Rica Directeur de thèse
Transcript of MONTPELLIER SUPAGRO Institut des régions … · JIMÉNEZ ELIZONDO a bénéficié d’une bourse de...
MONTPELLIER SUPAGRO Institut des régions chaudes
THÈSE Pour obtenir le grade de
DOCTEUR DE MONTPELLIER SUPAGRO
Formation doctorale : Génie des procédés
École doctorale : Sciences des Procédés – Sciences des Aliments
Présentée et soutenue publiquement
par
Nadiarid JIMÉNEZ ELIZONDO
Le 13 décembre 2011
Titre
Impact des opérations thermiques agroalimentaires à hautes
températures sur la dégradation des anthocyanes :
Caractérisation et modélisation des cinétiques réactionnelles
Jury
Mme. Xuân-Mi MEYER Professeur, ENSIACET, Toulouse Rapporteur
M. Gilles TRYSTRAM Professeur, AgroParisTech, Massy Rapporteur
M. Olivier DANGLES Professeur, Université d’Avignon Examinateur
M. Philippe BOHUON Maître de conférences, Montpellier SupAgro Examinateur
M. Fabrice VAILLANT Chercheur, CIRAD-CITA, Costa Rica Directeur de thèse

MONTPELLIER SUPAGRO Institut des régions chaudes
THÈSE Pour obtenir le grade de
DOCTEUR DE MONTPELLIER SUPAGRO
Formation doctorale : Génie des procédés
École doctorale : Science des Procédés – Sciences des Aliments
Présentée et soutenue publiquement
par
Nadiarid JIMÉNEZ ELIZONDO
Le 13 décembre 2011
Titre
Impact des opérations thermiques agroalimentaires à hautes
températures sur la dégradation des anthocyanes :
Caractérisation et modélisation des cinétiques réactionnelles
Jury
Mme. Xuân-Mi MEYER Professeur, ENSIACET, Toulouse Rapporteur
M. Gilles TRYSTRAM Professeur, AgroParisTech, Massy Rapporteur
M. Olivier DANGLES Professeur, Université d’Avignon Examinateur
M. Philippe BOHUON Maître de conférences, Montpellier SupAgro Examinateur
M. Fabrice VAILLANT Chercheur, CIRAD-CITA, Costa Rica Directeur de thèse
i
À ma famille, pour leur soutien inestimable
À Ricardo, à qui je dois tout mon bonheur
ii
Remerciements
Ce travail a été effectué dans le cadre d’un Projet Européen No. FP6-0015279. Nadiarid
JIMÉNEZ ELIZONDO a bénéficié d’une bourse de thèse octroyée par l’Université du
Costa Rica et le Centre Culturel et de Coopération pour l’Amérique Centrale du
Ministère des Affaires Étrangères de France.
Il a été effectué au CIRAD (Centre de Coopération Internationale en Recherche
Agronomique pour le Développement) au sein de l’Équipe 3, Procédés de stabilisation
et de transformation (UMR Qualisud, Démarche intégrée pour l’obtention d’aliments de
qualité) sous la direction du M. Fabrice VAILLANT, et a été co-encadré par
M. Philippe BOHUON, maître de conférences à Montpellier SupAgro.
Je leur exprime toute ma gratitude pour m’avoir guidé dans mon travail de recherche, et
pour la confiance qu’ils m’ont témoignée au cours de ces années.
Mes sincères remerciements s’adressent aux membres du Jury qui ont accepté de juger
ce travail :
Mme. Meyer, Professeur à l’ENSIACET, Toulouse
M. Trystram, Professeur à AgroParisTech, Massy
M. Dangles, Professeur à l’Université d’Avignon
Je tiens à remercier le personnel du Département PERSYST (Performances des
Systèmes de Production et de Transformation Tropicaux), ainsi que mes collègues de
travail avec lesquels j’ai partagé ces années, pour avoir rendu mon séjour à Montpellier
agréable et le travail convivial.
iii
Les résultats de ce travail ont été ou vont être publiés sous forme d’articles :
Jiménez, N.; Ribeiro, J.; Bohuon, P.; Dornier, M.; Perez, A.M.; Vaillant, F. “Kinetic of
anthocyanin degradation and browning in reconstituted blackberry juice treated at high
temperatures (100–180 ºC)”. Journal of Agricultural and Food Chemistry, 2010, 58,
2314–2322.
Jiménez, N.; Bohuon, P.; Dornier, M.; Bonazzi, C.; Perez, A.M.; Vaillant, F. “Effect of
Water Activity on Anthocyanin Degradation and Browning Kinetics at High
Temperatures (100–140 ºC)”. Food Research International, 2012, 47, 106-115.
Jiménez, N.; Bohuon, P.; Dornier, M.; Vaillant, F. 3D “Modeling of a reactor to
estimate degradation kinetic parameters of anthocyanins at different water activities
during heat treatment (25–140 ºC)”. Journal of Food Engineering. (Soumise)
Jiménez, N.; Bohuon, P.; Dornier, M.; Soto, M.; Perez, A.M.; Vaillant, F. “Coupling of
osmotic dehydration and heat treatment in green papaya impregnated with blackberry
juice solution”. LWT – Food Science and Technology. (Soumise)
Jiménez, N.; Bassama, J.; Bohuon, P.; Vaillant, F. “Impact of Heat and Mass Transfer
on Anthocyanin Degradation during Deep Fat Frying”. En préparation pour soumission
au Journal of Food Engineering.
Jiménez, N.; Bohuon, P.; Dornier, M.; Bonazzi, C.; Vaillant, F. “Interest of modeling
heat transfer inside a reactor to estimate kinetic parameters”. In: Proceedings of 11th
International Congress on Engineering and Food (ICEF11). May 22-26, 2011. Athens,
Greece. http://www.icef11.org/content/papers/mfs/MFS477.pdf
Lima, J.; Jiménez, N.; Bohuon, P. “Kinetics of ascorbic acid degradation and colour
change in ground cashew apples treated at high temperatures (100–180 ºC)”.
International Journal of Food Science and Technology, 2010, 45, 1724–1731.
iv
Table de Matières
Table de Matières ............................................................................................................ iv
Liste des Tableaux ............................................................................................................ x
Liste des Figures ............................................................................................................. xii
Liste des Abréviations ................................................................................................... xix
Chapitre I : Introduction générale ..................................................................................... 1
Chapitre II : Matériels et Méthodes .................................................................................. 9
1 Matériels ............................................................................................................... 9
1.1 Matières premières et produits chimiques .................................................... 9
1.2 Préparation du jus de mûre reconstitué....................................................... 10
1.3 Préparation du système jus de mûre sable de Fontainebleau .................. 11
1.4 Préparation des échantillons à différentes activités de l’eau ...................... 11
2 Equipements et protocoles de traitement ............................................................ 12
2.1 Traitement thermique en réacteur fermé .................................................... 12
2.1.1 Le réacteur fermé .................................................................................... 12
2.1.2 Traitement thermique en cellule ............................................................. 13
2.2 Traitement de papaye verte par DII ............................................................ 13
2.2.1 Déshydratation-imprégnation par immersion (DII) ................................ 14
2.3 Friture de papaye verte formulée ................................................................ 15
2.4 Protocoles d’extraction ............................................................................... 16
2.4.1 Protocole d’extraction des échantillons du jus de mûre reconstitué ....... 16
2.4.2 Protocole d’extraction des échantillons du système jus de mûresable . 16
2.4.3 Extraction des échantillons de papaye verte formulé par DII ................ 16
2.4.4 Protocole d’extraction des échantillons frits .......................................... 17
3 Méthodes de mesures ......................................................................................... 18
3.1 Analyses physico-chimiques ...................................................................... 18
3.1.1 Dosage des anthocyanes par la méthode du différentiel du pH .............. 18
3.1.2 Dosage des anthocyanes par CLHP ........................................................ 19
3.1.3 Détermination de l’indice de brunissement non enzymatique................ 20
3.1.4 Détermination de la teneur en eau .......................................................... 20
v
3.1.5 Identification du 5- hydroxyméthyl furfural par analyse GC-MS .......... 20
3.1.6 Détermination de la capacité antioxydante par la méthode ORAC ........ 21
3.1.7 Dosage des polyphénols totaux .............................................................. 22
3.2 Mesures thermophysiques .......................................................................... 22
3.2.1 Détermination de la masse volumique.................................................... 22
3.2.2 Détermination de la porosité .................................................................. 22
3.2.3 Détermination de la capacité thermique massique ................................. 23
3.2.4 Détermination de la conductivité thermique .......................................... 23
3.2.5 Détermination de l’activité de l’eau ....................................................... 24
3.2.6 Détermination de l’isotherme de sorption .............................................. 25
3.2.7 Température ............................................................................................ 25
4 Expressions et analyses des résultats .................................................................. 26
4.1 Transfert de matière lors de la DII.............................................................. 26
4.2 Analyse de la cinétique de dégradation des anthocyanes et du BNE ......... 26
4.2.1 Les modèles cinétiques ........................................................................... 27
4.2.2 Identification des paramètres cinétiques................................................. 28
5 Modélisation des réactions de dégradation couplée aux transferts..................... 29
5.1 Cas des transferts d’énergie dans la cellule de réaction ............................. 29
5.1.1 Formulation du modèle ........................................................................... 29
5.1.2 Résolution numérique ............................................................................. 30
5.1.3 Estimation des paramètres du modèle de transfert de chaleur................ 30
5.1.4 Estimation des paramètres du modèle cinétique réactionnelle ............... 31
5.1.5 Analyse statistique .................................................................................. 31
5.2 Cas du traitement thermique de la papaye après DII .................................. 32
5.2.1 Construction d’un plan d’expériences pour la DII ................................. 32
5.2.2 Simulation de la dégradation des anthocyanes à haute température ...... 33
5.3 Cas des transferts d’énergie et d’eau lors de la friture ............................... 35
5.3.1 Formulation du modèle ........................................................................... 36
5.3.2 Le modèle de friture ............................................................................... 36
5.3.3 Résolution numérique ............................................................................. 37
Chapitre III : Résultats .................................................................................................... 39

vi
6 Publication #1 : Cinétiques de dégradation des anthocyanes et brunissement non
enzymatique dans un jus de mûre reconstitué traité à haute température (100–180 °C)
40
6.1 Introduction ................................................................................................ 43
6.2 Materials and methods ................................................................................ 45
6.2.1 Blackberry juice ...................................................................................... 45
6.2.2 Preparing reconstituted blackberry juice ................................................ 45
6.2.3 Heating device and conditions ................................................................ 45
6.2.4 Analytical methods ................................................................................. 47
6.2.5 Repeatability of the heat treatment and subsequent physicochemical
analyses ............................................................................................................... 49
6.2.6 Kinetic model development .................................................................... 49
6.3 Results and discussion ................................................................................ 52
6.3.1 Initial characteristics of reconstituted blackberry juice .......................... 53
6.3.2 Kinetic parameter estimation .................................................................. 53
6.3.3 Monomeric anthocyanin content ............................................................ 56
6.3.4 Non-enzymatic browning ....................................................................... 59
6.3.5 Model applications ................................................................................. 60
7 Publication #2 : Effet de l’activité d’eau dans les cinétiques de dégradation
d’anthocyanes et brunissement à haute température (100–140 ºC) ............................ 63
7.1 Introduction ................................................................................................ 66
7.2 Materials and methods ................................................................................ 68
7.2.1 Blackberry juice ...................................................................................... 68
7.2.2 Preparation of blackberry juice - quartz sand samples ........................... 68
7.2.3 Determination of the moisture sorption isotherm ................................... 69
7.2.4 Sample preparation at different water activities ..................................... 69
7.2.5 Heating device and conditions ................................................................ 70
7.2.6 Blackberry juice–quartz sand sample extraction .................................... 71
7.2.7 Analytical methods ................................................................................. 71
7.2.8 Kinetic model development .................................................................... 73
7.3 Results and discussion ................................................................................ 76
vii
7.3.1 Characteristics of the blackberry juice–quartz sand system ................... 76
7.3.2 Kinetic parameter estimation .................................................................. 76
7.3.3 Anthocyanin degradation kinetics .......................................................... 77
7.3.4 Effect of water activity on anthocyanin degradation .............................. 78
7.3.5 Non-enzymatic browning kinetics. ......................................................... 80
7.3.6 Effect of water activity on non-enzymatic browning ............................. 81
7.3.7 Hypothetical effect of water activity on the interaction between
anthocyanin degradation and NEB kinetics at high temperature ....................... 82
7.4 Conclusions ................................................................................................ 83
7.5 Acknowledgments ...................................................................................... 83
8 Publication #3 : Modélisation d’un réacteur en 3D pour estimer les paramètres
de la cinétique de dégradation des anthocyanes à différentes activités d’eau pendant le
traitement thermique (25140 ºC). ............................................................................. 84
8.1 Introduction ................................................................................................ 87
8.2 Materials and methods ................................................................................ 88
8.2.1 Materials ................................................................................................. 88
8.2.2 Heating device and conditions ................................................................ 89
8.2.3 Analytical methods ................................................................................. 90
8.2.4 Reactor model ......................................................................................... 91
8.3 Results and discussion ................................................................................ 98
8.3.1 Characteristics of the blackberry juice–quartz sand system ................... 98
8.3.2 Heat transfer phenomena inside the reactor ........................................... 99
8.3.3 Estimates of kinetic parameters ............................................................ 101
8.4 Conclusions .............................................................................................. 108
8.5 Acknowledgments .................................................................................... 108
9 Publication #4 : Couplage de la déshydratation-imprégnation par immersion et la
stérilisation de papaye verte imprégnée d’une solution de jus de mûre ................... 109
9.1 Introduction .............................................................................................. 112
9.2 Materials and methods .............................................................................. 113
9.2.1 Materials ............................................................................................... 113
9.2.2 Sample preparation and osmotic dehydration ...................................... 114

viii
9.2.3 Extraction of phenolic compounds ....................................................... 115
9.2.4 Analytical methods ............................................................................... 116
9.2.5 Expression of responses ....................................................................... 116
9.2.6 Kinetics of mass transfer ...................................................................... 117
9.2.7 Experimental design and statistical analysis ........................................ 117
9.2.8 Numerical estimation of anthocyanin degradation during high-
temperature treatment ....................................................................................... 119
9.3 Results and discussion .............................................................................. 121
9.3.1 Kinetics of osmotic dehydration ........................................................... 121
9.3.2 Experimental design ............................................................................. 123
9.3.3 Simulation of high-temperature treatment ............................................ 125
9.4 Conclusions .............................................................................................. 127
9.5 Acknowledgments .................................................................................... 127
10 Publication #5 : Impact des transferts d’énergie et matière sur la dégradation des
anthocyanes au cours de la friture ............................................................................ 128
10.1 Introduction .............................................................................................. 131
10.2 Materials and methods .............................................................................. 133
10.2.1 Materials ........................................................................................... 133
10.2.2 Sample preparation and deep-fat frying ........................................... 133
10.2.3 Analytical methods ........................................................................... 134
10.2.4 Kinetics of deep-fat frying ................................................................ 135
10.2.5 Modeling of frying coupled with anthocyanin degradation kinetics 136
10.3 Results and discussion .............................................................................. 139
10.3.1 Preliminary considerations ............................................................... 139
10.3.2 Model validation ............................................................................... 140
10.3.3 Sensitivity analysis of the model ...................................................... 143
10.3.4 Understanding the anthocyanin degradation mechanisms during frying
146
10.3.5 Coupling analysis between osmotic dehydration and frying for green
papaya – blackberry chips ................................................................................ 148
Chapitre IV: Résultats complémentaires et discussion générale .................................. 153

ix
11 Construction d’une base de données expérimentales et étude cinétique de la
dégradation des anthocyanes .................................................................................... 154
11.1 Le réacteur fermé pour l’étude cinétique .................................................. 154
11.2 Validation d’une méthode rapide et semi-automatisée du dosage des
anthocyanes .......................................................................................................... 156
11.3 Analyse des polyphénols totaux et de la capacité antioxydante ............... 157
11.4 Choix du modèle cinétique ....................................................................... 158
11.5 Identification des paramètres cinétiques................................................... 158
11.5.1 Milieu liquide ................................................................................... 159
11.5.2 Milieu modèle bi-phasique ............................................................... 161
11.5.3 Intervalle de confiance des paramètres ............................................. 164
12 Mécanismes de dégradation thermique des anthocyanes ................................. 166
12.1 Effet de la température ............................................................................. 166
12.2 Effet de l’oxygène dissous ........................................................................ 167
12.3 Effet de l’activité d’eau ............................................................................ 168
12.4 Effet du sucre ajouté ................................................................................. 170
13 Comment construire un procédé séquentiel de formulation suivi d’un traitement
à haute température ? ................................................................................................ 172
13.1 La formulation d’anthocyanes par DII ..................................................... 172
13.2 La DII suivie d’une stérilisation ............................................................... 173
13.3 La DII suivie d’une friture ........................................................................ 175
13.4 Pertinence de la démarche de modélisation .............................................. 179
13.4.1 Les milieux modèles ......................................................................... 179
13.4.2 Modèle cinétique de dégradation ...................................................... 179
13.4.3 Modèle de friture .............................................................................. 180
Chapitre V : Conclusion générale et perspectives ........................................................ 181
Références bibliographiques......................................................................................... 184
x
Liste des Tableaux
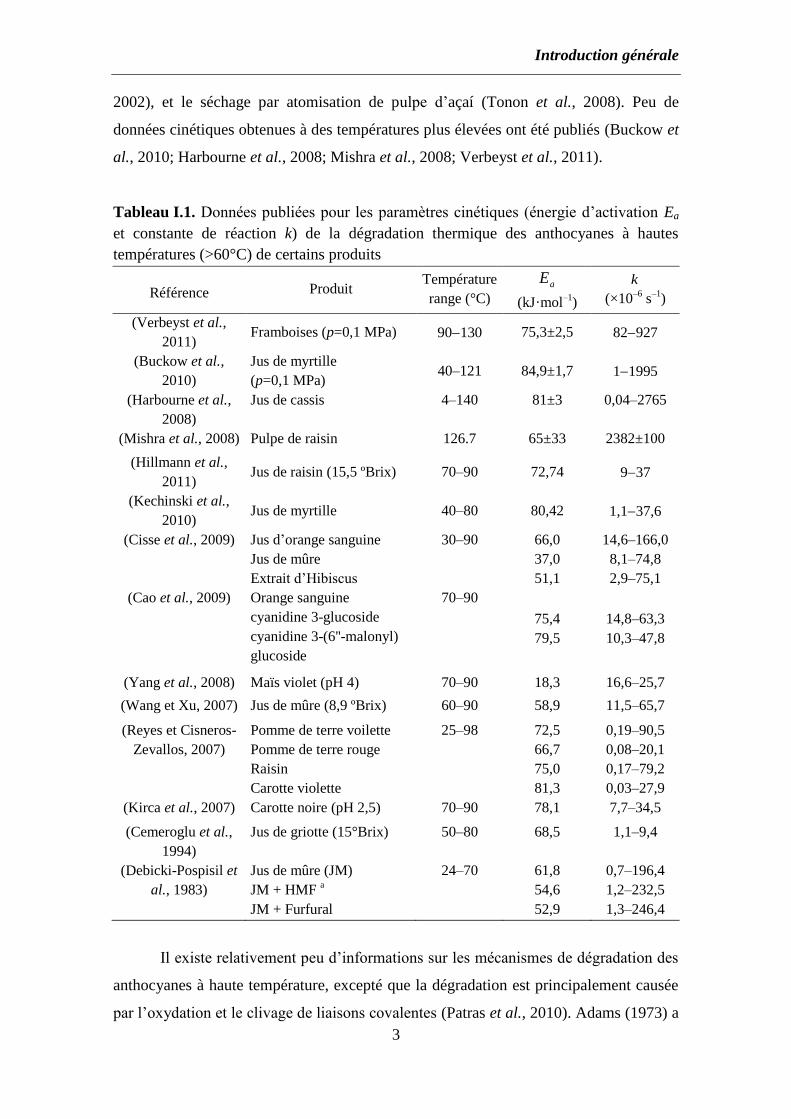
Tableau I.1. Données publiées pour les paramètres cinétiques (énergie d’activation Ea
et constante de réaction k) de la dégradation thermique des anthocyanes à hautes
températures (>60°C) de certains produits ....................................................................... 3
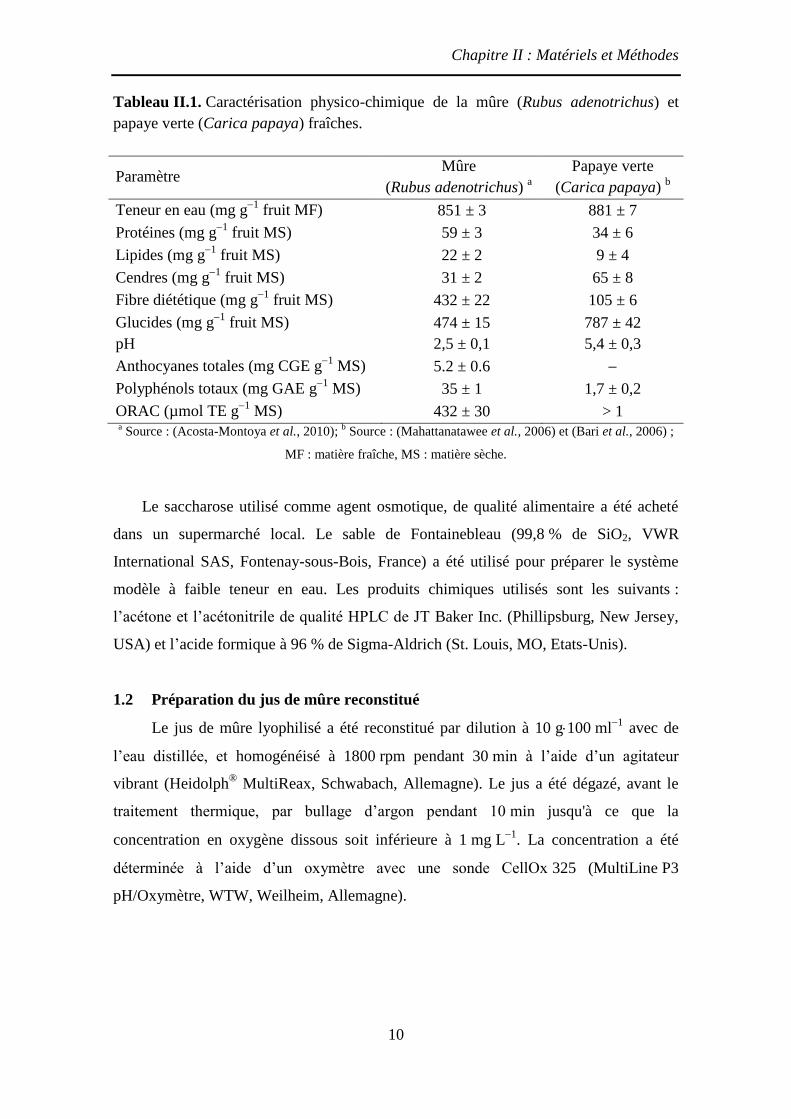
Tableau II.1. Caractérisation physico-chimique de la mûre (Rubus adenotrichus) et
papaye verte (Carica papaya) fraîches. .......................................................................... 10
Tableau II.2. Caractéristiques du chromatographe Agilent 6980 HP et paramètres du
spectromètre de masse. ................................................................................................... 21
Tableau II.3. Paramètres de l’analyse de la conductivité thermique du système jus de
mûre–sable de Fontainebleau par la méthode Hot Disk ................................................. 24
Tableau II.4. Expression des résultats pour la déshydratation-imprégnation par
immersion ....................................................................................................................... 26
Tableau II.5. Valeurs codées et réelles des variables indépendantes du plan
d’expérience.................................................................................................................... 32
Tableau. II.6. Paramètres d’entrée utilisés pour les simulations ................................... 37
Table III.1.1. Published data for kinetic parameters (activation energy Ea and rate
constant k) of anthocyanins thermal degradation of some products. .............................. 44
Table III.1.2. Main characteristics of reconstituted blackberry juice (Rubus
adenotrichus) used for kinetic experiments (mean values 95 % confidence interval
with n=5). ....................................................................................................................... 53
Table III.1.3. Estimated kinetic parameters (aE and
refk ) of anthocyanins thermal
degradation and non-enzymatic browning (mean values ± 95 % confidence interval
determined with Monte-Carlo simulations: 2 000 sets of ( )tA and ( )tB data randomly
with 5 % and 3 % of uncertainty). .................................................................................. 55
Table III.2.1. Main characteristics of blackberry juice - quartz sand samples used for
kinetic experiments (mean values 95 % confidence interval with n=5). .................... 70
Table III.2.2. Estimated kinetic parameters (aE and
refk ) of anthocyanins thermal
degradation and non-enzymatic browning from 100 to 140 ºC with a reference
temperature of 120 ºC (mean values ± 95 % confidence interval determined with Monte-
Carlo simulations: 2,000 sets of random ( )tA and ( )tB data with 5 % and 3 %
uncertainty). .................................................................................................................... 75
Table III.3.1. Main characteristics and input parameters used in computer simulation

xi
for blackberry juice – quartz sand sample at three different water activities (aw 0.34,
0.76 and 0.95) at 25 ºC (mean values ± 95 % confidence interval). .............................. 94
Table III.3.2. Estimated kinetic parameters (aE and
120 Ck ) for anthocyanins thermal
degradation from 100 to 140 ºC, by two types of analysis: with a space-dependent heat-
reaction model (heterogeneous) or by the homogeneous assumption. Mean
values ± 95 % confidence interval. ............................................................................... 102
Table III.4.1. Central composite design matrix with coded and real values of the
independent variables (temperature and sucrose added molality, msucrose) and
experimental responses to water loss (WL), sugar gain (SG) and anthocyanins gain (AG)
after 60 min. .................................................................................................................. 118
Table III.4.2. Second order polynomial models of water loss (WL), sugar gain (SG) and
anthocyanin gain (AG) with significant regression coefficients (P<0.05). .................. 123
Table III.5.1. Test conditions of the frying kinetics of green papaya-blackberry juice
chips impregnated by osmotic dehydration. ................................................................. 135
Table. III.5.2. Input parameters used in simulations ................................................... 137
Table III.5.3. Optimum operating conditions for the production of green papaya-
blackberry juice chips impregnated by osmotic treatment and product output
characteristics for each operation. ................................................................................ 150
Tableau IV.1. Teneur en anthocyanes et indice du brunissement non-enzymatique après
traitement thermique (120 s à 140 ºC) des échantillons du système jus de mûre-sable à
aw 0,34 analysées avec et sans la surface...................................................................... 162
Tableau IV.2. Méthodes d’identification des paramètres cinétiques et des intervalles de
confiance utilisés pour les modèles cinétiques en milieux liquide et bi-phasique. ...... 164
Tableau IV.3. Conditions opératoires optimales du procédé d’obtention des chips de
papaye verte formulées par DII et les caractéristiques des produits à la sortie de chaque
opération. ...................................................................................................................... 178
xii
Liste des Figures
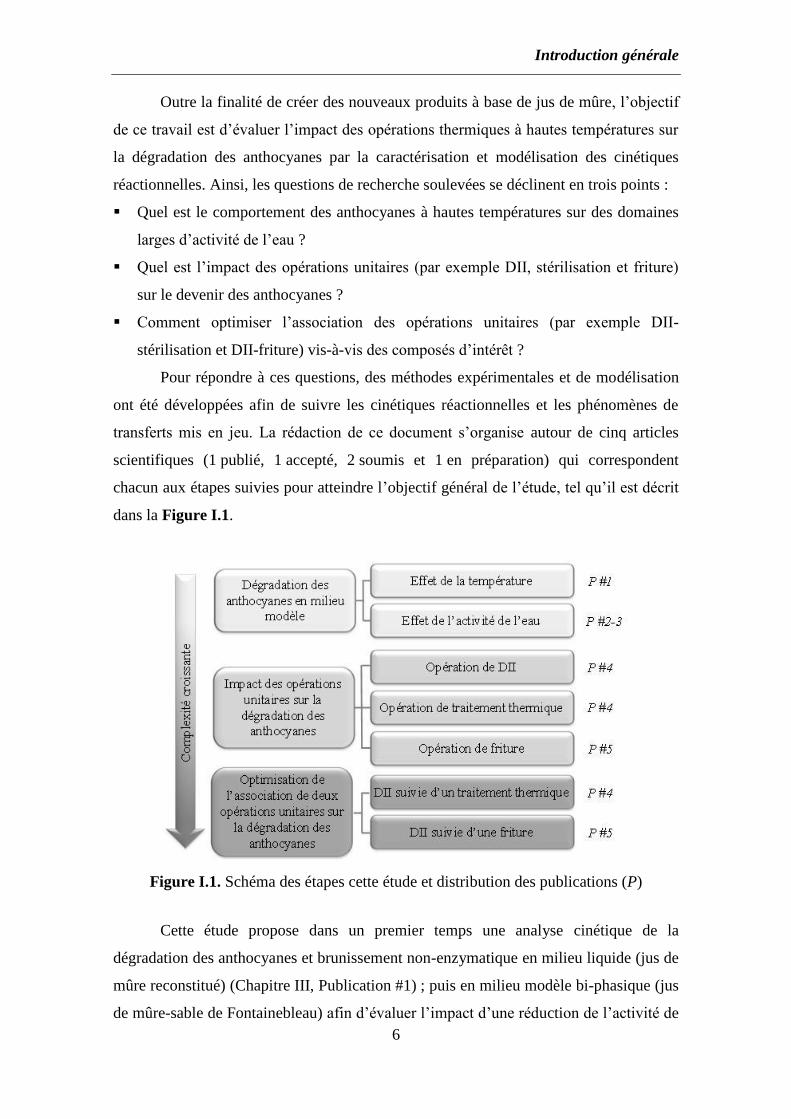
Figure I.1. Schéma des étapes cette étude et distribution des publications (P) ............... 6
Figure II.1. L’aspect des produits avant le traitement thermique. L’échantillon de jus de
mûre et sable lyophilisé (a) et à aw de 0,34 (b), 0.76 (c) et 0.95 (d) ............................... 11
Figure II.2. Cellule de traitement thermique. Schéma de la cellule : (a) Ensemble
général, (b) couvercle, (c) coupelle avec des ailettes, (d) vue latérale de l’ensemble ;
(e) position du thermocouple et (f) vue générale de la cellule. ...................................... 12
Figure II.3. Processus d’élaboration du produit intermédiaire par déshydratation-
imprégnation par immersion (DII) de la papaye verte avec une solution de jus de mûre.
........................................................................................................................................ 14
Figure II.4. Protocoles d’extraction d’huile dans les chips (a), et extraction des
anthocyanes dans le produit délipidé (b). ....................................................................... 17
Figure II.5. Conditions de l’analyse de la conductivité thermique du système jus de
mûre–sable de Fontainebleau par la méthode Hot Disk ................................................. 24
Figure II.6. Schéma du domaine de calcul en 3D ; Ω2 : le système jus de mûresable de
Fontainebleau ; Ω2 : réacteur en acier inoxydable; out frontière entre Ω2 et l'huile
chaude (flux de chaleur par convection); in frontière entre Ω1 et Ω2 (résistance
thermique) et sym la surface de symétrie (pas de flux). ................................................. 29
Figure II.7. Schéma de la méthode d’estimation numérique de la teneur en anthocyanes
(A(t)) dans la papaye verte imprégnée d’une solution de jus de mûre stérilisée, à partir du
couplage de la déshydratation osmotique et du traitement thermique............................ 34
Figure II.8. Schéma du domaine de calcul en 2D et conditions aux limites ................. 36
Figure II.9 Schéma du modèle physique de friture (Bassama, 2011) ........................... 36
Figure III.1.2. Time-temperature profiles ( )(tT ) for reconstituted blackberry juice
samples heated from 100 to 180 ºC in a hermetically sealed cell. ................................. 50
Figure III.1.3. Residual plot of anthocyanin content (A(t)
) and non-enzymatic browning
(B(t)
) at different temperatures for the single (a, c) and sequential (b) first-order kinetics.
........................................................................................................................................ 54
Figures III.1.4. Monte-Carlo simulations to estimate the uncertainties in the parameters
and their correlation for anthocyanin degradation and non-enzymatic browning index.
Histogram for activation energy values (solid lines are normal distributions) (a and b),
and correlation between Ea and kref for different temperature ranges (c, d and e). Results
xiii
of 2 000 simulations. ...................................................................................................... 56
Figure III.1.5. Degradation kinetics of monomeric anthocyanins (A(t)
) during thermal
treatment from 100 to 180 ºC. Experimental data () and predicted curves from two
sequential first-order kinetics ([100-140 ºC] then ]140-180 ºC]). Bars represent 95 %
confidence interval (n=5). .............................................................................................. 57
Figure III.1.6. Arrhenius plot describing the temperature dependence of non-enzymatic
browning (NEB) and anthocyanin degradation rate constant ( k ) of reconstituted
blackberry juice (R. adenotrichus) from 30 to 90 ºC (Cisse et al., 2009) and 100 to
180 ºC (present study). ................................................................................................... 58
Figure III.1.7. Kinetics of non-enzymatic browning during thermal treatment from 100
to 180 ºC. Experimental data () and predicted curves for each trial. Bars represent
95 % confidence interval (n=5). ..................................................................................... 59
Figure III.1.8. Simulated non-isothermal heating profiles, anthocyanin degradation
curves and equivalent isothermal time (with Tref =140 ºC) for different applications:
deep-fat frying, spray drying, extrusion, conventional and HTST sterilization. ............ 61
Figure III.2.1. Possible thermal degradation mechanisms of cyanidin 3-glucoside via
the hydrolytic pathway (Furtado et al., 1993; Patras et al., 2010). ................................ 67
Figure III.2.2. Product appearance before heat treatment. Blackberry juice–quartz sand
samples at aw of 0.34 (a), 0.76 (b) and 0.95 (c). ............................................................. 70
Figure III.2.3. Time-temperature profiles (T(t)
) for blackberry juice–quartz sand
samples at aw of 0.34, 0.76 and 0.95 heated from 100 to 140 ºC in a hermetically sealed
cell. ................................................................................................................................. 74
Figure III.2.4. Monte-Carlo simulations used to estimate uncertainties and correlation
in the parameters (Ea and kref) for monomeric anthocyanin degradation. Histograms
show the activation energy and kref values (solid lines are the normal distributions) for
temperatures from 100 to 140 ºC (a and b) and correlations between Ea and kref for
different water activities (c to f). The results are from 2,000 simulations. ..................... 77
Figure III.2.5. Kinetics of monomeric anthocyanin degradation (A(t)
) during thermal
treatment from 100 to 140 ºC. Experimental data (O) and predicted curves for each trial.
Bars represent the 95 % confidence interval (n = 5). ..................................................... 78
Figure III.2.6. Relationship between anthocyanin degradation rate constants (kA and
kref) of the blackberry juice–quartz sand system and water activity (aw) from 100 to
140 ºC. Arrhenius plot describing the temperature dependence of kC at three water
activities (aw of 0.34, 0.76 and 0.95) (a) and empirical mathematical model describing
xiv
the sigmoidal relationship between kref and aw along with the moisture sorption isotherm
at 25 ºC (b). Bars represent the 95 % confidence interval (n = 2,000). .......................... 79
Figure III.2.7. Monte-Carlo simulations to estimate the uncertainties and correlations in
the non-enzymatic browning index parameters (Ea and kref). Histograms show the
activation energy and kref values (solid lines are normal distributions) for temperatures
from 100 to 140 ºC (a and b) and correlations between Ea and kref for different water
activities (c to f). The results are from 2,000 simulations. ............................................. 80
Figure III.2.8. Kinetics of non-enzymatic browning during heat treatment from 100 to
140 ºC. Experimental data () and predicted curves for each trial. Bars represent the
95 % confidence interval (n = 5). ................................................................................... 81
Figure III.2.9. Possible thermal degradation mechanism of cyaniding 3-glucoside via
condensation with furfural or 5-hydroxymethylfurfural (HMF) (Es-Safi et al., 2002). . 83
Figure III.3.1. Schematic diagram of reactor with inner and outer dimensions in mm.
(a) General assembly, (b) Cell cap and (c) Cell cupel. ................................................... 90
Figure III.3.2. Schematic view (not to scale) of the computational domain 3D; Ω1:
blackberry juice – quartz sand sample; Ω2: stainless steel reactor; Γout: boundary
between Ω2 and hot oil (convective heat flux); Γin: boundary between Ω1 and Ω2
(thermal resistance) and Γsym symmetry surface (no flux). ............................................ 92
Figure III.3.3. Fitting of time-temperature profiles (T(t)
) for water, in a hermetically
sealed reactor, to identify the convective heat transfer coefficient between reactor and
hot oil (T∞). Experimental data (O) and predicted curves. Dash–dotted lines represent
first and second oil bath temperature. ............................................................................. 97
Figure III.3.4. Identification of the thermal resistance (Rt) between reactor inner
surface and foodstuff sample for blackberry juice – quartz sand samples at initial
aw 0.34, 0.76 and 0.95, heated from 100 to 140 °C, in a hermetically sealed reactor.
RMSE is the root mean square error between the experimental and predicted data. The
upright dotted line indicates the zone of non-limiting heat transfer. ............................ 100
Figure III.3.5. Fitting of time-temperature profiles (T(t)
) for blackberry juice – quartz
sand samples at initial aw 0.34, 0.76 and 0.95, heated from 100 to 140 ºC, in a
hermetically sealed reactor, to identify the thermal resistance (Rt) between reactor inner
surface and foodstuff sample. Experimental data (O) and predicted curves for each trial.
The upright dash–dotted lines depict the value of transition time between baths (first
bath at 250 ºC). ............................................................................................................. 101
Figure III.3.6. Degradation kinetics of monomeric anthocyanins (A(t)
/A(0)
) from
xv
blackberry juice – quartz sand samples at initial aw 0.34, 0.76 and 0.95 during heat
treatments from 100 to 140 ºC in a hermetically sealed reactor. Experimental data (O)
and predicted curves for each trial. Bars represent 95 % confidence interval (n = 5). . 103
Figure III.3.7. Simulated temperature profile (T(t)
) and degradation kinetics of
monomeric anthocyanins (A(t)
/A(0)
) in two locations inside the hermetically sealed
reactor, for blackberry juice – quartz sand samples at initial aw 0.34 heated at 140 °C.
Dash-dotted line for the axy–symmetric center (“cold point”), solid line for the edge of
the compartment (“hot point”) and dotted line for the volumetric mean. .................... 104
Figure III.3.8. Relationship between anthocyanin degradation rate constants (kA and
kref) and initial water activity (aw) for blackberry juice – quartz sand system heated from
100 to 140 ºC. (a) Arrhenius plot describing the temperature dependence of kA at four
initial water activities (aw 0.34, 0.76, 0.95 and 0.99). (b) Empirical model describing kref
(at Tref =120 ºC) as function of aw, along with the moisture sorption isotherm at 25 ºC.
Bars and dotted lines represent 95 % confidence intervals. ......................................... 105
Figure III.3.9. Simulated temperature profile (T(t)
) and degradation kinetics of
anthocyanins (A(t)
/A(0)
) for blackberry juice – quartz sand samples at initial aw 0.34 and
0.76 heated at 140 ºC, under homogeneous and heterogeneous temperature distribution
within the sealed reactor. .............................................................................................. 106
Figure III.3.10. Arrhenius plot describing the temperature dependence of kX at four
activation energies (Ea=50–300 kJ mol-1
) with the same kref = 3×10⁻³
s-1
(a), and at four
rate constants (kref=1×10⁻⁴–1×10
-1 s
-1) with Ea=100 kJ mol
-1 (b). Simulated temperature
profile (T(t)
) for a product at initial aw 0.34 heated at 140 ºC at the “cold point” of the
reactor (c and d), and gap between the degradation kinetics of a compound X (X(t)
/X(0)
)
estimated under homogeneous and heterogeneous temperature distribution within the
sealed reactor for the previous kinetic parameters (e and f). ........................................ 107
Figure III.4.1. Flowchart for the osmotic dehydration and impregnation of green
papaya with blackberry juice solution. ......................................................................... 114
Figure III.4.2. Flowchart for the numerical estimation of anthocyanins concentration
(A(t)
) in green papaya impregnated with blackberry juice solution from the coupling of
osmotic dehydration and heat treatment. ...................................................................... 119
Figure III.4.3. Kinetics of water loss (WL), sugar gain (SG) and anthocyanin gain (AG)
during osmotic dehydration and impregnation of green papaya with blackberry juice
solution at three sucrose added molalities at 50 °C. Bars represent 95% confidence
interval (n=3). ............................................................................................................... 122
xvi
Figure III.4.4. Contour diagrams and observed versus predicted plot for water loss
(WL), sugar gain (SG) and anthocyanin gain (AG) as a function of temperature (T: 30–
70 °C) and sucrose molality (msucrose: 0.0–3.0 mol kg-1
) during osmotic dehydration and
impregnation of green papaya with blackberry juice solution. .................................... 124
Figure III.4.5. Effect of two iso-lethal sterilization treatments on the anthocyanin
content of an intermediate product (green papaya impregnated with blackberry juice)
formulated with sucrose added molalities (msucrose) from 0.0 to 3.0 mol kg-1
at 50 °C.
(a) Temperature profiles of sterilization treatments (F0=2.8 min); (b) water activity (aw)
and reaction rate constant (k120°C) of the anthocyanin degradation for the intermediate
moisture product, (c) residual anthocyanin concentration after heat treatment (A(t)
/A(0)
)
and (d) anthocyanin content for each sterilized product (A(t)
). ..................................... 126
Figure III.5.1. Schematic view of the computational domain and boundary conditions
...................................................................................................................................... 136
Figure III.5.2. Diagram of the physical model of deep-fat frying (Bassama, 2011)... 136
Figure III.5.3. Diagram for the green papaya-blackberry juice chips obtained by
osmotic dehydration and deep-fat frying; operating variables and product characteristics
at the end of each unit operation. .................................................................................. 139
Figure III.5.4. Comparison of temperature profiles (T(t)
) and kinetics of water content
(W(t)
) and anthocyanin content (A(t)
), experimental and predicted for green papaya chips
formulated by osmotic dehydration at three concentrations of added sucrose (msucrose=0 ;
1.5 and 3.0 mol kg1
) fried at 140 ºC. ........................................................................... 140
Figure III.5.5. Oil content (F(t)
) as a function of water loss (W(0)W
(t)) during frying at
140 ºC for green papaya-blackberry juice chips ........................................................... 142
Figure III.5.6. Experimental frying kinetic at 140 ºC for green papaya-blackberry juice
chips formulated by osmotic dehydration with three concentrations of added sucrose
(msucrose=0, 1.5 and 3.0 mol kg1
) ................................................................................. 142
Figure III.5.7. Influence of thickness variation in green papaya-blackberry chips (z ±
20%) on the temperature profiles (core and surface) and kinetics of water content (W(t)
)
and anthocyanin content (A(t)
) for chips fried at 140 ºC. .............................................. 144
Figure III.5.8. Impact of frying temperature (120 and 140 ºC) on temperature profiles
(core and surface) and kinetics of water content (W(t)
) and anthocyanin content (A(t)
) for
green papaya-blackberry chips impregnated at msucrose=1.5 mol kg1
. ......................... 145
Figure III.5.9. Impact of kinetic parameters (Ea and kref) variation on the anthocyanin

xvii
degradation kinetics of green papaya chips formulated at msucrose=1.5 mol kg1
and fried
at 140 ºC ....................................................................................................................... 146
Figure III.5.10. Anthocyanin degradation kinetics and temperature profiles in two
positions of the geometry (core and surface) during frying at 140 ºC for green papaya-
blackberry chips formulated at msucrose=1.5 mol kg1
. .................................................. 147
Figure III.5.11. Simulated anthocyanin degradation kinetics during frying at 140 ºC for
green papaya-blackberry chips formulated at msucrose=1.5 mol kg1
(b). Simulations
performed at fixed reaction rate (kref) for six different water activities, and at variable kref
according to chips dehydration (a). .............................................................................. 148
Figure III.5.12. Coupling between osmotic dehydration (msucrose from 0.0 to
3.0 mol kg1
) and frying operation for green papaya-blackberry chips. (a) hydro-thermal
path followed by each impregnated product and (b) anthocyanin degradation kinetic
during frying at 140 ºC. (c) The initial water activity of products and the frying time
required to reach a water content of 0.07 kg kg1
NFDB. (d) Average anthocyanin
content (A(t)
) and reduced anthocyanin content (A(t)
/A(0)
) at the end of frying. ............ 149
Figure IV.1. Profils de température au sein de la cellule pour le système jus de mûre-
sable de Fontainebleau à différentes activités de l’eau et pour le jus de mûre (aw 0,99).
...................................................................................................................................... 155
Figure IV.2. Corrélation de deux méthodes de quantification des anthocyanes en jus de
mûre reconstitué: CLHP et la méthode du différentiel du pH (R = 0,98). ................... 157
Figure IV.3. Cinétiques de la teneur réduite des anthocyanes et des polyphénols totaux,
et évolution de la capacité antioxydante du jus de mûre à 100 et 180 ºC. ................... 157
Figure IV.4. Graphique d’Arrhenius de la constante de réaction pour la dégradation
thermique des anthocyanes (100 à 140 ºC) dans le jus de mûre déterminé par la méthode
traditionnelle (isotherme) et la méthode non-isotherme. .............................................. 159
Figure IV.5. Teneur en anthocyanes, avant et après un traitement thermique (200 s à
140 ºC), dans le jus de mûre à trois différentes dilutions. ............................................ 160
Figure IV.6. Teneur réduite en anthocyanes (A(t)
/A(0)
) après traitement thermique
(160 ºC) valeurs expérimentales et prédites par le modèle en milieu liquide (jus de
mûre), dans le système jus de mûre-sable de Fontainebleau à différentes activités de
l’eau. ............................................................................................................................. 161
Figure IV.7. Relation entre les constantes de réaction de dégradation des anthocyanes
(kA et kref) et l’activité de l’eau (aw) du système jus de mûre-sable traité à 100140 ºC.
xviii
Courbe d’Arrhenius décrivant la dépendance en température de kA à quatre activités de
l’eau (aw 0,34, 0,76, 0,95 et 0,99) pour l’approche homogène (a) et hétérogène (b).
Modèle empirique décrivant kref en fonction de l’aw, avec l’isotherme de sorption à
25 ºC, pour l’analyse homogène (c) et hétérogène (d). Les barres représentent les
intervalles de confiance à 95 %. ................................................................................... 163
Figure IV.8. Coefficients de variation des paramètres cinétiques (Ea et kref) obtenus
pour les trois modèles cinétiques développés pour la dégradation des anthocyanes à
haute température ......................................................................................................... 165
Figure IV.9. Teneur réduite en anthocyanes après traitement thermique (150 s à 180 ºC)
valeurs expérimentales et prédites par le modèle en milieu liquide, dans le jus de mûre à
différentes teneurs en oxygène dissous. *Jus dégazé par bullage d’argon. .................. 168
Figure IV.10. Représentation de la constante de réaction à 120 ºC de la dégradation des
anthocyanes en fonction de l’activité de l’eau (kref=f(aw)), de la teneur en eau en base
humide (kref=f(WMF)) et en base sèche (kref=f(WMS)). ................................................... 169
Figure IV.11. Teneur en anthocyanes, avant et après un traitement thermique (180 s à
140 ºC), dans le jus de mûre formulé à trois teneurs en saccharose ajouté (aw 0,99 à
0,0 kg kg1
; aw 0,97 à 0,25 kg kg1
; aw 0,95 à 0,4 kg kg1
) ........................................ 171
Figure IV.12. Schéma du procédé d’obtention des tranches de papaye verte-jus de mûre
formulées par DII et stérilisées, suivant les variables opératoires et les caractéristiques
des produits à la sortie de chaque opération (W, S, A et aw sont respectivement la teneur
en eau, en sucre, en anthocyanes et l’activité de l’eau). ............................................... 174
Figure IV.13. Schéma du procédé d’obtention des chips de papaye verte-jus de mûre
formulées par DII avec les variables et les caractéristiques des produits à la sortie de
chaque opération. .......................................................................................................... 175
Figure IV.14. Simulation des trajectoires thermo-hydriques et cinétiques de dégradation
des anthocyanes au cours du traitement thermique de friture (cœur) de produits à trois
différentes teneurs en eau initiales ............................................................................... 176
Figure IV.15. Teneur en huile (F(t)
) en fonction de la perte en eau (W(0)W
(t)) au cours
de la friture à 140 ºC de chips de papaye verte imprégnées de jus de mûre par DII. ... 177
xix
Liste des Abréviations
A(t)
et A(0)
Teneur en anthocyanes totales au temps t et t = 0 g L–1
mg 100g–1
AG Gain en anthocyanes mg CGE kg–1
aw Activité de l’eau à 25 ºC Adimensionnel
B(t)
et B(0)
Brunissement non enzymatique au temps t et t=0 Adimensionnel
B Brunissement non enzymatique au temps t = Adimensionnel
c Capacité thermique massique J kg–1
K–1
Ea Énergie d’activation apparente J mol–1
hoil Coefficient de transfert thermique W m–2
K–1
K Constante de corrélation de l’équation de Norrish Adimensionnel
k Conductivité thermique W m–1
K–1
kX Constante de réaction de X(t)
s–1
kXref Constante de réaction de X(t)
à température de
référence
s–1
msaccharose
ou msucrose
Molalité du saccharose ajouté mol kg–1
m(t)
et m(0)
Masse d’échantillon au temps t et t = 0 kg
MM Masse moléculaire g mol–1
n Vecteur normal unitaire m
Masse volumique kg m–3
R Constante des gaz parfaits 8.314 Jmol–1K
–1
RT Résistance thermique m2 K W
–1
SG Gain en sucre kg kg–1
S(t)
et S(0)
Teneur en saccharose à l’instant t et t = 0 kg kg–1
δT Épaisseur de la couche limite thermique m
T Température K
TDII Température de traitement osmotique ºC
T∞ Température de l’huile de friture °C
Tref Température de référence K
T(t)
ou T(0)
Température à l’instant t and t = 0 ºC
t Temps s
xx
ttransition Temps de transition entre bains s
WL Perte en eau kg kg–1
W(t)
et W(0)
Teneur en eau au temps t et t = 0 kg kg–1
Xw et Xs Fractions molaires de l’eau et saccharose mol mol–1
X(t)
A(t)
ou ( ( )tB B ) au temps t
BNE ou NEB Brunissement non enzymatique
CGE Cyanidine 3-glucoside équivalente
CLHP ou
HPLC
Chromatographie liquide haute performance
DII Déshydratation-imprégnation par immersion
MF ou WB Matière fraîche
MS ou DB Matière sèche
MSNH ou
NFDB
Matière sèche non huileuse
PV ou GP Papaye verte
PT Polyphénols totaux
ORAC « Oxygen Radical Absorbance Capacity »

Introduction générale
1
Chapitre I : Introduction générale
La couleur des produits alimentaires est l’une des enjeux majeurs de l’industrie
alimentaire. D’une certaine manière, la couleur peut agir comme une « empreinte » d’un
produit alimentaire, étant liée à son goût et en même temps permet d’évaluer sa qualité
globale. La couleur est également le premier attribut à être perçu dans les aliments et les
boissons et est généralement corrélée positivement avec les indices de qualité par le
consommateur (Mateus et Freitas, 2009). L’utilisation d’additifs synthétiques est de
moins en moins populaire parmi les consommateurs, en particulier pour des raisons
psychologiques, du fait que le consommateur associe aisément les colorants naturels à
des bénéfices pour la santé, et les colorants synthétiques aux problèmes de toxicité et
d’allergie. En outre, les colorants synthétiques couramment utilisés dans l’industrie
alimentaire sont suspectés de provoquer des effets indésirables comportementaux et
neurologiques (McCann et al., 2007). Par conséquent, le remplacement des colorants
synthétiques par des colorants naturels est devenu un enjeu majeur au cours des
dernières années. Les pigments à partir de sources naturelles peuvent afficher un large
éventail de couleurs et sont généralement sûrs. Parmi ces pigments répandus dans la
nature, les anthocyanes ont un rôle crucial lorsqu’il s’agit de colorants naturels (He et
Giusti, 2010).
Les anthocyanes constituent le plus grand et probablement le groupe le plus
important de pigments naturels hydrosolubles. Ils appartiennent à un grand groupe de
composés poly-phénoliques nommé flavonoïdes, qui sont des métabolites secondaires
synthétisés par les plantes. À ce jour, il y a eu plus de 635 anthocyanes identifiés dans la
nature, et un tel groupe hétérogène permet d’obtenir des couleurs du rose au rouge et du
violet au bleu foncé dans une grande variété de légumes, céréales, fleurs et fruits,
comme les baies (Giusti et Jing, 2007). Parmi les baies, les mûres tropicales
(R. adenotrichus) sont une bonne source d’anthocyanes, en particulier la cyanidine 3-
glucoside (Acosta-Montoya et al., 2010; Mertz et al., 2007). Outre ses propriétés en tant
que colorant, les anthocyanes ont récemment attiré l’attention grâce à leurs bénéfices
potentiels pour la santé. Basé sur de nombreuses études cellulaires, en modèles
animaux, et des essais cliniques chez les humains, il a été suggéré que les anthocyanes
présentent des propriétés anti-inflammatoires, anti-cancérigènes, de prévention des
maladies cardiovasculaires (Basu et al., 2010), et de contrôle de l’obésité et de réduction
du diabète. Ces propriétés sont probablement toutes associées plus ou moins avec leur
Introduction générale
2
propriétés antioxydantes élevées (He et Giusti, 2010).
Globalement, les anthocyanes sont des composés naturels intéressants pour une
utilisation comme colorants alimentaires, car ils peuvent présenter un large éventail de
couleurs attrayantes, ils sont solubles dans l’eau et ont des bénéfices potentiels pour la
santé (Mateus et Freitas, 2009). Néanmoins, l’utilisation de ces pigments dans les
aliments est entravée par sa faible stabilité, qui est affectée par des facteurs physiques et
chimiques telles que la température, le pH, la lumière, les solvants et la structure des
pigments, ainsi que les variables thermodynamiques intervenant lors des procédés de
transformation et du stockage des aliments (Mercadante et Bobbio, 2008).
Les procédés de conservation des aliments impliquent généralement l’utilisation
de traitements thermiques à haute température (60 à 150 ºC) afin de préserver
efficacement les aliments et de fournir les propriétés sensorielles souhaitables. Par
ailleurs, l’intensité et la durée du traitement thermique ont une influence négative sur la
stabilité de la plupart des molécules bioactives d’intérêt pour les produits alimentaires
sains. C’est le cas des anthocyanes que peuvent être facilement dégradées pendant les
traitements thermiques à haute température, ce qui a un impact considérable sur la
couleur et affecte les propriétés nutritionnelles et fonctionnelles de l’aliment (Patras et
al., 2010). La dégradation des anthocyanes au cours du traitement doit être minimisée
afin de préserver la qualité des aliments (Sadilova et al., 2006).
L’effet des traitements thermiques à haute température sur la dégradation des
anthocyanes a été étudié par plusieurs auteurs (Cao et al., 2009; Cemeroglu et al., 1994;
Cisse et al., 2009; Debicki-Pospisil et al., 1983; Harbourne et al., 2008; Hillmann et al.,
2011; Kechinski et al., 2010; Kirca et al., 2007; Mishra et al., 2008; Reyes et Cisneros-
Zevallos, 2007; Wang et Xu, 2007; Yang et al., 2008) lesquels ont déterminé les
paramètres cinétiques (l’énergie d’activation et la constante de vitesse de réaction) pour
une grande variété de produits riches en anthocyanes (Tableau I.1). Les paramètres ont
été obtenus suivant des cinétiques de premier ordre et en modélisant la dépendance de
la température selon l’équation d’Arrhenius. La plupart des études ont été réalisées à des
températures inférieures à 100 ºC, ce qui permet de les assimiler à des traitements
isothermes. Cependant, certaines opérations thermiques pour les produits alimentaires
riches en anthocyanes impliquent des températures supérieur à 100 ºC ; par exemple, la
friture sous vide des pommes de terre bleues (Da Silva et Moreira, 2008), la stérilisation
de la pulpe de raisin (Mishra et al., 2008), l’extrusion de farine de maïs avec des
anthocyanes de myrtille et de raisins pour les céréales de petit déjeuner (Camire et al.,
Introduction générale
3
2002), et le séchage par atomisation de pulpe d’açaí (Tonon et al., 2008). Peu de
données cinétiques obtenues à des températures plus élevées ont été publiés (Buckow et
al., 2010; Harbourne et al., 2008; Mishra et al., 2008; Verbeyst et al., 2011).
Tableau I.1. Données publiées pour les paramètres cinétiques (énergie d’activation Ea
et constante de réaction k) de la dégradation thermique des anthocyanes à hautes
températures (>60°C) de certains produits
Référence Produit Température
range (°C) aE
(kJ·mol–1
)
k
(×10–6
s–1
)
(Verbeyst et al.,
2011) Framboises (p=0,1 MPa) 90130 75,3±2,5 82927
(Buckow et al.,
2010)
Jus de myrtille
(p=0,1 MPa) 40–121 84,9±1,7 11995
(Harbourne et al.,
2008)
Jus de cassis 4–140 81±3 0,04–2765
(Mishra et al., 2008) Pulpe de raisin 126.7 65±33 2382±100
(Hillmann et al.,
2011) Jus de raisin (15,5 ºBrix) 70–90 72,74 937
(Kechinski et al.,
2010) Jus de myrtille 40–80 80,42 1,137,6
(Cisse et al., 2009) Jus d’orange sanguine
Jus de mûre
Extrait d’Hibiscus
30–90 66,0
37,0
51,1
14,6–166,0
8,1–74,8
2,9–75,1
(Cao et al., 2009) Orange sanguine
cyanidine 3-glucoside
cyanidine 3-(6''-malonyl)
glucoside
70–90
75,4
79,5
14,8–63,3
10,3–47,8
(Yang et al., 2008) Maïs violet (pH 4) 70–90 18,3 16,6–25,7
(Wang et Xu, 2007) Jus de mûre (8,9 ºBrix) 60–90 58,9 11,5–65,7
(Reyes et Cisneros-
Zevallos, 2007)
Pomme de terre voilette
Pomme de terre rouge
Raisin
Carotte violette
25–98 72,5
66,7
75,0
81,3
0,19–90,5
0,08–20,1
0,17–79,2
0,03–27,9
(Kirca et al., 2007) Carotte noire (pH 2,5) 70–90 78,1 7,7–34,5
(Cemeroglu et al.,
1994)
Jus de griotte (15°Brix) 50–80 68,5 1,1–9,4
(Debicki-Pospisil et
al., 1983)
Jus de mûre (JM)
JM + HMF a
JM + Furfural
24–70 61,8
54,6
52,9
0,7–196,4
1,2–232,5
1,3–246,4
Il existe relativement peu d’informations sur les mécanismes de dégradation des
anthocyanes à haute température, excepté que la dégradation est principalement causée
par l’oxydation et le clivage de liaisons covalentes (Patras et al., 2010). Adams (1973) a

Introduction générale
4
proposé que l’hydrolyse de la liaison glucosidique et la formation de l’aglycone sont les
étapes initiales de la dégradation de la cyanidine 3-glucoside dans une solution aqueuse
acidifiée à 100 ºC. D’autres auteurs ont également suggéré que la dégradation thermique
du 3,5-malvidine diglucoside à 100 ºC commence par l’hydrolyse des liaisons
glucosidiques, qui déstabilise l’aglycone et conduit à l’ouverture de l’anneau du
pyrylium et par conséquent, la formation d’une chalcone (Piffaut et al., 1994). Étant
donné que la dégradation thermique est supposée être une réaction hydrolytique, la
disponibilité en eau est considérée comme essentielle pour la dégradation des
anthocyanes (Erlandson et Wrolstad, 1972).
La plupart des traitements à des températures supérieures à 100 ºC sont
inévitablement couplés à des phénomènes de transfert de matière, quand l’eau présente
dans l’aliment s’évapore pendant le traitement thermique. Ces pertes en eau entraînent
des modifications de la teneur en eau et de l’activité de l’eau du produit traité. L’effet de
l’activité de l’eau sur la dégradation des anthocyanes a été étudié par plusieurs auteurs
dans des systèmes modèles et produits réels. Ces études ont indiqué que les anthocyanes
se dégradent plus rapidement lorsque l’activité de l’eau s’accroit (Bronum-Hansen et
Flink, 1985; Erlandson et Wrolstad, 1972; Garzón et Wrolstad, 2001; Gradinaru et al.,
2003; Lai et al., 2009; Thakur et Arya, 1989) confirmant une réaction hydrolytique.
Néanmoins, aucune de ces études n’a été réalisée à des températures supérieures à
100 ºC et, dans certains cas, elles ont été effectuées sur solutions modèles sans sucre.
C’est pourquoi, il est important d’évaluer l’effet combiné de la température (T>100 ºC)
et de l’activité de l’eau sur la dégradation des anthocyanes dans des produits réels.
En plus de la dégradation des anthocyanes, les fruits (contenant des sucres), tels
que les mûres, subissent des réactions de brunissement non-enzymatique à haute
température. Le brunissement non-enzymatique se réfère à l’obscurcissement d’un
produit alimentaire en raison de toute réaction qui ne résulte pas de l’activité
enzymatique ; il est principalement associée à des réactions de dégradation des glucides,
tels que la caramélisation et les réactions de Maillard (Quintas et al., 2007). Les
réactions de Maillard sont initiées principalement par la condensation d’un groupe
aldéhyde et amine, alors que la caramélisation se réfère plutôt à des réactions seulement
entre glucides exposés à des températures élevées (BeMiller et Whistler, 1996).
Parmi les traitements thermiques à haute température, la friture est un procédé
largement utilisé pour l’élaboration de « snacks ». La simplicité d’application de la
friture, son rendement énergétique élevé, sa courte durée et la facilité de préparation de
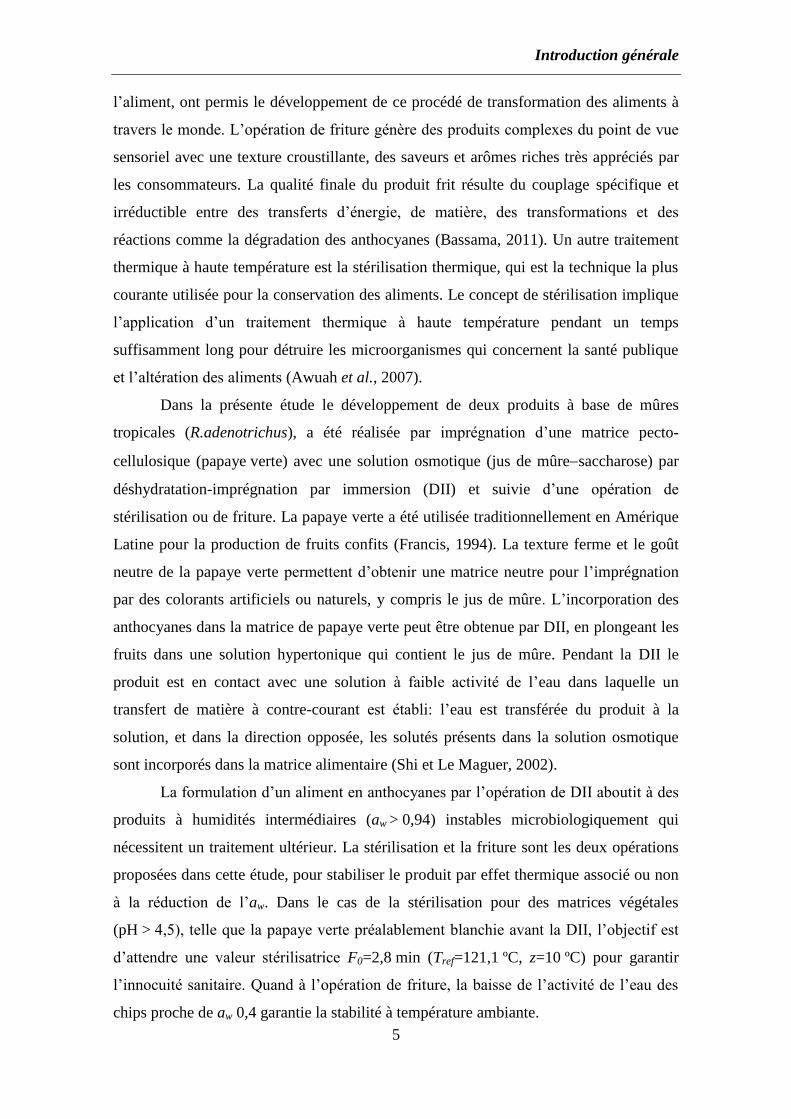
Introduction générale
5
l’aliment, ont permis le développement de ce procédé de transformation des aliments à
travers le monde. L’opération de friture génère des produits complexes du point de vue
sensoriel avec une texture croustillante, des saveurs et arômes riches très appréciés par
les consommateurs. La qualité finale du produit frit résulte du couplage spécifique et
irréductible entre des transferts d’énergie, de matière, des transformations et des
réactions comme la dégradation des anthocyanes (Bassama, 2011). Un autre traitement
thermique à haute température est la stérilisation thermique, qui est la technique la plus
courante utilisée pour la conservation des aliments. Le concept de stérilisation implique
l’application d’un traitement thermique à haute température pendant un temps
suffisamment long pour détruire les microorganismes qui concernent la santé publique
et l’altération des aliments (Awuah et al., 2007).
Dans la présente étude le développement de deux produits à base de mûres
tropicales (R.adenotrichus), a été réalisée par imprégnation d’une matrice pecto-
cellulosique (papaye verte) avec une solution osmotique (jus de mûresaccharose) par
déshydratation-imprégnation par immersion (DII) et suivie d’une opération de
stérilisation ou de friture. La papaye verte a été utilisée traditionnellement en Amérique
Latine pour la production de fruits confits (Francis, 1994). La texture ferme et le goût
neutre de la papaye verte permettent d’obtenir une matrice neutre pour l’imprégnation
par des colorants artificiels ou naturels, y compris le jus de mûre. L’incorporation des
anthocyanes dans la matrice de papaye verte peut être obtenue par DII, en plongeant les
fruits dans une solution hypertonique qui contient le jus de mûre. Pendant la DII le
produit est en contact avec une solution à faible activité de l’eau dans laquelle un
transfert de matière à contre-courant est établi: l’eau est transférée du produit à la
solution, et dans la direction opposée, les solutés présents dans la solution osmotique
sont incorporés dans la matrice alimentaire (Shi et Le Maguer, 2002).
La formulation d’un aliment en anthocyanes par l’opération de DII aboutit à des
produits à humidités intermédiaires (aw > 0,94) instables microbiologiquement qui
nécessitent un traitement ultérieur. La stérilisation et la friture sont les deux opérations
proposées dans cette étude, pour stabiliser le produit par effet thermique associé ou non
à la réduction de l’aw. Dans le cas de la stérilisation pour des matrices végétales
(pH > 4,5), telle que la papaye verte préalablement blanchie avant la DII, l’objectif est
d’attendre une valeur stérilisatrice F0=2,8 min (Tref=121,1 ºC, z=10 ºC) pour garantir
l’innocuité sanitaire. Quand à l’opération de friture, la baisse de l’activité de l’eau des
chips proche de aw 0,4 garantie la stabilité à température ambiante.
Introduction générale
6
Outre la finalité de créer des nouveaux produits à base de jus de mûre, l’objectif
de ce travail est d’évaluer l’impact des opérations thermiques à hautes températures sur
la dégradation des anthocyanes par la caractérisation et modélisation des cinétiques
réactionnelles. Ainsi, les questions de recherche soulevées se déclinent en trois points :
Quel est le comportement des anthocyanes à hautes températures sur des domaines
larges d’activité de l’eau ?
Quel est l’impact des opérations unitaires (par exemple DII, stérilisation et friture)
sur le devenir des anthocyanes ?
Comment optimiser l’association des opérations unitaires (par exemple DII-
stérilisation et DII-friture) vis-à-vis des composés d’intérêt ?
Pour répondre à ces questions, des méthodes expérimentales et de modélisation
ont été développées afin de suivre les cinétiques réactionnelles et les phénomènes de
transferts mis en jeu. La rédaction de ce document s’organise autour de cinq articles
scientifiques (1 publié, 1 accepté, 2 soumis et 1 en préparation) qui correspondent
chacun aux étapes suivies pour atteindre l’objectif général de l’étude, tel qu’il est décrit
dans la Figure I.1.
Figure I.1. Schéma des étapes cette étude et distribution des publications (P)
Cette étude propose dans un premier temps une analyse cinétique de la
dégradation des anthocyanes et brunissement non-enzymatique en milieu liquide (jus de
mûre reconstitué) (Chapitre III, Publication #1) ; puis en milieu modèle bi-phasique (jus
de mûre-sable de Fontainebleau) afin d’évaluer l’impact d’une réduction de l’activité de
Introduction générale
7
l’eau sur la dégradation des anthocyanes à très hautes températures (100140 ºC) en
système fermé. Pour cette analyse, deux démarches ont été présentés : une première où
l’homogénéité du champ de température a été supposée au sein d’un réacteur
(Chapitre III, Publication #2), et la seconde analyse, a prise en compte l’hétérogénéité
du champ de température à l’aide d’un modèle en 3D de la cellule de traitement
thermique (Chapitre III, Publication #3). Dans une seconde partie, l’impact de trois
opérations unitaires (DII, traitement thermique et friture) sur le devenir des anthocyanes
sera analysée et évaluera l’impact des processus de transfert d’énergie avec ou sans
transfert de matière (eau, sucre et huile) impliqués dans la dégradation des anthocyanes.
Enfin, une dernière partie proposera des règles de conduite de deux procédés associant
chacun deux opérations unitaires, une opération de formulation (DII) et un traitement á
très haute température (Stérilisation (Chapitre III, Publication #4) et friture
(Chapitre III, Publication #5) afin de privilégier la conservation des anthocyanes sur des
produits réels à base de papaye verte.

Chapitre II : Matériels et Méthodes
9
Chapitre II : Matériels et Méthodes
L’étude de l’impact des opérations thermiques agroalimentaires à hautes
températures sur la dégradation des anthocyanes a été réalisée avec des aliments
modèles et des produits réels. Les expérimentations ont été effectuées dans différents
systèmes : dans le premier cas, il s’agissait d’un milieu liquide contenant les composés
d’intérêt (jus de mûre reconstitué) ; dans le deuxième cas, la matrice était constituée par
un milieu solide modèle (jus de mûresable de Fontainebleau lyophilisé et réhydraté) ;
finalement dans le troisième cas, il s’agissait d’un produit réel (chips de papaye verte
imprégnées de jus de mûre) qui a été formulé par déshydratation-imprégnation par
immersion (DII). Ce chapitre récapitule les protocoles de préparation des différents
échantillons (aliments modèles et réels) et présente le détail des méthodes d’analyses
physico-chimiques ainsi et l’exploitation des résultats afin de réaliser la caractérisation
et la modélisation des cinétiques réactionnelles.
1 Matériels
1.1 Matières premières et produits chimiques
Les mûres (Rubus adenotrichus) ont été récoltées dans la région de Cartago au
Costa-Rica (à 1500 m d’altitude) et congelées à 10 ºC. Les mûres congelées ont été
décongelées après 24 h à 5 ºC et pressées à l’aide d’une presse hydraulique discontinue
(OTC 25 ton HFrame Shop Press, série Y125, Owatonna, MN) pour obtenir un jus à
faible turbidité (88 ± 3 g kg1
TSS). Le jus a été ensuite lyophilisé et emballé sous vide
en sachets aluminisés, et conservés congelés à 18 ºC. Le jus de mûre pressé avec une
concentration initiale d’anthocyanes de A(0)
=625±18 mg kg1
de jus (exprimé en
équivalents de cyanidine 3-glucoside) et une teneur en eau initiale de
W(0)
=0,92±0,01 kg kg1
de jus, présentait le suivant profil en sucres : 117±7 g kg1
de
matière sèche du fruit (MS) de glucose, 104±8 g kg1
MS du fruit de fructose. Le
saccharose n’a pas été détecté (≤ 0,5 g kg1
MS du fruit).
La papaye verte (Carica papaya L.) d’une variété autochtone a été récoltée en
début de maturité (chair et graines blanches) dans la région de Puntarenas au Costa-
Rica. La composition physico-chimique des fruits est donnée dans le Tableau II.1.
Chapitre II : Matériels et Méthodes
10
Tableau II.1. Caractérisation physico-chimique de la mûre (Rubus adenotrichus) et
papaye verte (Carica papaya) fraîches.
Paramètre Mûre
(Rubus adenotrichus) a
Papaye verte
(Carica papaya) b
Teneur en eau (mg g1
fruit MF) 851 ± 3 881 ± 7
Protéines (mg g1
fruit MS) 59 ± 3 34 ± 6
Lipides (mg g1
fruit MS) 22 ± 2 9 ± 4
Cendres (mg g1
fruit MS) 31 ± 2 65 ± 8
Fibre diététique (mg g1
fruit MS) 432 ± 22 105 ± 6
Glucides (mg g1
fruit MS) 474 ± 15 787 ± 42
pH 2,5 ± 0,1 5,4 ± 0,3
Anthocyanes totales (mg CGE g1
MS) 5.2 ± 0.6
Polyphénols totaux (mg GAE g1
MS) 35 ± 1 1,7 ± 0,2
ORAC (µmol TE g1
MS) 432 ± 30 > 1 a Source : (Acosta-Montoya et al., 2010);
b Source : (Mahattanatawee et al., 2006) et (Bari et al., 2006) ;
MF : matière fraîche, MS : matière sèche.
Le saccharose utilisé comme agent osmotique, de qualité alimentaire a été acheté
dans un supermarché local. Le sable de Fontainebleau (99,8 % de SiO2, VWR
International SAS, Fontenay-sous-Bois, France) a été utilisé pour préparer le système
modèle à faible teneur en eau. Les produits chimiques utilisés sont les suivants :
l’acétone et l’acétonitrile de qualité HPLC de JT Baker Inc. (Phillipsburg, New Jersey,
USA) et l’acide formique à 96 % de Sigma-Aldrich (St. Louis, MO, Etats-Unis).
1.2 Préparation du jus de mûre reconstitué
Le jus de mûre lyophilisé a été reconstitué par dilution à 10 g100 ml1
avec de
l’eau distillée, et homogénéisé à 1800 rpm pendant 30 min à l’aide d’un agitateur
vibrant (Heidolph® MultiReax, Schwabach, Allemagne). Le jus a été dégazé, avant le
traitement thermique, par bullage d’argon pendant 10 min jusqu'à ce que la
concentration en oxygène dissous soit inférieure à 1 mg L1
. La concentration a été
déterminée à l’aide d’un oxymètre avec une sonde CellOx 325 (MultiLine P3
pH/Oxymètre, WTW, Weilheim, Allemagne).

Chapitre II : Matériels et Méthodes
11
1.3 Préparation du système jus de mûre sable de Fontainebleau
Le jus de mûre reconstitué et le sable de Fontainebleau préalablement séché
(99,8 % de SiO2, VWR International SAS, Fontenay-sous-Bois, France) ont été
mélangés dans un ratio en matière sèche de 1:9 (m/m). Le mélange a été lyophilisé à
l’aide d’un lyophilisateur Cryo (Cryonext, Saint Gely du Fesc, France). La poudre
obtenue a été homogénéisée dans un broyeur à billes (Dangoumill 300, Prolabo, Paris,
France) à l’azote liquide afin de prévenir la dégradation des composés d’intérêt. La
poudre lyophilisée a été stockée dans des récipients en plastique protégés de la lumière à
25 ºC et maintenus sous vide afin d’éviter toute adsorption d’eau.
1.4 Préparation des échantillons à différentes activités de l’eau
Les échantillons à trois activités de l’eau différentes de 0,34, 0,76 et 0,95 à 25 ºC
(Figure II.1) ont été préparés par réhydratation du système jus de mûresable de
Fontainebleau d’après le protocole établi pour la courbe de sorption (cf. Section 3.2.6).
À la fin de la préparation, les échantillons ont présentés presque la même concentration
en solutés réactifs (51±4 mg100g1
d’anthocyanes MF). Les activités de l’eau des
échantillons à 25 ºC ont été déterminées à l’aide d’un instrument de mesure du point de
rosée (cf. Section 3.2.5). Pour chaque préparation, un contrôle de la teneur en eau et de
l’activité de l’eau a été effectué avant le traitement thermique.
Figure II.1. L’aspect des produits avant le traitement thermique. L’échantillon de jus de
mûre et sable lyophilisé (a) et à aw de 0,34 (b), 0.76 (c) et 0.95 (d)
(a) (b) (c) (d)
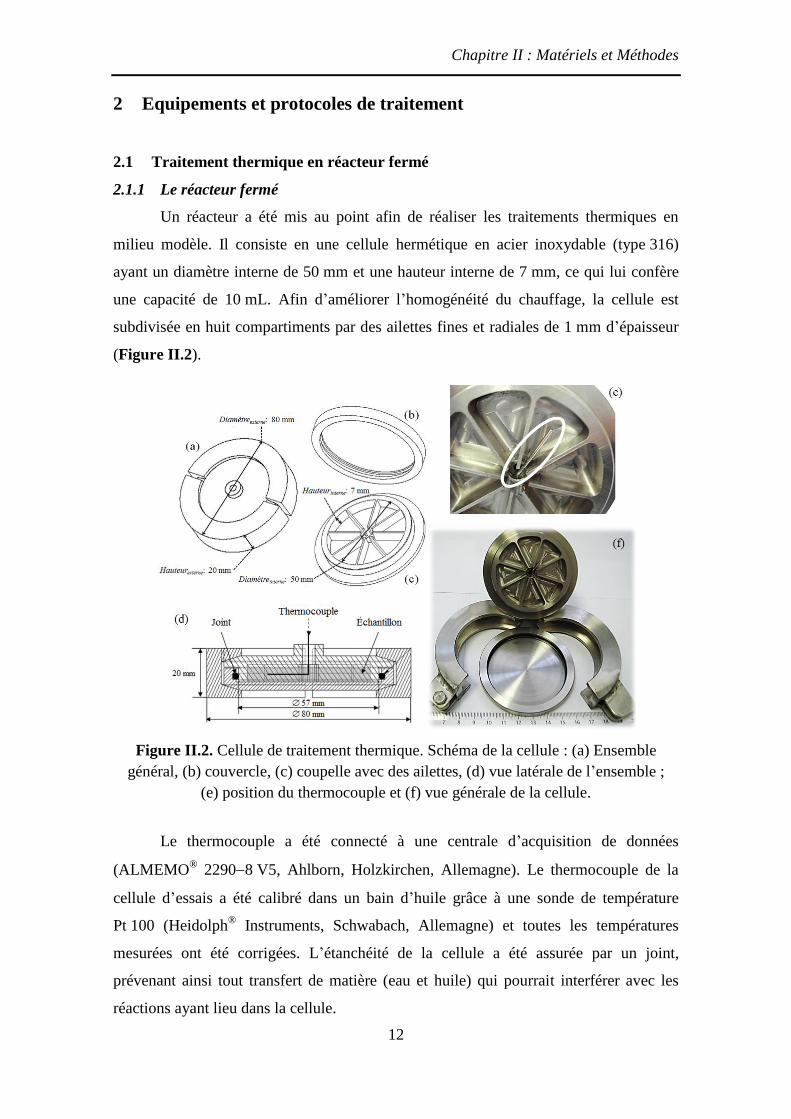
Chapitre II : Matériels et Méthodes
12
2 Equipements et protocoles de traitement
2.1 Traitement thermique en réacteur fermé
2.1.1 Le réacteur fermé
Un réacteur a été mis au point afin de réaliser les traitements thermiques en
milieu modèle. Il consiste en une cellule hermétique en acier inoxydable (type 316)
ayant un diamètre interne de 50 mm et une hauteur interne de 7 mm, ce qui lui confère
une capacité de 10 mL. Afin d’améliorer l’homogénéité du chauffage, la cellule est
subdivisée en huit compartiments par des ailettes fines et radiales de 1 mm d’épaisseur
(Figure II.2).
Figure II.2. Cellule de traitement thermique. Schéma de la cellule : (a) Ensemble
général, (b) couvercle, (c) coupelle avec des ailettes, (d) vue latérale de l’ensemble ;
(e) position du thermocouple et (f) vue générale de la cellule.
Le thermocouple a été connecté à une centrale d’acquisition de données
(ALMEMO® 22908 V5, Ahlborn, Holzkirchen, Allemagne). Le thermocouple de la
cellule d’essais a été calibré dans un bain d’huile grâce à une sonde de température
Pt 100 (Heidolph® Instruments, Schwabach, Allemagne) et toutes les températures
mesurées ont été corrigées. L’étanchéité de la cellule a été assurée par un joint,
prévenant ainsi tout transfert de matière (eau et huile) qui pourrait interférer avec les
réactions ayant lieu dans la cellule.
Chapitre II : Matériels et Méthodes
13
2.1.2 Traitement thermique en cellule
Le traitement thermique s’est fait par l’immersion consécutive de la cellule dans
deux bains d’huile thermostatés. Le premier, ayant une capacité de 5 L (CC 304B,
Huber Kältemaschinenbau, Offenberg, Allemagne), rempli d’huile de silicone
(thermofluide P20.275.50, Huber Kältemaschinenbau, Offenberg, Allemagne), a été
maintenu à très haute température (250 ºC) afin d’assurer une montée rapide de la
température dans la cellule. Le second bain, une friteuse d’un volume de 8 L d’huile
d’oléine de palme, a été maintenu à la température du traitement (100 ºC–180 ºC) grâce
à une sonde de température Pt 100 reliée à un régulateur PID. Le passage de la cellule
du premier bain vers le second s’est fait en moins de 3 s. Le premier bain était agité par
une pompe réglable maintenue à 3500 rpm, tandis que le second a été agité à 1200 rpm
grâce à un agitateur muni de deux turbines de type Rushton (IKA–Werke, Staufen,
Allemagne). L’agitation a assuré la turbulence de l’huile afin d’homogénéiser le champ
de température. Quand le réacteur était immergé dans le premier bain, la température du
bain ne diminuait pas de plus de 5 ºC. La cellule a été maintenue immergée par
l’intermédiaire d’un fil en aluminium. Les temps de traitement ont été variables selon
les échantillons. Après chaque traitement thermique, la cellule a été immédiatement
refroidie dans un bain d’eau à 5 ºC puis séchée dans une serviette en papier.
L’échantillon a été ensuite retiré du réacteur, puis conservé à 18 ºC avant analyses.
2.2 Traitement de papaye verte par DII
L’élaboration de disques de papaye verte formulés par une solution de jus de mûre
a été effectuée d’après la procédure décrite sur la Figure II.3. La papaye verte a été
choisie comme support d’imprégnation en raison de sa texture ferme et son goût neutre
conférés par sa teneur élevée en fibre alimentaire et pectine (Mahattanatawee et al.,
2006). En outre, la faible teneur en solides solubles la rend appropriée pour la
formulation. Le jus de mûre (Rubus adenotrichus) a été choisi comme une source de
composés phénoliques (Acosta-Montoya et al., 2010; Mertz et al., 2007).
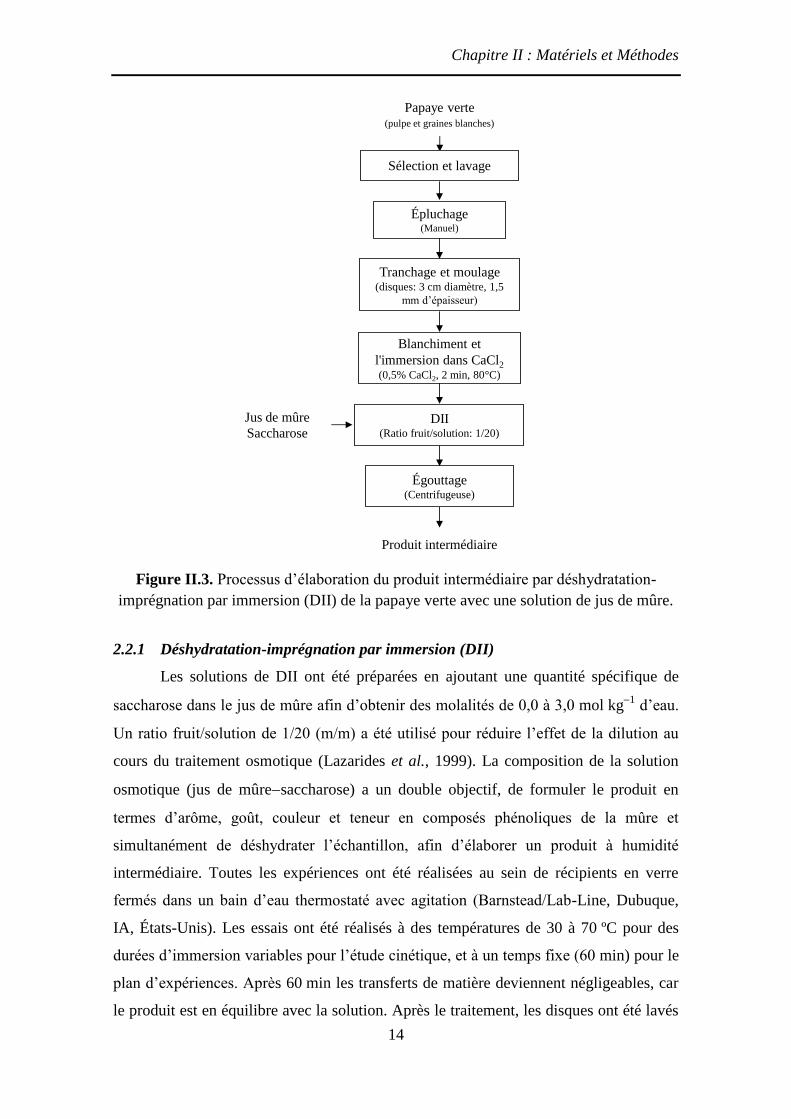
Chapitre II : Matériels et Méthodes
14
Figure II.3. Processus d’élaboration du produit intermédiaire par déshydratation-
imprégnation par immersion (DII) de la papaye verte avec une solution de jus de mûre.
2.2.1 Déshydratation-imprégnation par immersion (DII)
Les solutions de DII ont été préparées en ajoutant une quantité spécifique de
saccharose dans le jus de mûre afin d’obtenir des molalités de 0,0 à 3,0 mol kg1
d’eau.
Un ratio fruit/solution de 1/20 (m/m) a été utilisé pour réduire l’effet de la dilution au
cours du traitement osmotique (Lazarides et al., 1999). La composition de la solution
osmotique (jus de mûresaccharose) a un double objectif, de formuler le produit en
termes d’arôme, goût, couleur et teneur en composés phénoliques de la mûre et
simultanément de déshydrater l’échantillon, afin d’élaborer un produit à humidité
intermédiaire. Toutes les expériences ont été réalisées au sein de récipients en verre
fermés dans un bain d’eau thermostaté avec agitation (Barnstead/Lab-Line, Dubuque,
IA, États-Unis). Les essais ont été réalisés à des températures de 30 à 70 ºC pour des
durées d’immersion variables pour l’étude cinétique, et à un temps fixe (60 min) pour le
plan d’expériences. Après 60 min les transferts de matière deviennent négligeables, car
le produit est en équilibre avec la solution. Après le traitement, les disques ont été lavés
Papaye verte (pulpe et graines blanches)
Sélection et lavage
Épluchage(Manuel)
Tranchage et moulage(disques: 3 cm diamètre, 1,5
mm d’épaisseur)
Blanchiment et
l'immersion dans CaCl2
(0,5% CaCl2, 2 min, 80°C)
DII (Ratio fruit/solution: 1/20)
Égouttage (Centrifugeuse)
Produit intermédiaire
Jus de mûre
Saccharose

Chapitre II : Matériels et Méthodes
15
à l’eau pendant quelques secondes pour enlever l’excès de solution osmotique, puis
égouttés et légèrement séchés avec du papier absorbant.
2.3 Friture de papaye verte formulée
Les chips ont été préparées à partir de disques de papaye verte traités par DII
avec des solutions de jus de mûre à trois concentrations de saccharose différentes
(msaccharose=0, 1,5 et 3,0 mol kg1
) pendant 30 min d’immersion à 50 ºC. Le produit
intermédiaire a été élaboré d’après la procédure décrite sur la Figure II.3. Ensuite, les
disques imprégnés ont été frits dans un bain d’oléine de palme (friteuse Croydon, RJ,
Brésil). La friteuse possède une résistance électrique immergée à 3 cm au-dessus du
fond de la cuve pour chauffer l’huile. Le bain d’huile n’a pas été agité et la température
de l’huile a été contrôlée par un régulateur PID numérique. Le ratio produits/huile a été
de 1/40, pour éviter la chute de température au début de l’opération. Trente cinq disques
ont été distribués uniformément dans un panier métallique avec une grille au-dessus
pour les maintenir immergés à la même profondeur au cours de la friture. Le panier a
été introduit dans le bain d’huile à 140±2 ºC pour des durées d’immersion variables.
Après le traitement, les disques ont été égouttés et l’excès d’huile à la surface a été
enlevé avec du papier absorbant.
Les cinétiques de friture à 140 ºC ont été effectuées sur des disques de papaye
verte imprégnés par traitements de DII avec trois solutions différentes de jus de mûre et
saccharose (msaccharose=0, 1,5 et 3,0 mol kg1
). Les cinétiques de teneur en eau (W(t)
),
teneur en huile (F(t)
) et teneur en anthocyanes (A(t)
) ont été obtenues expérimentalement
afin d’évaluer le temps de friture nécessaire pour atteindre le même niveau de
déshydratation (W=0,07±0,01 kg kg1
BSNH).
Chapitre II : Matériels et Méthodes
16
2.4 Protocoles d’extraction
2.4.1 Protocole d’extraction des échantillons du jus de mûre reconstitué
Le jus traité a été centrifugé à 12 074×g pendant 10 min, en utilisant une
centrifugeuse Sigma 1-15 Microfuge (Fisher Bioblock Scientific, Illkirch, France).
L’échantillon a été ensuite filtré avec un filtre Minisart® SRP 25 (0,45 µm; Sartorius
AG, Göttingen, Allemagne) pour séparer les solides en suspension formés pendant le
chauffage. Les échantillons ont été analysés selon les dosages décrits dans les sections
3.1.1 et 3.1.3, pour les anthocyanes et le brunissement non-enzymatique,
respectivement.
2.4.2 Protocole d’extraction des échantillons du système jus de mûresable
Cinq grammes de l’échantillon homogénéisé ont été extraits avec 45 mL d’eau
distillée, et l’extraction a été effectuée en trois reprises. À chaque reprise, l’échantillon a
été agité à 1800 rpm pendant 5 min à l’aide d’un agitateur vibrant (Heidolph®
Multi Reax, Schwabach, Allemagne) puis il a été centrifugé à 8300×g pendant 10 min à
10 ºC (centrifugeuse Allegra 21, Beckman Coulter, Brea, CA, Etats-Unis), et enfin le
surnageant a été séparé jusqu’à l’obtention d’un résidu de sable incolore. L’extrait a
ensuite été filtré en utilisant un filtre Minisart SRP 25 (0,45 µm; Sartorius AG,
Göttingen, Allemagne) pour séparer les solides en suspension formés au cours du
chauffage. Les extraits ont été analysés selon les méthodes décrites dans les sections
3.1.1 et 3.1.3 pour les anthocyanes et le brunissement non-enzymatique, respectivement.
2.4.3 Extraction des échantillons de papaye verte formulé par DII
10 g de l’échantillon imprégné ont été homogénéisés avec 40 mL d’une solution
acétone/eau (7:3, v/v) et 10 mL d’acétone à l’aide d’un Ultraturrax (IKA, Staufen,
Allemagne), puis extraits deux fois pendant 10 min avec 25 mL de solution acétone/eau
(7:3, v/v) à l’aide d’un bain à ultrasons (Fisher Scientific, modèle FS60H, Pittsburgh,
PA). L’extrait a été séparé par centrifugation à 5660×g pendant 10 min (IEC Multi-RF,
modèle 120, Thermo IEC, Etats-Unis) et par filtration sur coton (pour éviter la rétention
de pigments dans le papier filtre), suivie d’une concentration sous vide dans un
évaporateur rotatif (Büchi 011 et 461, Suisse) pour éliminer l’acétone (à 40 ºC). Les
extraits ont été analysés selon la méthode décrite dans la section 3.1.2 pour le dosage
d’anthocyanes par CLHP. La teneur en eau des disques imprégnés a été déterminée par

Chapitre II : Matériels et Méthodes
17
la méthode 3.1.4 et la teneur en sucres a été calculée en fonction d’un bilan de matière
puisque aucun sucre n’est détecté dans la papaye verte (cf. section 1.1).
2.4.4 Protocole d’extraction des échantillons frits
La Figure II.4 présente la procédure d’extraction d’huile à froid pour éviter la
dégradation des composés d’intérêt et postérieurement l’extraction des anthocyanes
dans l’échantillon délipidé.
Figure II.4. Protocoles d’extraction d’huile dans les chips (a), et extraction des
anthocyanes dans le produit délipidé (b).
6 g des chips préalablement homogénéisés ont été mélangés avec 150 mL éther de
pétrole (40-60º) pour extraire les composés liposolubles par agitation pendant 2 min à
(a) Protocole d’extraction
de l’huile à froid
Chips
Extraction 1
(Vortex, 2 min)
Huile +
Éther de
pétrole
Séparation
(Centrifugeuse, 10 min, 4500 rpm)
Résidus
Évaporation 1
(Rotavapeur, 40 C, 15 min)
Ether de
pétrole
(40-60 )
Évaporation 2
(Étuve sous vide, 70 C, 12 h)
Produit
délipidéHuile
Macération
3
Extraction 1
(Ultraturrax, 1 min)
Extraction 2
(Ultrason, 5 min)
Séparation 1
(Centrifugeuse, 10000 rpm, 5 min)
Séparation 2
(Filtration)
Acétone (70%)
Eau (30%)
Extrait +
acétoneRésidus
Evaporation
(Rotavapeur, 40 C, 10 min)
Extrait
d’anthocyanes
(b) Protocole d’extraction
des anthocyanes

Chapitre II : Matériels et Méthodes
18
température ambiante, à l’aide d’un agitateur vortex à 2000 rpm (Vortex ZX-3, Velp
Scientifica, Italie). L’échantillon a été centrifugé à 5660×g pendant 10 min (IEC Multi-
RF, modèle 120, Thermo IEC, Etats-Unis), puis les phases ont été séparées. La
procédure d’extraction a été répétée trois fois en ajoutant 50 mL de solution d’extraction
sur les résidus solides et en séparant les composés solubles. L’éther de pétrole a été
évaporé à l’aide d’un rotavapeur (Büchi 011 et 461, Suisse) à 40 ºC pendant 15 min.
Des traces d’éther ont été enlevées par chauffage du ballon dans une étuve à 70 ºC sous
pression réduite pendant 12 h. Le ballon a été refroidi pendant 1 h dans le dessiccateur à
température ambiante, et pesé avec une précision de 1 mg. Le solvant résiduel dans le
précipité a été enlevé et l’échantillon délipidé a été placé dans un récipient protégé de la
lumière avant l’extraction des anthocyanes. Ensuite les anthocyanes ont été extraites du
produit dégraissé (8,000 g) d’après la procédure décrite dans la section 2.4.3 et la
Figure II.4b.
3 Méthodes de mesures
3.1 Analyses physico-chimiques
3.1.1 Dosage des anthocyanes par la méthode du différentiel du pH
Les anthocyanes subissent des transformations structurelles réversibles avec le
changement de pH, manifestées par des spectres d’absorption différents. La forme
colorée (oxonium) prédomine à pH 1,0 et la forme incolore (hémicétal) à pH 4,5. La
méthode du différentiel de pH est basée sur cette réaction, et permet une mesure rapide
et précise des anthocyanes totales, même en présence de pigments polymérisés dégradés
et d’autres composés interférents (Giusti et Wrolstad, 2001). L’analyse
spectrophotométrique a été corrélée à la méthode de dosage par CLHP (Lee et al.,
2008), et en 2005, la méthode du différentiel de pH a reçu l’approbation en première
action du Conseil International de Méthodes Officielles de l’Association of Analytical
Communities (AOAC) (Lee et al., 2005).
Après dilution du jus de mûre dans deux solutions tampon à pH 1,0 et 4,5,
l’absorbance a été mesurée à 510 nm (absorbance maximale) et à 700 nm pour corriger
la turbidité. Les mesures ont été effectuées à l’aide d’un spectrophotomètre à
microplaques (Infinite 200, Tecan France SAS, Lyon, France), en utilisant des plaques
en polypropylène transparent à 96 puits. Les valeurs lues à deux longueurs d’ondes pour

Chapitre II : Matériels et Méthodes
19
chaque dilution permettent de calculer la concentration en anthocyanes suivant
l’équation (1). La teneur en anthocyanes totales (A(t)
) a été exprimée en équivalents de
cyanidine 3-glucoside, l’anthocyane majoritaire (95 %) de l’espèce R.adenotrichus
(Mertz et al., 2007).
( ) 1 3( ) 10t A MW DF
A mg Ll
(1)
où, A est l’absorbance de l’échantillon calculée par A = (A510nm – A700nm)pH 1,0 –
(A510nm – A700nm)pH 4,5; MW est la masse molaire de la cyanidine 3-glucoside = 449,2 g
mol1
; DF le facteur de dilution de l’échantillon = 10 à 50; ε est le coefficient
d’absorption molaire de l’anthocyane majoritaire égal à 26 900 L mol1
cm1
et l est le
trajet optique = 0,52 cm (valeur calculée pour la géométrie spécifique du puits avec
200 μL de solution) et 103 est le facteur de conversion de g à mg. Le coefficient de
variation de la mesure est estimé à 5 %
3.1.2 Dosage des anthocyanes par CLHP
Le dosage des anthocyanes par chromatographie liquide haute performance
(CLHP) a été effectué pour caractériser les échantillons de papaye verte imprégnée
d’une solution de jus de mûre par DII et pour valider la méthode du différentiel de pH
par co-injection d’un étalon commercial de kuromanine (cyanidine 3-glucoside) avec
une concentration de 593,3 mg L1
.
Les composés phénoliques ont été analysés à l’aide d’une chaîne CLHP équipée
d’un détecteur à barrettes de diodes (Shimadzu Scientific Instruments, Kyoto, Japon).
La détection a été réalisée entre 200 et 600 nm suivant la méthode décrite par Mertz et
al. (2007). La séparation a été effectuée à l’aide d’une colonne C18 (Phenomenex,
Torrance, CA, Etats-Unis) thermostatée à 30 ºC. Les solvants utilisés ont été A :
eau / acide formique (98:2 v/v) et B : acétonitrile / eau / acide formique (80:18:2 v/v).
Le débit a été de 0,3 mL min1
et le volume d’injection de 20 μL. Les conditions
d’élution ont été les suivantes : de 5 à 25 % B en 20 min, de 25 à 100 % B en 5 min et
de 100 à B 5 % en 5 min, suivi d’un équilibrage de la colonne durant 10 min à 5 % B.
La teneur en anthocyanes (mg kg1
) a été exprimée en équivalents de cyanidine 3-
glucoside.

Chapitre II : Matériels et Méthodes
20
3.1.3 Détermination de l’indice de brunissement non enzymatique
L’indice de brunissement non-enzymatique a été calculé d’après la méthode de
Buglione et Lozano (2002) pour les jus rouges. Un spectrophotomètre à microplaques a
été utilisé avec des plaques de polypropylène transparent de 96 puits. L’absorbance de
l’échantillon a été mesurée, après dilution du jus dans une solution tampon à pH 1,0, à
deux longueurs d’onde: à 510 nm, l’absorbance maximale des anthocyanes, et à 420 nm
pour l’absorbance à la fois de produits de brunissement et des anthocyanes. L’indice de
brunissement non-enzymatique a été calculé par l’équation (2)
( )
510 420/t
nm nmB A A (2)
La valeur du brunissement non enzymatique à l’équilibre (B∞) a été déterminée
après un chauffage prolongé à température élevée. Trois essais ont été réalisés sur le jus
de mûre reconstitué chauffé à 180 ºC pendant 30 et 45 min. L’indice B(t)
a été ensuite
calculé. Aucune différence significative (p < 0,05) a été trouvée entre les valeurs pour
les deux temps de chauffage, montrant que la valeur d’équilibre a été atteint à
B∞ = 0,25±0,02. Le coefficient de variation de la mesure a été estimé à 3 %
3.1.4 Détermination de la teneur en eau
La mesure de la teneur en eau a été réalisée sur le système jus de mûre–sable de
Fontainebleau, la papaye verte imprégnée d’une solution de jus de mûre par DII et les
chips obtenues selon la méthode officielle (AOAC, 1990). La méthode par dessiccation
sous pression réduite dans une étuve permet de sécher à 70 ºC sous une pression de
30 kPa environ. Des coupelles en aluminium de 5,5 cm de diamètre ont été pré-pesées
avec une balance analytique d’une précision de 104
g, après séchage à 70 ºC pendant
1 h puis refroidies. Une prise d’essai de 15 g a été répartie en monocouche dans trois
coupelles et puis séchée dans l’étuve sous vide à 70 ºC pendant 24 h au minimum. Le
coefficient de variation de la mesure a été estimé à 2,0 %
3.1.5 Identification du 5- hydroxyméthyl furfural par analyse GC-MS
Les composés volatils des échantillons du jus de mûre avec du sable de
Fontainebleau traités thermiquement ont été extraits avec une solution de
dichlorométhane / pentane à laquelle on a ajouté du sulfate de sodium. 1 µL de l’extrait
a été analysé à l’aide d’un chromatographe en phase gazeuse (Agilent, modèle 6890 HP,
Agilent Technology, Massy, France) en mode d’injection automatique sur une colonne
Chapitre II : Matériels et Méthodes
21
polaire capillaire (DB WAX) et en conformité avec les paramètres décrits dans le
Tableau II.2. Le chromatographe a été couplé à un spectromètre de masse (Agilent
modèle 5973, Agilent Technology, Massy, France). La spectrométrie de masse a été
réalisée en utilisant un détecteur de masse sélective fonctionnant en mode d’impact
électronique avec une source d’ionisation interne de 70 eV. Le spectromètre de masse a
été balayé de m/z 35 à 350. L’identification des composés volatils a été réalisée par
comparaison des temps de rétention et des spectres de masse par rapport à ceux trouvés
dans les bases de données des spectres de composés connus de Wiley, NIST et de
l’INRA.
Tableau II.2. Caractéristiques du chromatographe Agilent 6980 HP et paramètres du
spectromètre de masse.
Chromatographe Agilent 6980 HP
Colonne : DB WAX (polaire) Longueur 30 m ; diamètre 0,25 mm ; 0,25 µm
d’épaisseur film de phase
Programmation de la température du
four
De 40 ºC à 180 ºC, 3 ºC min1
Isotherme : 180 ºC pendant 20 min
De 180 ºC à 230 ºC, 6 ºC min1
Isotherme : 230 ºC pendant 5 min
Température de l’injecteur 250 ºC
Débit colonne (gaz vecteur : Hélium) 1,5 mL min1
Injection 1 µL en mode split
Spectromètre de masse : Agilent 5973 Network mass selective detector
Mode IE+ Impact électronique positif
Énergie d’ionisation 70 eV
Température ligne de transfert 260 ºC
Intervalle de masse balayée 35 à 350 u.m.
3.1.6 Détermination de la capacité antioxydante par la méthode ORAC
La mesure de la capacité antioxydante par la méthode ORAC (Oxygen Radical
Absorbance Capacity) a été effectuée d’après Ou et al. (2001), en utilisant un
spectrofluorimètre à microplaques (Infinite 200, Tecan France SAS, Lyon, France) avec
des plaques noires en polypropylène de 96 puits (Gancel et al., 2008). La valeur ORAC
a été exprimée en micromoles d’équivalents de trolox par litre de jus (µmol L1
). Le
coefficient de variation a été estimé à 10,7 %.
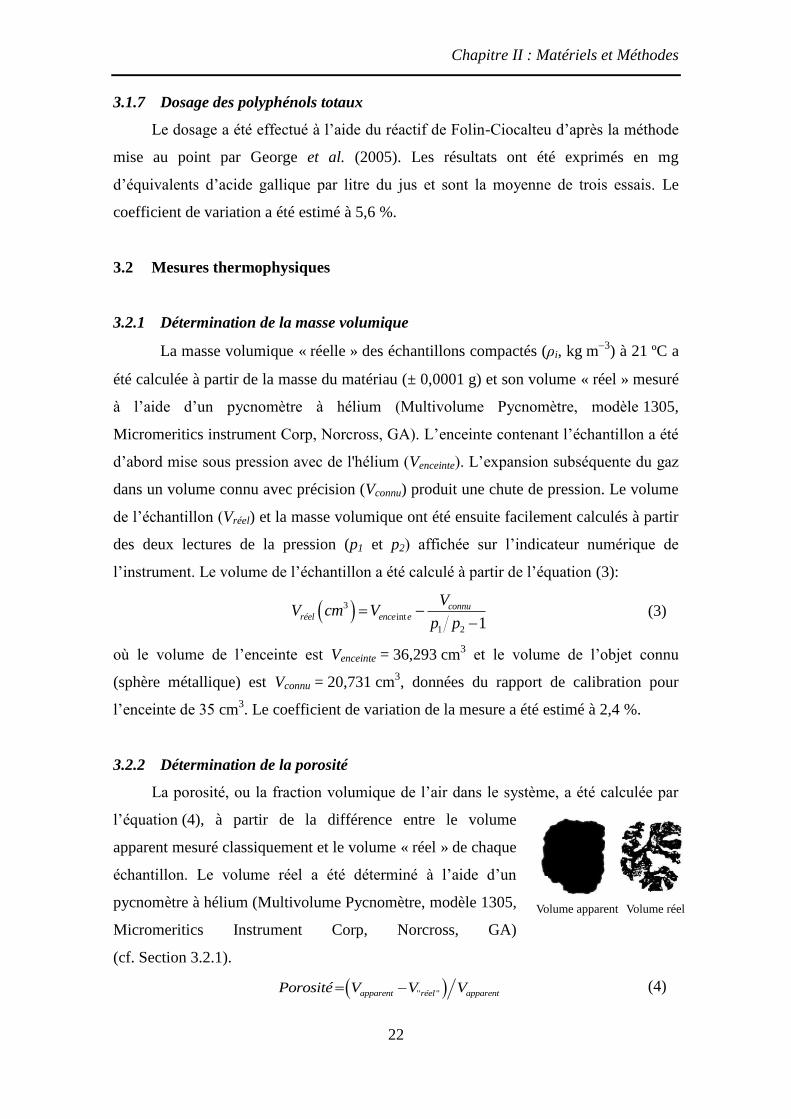
Chapitre II : Matériels et Méthodes
22
3.1.7 Dosage des polyphénols totaux
Le dosage a été effectué à l’aide du réactif de Folin-Ciocalteu d’après la méthode
mise au point par George et al. (2005). Les résultats ont été exprimés en mg
d’équivalents d’acide gallique par litre du jus et sont la moyenne de trois essais. Le
coefficient de variation a été estimé à 5,6 %.
3.2 Mesures thermophysiques
3.2.1 Détermination de la masse volumique
La masse volumique « réelle » des échantillons compactés (ρi, kg m3
) à 21 ºC a
été calculée à partir de la masse du matériau (± 0,0001 g) et son volume « réel » mesuré
à l’aide d’un pycnomètre à hélium (Multivolume Pycnomètre, modèle 1305,
Micromeritics instrument Corp, Norcross, GA). L’enceinte contenant l’échantillon a été
d’abord mise sous pression avec de l'hélium (Venceinte). L’expansion subséquente du gaz
dans un volume connu avec précision (Vconnu) produit une chute de pression. Le volume
de l’échantillon (Vréel) et la masse volumique ont été ensuite facilement calculés à partir
des deux lectures de la pression (p1 et p2) affichée sur l’indicateur numérique de
l’instrument. Le volume de l’échantillon a été calculé à partir de l’équation (3):
3
int
1 2 1
connuréel ence e
VV cm V
p p
(3)
où le volume de l’enceinte est Venceinte = 36,293 cm3 et le volume de l’objet connu
(sphère métallique) est Vconnu = 20,731 cm3, données du rapport de calibration pour
l’enceinte de 35 cm3. Le coefficient de variation de la mesure a été estimé à 2,4 %.
3.2.2 Détermination de la porosité
La porosité, ou la fraction volumique de l’air dans le système, a été calculée par
l’équation (4), à partir de la différence entre le volume
apparent mesuré classiquement et le volume « réel » de chaque
échantillon. Le volume réel a été déterminé à l’aide d’un
pycnomètre à hélium (Multivolume Pycnomètre, modèle 1305,
Micromeritics Instrument Corp, Norcross, GA)
(cf. Section 3.2.1).
" "apparent réel apparentPorosité V V V (4)
Volume apparent Volume réel
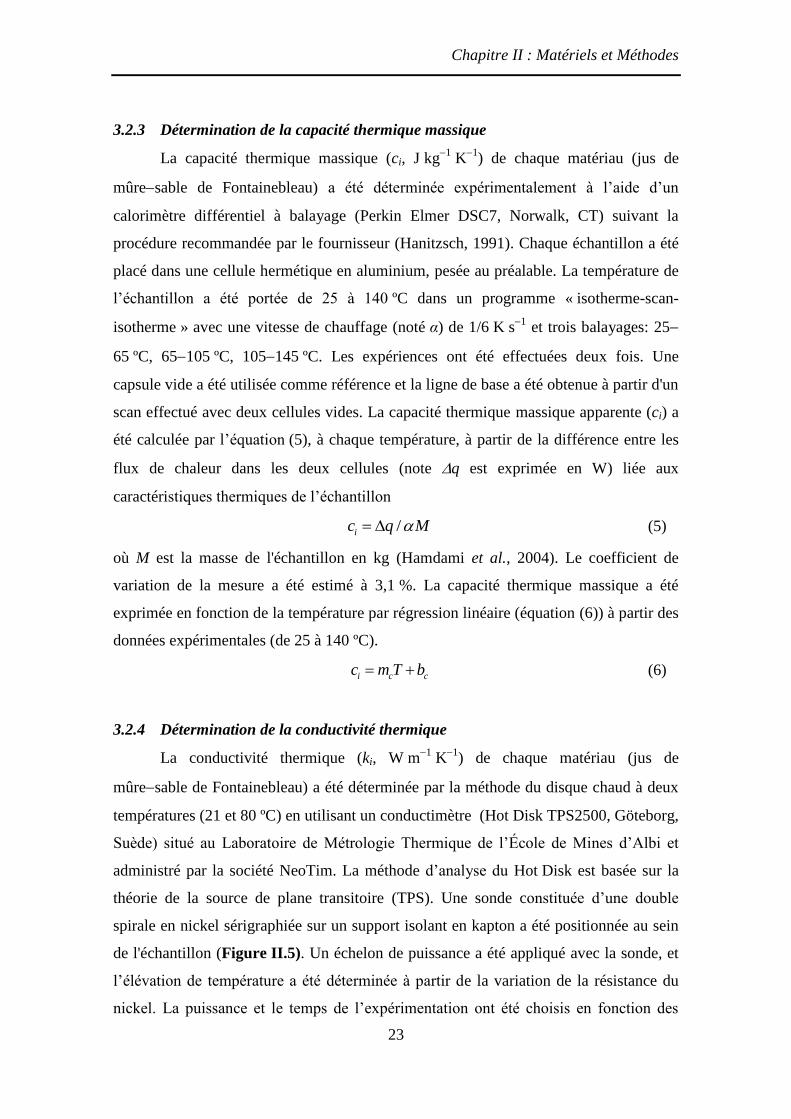
Chapitre II : Matériels et Méthodes
23
3.2.3 Détermination de la capacité thermique massique
La capacité thermique massique (ci, J kg1
K1
) de chaque matériau (jus de
mûresable de Fontainebleau) a été déterminée expérimentalement à l’aide d’un
calorimètre différentiel à balayage (Perkin Elmer DSC7, Norwalk, CT) suivant la
procédure recommandée par le fournisseur (Hanitzsch, 1991). Chaque échantillon a été
placé dans une cellule hermétique en aluminium, pesée au préalable. La température de
l’échantillon a été portée de 25 à 140 ºC dans un programme « isotherme-scan-
isotherme » avec une vitesse de chauffage (noté α) de 1/6 K s1
et trois balayages: 25
65 ºC, 65105 ºC, 105145 ºC. Les expériences ont été effectuées deux fois. Une
capsule vide a été utilisée comme référence et la ligne de base a été obtenue à partir d'un
scan effectué avec deux cellules vides. La capacité thermique massique apparente (ci) a
été calculée par l’équation (5), à chaque température, à partir de la différence entre les
flux de chaleur dans les deux cellules (note q est exprimée en W) liée aux
caractéristiques thermiques de l’échantillon
/ic q M (5)
où M est la masse de l'échantillon en kg (Hamdami et al., 2004). Le coefficient de
variation de la mesure a été estimé à 3,1 %. La capacité thermique massique a été
exprimée en fonction de la température par régression linéaire (équation (6)) à partir des
données expérimentales (de 25 à 140 ºC).
i c cc m T b (6)
3.2.4 Détermination de la conductivité thermique
La conductivité thermique (ki, W m1
K1
) de chaque matériau (jus de
mûresable de Fontainebleau) a été déterminée par la méthode du disque chaud à deux
températures (21 et 80 ºC) en utilisant un conductimètre (Hot Disk TPS2500, Göteborg,
Suède) situé au Laboratoire de Métrologie Thermique de l’École de Mines d’Albi et
administré par la société NeoTim. La méthode d’analyse du Hot Disk est basée sur la
théorie de la source de plane transitoire (TPS). Une sonde constituée d’une double
spirale en nickel sérigraphiée sur un support isolant en kapton a été positionnée au sein
de l'échantillon (Figure II.5). Un échelon de puissance a été appliqué avec la sonde, et
l’élévation de température a été déterminée à partir de la variation de la résistance du
nickel. La puissance et le temps de l’expérimentation ont été choisis en fonction des
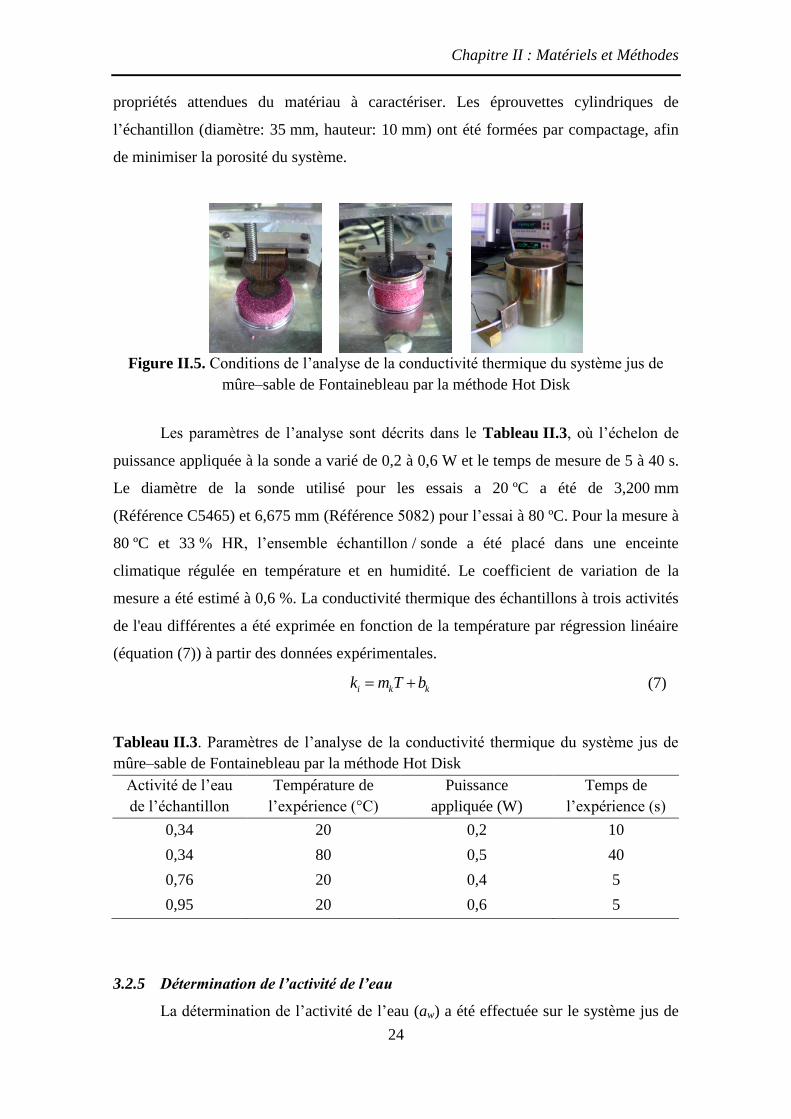
Chapitre II : Matériels et Méthodes
24
propriétés attendues du matériau à caractériser. Les éprouvettes cylindriques de
l’échantillon (diamètre: 35 mm, hauteur: 10 mm) ont été formées par compactage, afin
de minimiser la porosité du système.
Figure II.5. Conditions de l’analyse de la conductivité thermique du système jus de
mûre–sable de Fontainebleau par la méthode Hot Disk
Les paramètres de l’analyse sont décrits dans le Tableau II.3, où l’échelon de
puissance appliquée à la sonde a varié de 0,2 à 0,6 W et le temps de mesure de 5 à 40 s.
Le diamètre de la sonde utilisé pour les essais a 20 ºC a été de 3,200 mm
(Référence C5465) et 6,675 mm (Référence 5082) pour l’essai à 80 ºC. Pour la mesure à
80 ºC et 33 % HR, l’ensemble échantillon / sonde a été placé dans une enceinte
climatique régulée en température et en humidité. Le coefficient de variation de la
mesure a été estimé à 0,6 %. La conductivité thermique des échantillons à trois activités
de l'eau différentes a été exprimée en fonction de la température par régression linéaire
(équation (7)) à partir des données expérimentales.
i k kk m T b (7)
Tableau II.3. Paramètres de l’analyse de la conductivité thermique du système jus de
mûre–sable de Fontainebleau par la méthode Hot Disk
Activité de l’eau
de l’échantillon
Température de
l’expérience ( C)
Puissance
appliquée (W)
Temps de
l’expérience (s)
0,34 20 0,2 10
0,34 80 0,5 40
0,76 20 0,4 5
0,95 20 0,6 5
3.2.5 Détermination de l’activité de l’eau
La détermination de l’activité de l’eau (aw) a été effectuée sur le système jus de
Chapitre II : Matériels et Méthodes
25
mûre–sable de Fontainebleau à l’aide d’un instrument de mesure du point de rosée
(Aqualab, modèle CX-2, Decagon Devices, Inc., Pullman, Washington) à 25 ºC. Une
vérification de la justesse de la mesure de l’instrument a été réalisée avant les analyses
avec une solution aqueuse de chlorure de sodium saturée (aw = 0,747±0,003 à 25 ºC).
Pour chaque produit, trois mesures ont été effectuées. Le coefficient de variation de la
mesure a été estimé à 0,6 %.
3.2.6 Détermination de l’isotherme de sorption
Comme une alternative à la méthode isopiestique (Sablani et al., 2007) couramment
utilisée, l’isotherme de sorption a été construite par ajout de quantités croissantes d’eau
directement dans les échantillons pour empêcher tout développement microbien. Ces
mélanges homogénéisés, ont été placés dans une enceinte sous vide pendant 48 h pour
atteindre les conditions d’équilibre. Une fois l’équilibre atteint, la teneur en eau de
l’échantillon a été mesurée par la méthode gravimétrique (cf. Section 3.1.4) et l’activité
de l’eau a été mesurée à 25 ºC (cf. Section 3.2.5). Tous les échantillons (système jus de
mûresable et papaye verte imprégnés de jus de mûre) ont été préparés trois fois. Les
équations des courbes de sorption ont été établies en utilisant un logiciel d’ajustement
de courbes (TableCurve®
2D, Jandel Scientific, CA).
3.2.7 Température
La température au cœur et à la surface des chips de papaye verte formulés par
DII a été enregistrée à l’aide des thermocouples chemisés miniatures à gaine métallique
semi-rigide type K de 0,25 mm d’épaisseur (Référence 406-477, TC Direct, Dardilly,
France). Le thermocouple a été connecté à une centrale d’acquisition de données
(Prova® 800, Prova Instruments Inc., Zhejiang, China) et la température a été
enregistrée à 1 Hz.

Chapitre II : Matériels et Méthodes
26
4 Expressions et analyses des résultats
4.1 Transfert de matière lors de la DII
Les traitements de DII ont été effectués avec trois solutions différentes
(msaccharose= 0, 1,5 et 3,0 mol kg1
) à 50 ºC pour des temps d’immersion croissants (t = 2,
4, 8, 15, 30 et 60 min). Les relations permettant de calculer la perte en eau (WL) le gain
en sucre (SG) et le gain en anthocyanes (AG) sont regroupées dans le Tableau II.4.
Tableau II.4. Expression des résultats pour la déshydratation-imprégnation par
immersion
Réponse Équation Variables
Perte en eau
(WL, kg kg1
papaye verte)
( ) ( )( ) (0)
(0)
t tt m W
WL Wm
(8) W
(0) : teneur en eau et
m(0)
: masse de disques papaye
verte au temps initial;
W(t)
: teneur en eau et
m(t)
: masse de l’échantillon
déshydraté au temps t
d’immersion
Gain en sucre
(SG, kg kg1
papaye verte)
( ) ( )(0)
(0)
t tS mSG S
m (9)
S(0)
: teneur en saccharose de la
papaye verte au temps initial
(S(0)
= 0)
S(t)
: teneur en saccharose de
l’échantillon imprégné au temps t
d’immersion
Gain en
anthocyanes
(AG, kg kg1
papaye verte)
( ) ( )(0)
(0)
t tA mAG A
m (10)
A(0)
: teneur en anthocyanes de la
papaye verte au temps initial
(A(0)
=0)
A(t)
: teneur en anthocyanes de
l’échantillon imprégné au temps t
d’immersion
4.2 Analyse de la cinétique de dégradation des anthocyanes et du BNE
La modélisation des cinétiques réactionnelles a été menée pour développer un
outil, qui puisse prédire la dégradation des anthocyanes et le brunissement non
enzymatique dans du jus de mûre reconstitué soumis à des opérations thermiques
agroalimentaires à hautes températures (friture, séchage par atomisation, stérilisation,
extrusion, entre autres) dans des conditions isothermes ou non-isothermes. Les

Chapitre II : Matériels et Méthodes
27
équations sont donc présentées pour évaluer les effets cumulatifs de la cinétique
thermique (T(t)
) sur la dégradation des anthocyanes (A(t)
) et le brunissement non-
enzymatique (B(t)
).
4.2.1 Les modèles cinétiques
Deux modèles cinétiques ont été considérés pour la description du
comportement de la teneur en anthocyanes (A(t)
) et du brunissement non-enzymatique
(B(t)
) au cours du traitement thermique. Les réactions de A(t)
et B(t)
ont été décrites en
termes d’une cinétique irréversible de premier ordre.
( )
( )t
t
X
d Xk X
dt (11)
où X(t)
pourraient être A(t)
ou (B(t) B
∞); kX est la constante de vitesse de la réaction. B
∞ a
été déterminé expérimentalement que B∞=0,25±0,02. Un second modèle a été proposé
où les réactions de A(t)
et B(t)
sont décrites en termes de deux réactions séquentielles
irréversibles de premier ordre en fonction du domaine de température.
( )
( )
1 2
tt
X X
dXk k X
dt où
( )
1
( )
2
0 at
0 at
t
X transition
t
X transition
k T T
k T T
(12)
où Ttransition est la température qui divise les deux domaines ; kX1 et kX2 sont les
constantes de réaction du premier et deuxième intervalle de température
La dépendance de la constante de réaction kX ou kXi (s1
) par rapport à la
température absolue du système (T (K)) est traduite par l’équation d’Arrhenius
(équation (13))
( )
1 1exp
Xi
Xi t
a
Xiref
ref i
E
R T Tk k
(13)
où kXi ref , Ea Xi et R sont respectivement la constante de réaction à la température de
référence (s1
), l’énergie d'activation apparente (J mol1
) et la constante des gaz parfaits
(8,314 J mol1
K1
). La température de référence a été choisie au milieu de l’intervalle
de température étudié. Au cours du traitement thermique, la température a été
enregistrée durant les périodes non-isothermes (chauffage, entretien et refroidissement).
Chaque cinétique thermique (T(t)
) a été ajustée à l’aide d’une fonction spline de lissage
« csaps » (Matlab®, version 7, The MathWorks Inc, Natick, MA, Etats-Unis).
Chapitre II : Matériels et Méthodes
28
4.2.2 Identification des paramètres cinétiques
La dégradation du composé X(t)
lors du traitement thermique non-isotherme a été
prise en compte dans les équations (11), ou (12) avec (13). Ainsi, la valeur X, prédit à
l’instant t (X(t)
), a été calculée par intégration (modèle général), comme suit:
( ) 0
1 1 2 2ˆ / exp( )t
X ref X X ref XX X k k où
( )
1
( )
2
0 at
0 at
t
X ref transition
t
X ref transition
k T T
k T T
(14)
où ( ) ( )ˆˆ t tX A ou ( ) ( )ˆ ˆt tX B B , pour la cinétique de dégradation des anthocyanes
ou du brunissement non-enzymatique (BNE), respectivement. βXi est l’historique
thermique pour X dans l’intervalle i de température, et correspond au temps équivalent
isotherme à la température de référence (Tref).
( )
0
1 1exp a
t
ref i
XiXi
tE
dtR T T
(15)
L’intégrale de l’équation (15) a été calculée comme l'intégrale analytique directe
de la fonction spline de lissage de ( )exp (1/ 1/ ) /t
a Xi ref iE T T R . Deux paramètres
cinétiques Xirefk et XiaE ont été estimés à partir des données expérimentales.
Le modèle est non linéaire et les deux paramètres ont été estimés en minimisant
la somme des carrés des écarts (MSE) entre des valeurs mesurées ( ( )tX ) et prédites
( ( )ˆ tX ) (equation (16)) grâce à la méthode de Nelder-Mead simplex (Lagarias et al.,
1998) à l’aide du logiciel Matlab® (version 7, The MathWorks Inc, Natick, MA, Etats-
Unis).
2
( ) ( )
1
1 ˆ( )
i i
nt t
i
MSE X Xn p
(16)
où n est le nombre de données, et p le nombre de paramètres (p=2). Le minimum de la
fonction objective (16) a été recherché avec différentes valeurs d’initialisation pour les
paramètres (kref et Ea) afin d’éviter un minimum local (van Boekel, 1996). L’intervalle
de confiance pour chaque paramètre a été déterminé par la méthode de Monte-Carlo
(Hessler, 1997) avec 2000 simulations.
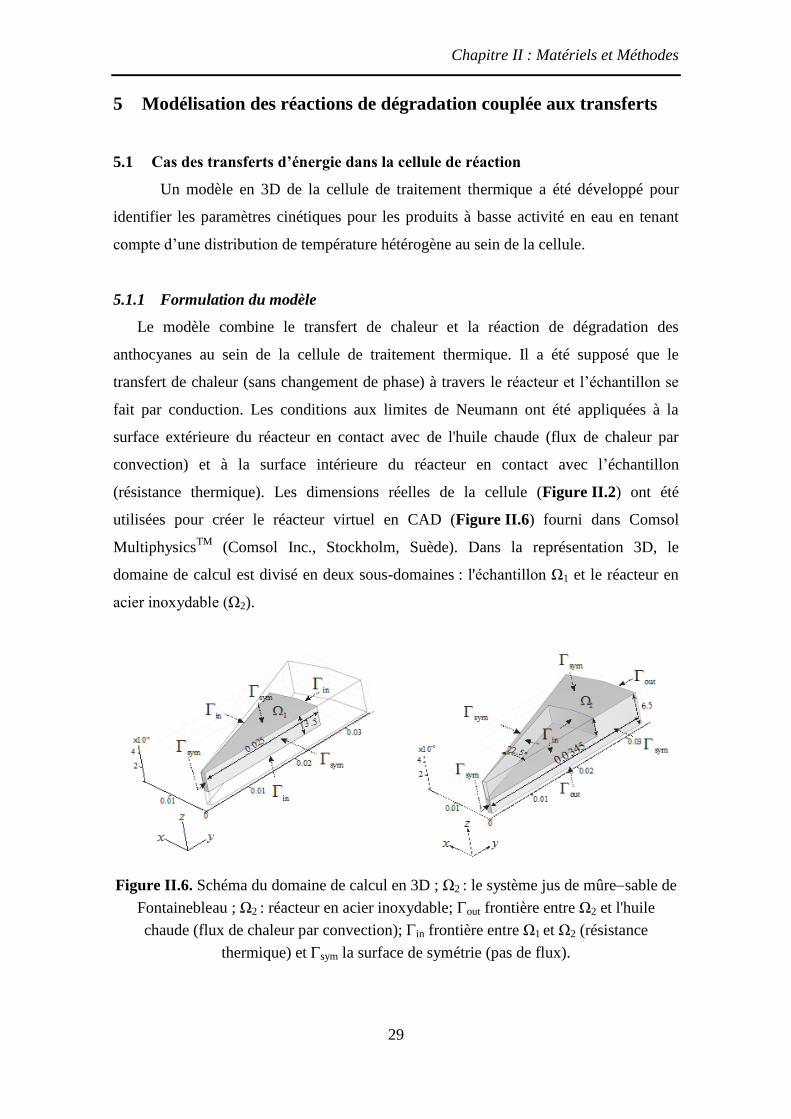
Chapitre II : Matériels et Méthodes
29
5 Modélisation des réactions de dégradation couplée aux transferts
5.1 Cas des transferts d’énergie dans la cellule de réaction
Un modèle en 3D de la cellule de traitement thermique a été développé pour
identifier les paramètres cinétiques pour les produits à basse activité en eau en tenant
compte d’une distribution de température hétérogène au sein de la cellule.
5.1.1 Formulation du modèle
Le modèle combine le transfert de chaleur et la réaction de dégradation des
anthocyanes au sein de la cellule de traitement thermique. Il a été supposé que le
transfert de chaleur (sans changement de phase) à travers le réacteur et l’échantillon se
fait par conduction. Les conditions aux limites de Neumann ont été appliquées à la
surface extérieure du réacteur en contact avec de l'huile chaude (flux de chaleur par
convection) et à la surface intérieure du réacteur en contact avec l’échantillon
(résistance thermique). Les dimensions réelles de la cellule (Figure II.2) ont été
utilisées pour créer le réacteur virtuel en CAD (Figure II.6) fourni dans Comsol
MultiphysicsTM
(Comsol Inc., Stockholm, Suède). Dans la représentation 3D, le
domaine de calcul est divisé en deux sous-domaines : l'échantillon Ω1 et le réacteur en
acier inoxydable (Ω2).
Figure II.6. Schéma du domaine de calcul en 3D ; Ω2 : le système jus de mûresable de
Fontainebleau ; Ω2 : réacteur en acier inoxydable; out frontière entre Ω2 et l'huile
chaude (flux de chaleur par convection); in frontière entre Ω1 et Ω2 (résistance
thermique) et sym la surface de symétrie (pas de flux).

Chapitre II : Matériels et Méthodes
30
Le problème thermique peut être décrit avec l'équation de diffusion thermique
0ii i i i
Tc k T
t
dans (0, )i t sur 1 à 2i (17)
où Ti (x, y, z, t) est la température, i est la densité (kg m–3
), ci est la capacité thermique
massique (J kg –1
K–1
), ki est la conductivité thermique (W m–1
K–1
).
Les trois conditions aux limites sont:
2 2 oil 2( ) 0k T n h T T surface extérieure (0, )cout t (18)
( )0
i j
i i
t
T Tk T n
R
surface intérieure (0, )cin t sur ( ) 1 à 2i j (19)
0iT n surface symétrique
(0, )csym t sur i 1 et 2 (20)
où hoil (W m–2
K–1
) est le coefficient de transfert thermique entre la surface extérieure
du réacteur en contact avec l'huile chaude et T∞ est la température de l'huile chaude,
Rt (m2 K W
–1) est la résistance thermique entre la surface intérieur du réacteur et
l’échantillon, tc est le temps de calcul total (s) et n est le vecteur normal unitaire (m).
La condition initiale est une température uniforme au début de l’expérience (T0=21 ºC) :
0iT T dans 0i sur 1 to 2i (21)
5.1.2 Résolution numérique
Le système du réacteur thermique se compose de trois variables d’état, deux
températures Ti (la cellule en acier inoxydable et l’échantillon) et A(t)
, qui dépendent des
équations (17) et (11) respectivement. Le système a été résolu en utilisant la méthode
des éléments finis sur le code commercial Comsol MultiphysicsTM
(Comsol Inc.,
Stockholm, Suède), avec des conditions aux limites données par les équations (18)(20)
et la condition initiale donnée par l’équation (21).
5.1.3 Estimation des paramètres du modèle de transfert de chaleur
Pour l’identification du coefficient de convection hoil, de l’eau a été chauffée
dans la cellule hermétique à T∞ = 100, 120 et 140 ºC, dans les conditions décrites à la
section 2.1.2, où la température de l’eau (T(t)
) au sein de la cellule a été enregistrée à
1 Hz. L’eau a été choisie comme fluide d’essai, par deux raisons: (a) les propriétés
thermophysiques de l’eau saturée à haute température sont bien connues (Wagner et
Pruss, 2002), (b) l’eau en ébullition a permis de garantir une distribution uniforme de la
température en considérant la résistance thermique entre l’eau et la surface intérieure du
Chapitre II : Matériels et Méthodes
31
réacteur comme non-limitante (Rt=1×10⁵
m2 K W
1). La somme des carrés des écarts
entre le profil de température expérimental ( ( )
1
tT ) et simulé ( ( )
1ˆ tT ) a été minimisée par
régression non linéaire d’après la méthode décrite dans la section 5.1.5 pour obtenir les
valeurs estimées de hoil.
Le paramètre Rt a été déterminé pour chaque échantillon (aw 0,34, 0,76 et 0,95)
car cette résistance thermique de contact dépend des propriétés thermophysiques de
l’échantillon (liquide ou solide, par exemple). La température de l’échantillon (T(t)
) à
l’intérieur de la cellule a été enregistrée à 1 Hz. La somme des carrés des écarts entre le
profil de température expérimental ( ( )
1
tT ) et simulé ( ( )
1ˆ tT ) pour les trois températures
(T∞
: 100, 120 et 140 ºC) simultanément a été minimisé par régression non linéaire selon
la méthode décrit dans la section 5.1.5 afin d’obtenir les valeurs estimées de Rt pour les
échantillons du système jus de mûre sable de Fontainebleau aux trois activités de l’eau
différentes (aw 0,34, 0,76 et 0,95).
5.1.4 Estimation des paramètres du modèle cinétique réactionnelle
Pour estimer les paramètres cinétiques (kref et Ea) de la dégradation des
anthocyanes (A(t)
) à haute température (T∞ : 100140 ºC), tous les paramètres du
système identifiés précédemment (cf. section 5.1.3) ont été introduits dans le modèle en
3D avec transfert de chaleur et réaction. La somme des carrés des écarts entre la
concentration d’anthocyanes expérimentale ( ( )tA ) et simulée ( ( )ˆ tA ) a été minimisée par
régression non linéaire d’après la méthode décrite dans la section 5.1.5 afin d’obtenir les
paramètres. Ils ont été déterminés pour chaque échantillon (aw 0,34, 0,76 et 0,95) et
pour les trois températures du traitement thermique (T∞
: 100, 120 et 140 ºC)
simultanément.
5.1.5 Analyse statistique
L’identification du coefficient de convection (hoil), de la résistance thermique (Rt)
ainsi que les paramètres cinétiques (kref et Ea) ont été effectués par la méthode des
moindres carrés pour des fonctions non linéaires. L’algorithme de Levenberg-Marquardt
(Seber et Wild, 2003) a été utilisé par la fonction « lsqcurvefit » (Matlab®, The
MathWorks Inc, Natick, MA, Etats-Unis). La fonction « lsqcurvefit » retourne les
paramètres ajustés (beta), la matrice des résidus (residual) et la matrice jacobienne de la
fonction (jacobian). Le minimum de la fonction de la somme de carrés a été évalué avec
Chapitre II : Matériels et Méthodes
32
différentes valeurs d’initialisation pour les paramètres (beta0) pour éviter d’obtenir un
minimum local (van Boekel, 1996). L’intervalle de confiance (95 % asymptotique) de
chaque paramètre a été estimé à partir de la fonction « nlparci » tel qu’il est
recommandé par Dolan et al. (2007). Les entrées de la fonction « nlparci » sont les
sorties de la fonction « lsqcurvefit » (beta, residual et jacobian) (Matlab®, The
MathWorks Inc, Natick, MA, Etats-Unis).
5.2 Cas du traitement thermique de la papaye après DII
5.2.1 Construction d’un plan d’expériences pour la DII
Un plan central composite rotatif (RCCD) a été effectué avec 4 points factoriels,
4 points axiaux et 3 points centrales, résultant en 11 expériences. Ce plan d’expériences
a été réalisé afin d’obtenir un modèle polynomial de deuxième ordre qui décrit WL, SG
et AG (variables dépendantes, Tableau II.4) en fonction de deux variables
indépendantes, la température du procédé (T) et la molalité en saccharose (msaccharose) de
la solution osmotique. Le temps d’immersion a été fixé à 60 min, car il correspond au
temps d’équilibre des transferts entre le fruit et la solution. Les valeurs codées et réelles
des variables indépendantes du plan d’expériences sont données dans le Tableau II.5.
Toutes les expériences ont été effectuées de façon aléatoire, et les données ont été
analysées à l’aide du logiciel Statistica 7.0 (Statsoft Inc, Etats-Unis). Le modèle
polynomial du second ordre utilisé pour décrire les variables dépendantes Yk (WL, SG et
AG) en fonction des variables indépendantes Xi, est présenté dans l’équation (22)
2
0k k ki i kii i kij i jY X X X X (22)
Tableau II.5. Valeurs codées et réelles des variables indépendantes du plan
d’expérience
Variable 1,41 1 0 +1 +1,41
Température (ºC) 30 35,8 50 64,2 70
Molalité en saccharose
(mol kg1
d’eau) 0 0,44 1,50 2,56 3,00
où X1 est la température du procédé en valeur codée (T = 14,1×X1+50); X2 est la molalité
en saccharose ajoutée en valeur codée (msaccharose = 1,1×X2+1.5); βk0 est la constante
polynomiale; et βki, βkii et βkij i≠j sont les coefficients de régression linéaires, quadratiques
et d'interaction, respectivement. La validité du modèle a été évaluée par le coefficient de
Chapitre II : Matériels et Méthodes
33
détermination (R2) entre les réponses réelles et simulées, la valeur P qui évalue la
probabilité que la valeur vraie des paramètres multiplicatifs du modèle soit nulle, et le
test de manque d’ajustement (Plof). De plus, l’analyse graphique des valeurs observées
vs prédites a été effectuée pour vérifier la distribution aléatoire des réponses.
5.2.2 Simulation de la dégradation des anthocyanes à haute température
La comparaison de deux traitements de stérilisation sur la dégradation des
anthocyanes du produit intermédiaire (papaye verte traité par DII) a été évaluée par
simulation numérique. Les deux traitements de stérilisation comparés sont : un classique
et un traitement à haute température et courte durée (HTST), en utilisant la même valeur
stérilisatrice finale (F0=2,8 min, avec Tref=121,1 ºC et z=10 ºC). La Figure II.7 montre
les trois principales étapes de la méthode utilisée pour évaluer le couplage entre la DII
et de traitement thermique pour la papaye verte imprégnée de jus de mûre.
5.2.2.1 Étape 1: Utilisation des modèles du plan d’expériences
Les caractéristiques des produits intermédiaires (WL, SG et AG) ont été calculées
à partir des modèles générés par le plan d’expériences avec des molalités en saccharose
de 0,0 à 3,0 mol kg1
et température de 50 ºC.
5.2.2.2 Etape 2: L’activité de l’eau du produit intermédiaire.
La fraction molaire de l’eau (Xw) et du saccharose (Xs) de chaque produit
intermédiaire a été calculée à partir de la fraction massique correspondante de l'eau
(W(t)
) et du saccharose (S(t)
), qui à leur tour ont été calculées à partir des valeurs WL et
SG obtenues dans l’étape 1. L’équation (23) résume les calculs effectués.
( )
( ) ( )
( )
( ) ( )
t
ww t t
w s
t
ss t t
w s
W MWX
W MW S MW
S MWX
W MW S MW
avec
( ) (0)
( )
1
1
t
i i i
t
i i i
W W WL WL SG
S SG WL SG
(23)
où MWw et MWs sont les masses molaires de l’eau (18,0 g mol1
) et du saccharose
(342,3 g mol1
) respectivement, et W(0)
la fraction massique d'eau de la papaye verte au
temps initial (0,93±0,02 kg kg1
).
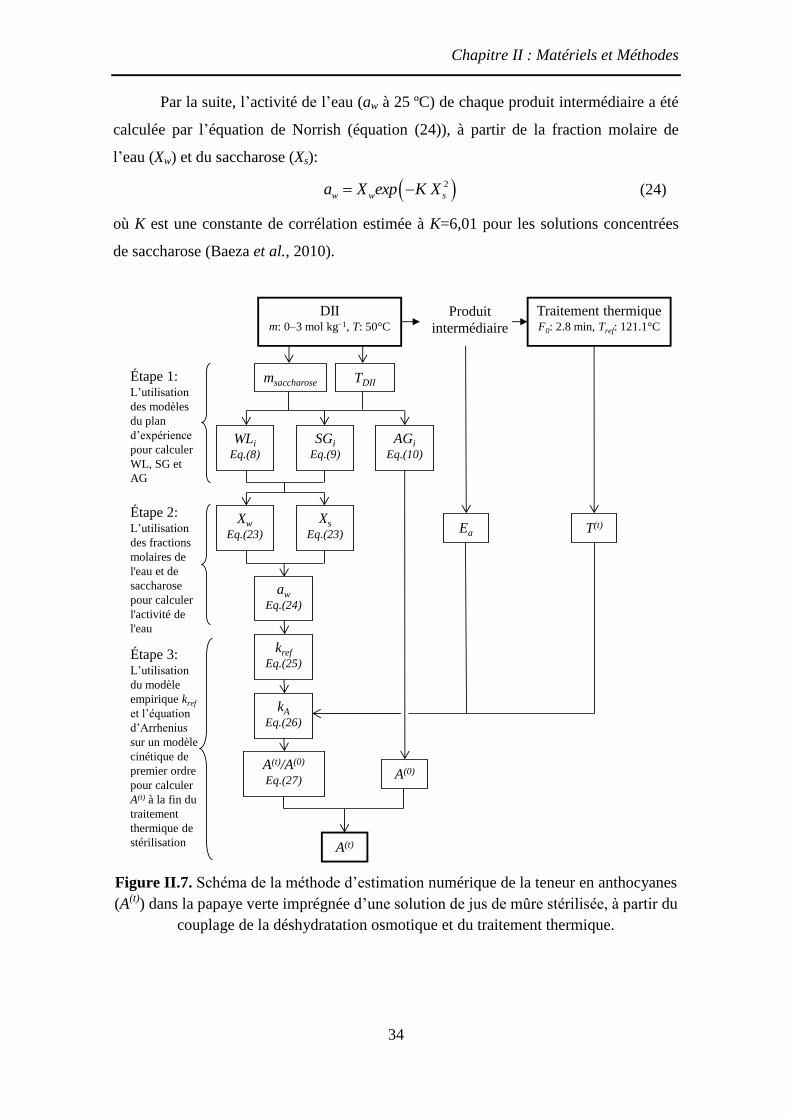
Chapitre II : Matériels et Méthodes
34
Par la suite, l’activité de l’eau (aw à 25 ºC) de chaque produit intermédiaire a été
calculée par l’équation de Norrish (équation (24)), à partir de la fraction molaire de
l’eau (Xw) et du saccharose (Xs):
2 w w sa X exp K X (24)
où K est une constante de corrélation estimée à K=6,01 pour les solutions concentrées
de saccharose (Baeza et al., 2010).
Figure II.7. Schéma de la méthode d’estimation numérique de la teneur en anthocyanes
(A(t)
) dans la papaye verte imprégnée d’une solution de jus de mûre stérilisée, à partir du
couplage de la déshydratation osmotique et du traitement thermique.
Étape 1: L’utilisation
des modèles
du plan
d’expérience
pour calculer
WL, SG et
AG
Étape 2: L’utilisation
des fractions
molaires de
l'eau et de
saccharose
pour calculer
l'activité de
l'eau
Étape 3: L’utilisation
du modèle
empirique kref
et l’équation
d’Arrhenius
sur un modèle
cinétique de
premier ordre
pour calculer
A(t) à la fin du
traitement
thermique de
stérilisation
DIIm: 0–3 mol kg–1, T: 50°C
Traitement thermiqueF0: 2.8 min, Tref: 121.1°C
Produit
intermédiaire
T(t)
TDIImsaccharose
WLi
Eq.(8)
Ea
A(0)
A(t)
SGi
Eq.(9)
AGi
Eq.(10)
Xw
Eq.(23)
Xs
Eq.(23)
aw
Eq.(24)
kref
Eq.(25)
kA
Eq.(26)
A(t)/A(0)
Eq.(27)

Chapitre II : Matériels et Méthodes
35
5.2.2.3 Etape 3: La teneur en anthocyanes du produit stérilisé.
La teneur en anthocyanes (A(t)
) pour chaque produit à la fin du traitement thermique
a été estimée en considérant les paramètres cinétiques (Ea et kref) identifiés pour la
dégradation des anthocyanes à des températures élevées (T∞=100140 ºC) et de
différentes activités de l’eau (aw 0,34 à 0,99). L’équation (25) présente la relation
obtenue entre la constante de réaction kref (s1
) à Tref=120 ºC et l’activité de l’eau initiale
(aw) à 25 ºC.
0.004 / 1 0.957 / 0.029ref wk exp a (25)
La constante de réaction kA (s1
) est supposée varier avec la température absolue du
système, T (K), selon l'équation d'Arrhenius
( )
1 1aA ref t
ref
Ek k exp
R T T
(26)
où kref (s1
) est la constante de réaction à la température de référence (Tref=120 ºC), Ea
est l’énergie d'activation (92±8 J mol1
), R est la constante des gaz parfaits
(8,314 J mol1
K1
) et T(t)
est la température au cours du traitement thermique.
La dégradation des anthocyanes (A(t)
) au cours du traitement à haute température
a été décrite par une cinétique irréversible de premier ordre (equation (27))
( )t
A
dAk A
dt (27)
Enfin, la teneur en anthocyanes A(t)
(mg kg1
papaye verte) du produit après traitement
thermique, a été obtenue en multipliant la teneur résiduelle d’anthocyanes (A(t)
/A(0)
) par
le gain en anthocyanes (AG=A(0)
, mg kg1
papaye verte). Le schéma de la méthode pour
l’analyse du couplage est présenté dans la Figure II.7.
5.3 Cas des transferts d’énergie et d’eau lors de la friture
Un modèle en 2D qui combine le transfert de chaleur et de vapeur avec la
cinétique de dégradation des anthocyanes, a été développé pour prédire la teneur en
anthocyanes dans les disques de papaye verte imprégnés de jus de mûre soumis à des
conditions de friture et en tenant compte des paramètres cinétiques obtenus pour le
milieu solide modèle.
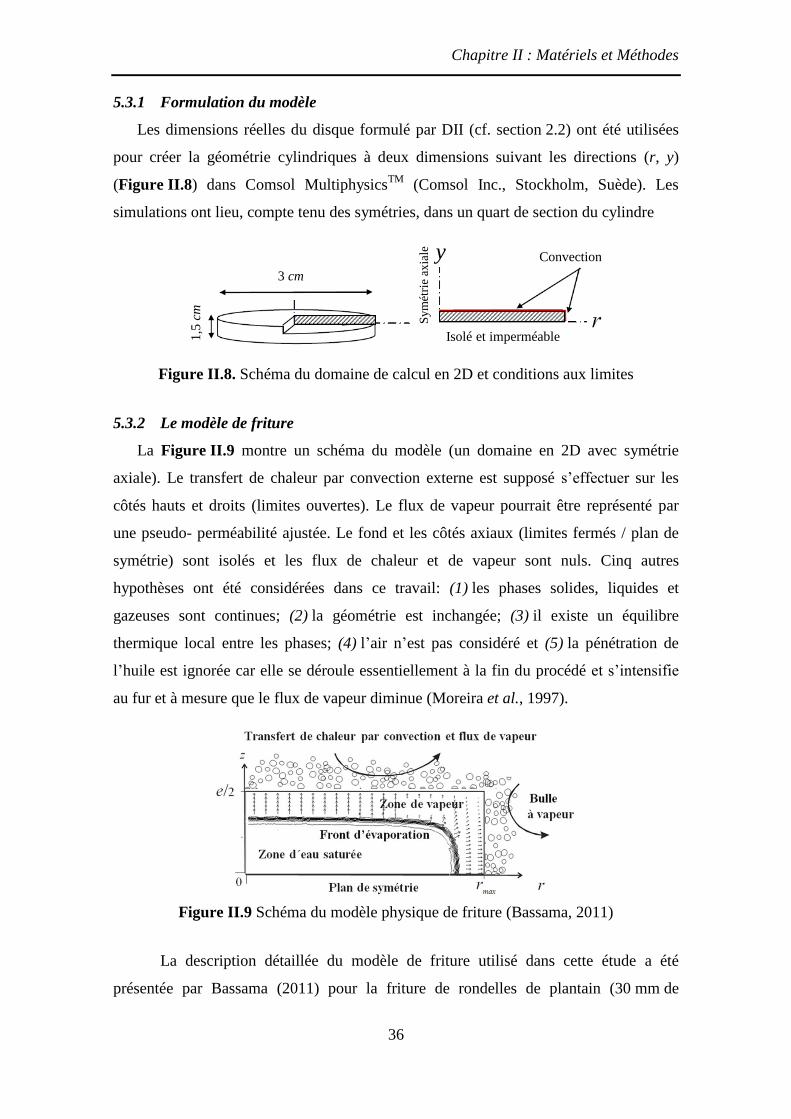
Chapitre II : Matériels et Méthodes
36
5.3.1 Formulation du modèle
Les dimensions réelles du disque formulé par DII (cf. section 2.2) ont été utilisées
pour créer la géométrie cylindriques à deux dimensions suivant les directions (r, y)
(Figure II.8) dans Comsol MultiphysicsTM
(Comsol Inc., Stockholm, Suède). Les
simulations ont lieu, compte tenu des symétries, dans un quart de section du cylindre
Figure II.8. Schéma du domaine de calcul en 2D et conditions aux limites
5.3.2 Le modèle de friture
La Figure II.9 montre un schéma du modèle (un domaine en 2D avec symétrie
axiale). Le transfert de chaleur par convection externe est supposé s’effectuer sur les
côtés hauts et droits (limites ouvertes). Le flux de vapeur pourrait être représenté par
une pseudo- perméabilité ajustée. Le fond et les côtés axiaux (limites fermés / plan de
symétrie) sont isolés et les flux de chaleur et de vapeur sont nuls. Cinq autres
hypothèses ont été considérées dans ce travail: (1) les phases solides, liquides et
gazeuses sont continues; (2) la géométrie est inchangée; (3) il existe un équilibre
thermique local entre les phases; (4) l’air n’est pas considéré et (5) la pénétration de
l’huile est ignorée car elle se déroule essentiellement à la fin du procédé et s’intensifie
au fur et à mesure que le flux de vapeur diminue (Moreira et al., 1997).
Figure II.9 Schéma du modèle physique de friture (Bassama, 2011)
La description détaillée du modèle de friture utilisé dans cette étude a été
présentée par Bassama (2011) pour la friture de rondelles de plantain (30 mm de
3 cm
1,5
cm
Isolé et imperméable
y
Sym
étri
e ax
iale Convection

Chapitre II : Matériels et Méthodes
37
diamètre et 10 mm d’épaisseur). Les simulations ont été réalisées en considérant les
paramètres du Tableau II.6 pour la friture des disques de papaye verte formulés par DII
à trois concentrations de saccharose (msaccharose=0 ; 1,5 et 3,0 mol kg1
) dans la solution
de jus de mûre.
Tableau. II.6. Paramètres d’entrée utilisés pour les simulations
Paramètre d’entrée Valeur Référence
Capacité thermique de l’eau, pc (J kg1
K1
) 4178 (Wagner et
Pruss, 2002) Capacité thermique de la vapeur, pcv (J kg
1 K
1) 1960
Capacité thermique de la matière sèche, spc (J kg
1 K
1) 1361
(Ni et Datta,
1999)
Perméabilité intrinsèque, Kv (m2) 1×10
13 Ajusté
Masse molaire de l’eau, Mv (kg mol1
) 0,018
Constante des gaz parfaits, R (J mol1
K1
) 8,314
Fraction volumique initiale du vapeur, 0v DII-0,0 0,162 Estimé
DII-1,5 0,285 Estimé
DII-3,0 0,462 Estimé
Fraction volumique initiale de la matière sèche, s DII-0,0 0,065 Estimé
DII-1,5 0,191 Estimé
DII-3,0 0,200 Estimé
Coefficient de convection, hconv (W m2
K1
) 2000
Anthocyanes initial, A(0)
(mg kg1
MSNH) DII-0,0 3365 Section 2.3
DII-1,5 639 Section 2.3
DII-3,0 321 Section 2.3
Température de l’huile, T∞ (°C) 140
Intervalle de transition (fonction Heaviside), T (K) 1
Viscosité de la vapeur, v (kg m1
s1
) 1,25×10⁵
(Perré, 1995)
Densité intrinsèque de la matière sèche s (kg m
3) 1600
(Farkas et al.,
1996a)
Densité intrinsèque de l’eau (kg m3
) 1000
5.3.3 Résolution numérique
Le modèle se compose de trois variables, la température T(r,z,t)
, la pression p(r,z,t)
et la
teneur en anthocyanes A(r,z,t)
, et le système a été résolu en utilisant la méthode des
éléments finis sur le code commercial Comsol MultiphysicsTM
(Comsol Inc.,
Stockholm, Suède). La géométrie et le maillage ont été créés dans Comsol. Le maillage
d’éléments finis se composait de triangles avec 3 nœuds par élément. Le nombre total
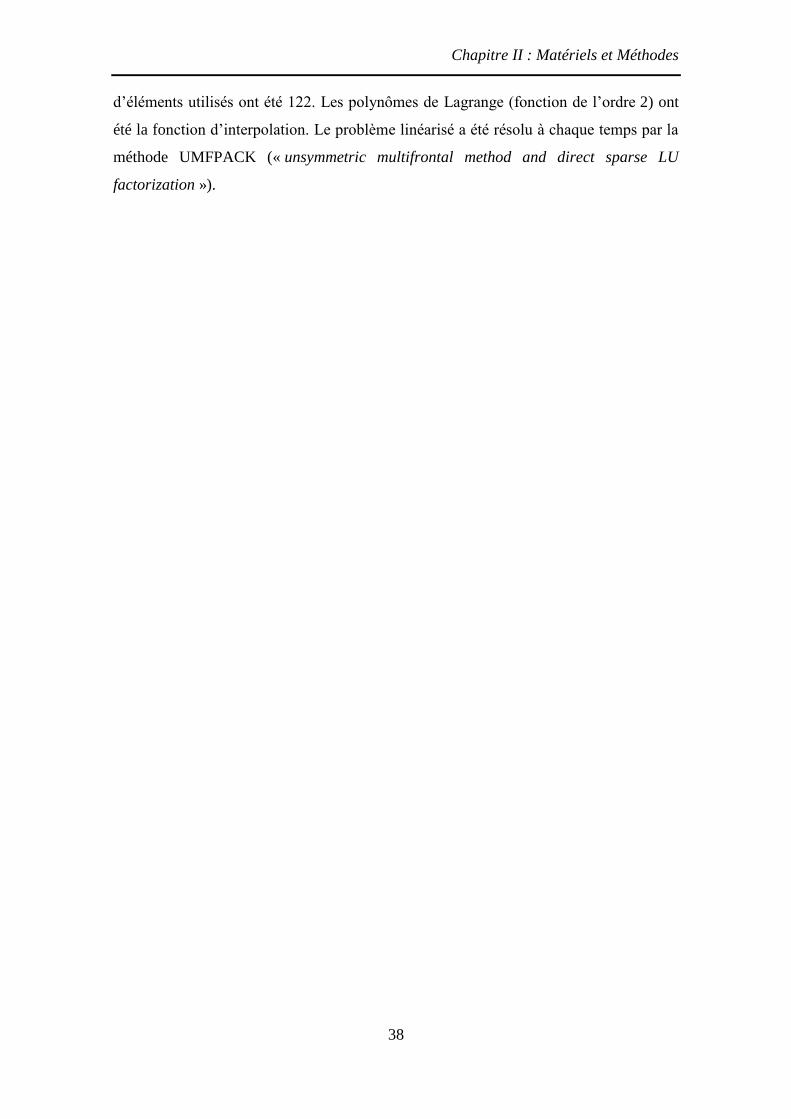
Chapitre II : Matériels et Méthodes
38
d’éléments utilisés ont été 122. Les polynômes de Lagrange (fonction de l’ordre 2) ont
été la fonction d’interpolation. Le problème linéarisé a été résolu à chaque temps par la
méthode UMFPACK (« unsymmetric multifrontal method and direct sparse LU
factorization »).

Chapitre III: Résultats
39
Chapitre III : Résultats
Les résultats de ce travail s’organisent autour de cinq articles scientifiques
(1 publié, 1 accepté, 2 soumis et 1 en préparation) qui correspondent chacun aux étapes
suivies pour atteindre l’objectif général de l’étude (Figure I.1). Ce chapitre propose
dans un premier temps une analyse cinétique de la dégradation des anthocyanes et
brunissement non-enzymatique en milieu liquide (jus de mûre reconstitué)
(Publication #1) ; puis en milieu modèle bi-phasique (jus de mûre-sable de
Fontainebleau) afin d’évaluer l’impact d’une réduction de l’activité de l’eau sur la
dégradation des anthocyanes à très hautes températures (100140 ºC) en système fermé.
Pour cette analyse, deux démarches ont été présentées : une première où l’homogénéité
du champ de température a été suppose au sein d’un réacteur (Publication #2), et la
seconde analyse, a prise en compte l’hétérogénéité du champ de température à l’aide
d’un modèle en 3D de la cellule de traitement thermique (Publication #3). Ensuite,
l’impact de trois opérations unitaires (DII, stérilisation et friture) sur le devenir des
anthocyanes sera analysée et évaluera l’impact des processus de transfert d’énergie avec
ou sans transfert de matière (eau, sucre et huile) impliqués dans la dégradation des
anthocyanes. Enfin, des règles de conduite seront proposées pour les deux procédés
associant chacun deux opérations unitaires, une opération de formulation (DII) et un
traitement à très haute température (Stérilisation (Publication #4) et friture
(Publication #5) afin de privilégier la conservation des anthocyanes sur des produits
réels à base de papaye verte.
Chapitre III : Résultats – Publication #1
40
6 Publication #1 : Cinétiques de dégradation des anthocyanes et
brunissement non enzymatique dans un jus de mûre reconstitué
traité à haute température (100–180 °C)
La dégradation des anthocyanes et l’indice de brunissement non enzymatique
(BNE) ont été déterminés dans un jus de mûre reconstitué traité à haute température
dans une cellule fermé hermétiquement. L’analyse statistique a démontré que quand la
gamme de température (100–180 ºC) se divise en deux sous gammes (100140 et
140180 ºC) pour la dégradation d’anthocyanes, les cinétiques de réactions sont bien
représentées par deux réactions séquentielles de premier ordre. La valeur de l’énergie
d’activation de l’indice de brunissement non enzymatique de 100 à 180 ºC
(106 kJ mol1
) a été légèrement supérieure à la valeur des anthocyanes pour la gamme
de température inférieur (92 kJ mol1
), mais a été plus que le double de la valeur pour la
gamme supérieure (44 kJ mol1
). La constante de réaction à 140 ºC pour la dégradation
d’anthocyanes (3,5×10³
s1
) a été deux fois la valeur pour l’indice de brunissement non
enzymatique (1,6×10³
s1). De ce fait, la dégradation d’anthocyanes a été plus rapide
que l’apparition des produits du brunissement non enzymatique. La méthode non
isotherme développée permet l’estimation des paramètres cinétiques et la génération de
profils de température des procédés thermiques qui aideront à préserver les propriétés
nutritionnelles des aliments pendant les traitements thermiques à haute température.

Chapitre III : Résultats – Publication #1
41
Kinetics of Anthocyanin degradation and Browning in
Reconstituted Blackberry Juice Treated at High
Temperatures (100–180 ºC)
NADIARID JIMÉNEZ1, PHILIPPE BOHUON
2*, JANICE LIMA
3, MANUEL DORNIER
2,
FABRICE VAILLANT4, AND ANA MERCEDES PÉREZ
5
1Escuela de Tecnología de Alimentos, Universidad de Costa Rica, Apartado Postal 11501–2060,
San José, Costa Rica
2Montpellier SupAgro, UMR QualiSud, 1101 avenue Agropolis, CS 24501, 34093 Montpellier Cedex 5,
France
3Embrapa Agroindústria Tropical, Rua Dra Sara Mesquita, 2270 - Planalto do Pici, CEP 60511–110,
Fortaleza, Ceará, Brazil
4CIRAD, UMR QualiSud, 40/15, 73 rue Jean François Breton, 34398 Montpellier Cedex 5, France
5Centro Nacional de Ciencia y Tecnología de Alimentos (CITA), Universidad de Costa Rica,
Apartado Postal 11501–2060, San José, Costa Rica
*Author to whom correspondence should be addressed (telephone +33 4 67 615726;
fax +33 4 67 615728; e-mail [email protected])
Chapitre III : Résultats – Publication #1
42
Abstract
Monomeric anthocyanin degradation and non-enzymatic browning (NEB) index
have been determined in reconstituted blackberry juice heated at high temperature in a
hermetically sealed cell. Statistical analysis demonstrated that, when the temperature
range (100-180 ºC) was divided into two sub-ranges (100140 and 140180 ºC) for
anthocyanin degradation, reaction kinetics were well represented by two sequential
first-order reactions. The activation energy for NEB from 100 to 180 ºC (106 kJ mol1
)
was slightly higher than the anthocyanins value at the lower temperature range
(92 kJ mol1
), but was more than twice the value for the higher range (44 kJ mol1
). The
reaction rate constant at 140 ºC for anthocyanin degradation (3.5×10³
s1
) was two
times that for the NEB index (1.6×10³
s1
). Hence, anthocyanin degradation was faster
than the appearance of NEB products. The non-isothermal method developed allows
estimating kinetic parameters and thereby generating temperature profiles of heat
processes that would help preserve the nutritional properties of foods during high-
temperature processes.
Keywords: Blackberry juice; kinetics modeling; anthocyanins; non-enzymatic
browning; heat treatment
Chapitre III : Résultats – Publication #1
43
6.1 Introduction
Blackberries are particularly interesting because of their high contents of
phenolic compounds, especially of ellagitannins and anthocyanins (Mertz et al., 2007;
Siriwoharn et al., 2004). These compounds possess a significant antioxidant capacity
(free-radical scavenging and metal chelating). Hence, they play a potentially beneficial
role in human health by reducing risks of cancer, cardiovascular disease, and other
pathologies (Clifford et Scalbert, 2000; Prior, 2004).
Anthocyanins are polyphenolic pigments, responsible for the red, blue, and
purple colors of many fruits and vegetables. However, they readily degrade during food
processing and storage, being highly reactive to factors such as oxygen, light, pH, and
temperature. The last two in particular may dramatically affect color quality and the
nutritional properties of products (Wrolstad et al., 2005).
Food processing usually involves the use of heat treatments to effectively
preserve foodstuffs and provide desirable sensory properties. However, nutritional
quality is often compromised. If optimal color, and nutritional and functional qualities
are to be maintained, anthocyanin degradation must be minimized during processing
(Sadilova et al., 2006).
Several authors have studied the heat degradation of anthocyanins (Cao et al.,
2009; Cemeroglu et al., 1994; Cisse et al., 2009; Debicki-Pospisil et al., 1983;
Harbourne et al., 2008; Kirca et al., 2007; Mishra et al., 2008; Reyes et Cisneros-
Zevallos, 2007; Wang et Xu, 2007; Yang et al., 2008) and have reported on kinetic
parameters (activation energy and reaction rate constant) for a wide variety of
anthocyanin-rich products (Table III.1.1). The parameters were obtained through first-
order kinetics and modeling temperature dependence according to the Arrhenius
equation. Most of the studies were conducted at temperatures below 100 ºC, which may
be considered as isothermal treatments.
However, some heat processes for anthocyanin-rich foodstuffs involve
temperatures of more than 100 ºC, for example, vacuum-frying blue potatoes (Da Silva
et Moreira, 2008), sterilizing grape pomace (Mishra et al., 2008), extruding corn meal
with blueberry and grape anthocyanins for breakfast cereals (Camire et al., 2002), and
spray-drying açaí pulp (Tonon et al., 2008).

Chapitre III : Résultats – Publication #1
44
Table III.1.1. Published data for kinetic parameters (activation energy Ea and rate
constant k) of anthocyanins thermal degradation of some products.
Reference Product Temperature
range (°C)
Anthocyanins
determination a
E
(kJ mol1
)
k
(106
s1
)
(Cisse et
al., 2009)
Blood orange juice
Blackberry juice
Roselle extract
3090 pH differential 66.0
37.0
51.1
14.6166.0
8.174.8
2.975.1
(Cao et al.,
2009)
Blood orange
cyanidin 3-glucoside
cyanidin 3-(6''-
malonyl) glucoside
7090
pH differential
RP-HPLC
pH differential
RP-HPLC
75.4
74.6
79.5
75.8
14.863.3
15.364.6
10.347.8
16.470.7
(Harbourn
e et al.,
2008)
Blackcurrant juice 4140 pH differential 81 ± 3 0.042765
(Mishra et
al., 2008)
Grape pomace 126.7 HPLC 65 ± 33 2382 ± 100
(Yang et
al., 2008)
Purple corn cob
(pH 4)
7090 pH differential 18.3 16.625.7
(Wang et
Xu, 2007)
Blackberry juice
(8.9°Brix)
6090 pH differential 58.9 11.565.7
(Reyes et
Cisneros-
Zevallos,
2007)
Purple-flesh potatoes
Red-flesh potatoes
Grape
Purple carrot
2598 Color retention 72.5
66.7
75.0
81.3
0.1990.5
0.0820.1
0.1779.2
0.0327.9
(Kirca et
al., 2007)
Black carrot
(pH 2.5)
7090 pH differential 78.1 7.734.5
(Cemerogl
u et al.,
1994)
Sour cherry juice
(15°Brix)
5080 pH differential 68.5 1.19.4
(Debicki-
Pospisil et
al., 1983)
Blackberry juice (BJ)
BJ + HMF a
BJ + Furfural
2470 pH differential 61.8
54.6
52.9
0.7196.4
1.2232.5
1.3246.4 a HMF : 5-Hydroxymethylfurfural
Few kinetic data obtained at higher temperatures have also been published
(Harbourne et al., 2008; Mishra et al., 2008). Nonetheless, at temperatures of more than
100 ºC, heat treatments are non-isothermal, as the heating and cooling stages are too
long to be ignored. Non-isothermal methods must therefore be used to estimate the
kinetic parameters at these high temperatures (Harbourne et al., 2008).
Such methods evaluate the cumulative effect of time-temperature history (T(t)
)
on anthocyanin degradation (A(t)
) and non-enzymatic browning (B(t)
) through the
determination of kinetic parameters (Ea and kref). These parameters are obtained by
Chapitre III : Résultats – Publication #1
45
minimizing the sum of squares error (SSE) between experimental and predicted data. As
the model is nonlinear for parameters, no explicit analytical solutions are available for
the confidence intervals. Hence, the confidence interval for each parameter must be
determined by methods such as the Monte Carlo simulations (Hessler, 1997).
This study aimed, first, to experimentally quantify in reconstituted blackberry
juice the total monomeric anthocyanin content (A(t)
), total polyphenol content,
antioxidant capacity (ORAC), and non-enzymatic browning index (B(t)
) during heat
treatments; second, to develop a kinetic model to describe A(t)
and B(t)
in heat situations,
using a non-isothermal method; and third, to discuss the advantages of using high-
temperature short-time (HTST) treatments for blackberries to reduce the impact of heat
on product quality during different food processes.
6.2 Materials and methods
6.2.1 Blackberry juice
Fully ripe tropical highland blackberries (Rubus adenotrichus) were harvested in
Cartago region, Costa Rica (1500 m above sea level) and frozen at –20 ºC. The frozen
blackberries were then thawed at 5 ºC for 24 h and pressed with a discontinuous
hydraulic press (OTC-25-ton H-frame Hydraulic Shop Press, Series Y125, Owatonna,
MN, USA) to obtain the juice. The juice was then freeze-dried and vacuum-packed in
laminated metallic bags, and kept frozen at –18 ºC.
6.2.2 Preparing reconstituted blackberry juice
Lyophilized blackberry juice was reconstituted by dilution at 10 g 100 mL–1
with
distilled water and mixed at 1800 rpm for 30 min in a vibrating shaker (Heidolph®
multi reax, Schwabach, Germany). The juice was degasified before heat treatment by
bubbling argon for 30 min until the dissolved oxygen concentration was less than
1 mg L–1
, as determined by a MultiLine P3 pH/Oximeter with a CellOx 325 probe
(WTW, Weilheim, Germany).
6.2.3 Heating device and conditions
Reconstituted blackberry juice was pipetted into the test cell at room temperature
(T0=213 ºC). Juice was heated in a hermetically sealed test cell (Figure III.1.1) that
was custom-designed in stainless steel (type 316). The inner diameter was 50 mm and
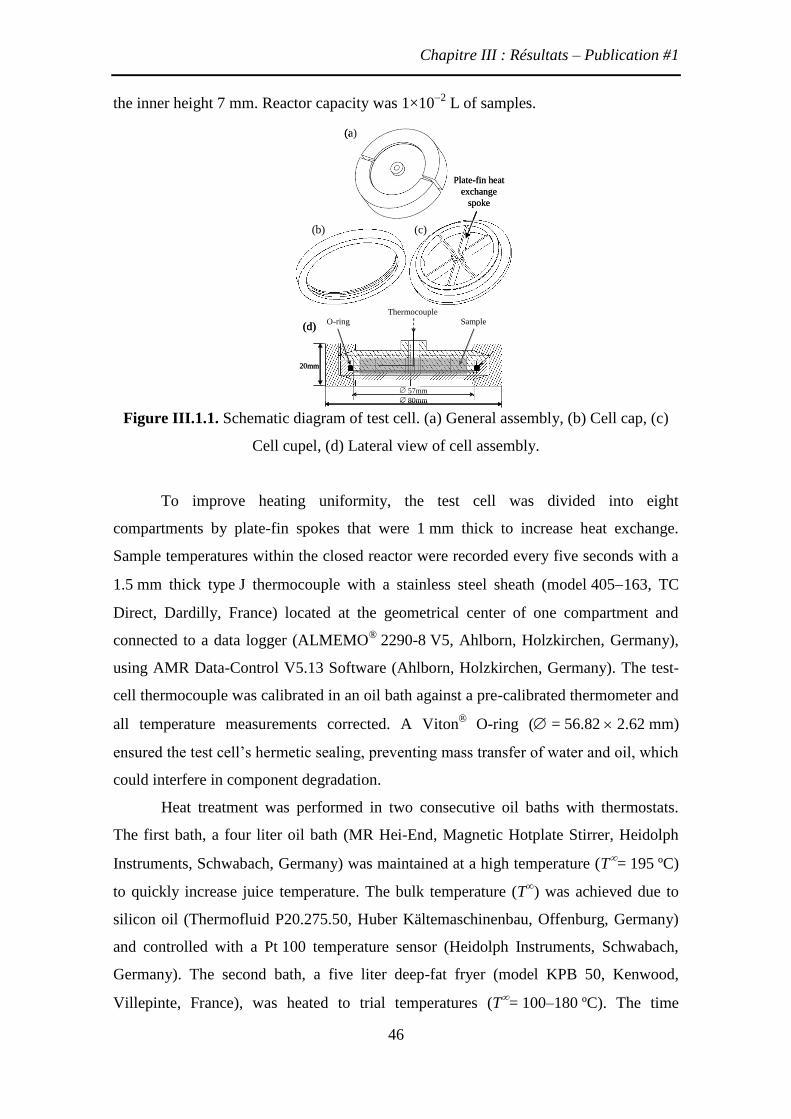
Chapitre III : Résultats – Publication #1
46
the inner height 7 mm. Reactor capacity was 1×10²
L of samples.
Figure III.1.1. Schematic diagram of test cell. (a) General assembly, (b) Cell cap, (c)
Cell cupel, (d) Lateral view of cell assembly.
To improve heating uniformity, the test cell was divided into eight
compartments by plate-fin spokes that were 1 mm thick to increase heat exchange.
Sample temperatures within the closed reactor were recorded every five seconds with a
1.5 mm thick type J thermocouple with a stainless steel sheath (model 405163, TC
Direct, Dardilly, France) located at the geometrical center of one compartment and
connected to a data logger (ALMEMO® 2290-8 V5, Ahlborn, Holzkirchen, Germany),
using AMR Data-Control V5.13 Software (Ahlborn, Holzkirchen, Germany). The test-
cell thermocouple was calibrated in an oil bath against a pre-calibrated thermometer and
all temperature measurements corrected. A Viton
O-ring ( = 56.82 2.62 mm)
ensured the test cell’s hermetic sealing, preventing mass transfer of water and oil, which
could interfere in component degradation.
Heat treatment was performed in two consecutive oil baths with thermostats.
The first bath, a four liter oil bath (MR Hei-End, Magnetic Hotplate Stirrer, Heidolph
Instruments, Schwabach, Germany) was maintained at a high temperature (T= 195 ºC)
to quickly increase juice temperature. The bulk temperature (T∞) was achieved due to
silicon oil (Thermofluid P20.275.50, Huber Kältemaschinenbau, Offenburg, Germany)
and controlled with a Pt 100 temperature sensor (Heidolph Instruments, Schwabach,
Germany). The second bath, a five liter deep-fat fryer (model KPB 50, Kenwood,
Villepinte, France), was heated to trial temperatures (T= 100–180 ºC). The time
(a)
(b)
(d)
(c)
Plate-fin heat
exchange
spoke
ThermocoupleSampleO-ring
57mm
80mm
20mm
(a)
(b)
(d)
(c)
Plate-fin heat
exchange
spoke
ThermocoupleSampleO-ring
57mm
80mm
20mm
Chapitre III : Résultats – Publication #1
47
interval between the first and second thermostat oil baths did not exceed 3 s. In each
bath, the bulk of the oil volume was stirred at 1200 rpm with an electronic overhead
stirrer (IKA–Werke, Staufen, Germany). The radial flow of the stirring unit produced
turbulence and ensured homogenization of the temperature field. When the reactor was
first plunged into the oil, the maximum local temperature variation was 5 ºC below T.
The test cell was held and maintained submerged with a wire.
For the kinetic experiments, samples were taken at different heating times,
which were chosen according to treatment temperatures. After each heat treatment, the
test cell was immediately cooled in an ice-water bath and dried with paper towel. The
sample was then removed from the cell and stored at 4 ºC overnight until analysis.
After heat treatment, the juice was centrifuged at 12 074×g for 10 min, using a
Sigma 1-15 Microfuge (Fisher Bioblock Scientific, Illkirch, France). It was then filtered
with a Minisart® SRP 25 filter (0.45 μm pore size; Sartorius AG, Göttingen, Germany)
to separate suspended solids formed during heating and cooling.
6.2.4 Analytical methods
6.2.4.1 Physicochemical analysis
Reconstituted blackberry juice was analyzed for pH, titratable acidity (citric acid
at g L–1
), and total soluble solids (g kg–1
), using standard methods (AOAC, 1990). All
analyses were done in quintuplicate and results reported with 95 % confidence intervals
(standard deviation × 2.57, where n = 5).
6.2.4.2 Total monomeric anthocyanin content
Total monomeric anthocyanin content (A(t)
) was determined by the pH
differential method (Giusti et Wrolstad, 2001; Lee et al., 2005). Juice absorbance was
measured at pH 1.0 and 4.5 at wavelengths of maximum absorbance (510 nm) and at
700 nm to correct for haze. Measurements were performed with a microplate
spectrofluorimeter (Infinite® 200, Tecan France S.A.S., Lyon, France), using 96-well
polypropylene plates. Total monomeric anthocyanins were expressed as cyanidin
3-glucoside equivalents, the most prevalent anthocyanin in R. adenotrichus at 95 %
(Mertz et al., 2007):
( ) 1 3( ) 10t A MW DF
A mg Ll
(28)
Chapitre III : Résultats – Publication #1
48
where, A or absorbance = (A510nm – A700nm)pH1.0 – (A510nm – A700nm)pH4.5; MW or
molecular weight = 449.2 g mol–1
for cyanidin 3-glucoside; DF or dilution factor = 10
to 50; or molar extinction coefficient = 26 900 L mol–1
cm–1
; l or path length =
0.52 cm (calculated for the specific well geometry with 200 μL of solution) and 103 =
conversion factor from g to mg.
The pH differential method was validated by comparing selected results with the
HPLC method (Mertz et al., 2007), obtaining coefficients of variation between 3 and
7 % (results not shown).
6.2.4.3 Total polyphenol content
The total polyphenol content (TP) was determined by the Folin–Ciocalteu assay
as modified according to George et al. (2005), and expressed as gallic acid equivalents
in mg L–1
.
6.2.4.4 Antioxidant capacity
An oxygen radical absorbance capacity (ORAC) assay was performed in
accordance with Ou et al. (2001), using a microplate spectrofluorimeter with 96-well
plates made in black polypropylene (Gancel et al., 2008). The ORAC value was
expressed as trolox equivalents (μmol L–1
).
6.2.4.5 Non-enzymatic browning index
Non-enzymatic browning index (B) was calculated according to Buglione et
Lozano (2002) for red juices. A microplate spectrofluorimeter was used, with 96-well
plates made in transparent polypropylene. The absorbance of reconstituted blackberry
juice was measured at pH 1.0 at two wavelengths: 510 nm for anthocyanin maximum
absorbance, and 420 nm for absorbance of both browning products and anthocyanins.
The non-enzymatic browning index was calculated as follows:
510 420/B A A (29)
The non-enzymatic browning equilibrium value (B) was determined after
prolonged heating at high temperature. Reconstituted blackberry juice was heated at
180 ºC for 30 and 45 min in triplicate. The B index was then calculated. No significant
difference (p < 0.05) was found between B values for the two heating times, showing
that the equilibrium value was reached at B = 0.250.02.
Chapitre III : Résultats – Publication #1
49
6.2.5 Repeatability of the heat treatment and subsequent physicochemical analyses
To assess the standard error of the heat treatments and subsequent analyses for
the different responses, three replicates of the experiment were performed at 140 ºC for
1, 2, 4, 6, and 8 min. The resulting standard error was found to be 5 % for monomeric
anthocyanin content and 3 % for the non-enzymatic browning index. For the other
temperatures (100, 120, 160 and 180 ºC), only one experiment was performed for each
time.
6.2.6 Kinetic model development
Kinetic modeling was conducted to develop a useful tool, which, in association
with a heat transfer model, could predict anthocyanin degradation and non-enzymatic
browning in reconstituted blackberry juice exposed to different heat processes (deep-fat
frying, spray drying, sterilization, extrusion, and others) under isothermal or non-
isothermal conditions (heating, maintaining, and cooling). Equations are therefore
presented to evaluate the cumulative effects of any time-temperature history (T(t)
) on
anthocyanin degradation (A(t )
) and non-enzymatic browning (B(t)
).
6.2.6.1 Selecting models
Two cases were considered for the description of the anthocyanin content (A(t)
)
and non-enzymatic browning index (B(t)
) behavior during heat treatment.
Case 1: A(t)
and B(t)
reactions were described in terms of one irreversible first-
order kinetic.
( )( )
tt
X
d Xk X
dt (30)
where ( )tX could be A(t)
or ( ( )tB B ); Xk is the rate constants. B was determined
experimentally as B = 0.25 0.02.
Case 2: A(t)
and B(t)
reactions were described in terms of two sequential
irreversible first-order kinetics
( )
( )
1 2
tt
X X
dXk k X
dt with
( )
1
( )
2
0 at
0 at
t
X transition
t
X transition
k T T
k T T
(31)
where ( )tX could be A(t)
or ( ( )tB B ); 1Xk and 2Xk are the rate constants at the first
and second temperature range.
The rate constant Xk or Xik (s–1) varied with the system’s absolute temperature,
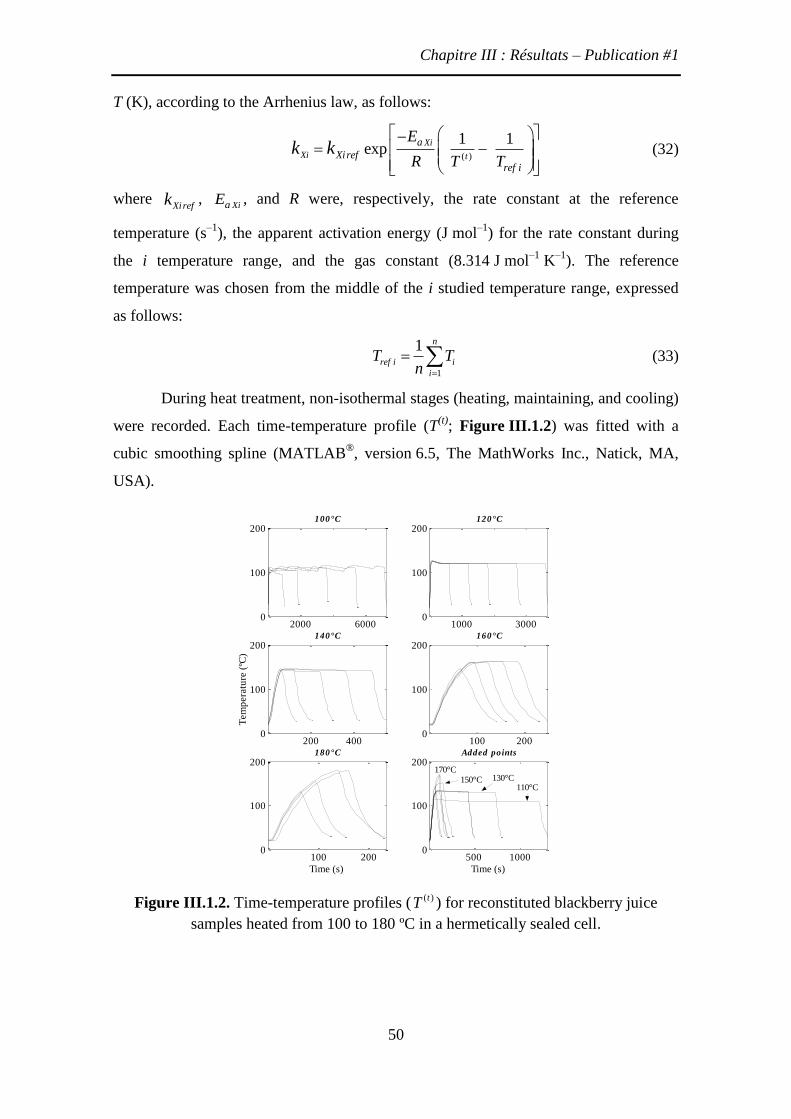
Chapitre III : Résultats – Publication #1
50
T (K), according to the Arrhenius law, as follows:
( )
1 1exp
Xi
Xi t
a
Xiref
ref i
E
R T Tk k
(32)
where Xirefk ,
XiaE , and R were, respectively, the rate constant at the reference
temperature (s–1
), the apparent activation energy (J mol–1
) for the rate constant during
the i temperature range, and the gas constant (8.314 J mol–1
K–1
). The reference
temperature was chosen from the middle of the i studied temperature range, expressed
as follows:
1
1 n
ref i i
i
T Tn
(33)
During heat treatment, non-isothermal stages (heating, maintaining, and cooling)
were recorded. Each time-temperature profile (T(t)
; Figure III.1.2) was fitted with a
cubic smoothing spline (MATLAB®, version 6.5, The MathWorks Inc., Natick, MA,
USA).
Figure III.1.2. Time-temperature profiles ( )(tT ) for reconstituted blackberry juice
samples heated from 100 to 180 ºC in a hermetically sealed cell.
2000 60000
100
200 100°C
1000 30000
100
200 120°C
200 4000
100
200
Tem
pera
ture
(ºC
)
140°C
100 2000
100
200 160°C
100 2000
100
200
Time (s)
180°C
500 10000
100
200
Time (s)
Added points
110°C 130°C 150°C
170°C

Chapitre III : Résultats – Publication #1
51
6.2.6.2 Parameter estimation and statistical methods
The non-isothermal degradation of compound X during heat treatment was taken
into account in equations (30) or (31) with (32). Hence, the X value, predicted at time t (
( )ˆ tX ), was calculated by time integration (general case 2), as follows:
( ) 0
1 1 2 2ˆ / exp( )t
X ref X X ref XX X k k with
( )
1
( )
2
0 at
0 at
t
X ref transition
t
X ref transition
k T T
k T T
(34)
where ( ) ( )ˆˆ t tX A , or ( ) ( )ˆ ˆ( )t tX B B , for anthocyanin content kinetic or non-
enzymatic browning index kinetic, respectively. Xi is the time-temperature history for
X during the i temperature range, and corresponds to the equivalent isothermal time at
the reference temperature (ref i
T ).
( )
0
1 1exp a
t
ref i
XiXi
tE
dtR T T
(35)
The integral of equation (35) was calculated as the direct analytical integral of
the cubic smoothing spline function of ( )exp (1/ 1/ ) /t
a Xi ref iE T T R with a
regularization parameter of 0.99 (MATLAB®, version 6.5, The MathWorks Inc., Natick,
MA, USA). There were two parameters (Xirefk and
XiaE ) to be estimated from the
collected data.
As the model was nonlinear for parameters, the parameters cannot be solved
directly, but must be solved by nonlinear regression. The parameters were iteratively
adjusted to the goodness-of-fit merit function, using the minimization procedure of the
Nelder–Mead simplex method (Lagarias et al., 1998), with the MATLAB® software
(MATLAB®, version 6.5, The MathWorks Inc., Natick, MA, USA). This merit function
was the mean of squares error (MSE) between experimental ( ( )tX ) and predicted (( )ˆ tX )
data:
2
( ) ( )
1
1 ˆ( )
i i
nt t
i
MSE X Xn p
(36)
where, n is the number of data, and p the number of parameters (here, p = 2).
The minimum of the merit function was searched with different initial values for
the parameters to avoid obtaining a local minimum (van Boekel, 1996). Because the
model was nonlinear for parameters, no explicit analytical solutions could be obtained
for the confidence intervals, resulting only in approximate values (van Boekel, 1996).
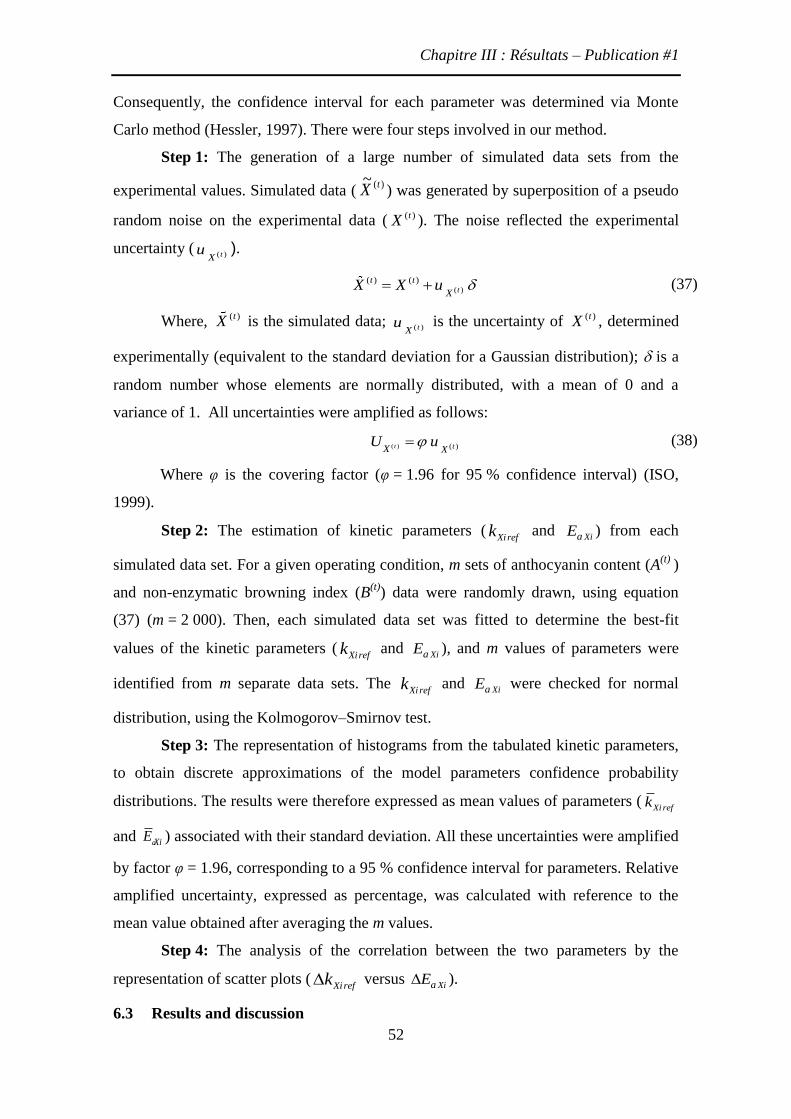
Chapitre III : Résultats – Publication #1
52
Consequently, the confidence interval for each parameter was determined via Monte
Carlo method (Hessler, 1997). There were four steps involved in our method.
Step 1: The generation of a large number of simulated data sets from the
experimental values. Simulated data ()(~ tX ) was generated by superposition of a pseudo
random noise on the experimental data ( ( )tX ). The noise reflected the experimental
uncertainty (( )tX
u ).
( )
( ) ( )t
t t
XX X u (37)
Where, ( )tX is the simulated data; ( )tX
u is the uncertainty of ( )tX , determined
experimentally (equivalent to the standard deviation for a Gaussian distribution); is a
random number whose elements are normally distributed, with a mean of 0 and a
variance of 1. All uncertainties were amplified as follows:
( ) ( )t tX X
U u (38)
Where φ is the covering factor (φ = 1.96 for 95 % confidence interval) (ISO,
1999).
Step 2: The estimation of kinetic parameters (Xirefk and
XiaE ) from each
simulated data set. For a given operating condition, m sets of anthocyanin content (A(t)
)
and non-enzymatic browning index (B(t)
) data were randomly drawn, using equation
(37) (m = 2 000). Then, each simulated data set was fitted to determine the best-fit
values of the kinetic parameters (Xirefk and
XiaE ), and m values of parameters were
identified from m separate data sets. The Xirefk and
XiaE were checked for normal
distribution, using the Kolmogorov–Smirnov test.
Step 3: The representation of histograms from the tabulated kinetic parameters,
to obtain discrete approximations of the model parameters confidence probability
distributions. The results were therefore expressed as mean values of parameters (Xi refk
and aXiE ) associated with their standard deviation. All these uncertainties were amplified
by factor φ = 1.96, corresponding to a 95 % confidence interval for parameters. Relative
amplified uncertainty, expressed as percentage, was calculated with reference to the
mean value obtained after averaging the m values.
Step 4: The analysis of the correlation between the two parameters by the
representation of scatter plots (Xirefk versus
XiaE ).
6.3 Results and discussion

Chapitre III : Résultats – Publication #1
53
6.3.1 Initial characteristics of reconstituted blackberry juice
Table III.1.2 presents the values of some physicochemical properties of the
reconstituted blackberry juice. Results are consistent with those reported in literature for
blackberry juice (Cisse et al., 2009; Wang et Xu, 2007) and other berries belonging to
the Rubus genus (Benvenuti et al., 2004), particularly R. adenotrichus (Mertz et al.,
2007). That is, blackberry juice is a good source of natural antioxidants. The
predominance of the anthocyanin cyanidin 3-glucoside in blackberry juice
(R. adenotrichus) was confirmed by comparing the juice’s HPLC chromatograms with
those of standard kuromanine (cyanidin 3-glucoside), results not shown.
Table III.1.2. Main characteristics of reconstituted blackberry juice (Rubus
adenotrichus) used for kinetic experiments (mean values 95 % confidence interval
with n=5).
Blackberry juice
pH 2.8 0.1
Total soluble solids (g kg-1
) 88 3
Titrable acidity (g citric acid L-1
) 25 1
Anthocyanins (mg cyanidin 3-glucoside L-1
), A0 554 13
Total polyphenols (mg gallic acid L-1
) 2936 90
ORAC (µmol trolox g-1
of DM) 306 22
Non-enzymatic browning index (A510/A420), B0 2.43 0.08
6.3.2 Kinetic parameter estimation
Monomeric anthocyanin content (A(t)
), total polyphenol content (TP(t)
),
antioxidant capacity (ORAC(t)
), and non-enzymatic browning index (B(t)
) were measured
experimentally in the juice for different time-temperature treatments. The results for
TP(t)
and ORAC(t)
are not considered in our study, as neither presented a defined pattern.
They are global measurements that can be affected by the presence of water-soluble
Maillard reaction products that may have antioxidant activity (Yilmaz et Toledo, 2005).
For the monomeric anthocyanin content (A(t)
) and non-enzymatic browning
index (B(t)
), the non-isothermal method was used to estimate kinetic parameters.
Figure III.1.3 shows the residual plots of anthocyanin content (single and sequential
first-order kinetics) and non-enzymatic browning index. In Figure III.1.3a, for the
single first-order kinetic, the residues ( ˆi it t
A A ) of each experimental trial were
calculated from the parameters estimated for the temperature range 100 to 180 ºC

Chapitre III : Résultats – Publication #1
54
(Ea=101 kJ mol1
and kref= 4×10⁻³
s1
, for Tref=140 ºC). An apparent trend was observed
throughout the tests. In the initial section most of the residual content of anthocyanins
were underestimated and after 140 ºC, most of residual content were overestimated.
Distribution of residues was considerably improved when a transition temperature of
140 ºC for the sequential analysis was considered (Figure III.1.3b). Residual values of
NEB index obtained from a single first-order kinetic are shown in Figure III.1.3c, and
no specific pattern was observed.
Figure III.1.3. Residual plot of anthocyanin content (A(t)
) and non-enzymatic browning
(B(t)
) at different temperatures for the single (a, c) and sequential (b) first-order kinetics.
0 1 2 3 4 5 6 7 8 9 10 11 12 13 14 15 16 17 18 19 20 21 22 23 24 25 26 27 28 29 30 31
-0.2
0
0.2
Resi
du
al
0 1 2 3 4 5 6 7 8 9 10 11 12 13 14 15 16 17 18 19 20 21 22 23 24 25 26 27 28 29 30 31
-0.2
0
0.2
Resi
du
al
0 1 2 3 4 5 6 7 8 9 10 11 12 13 14 15 16 17 18 19 20 21 22 23 24 25 26 27 28 29 30 31
-0.2
0
0.2
Experimental test number
Resi
du
al
100°C 110°C 120°C 130°C 140°C 150°C 160°C 170°C 180°C
100°C 110°C 120°C 130°C 140°C 150°C 160°C 170°C 180°C
100°C 110°C 120°C 130°C 140°C 150°C 160°C 170°C 180°C
(a)
(b)
(c)
Ckdt
dC
Ckdt
dC1 Ckk
dt
dC21
dB
k B Bdt

Chapitre III : Résultats – Publication #1
55
Table III.1.3. Estimated kinetic parameters (aE and
refk ) of anthocyanins thermal
degradation and non-enzymatic browning (mean values ± 95 % confidence interval
determined with Monte-Carlo simulations: 2 000 sets of ( )tA and ( )tB data randomly
with 5 % and 3 % of uncertainty).
Reaction
Temperature
range
(ºC)
refT
(ºC)
Optimized parameters
140 Ck
a
(103
s1
) RMSE
b aE
(kJ mol1
)
refk
(103
s1
)
Anthocyanins
(( ) 0/tA A )
[100-140] 120 92 ± 8 0.90 ± 0.08 3.5 ± 0.5 0.06
]140-180] 160 44 ± 40 20 ± 3 11 ± 7 0.12
Non-enzymatic browning
( ) 0/tB B B B [100-180] 140 107 ± 3 1.62 ± 0.07 1.62 ± 0.07 0.04
a Reaction rate constant at 140 ºC;
bRMSE : mean of root square error between
experimental and predicted ( )tA and ( )tB data
Table III.1.3 shows the optimized kinetic parameters for A(t)
and B(t)
,
considering two sequential first-order kinetics for the anthocyanins thermal degradation.
The confidence intervals of these kinetic parameters were determined via Monte Carlo
simulations, using 2 000 data sets that generate the same number of best-fit values for
the kinetic parameters (kXref and EaX). According to van Boekel (2009c), the Monte
Carlo method provides the most accurate probability distribution of the model
parameters, and it also provides information on the correlation between parameters.
Figure III.1.4 shows the results of the Monte-Carlo simulations, where a normal
distribution of the parameter Ea was obtained for A(t)
and B(t)
as shown in
Figures III.1.4a and 4b. In Figures III.1.4a, a large standard deviation was observed
for the activation energy of anthocyanins at temperatures above 140 ºC, probably due to
scarce experimental data computed within this region. Figures III.1.4c to 4e reveals the
lack of correlation between the kinetic parameters Ea and kref for both responses, as a
result of reparameterization (van Boekel, 1996, 2009c), through the introduction of a
reference temperature.
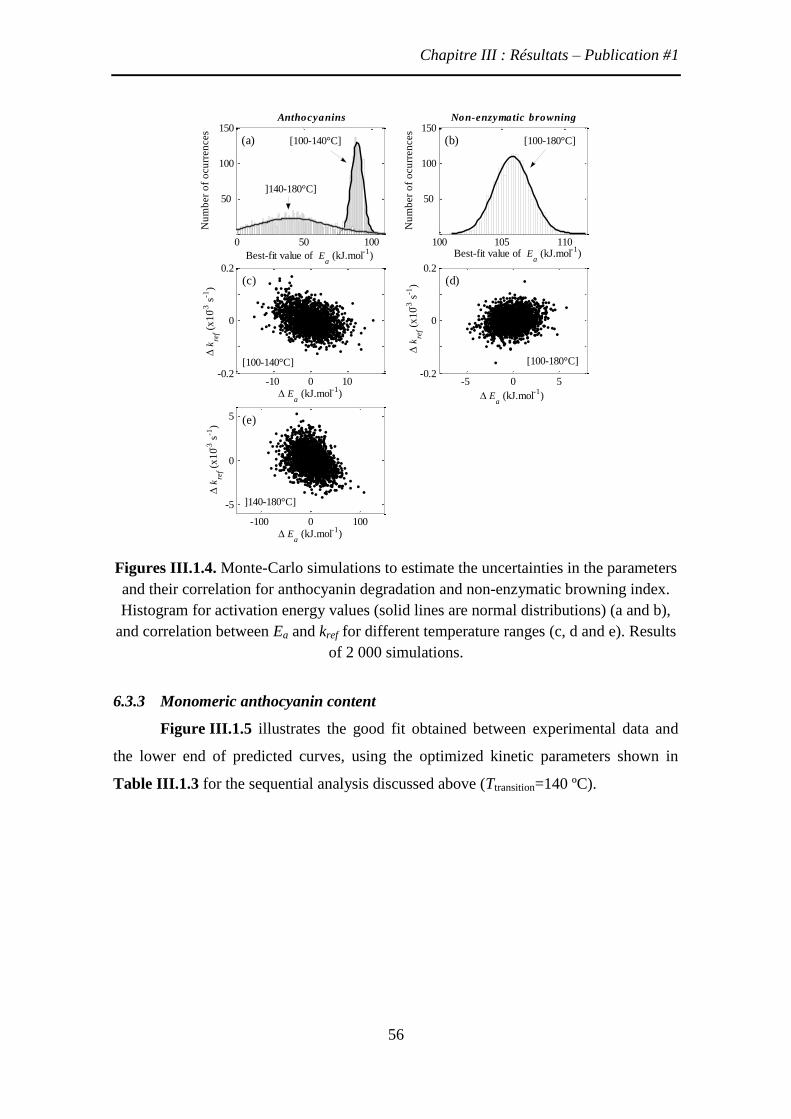
Chapitre III : Résultats – Publication #1
56
Figures III.1.4. Monte-Carlo simulations to estimate the uncertainties in the parameters
and their correlation for anthocyanin degradation and non-enzymatic browning index.
Histogram for activation energy values (solid lines are normal distributions) (a and b),
and correlation between Ea and kref for different temperature ranges (c, d and e). Results
of 2 000 simulations.
6.3.3 Monomeric anthocyanin content
Figure III.1.5 illustrates the good fit obtained between experimental data and
the lower end of predicted curves, using the optimized kinetic parameters shown in
Table III.1.3 for the sequential analysis discussed above (Ttransition=140 ºC).
0 50 100
50
100
150
Best-fit value of Ea (kJ.mol
-1)
Nu
mb
er
of
ocu
rren
ces
Anthocyanins
100 105 110
50
100
150
Best-fit value of Ea (kJ.mol
-1)
Nu
mb
er
of
ocu
rren
ces
Non-enzymatic browning
-10 0 10-0.2
0
0.2
Ea (kJ.mol
-1)
k
ref (
x1
0-3 s
-1)
-5 0 5-0.2
0
0.2
Ea (kJ.mol
-1)
k
ref (
x1
0-3 s
-1)
-100 0 100
-5
0
5
Ea (kJ.mol
-1)
k
ref (
x1
0-3 s
-1)
]140-180°C]
[100-140°C] [100-180°C]
[100-140°C]
]140-180°C]
[100-180°C]
(a) (b)
(c) (d)
(e)
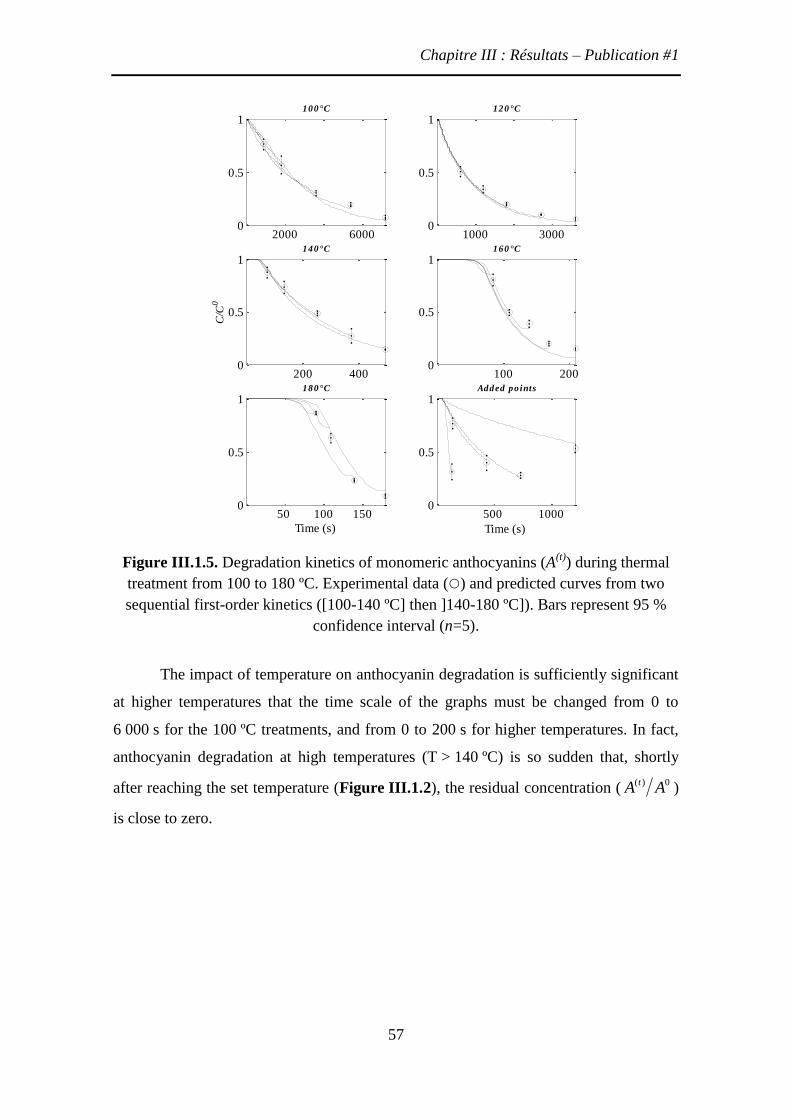
Chapitre III : Résultats – Publication #1
57
Figure III.1.5. Degradation kinetics of monomeric anthocyanins (A(t)
) during thermal
treatment from 100 to 180 ºC. Experimental data () and predicted curves from two
sequential first-order kinetics ([100-140 ºC] then ]140-180 ºC]). Bars represent 95 %
confidence interval (n=5).
The impact of temperature on anthocyanin degradation is sufficiently significant
at higher temperatures that the time scale of the graphs must be changed from 0 to
6 000 s for the 100 ºC treatments, and from 0 to 200 s for higher temperatures. In fact,
anthocyanin degradation at high temperatures (T > 140 ºC) is so sudden that, shortly
after reaching the set temperature (Figure III.1.2), the residual concentration (( ) 0tA A )
is close to zero.
2000 60000
0.5
1 100°C
1000 30000
0.5
1 120°C
200 4000
0.5
1 140°C
C/C
0
100 2000
0.5
1 160°C
50 100 1500
0.5
1 180°C
Time (s)
500 10000
0.5
1 Added po ints
Time (s)

Chapitre III : Résultats – Publication #1
58
Figure III.1.6. Arrhenius plot describing the temperature dependence of non-enzymatic
browning (NEB) and anthocyanin degradation rate constant ( k ) of reconstituted
blackberry juice (R. adenotrichus) from 30 to 90 ºC (Cisse et al., 2009) and 100 to
180 ºC (present study).
The temperature dependence of the anthocyanin degradation rate constant (k) in
reconstituted blackberry juice is shown in Figure III.1.6. Three regions can be seen:
low temperatures (T < 100 ºC), where Ea= 37 kJ mol–1
(Cisse et al., 2009); intermediate
temperatures (100 < T ≤ 140 ºC), where Ea= 92 8 kJ mol–1
; and high temperatures
(T > 140 ºC), where Ea= 44 40 kJ mol–1
.
Although differences in slopes suggest different anthocyanin degradation
mechanisms at each temperature range, conclusions cannot be made because studies of
reaction mechanisms have been conducted only for low temperatures (T < 100 ºC)
(Sadilova et al., 2006). At higher temperatures, many factors may be involved in
anthocyanin degradation such as the formation of Maillard reaction products. According
to Debicki-Pospisil et al. (1983) the presence of furfural and 5-(hydroxymethyl) furfural
accelerates the degradation rate of cyanidin 3-glucoside in blackberry juice.
Although some kinetic data have been published for high temperatures
(Harbourne et al., 2008; Mishra et al., 2008), the optimized parameters shown in
Table III.1.3 present no significant difference with those reported by Harbourne et al.
(2008) for blackcurrant juice at 140 ºC (Table III.1.1). The relevance of considering
heat treatments of more than 100 ºC as non-isothermal was confirmed when comparing
2.2 2.4 2.6 2.8 3 3.2 3.4
10-5
10-4
10-3
10-2
103/T (K
-1)
k (
s-1)
confidence interval (p=0.05)
18
0°C
NEB
Anthocyanins
14
0°C
10
0°C
30
°C
Chapitre III : Résultats – Publication #1
59
the kinetic parameters obtained by the traditional 2-step procedure (Harbourne et al.,
2008) for isothermal treatment with those of the non-isothermal method used in our
study. For example, in our case, the estimated activation energy (Ea) for A(t)
was
92 8 kJ mol–1
(T: [100140 ºC]); whereas, for the same data, if the heat treatments
were assumed as isothermal the calculated Ea for A(t)
would be 74 kJ mol–1
. The latter
value is closer to those reported in literature for heat treatment at T <100 ºC
(Table III.1.1).
6.3.4 Non-enzymatic browning
Figure III.1. 7 shows the good fit between experimental data and the lower end
of the predicted curves, using the kinetic parameters presented in Table III.1.3 for the
non-enzymatic browning index. Good fit is also confirmed by the low root mean square
error (RMSE=0.04) and the analysis of residues (Figure III.1.3c).
Figure III.1.7. Kinetics of non-enzymatic browning during thermal treatment from 100
to 180 ºC. Experimental data () and predicted curves for each trial. Bars represent
95 % confidence interval (n=5).
2000 60000
0.5
1 100°C
1000 30000
0.5
1 120°C
200 4000
0.5
1 140°C
(B
-B
)/(B
0-B
)
100 2000
0.5
1 160°C
50 100 1500
0.5
1 180°C
Time (s)
500 10000
0.5
1 Added po ints
Time (s)
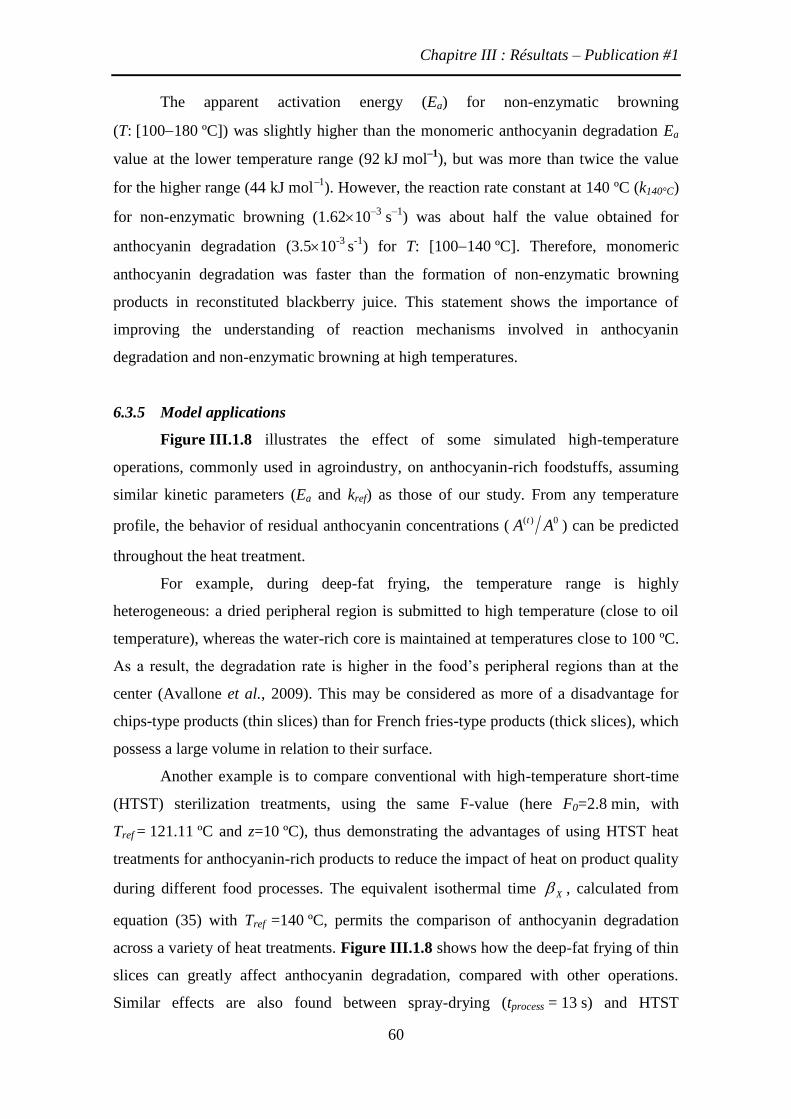
Chapitre III : Résultats – Publication #1
60
The apparent activation energy (Ea) for non-enzymatic browning
(T: [100180 ºC]) was slightly higher than the monomeric anthocyanin degradation Ea
value at the lower temperature range (92 kJ mol–1
), but was more than twice the value
for the higher range (44 kJ mol1
). However, the reaction rate constant at 140 ºC (k140°C)
for non-enzymatic browning (1.6210–3
s–1
) was about half the value obtained for
anthocyanin degradation (3.510-3
s-1
) for T: [100140 ºC]. Therefore, monomeric
anthocyanin degradation was faster than the formation of non-enzymatic browning
products in reconstituted blackberry juice. This statement shows the importance of
improving the understanding of reaction mechanisms involved in anthocyanin
degradation and non-enzymatic browning at high temperatures.
6.3.5 Model applications
Figure III.1.8 illustrates the effect of some simulated high-temperature
operations, commonly used in agroindustry, on anthocyanin-rich foodstuffs, assuming
similar kinetic parameters (Ea and kref) as those of our study. From any temperature
profile, the behavior of residual anthocyanin concentrations (( ) 0tA A ) can be predicted
throughout the heat treatment.
For example, during deep-fat frying, the temperature range is highly
heterogeneous: a dried peripheral region is submitted to high temperature (close to oil
temperature), whereas the water-rich core is maintained at temperatures close to 100 ºC.
As a result, the degradation rate is higher in the food’s peripheral regions than at the
center (Avallone et al., 2009). This may be considered as more of a disadvantage for
chips-type products (thin slices) than for French fries-type products (thick slices), which
possess a large volume in relation to their surface.
Another example is to compare conventional with high-temperature short-time
(HTST) sterilization treatments, using the same F-value (here F0=2.8 min, with
Tref = 121.11 ºC and z=10 ºC), thus demonstrating the advantages of using HTST heat
treatments for anthocyanin-rich products to reduce the impact of heat on product quality
during different food processes. The equivalent isothermal time X , calculated from
equation (35) with Tref =140 ºC, permits the comparison of anthocyanin degradation
across a variety of heat treatments. Figure III.1.8 shows how the deep-fat frying of thin
slices can greatly affect anthocyanin degradation, compared with other operations.
Similar effects are also found between spray-drying (tprocess = 13 s) and HTST
Chapitre III : Résultats – Publication #1
61
sterilization (tprocess = 150 s), despite different processing times.
Figure III.1.8. Simulated non-isothermal heating profiles, anthocyanin degradation
curves and equivalent isothermal time (with Tref =140 ºC) for different applications:
deep-fat frying, spray drying, extrusion, conventional and HTST sterilization.
The application of the kinetic model therefore allows the generation and
adjustment of temperature profiles of heat processes to better achieve expected results
(Peleg et al., 2008). Such results may include the improved preservation of the
nutritional qualities of heat-sensitive fruits and vegetables during high-temperature
processing.
0 50 100
100
200T
em
pera
ture
(ºC
) Deep-fa t frying
0 100
100
200 Spray drying and Extrusion
0 1000 2000
100
200 Steri l i za t ion and HTST
0 50 100
0.5
1
C/C
0
0 100
0.5
1
0 1000 2000
0.5
1
0 50 100
50
150
250
Eq
uiv
ale
nt
tim
e (
s)
0 100
50
150
250
Process time (s)
0 1000 2000
50
150
250
Spray Drying
Extrusion
Tref
=140°C
Sterilization
HTST
CoreSurface

Chapitre III : Résultats – Publication #2
63
7 Publication #2 : Effet de l’activité d’eau dans les cinétiques de
dégradation d’anthocyanes et brunissement à haute température
(100–140 ºC)
L’effet de l’activité de l’eau dans la dégradation des anthocyanes et l’indice de
brunissement non enzymatique a été déterminé dans un système de jus de mûre traité à
haute température. Les échantillons de jus de mûre mélangés à du sable de
Fontainebleau à trois différentes activités d’eau (aw de 0,34, 0,76 et 0,95) et ayant la
même concentration d’anthocyanes (51±4 mg 100g1
MF) ont été chauffés dans des
conditions non-isothermes (100 to 140 ºC) dans un réacteur hermétiquement fermé. Les
cinétiques de réaction sont bien représentées par des modèles de réactions de premier
ordre. Une méthode non-isotherme a été utilisée pour identifier les paramètres de la
cinétique, et l’intervalle de confiance pour chaque paramètre a été déterminé via la
méthode de Monte-Carlo. Les paramètres estimés ont révélé une augmentation dans la
constante de réaction de la dégradation des anthocyanes (kref) de 0,9 à 3,5×10⁻³
s-1
pendant que l’activité d’eau a diminué de 0,99 à 0,34. Les énergies d’activation
correspondantes (Ea) pour les anthocyanes et pour l’indice de brunissement non
enzymatique ont été modifiées en moindre mesure par des variations dans l’activité
d’eau. Par conséquent, la réduction de l’activité d’eau a eu un effet négatif dans la
stabilité des anthocyanes à hautes températures.
Chapitre III : Résultats – Publication #2
64
Effect of Water Activity on Anthocyanin degradation and
Browning Kinetics at High Temperatures (100–140 ºC)
Nadiarid Jiménez1, Philippe Bohuon
2, Manuel Dornier
2,
Catherine Bonazzi3,4
, Ana Mercedes Pérez5 and Fabrice Vaillant
6*
1Escuela de Tecnología de Alimentos, Universidad de Costa Rica, Apartado Postal 11501–2060,
San José, Costa Rica
2Montpellier SupAgro, UMR QualiSud, 1101 avenue Agropolis, CS 24501, 34093 Montpellier Cedex 5,
France
3AgroParisTech, UMR1145 Ingénierie Procédés Aliments, 91300 Massy, France
4 INRA, UMR1145 Ingénierie Procédés Aliments, 91300 Massy, France
5Centro Nacional de Ciencia y Tecnología de Alimentos (CITA), Universidad de Costa Rica,
Apartado Postal 11501–2060, San José, Costa Rica
6CIRAD, UMR QualiSud, TA B-95/15, 73 rue Jean François Breton, 34398 Montpellier Cedex 5, France
*Corresponding author. Tel.: +33 467615519. E-mail address: [email protected] (F. Vaillant).
Chapitre III : Résultats – Publication #2
65
Abstract
The effect of water activity on anthocyanin degradation and non-enzymatic browning
(NEB) indices was determined in a blackberry juice system heated to high temperature.
Blackberry juice samples mixed with quartz sand at three different water activities
(aw of 0.34, 0.76 and 0.95) and having the same concentration of anthocyanins
(51±4 mg 100g1
WB) were heated in a hermetically sealed reactor under non-
isothermal conditions (100 to 140 ºC). Reaction kinetics were well-represented by first-
order reaction models. A non-isothermal method was used for the identification of
kinetic parameters, and the confidence interval for each parameter was determined via
Monte-Carlo simulations. The estimated parameters revealed an increase in the
anthocyanin degradation reaction rate constant (kref) from 0.9 to 3.5×10⁻³
s-1
as the water
activity decreased from 0.99 to 0.34. The corresponding activation energies (Ea) for
anthocyanins and NEB index were modified to a lesser extent by variations in water
activity. Hence, the reduction of water activity had a negative effect on anthocyanins
stability at high temperatures.
Keywords: Blackberry juice; water activity; kinetic modeling; anthocyanins; non-
enzymatic browning; heat treatment
Chapitre III : Résultats – Publication #2
66
7.1 Introduction
Water activity has been used to assess microbial growth, lipid oxidation and non-
enzymatic and enzymatic activity following the manufacture of food products. The
effect of water on chemical reactions in foods, whether enzymatic or non-enzymatic, is
difficult to attribute to a single mechanism because the reaction mechanisms are
complex (Sablani et al., 2007). Anthocyanin degradation and non-enzymatic browning
(NEB) are among the chemical reactions that have a pre-eminent influence on the
quality of blackberry products that are heated to high temperatures.
Anthocyanins are water-soluble plant pigments that provide color to a variety of
vegetables, cereal grains, flowers and fruits such as berries; anthocyanins belong to the
class of flavonoid compounds commonly known as plant polyphenols. In the last two
decades, interest in anthocyanins has increased because of their use as natural food
colorants and their potential health-promoting properties (Andersen, 2009). The
preservation of color and the potential health impacts associated with natural pigments
are important issues for processed foods that are treated at high temperatures. For
example, anthocyanin pigments in fruit snacks or spray-dried food ingredients need to
be protected to meet new market requirements for sensory and functional quality.
Anthocyanins pigments readily degrade during thermal processing, which has a
dramatic impact on color and affects nutritional properties (Jimenez et al., 2010).
Relatively little is known about the mechanisms of anthocyanins thermal degradation,
except that degradation is primarily caused by oxidation and cleavage of covalent bonds
(Patras et al., 2010) (Figure III.2.1). Adams (1973) proposed that the hydrolysis of the
sugar moiety and the formation of aglycone are the initial steps of cyanidin 3-glucoside
degradation in an acidified aqueous solution at 100 ºC (Adams, 1973); Piffaut et al.
(1994) also suggested that thermal degradation of malvidin 3,5-diglucoside at 100 ºC
starts by the hydrolysis of glucosidic bonds, which destabilizes aglycone and leads to
opening of the pyrilium ring and subsequent chalcone formation (Piffaut et al., 1994).
Because thermal degradation is assumed to be a hydrolytic reaction, water availability is
thought to be essential for anthocyanin degradation (Erlandson et Wrolstad, 1972).
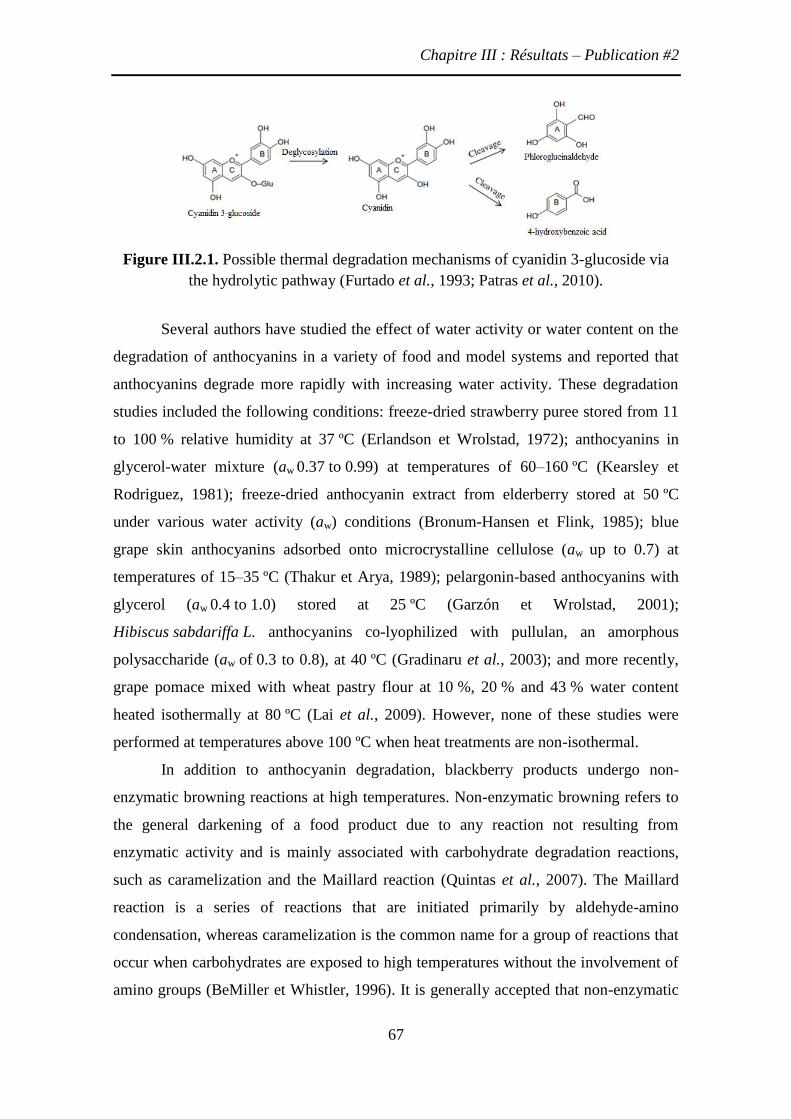
Chapitre III : Résultats – Publication #2
67
Figure III.2.1. Possible thermal degradation mechanisms of cyanidin 3-glucoside via
the hydrolytic pathway (Furtado et al., 1993; Patras et al., 2010).
Several authors have studied the effect of water activity or water content on the
degradation of anthocyanins in a variety of food and model systems and reported that
anthocyanins degrade more rapidly with increasing water activity. These degradation
studies included the following conditions: freeze-dried strawberry puree stored from 11
to 100 % relative humidity at 37 ºC (Erlandson et Wrolstad, 1972); anthocyanins in
glycerol-water mixture (aw 0.37 to 0.99) at temperatures of 60–160 ºC (Kearsley et
Rodriguez, 1981); freeze-dried anthocyanin extract from elderberry stored at 50 ºC
under various water activity (aw) conditions (Bronum-Hansen et Flink, 1985); blue
grape skin anthocyanins adsorbed onto microcrystalline cellulose (aw up to 0.7) at
temperatures of 15–35 ºC (Thakur et Arya, 1989); pelargonin-based anthocyanins with
glycerol (aw 0.4 to 1.0) stored at 25 ºC (Garzón et Wrolstad, 2001);
Hibiscus sabdariffa L. anthocyanins co-lyophilized with pullulan, an amorphous
polysaccharide (aw of 0.3 to 0.8), at 40 ºC (Gradinaru et al., 2003); and more recently,
grape pomace mixed with wheat pastry flour at 10 %, 20 % and 43 % water content
heated isothermally at 80 ºC (Lai et al., 2009). However, none of these studies were
performed at temperatures above 100 ºC when heat treatments are non-isothermal.
In addition to anthocyanin degradation, blackberry products undergo non-
enzymatic browning reactions at high temperatures. Non-enzymatic browning refers to
the general darkening of a food product due to any reaction not resulting from
enzymatic activity and is mainly associated with carbohydrate degradation reactions,
such as caramelization and the Maillard reaction (Quintas et al., 2007). The Maillard
reaction is a series of reactions that are initiated primarily by aldehyde-amino
condensation, whereas caramelization is the common name for a group of reactions that
occur when carbohydrates are exposed to high temperatures without the involvement of
amino groups (BeMiller et Whistler, 1996). It is generally accepted that non-enzymatic
Chapitre III : Résultats – Publication #2
68
browning exhibits a maximum reaction rate in intermediate water activity ranges (aw of
0.5 to 0.8). The proposed explanation is that many of the reactions in the NEB scheme
are bimolecular. Therefore, in the high water activity range, the reactants are in solution,
and further dilution by water reduces the reaction rate by the well-known law of mass
action; thus, the reaction rate is proportional to the reactant concentration, which
decreases with increasing water content (Karel et Lund, 2003).
To elucidate the effects of processing parameters (temperature and water
activity) on anthocyanin degradation and non-enzymatic browning of blackberry juice,
this study had three main goals: 1) to experimentally quantify the total monomeric
anthocyanin content (A(t)
) and the non-enzymatic browning index (B(t)
) during heat
treatments of a blackberry juice–quartz sand system at three different water contents
corresponding to different water activities at 25 ºC (aw 0.34, 0.76 and 0.95); 2) to
develop a kinetic model to describe the evolution of A(t)
and B(t)
under non-isothermal
heating conditions; and 3) to evaluate the effect of water activity on the kinetics of
anthocyanin degradation and non-enzymatic browning reactions.
7.2 Materials and methods
7.2.1 Blackberry juice
Fully ripe tropical highland blackberries (Rubus adenotrichus) were harvested in the
Cartago region of Costa Rica (1,500 m above sea level) and were frozen at –20 ºC. The
frozen blackberries were thawed at 5 ºC for 24 h and pressed with a discontinuous
hydraulic press (OTC 25-ton H-frame Hydraulic Shop Press, Series Y125, Owatonna,
MN, USA) to obtain the juice. The juice was then freeze-dried and vacuum-packed in
laminated metallic bags, and it was kept frozen at –18 ºC.
7.2.2 Preparation of blackberry juice - quartz sand samples
Freeze-dried blackberry juice was reconstituted by dilution at 10 g 100 mL–1
in
distilled water and mixed at 1,800 rpm for 30 min in a vibrating shaker (Heidolph®
MULTI REAX, Schwabach, Germany). Reconstituted blackberry juice and previously
dried Fontainebleau sand (99.8 % SiO2,VWR International S.A.S., Fontenay-sous-Bois,
France) were mixed together at a dry weight ratio of 1:9 (w/w), and the mixture was
freeze-dried using a CRYO lyophilizer (Cryonext, Saint Gely du Fesc, France). The
resulting powder was homogenized in a ball mill (Dangoumill 300, Prolabo, Paris,
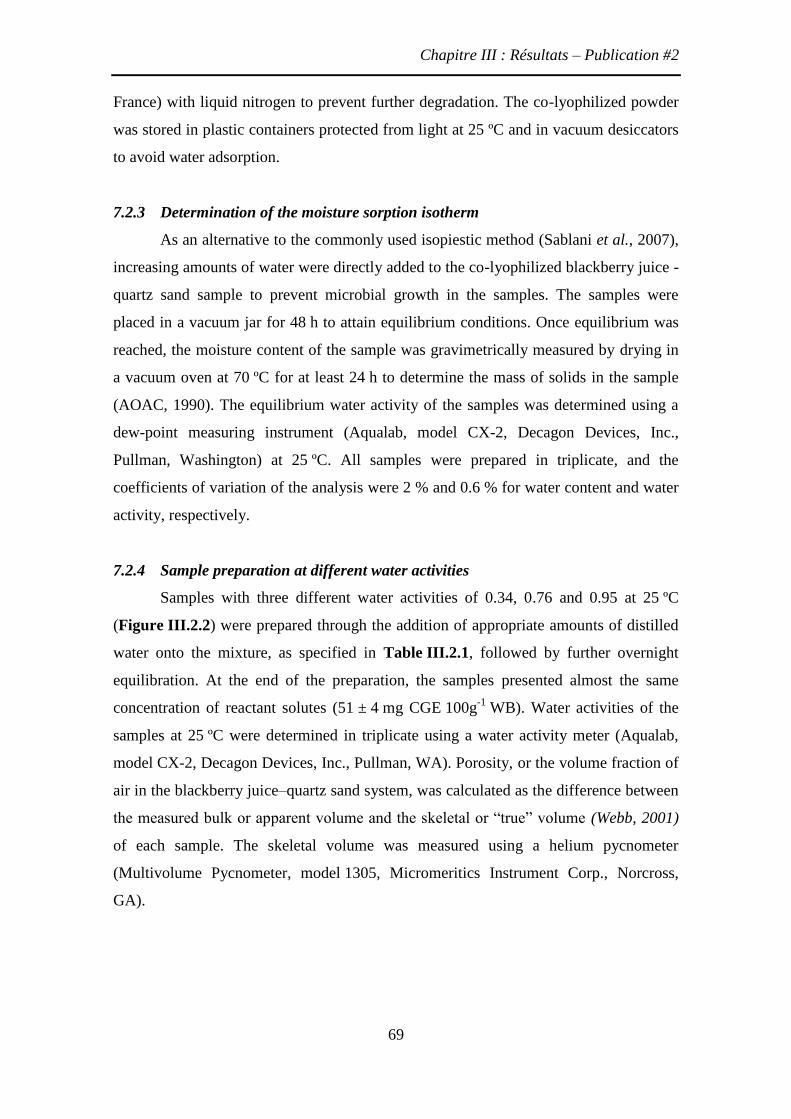
Chapitre III : Résultats – Publication #2
69
France) with liquid nitrogen to prevent further degradation. The co-lyophilized powder
was stored in plastic containers protected from light at 25 ºC and in vacuum desiccators
to avoid water adsorption.
7.2.3 Determination of the moisture sorption isotherm
As an alternative to the commonly used isopiestic method (Sablani et al., 2007),
increasing amounts of water were directly added to the co-lyophilized blackberry juice -
quartz sand sample to prevent microbial growth in the samples. The samples were
placed in a vacuum jar for 48 h to attain equilibrium conditions. Once equilibrium was
reached, the moisture content of the sample was gravimetrically measured by drying in
a vacuum oven at 70 ºC for at least 24 h to determine the mass of solids in the sample
(AOAC, 1990). The equilibrium water activity of the samples was determined using a
dew-point measuring instrument (Aqualab, model CX-2, Decagon Devices, Inc.,
Pullman, Washington) at 25 ºC. All samples were prepared in triplicate, and the
coefficients of variation of the analysis were 2 % and 0.6 % for water content and water
activity, respectively.
7.2.4 Sample preparation at different water activities
Samples with three different water activities of 0.34, 0.76 and 0.95 at 25 ºC
(Figure III.2.2) were prepared through the addition of appropriate amounts of distilled
water onto the mixture, as specified in Table III.2.1, followed by further overnight
equilibration. At the end of the preparation, the samples presented almost the same
concentration of reactant solutes (51 ± 4 mg CGE 100g-1
WB). Water activities of the
samples at 25 ºC were determined in triplicate using a water activity meter (Aqualab,
model CX-2, Decagon Devices, Inc., Pullman, WA). Porosity, or the volume fraction of
air in the blackberry juice–quartz sand system, was calculated as the difference between
the measured bulk or apparent volume and the skeletal or “true” volume (Webb, 2001)
of each sample. The skeletal volume was measured using a helium pycnometer
(Multivolume Pycnometer, model 1305, Micromeritics Instrument Corp., Norcross,
GA).
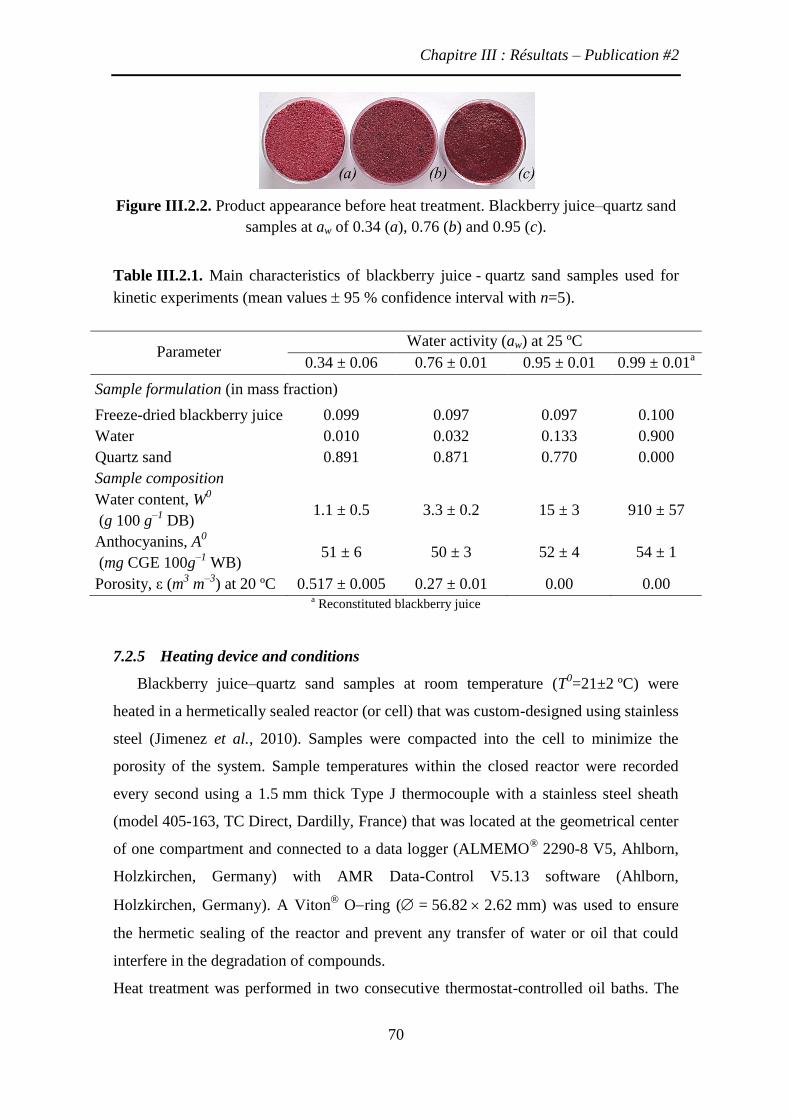
Chapitre III : Résultats – Publication #2
70
Figure III.2.2. Product appearance before heat treatment. Blackberry juice–quartz sand
samples at aw of 0.34 (a), 0.76 (b) and 0.95 (c).
Table III.2.1. Main characteristics of blackberry juice - quartz sand samples used for
kinetic experiments (mean values 95 % confidence interval with n=5).
Parameter Water activity (aw) at 25 ºC
0.34 ± 0.06 0.76 ± 0.01 0.95 ± 0.01 0.99 ± 0.01a
Sample formulation (in mass fraction)
Freeze-dried blackberry juice 0.099 0.097 0.097 0.100
Water 0.010 0.032 0.133 0.900
Quartz sand 0.891 0.871 0.770 0.000
Sample composition
Water content, W0
(g 100 g–1
DB) 1.1 ± 0.5 3.3 ± 0.2 15 ± 3 910 ± 57
Anthocyanins, A0
(mg CGE 100g–1
WB) 51 ± 6 50 ± 3 52 ± 4 54 ± 1
Porosity, ε (m3 m
–3) at 20 ºC 0.517 ± 0.005 0.27 ± 0.01 0.00 0.00
a Reconstituted blackberry juice
7.2.5 Heating device and conditions
Blackberry juice–quartz sand samples at room temperature (T0=21±2 ºC) were
heated in a hermetically sealed reactor (or cell) that was custom-designed using stainless
steel (Jimenez et al., 2010). Samples were compacted into the cell to minimize the
porosity of the system. Sample temperatures within the closed reactor were recorded
every second using a 1.5 mm thick Type J thermocouple with a stainless steel sheath
(model 405-163, TC Direct, Dardilly, France) that was located at the geometrical center
of one compartment and connected to a data logger (ALMEMO® 2290-8 V5, Ahlborn,
Holzkirchen, Germany) with AMR Data-Control V5.13 software (Ahlborn,
Holzkirchen, Germany). A Viton
Oring ( = 56.82 2.62 mm) was used to ensure
the hermetic sealing of the reactor and prevent any transfer of water or oil that could
interfere in the degradation of compounds.
Heat treatment was performed in two consecutive thermostat-controlled oil baths. The
Chapitre III : Résultats – Publication #2
71
first bath, a 5 L oil bath (Huber CC-304B, heating circulator bath, Huber
Kältemaschinenbau, Offenburg, Germany) was maintained at a high temperature
(T = 250 ºC) to quickly increase the sample temperature. The bulk temperature (T
∞)
was achieved using silicon oil (Thermofluid P20.275.50, Huber Kältemaschinenbau,
Offenburg, Germany) and was controlled with a Pt 100 temperature sensor. The second
bath, a 5 L deep-fat fryer (model KPB 50, Kenwood, Villepinte, France), was heated to
trial temperatures in the range of 100–140 ºC. The time interval between the first and
second thermostat oil baths did not exceed 3 s. When the reactor was first plunged into
the oil, the maximum variation of the oil temperature was 5 ºC below T∞. The test cell
was supported and constantly submerged using a wire.
For the kinetic experiments, samples were taken out of the oil bath after different
heating durations, which were chosen according to the treatment temperatures. After
each heat treatment, the reactor was immediately cooled in an ice water bath and wiped
with paper towels. The samples were then removed from the cells and stored at –18 ºC
overnight until analysis.
7.2.6 Blackberry juice–quartz sand sample extraction
Five grams of homogenized sample were extracted with 45 mL of distilled water,
and the extraction was performed in three stages. At each stage, the sample was stirred
at 1800 rpm for 5 min in a vibrating shaker (Heidolph® MULTI REAX, Schwabach,
Germany) and centrifuged at 8300×g for 10 min at 10 ºC (Allegra 21 centrifuge,
Beckman Coulter, Brea, CA, USA), and the supernatant was separated until a colorless
sand residue was obtained. The extract was then filtered using a Minisart SRP 25 filter
(0.45 μm pore size; Sartorius AG, Gottingen, Germany) to separate suspended solids
formed during heating and cooling.
7.2.7 Analytical methods
7.2.7.1 Total monomeric anthocyanin content
Total monomeric anthocyanin content was determined using the pH differential
method (Lee et al., 2005), which had been previously validated by comparing selected
results with the HPLC method (Jimenez et al., 2010). The sample absorbance was
measured at pH 1.0 and 4.5 at the wavelength of maximum absorbance (510 nm) and at
700 nm to correct for haze. Measurements were performed using a microplate
Chapitre III : Résultats – Publication #2
72
spectrofluorimeter (Infinite® 200, Tecan France S.A.S., Lyon, France) with 96-well
polypropylene plates. Total monomeric anthocyanins were expressed as cyanidin
3glucoside equivalents, which are the most prevalent anthocyanin type in R.
adenotrichus (95 %) (Mertz et al., 2007):
( ) 1 3( ) 10t A MW DFA mg L
l
(39)
where A is the sample absorbance [(A510nm – A700nm)pH1.0 – (A510nm – A700nm)pH4.5]; MW
is the molecular weight (449.2 g mol–1
for cyanidin 3-glucoside); DF is the dilution
factor (10 to 50); is the molar extinction coefficient (26 900 L mol–1
cm–1
); l is the
path length (0.52 cm; calculated for the specific well geometry with 200 μL of solution)
and 103 is the multiplication factor for converting g to mg.
1.1.1.1 Non-enzymatic browning index
The non-enzymatic browning index was calculated according to the method of
Buglione et Lozano (2002) for red juices. A microplate spectrofluorimeter was used
with transparent polypropylene 96-well plates. The absorbance of the sample was
measured at pH 1.0 at two wavelengths: 510 nm for the anthocyanin maximum
absorbance and 420 nm for the absorbance of both browning products and
anthocyanins. The non-enzymatic browning index was calculated as follows:
( )
510 420/tB A A (40)
The non-enzymatic browning equilibrium value (B) was previously determined
after prolonged heating at high temperature, which showed that the equilibrium value
was reached at B = 0.250.02 (Jimenez et al., 2010).
7.2.7.2 Identification of 5-HMF by GC-MS analysis
Volatile compounds of blackberry juice–quartz sand samples were extracted with a
dichloromethane/pentane solution. Injections using 1 µL of the extract were analyzed
using a gas chromatograph (Agilent, model 6890 HP, Agilent Technology, Massy,
France) with a polar column (DB WAX). Mass spectrometry was performed using a
mass-selective detector (Agilent model 5973, Agilent Technology, Massy, France)
operated in electron ionization mode (70 eV). The mass spectrometer scanned from m/z
35 to 350. Identification of the volatile compounds was carried out using the mass
spectra libraries (Wiley, NIST, INRA database) and by comparing the retention indices
with those found in the literature.

Chapitre III : Résultats – Publication #2
73
7.2.8 Kinetic model development
Kinetic modeling was conducted to develop a useful tool that, in association with a
heat transfer model, could predict anthocyanin degradation and non-enzymatic
browning in blackberry juice at different water activities exposed to different isothermal
or non-isothermal heat treatments. Equations for evaluating the cumulative effects of
any time-temperature history (T(t)
) on A(t)
and B(t)
are presented.
7.2.8.1 Selecting models
The anthocyanin content decrease and non-enzymatic browning index increase
during heat treatment were described in terms of irreversible first-order kinetics:
( )( )
tt
A
d Ak A
dt (41)
( )
( )t
t
B
d Bk B B
dt
(42)
where B was determined experimentally as B
= 0.250.02.
The rate constants kA and kB (s–1
) were assumed to vary with the absolute
temperature of the system, T (K), according to the Arrhenius equation as follows:
( )
1 1exp
X
X t
a
X ref
ref
E
R T Tk k
,
(43)
where kXref, EaX, and R are the rate constant at the reference temperature (s–1
), the
apparent activation energy (J mol–1
) for the rate constant and the gas constant
(8.314 J mol–1
K–1
), respectively. The reference temperature in the middle of the studied
temperature range was chosen and expressed as follows:
1
1 n
ref i
i
T Tn
(44)
During each heat treatment, the non-isothermal stages (heating, maintaining, and
cooling) were recorded. Each time-temperature profile (T(t)
; Figure III.2.3) was fitted
with a cubic smoothing spline (MATLAB®, version 7.0, The MathWorks Inc., Natick,
MA, USA) by considering the temperature field inside the cell to be homogeneous.
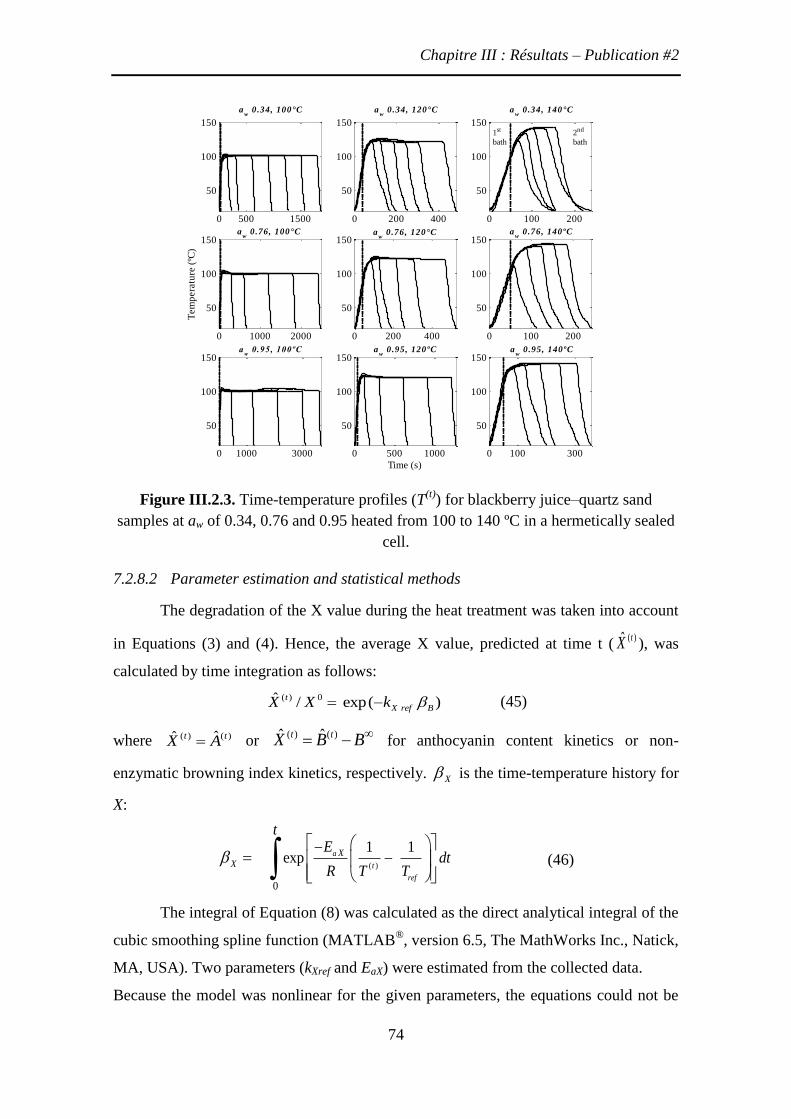
Chapitre III : Résultats – Publication #2
74
Figure III.2.3. Time-temperature profiles (T(t)
) for blackberry juice–quartz sand
samples at aw of 0.34, 0.76 and 0.95 heated from 100 to 140 ºC in a hermetically sealed
cell.
7.2.8.2 Parameter estimation and statistical methods
The degradation of the X value during the heat treatment was taken into account
in Equations (3) and (4). Hence, the average X value, predicted at time t (( )ˆ tX ), was
calculated by time integration as follows:
( ) 0ˆ / exp( )t
X ref BX X k (45)
where ( ) ( )ˆˆ t tX A or ( ) ( )ˆ ˆt tX B B for anthocyanin content kinetics or non-
enzymatic browning index kinetics, respectively. X is the time-temperature history for
X:
( )
0
1 1exp a
t
ref
XX
tE
dtR T T
(46)
The integral of Equation (8) was calculated as the direct analytical integral of the
cubic smoothing spline function (MATLAB®, version 6.5, The MathWorks Inc., Natick,
MA, USA). Two parameters (kXref and EaX) were estimated from the collected data.
Because the model was nonlinear for the given parameters, the equations could not be
0 500 1500
50
100
150
aw
0 .34, 100°C
0 200 400
50
100
150
aw
0 .34, 120°C
0 100 200
50
100
150
aw
0 .34, 140°C
0 1000 2000
50
100
150
Tem
pera
ture
(ºC
)
aw
0 .76, 100°C
0 200 400
50
100
150 a
w 0 .76, 120°C
0 100 200
50
100
150 a
w 0 .76, 140ºC
0 1000 3000
50
100
150 a
w 0 .95, 100ºC
0 500 1000
50
100
150
Time (s)
aw
0 .95, 120ºC
0 100 300
50
100
150 a
w 0 .95, 140ºC
1st
bath
2nd
bath
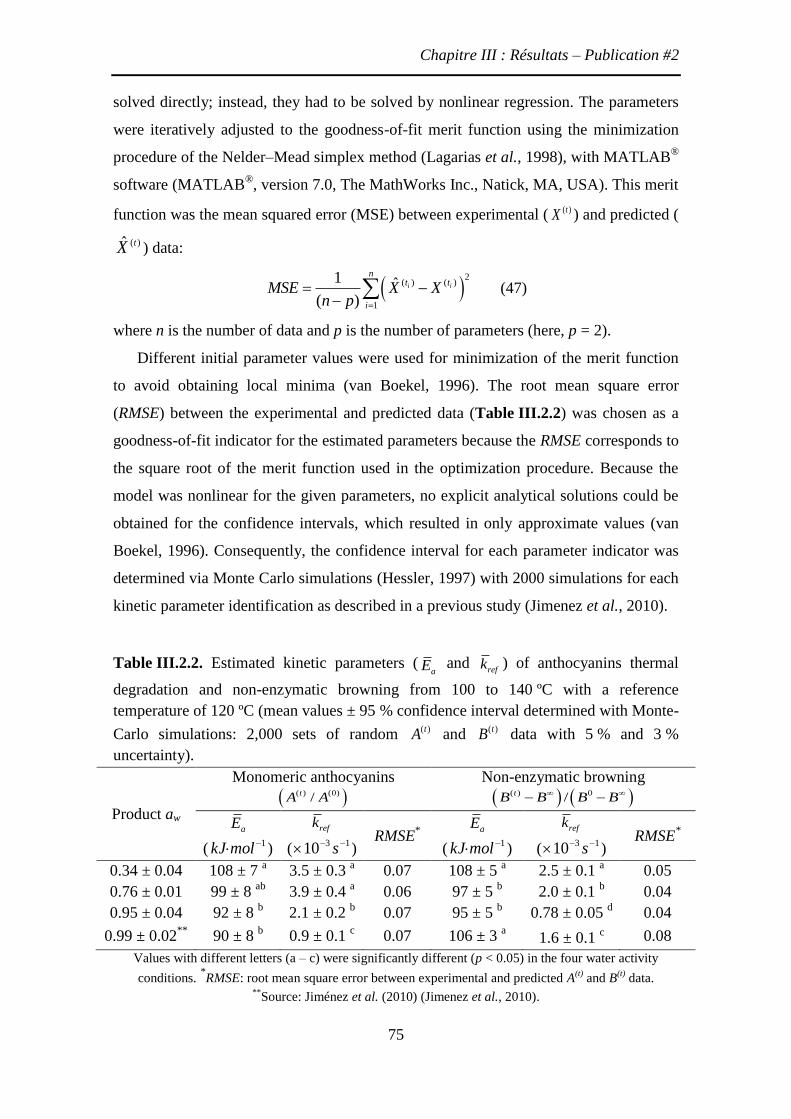
Chapitre III : Résultats – Publication #2
75
solved directly; instead, they had to be solved by nonlinear regression. The parameters
were iteratively adjusted to the goodness-of-fit merit function using the minimization
procedure of the Nelder–Mead simplex method (Lagarias et al., 1998), with MATLAB®
software (MATLAB®, version 7.0, The MathWorks Inc., Natick, MA, USA). This merit
function was the mean squared error (MSE) between experimental ( ( )tX ) and predicted (
( )ˆ tX ) data:
2
( ) ( )
1
1 ˆ( )
i i
nt t
i
MSE X Xn p
(47)
where n is the number of data and p is the number of parameters (here, p = 2).
Different initial parameter values were used for minimization of the merit function
to avoid obtaining local minima (van Boekel, 1996). The root mean square error
(RMSE) between the experimental and predicted data (Table III.2.2) was chosen as a
goodness-of-fit indicator for the estimated parameters because the RMSE corresponds to
the square root of the merit function used in the optimization procedure. Because the
model was nonlinear for the given parameters, no explicit analytical solutions could be
obtained for the confidence intervals, which resulted in only approximate values (van
Boekel, 1996). Consequently, the confidence interval for each parameter indicator was
determined via Monte Carlo simulations (Hessler, 1997) with 2000 simulations for each
kinetic parameter identification as described in a previous study (Jimenez et al., 2010).
Table III.2.2. Estimated kinetic parameters (aE and
refk ) of anthocyanins thermal
degradation and non-enzymatic browning from 100 to 140 ºC with a reference
temperature of 120 ºC (mean values ± 95 % confidence interval determined with Monte-
Carlo simulations: 2,000 sets of random ( )tA and ( )tB data with 5 % and 3 %
uncertainty).
Product aw
Monomeric anthocyanins
( ) (0)/tA A
Non-enzymatic browning
( ) 0/tB B B B
aE
(1molkJ )
refk
(1310 s )
RMSE*
aE
(1molkJ )
refk
(1310 s )
RMSE*
0.34 ± 0.04 108 ± 7 a 3.5 ± 0.3
a 0.07 108 ± 5
a 2.5 ± 0.1
a 0.05
0.76 ± 0.01 99 ± 8 ab
3.9 ± 0.4 a 0.06 97 ± 5
b 2.0 ± 0.1
b 0.04
0.95 ± 0.04 92 ± 8 b 2.1 ± 0.2
b 0.07 95 ± 5
b 0.78 ± 0.05
d 0.04
0.99 ± 0.02**
90 ± 8 b 0.9 ± 0.1
c 0.07 106 ± 3
a 1.6 ± 0.1
c 0.08
Values with different letters (a – c) were significantly different (p < 0.05) in the four water activity
conditions. *RMSE: root mean square error between experimental and predicted A
(t) and B
(t) data.
**Source: Jiménez et al. (2010) (Jimenez et al., 2010).

Chapitre III : Résultats – Publication #2
76
7.3 Results and discussion
7.3.1 Characteristics of the blackberry juice–quartz sand system
Table III.2.1 presents the composition of the samples prepared from freeze-dried
blackberry juice and quartz sand at three different water activities measured at 25 ºC
before heat treatment and the main characteristics of the samples used in kinetic
experiments. The samples had equivalent initial concentrations (A0) of reactant solutes
(51 ± 4 mg CGE 100g1
WB). However, there was a significant variation in the porosity
between samples despite the compaction used to reduce the air volume in the system;
texture differences were also observed, as shown in Figure III.2.2.
7.3.2 Kinetic parameter estimation
Monomeric anthocyanin content and non-enzymatic browning index were measured
experimentally in the blackberry juice–quartz sand samples at three levels of water
activity for different time-temperature treatments at 100, 120 and 140 ºC. A non-
isothermal method was used to estimate kinetic parameters (kref and Ea). Table III.2.2
shows the estimated kinetic parameters of anthocyanin degradation and NEB from 100
to 140 ºC for the three water activities (aw of 0.34, 0.76 and 0.95) and the data
previously reported for reconstituted blackberry juice alone at an aw of 0.99 (Jimenez et
al., 2010). The reaction kinetics during heat treatments of 100–140 ºC were well
represented by first-order reactions, as indicated by the low root mean square error
values (RMSE ≤ 0.07), which means that the absolute mean error between the
experimental and predicted values was less than 7 %. The confidence intervals of the
identified kinetic parameters reported in Table III.2.2 were determined via Monte-
Carlo simulations using 2000 data sets that generated the same number of best-fit values
for the kinetic parameters (kref and Ea). The Monte-Carlo method provides the most
accurate probability distribution of the model parameters and provides information on
the correlation between parameters (van Boekel, 2009c).
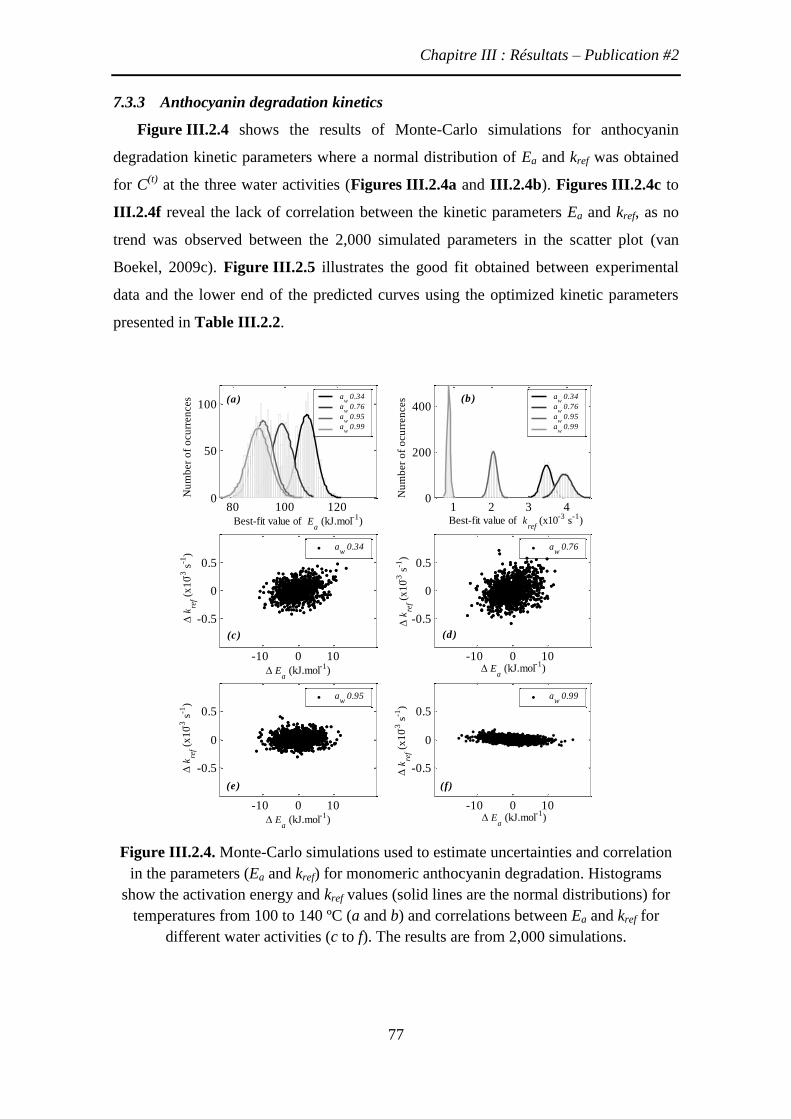
Chapitre III : Résultats – Publication #2
77
7.3.3 Anthocyanin degradation kinetics
Figure III.2.4 shows the results of Monte-Carlo simulations for anthocyanin
degradation kinetic parameters where a normal distribution of Ea and kref was obtained
for C(t)
at the three water activities (Figures III.2.4a and III.2.4b). Figures III.2.4c to
III.2.4f reveal the lack of correlation between the kinetic parameters Ea and kref, as no
trend was observed between the 2,000 simulated parameters in the scatter plot (van
Boekel, 2009c). Figure III.2.5 illustrates the good fit obtained between experimental
data and the lower end of the predicted curves using the optimized kinetic parameters
presented in Table III.2.2.
Figure III.2.4. Monte-Carlo simulations used to estimate uncertainties and correlation
in the parameters (Ea and kref) for monomeric anthocyanin degradation. Histograms
show the activation energy and kref values (solid lines are the normal distributions) for
temperatures from 100 to 140 ºC (a and b) and correlations between Ea and kref for
different water activities (c to f). The results are from 2,000 simulations.
80 100 1200
50
100
Best-fit value of Ea (kJ.mol
-1)
Nu
mb
er
of
ocu
rren
ces
1 2 3 40
200
400
Best-fit value of kref
(x10-3
s-1
)
-10 0 10
-0.5
0
0.5
Ea (kJ.mol
-1)
k
ref (
x1
0-3 s
-1)
-10 0 10
-0.5
0
0.5
Ea (kJ.mol
-1)
k
ref (
x1
0-3 s
-1)
-10 0 10
-0.5
0
0.5
Ea (kJ.mol
-1)
k
ref (
x1
0-3 s
-1)
-10 0 10
-0.5
0
0.5
Ea (kJ.mol
-1)
k
ref (
x1
0-3 s
-1)
aw
0.99 aw
0.95
aw
0.76 aw
0.34
aw 0.34
aw 0.76
aw 0.95
aw 0.99
aw 0.34
aw 0.76
aw 0.95
aw 0.99
(a) (b)
(c) (d)
(e) (f)
Nu
mb
er
of
ocu
rren
ces
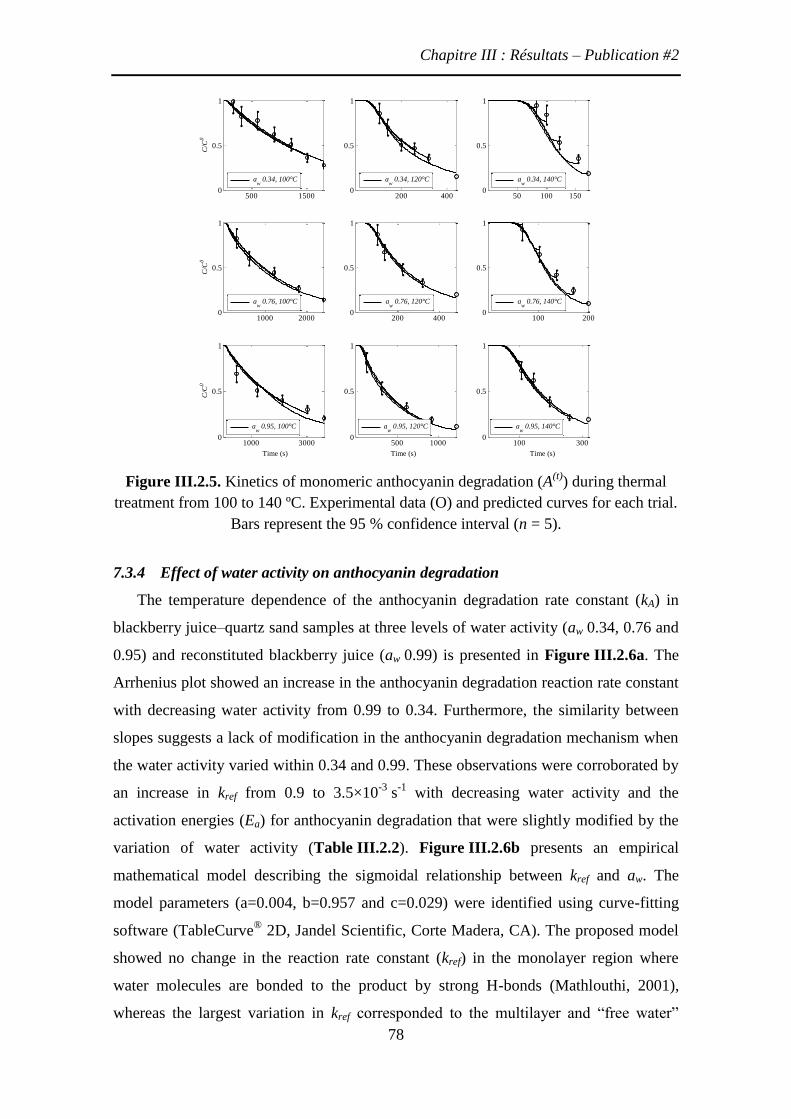
Chapitre III : Résultats – Publication #2
78
Figure III.2.5. Kinetics of monomeric anthocyanin degradation (A(t)
) during thermal
treatment from 100 to 140 ºC. Experimental data (O) and predicted curves for each trial.
Bars represent the 95 % confidence interval (n = 5).
7.3.4 Effect of water activity on anthocyanin degradation
The temperature dependence of the anthocyanin degradation rate constant (kA) in
blackberry juice–quartz sand samples at three levels of water activity (aw 0.34, 0.76 and
0.95) and reconstituted blackberry juice (aw 0.99) is presented in Figure III.2.6a. The
Arrhenius plot showed an increase in the anthocyanin degradation reaction rate constant
with decreasing water activity from 0.99 to 0.34. Furthermore, the similarity between
slopes suggests a lack of modification in the anthocyanin degradation mechanism when
the water activity varied within 0.34 and 0.99. These observations were corroborated by
an increase in kref from 0.9 to 3.5×10⁻³
s-1
with decreasing water activity and the
activation energies (Ea) for anthocyanin degradation that were slightly modified by the
variation of water activity (Table III.2.2). Figure III.2.6b presents an empirical
mathematical model describing the sigmoidal relationship between kref and aw. The
model parameters (a=0.004, b=0.957 and c=0.029) were identified using curve-fitting
software (TableCurve®
2D, Jandel Scientific, Corte Madera, CA). The proposed model
showed no change in the reaction rate constant (kref) in the monolayer region where
water molecules are bonded to the product by strong H-bonds (Mathlouthi, 2001),
whereas the largest variation in kref corresponded to the multilayer and “free water”
500 15000
0.5
1
C/C
0
200 4000
0.5
1
50 100 1500
0.5
1
aw 0.34, 140°C a
w 0.34, 100°C a
w 0.34, 120°C
1000 20000
0.5
1
C/C
0
200 4000
0.5
1
100 2000
0.5
1
aw 0.76, 140°C a
w 0.76, 120°C a
w 0.76, 100°C
1000 30000
0.5
1
C/C
0
500 10000
0.5
1
100 3000
0.5
1
aw 0.95, 100°C a
w 0.95, 120°C a
w 0.95, 140°C
Time (s) Time (s) Time (s)

Chapitre III : Résultats – Publication #2
79
region of the sorption isotherm at 25 ºC. In view of these results, it appears that the
reduction in water activity had a negative effect on the stability of anthocyanins at high
temperatures, which contradicts results reported in the literature on the effect of water
activity on anthocyanin degradation at lower temperatures (Bronum-Hansen et Flink,
1985; Erlandson et Wrolstad, 1972; Garzón et Wrolstad, 2001; Gradinaru et al., 2003;
Lai et al., 2009; Thakur et Arya, 1989). The reduction in water activity from an aw of
0.99 to 0.34 caused a 4-fold increase in the anthocyanin degradation rate constant (kA),
whereas a temperature increase from 100 to 140 ºC induced a 17-fold increase in kA.
Temperature was the main parameter affecting the anthocyanins reaction rate; however,
the combination of high temperatures and low initial water activities may have caused
the anthocyanin degradation rate constant to increase significantly by up to 70-fold.
Figure III.2.6. Relationship between anthocyanin degradation rate constants (kA and
kref) of the blackberry juice–quartz sand system and water activity (aw) from 100 to
140 ºC. Arrhenius plot describing the temperature dependence of kC at three water
activities (aw of 0.34, 0.76 and 0.95) (a) and empirical mathematical model describing
the sigmoidal relationship between kref and aw along with the moisture sorption isotherm
at 25 ºC (b). Bars represent the 95 % confidence interval (n = 2,000).
2.4 2.5 2.6 2.7
10-3
10-2
103/T (K
-1)
k C (
s-1)
aw 0.34
aw 0.76
aw 0.95
aw 0.99
0.2 0.4 0.6 0.8 1.0
1
2
3
4
Water activity
kre
f (x1
0-3
s-1)
20
40
60
80
100
Wate
r co
nte
nt (g
10
0g -1 W
B)
95% Confidence interval
kref
= a / (1+ exp[ (aw
- b) / c] )
Moisture sorption isotherm
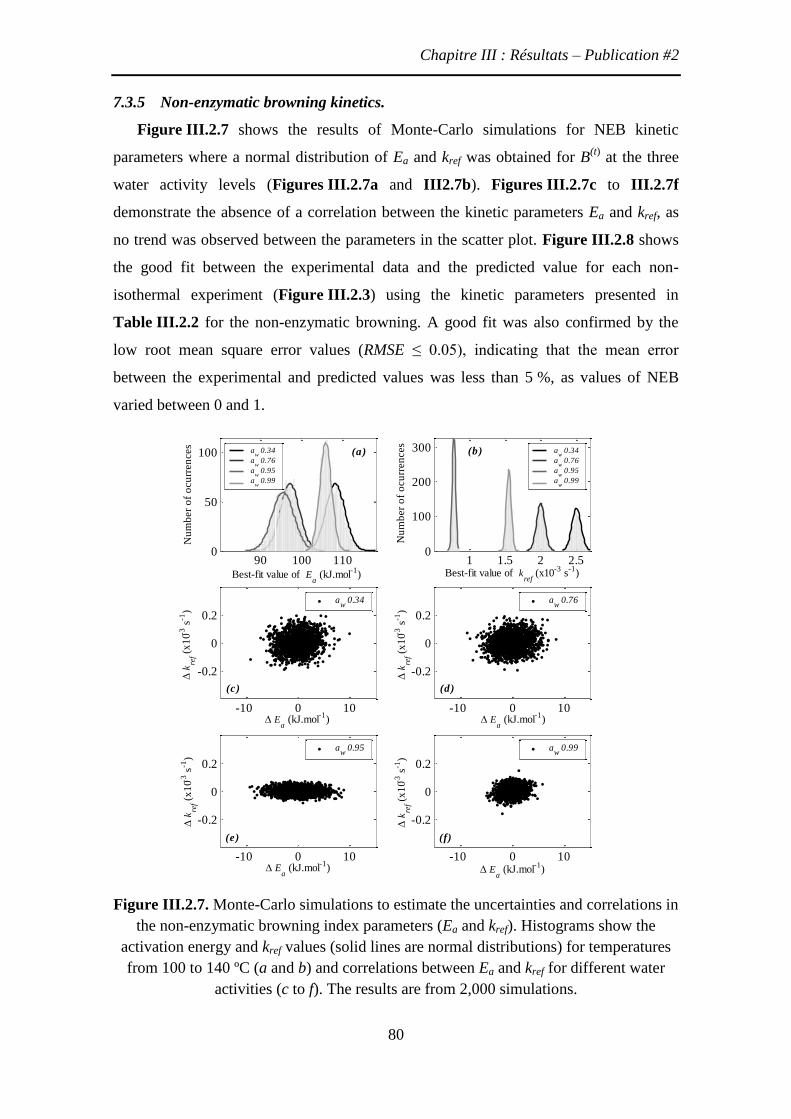
Chapitre III : Résultats – Publication #2
80
7.3.5 Non-enzymatic browning kinetics.
Figure III.2.7 shows the results of Monte-Carlo simulations for NEB kinetic
parameters where a normal distribution of Ea and kref was obtained for B(t)
at the three
water activity levels (Figures III.2.7a and III2.7b). Figures III.2.7c to III.2.7f
demonstrate the absence of a correlation between the kinetic parameters Ea and kref, as
no trend was observed between the parameters in the scatter plot. Figure III.2.8 shows
the good fit between the experimental data and the predicted value for each non-
isothermal experiment (Figure III.2.3) using the kinetic parameters presented in
Table III.2.2 for the non-enzymatic browning. A good fit was also confirmed by the
low root mean square error values (RMSE ≤ 0.05), indicating that the mean error
between the experimental and predicted values was less than 5 %, as values of NEB
varied between 0 and 1.
Figure III.2.7. Monte-Carlo simulations to estimate the uncertainties and correlations in
the non-enzymatic browning index parameters (Ea and kref). Histograms show the
activation energy and kref values (solid lines are normal distributions) for temperatures
from 100 to 140 ºC (a and b) and correlations between Ea and kref for different water
activities (c to f). The results are from 2,000 simulations.
90 100 1100
50
100
Best-fit value of Ea (kJ.mol
-1)
Nu
mb
er
of
ocu
rren
ces
1 1.5 2 2.50
100
200
300
Best-fit value of kref
(x10-3
s-1
)
Nu
mb
er
of
ocu
rren
ces
-10 0 10
-0.2
0
0.2
Ea (kJ.mol
-1)
k
ref (
x1
0-3 s
-1)
-10 0 10
-0.2
0
0.2
Ea (kJ.mol
-1)
k
ref (
x1
0-3 s
-1)
-10 0 10
-0.2
0
0.2
Ea (kJ.mol
-1)
k
ref (
x1
0-3 s
-1)
-10 0 10
-0.2
0
0.2
Ea (kJ.mol
-1)
k
ref (
x1
0-3 s
-1)
aw
0.99 aw
0.95
aw
0.76 aw
0.34
aw 0.34
aw 0.76
aw 0.95
aw 0.99
aw 0.34
aw 0.76
aw 0.95
aw 0.99
(a) (b)
(c) (d)
(e) (f)

Chapitre III : Résultats – Publication #2
81
Figure III.2.8. Kinetics of non-enzymatic browning during heat treatment from 100 to
140 ºC. Experimental data () and predicted curves for each trial. Bars represent the
95 % confidence interval (n = 5).
7.3.6 Effect of water activity on non-enzymatic browning
Kinetic parameters reported in Table III.2.2 show an increase in kref from 0.78 to
2.5×10⁻³
s-1
with decreasing water activity from 0.34 to 0.95; this pattern was similar to
that observed for anthocyanin degradation. However, a significant difference (p <0.05)
was found among activation energy values (Ea) obtained at a low water activity (aw of
0.34) or at higher aw levels. The kinetic parameters previously reported for reconstituted
juice blackberry (Jimenez et al., 2010) did not show a clear trend relative to those
obtained in this study (Table III.2.2). The lack of continuity may be due to the marked
difference between the reconstituted blackberry juice and the studied systems
(Figure III.2.2), which had a wide variation in porosity (from 0 to 52 %, see
Table III.2.1). The variation in porosity observed in this system may have caused
differences in the thermophysical properties of the bi-phasic system, especially the
thermal conductivity of the porous product, because of large differences in the thermal
conductivities between the gaseous (kair~0.03 W m–1
K–1
) and condensed phase
components of the product (kquartzsand~7.50 W m–1
K–1
) (Carson et al., 2006). This factor
may have had an impact on the temperature gradients simulated inside the reactor and
500 15000
0.5
1
(B
-B
)/(B
0-B
)
200 4000
0.5
1
50 100 1500
0.5
1
aw 0.34, 120°C a
w 0.34, 140°C a
w 0.34, 100°C
1000 20000
0.5
1
(B
-B
)/(B
0-B
)
200 4000
0.5
1
100 2000
0.5
1
aw 0.76, 140°C a
w 0.76, 100°C a
w 0.76, 120°C
1000 30000
0.5
1
(B
-B
)/(B
0-B
)
500 10000
0.5
1
100 200 3000
0.5
1
aw 0.95, 100°C a
w 0.95, 120°C a
w 0.95, 140°C
Time (s) Time (s) Time (s)

Chapitre III : Résultats – Publication #2
82
the temperature profiles used for the determination of kinetic parameters. Furthermore,
no maximum value for the reaction rate was observed at intermediate water activities in
the range of 0.5–0.8, as typically reported in the literature (Karel et Lund, 2003). This
lack of maximum value may have resulted from methodological differences: the
variations in water activity were controlled by the addition of water in most studies,
which causes a dilution of the reactant solutes. In contrast, in the present study, the
concentration of the reactant solutes was kept constant for all water activity levels
(Table III.2.1), and no dilution occurred.
7.3.7 Hypothetical effect of water activity on the interaction between anthocyanin
degradation and NEB kinetics at high temperature
A possible explanation is presented for the seemingly contradictory results
between the literature and the present study: the results reported in the literature
(Bronum-Hansen et Flink, 1985; Erlandson et Wrolstad, 1972; Garzón et Wrolstad,
2001; Gradinaru et al., 2003; Lai et al., 2009; Thakur et Arya, 1989) were obtained at
temperatures under 100 ºC and, in some cases, in model solutions without sugar. At
high temperatures, many factors may be involved in anthocyanin degradation, such as
the formation of Maillard reactions and caramelization products. The tropical highland
blackberries (R. adenotrichus) used in the present study contain high amounts of sugars
such as glucose (117 ± 7 mg g-1
fruit DB) and fructose (104 ± 8 mg g-1
fruit DB)
(Acosta-Montoya et al.), which are the precursors of NEB reactions. Among the
degradation products of Maillard and caramelization reactions, one product of special
distinction is 5-hydroxymethylfurfural (HMF). The typical brown color developed
during caramelization is attributed to the production of polymeric products during the
reaction course, and HMF and furfural have been indicated as precursors of these
polymers (Kroh, 1994). The presence of HMF in the blackberry juice–quartz sand
samples at low water activity (aw 0.45) upon heating at 140 ºC for 3 and 6 min was
confirmed by GC/MS analysis (data not shown). Furfural and HMF have been reported
to react with anthocyanins to produce dark brownish reaction products (Es-Safi et al.,
2000). The interaction between HMF and cyanidin 3-glucoside was investigated in
blackberry juice and in a citrate buffer model solution at 24, 50 and 70 ºC, and
acceleration of the pigment degradation was observed (Debicki-Pospisil et al., 1983).
Es-Safi et al. (2002) reported that furfural compounds play a major role in the
condensation of flavanols and anthocyanins (Es-Safi et al., 2002) (Figure III.2.9). Such
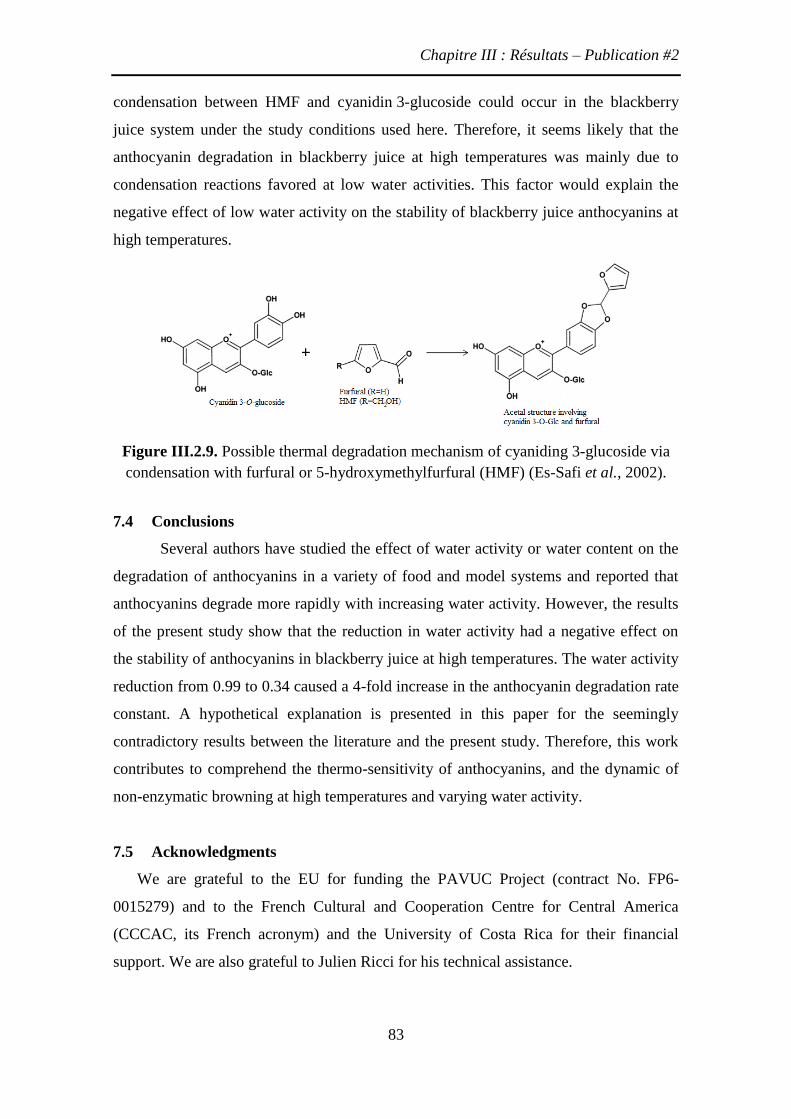
Chapitre III : Résultats – Publication #2
83
condensation between HMF and cyanidin 3-glucoside could occur in the blackberry
juice system under the study conditions used here. Therefore, it seems likely that the
anthocyanin degradation in blackberry juice at high temperatures was mainly due to
condensation reactions favored at low water activities. This factor would explain the
negative effect of low water activity on the stability of blackberry juice anthocyanins at
high temperatures.
Figure III.2.9. Possible thermal degradation mechanism of cyaniding 3-glucoside via
condensation with furfural or 5-hydroxymethylfurfural (HMF) (Es-Safi et al., 2002).
7.4 Conclusions
Several authors have studied the effect of water activity or water content on the
degradation of anthocyanins in a variety of food and model systems and reported that
anthocyanins degrade more rapidly with increasing water activity. However, the results
of the present study show that the reduction in water activity had a negative effect on
the stability of anthocyanins in blackberry juice at high temperatures. The water activity
reduction from 0.99 to 0.34 caused a 4-fold increase in the anthocyanin degradation rate
constant. A hypothetical explanation is presented in this paper for the seemingly
contradictory results between the literature and the present study. Therefore, this work
contributes to comprehend the thermo-sensitivity of anthocyanins, and the dynamic of
non-enzymatic browning at high temperatures and varying water activity.
7.5 Acknowledgments
We are grateful to the EU for funding the PAVUC Project (contract No. FP6-
0015279) and to the French Cultural and Cooperation Centre for Central America
(CCCAC, its French acronym) and the University of Costa Rica for their financial
support. We are also grateful to Julien Ricci for his technical assistance.
Chapitre III: Résultats – Publication #3
84
8 Publication #3 : Modélisation d’un réacteur en 3D pour estimer les
paramètres de la cinétique de dégradation des anthocyanes à
différentes activités d’eau pendant le traitement thermique
(25140 ºC).
Un modèle en 3D d’un réacteur a été développé, par combinaison de transfert
d’énergie et réaction chimique, pour identifier les paramètres cinétiques dans des
conditions non-isothermes pour des aliments d’humidité intermédiaire. En particulier, le
modèle a été utilisé pour comprendre l’impact des traitements thermique à haute
température (100–140 ºC) dans la dégradation des anthocyanes du jus de mûre. Un
système de sable de Fontainebleau a été utilisé à 25 ºC, avec trois différentes activités
d’eau (aw = 0,34, 0,76 et 0,95). La résistance du transfert de chaleur et les paramètres
cinétiques ont été identifiés avec une méthode de régression non linéaire. Les
estimations des paramètres cinétiques ont montré que la constante de réaction de
dégradation des anthocyanes (k120 ºC) a augmenté de 0,9 à 4,1×10⁻³
s–1
avec une
diminution de l’activité de l’eau, avec une vitesse maximale à aw = 0.76. Des
différences non significatives (p < 0.05) entre les énergies d’activation correspondantes
ont été trouvées (Ea = 94 ± 7 kJ mol–1
). Une activité de l’eau réduite affecte donc
négativement la stabilité aux hautes températures des anthocyanes.
Chapitre III: Résultats – Publication #3
85
3D modeling of a reactor to estimate degradation kinetic
parameters for anthocyanins at different water activities
during heat treatment (25–140 ºC)
Nadiarid Jiméneza, Philippe Bohuon
b, *, Manuel Dornier
b and Fabrice Vaillant
c
a Escuela de Tecnología de Alimentos, Universidad de Costa Rica (UCR), Apartado Postal
11501–2060, San José, Costa Rica. Email: [email protected]
b Montpellier SupAgro, UMR QualiSud, 1101 avenue Agropolis, CS 24501, 34093 Montpellier
Cedex 5, France. Email: [email protected]; [email protected]
c Centre de coopération international en recherche agronomique pour le développement
(CIRAD), UMR QualiSud, TA B-95/15, 73 rue Jean François Breton, 34398 Montpellier
Cedex 5, France. . Email:[email protected]
*Corresponding author.
Montpellier SupAgro, UMR QualiSud, 1101 avenue Agropolis, CS 24501, 34093 Montpellier
Cedex 5, France
Tel.: +33 467615726; fax: +33 467615728; e-mail: [email protected].
Chapitre III: Résultats – Publication #3
86
Abstract
A 3D model of a reactor was developed, combining heat transfer and chemical reaction,
to identify kinetic parameters under non-isothermal conditions for intermediate-
moisture foodstuffs. In particular, the model was used to assess the impact of high-
temperature heat treatments (100–140 ºC) on anthocyanin degradation in blackberry
juice. A quartz-sand system was used at 25 ºC, with three different water activities
(aw = 0.34, 0.76 and 0.95). Heat transfer resistance and kinetic parameters were
identified, using a nonlinear regression method. Estimates of kinetic parameters showed
that the constant for the anthocyanin-degradation reaction rate (k120 ºC) increased from
0.9 to 4.1×10⁻³
s–1
with decreasing water activity, with a maximum rate at aw = 0.76. No
significant difference (p < 0.05) was found between the corresponding activation
energies (Ea = 94 ± 7 kJ mol–1
). Reduced water activity therefore negatively affects
anthocyanin stability at high temperatures.
Keywords: Heat transfer; Porous material; Kinetic modeling; Blackberry juice;
Anthocyanins; Water activity

Chapitre III: Résultats – Publication #3
87
8.1 Introduction
Reaction rates vary with temperature, heating rate, moisture, pH, pressure,
presence and amount of reactants or other ingredients, and many other experimental
conditions (Dolan, 2003). Estimating kinetic parameters for compounds in low- to
intermediate-moisture food processed at high temperatures (T > 100 ºC) is challenging,
because two aspects must be considered. The first is a non-isothermal condition (time-
dependent), where heating and cooling times play a role in the reaction, and the
concentration of the compound of interest is a function of the varying temperature,
which, in its turn, is a function of time (van Boekel, 2009a). The second is an unsteady-
state conduction-heat condition (space-dependent), where the temperature distribution
within the product involves a heterogeneous reaction.
As yet, little work has been published on identifying kinetic parameters with
respect to a space- and time-dependent reaction occurring in a foodstuff. Studies using
this approach include those of Banga et al. (1993), Nasri et al. (1993), Welt et al.
(1997), Rodrigo et al. (1998), Martens et al. (2001), Garrote et al. (2001), Mishra et al.
(2008), and Lai et al. (2009).
Anthocyanins constitute a major flavonoid group, which is responsible for colors,
ranging from pink through red and violet to dark blue, in plant tissues. In the last two
decades, interest in anthocyanins has increased, mainly because of their use as natural
food colorants and their potential health-promoting properties (Andersen, 2009).
Some high-temperature processes exist for anthocyanin-rich low- to intermediate-
moisture foods, for example, vacuum-frying of blue potatoes (Da Silva et Moreira,
2008), sterilizing of grape pomace (Mishra et al., 2008), extruding of maize meal with
blueberry and grape anthocyanins for breakfast cereals (Camire et al., 2002), and spray-
drying of açai pulp (Tonon et al., 2008).
Most processes at temperatures of more than 100 ºC are inevitably coupled with
mass transfer phenomena such as water present in food evaporating during heat
treatment. Such water loss consequently leads to changes in the product’s water content
and aw.
Jimenez et al. (2011) evaluated the effect of water activity variation on
anthocyanin degradation at high temperatures (100–140 ºC). They used a hermetically
sealed reactor and assumed a homogeneous distribution of temperature inside the
reactor to estimate the kinetic parameters under non-isothermal conditions. Results

Chapitre III: Résultats – Publication #3
88
indicated that reduced water activity negatively affects anthocyanins stability at high
temperatures.
This observation was apparently inconsistent with some studies conducted at
temperatures of less than 100 ºC, where anthocyanins degraded more rapidly with
increasing water activity (Bronum-Hansen et Flink, 1985; Erlandson et Wrolstad, 1972;
Garzón et Wrolstad, 2001; Gradinaru et al., 2003; Lai et al., 2009; Thakur et Arya,
1989).
In high-temperature heat treatments, the modeling of heat transfer allows a more
reliable assessment of temperature distribution in the product during treatment. Limiting
phenomena can therefore be identified, such as heterogeneity of temperature within the
product and coupling phenomena between heat transfers (convection, conduction) and
degradation kinetics.
This study therefore aims to elucidate the effect of heterogeneous temperature
distribution inside the reactor on kinetic parameters for anthocyanin degradation at high
temperatures. First, we experimentally quantified the total monomeric anthocyanin
content (A(t)
) in a blackberry juice–quartz sand system at 25 ºC, with three different
water activities (aw = 0.34, 0.76 and 0.95) during heat treatments. Second, we developed
a 3D model of heat transfer, coupling it to a kinetic model. Thus, we could estimate heat
and kinetic parameters under non-isothermal conditions, using nonlinear regression.
8.2 Materials and methods
8.2.1 Materials
8.2.1.1 Blackberry juice
Fully ripe, tropical, highland blackberries (Rubus adenotrichus) were harvested
in the Cartago region of Costa Rica (1500 m above sea level). They were frozen at
20 ºC and later thawed at 5 ºC over 24 h. Juice was obtained by pressing the fruit with
a discontinuous hydraulic press (OTC 25-ton H-frame Hydraulic Shop Press, Series
Y125, Owatonna, MN, USA). The juice was then freeze-dried and vacuum-packed in
laminated metallic bags, and kept frozen at 18 ºC until analysis.
8.2.1.2 Preparing the blackberry juice–quartz sand sample
Freeze-dried blackberry juice was reconstituted by dilution at 10 g 100 ml–1
with

Chapitre III: Résultats – Publication #3
89
distilled water and mixed at 1800 rpm for 30 min in a vibrating shaker (Heidolph®
MULTI REAX, Schwabach, Germany). To simulate the texture of porous foods, the
reconstituted blackberry juice and previously dried Fontainebleau sand (99.8 % SiO2,
VWR International S.A.S., Fontenay-sous-Bois, France), were mixed together at a ratio
of 1:9 (w/w), dry weight basis, and then freeze-dried, using a CRYO lyophilizer
(CRYONEXT, Saint Gely du Fesc, France). The resulting powder was homogenized in
a ball mill (Dangoumill 300, Prolabo, Paris, France) with liquid nitrogen to prevent
further degradation. The freeze-dried powder was stored in vacuum desiccators to
prevent water adsorption.
8.2.1.3 Preparing samples at different water activities
Samples with three different water activities (aw = 0.34, 0.76 and 0.95) were
prepared by adding appropriate amounts of distilled water to blackberry juice-sand
samples, and left overnight to reach equilibrium. The samples thus epresented almost
the same concentrations of reactant solutes (51 ± 4 mg cyanidin 3-glucoside
equivalents (CGE)/100 g–1
wb). Water activity of samples was determined in triplicate,
using a water activity meter (AquaLab model CX-2, Decagon Devices, Inc., Pullman,
WA, USA) at 25 ºC.
8.2.2 Heating device and conditions
Blackberry juice–quartz sand samples kept at room temperature (T0 = 21 ± 2 ºC)
were heated in a hermetically sealed reactor (Figure III.3.1) that was custom-designed
in stainless steel (Jimenez et al., 2010). Samples were compacted into the cell to
minimize their porosity. Sample temperatures within the closed reactor were recorded
every second, using a 1.5 mm thick, Type J thermocouple with a stainless steel sheath
(model 405-163, TC Direct, Dardilly, France). It was placed at the geometrical center of
one compartment and connected to a data logger (ALMEMO® 2290-8 V5, Ahlborn,
Holzkirchen, Germany), using AMR Data-Control V5.13 Software (Ahlborn,
Holzkirchen, Germany). A Viton
O-ring (Ø = 56.82 mm 2.62 mm) ensured the test
cell’s hermetic sealing, preventing any water or oil transfer, which would interfere with
component degradation.
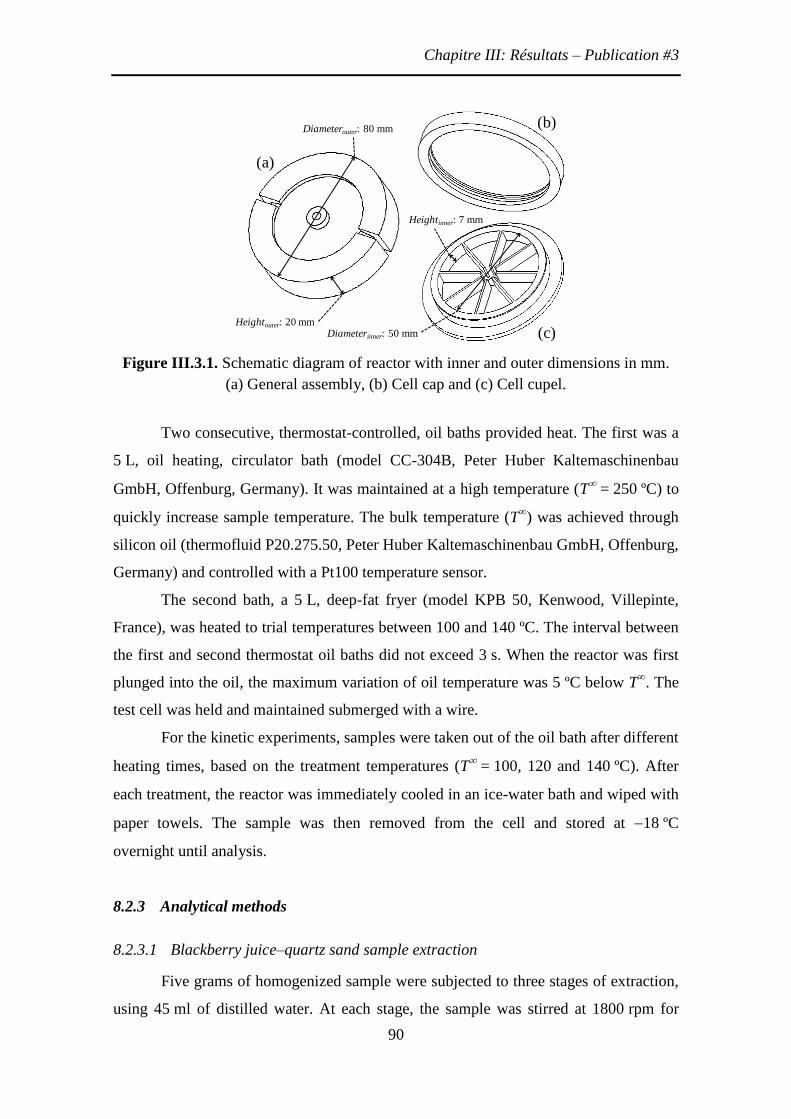
Chapitre III: Résultats – Publication #3
90
Figure III.3.1. Schematic diagram of reactor with inner and outer dimensions in mm.
(a) General assembly, (b) Cell cap and (c) Cell cupel.
Two consecutive, thermostat-controlled, oil baths provided heat. The first was a
5 L, oil heating, circulator bath (model CC-304B, Peter Huber Kaltemaschinenbau
GmbH, Offenburg, Germany). It was maintained at a high temperature (T = 250 ºC) to
quickly increase sample temperature. The bulk temperature (T∞) was achieved through
silicon oil (thermofluid P20.275.50, Peter Huber Kaltemaschinenbau GmbH, Offenburg,
Germany) and controlled with a Pt100 temperature sensor.
The second bath, a 5 L, deep-fat fryer (model KPB 50, Kenwood, Villepinte,
France), was heated to trial temperatures between 100 and 140 ºC. The interval between
the first and second thermostat oil baths did not exceed 3 s. When the reactor was first
plunged into the oil, the maximum variation of oil temperature was 5 ºC below T∞. The
test cell was held and maintained submerged with a wire.
For the kinetic experiments, samples were taken out of the oil bath after different
heating times, based on the treatment temperatures (T = 100, 120 and 140 ºC). After
each treatment, the reactor was immediately cooled in an ice-water bath and wiped with
paper towels. The sample was then removed from the cell and stored at 18 ºC
overnight until analysis.
8.2.3 Analytical methods
8.2.3.1 Blackberry juice–quartz sand sample extraction
Five grams of homogenized sample were subjected to three stages of extraction,
using 45 ml of distilled water. At each stage, the sample was stirred at 1800 rpm for
Diameterinner: 50 mm
Heightinner: 7 mm
Heightouter: 20 mm
Diameterouter: 80 mm
(a)
(b)
(c)

Chapitre III: Résultats – Publication #3
91
5 min in a vibrating shaker (Heidolph® MULTI REAX, Schwabach, Germany), then
centrifuged at 8200 g for 10 min at 10 ºC (Allegra 21 Centrifuge, Beckman Coulter,
Brea, CA, USA). The supernatant was separated until a colorless sand residue was left.
The extract was then filtered, using a Minisart® SRP 25 filter (0.45 μm pore size;
Sartorius AG, Göttingen, Germany) to separate any suspended solids formed during
heating and cooling.
8.2.3.2 Total monomeric anthocyanin content
Total monomeric anthocyanin content (A(t)
) was determined by the pH
differential method (Lee et al., 2005), which had been previously validated by
comparing selected results with the HPLC method (Jimenez et al., 2010). Sample
absorbance was measured at pH 1.0 and 4.5 at wavelengths of maximum absorbance
(510 nm) and at 700 nm to correct for haze. Measurements were performed with a
microplate spectrofluorimeter (Infinite® 200, Tecan France S.A.S., Lyon, France), using
96-well polypropylene plates. Total monomeric anthocyanins were expressed as
cyanidin 3-glucoside equivalents (CGE), the most prevalent anthocyanins in
R. adenotrichus, at 95 % (w/w) (Mertz et al., 2007):
( ) 1 3( ) 10t A MW DF
A mg Ll
(48)
where,
A or sample absorbance = (A510nmA700nm)pH1.0(A510nmA700nm)pH4.5
MW or molecular weight = 449.2 g mol–1
for cyanidin 3-glucoside
DF or dilution factor = 10 to 50
or molar extinction coefficient = 26,900 L mol–1
cm–1
l or path length = 0.52 cm (calculated for specific well geometry with 200 μL of
solution)
103 = conversion factor from g to mg
8.2.4 Reactor model
8.2.4.1 Assumptions
A model combining heat transfers and chemical reaction was developed to
identify kinetic parameters under non-isothermal conditions. Heat conduction (without
phase change) was assumed to take place inside the stainless steel reactor and foodstuff

Chapitre III: Résultats – Publication #3
92
sample, while the Neumann boundary condition applied to the stainless steel reactor’s
outer surface in contact with hot oil (convective heat flux), and its inner surface in
contact with the foodstuff sample (thermal resistance).
The reactor’s real dimensions (Figure III.3.1) were used to create the virtual
reactor in CAD (Figure III.3.2), provided by COMSOL MultiphysicsTM
(COMSOL
Inc., Stockholm, Sweden). In the 3D representation, the computational domain is
divided into two subdomains: the foodstuff sample referred to as Ω1 and the stainless
steel reactor (Ω2). Each subdomain Ωi was assumed to be homogeneous, isotropic,
shaped as shown in Figure III.3.2, and revolving on a z axis and with a symmetry plane
parallel to the x-y plane.
Figure III.3.2. Schematic view (not to scale) of the computational domain 3D; Ω1:
blackberry juice – quartz sand sample; Ω2: stainless steel reactor; Γout: boundary
between Ω2 and hot oil (convective heat flux); Γin: boundary between Ω1 and Ω2
(thermal resistance) and Γsym symmetry surface (no flux).
8.2.4.2 Unsteady heat model for the reactor’s interior
The thermal problem (Figure III.3.2) can be described by the following heat
diffusion equation:
0ii i i i
Tc k T
t
in (0, )i t with 1 to 2i (49)
where, Ti (x, y, z, t) is the temperature, i is the density (kg m–3
), ci is the specific heat
(J kg –1
K–1
), ki is the thermal conductivity (W m–1
K–1
),
The three boundary conditions described in section 8.2.4.1 are:
y
z
x
in
insym
in
0.03
0.02
0.01
x10-3
0.01
0
2
4
sym
1
sym
3.5
0.025 0.03
0.02
0.01
x10-3
0.01
0
2
4
y
z
x
out
out
in sym
sym
sym
2
sym
22.5°
6.5
0.0345
Chapitre III: Résultats – Publication #3
93
2 2 oil 2( ) 0k T n h T T outer surface (0, )cout t (50)
( )0
i j
i i
t
T Tk T n
R
inner surface (0, )cin t with ( ) 1 to 2i j (51)
0iT n symmetric surface (0, )csym t with i 1 and 2 (52)
The initial condition is a uniform temperature at the beginning of the experiment
(T0 = 21 ºC):
0iT T in 0i with 1 to 2i (53)
where, hoil (W m–2
K–1
) is the heat transfer coefficient between the stainless steel
reactor’s outer surface and the hot oil, T∞ is the hot oil temperature, RT (m
2 K W
–1) is
the thermal resistance between reactor’s inner surface and foodstuff sample, tc is the
total computation time (s), n is the unit outward normal vector (m)
8.2.4.3 Kinetic model for the reactor
Anthocyanin content (A(t)
) decreased during heat treatment and was described in
terms of irreversible first-order kinetics:
( , , , )x y z t
A
Ak A
t
(54)
The rate constant kA (s–1) was assumed to vary with the system’s absolute
temperature T (K), according to the Arrhenius equation, as follows:
( , , , )
1 1aref x y z t
ef
A
r
Ek k exp
R T T
(55)
where, kref is the reaction rate constant at the reference temperature (s–1
), Ea is the
apparent activation energy (J mol–1
) for the rate constant, R is the gas constant
(8.314 J mol–1
K–1
). The reference temperature was chosen from the middle of the
temperature range studied (Tref = 120 °C).
8.2.4.4 Input parameters and characteristics of materials
Table III.3.1 shows the input parameters used in the computer simulation for the
blackberry juice–quartz sand samples at three different water activities. Thermophysical
properties of samples were determined experimentally because of the large uncertainty
introduced by porosity into calculations for thermophysical properties of the mixture
distribution. Porosity, or volume fraction of air in the blackberry juice–quartz sand
system, was calculated as the difference between the measured bulk or apparent volume

Chapitre III: Résultats – Publication #3
94
and each sample’s “true” volume (Webb, 2001). The “true” volume was measured with
a helium pycnometer (MultiVolume Pycnometer 1305, Micromeritics Instrument Corp.,
Norcross, GA, USA).
Table III.3.1. Main characteristics and input parameters used in computer simulation
for blackberry juice – quartz sand sample at three different water activities (aw 0.34,
0.76 and 0.95) at 25 ºC (mean values ± 95 % confidence interval).
Parameter Water activity (aw) at 25 ºC
0.34 ± 0.06 0.76 ± 0.01 0.95 ± 0.01
Sample formulation (in mass fraction)
Freeze-dried juice 0.099 0.097 0.097
Water 0.010 0.032 0.133
Quartz sand 0.891 0.871 0.770
Sample composition (in dry basis)
Water content W0 (g 100g
–1 DB) 1.1 ± 0.5 3.3 ± 0.2 15 ± 3
Anthocyanins A0 (mg CGE 100g
–1 DB) 52 ± 6 50 ± 3 52 ± 4
Thermal properties of sample
Porosity ε (m3 m
–3) at 20 ºC 0.517 ± 0.005 0.27 ± 0.01 0.00
Density (kg m–3
) at 20 ºC 2554 ± 29 2565 ± 63 2010
Specific heat cp (J kg–1
K–1
) as function of T (ºC)
ci = mc T + bc
for T: 25–140
mc 1.475 2.058 1.805
bc 826 821 1202
Thermal conductivity k (W m–1
K–1
) as function of T (ºC)
ki = mk T + bk
for T: 20–80
mk 0.001 0.001 0.001
bk 0.777 1.998 1.988
Boundary condition
Thermal resistance (Rt, ×10–3
m2 K W
–1) 0.4±0.1 2.4±0.6 1.7±0.3
Density
“True” density of compacted samples (i, kg m–3
) at 21 ºC was calculated from the
mass of the material (±0.0001 g) and its “true” volume measured with a helium
pycnometer (MultiVolume Pycnometer 1305, Micromeritics Instrument Corp.,
Norcross, GA, USA). The maximum standard error was found to be 2.4 %.
Specific heat capacity
The specific heat (ci, J kg–1
K–1
) of each material was determined by means of
differential scanning calorimetry (Perkin Elmer DSC7, Norwalk, CT, USA), following
Chapitre III: Résultats – Publication #3
95
the procedure recommended by the supplier (Hanitzsch, 1991). Each sample was placed
in a hermetically sealed aluminum sample pan, previously weighed. The sample
temperature was increased from 25 to 140 ºC, using an “isothermal-scan-isothermal”
method with a heating rate (noted as β) of 1/6 K s–1
and three heating scans: 25–65 ºC,
65–105 ºC, and 105–145 ºC. Experiments were carried out twice. An empty pan was
used as a reference. The baseline was obtained from a scan performed with two empty
pans. Displacement of the thermograph from the baseline gives a differential heat flow
rate (q), from which the apparent specific heat (ci) can be calculated at each
temperature.
/ic q M (56)
where, ci is the specific heat in J kg–1
K–1
, q is the heat flow in W, β is the heating rate
in K s–1
, M is the sample mass in kg (Hamdami et al., 2004)
The maximum standard error was 3.1 %. The specific heat was expressed as a
function of temperature by linear regression from the experimental data, as the
parameter was determined from 25 to 140 ºC.
i c cc m T b (57)
Thermal conductivity
The thermal conductivity (ki, W m–1
K–1
) was determined at two temperatures (21
and 80 ºC), using a hot disk thermal constants analyzer (HotDisk TPS 2500 S,
ThermTest, Inc., Gothenburg, Sweden). Samples were placed into cylindrical containers
(35 mm diameter; 10 mm height) and compacted to minimize the system’s porosity. For
measurements, the hot disk sensor was placed between two sample cylinders. The
applied output power to the hot disk sensor varied from 0.2 to 0.6 W and measurement
times from 5 to 40 s. The diameter of the hot disk sensor was 3.2 mm. The maximum
standard error was found to be 0.6 %. Thermal conductivity of samples at three different
water activities was expressed as a function of temperature by linear regression from the
experimental data.
i k kk m T b (58)
8.2.4.5 Numerical solution
The reactor’s thermal system consisted of three variables: two temperatures Ti
(stainless steel reactor and foodstuff sample, and depending on equation (49)), and A(t)
(Equation (54)). The system was solved, using the FEM-based commercial code of
Chapitre III: Résultats – Publication #3
96
COMSOL MultiphysicsTM
(COMSOL Inc., Stockholm, Sweden); the boundary
conditions given by equations (50), (51), and (52); and the initial condition given by
equation (53). The geometry (Figure III.3.2) and mesh were created with COMSOL.
The finite element mesh consisted of triangles with three nodes per element. Mesh
parameters determine the accuracy of results and computation time. A mesh
convergence study was therefore performed to determine the mesh parameters that gave
the minimum elements without altering results.
About 3000 elements were used from the following mesh parameters: maximum
element size scaling factor (1), element growth rate (1.5), mesh curvature factor (1),
mesh curvature cutoff (0.05), resolution of narrow regions (0.1), resolution of geometry
(10), and scale geometry before meshing (x-direction = 1, y-direction = 1, and
z-direction = 2). The parameters were modified to avoid mesh problems resulting from
the large geometric scale variation, particularly in the thin layers. Lagrange polynomials
(second-order function) provided the interpolation function. The linearized problem was
solved at each time step by the UMFPACK method (unsymmetric multifrontal method
and direct sparse LU factorization).
8.2.4.6 Parameter identification (hoil and RT) for heat model
To estimate hoil (i.e., the convective heat transfer coefficient), water was heated
in the hermetically sealed reactor at T∞
= 100, 120 and 140 ºC, under the conditions
described in section 8.2.2, where bulk water temperature (T(t)
) within the closed reactor
was recorded every second. Water was chosen as a test fluid for its well-known thermal
parameters as a saturated liquid at high temperatures (Wagner et Pruss, 2002); and to
guarantee a uniform temperature field, considering the thermal resistance between water
and the reactor’s inner surface as non-limitant (RT= 1 × 10⁵
m2 K W
–1). Because heat
treatments were conducted in two oil baths, a heat transfer coefficient was identified for
each system; hoil (high) for the bath at 250 ºC; and hoil (low) for the bath at the selected
temperature (T∞ = 100–140 ºC). Thus, hoil is assumed to follow a discontinuous
relationship with time:
( )
( )
oil oil high
oil oil low
h h
h h
when
transition
transition
t t
t t
(59)
where, ttransition is the period in the first bath at 250 ºC.
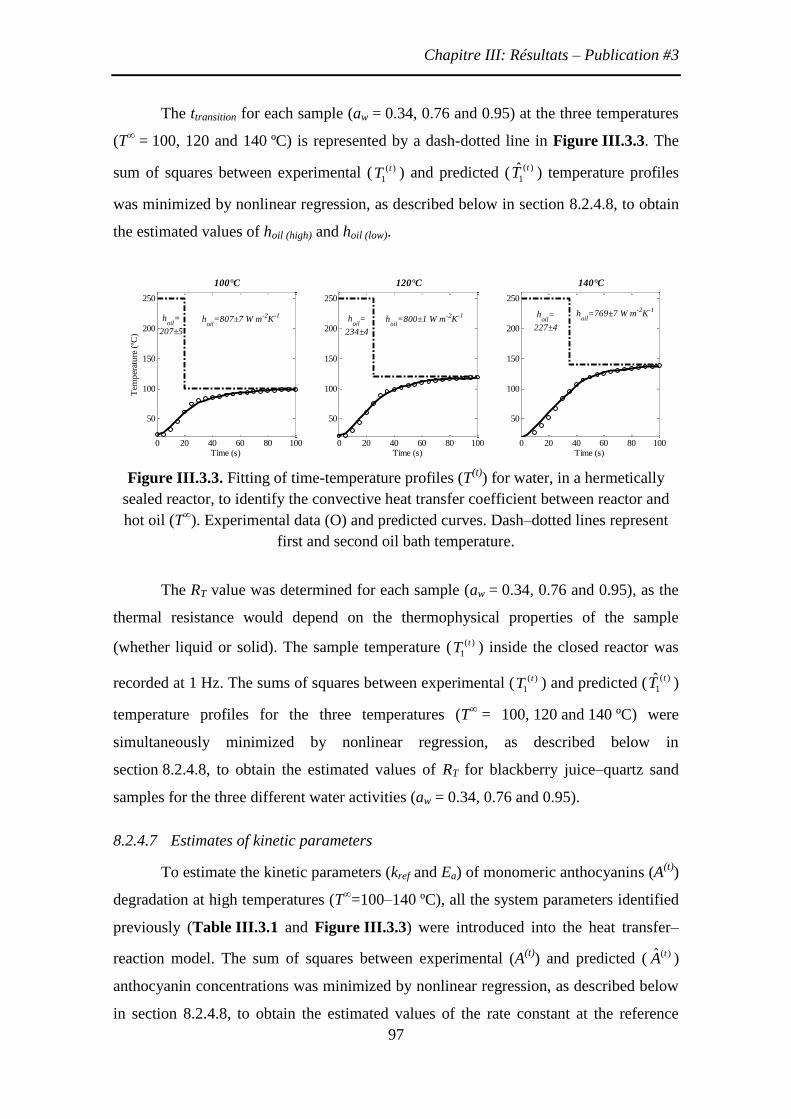
Chapitre III: Résultats – Publication #3
97
The ttransition for each sample (aw = 0.34, 0.76 and 0.95) at the three temperatures
(T∞ = 100, 120 and 140 ºC) is represented by a dash-dotted line in Figure III.3.3. The
sum of squares between experimental ( ( )
1
tT ) and predicted ( ( )
1ˆ tT ) temperature profiles
was minimized by nonlinear regression, as described below in section 8.2.4.8, to obtain
the estimated values of hoil (high) and hoil (low).
Figure III.3.3. Fitting of time-temperature profiles (T(t)
) for water, in a hermetically
sealed reactor, to identify the convective heat transfer coefficient between reactor and
hot oil (T∞). Experimental data (O) and predicted curves. Dash–dotted lines represent
first and second oil bath temperature.
The RT value was determined for each sample (aw = 0.34, 0.76 and 0.95), as the
thermal resistance would depend on the thermophysical properties of the sample
(whether liquid or solid). The sample temperature ( ( )
1
tT ) inside the closed reactor was
recorded at 1 Hz. The sums of squares between experimental ( ( )
1
tT ) and predicted ( ( )
1ˆ tT )
temperature profiles for the three temperatures (T∞ = 100, 120 and 140 ºC) were
simultaneously minimized by nonlinear regression, as described below in
section 8.2.4.8, to obtain the estimated values of RT for blackberry juice–quartz sand
samples for the three different water activities (aw = 0.34, 0.76 and 0.95).
8.2.4.7 Estimates of kinetic parameters
To estimate the kinetic parameters (kref and Ea) of monomeric anthocyanins (A(t)
)
degradation at high temperatures (T∞=100–140 ºC), all the system parameters identified
previously (Table III.3.1 and Figure III.3.3) were introduced into the heat transfer–
reaction model. The sum of squares between experimental (A(t)
) and predicted ( ( )ˆ tA )
anthocyanin concentrations was minimized by nonlinear regression, as described below
in section 8.2.4.8, to obtain the estimated values of the rate constant at the reference
0 20 40 60 80 100
50
100
150
200
250
100°C
Time (s)
Tem
per
atu
re (
ºC)
0 20 40 60 80 100
50
100
150
200
250
120°C
Time (s)0 20 40 60 80 100
50
100
150
200
250
140°C
Time (s)
hoil
=
227±4h
oil=800±1 W m
-2K
-1 hoil
=769±7 W m-2
K-1
hoil
=
207±5
hoil
=807±7 W m-2
K-1 h
oil=
234±4
Chapitre III: Résultats – Publication #3
98
temperature (kref, s–1
) and the apparent activation energy (Ea, J mol–1
). The kinetic
parameters were determined for each specific aw product for the three heat treatment
temperatures (T∞ = 100, 120 and 140 ºC) simultaneously.
8.2.4.8 Statistical methods
The identification of the heat transfer coefficients (hoil (high) and hoil (low)), heat
resistance (RT), and the kinetic parameters (kref and Ea) were computed with a nonlinear
least squares method. The Levenberg–Marquardt algorithm (Seber et Wild, 2003) was
used by the “lsqcurvefit” function (MATLAB®, The MathWorks Inc., Natick, MA,
USA). The “lsqcurvefit” function returns the fitted parameters (beta), the residuals
matrix (residual) and the Jacobian matrix of the function (jacobian). The minimum of
the sum of squares function was assessed with different initial values for the parameters
(beta0) to avoid obtaining a local minimum (van Boekel, 1996). To compute the 95 %
asymptotic confidence intervals of each parameter, the “nlparci” function was used as
recommended by Dolan et al. (2007). The inputs of the “nlparci” function were the
outputs of the “lsqcurvefit” function (i.e., beta, residual and jacobian) (Matlab®, The
MathWorks Inc., Natick, MA, USA).
8.3 Results and discussion
8.3.1 Characteristics of the blackberry juice–quartz sand system
Table III.3.1 presents the composition of the samples prepared from freeze-
dried blackberry juice and quartz sand at 25 ºC at three levels of water activity measured
before heat treatment, and the thermal properties of samples used in kinetic
experiments. Results show that the samples presented an equivalent initial concentration
of reactant solutes (A0
= 51 ± 4 mg CGE 100 g–1
wb). Porosity also varied significantly
between samples, with a maximum of 52 % for the lowest water activity (aw = 0.34).
For granular-type porous foods, the models could not accurately estimate the
levels of effective thermal conductivity that are functions only of the components’
properties and volume fractions (Carson et al., 2006). An experimental determination of
the thermophysical properties is therefore recommended. Both specific heat and thermal
conductivity were determined experimentally and expressed as functions of the
sample’s temperature (T(t)
). The resulting equations for ci (Equation (57)) and ki
(Equation (58)) were used in the unsteady heat model described in section 8.2.4.2. The
Chapitre III: Résultats – Publication #3
99
accurate identification of the thermophysical properties was essential for developing the
heat model (Equation (49)), as these properties determine the way heat is distributed
inside the reactor.
8.3.2 Heat transfer phenomena inside the reactor
8.3.2.1 Convective heat transfer coefficient (hoil)
Figure III.3.3 shows the identified values of the convective heat transfer
coefficient (hoil) for the silicon oil bath at T∞
= 250 ºC (hoil (high)) and for the palm olein
bath at T∞= 100, 120 and 140 ºC (hoil (low)), according to the method described in
section 8.2.4.6. The root mean square error (RMSE) between the experimental and
simulated temperatures was 2 ºC. The values were within the range of heat transfer
coefficients, as determined by different methods. Various geometries were used for
heating by soaking in oil baths at high temperatures for natural convection or in absence
of bubbling (h = 250300 W m–2
K–1
), and in forced convection or with bubbling (h =
8001000 W m–2
K–1
) (Costa et al., 1999).
However, the identified parameters showed an unusual pattern as the heat
transfer coefficient for the silicon oil bath at the higher temperature (T∞
= 250 ºC) with
agitation (hoil (high) ~ 200 W m–2
K–1
) was lower than the parameter for the second bath at
lower temperatures (T∞
= 100–140 ºC) and without agitation (hoil (low) ~ 800 W m2
K–1
).
The differences between the parameters may have been due to factors such as oil type,
oil temperature and viscosity. Another factor is the difference among the thermal
boundary layer thicknesses (δT) of both systems.
oil oil th k (60)
The temperature gradient between the reactor’s outer surface (T0
= 20 ºC) and
the hot silicon oil (T∞
= 250 °C) in the first bath (T = 230 ºC, δT >> 0) is significantly
higher than the T in the second bath. The temperature gradient between the reactor’s
heated outer surface at ttransition and the hot palm oil (T∞ = 100–140 ºC) tended to zero
(T → 0, δT → 0). Hence, reducing the thermal boundary layer thickness (δT) increased
the convective heat transfer coefficient (hoil), as shown in equation (60).
8.3.2.2 Thermal resistance (RT)
Thermal resistance (RT) between the sample and the reactor’s inner surface for
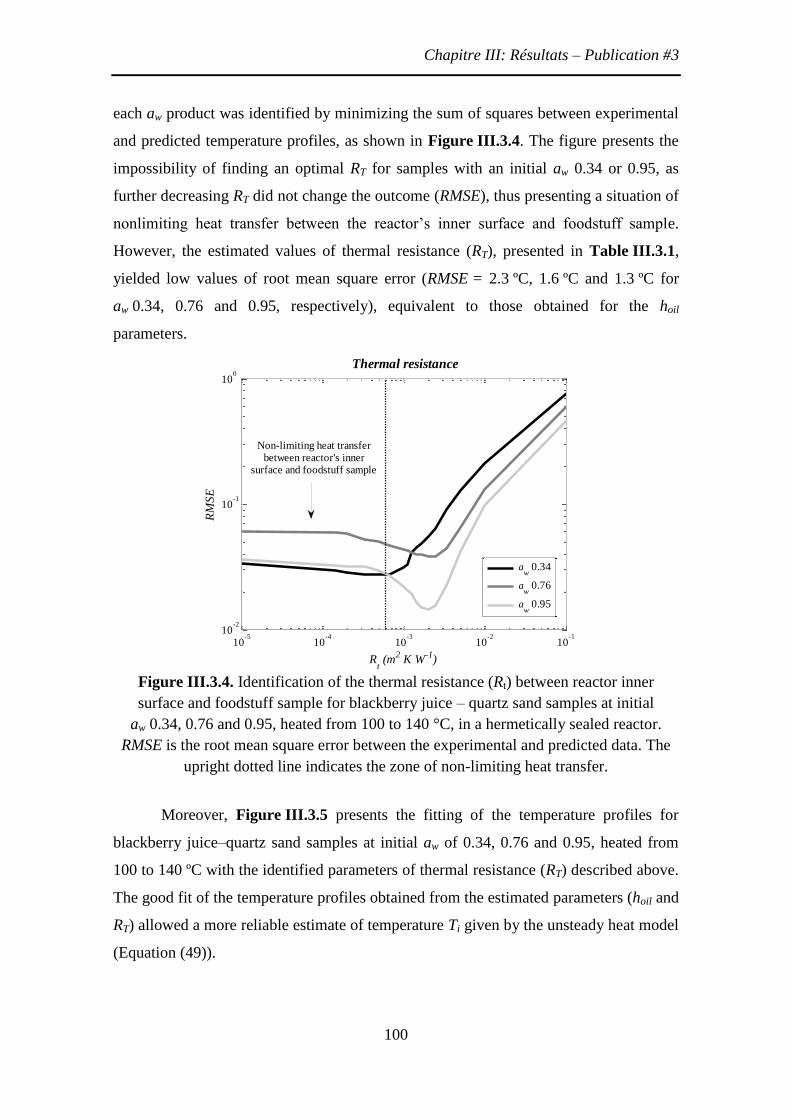
Chapitre III: Résultats – Publication #3
100
each aw product was identified by minimizing the sum of squares between experimental
and predicted temperature profiles, as shown in Figure III.3.4. The figure presents the
impossibility of finding an optimal RT for samples with an initial aw 0.34 or 0.95, as
further decreasing RT did not change the outcome (RMSE), thus presenting a situation of
nonlimiting heat transfer between the reactor’s inner surface and foodstuff sample.
However, the estimated values of thermal resistance (RT), presented in Table III.3.1,
yielded low values of root mean square error (RMSE = 2.3 ºC, 1.6 ºC and 1.3 ºC for
aw 0.34, 0.76 and 0.95, respectively), equivalent to those obtained for the hoil
parameters.
Figure III.3.4. Identification of the thermal resistance (Rt) between reactor inner
surface and foodstuff sample for blackberry juice – quartz sand samples at initial
aw 0.34, 0.76 and 0.95, heated from 100 to 140 °C, in a hermetically sealed reactor.
RMSE is the root mean square error between the experimental and predicted data. The
upright dotted line indicates the zone of non-limiting heat transfer.
Moreover, Figure III.3.5 presents the fitting of the temperature profiles for
blackberry juice–quartz sand samples at initial aw of 0.34, 0.76 and 0.95, heated from
100 to 140 ºC with the identified parameters of thermal resistance (RT) described above.
The good fit of the temperature profiles obtained from the estimated parameters (hoil and
RT) allowed a more reliable estimate of temperature Ti given by the unsteady heat model
(Equation (49)).
10-5
10-4
10-3
10-2
10-1
10-2
10-1
100
Rt (m
2 K W
-1)
RM
SE
aw 0.34
aw 0.76
aw 0.95
Thermal resistance
Non-limiting heat transferbetween reactor's inner
surface and foodstuff sample

Chapitre III: Résultats – Publication #3
101
Figure III.3.5. Fitting of time-temperature profiles (T
(t)) for blackberry juice – quartz
sand samples at initial aw 0.34, 0.76 and 0.95, heated from 100 to 140 ºC, in a
hermetically sealed reactor, to identify the thermal resistance (Rt) between reactor inner
surface and foodstuff sample. Experimental data (O) and predicted curves for each trial.
The upright dash–dotted lines depict the value of transition time between baths (first
bath at 250 ºC).
8.3.3 Estimates of kinetic parameters
A first-order kinetic model for anthocyanin degradation was coupled to the
predictive heat transfer model developed in the previous section. This anthocyanin
degradation model implied a numerical integration of equation (54), using equation (55)
to consider the temperature dependency of the reaction rate constant (kA).
8.3.3.1 Activation energy (Ea) and rate constant (kref)
Table III.3.2 shows the estimated kinetic parameters of anthocyanin
degradation from 100 to 140 ºC for the three water activities (aw = 0.34, 0.76 and 0.95)
at 25 ºC, taking into account the heterogeneous temperature distribution inside the
reactor and the parameters previously reported for the reconstituted blackberry juice
with an aw of 0.99 (Jimenez et al., 2010). Table III.3.2 also includes the kinetic
parameters identified by considering a homogeneous temperature inside the reactor
(Jimenez et al., 2011). The reaction kinetics during 100–140 ºC heat treatments were
0 50 100
50
100
150
aw
0 .34, 100°C
0 50 100
50
100
150
aw
0 .34, 120°C
Tem
pera
ture
(ºC
)
0 50 100
50
100
150
aw
0 .34, 140°C
Time (s)
0 50 100
50
100
150
aw
0 .76, 100°C
0 50 100
50
100
150
aw
0 .76, 120°C
0 50 100
50
100
150
aw
0 .76, 140°C
Time (s)
2nd
bath1st
bath
Tpredicted
Tobserved
0 50 100
50
100
150
aw
0 .95, 100°C
0 50 100
50
100
150
aw
0 .95, 120°C
0 50 100
50
100
150
aw
0 .95, 140°C
Time (s)
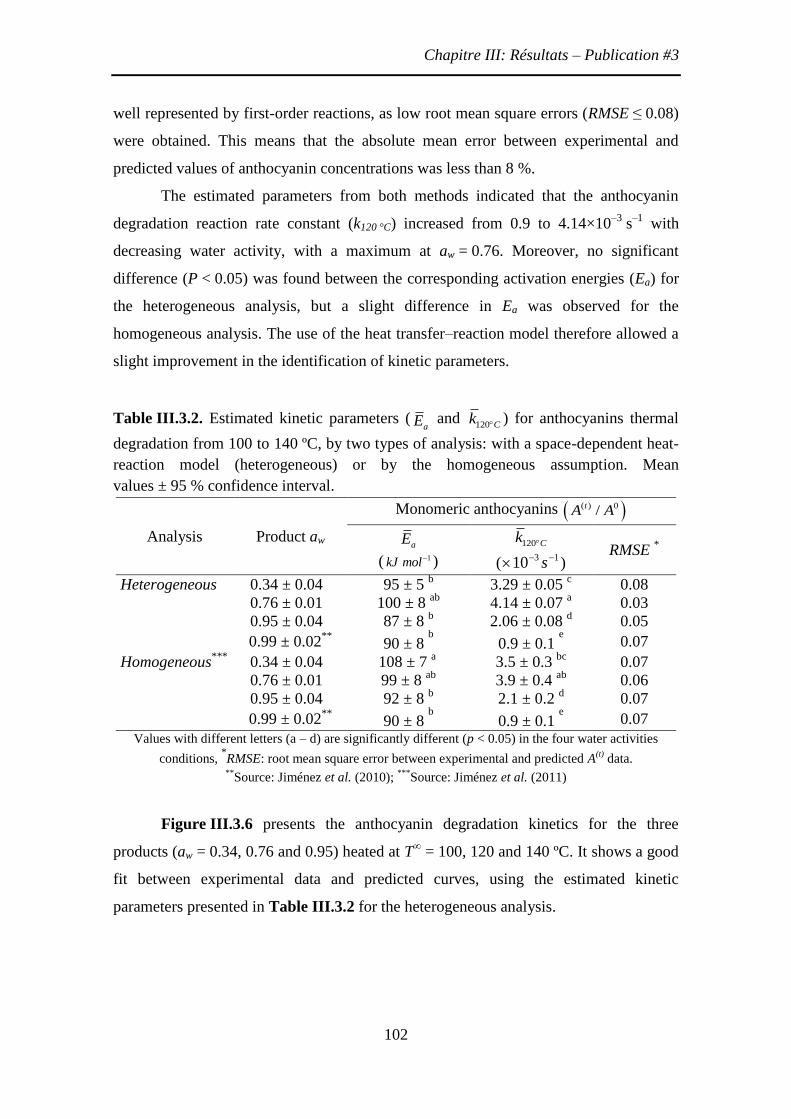
Chapitre III: Résultats – Publication #3
102
well represented by first-order reactions, as low root mean square errors (RMSE ≤ 0.08)
were obtained. This means that the absolute mean error between experimental and
predicted values of anthocyanin concentrations was less than 8 %.
The estimated parameters from both methods indicated that the anthocyanin
degradation reaction rate constant (k120 °C) increased from 0.9 to 4.14×10⁻³
s–1
with
decreasing water activity, with a maximum at aw = 0.76. Moreover, no significant
difference (P < 0.05) was found between the corresponding activation energies (Ea) for
the heterogeneous analysis, but a slight difference in Ea was observed for the
homogeneous analysis. The use of the heat transfer–reaction model therefore allowed a
slight improvement in the identification of kinetic parameters.
Table III.3.2. Estimated kinetic parameters (aE and
120 Ck ) for anthocyanins thermal
degradation from 100 to 140 ºC, by two types of analysis: with a space-dependent heat-
reaction model (heterogeneous) or by the homogeneous assumption. Mean
values ± 95 % confidence interval.
Analysis Product aw
Monomeric anthocyanins ( ) 0/tA A
aE
( 1kJ mol )
120 Ck (
1310 s ) RMSE
*
Heterogeneous 0.34 ± 0.04 95 ± 5 b 3.29 ± 0.05
c 0.08
0.76 ± 0.01 100 ± 8 ab
4.14 ± 0.07 a 0.03
0.95 ± 0.04 87 ± 8 b 2.06 ± 0.08
d 0.05
0.99 ± 0.02**
90 ± 8 b 0.9 ± 0.1
e 0.07
Homogeneous***
0.34 ± 0.04 108 ± 7 a 3.5 ± 0.3
bc 0.07
0.76 ± 0.01 99 ± 8 ab
3.9 ± 0.4 ab
0.06
0.95 ± 0.04 92 ± 8 b 2.1 ± 0.2
d 0.07
0.99 ± 0.02**
90 ± 8 b 0.9 ± 0.1
e 0.07
Values with different letters (a – d) are significantly different (p < 0.05) in the four water activities
conditions, *RMSE: root mean square error between experimental and predicted A
(t) data.
**Source: Jiménez et al. (2010);
***Source: Jiménez et al. (2011)
Figure III.3.6 presents the anthocyanin degradation kinetics for the three
products (aw = 0.34, 0.76 and 0.95) heated at T∞ = 100, 120 and 140 ºC. It shows a good
fit between experimental data and predicted curves, using the estimated kinetic
parameters presented in Table III.3.2 for the heterogeneous analysis.
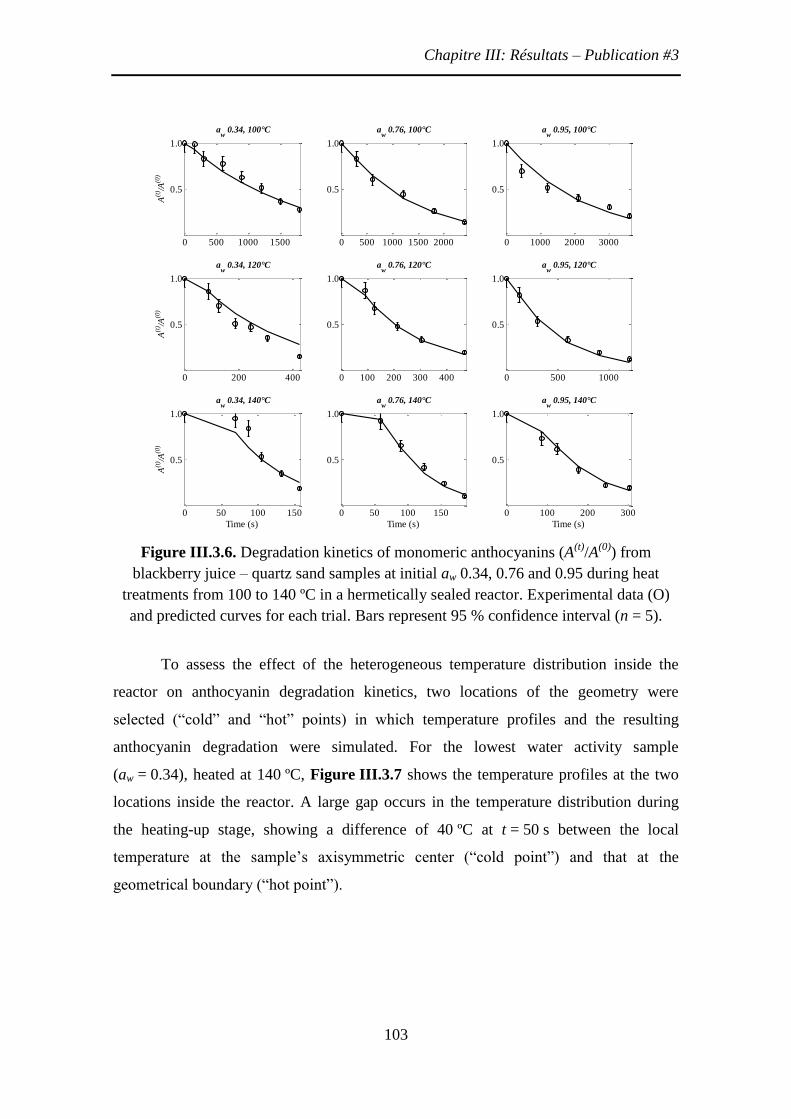
Chapitre III: Résultats – Publication #3
103
Figure III.3.6. Degradation kinetics of monomeric anthocyanins (A
(t)/A
(0)) from
blackberry juice – quartz sand samples at initial aw 0.34, 0.76 and 0.95 during heat
treatments from 100 to 140 ºC in a hermetically sealed reactor. Experimental data (O)
and predicted curves for each trial. Bars represent 95 % confidence interval (n = 5).
To assess the effect of the heterogeneous temperature distribution inside the
reactor on anthocyanin degradation kinetics, two locations of the geometry were
selected (“cold” and “hot” points) in which temperature profiles and the resulting
anthocyanin degradation were simulated. For the lowest water activity sample
(aw = 0.34), heated at 140 ºC, Figure III.3.7 shows the temperature profiles at the two
locations inside the reactor. A large gap occurs in the temperature distribution during
the heating-up stage, showing a difference of 40 ºC at t = 50 s between the local
temperature at the sample’s axisymmetric center (“cold point”) and that at the
geometrical boundary (“hot point”).
0 500 1000 1500
0.5
1.0
aw
0.34, 100°C
A(t
) /A(0
)
0 200 400
0.5
1.0
aw
0.34, 120°C
A(t
) /A(0
)
0 50 100 150
0.5
1.0
aw
0.34, 140°C
Time (s)
A(t
) /A(0
)
0 500 1000 1500 2000
0.5
1.0
aw
0.76, 100°C
0 100 200 300 400
0.5
1.0
aw
0.76, 120°C
0 50 100 150
0.5
1.0
aw
0.76, 140°C
Time (s)
0 1000 2000 3000
0.5
1.0
aw
0.95, 100°C
0 500 1000
0.5
1.0
aw
0.95, 120°C
0 100 200 300
0.5
1.0
aw
0.95, 140°C
Time (s)
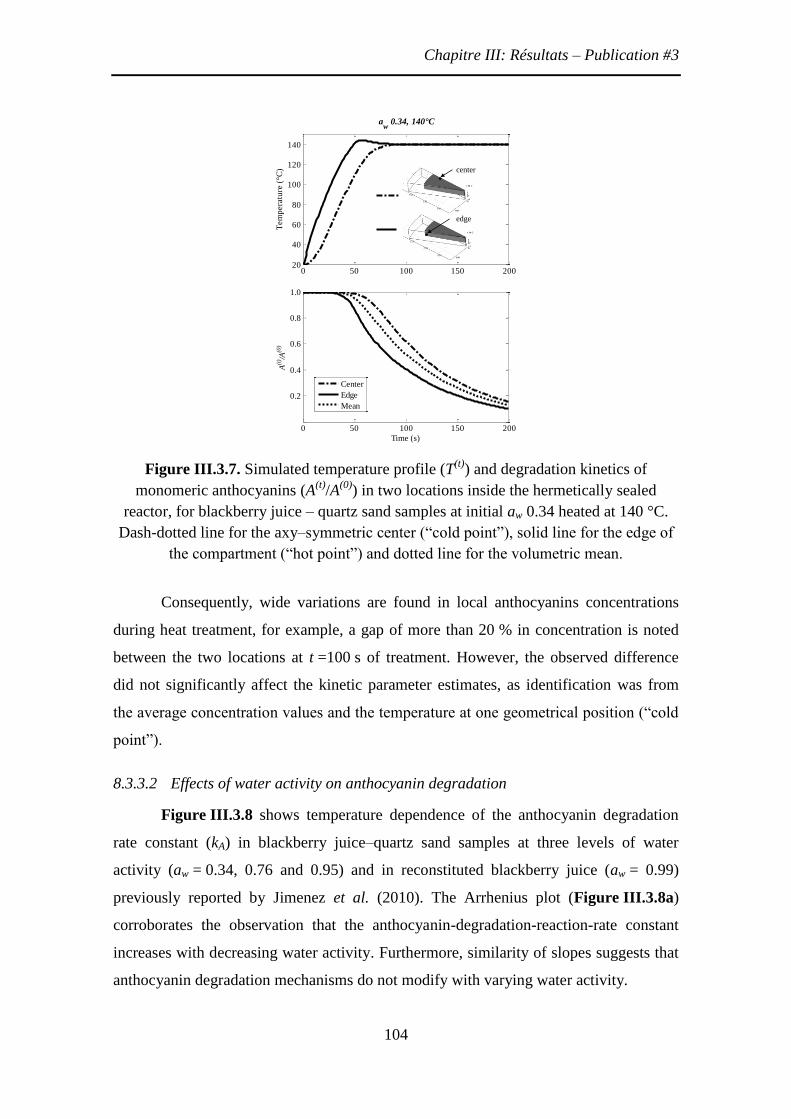
Chapitre III: Résultats – Publication #3
104
Figure III.3.7. Simulated temperature profile (T(t)
) and degradation kinetics of
monomeric anthocyanins (A(t)
/A(0)
) in two locations inside the hermetically sealed
reactor, for blackberry juice – quartz sand samples at initial aw 0.34 heated at 140 °C.
Dash-dotted line for the axy–symmetric center (“cold point”), solid line for the edge of
the compartment (“hot point”) and dotted line for the volumetric mean.
Consequently, wide variations are found in local anthocyanins concentrations
during heat treatment, for example, a gap of more than 20 % in concentration is noted
between the two locations at t =100 s of treatment. However, the observed difference
did not significantly affect the kinetic parameter estimates, as identification was from
the average concentration values and the temperature at one geometrical position (“cold
point”).
8.3.3.2 Effects of water activity on anthocyanin degradation
Figure III.3.8 shows temperature dependence of the anthocyanin degradation
rate constant (kA) in blackberry juice–quartz sand samples at three levels of water
activity (aw = 0.34, 0.76 and 0.95) and in reconstituted blackberry juice (aw = 0.99)
previously reported by Jimenez et al. (2010). The Arrhenius plot (Figure III.3.8a)
corroborates the observation that the anthocyanin-degradation-reaction-rate constant
increases with decreasing water activity. Furthermore, similarity of slopes suggests that
anthocyanin degradation mechanisms do not modify with varying water activity.
0 50 100 150 20020
40
60
80
100
120
140
aw
0.34, 140°C
Tem
pera
ture
(°C
)
0 50 100 150 200
0.2
0.4
0.6
0.8
1.0
Time (s)
A(t
) /A(0
)
Center
Edge
Mean
center
edge

Chapitre III: Résultats – Publication #3
105
Figure III.3.8b presents an empirical mathematical model describing the
relationship between kref and aw for the heterogeneous analysis. The model was
developed by a curve-fitting software (TableCurve®
2D, Jandel Scientific Software,
Corte Madera, CA, USA). A maximum kref is observed at intermediate moisture
(aw = 0.76). The largest variation in kref appears at the multilayer and “free” water region
of the sorption isotherm at 25 ºC.
Results suggest that reduced water activity negatively affects anthocyanin
stability at high temperatures. Moreover, the observation of a maximum kref at
intermediate moisture may support Jiménez et al. (2011) hypothesis that anthocyanin
degradation in blackberry juice at high temperatures results more from condensation
reactions between 5-hydroxymethylfurfural (HMF) and anthocyanins, and less from
hydrolytic mechanisms, because HMF formation and condensation are favored by
conditions of limited moisture (Jimenez et al., 2011).
Figure III.3.8. Relationship between anthocyanin degradation rate constants (kA and
kref) and initial water activity (aw) for blackberry juice – quartz sand system heated from
100 to 140 ºC. (a) Arrhenius plot describing the temperature dependence of kA at four
initial water activities (aw 0.34, 0.76, 0.95 and 0.99). (b) Empirical model describing kref
(at Tref =120 ºC) as function of aw, along with the moisture sorption isotherm at 25 ºC.
Bars and dotted lines represent 95 % confidence intervals.
2.4 2.5 2.6 2.7
10-3
10-2
103/T (K
-1)
k A (
s-1)
0.2 0.4 0.6 0.8 1.0
1
2
3
4
5
Water activity at 25 °C
kre
f (x1
0-3
s-1)
20
40
60
80
100
aw 0.34
aw 0.76
aw 0.95
aw 0.99
(a)
(b)
Moisture sorption isotherm
95% Confidence interval
2
0.003 0.002
1 1.692 0.760
wref
w w
ak
a a
Water co
nten
t (g 1
00
g-1 W
B)
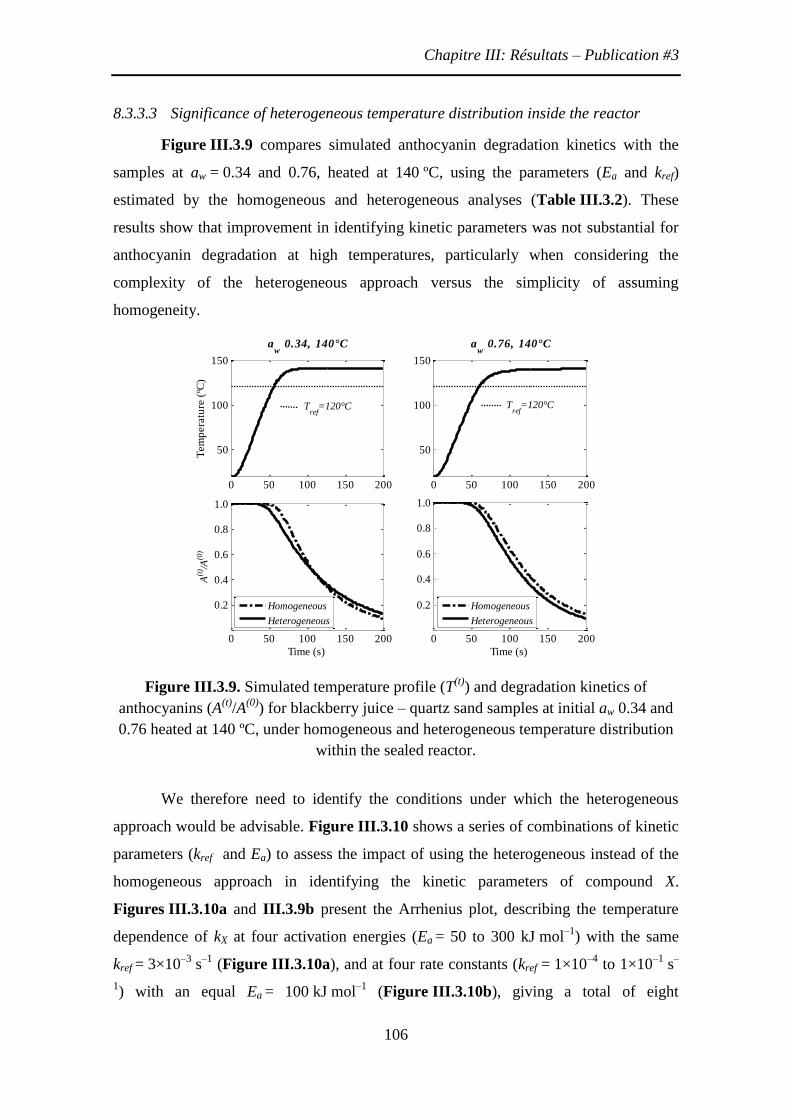
Chapitre III: Résultats – Publication #3
106
8.3.3.3 Significance of heterogeneous temperature distribution inside the reactor
Figure III.3.9 compares simulated anthocyanin degradation kinetics with the
samples at aw = 0.34 and 0.76, heated at 140 ºC, using the parameters (Ea and kref)
estimated by the homogeneous and heterogeneous analyses (Table III.3.2). These
results show that improvement in identifying kinetic parameters was not substantial for
anthocyanin degradation at high temperatures, particularly when considering the
complexity of the heterogeneous approach versus the simplicity of assuming
homogeneity.
Figure III.3.9. Simulated temperature profile (T(t)
) and degradation kinetics of
anthocyanins (A(t)
/A(0)
) for blackberry juice – quartz sand samples at initial aw 0.34 and
0.76 heated at 140 ºC, under homogeneous and heterogeneous temperature distribution
within the sealed reactor.
We therefore need to identify the conditions under which the heterogeneous
approach would be advisable. Figure III.3.10 shows a series of combinations of kinetic
parameters (kref and Ea) to assess the impact of using the heterogeneous instead of the
homogeneous approach in identifying the kinetic parameters of compound X.
Figures III.3.10a and III.3.9b present the Arrhenius plot, describing the temperature
dependence of kX at four activation energies (Ea = 50 to 300 kJ mol–1
) with the same
kref = 3×10⁻³
s–1
(Figure III.3.10a), and at four rate constants (kref = 1×10⁻⁴
to 1×10⁻¹
s–
1) with an equal Ea = 100 kJ mol
–1 (Figure III.3.10b), giving a total of eight
0 50 100 150 200
50
100
150
Tem
pera
ture
(ºC
)
aw
0.34, 140°C
0 50 100 150 200
50
100
150
aw
0.76, 140°C
0 50 100 150 200
0.2
0.4
0.6
0.8
1.0
Time (s)
A(t
) /A(0
)
0 50 100 150 200
0.2
0.4
0.6
0.8
1.0
Time (s)
Homogeneous
Heterogeneous
Homogeneous
Heterogeneous
Tref
=120°C Tref
=120°C

Chapitre III: Résultats – Publication #3
107
combinations of kinetic parameters. Figures III.3.10c and d represent the simulated
temperature profiles (T(t)
) applied to compound X at the reactor’s “cold point” for a
product at an initial aw of 0.34, heated at 140 ºC and considering the thermophysical
properties and thermal parameters of Table III.3.1.
Figure III.3.10. Arrhenius plot describing the temperature dependence of kX at four
activation energies (Ea=50–300 kJ mol-1
) with the same kref = 3×10⁻³
s-1
(a), and at four
rate constants (kref=1×10⁻⁴–1×10
-1 s
-1) with Ea=100 kJ mol
-1 (b). Simulated temperature
profile (T(t)
) for a product at initial aw 0.34 heated at 140 ºC at the “cold point” of the
reactor (c and d), and gap between the degradation kinetics of a compound X (X(t)
/X(0)
)
estimated under homogeneous and heterogeneous temperature distribution within the
sealed reactor for the previous kinetic parameters (e and f).
Finally, Figures III.3.10e and III.3.10f show the gaps among the degradation
kinetics of compound X (X(t)
/X(0)
), estimated under homogeneous and heterogeneous
temperature distribution within the sealed reactor for each combination of kinetic
parameters. The simulations indicate that the higher the kinetic parameter (Ea and kref),
the greater the error made when using the homogeneous approach. The difference of
concentrations of X simulated under homogeneous and heterogeneous temperature
distribution could reach almost 60% for the higher activation energy combination
2.45 2.50 2.55 2.60 2.6510
-5
10-4
10-3
10-2
10-1
100
103/T (K
-1)
kX (
s-1)
Ea 50 kJ mol
-1
Ea 100 kJ mol
-1
Ea 200 kJ mol
-1
Ea 300 kJ mol
-1
0 50 100 150 200
50
100
150
Tem
pera
ture
(°C
)
0 50 100 150 200
0.2
0.4
0.6
Time (s)
Xt /X
0 ho
mo
g -
Xt /X
0 het
ero
g
Ea 50 kJ mol-1
Ea 100 kJ mol-1
Ea 200 kJ mol-1
Ea 300 kJ mol-1
kref
=3.3x10⁻³
s-1
(a)
(c)
(e)
Tref
=120°C
2.45 2.50 2.55 2.60 2.6510
-5
10-4
10-3
10-2
10-1
100
103/T (K
-1)
kX (
s-1)
kref
10-4
s-1
kref
10-3
s-1
kref
10-2
s-1
kref
10-1
s-1
0 50 100 150 200
50
100
150
Tem
pera
ture
(°C
)
0 50 100 150 200
0.2
0.4
0.6
Time (s)
Xt /X
0 ho
mo
g -
Xt /X
0 het
ero
g
kref
10-4 s-1
kref
10-3 s-1
kref
10-2 s-1
kref
10-1 s-1
Tref
=120°C
Ea=1x10
5J mol
-1
(b)
(d)
(f)

Chapitre III: Résultats – Publication #3
108
(Ea = 300 kJ mol–1
and k120 ºC = 3×10⁻³
s–1
) and 45 % for the higher reaction rate
constant at Tref = 120 ºC (kref = 1×10⁻¹
s–1
and Ea = 100 kJ mol–1
). Under these
conditions, using the heterogeneous approach would indeed be justified. These orders of
magnitudes for kinetic parameters are characteristic of microbial inactivation and
protein denaturation (van Boekel, 2009a).
8.4 Conclusions
A space-and-time dependent model, which combines heat transfer and chemical
reaction, was developed to identify kinetic parameters under non-isothermal conditions
for intermediate-moisture foodstuffs, commonly used in agroindustry. When a
heterogeneous distribution of temperature inside the product is taken into account,
identification of kinetic parameters improved slightly. However, the complexity of the
heterogeneous analysis, compared with the homogeneous assumption, meant that the
improvement accomplished was not significant for anthocyanin degradation at high
temperatures. Even so, for some applications, the heat transfer–reaction model would
allow the generation and adjustment of temperature profiles of heat processes to better
achieve expected results, such as the nutritional and microbiological quality of heat-
sensitive foodstuffs during high-temperature processing.
8.5 Acknowledgments
We are grateful to the EU for funding the PAVUC Project (Contract No. FP6-
0015279), and to the French Cultural and Cooperation Centre for Central America
(CCCAC, its French acronym) and the University of Costa Rica for their financial
support. We are also grateful to Julien Ricci for his technical assistance.
Chapitre III : Résultats – Publication #4
109
9 Publication #4 : Couplage de la déshydratation-imprégnation par
immersion et la stérilisation de papaye verte imprégnée d’une
solution de jus de mûre
Des tranches fines (1,5 mm d’épaisseur) de papaye verte ont été imprégnées d’une
solution de saccharose-jus de mûre déshydratée par DII pour produire un produit
d’humidité intermédiaire. Les effets de la température de traitement et de la molalité du
saccharose ajouté (msaccharose) dans le transfert de matière pendant la DII ont été évalués
à l’aide d’une étude cinétique et de la méthodologie de surface de réponse (MSR). La
MSR a été utilisée pour modéliser la perte en eau (WL), le gain en sucre (SG) et le gain
en anthocyanes (AG) comme fonction des variables du traitement. Pour toutes les
réponses (WL, SG et AG), le transfert de matière survient principalement dans les cinq
premières minutes d’immersion. La molalité du saccharose (msaccharose) a été le facteur
principal qui a affecté toutes les réponses : en augmentant, la WL et le SG ont augmenté
tandis que le AG a diminué. Le transfert de matière limite donc l’imprégnation des
anthocyanes mais pas l’incorporation de saccharose. Une fois que l’opération de DII a
été caractérisée, le couplage entre l’imprégnation et le traitement thermique à hautes
températures a été analysé à l’aide d’une simulation numérique. Les conditions du
procédé combiné, conçu pour atteindre un produit final riche en anthocyanes, ont été
basse molalité de saccharose ajoutée (msaccharose < 1 mol kg–1
) et haute température de
traitement (T > 50 °C) pour la déshydratation osmotique, couplées avec un traitement de
stérilisation de courte durée à haute température pour stabiliser le produit.
Chapitre III : Résultats – Publication #4
110
Coupling Osmotic Dehydration with Heat Treatment for
Green Papaya Impregnated with Blackberry Juice Solution
Nadiarid Jiméneza, Philippe Bohuon
b, *, Manuel Dornier
b, Marvin Soto
c,
Ana Mercedes Pérezc and Fabrice Vaillant
d
a Escuela de Tecnología de Alimentos, Universidad de Costa Rica (UCR), Apartado Postal
11501–2060, San José, Costa Rica
b Montpellier Supagro, UMR QualiSud, 1101 avenue Agropolis, CS 24501, 34093 Montpellier
Cedex 5, France
c Centro Nacional de Ciencia y Tecnología de Alimentos (CITA), UCR
d Centre de coopération internationale en recherche Agronomique pour le développement
(CIRAD), UMR QualiSud, TA B-95/15, 73 rue Jean François Breton, 34398 Montpellier Cedex
5, France
*Corresponding author: Telephone: +33 467615726; fax: +33 467615728;
e-mail: [email protected]
Chapitre III : Résultats – Publication #4
111
Abstract
Thin slices (1.5 mm thick) of green papaya were impregnated with a blackberry
juice–sucrose solution and osmotically dehydrated to produce an intermediate-moisture
product. The effect of processing temperature (T) and sucrose-added molality (msucrose)
on mass transfer during osmotic dehydration was assessed, using a kinetics study and
response surface methodology (RSM). The RSM was used to model water loss (WL),
sugar gain (SG), and anthocyanin gain (AG) as functions of processing variables. For all
responses (WL, SG, and AG), mass transfer occurred mainly in the first 5 min of
immersion. Sucrose molality (msucrose) was the main factor affecting all responses: as it
increased, so did WL and SG, but AG decreased. Water transfer therefore limits
anthocyanin impregnation, but not sucrose incorporation. Once the osmotic operation
was characterized, the coupling between impregnation and heat treatment at high
temperatures was analyzed, using numerical simulation. The conditions of the combined
process, designed to achieve an anthocyanin-rich final product, are low sucrose-added
molalities (msucrose < 1 mol kg–1
) and high processing temperatures (T > 50 °C) for
osmotic dehydration, coupled with high-temperature, short-time (HTST) sterilization
treatments for product stabilization.
Keywords: blackberry juice; green papaya; osmotic dehydration; heat treatment;
anthocyanins; response surface methodology

Chapitre III : Résultats – Publication #4
112
9.1 Introduction
Green papaya (Carica papaya L.) is traditionally used in Latin America to
produce candied fruit (Francis, 1994). Its firm texture and neutral flavor make it suitable
for impregnation with artificial or natural colorants, such as blackberry juice, to obtain
an intermediate-moisture product for use in food formulations.
Blackberries (Rubus adenotrichus Schltdl.) are a good source of phenolic
compounds, including anthocyanins (Mertz et al., 2007). These natural red pigments are
water soluble and can offer an alternative to synthetic dyes (Cisse et al., 2009).
Anthocyanins also present potential health benefits (Giusti et Jing, 2007) and high
antioxidant activity, compared with other fruits (Fan-Chiang et Wrolstad, 2005).
Anthocyanins can be incorporated into green papaya through osmotic
dehydration. The fruit is immersed in a hypertonic solution that contains blackberry
juice. During osmotic dehydration, the product is in contact with a low water activity
solution in which a counter current mass transfer is established. That is, water is
transferred from the product to the solution and, in the opposite direction; soluble solids
present in the osmotic solution are incorporated into the food material (Shi et Le
Maguer, 2002).
This process—impregnating fruit juices and sugar syrups containing vitamins,
minerals, bioactive compounds, and other food ingredients to formulate fortified or
value-added fruit products—has been used to produce apple snacks fortified with
trans-resveratrol glucoside (Joshi et Rupasinghe, 2010) and calcium (Alzamora et al.,
2005);apple and banana impregnated with grape phenolics (Rózek et al., 2010); and
partially ripe mangoes impregnated with a mango juice–sugar syrup (Sriwimon et
Boonsupthip, 2011). These developments respond to growing demand for healthier
snacks, encouraging manufacturers to reassess the fruit sector.
Osmotic dehydration, however, yields intermediate-moisture products, and other
treatments must often be incorporated to either further reduce water activity or destroy
microorganisms and increase shelf life. Hence, osmotic dehydration is often coupled
with thermal treatment such as pasteurization, sterilization, frying, air-drying, or baking
(Ikoko et Kuri, 2007 385; Lenart et Lewicki, 2006 376).
Thermal processing involves heating foods at temperatures between 60 and
150 C, depending on the product’s pH and desired shelf life. Moreover, the magnitude
and duration of heat treatment strongly and negatively influence the stability of most
bioactive molecules of interest in health-food products. This is true for anthocyanins,
Chapitre III : Résultats – Publication #4
113
which, in most cases, are drastically reduced when food products are processed at high
temperatures (Patras et al., 2010). Recently, high-temperature treatments (100 to
140 °C), combined with decreasing water activity during processing, were reported to
severely degrade anthocyanins in blackberry juice (Jimenez et al., 2011).
The interaction between anthocyanins impregnation by osmotic dehydration and
high-temperature treatment of the intermediate-moisture product must therefore be
systematically analyzed. The analysis would help improve treatments for obtaining a
high-quality food ingredient.
This study has three objectives: first, to assess the effect of sucrose concentration
and processing temperature on the mass transfer phenomena that occur during osmotic
dehydration of green papaya being impregnated with a blackberry juice solution.
Emphasis is given to anthocyanins gain during soaking and its interaction with water
loss. The second objective is to model, using response surface methodology (RSM),
water loss (WL), sugar gain (SG), and anthocyanins gain (AG) as functions of
processing variables. The final objective is to optimize anthocyanin content in the final
product when previous osmotic dehydration is coupled with high-temperature
treatments such as sterilization.
9.2 Materials and methods
9.2.1 Materials
A native variety of green papaya was harvested at early maturity (white pulp and
seeds) in the Puntarenas Region of Costa Rica. Fully ripe, tropical highland blackberries
were also harvested, but in the Cartago Region, Costa Rica (1500 m above sea level),
and frozen at 20 ºC.
The frozen blackberries were then thawed at 5 ºC over 24 h and pressed with a
discontinuous hydraulic press (OTC 25-ton H-frame Hydraulic Shop Press, Series
Y125, Owatonna, MN, USA) to obtain a low turbidity juice at 80 g kg–1
TSS. It was
kept frozen at -18 °C. Initial values for the juice were anthocyanin contents at
A(0)
= 625 ± 18 mg kg–1
juice, expressed as cyanidin-3-glucoside equivalents (CGE);
and water content at W(0)
= 0.92 ± 0.01 kg kg–1
juice.
The sugar profile was as follows: glucose at 117 ± 7 g kg–1
fruit (dw), fructose at
104 ± 8 g kg–1
fruit (dw), and zero sucrose (i.e., ≤0.5 g kg–1
). Sucrose, the osmotic
agent, was purchased in a local supermarket as granulated cane sugar, refined to food-
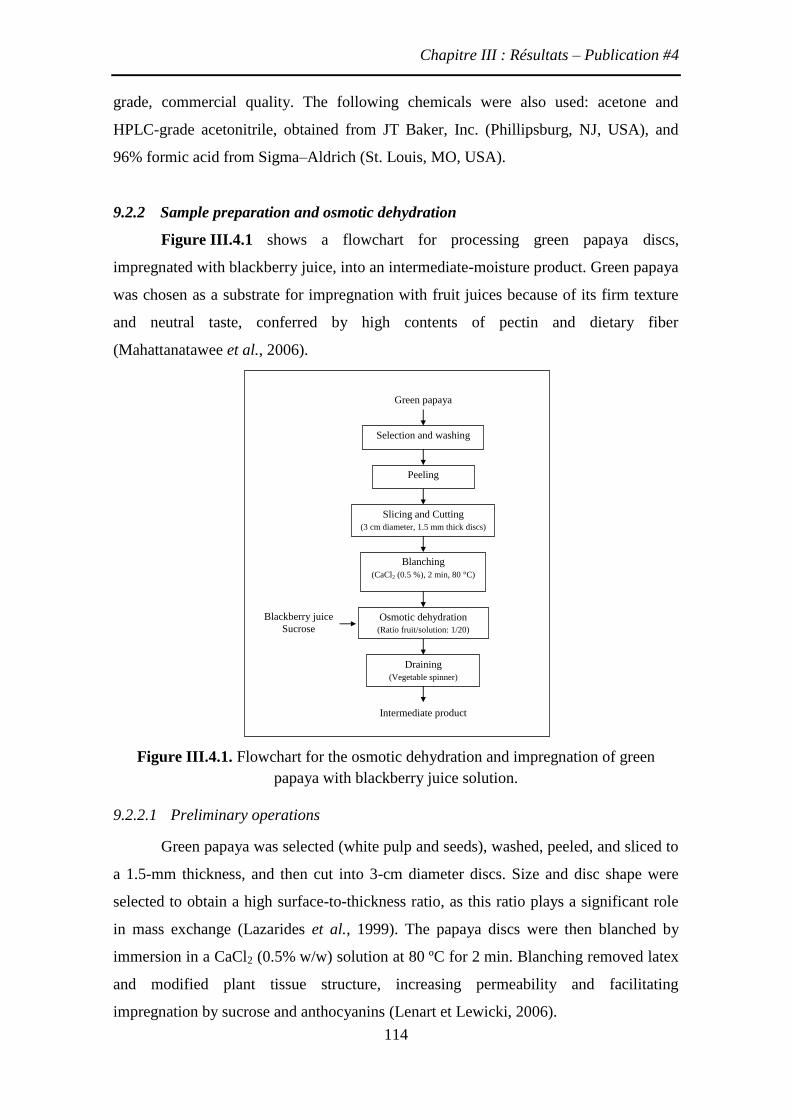
Chapitre III : Résultats – Publication #4
114
grade, commercial quality. The following chemicals were also used: acetone and
HPLC-grade acetonitrile, obtained from JT Baker, Inc. (Phillipsburg, NJ, USA), and
96% formic acid from Sigma–Aldrich (St. Louis, MO, USA).
9.2.2 Sample preparation and osmotic dehydration
Figure III.4.1 shows a flowchart for processing green papaya discs,
impregnated with blackberry juice, into an intermediate-moisture product. Green papaya
was chosen as a substrate for impregnation with fruit juices because of its firm texture
and neutral taste, conferred by high contents of pectin and dietary fiber
(Mahattanatawee et al., 2006).
Figure III.4.1. Flowchart for the osmotic dehydration and impregnation of green
papaya with blackberry juice solution.
9.2.2.1 Preliminary operations
Green papaya was selected (white pulp and seeds), washed, peeled, and sliced to
a 1.5-mm thickness, and then cut into 3-cm diameter discs. Size and disc shape were
selected to obtain a high surface-to-thickness ratio, as this ratio plays a significant role
in mass exchange (Lazarides et al., 1999). The papaya discs were then blanched by
immersion in a CaCl2 (0.5% w/w) solution at 80 ºC for 2 min. Blanching removed latex
and modified plant tissue structure, increasing permeability and facilitating
impregnation by sucrose and anthocyanins (Lenart et Lewicki, 2006).
1
Green papaya
Selection and washing
Peeling
(Manual)
Slicing and Cutting
(3 cm diameter, 1.5 mm thick discs)
Blanching
(CaCl2 (0.5 %), 2 min, 80 °C)
Osmotic dehydration
(Ratio fruit/solution: 1/20)
Draining
(Vegetable spinner)
Intermediate product
Blackberry juice
Sucrose
Chapitre III : Résultats – Publication #4
115
9.2.2.2 Osmotic dehydration
Impregnation solutions were prepared by dissolving specific amounts of sucrose
in blackberry juice to obtain molalities that ranged from 0.0 to 3.0 mol kg–1
water. A
solution-to-sample ratio of 20:1 (w/w) was used to reduce the effect of dilution during
osmotic treatment (Lazarides et al., 1999). The osmotic solution composition
(blackberry juice–sucrose) had a dual purpose: to formulate the product in terms of
odor, taste, color, and phenolic compounds of blackberry and, simultaneously,
dehydrate the sample to produce an intermediate-moisture product.
All experiments were carried out in closed glass jars within a thermostatically
controlled, shaking water bath (Barnstead/Lab-Line, Dubuque, IA, USA). The
experiments were performed at temperatures from 30 to 70 °C for varying immersion
times in the kinetics study, and at a fixed time (60 min) in the experimental design, to
ensure that equilibrium in the mass transfer was reached. The thermal degradation of
anthocyanins during osmosis can be considered as insignificant (T ≤ 70 °C and
t ≤ 60 min), according to results of a study reported by (Cisse et al., 2009) on low-
temperature thermal treatment of blackberry juice. After treatment, the discs were
washed with tap water for few seconds to remove excess osmotic solution, drained, and
gently blotted with tissue paper.
9.2.3 Extraction of phenolic compounds
Impregnated samples (10 g each) were homogenized with 40 mL of
acetone/water (7:3, v/v) and 10 mL of acetone in an ULTRA-TURRAX® homogenizer
(IKA/Werke, Staufen, Germany). Phenolics were then extracted twice, for 10 min each
session, with 25 mL of acetone/water (7:3, v/v), using an ultrasonic bath (model FS60H,
Fisher Scientific, Pittsburgh, PA, USA). Extracts were separated by centrifuging at
5660g for 10 min (centrifuge model 120, IEC Multi RF™, ThermoIEC, Needham
Heights, MA, USA) and filtering through cotton (to prevent pigment retention in filter
paper). The phenols were then concentrated under vacuum in a rotary evaporator (011
rotor and 461 water bath; BÜCHI Labortechnik, Flawil, Switzerland) to remove acetone
(at 40 ºC).

Chapitre III : Résultats – Publication #4
116
9.2.4 Analytical methods
9.2.4.1 Moisture and sucrose content
Moisture content was determined in a vacuum oven at 70 ºC until constant
weight was reached, as according to AOAC standard 920.151 (AOAC, 1990). Analyses
were performed in triplicate. Sucrose content was calculated by mass balance, because
no sucrose was detected in green papaya (USDA, 2010).
9.2.4.2 Anthocyanin content as determined by HPLC
Phenolic compounds were analyzed by HPLC-DAD (Shimadzu Scientific
Instruments, Kyoto, Japan), featuring a C18 column (Phenomenex, Torrance, CA,
USA). DAD detection was carried out between 200 and 600 nm, using a method
described by (Mertz et al., 2007). Chromatographic conditions were as follows: 30 ºC;
0.3 mL min–1
flow rate; 20 μL injection volume; eluent A = water/formic acid, 98:2,
v/v; and eluent B = acetonitrile/water/formic acid, 80:18:2, v/v. The gradients used for
separation were from 5 to 25 % B in 20 min, from 25 to 100 % B in 5 min, and from
100 to 5 % B in 5 min, after which the column was equilibrated for 10 min at 5 % B.
Anthocyanin contents were expressed as cyanidin-3-glucoside equivalents (mg kg–1
),
the most prevalent anthocyanin in blackberry at 95 % (w/w) (Mertz et al., 2007).
9.2.5 Expression of responses
9.2.5.1 Water loss
Water loss (WL, kg kg–1
green papaya) was expressed as the net loss of water (in
kg) from the green papaya between its initial and impregnated states, based on the
fruit’s initial sample weight in kilograms.
( ) ( )
( ) (0)
(0)
t tt m W
WL Wm
(61)
where, W(0)
is the water content and m(0)
is the weight of the green papaya discs at initial
time; W(t)
is the water content and m(t)
is the weight of the dehydrated sample at
immersion time t.
9.2.5.2 Sugar gain
Sugar gain (SG, kg kg–1
green papaya) was calculated as the gain of sucrose (in
kg) by the green papaya between its initial and osmotically treated states, based on the
Chapitre III : Résultats – Publication #4
117
fruit’s initial sample weight in kilograms.
( ) ( )
(0)
(0)
t tS mSG S
m (62)
where, S(0)
is the sucrose content of green papaya at initial time (S(0)
= 0); and S(t)
is the
sucrose content of impregnated sample at immersion time t.
9.2.5.3 Anthocyanin gain
Anthocyanin gain (AG, mg kg–1
green papaya) was expressed as the gain of
cyanidin-3-glucoside equivalents (CGE) in mg by the green papaya between its initial
and impregnated states, based on the fruit’s initial sample weight in kilograms.
( ) ( )
(0)
(0)
t tA mAG A
m (63)
where, A(0)
is the anthocyanin contents of green papaya at initial time (A(0)
= 0); and A(t)
is the anthocyanin contents of the impregnated sample at immersion time t.
9.2.6 Kinetics of mass transfer
Osmotic treatments were performed with three sucrose molalities (0, 1.5, and
3.0 mol kg–1
) at 50 °C over increasing immersion times (t = 2, 4, 8, 15, 30, and 60 min).
Kinetics of water loss (WL), sugar gain (SG), and anthocyanin gain (AG) were obtained
to assess the immersion time required to reach equilibrium.
9.2.7 Experimental design and statistical analysis
A rotatable central composite design (RCCD) was performed, using 4 factorial,
4 axial, and 3 central points (triplicate only at the central point) and resulting in 11
experiments. This experimental design was used to obtain a second-order polynomial
model to describe WL, SG, and AG (dependent variables) as functions of two
independent variables: processing temperature (T) and sucrose molality (m). The
immersion time was fixed at 60 min.
The statistical design, with coded and real values of factor variables, is given in
Table III.4.1. All experiments were performed randomly, and data treated with
STATISTICA 7.0 software (StatSoft Inc., Tulsa, OK, USA). The second-order
polynomial model, used to describe the response variable Yk (WL, SG, and AG) as a
function of factor variable Xi, was:

Chapitre III : Résultats – Publication #4
118
2
0k k ki i kii i kij i jY X X X X (64)
where, X1 is the processing temperature as a coded value (T = 14.1 × X1 + 50); X2 is the
sucrose-added molality as a coded value (msucrose = 1.1 × X2 + 1.5); βk0 is the polynomial
constant; and βki, βkii, and βkij i≠j are the linear, quadratic, and interaction regression
coefficients, respectively. Model validity was assessed by the coefficient of
determination (R2) between the actual and predicted responses; the P-value that tests the
probability that the true value of multiplicative parameters of the model are zero; and
the lack-of-fit tests that give the probability (Plof) for lack-of-fit variance to be equal to
pure error variance. Additionally, graphical analysis of observed versus predicted values
was performed to check for random distribution.
Table III.4.1. Central composite design matrix with coded and real values of the
independent variables (temperature and sucrose added molality, msucrose) and
experimental responses to water loss (WL), sugar gain (SG) and anthocyanins gain (AG)
after 60 min.
Assay Temperature
(°C)
msucrose
(mol kg–1
)
WL
(kg kg–1
)
SG
(kg kg–1
)
AG
(mg kg–1
)
1 36 (–1) 0.4 (–1) 0.420 0.251 388.8
2 36 (–1) 2.6 (+1) 0.621 0.246 211.0
3 64 (+1) 0.4 (–1) 0.155 0.154 702.2
4 64 (+1) 2.6 (+1) 0.608 0.288 261.3
5 30 (–1.41) 1.5 (0) 0.420 0.251 388.8
6 70 (+1.41) 1.5 (0) 0.357 0.330 497.7
7 50 (0) 0.0 (–1.41) 0.053 0.051 704.4
8 50 (0) 3.0 (+1.41) 0.610 0.311 212.4
9 50 (0) 1.5 (0) 0.444 0.304 470.6
10 50 (0) 1.5 (0) 0.487 0.259 374.1
11 50 (0) 1.5 (0) 0.512 0.275 337.3
Models were established, using only significant regression coefficients
(P < 0.05). Response contour diagrams and observed versus predicted plots were
generated with MATLAB®
software, version 7.0 (The MathWorks Inc., Natick, MA,
USA).
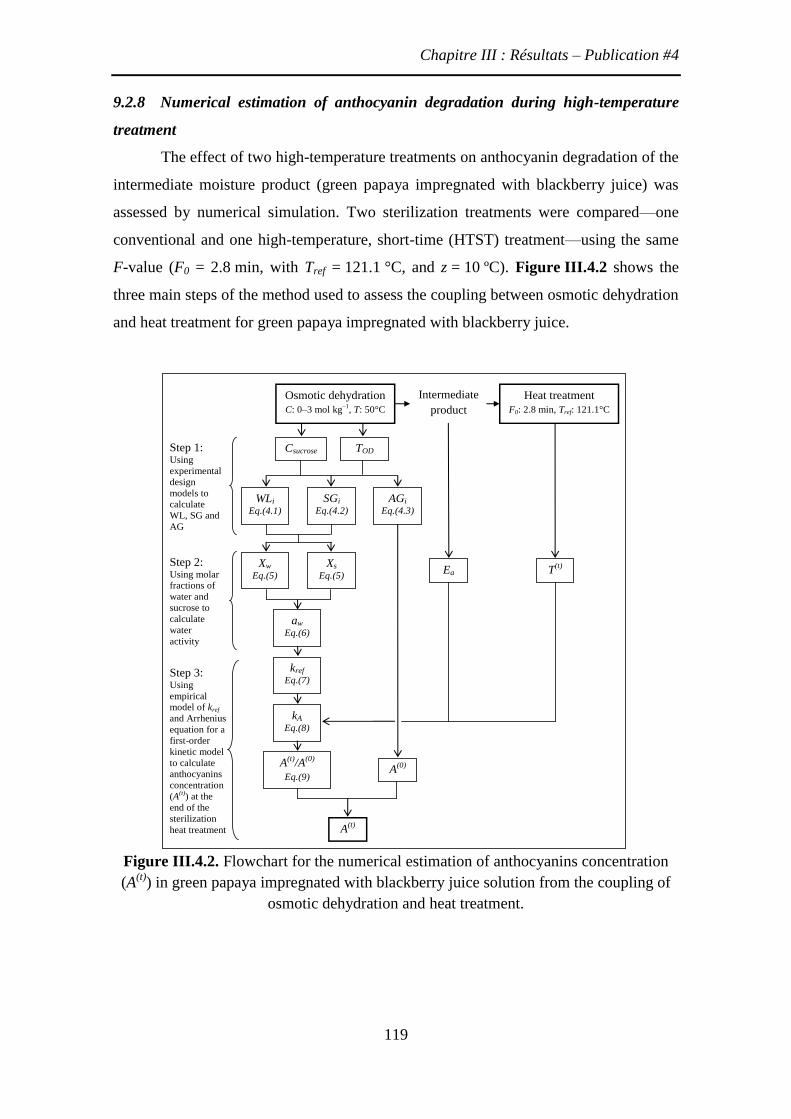
Chapitre III : Résultats – Publication #4
119
9.2.8 Numerical estimation of anthocyanin degradation during high-temperature
treatment
The effect of two high-temperature treatments on anthocyanin degradation of the
intermediate moisture product (green papaya impregnated with blackberry juice) was
assessed by numerical simulation. Two sterilization treatments were compared—one
conventional and one high-temperature, short-time (HTST) treatment—using the same
F-value (F0 = 2.8 min, with Tref = 121.1 °C, and z = 10 ºC). Figure III.4.2 shows the
three main steps of the method used to assess the coupling between osmotic dehydration
and heat treatment for green papaya impregnated with blackberry juice.
Figure III.4.2. Flowchart for the numerical estimation of anthocyanins concentration
(A(t)
) in green papaya impregnated with blackberry juice solution from the coupling of
osmotic dehydration and heat treatment.
Step 1: Using
experimental
design
models to
calculate
WL, SG and
AG
Step 2: Using molar
fractions of
water and
sucrose to
calculate
water
activity
Step 3: Using
empirical
model of kref
and Arrhenius
equation for a
first-order
kinetic model
to calculate
anthocyanins
concentration
(A(t)
) at the
end of the
sterilization
heat treatment
Osmotic dehydration
C: 0–3 mol kg–1
, T: 50°C
Heat treatment
F0: 2.8 min, Tref: 121.1°C
Intermediate
product
T(t)
TOD Csucrose
WLi
Eq.(4.1)
Ea
A(0)
A(t)
SGi
Eq.(4.2)
AGi
Eq.(4.3)
Xw
Eq.(5)
Xs
Eq.(5)
aw
Eq.(6)
kref
Eq.(7)
kA
Eq.(8)
A(t)
/A(0)
Eq.(9)
Chapitre III : Résultats – Publication #4
120
9.2.8.1 Step 1: Using experimental design models
The characteristics (WL, SG, and AG) of the intermediate moisture products
were calculated from models generated by the experimental design (Equations 4.1, 4.2,
and 4.3, respectively, in Table III.4.2) with sucrose molalities ranging from 0.0 to
3.0 mol kg–1
and the temperature at 50 ºC.
9.2.8.2 Step 2: Water activity of intermediate moisture product
The molar fraction of water (Xw) and sucrose (Xs) of each intermediate moisture
product was calculated from the corresponding mass fraction of water (W(t)
) and sucrose
(S(t)
). These, in their turn, were calculated from the WL and SG values obtained in
step 1. The following Equation (65) summarizes the performed calculations:
( )
( ) ( )
( )
( ) ( )
t
ww t t
w s
t
ss t t
w s
W MWX
W MW S MW
S MWX
W MW S MW
with
( ) (0)
( )
1
1
t
i i i
t
i i i
W W WL WL SG
S SG WL SG
(65)
where, MWw and MWs were the molecular weight of water (18.0 g mol–1
) and sucrose
(342.3 g mol–1
), respectively; and W(0)
the mass fraction of water in green papaya at
initial time (0.93 ± 0.02 kg kg–1
). Later, the water activity (aw at 25 °C) of each
intermediate moisture product was calculated through Norrish’s equation (Equation (66)
), from the molar fractions of water (Xw) and sucrose (Xs):
2 w w sa X exp K X (66)
where, K is a correlating constant, estimated as K = 6.01 for highly concentrated sucrose
solutions (Baeza et al., 2010).
9.2.8.3 Step 3: Anthocyanin concentration in sterilized product
Anthocyanin concentration A(t)
for each product at the end of the heat treatment
was estimated by considering the kinetic parameters, Ea and kref, for anthocyanin
degradation. These parameters were identified in a previous study on high temperatures
(T∞
= 100–140 °C) and different water activities (aw = 0.34–0.99) (Jimenez et al., 2011).
Equation (67) below presents the relationship obtained between the reaction rate
constant kref (s–1
) at Tref = 120 °C and initial water activity (aw) at 25 °C:
0.004 / 1 0.957 / 0.029ref wk exp a (67)
Chapitre III : Résultats – Publication #4
121
The rate constant kA (s–1) for anthocyanin degradation varied with the system’s
absolute temperature, T (K), according to the Arrhenius equation, as follows:
( )
1 1aA ref t
ref
Ek k exp
R T T
(68)
where, kref (s–1
) is the rate constant at the reference temperature (Equation (67)), Ea is
the apparent activation energy (92 ± 8 kJ mol–1
), R is the gas constant (8.314 J mol–1
K–
1), and T
(t) is the temperature during heat treatment. The reference temperature was
chosen to be in the middle of the studied temperature range, that is, Tref = 120 ºC.
The decrease of anthocyanin content (A(t)
) during high-temperature treatment
was described in terms of irreversible first-order kinetics (Jimenez et al., 2010):
( )t
A
dAk A
dt (69)
Finally, the anthocyanin content A(t)
(mg CGE kg–1
green papaya) of the product
after heat treatment was calculated as the product of the residual anthocyanin
concentration (A(t)
/A(0)
) times anthocyanin gain (AG = A(0)
, mg CGE kg–1
green papaya).
The method described for the coupling analysis is outlined in Figure III.4.2.
9.3 Results and discussion
9.3.1 Kinetics of osmotic dehydration
Figure III.4.3 shows kinetics of water loss (WL), sugar gain (SG), and
anthocyanin gain (AG) during osmotic dehydration at three sucrose molalities
(msucrose = 0, 1.5, and 3.0 mol kg–1
water) at the same processing temperature
(T = 50 ºC). Two patterns were observed in the mass transfer kinetics: first, when no
sucrose was added to blackberry juice (msucrose = 0 mol kg–1
water), lower WL and SG
and higher AG values were observed. The second pattern showed that, where sucrose
was added as two different concentrations (msucrose = 1.5 and 3.0 mol kg–1
water),
significant water loss and sugar gain were observed, with reduced anthocyanin gain.
That is, water transfer limited anthocyanin impregnation, but did not prevent sucrose
incorporation.
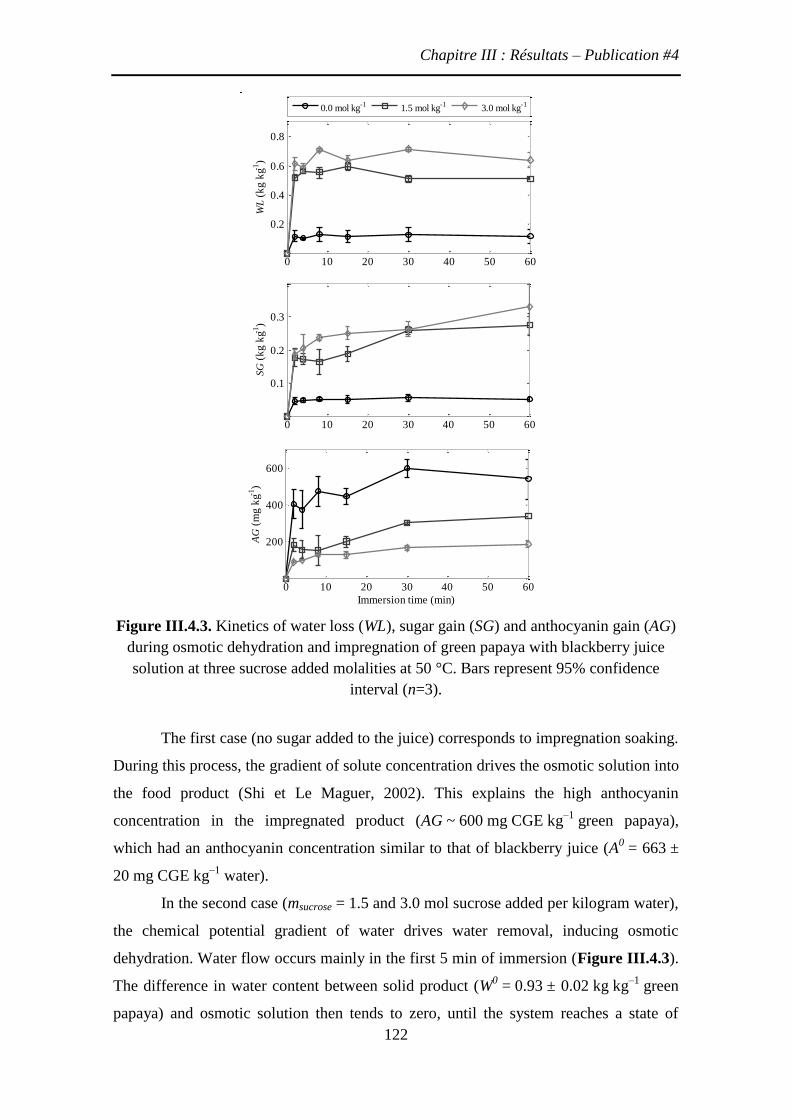
Chapitre III : Résultats – Publication #4
122
Figure III.4.3. Kinetics of water loss (WL), sugar gain (SG) and anthocyanin gain (AG)
during osmotic dehydration and impregnation of green papaya with blackberry juice
solution at three sucrose added molalities at 50 °C. Bars represent 95% confidence
interval (n=3).
The first case (no sugar added to the juice) corresponds to impregnation soaking.
During this process, the gradient of solute concentration drives the osmotic solution into
the food product (Shi et Le Maguer, 2002). This explains the high anthocyanin
concentration in the impregnated product (AG ~ 600 mg CGE kg–1
green papaya),
which had an anthocyanin concentration similar to that of blackberry juice (A0 = 663 ±
20 mg CGE kg–1
water).
In the second case (msucrose = 1.5 and 3.0 mol sucrose added per kilogram water),
the chemical potential gradient of water drives water removal, inducing osmotic
dehydration. Water flow occurs mainly in the first 5 min of immersion (Figure III.4.3).
The difference in water content between solid product (W0 = 0.93 ± 0.02 kg kg
–1 green
papaya) and osmotic solution then tends to zero, until the system reaches a state of
0 10 20 30 40 50 60
0.2
0.4
0.6
0.8
WL
(k
g k
g-1)
0 10 20 30 40 50 60
0.1
0.2
0.3
SG
(k
g k
g-1)
0 10 20 30 40 50 60
200
400
600
Immersion time (min)
AG
(m
g k
g-1)
0.0 mol kg-1
1.5 mol kg-1
3.0 mol kg-1

Chapitre III : Résultats – Publication #4
123
equilibrium. During the latter period of immersion, solute gain continues to increase
steadily because the gradient of solute concentration is still high (Shi et Le Maguer,
2002).
In both cases, for all three responses (WL, SG, and AG), the initial phase of
accelerated mass transfer occurred in about the first 5 min of immersion. This represents
a very short period of time, compared with values reported in literature (between 30 min
and 3 h for fruits and vegetables) (Bohuon et Raoult-Wack, 2002; Shi et Le Maguer,
2002). The rapidity of transfer may be explained by the high surface-to-thickness ratio
of the green papaya discs (3-cm diameter, 1.5 mm thickness), in addition to the
increased permeability caused by pre-treatment blanching. From the results obtained in
the kinetics study, an immersion time of 60 min was established, as this time is required
to reach a state of equilibrium of mass transfer. This value was selected for later
experimental design analysis.
9.3.2 Experimental design
Table III.4.1 presents the statistical design with coded and real values of
independent variables (temperature and sucrose molality), as well as the results for the
three dependent variables analyzed: water loss (WL), sugar gain (SG), and anthocyanin
gain (AG) after 60 min. A regression analysis was performed to obtain a second-order
model equation for the three responses as functions of processing temperature (X1) and
sucrose-added molality (X2). Table III.4.2 shows the estimated models with only the
significant regression coefficients (P < 0.05). The regression parameters reveal the
effect of each independent variable (X1 and X2) on the responses, WL, SG, or AG.
Table III.4.2. Second order polynomial models of water loss (WL), sugar gain (SG) and
anthocyanin gain (AG) with significant regression coefficients (P<0.05).
Dependent variable Equation R2 P-value Plof
Water Loss
(kg kg–1
GP)
WL = 0.46 – 0.05 X1 + 0.18 X2
– 0.04 X12 + 0.06 X1 X2
(4.1) 0.91 0.002 0.16
Sugar Gain
(kg kg–1
GP)
SG = 0.28 + 0.06 X2 – 0.05 X22
+ 0.04 X1 X2
(4.2) 0.81 0.007 0.21
Anthocyanins Gain
(mg kg–1
GP)
AG = 413.5 + 64.7 X1 – 164.3 X2
– 65.8 X1 X2
(4.3) 0.92 0.0004 0.70
X1: Coded values of temperature T with X1=(T–50)/14.1;
X2: Coded values of sucrose added molality msucrose with X2=(msucrose–1.5)/1.1
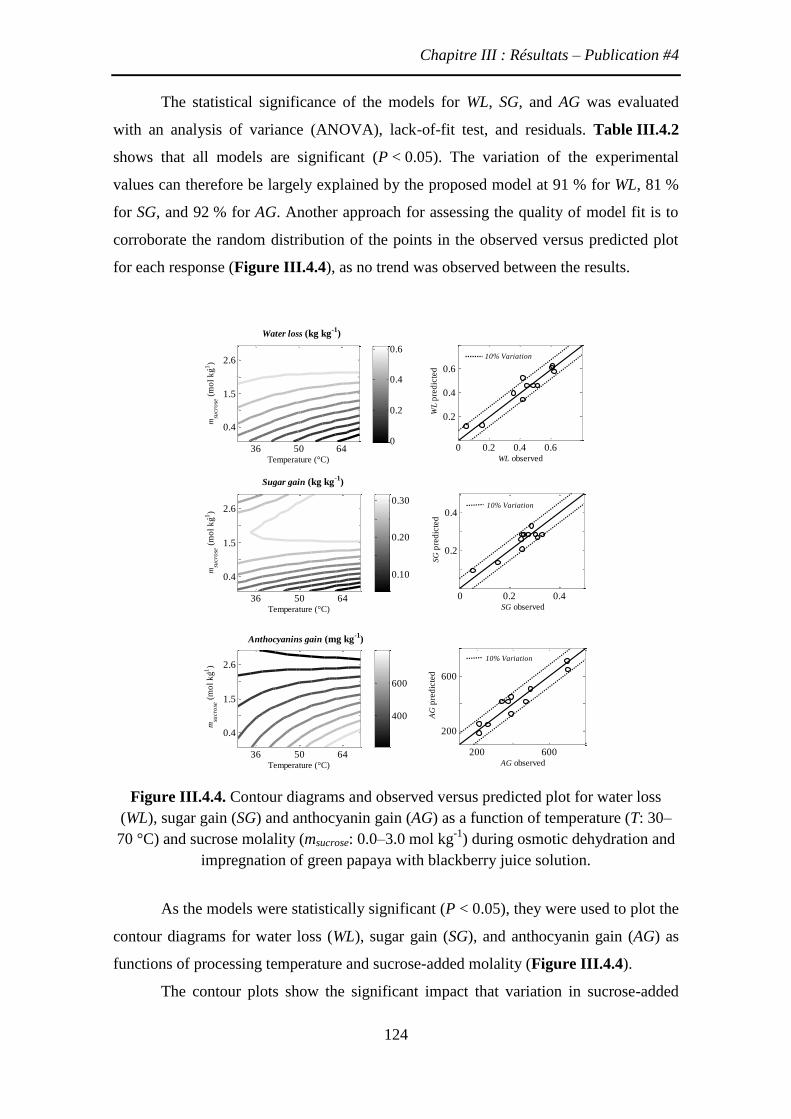
Chapitre III : Résultats – Publication #4
124
The statistical significance of the models for WL, SG, and AG was evaluated
with an analysis of variance (ANOVA), lack-of-fit test, and residuals. Table III.4.2
shows that all models are significant (P < 0.05). The variation of the experimental
values can therefore be largely explained by the proposed model at 91 % for WL, 81 %
for SG, and 92 % for AG. Another approach for assessing the quality of model fit is to
corroborate the random distribution of the points in the observed versus predicted plot
for each response (Figure III.4.4), as no trend was observed between the results.
Figure III.4.4. Contour diagrams and observed versus predicted plot for water loss
(WL), sugar gain (SG) and anthocyanin gain (AG) as a function of temperature (T: 30–
70 °C) and sucrose molality (msucrose: 0.0–3.0 mol kg-1
) during osmotic dehydration and
impregnation of green papaya with blackberry juice solution.
As the models were statistically significant (P < 0.05), they were used to plot the
contour diagrams for water loss (WL), sugar gain (SG), and anthocyanin gain (AG) as
functions of processing temperature and sucrose-added molality (Figure III.4.4).
The contour plots show the significant impact that variation in sucrose-added
Temperature (°C)
msu
cro
se (
mo
l k
g-1)
Water loss (kg kg-1
)
36 50 64
0.4
1.5
2.6
0 0.2 0.4 0.6
0.2
0.4
0.6
WL observed
WL p
red
icte
d
Temperature (°C)
msu
cro
se (
mo
l k
g-1)
Sugar gain (kg kg-1
)
36 50 64
0.4
1.5
2.6
0 0.2 0.4
0.2
0.4
SG observed
SG
pre
dic
ted
Temperature (°C)
msu
cro
se (
mo
l k
g-1)
Anthocyanins gain (mg kg-1
)
36 50 64
0.4
1.5
2.6
200 600
200
600
AG observed
AG
pre
dic
ted
0
0.2
0.4
0.6
0.10
0.20
0.30
400
600
10% Variation
10% Variation
10% Variation
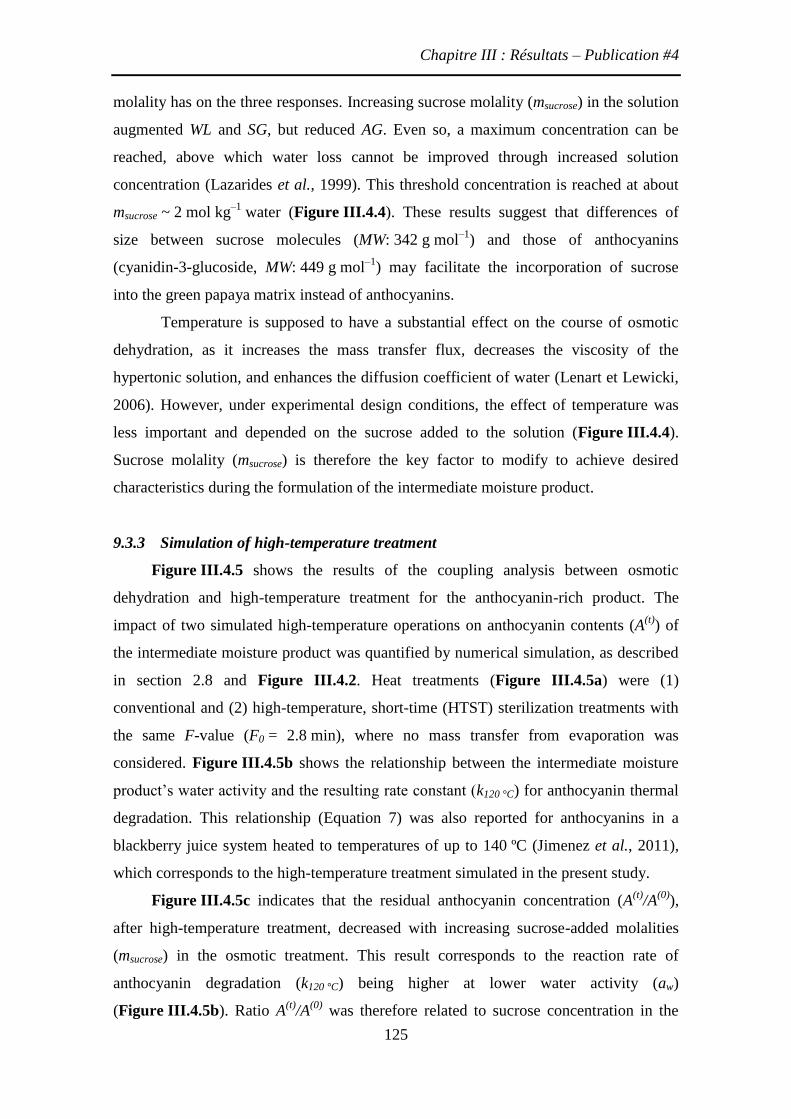
Chapitre III : Résultats – Publication #4
125
molality has on the three responses. Increasing sucrose molality (msucrose) in the solution
augmented WL and SG, but reduced AG. Even so, a maximum concentration can be
reached, above which water loss cannot be improved through increased solution
concentration (Lazarides et al., 1999). This threshold concentration is reached at about
msucrose ~ 2 mol kg–1
water (Figure III.4.4). These results suggest that differences of
size between sucrose molecules (MW: 342 g mol–1
) and those of anthocyanins
(cyanidin-3-glucoside, MW: 449 g mol–1
) may facilitate the incorporation of sucrose
into the green papaya matrix instead of anthocyanins.
Temperature is supposed to have a substantial effect on the course of osmotic
dehydration, as it increases the mass transfer flux, decreases the viscosity of the
hypertonic solution, and enhances the diffusion coefficient of water (Lenart et Lewicki,
2006). However, under experimental design conditions, the effect of temperature was
less important and depended on the sucrose added to the solution (Figure III.4.4).
Sucrose molality (msucrose) is therefore the key factor to modify to achieve desired
characteristics during the formulation of the intermediate moisture product.
9.3.3 Simulation of high-temperature treatment
Figure III.4.5 shows the results of the coupling analysis between osmotic
dehydration and high-temperature treatment for the anthocyanin-rich product. The
impact of two simulated high-temperature operations on anthocyanin contents (A(t)
) of
the intermediate moisture product was quantified by numerical simulation, as described
in section 2.8 and Figure III.4.2. Heat treatments (Figure III.4.5a) were (1)
conventional and (2) high-temperature, short-time (HTST) sterilization treatments with
the same F-value (F0 = 2.8 min), where no mass transfer from evaporation was
considered. Figure III.4.5b shows the relationship between the intermediate moisture
product’s water activity and the resulting rate constant (k120 °C) for anthocyanin thermal
degradation. This relationship (Equation 7) was also reported for anthocyanins in a
blackberry juice system heated to temperatures of up to 140 ºC (Jimenez et al., 2011),
which corresponds to the high-temperature treatment simulated in the present study.
Figure III.4.5c indicates that the residual anthocyanin concentration (A(t)
/A(0)
),
after high-temperature treatment, decreased with increasing sucrose-added molalities
(msucrose) in the osmotic treatment. This result corresponds to the reaction rate of
anthocyanin degradation (k120 °C) being higher at lower water activity (aw)
(Figure III.4.5b). Ratio A(t)
/A(0)
was therefore related to sucrose concentration in the
Chapitre III : Résultats – Publication #4
126
impregnated sample (i.e., SG), because sucrose content determines water activity (aw) in
the intermediate moisture product.
Figure III.4.5d shows the anthocyanin content (A(t)
at mg CGE kg–1
green
papaya) in the sterilized impregnated product, where the anthocyanin-gain values
(AG =A(0)
) were included in the calculation, as described in section 2.8.3. At this point,
the effect of sucrose-added molalities (msucrose) on the resulting anthocyanin
concentration (A(t)
) is even more pronounced, as the initial anthocyanin concentration
(AG = A(0)
) decreases with increasing msucrose (Figure III.4.4). Thus, to obtain high
anthocyanin content (A(t)
> 400 mg CGE kg–1
green papaya) in the sterilized
impregnated product, low sucrose-added molalities (msucrose < 1 mol kg–1
water) must be
formulated for HTST heat treatment, and without sucrose added to the blackberry juice
for conventional sterilization (msucrose = 0 mol kg–1
). Comparisons between high-
temperature treatments show the advantage of using HTST heat treatments for
anthocyanin-rich products to reduce the impact of heat on product quality during
processing.
Figure III.4.5. Effect of two iso-lethal sterilization treatments on the anthocyanin
content of an intermediate product (green papaya impregnated with blackberry juice)
formulated with sucrose added molalities (msucrose) from 0.0 to 3.0 mol kg-1
at 50 °C.
(a) Temperature profiles of sterilization treatments (F0=2.8 min); (b) water activity (aw)
and reaction rate constant (k120°C) of the anthocyanin degradation for the intermediate
moisture product, (c) residual anthocyanin concentration after heat treatment (A(t)
/A(0)
)
and (d) anthocyanin content for each sterilized product (A(t)
).
0 1000 2000
60
100
140
Time (s)
Tem
pera
ture
(ºC
)
(a)
1 2 30
1
2
3x 10
-3
msucrose
(mol kg-1
)
k120°C
(s-1
)
(b)
0.92
0.96
1.00
aw a
t 2
5 °
C
0 1 2 3
0.5
1.0
msucrose
(mol kg-1
)
A(t
) /A(0
)
(c)
0 1 2 3
100
300
500
700
msucrose
(mol kg-1
)
A(t
) (mg
kg-1
GP
)
(d)
Rate constant at 120 °C
Water activity at 25 °C
Conventional
profile
HTST
profile
Chapitre III : Résultats – Publication #4
127
9.4 Conclusions
In light of these observations, to achieve a high-quality food ingredient (i.e., an
anthocyanin-rich product), coupling an osmotic process with high-temperature
treatment would require low sucrose molalities (msucrose < 1 mol kg–1
water) and high
processing temperatures (T > 50 ºC). These would enable osmotic dehydration in
blackberry juice (as a soaking solution), combined with HTST sterilization treatments
for product stabilization.
The methodology developed in this study may be used as a support tool for
product formulation. Hence, in performing an integrated analysis of coupled unit
operations, in this particular case, osmotic dehydration can be feasibly followed by a
high-temperature treatment without mass transfer.
9.5 Acknowledgments
We are grateful to the EU for funding the PAVUC Project (contract No. FP6-
0015279), and to the French Cultural and Cooperation Centre for Central America
(CCCAC, its French acronym) and the University of Costa Rica for their financial
support. We are also grateful to Paula Valverde for her technical assistance.
Chapitre III : Résultats – Publication #5
128
10 Publication #5 : Impact des transferts d’énergie et matière sur la
dégradation des anthocyanes au cours de la friture
Un modèle en 2D, qui intègre les transferts d’énergie et de vapeur et une cinétique
de réaction des anthocyanes, a été développé. La validation du modèle a été réalisée par
comparaison des cinétiques expérimentales et simulés de teneur en eau (W(t)
), teneur en
anthocyanes (A(t)) et les montées en température à cœur et à surface (T
(t)) des chips de
papaye verte imprégnés par DII. Une analyse de sensibilité du modèle a été réalisée afin
d’évaluer l’effet de la variation des dimensions du produit, de la température de l’huile
de friture et des paramètres cinétiques, sur les réponses prédites (T(t)
, W(t)
, A(t)
). Ensuite,
des simulations ont été effectuées pour améliorer la compréhension de la cinétique de la
dégradation des anthocyanes pendant la friture. Enfin, une analyse de couplage entre les
deux opérations unitaires (déshydratation osmotique et la friture) a été réalisée pour les
chips de papaye verte-jus de mûre pour identifier les différentes stratégies qui
permettent de limiter la dégradation des anthocyanes au cours friture. L’association
entre les résultats des simulations du modèle et les résultats expérimentaux suggèrent
que un processus optimal serait celui d’un produit formulé à une molalité de saccharose
ajouté de msaccharose=0,1 kg mol1
, qui après une friture à 140 ºC, va produire des chips
avec une teneur en huile relativement faible (F(t)
=0,30 kg kg1
MSNH, matière sèche
non huileuse) et une teneur en anthocyanes élevée (A(t)
=2013 mg kg1
MSNH).
Toutefois, de l’analyse de validation, il a été constaté que à faibles molalities de
saccharose ajouté (msaccharose~0 kg mol1
), les simulations du modèle de la friture ont
différé des résultats expérimentaux, les profils de température et la cinétique de
dégradation des anthocyanes ont été sous-estimé à ces conditions. C’est pourquoi il est
nécessaire d’inclure la prise d’huile dans le modèle de friture, puis confirmer les
conditions optimales.
Chapitre III : Résultats – Publication #5
129
Impact of Heat and Mass Transfer on Anthocyanin
Degradation during Deep-Fat Frying
Nadiarid Jiméneza, Joseph Bassama
b, Fabrice Vaillant
c and Philippe Bohuon
b,*
En préparation pour soumission au Journal of Food Engineering
a Escuela de Tecnología de Alimentos, Universidad de Costa Rica (UCR), Apartado Postal
11501–2060, San José, Costa Rica
b Montpellier Supagro, UMR QualiSud, 1101 avenue Agropolis, CS 24501, 34093 Montpellier
Cedex 5, France
c Centre de coopération internationale en recherche Agronomique pour le développement
(CIRAD), UMR QualiSud, TA B-95/15, 73 rue Jean François Breton, 34398 Montpellier
Cedex 5, France
*Corresponding author.
Montpellier SupAgro, UMR QualiSud, 1101 avenue Agropolis, CS 24501, 34093 Montpellier
Cedex 5, France
Tel.: +33 467615726; fax: +33 467615728; e-mail: [email protected].
Chapitre III : Résultats – Publication #5
130
Abstract
2D model including heat and vapour transfer and anthocyanin degradation
kinetic was developed. The model was validated against experimental data: temperature
profiles at two positions inside the product (core and surface) (T(t)
), as well as water
content (W(t)
) and anthocyanin content (A(t)
) kinetics for the frying operation of green
papaya-blackberry juice chips formulated by osmotic dehydration. A sensitivity analysis
of the model was performed to assess the effect of the variation of product dimension,
frying temperature and kinetic parameters, on the predicted responses (T(t)
, W(t)
, A(t)
).
Then, simulations were performed to improve the understanding of the anthocyanin
degradation kinetics during frying. Finally, a coupling analysis between the two unit
operations (osmotic dehydration and frying) was conducted for the green papaya-
blackberry juice chips to identify different strategies that allow limiting the anthocyanin
degradation during deep-fat frying. The association of the model simulations with
experimental results, suggest that an optimal process would be for a product formulated
with a molality of sucrose added of msucrose=0.1 kg mol1
, which after a frying process at
140 ºC, will produce chips with relatively low oil content (F(t)
=0.30 kg kg1
NFDB,
non-fat dry basis) and high anthocyanin content (A(t)
=2013 mg kg1
NFDB). However,
from the validation analysis it was found that at low molalities of sucrose added
(msucrose~0 kg mol1
), the simulations of the frying model differed from the experimental
results, both temperature profiles and anthocyanin degradation kinetics were
underestimated under these conditions. Therefore it is necessary to include the oil
uptake in the frying model, and then confirm the optimum conditions.
Keywords: Heat and mass transfer; Modeling; Deep-fat frying; Osmotic dehydration;
Anthocyanin degradation; Blackberry juice.
Chapitre III : Résultats – Publication #5
131
10.1 Introduction
Anthocyanins are water-soluble, natural, red pigments that offer alternatives to
synthetic dyes (Cisse et al., 2009). These compounds are also of interest due to their
potential health benefits (Giusti et Jing, 2007) and antioxidant activity which is high if
compared to other fruits (Fan-Chiang et Wrolstad, 2005). The incorporation of
anthocyanins into a pecto-cellulosic (for instance green papaya) matrix can be achieved
through osmotic dehydration, in order to obtain an anthocyanin-rich product with
intermediate moisture. However, these intermediate moisture products often require
additional treatments either to reduce further water activity or to destroy
microorganisms and increase shelf-life. Hence, osmotic dehydration is often coupled
with a thermal treatment such as pasteurization, sterilization, air-drying, baking and
deep-fat frying, among others (Ikoko et Kuri, 2007; Lenart et Lewicki, 2006).
Most processes at temperatures of more than 100 ºC are inevitably coupled with
mass transfer phenomena, as water present in food evaporates during heat treatment.
Such water loss consequently leads to changes in the product’s water content and aw.
The magnitude and duration of the heat treatment has a strong negative influence on the
stability of most bioactive molecules of interest for healthy food product. This is the
case for anthocyanins that in most cases can be degraded considerably when food are
processed at high temperatures (Patras et al., 2010). Recently, it was reported that high
temperature heat treatments (100 to 140 ºC) combined with decreasing water activity
during process, enhance considerably anthocyanin degradation in blackberry juice
(Rubus adenotrichus) (Jimenez et al., 2011)
Deep-fat frying is defined as the process of cooking foods by soaking them into
edible fat or oil at a temperature above the boiling point of water, usually 120–180 ºC
(Farkas et al., 1996a). Frying is often chosen because of its ability to create unique
flavors and texture in processed foods. It is also a very fast method of food processing
among conventional heat transfer methods. Proper understanding of the mechanisms of
deep-fat frying is important because it forms the basis for the development of predictive
models, saving time and costs of experimentation.
Several authors have proposed numerical models to describe the heat and mass
transport phenomena during deep-fat frying operation (Costa et al., 1999; Farkas et al.,
1996b; Grenier et al., 2010; Moreira et al., 1997; Ni et Datta, 1999; Vitrac et al., 2000;
Yamsaengsung et Moreira, 2002). However, there is yet not much work published on
the development of frying models coupled with reaction kinetic models. Most of them
Chapitre III : Résultats – Publication #5
132
are focused on the study of the acrylamide formation and elimination during frying
(Achir et al., 2008; Bassama et al., 2011; Carrieri et al., 2009; Corradini et Peleg, 2006;
Halder et al., 2007), and others on the ascorbic acid degradation in plantain-based
products (Rojas-Gonzalez, 2007) and protein denaturation in chicken breast coated with
batter (Tangduangdee et al., 2003).
In light of these considerations, the present study aims to assess the impact of the
frying operation on the anthocyanin degradation in green papaya-blackberry juice chips
during coupled treatment of osmotic dehydration and deep-fat frying. Firstly, will be
considered the development of a frying model that describes the coupled transfer (heat
and mass) and anthocyanin degradation kinetic; and secondly the use of numerical
simulations to identify strategies to limit anthocyanin degradation during deep-fat
frying.
Chapitre III : Résultats – Publication #5
133
10.2 Materials and methods
10.2.1 Materials
A native variety of green papaya was harvested at early maturity (white pulp and
seeds) in the Puntarenas Region of Costa Rica. Fully ripe, tropical highland blackberries
were also harvested, in the Cartago Region, Costa Rica (1500 m.a.s.l), and frozen at
20 ºC. The frozen blackberries were then thawed at 5 ºC over 24 h and pressed with a
discontinuous hydraulic press (OTC 25-ton H-frame Hydraulic Shop Press, Series
Y125, Owatonna, MN, USA) to obtain a low turbidity juice at 80 g kg–1
TSS. It was
kept frozen at -18 °C. Initial anthocyanin content for the juice was at A(0)
= 625 ±
18 mg kg–1
juice, expressed as cyanidin-3-glucoside equivalents (CGE); and initial
water content was W(0)
= 0.92 ± 0.01 kg kg–1
juice. Sucrose, the osmotic agent, was
purchased in a local supermarket as granulated cane sugar, refined to food-grade,
commercial quality. The following chemicals were also used: acetone and HPLC-grade
acetonitrile, obtained from JT Baker, Inc. (Phillipsburg, NJ, USA), and 96% formic acid
from Sigma–Aldrich (St. Louis, MO, USA).
10.2.2 Sample preparation and deep-fat frying
Chips were prepared from green papaya discs impregnated with blackberry juice
by osmotic dehydration at three different sucrose molalities (msucrose=0, 1.5 and
3.0 mol kg1
) for 30 min at 50 ºC. The intermediate-moisture product was prepared
according to the procedure described by (Jiménez et al., 2011a). Then, the impregnated
discs were deep-fried in a bath of palm olein (Croydon Fryer, RJ, Brazil). This
equipment has an electrical resistance immersed 3 cm above the bottom of the tank in
order to heat the oil. The oil bath was not agitated and temperature was controlled by a
digital PID controller. An oil-to-sample ratio of 40:1 (w/w) was used to prevent the
temperature drop at the beginning of the unit operation. Thirty-five discs were
uniformly distributed in a metal basket with a grid on top to keep them submerged at the
same depth during frying. The basket was introduced into the oil bath at 140±2 ºC for
varying times of immersion. After treatment, the discs were drained and the oil excess
on the surface was removed with paper towels.
Chapitre III : Résultats – Publication #5
134
10.2.2.1 Temperature measurement inside the product
Core and surface temperature of chips was recorded using 0.25 mm thick K-type
micro-thermocouples (Reference 406-477, TC Direct, Dardilly, France). The
thermocouple was connected to a central data acquisition (Prova® 800, Prova
Instruments Inc., Zhejiang, China) and temperature was recorded at 1 Hz.
10.2.3 Analytical methods
10.2.3.1 Extraction of oil and anthocyanins
A cold oil extraction was performed to avoid anthocyanin degradation. 6 g of
previously homogenized chips were mixed with 150 mL petroleum ether (40-60º) to
extract liposoluble compounds by stirring for 2 min at room temperature using a vortex
mixer at 2000 rpm (Vortex-ZX 3, Velp Scientifica, Italy). The sample was centrifuged
at 5660×g for 10 min (IEC Multi-RF, model 120, Thermo IEC, USA), then phases were
separated. The extraction procedure was repeated three times by adding 50 mL of
petroleum ether on the solid residues, and separating the soluble compounds. The
petroleum ether was evaporated using a rotary evaporator (011 rotor and 461 water
bath; BÜCHI Labortechnik, Flawil, Switzerland) at 40 ºC for 15 min. Traces of ether
were removed by heating in an oven at 70 ºC under reduced pressure for 12 h. The flask
was cooled for 1 h in a desiccator at room temperature, and weighed with an accuracy
of 1 mg. The residual solvent in the solid phase was removed and the defatted sample
was placed in a container protected from light prior to anthocyanins extraction. The
anthocyanins were extracted from the fat-free sample (8 g) according to the procedure
described previously (Jiménez et al., 2011a).
10.2.3.2 Total monomeric anthocyanin content
Total monomeric anthocyanin content (A(t)
) was determined by the pH
differential method (Lee et al., 2005), which had been previously validated by
comparing selected results with the HPLC method (Jimenez et al., 2010). Sample
absorbance was measured at pH 1.0 and 4.5 at wavelengths of maximum absorbance
(510 nm) and at 700 nm to correct for haze. Measurements were performed with a
microplate spectrofluorimeter (Infinite® 200, Tecan France S.A.S., Lyon, France), using
96-well polypropylene plates. Total monomeric anthocyanins were expressed as
cyanidin 3-glucoside equivalents (CGE), the most prevalent anthocyanins which
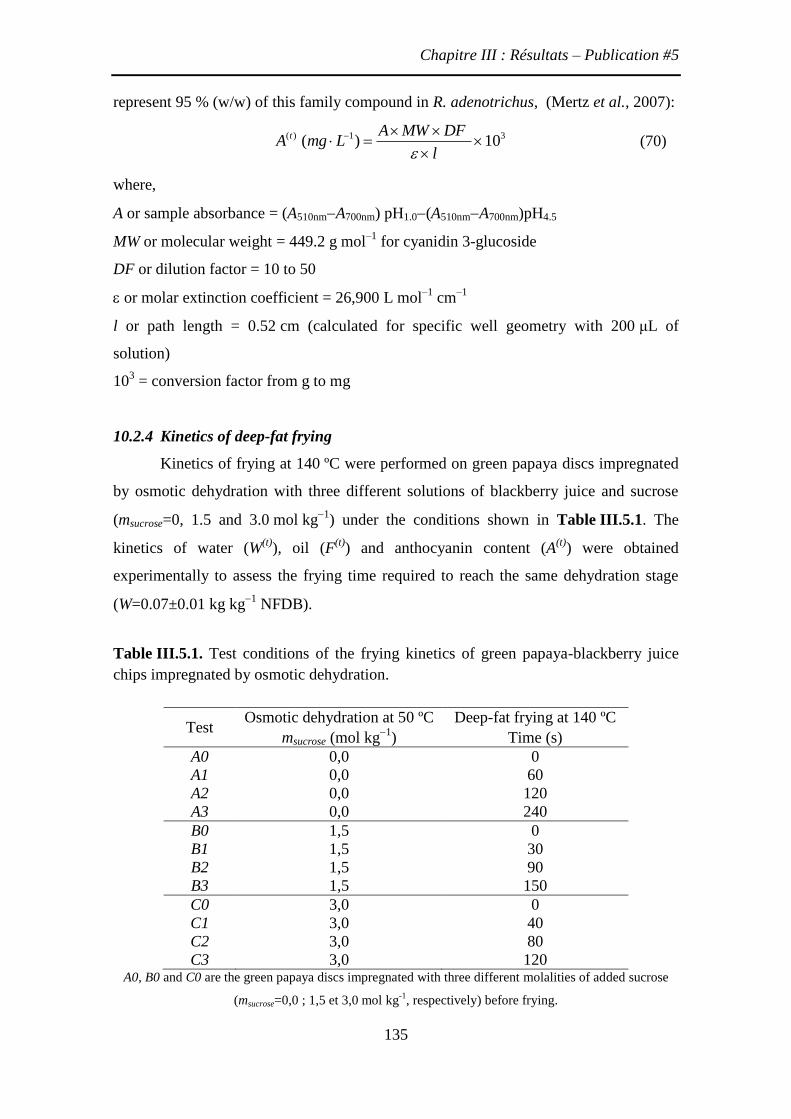
Chapitre III : Résultats – Publication #5
135
represent 95 % (w/w) of this family compound in R. adenotrichus, (Mertz et al., 2007):
( ) 1 3( ) 10t A MW DF
A mg Ll
(70)
where,
A or sample absorbance = (A510nmA700nm) pH1.0(A510nmA700nm)pH4.5
MW or molecular weight = 449.2 g mol–1
for cyanidin 3-glucoside
DF or dilution factor = 10 to 50
or molar extinction coefficient = 26,900 L mol–1
cm–1
l or path length = 0.52 cm (calculated for specific well geometry with 200 μL of
solution)
103 = conversion factor from g to mg
10.2.4 Kinetics of deep-fat frying
Kinetics of frying at 140 ºC were performed on green papaya discs impregnated
by osmotic dehydration with three different solutions of blackberry juice and sucrose
(msucrose=0, 1.5 and 3.0 mol kg1
) under the conditions shown in Table III.5.1. The
kinetics of water (W(t)
), oil (F(t)
) and anthocyanin content (A(t)
) were obtained
experimentally to assess the frying time required to reach the same dehydration stage
(W=0.07±0.01 kg kg1
NFDB).
Table III.5.1. Test conditions of the frying kinetics of green papaya-blackberry juice
chips impregnated by osmotic dehydration.
Test Osmotic dehydration at 50 ºC Deep-fat frying at 140 ºC
msucrose (mol kg1
) Time (s)
A0 0,0 0
A1 0,0 60
A2 0,0 120
A3 0,0 240
B0 1,5 0
B1 1,5 30
B2 1,5 90
B3 1,5 150
C0 3,0 0
C1 3,0 40
C2 3,0 80
C3 3,0 120 A0, B0 and C0 are the green papaya discs impregnated with three different molalities of added sucrose
(msucrose=0,0 ; 1,5 et 3,0 mol kg-1
, respectively) before frying.
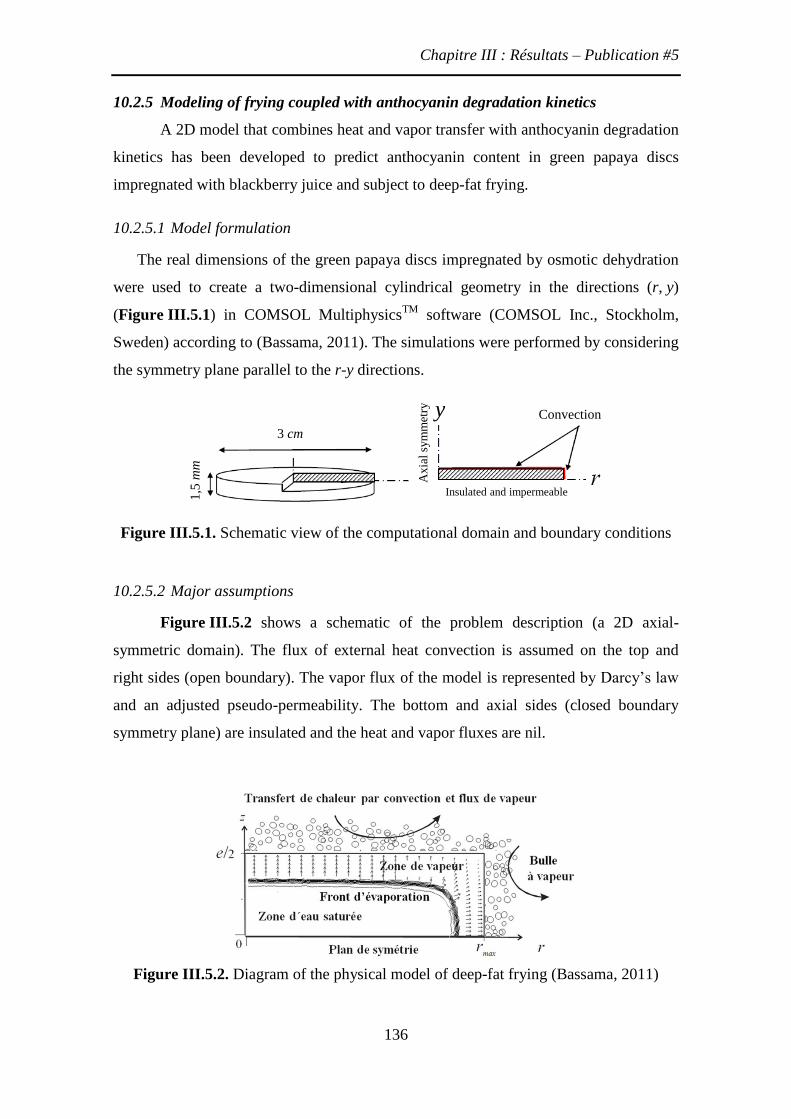
Chapitre III : Résultats – Publication #5
136
10.2.5 Modeling of frying coupled with anthocyanin degradation kinetics
A 2D model that combines heat and vapor transfer with anthocyanin degradation
kinetics has been developed to predict anthocyanin content in green papaya discs
impregnated with blackberry juice and subject to deep-fat frying.
10.2.5.1 Model formulation
The real dimensions of the green papaya discs impregnated by osmotic dehydration
were used to create a two-dimensional cylindrical geometry in the directions (r, y)
(Figure III.5.1) in COMSOL MultiphysicsTM
software (COMSOL Inc., Stockholm,
Sweden) according to (Bassama, 2011). The simulations were performed by considering
the symmetry plane parallel to the r-y directions.
Figure III.5.1. Schematic view of the computational domain and boundary conditions
10.2.5.2 Major assumptions
Figure III.5.2 shows a schematic of the problem description (a 2D axial-
symmetric domain). The flux of external heat convection is assumed on the top and
right sides (open boundary). The vapor flux of the model is represented by Darcy’s law
and an adjusted pseudo-permeability. The bottom and axial sides (closed boundary
symmetry plane) are insulated and the heat and vapor fluxes are nil.
Figure III.5.2. Diagram of the physical model of deep-fat frying (Bassama, 2011)
3 cm
1,5
mm
Insulated and impermeable
yA
xia
l sy
mm
etry Convection
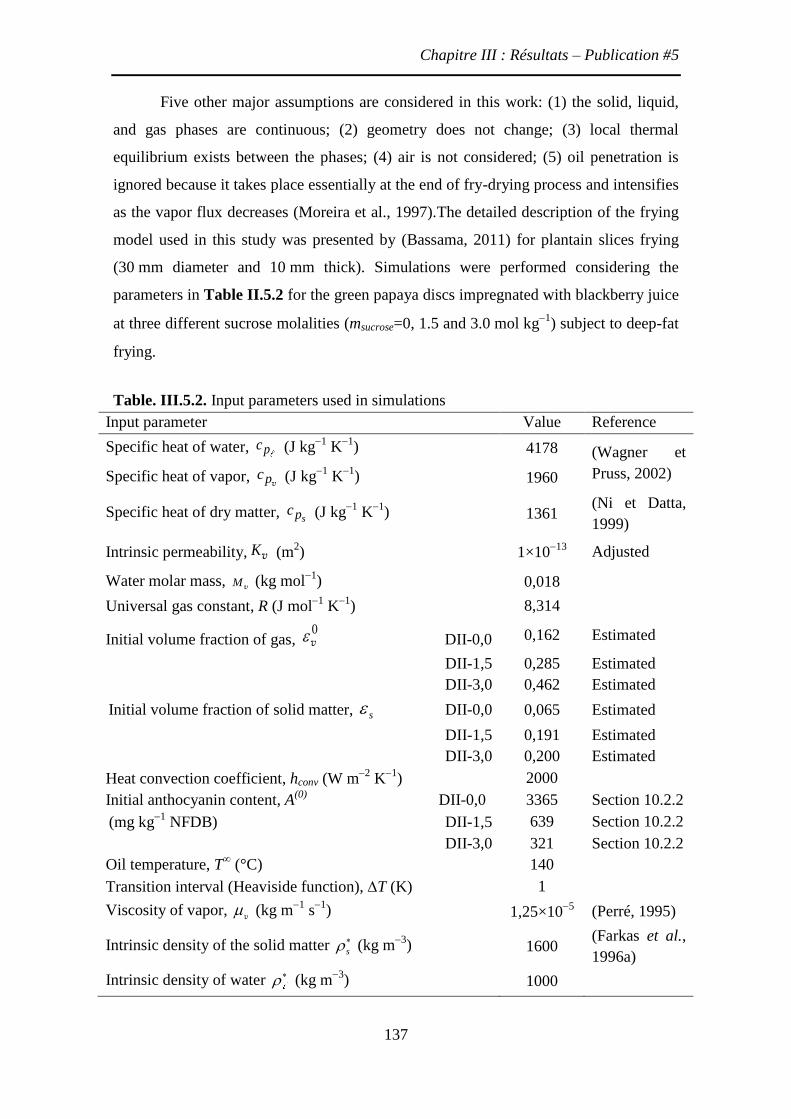
Chapitre III : Résultats – Publication #5
137
Five other major assumptions are considered in this work: (1) the solid, liquid,
and gas phases are continuous; (2) geometry does not change; (3) local thermal
equilibrium exists between the phases; (4) air is not considered; (5) oil penetration is
ignored because it takes place essentially at the end of fry-drying process and intensifies
as the vapor flux decreases (Moreira et al., 1997).The detailed description of the frying
model used in this study was presented by (Bassama, 2011) for plantain slices frying
(30 mm diameter and 10 mm thick). Simulations were performed considering the
parameters in Table II.5.2 for the green papaya discs impregnated with blackberry juice
at three different sucrose molalities (msucrose=0, 1.5 and 3.0 mol kg1
) subject to deep-fat
frying.
Table. III.5.2. Input parameters used in simulations
Input parameter Value Reference
Specific heat of water, pc (J kg1
K1
) 4178 (Wagner et
Pruss, 2002) Specific heat of vapor, pcv (J kg
1 K
1) 1960
Specific heat of dry matter, spc (J kg
1 K
1) 1361
(Ni et Datta,
1999)
Intrinsic permeability, Kv (m2) 1×10
13 Adjusted
Water molar mass, Mv (kg mol1
) 0,018
Universal gas constant, R (J mol1
K1
) 8,314
Initial volume fraction of gas, 0v DII-0,0 0,162 Estimated
DII-1,5 0,285 Estimated
DII-3,0 0,462 Estimated
Initial volume fraction of solid matter, s DII-0,0 0,065 Estimated
DII-1,5 0,191 Estimated
DII-3,0 0,200 Estimated
Heat convection coefficient, hconv (W m2
K1
) 2000
Initial anthocyanin content, A(0)
DII-0,0 3365 Section 10.2.2
(mg kg1
NFDB) DII-1,5 639 Section 10.2.2
DII-3,0 321 Section 10.2.2
Oil temperature, T∞ (°C) 140
Transition interval (Heaviside function), T (K) 1
Viscosity of vapor, v (kg m1
s1
) 1,25×10⁵
(Perré, 1995)
Intrinsic density of the solid matter s (kg m
3) 1600
(Farkas et al.,
1996a)
Intrinsic density of water (kg m3
) 1000
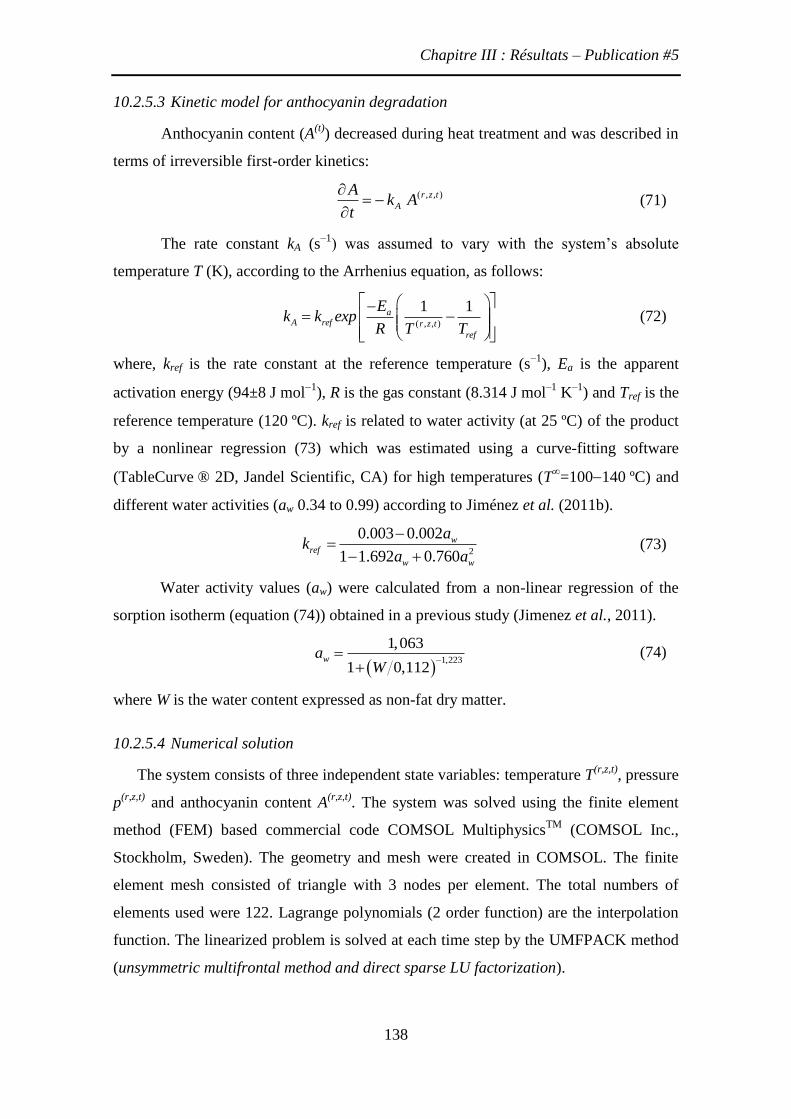
Chapitre III : Résultats – Publication #5
138
10.2.5.3 Kinetic model for anthocyanin degradation
Anthocyanin content (A(t)
) decreased during heat treatment and was described in
terms of irreversible first-order kinetics:
( , , )r z t
A
Ak A
t
(71)
The rate constant kA (s–1) was assumed to vary with the system’s absolute
temperature T (K), according to the Arrhenius equation, as follows:
( , , )
1 1aref r z t
ref
A
Ek k exp
R T T
(72)
where, kref is the rate constant at the reference temperature (s–1
), Ea is the apparent
activation energy (94±8 J mol1
), R is the gas constant (8.314 J mol–1
K–1
) and Tref is the
reference temperature (120 ºC). kref is related to water activity (at 25 ºC) of the product
by a nonlinear regression (73) which was estimated using a curve-fitting software
(TableCurve ® 2D, Jandel Scientific, CA) for high temperatures (T∞=100140 ºC) and
different water activities (aw 0.34 to 0.99) according to Jiménez et al. (2011b).
2
0.003 0.002
1 1.692 0.760
wref
w w
ak
a a
(73)
Water activity values (aw) were calculated from a non-linear regression of the
sorption isotherm (equation (74)) obtained in a previous study (Jimenez et al., 2011).
1,223
1,063
1 0,112wa
W
(74)
where W is the water content expressed as non-fat dry matter.
10.2.5.4 Numerical solution
The system consists of three independent state variables: temperature T(r,z,t)
, pressure
p(r,z,t)
and anthocyanin content A(r,z,t)
. The system was solved using the finite element
method (FEM) based commercial code COMSOL MultiphysicsTM
(COMSOL Inc.,
Stockholm, Sweden). The geometry and mesh were created in COMSOL. The finite
element mesh consisted of triangle with 3 nodes per element. The total numbers of
elements used were 122. Lagrange polynomials (2 order function) are the interpolation
function. The linearized problem is solved at each time step by the UMFPACK method
(unsymmetric multifrontal method and direct sparse LU factorization).
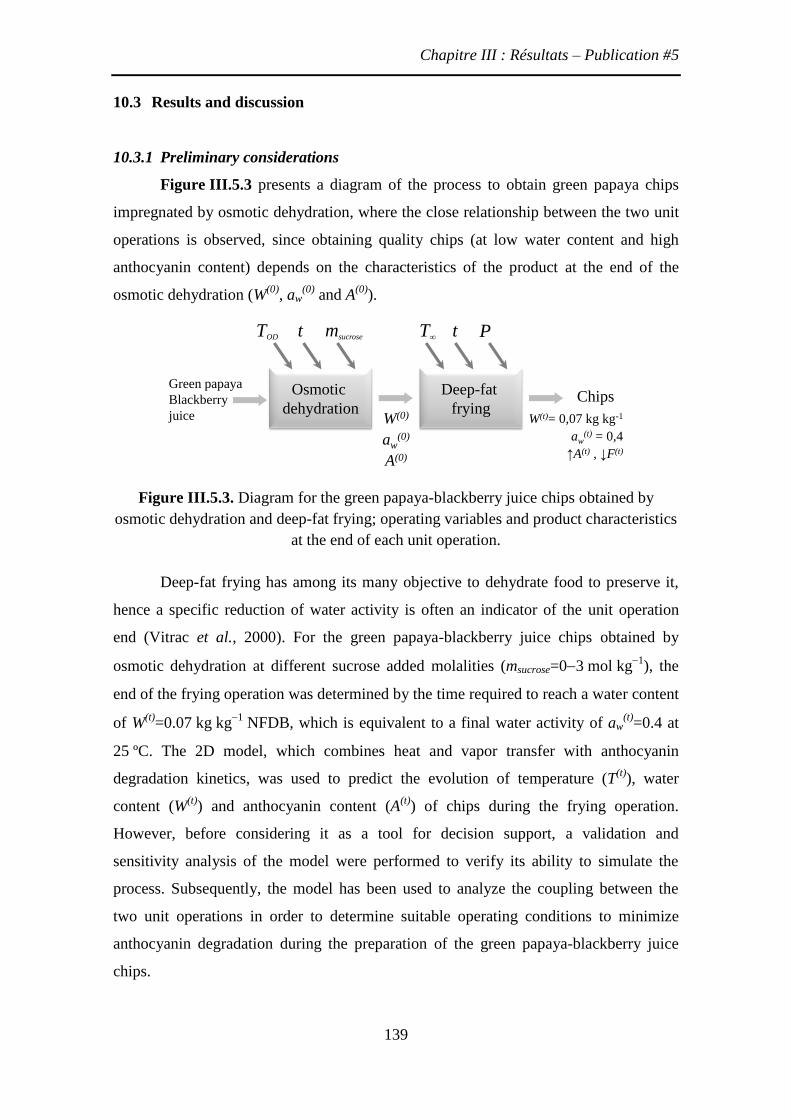
Chapitre III : Résultats – Publication #5
139
10.3 Results and discussion
10.3.1 Preliminary considerations
Figure III.5.3 presents a diagram of the process to obtain green papaya chips
impregnated by osmotic dehydration, where the close relationship between the two unit
operations is observed, since obtaining quality chips (at low water content and high
anthocyanin content) depends on the characteristics of the product at the end of the
osmotic dehydration (W(0)
, aw(0)
and A(0)
).
Figure III.5.3. Diagram for the green papaya-blackberry juice chips obtained by
osmotic dehydration and deep-fat frying; operating variables and product characteristics
at the end of each unit operation.
Deep-fat frying has among its many objective to dehydrate food to preserve it,
hence a specific reduction of water activity is often an indicator of the unit operation
end (Vitrac et al., 2000). For the green papaya-blackberry juice chips obtained by
osmotic dehydration at different sucrose added molalities (msucrose=03 mol kg1
), the
end of the frying operation was determined by the time required to reach a water content
of W(t)
=0.07 kg kg1
NFDB, which is equivalent to a final water activity of aw(t)
=0.4 at
25 ºC. The 2D model, which combines heat and vapor transfer with anthocyanin
degradation kinetics, was used to predict the evolution of temperature (T(t)
), water
content (W(t)
) and anthocyanin content (A(t)
) of chips during the frying operation.
However, before considering it as a tool for decision support, a validation and
sensitivity analysis of the model were performed to verify its ability to simulate the
process. Subsequently, the model has been used to analyze the coupling between the
two unit operations in order to determine suitable operating conditions to minimize
anthocyanin degradation during the preparation of the green papaya-blackberry juice
chips.
W(t)= 0,07 kg kg-1
aw(t) = 0,4
↑A(t) , ↓F(t)
TOD msucroset T∞ t P
Osmotic
dehydration
Deep-fat
frying
Green papaya
Blackberry
juice
Chips
W(0)
aw(0)
A(0)
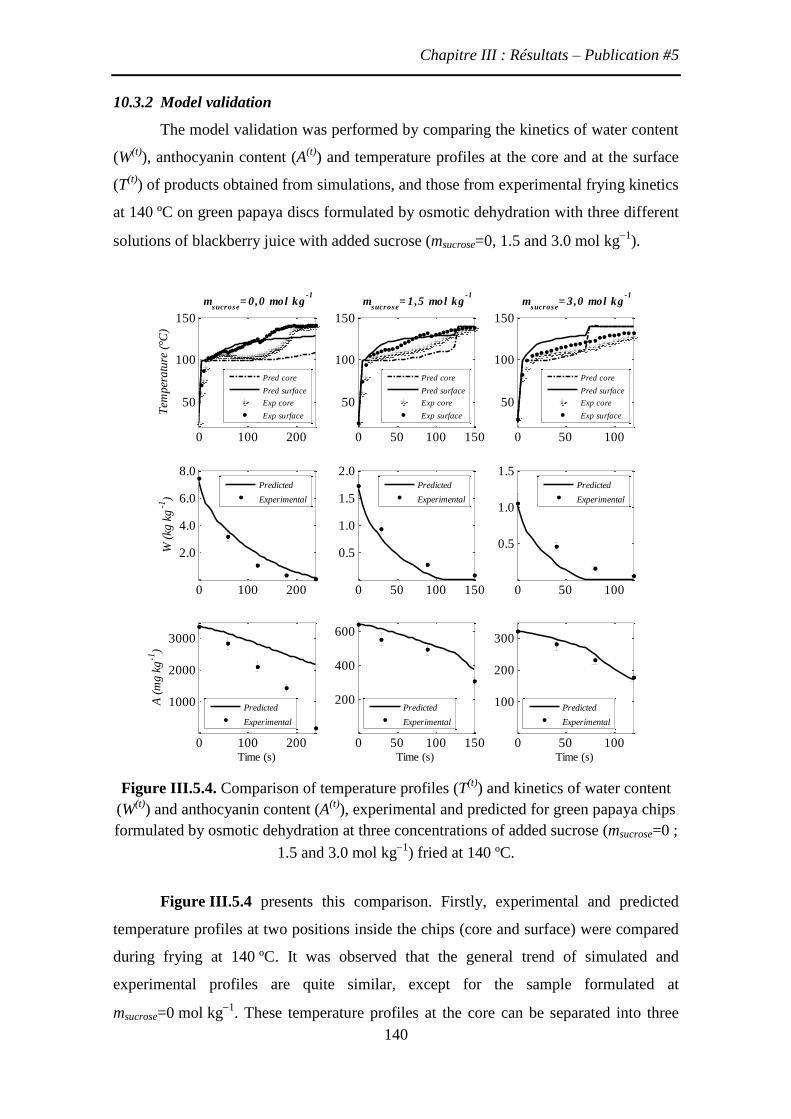
Chapitre III : Résultats – Publication #5
140
10.3.2 Model validation
The model validation was performed by comparing the kinetics of water content
(W(t)
), anthocyanin content (A(t)
) and temperature profiles at the core and at the surface
(T(t)
) of products obtained from simulations, and those from experimental frying kinetics
at 140 ºC on green papaya discs formulated by osmotic dehydration with three different
solutions of blackberry juice with added sucrose (msucrose=0, 1.5 and 3.0 mol kg1
).
Figure III.5.4. Comparison of temperature profiles (T(t)
) and kinetics of water content
(W(t)
) and anthocyanin content (A(t)
), experimental and predicted for green papaya chips
formulated by osmotic dehydration at three concentrations of added sucrose (msucrose=0 ;
1.5 and 3.0 mol kg1
) fried at 140 ºC.
Figure III.5.4 presents this comparison. Firstly, experimental and predicted
temperature profiles at two positions inside the chips (core and surface) were compared
during frying at 140 ºC. It was observed that the general trend of simulated and
experimental profiles are quite similar, except for the sample formulated at
msucrose=0 mol kg1
. These temperature profiles at the core can be separated into three
0 100 200
50
100
150
msucrose
= 0,0 mol kg-1
Tem
per
atu
re (
°C)
Pred core
Pred surface
Exp core
Exp surface
0 50 100 150
50
100
150
msucrose
= 1,5 mol kg-1
Pred core
Pred surface
Exp core
Exp surface
0 50 100
50
100
150
msucrose
= 3,0 mol kg-1
Pred core
Pred surface
Exp core
Exp surface
0 100 200
2.0
4.0
6.0
8.0
W (
kg k
g-1
)
Predicted
Experimental
0 50 100 150
0.5
1.0
1.5
2.0
Predicted
Experimental
0 50 100
0.5
1.0
1.5
Predicted
Experimental
0 100 200
1000
2000
3000
Time (s)
A (
mg k
g-1
)
Predicted
Experimental
0 50 100 150
200
400
600
Time (s)
Predicted
Experimental
0 50 100
100
200
300
Time (s)
Predicted
Experimental
Chapitre III : Résultats – Publication #5
141
stages (Vitrac et al., 2000). The first stage corresponds to the temperature rise in the
product before boiling, which was almost instantaneous for the three samples (t <10 s);
however, this predicted temperature rise was more rapidly than the experimental profile.
The second stage presents the stabilization at the saturation temperature (Tsat), which
was modified by the presence of solutes (sucrose) in the samples formulated at
msucrose=1.5 and 3.0 mol kg1
, causing an increase in Tsat. The third stage corresponds to
a gradual temperature rise of the hygroscopic zone with time, where the greatest
differences were observed between the experimental and predicted profiles due to the
cumulative effect of the previous stages. These differences could also be due to the
difficulty of accurately locate and hold the thermocouple in the center and surface of the
chips (1.5 mm thick) during the frying operation.
The average water content (( )tW ) was calculated by numerical integration of the
moisture profile at each time step. The average content (( )tW ) was then compared with
the experimental data. The water content decreased considerably at the beginning of the
process, for the first two stages in which the free water was evaporated on the surface
and inside the product following a vaporization front (Achir et al., 2008). Then, the
drying rate decreased as the product reached the oil temperature (T∞). In general, the
data was predicted in good agreement with the experimental values.
Finally, Figure III.5.4 presents the kinetics of average anthocyanin content
( ( )tA ) as function of frying time, for all three products (msucrose=0 ; 1.5 and
3.0 mol kg1
). The reduction in anthocyanin content was well represented by a first-
order kinetic model developed previously (Jiménez et al., 2011b), which was coupled to
a heat and vapor transfer model. Only the msucrose=0 mol kg1
sample, showed
significant differences with the experimental data, in fact the predicted temperature
profile for this sample was systematically below the experimental one; as a result the
predicted anthocyanin degradation was underestimated.
These differences may be explained by the oil incorporation in the food matrix
during frying, a transfer process that was not considered in the frying model. In fact
20 % of the total oil adsorbed by the product penetrates during frying (Moreira et al.,
1997). This oil uptake may be involved during the temperature rise of the product,
allowing a high temperature gradient between the humid and hygroscopic zones.
Figure III.5.5 shows the experimental relationship between oil content (F) and water
loss (W(0)W
(t)) for green papaya-blackberry juice chips during frying operation at

Chapitre III : Résultats – Publication #5
142
140 ºC.
Figure III.5.5. Oil content (F(t)
) as a function of water loss (W(0)W
(t)) during frying at
140 ºC for green papaya-blackberry juice chips
These results confirm the previous explanation, where the msucrose=0 mol kg1
sample (W(0)W
(t)=7.4 kg kg
1 NFDB) presents the greatest oil uptake
(F(t)
=1.5 kg kg1
NFDB) during frying and, therefore, is the one that differs from the
model assumption (oil uptake has been ignored). The other two samples (msucrose=1.5
and 3.0 mol kg1
) were not affected, as the maximum oil content were F(t)
=0.06 and
0.03 kg kg1
NFDB, respectively.
Figure III.5.6. Experimental frying kinetic at 140 ºC for green papaya-blackberry juice
chips formulated by osmotic dehydration with three concentrations of added sucrose
(msucrose=0, 1.5 and 3.0 mol kg1
)
Moreover, the chips obtained with green papaya formulated without sucrose
0.0
0.5
1.0
1.5
2.0
2.5
0.0 2.0 4.0 6.0 8.0
F (
kg o
il k
g-1
NF
DM
)
W(0)-W(t) (kg water kg-1 NFDM)
Predicted
Experimental
(0) ( )
(0) ( )
0,006 0,010
1 0,128
t
t
W WF
W W
msucrose=
0,0 mol kg-1
msucrose=
1,5 mol kg-1
msucrose=
3,0 mol kg-1
Osmotic dehydration
at 50 ºC
Deep-fat frying at 140 ºC
t=60 s t=120 s t=240 s
t=30 s t=90 s t=150 s
t=40 s t=80 s t=120 s
Chapitre III : Résultats – Publication #5
143
(msucrose=0 mol kg1
) were burned after 240 s in the oil bath (Figure III.5.6). This result
shows the need of a pre-dehydration of the formulated green papaya before frying
operation, in order to reach low water activity (aw = 0.4) during frying, without burning
the chips. However, the validation for the other two products (msucrose=1.5 and
3.0 mol kg1
) seems to confirm the hypothesis that the behavior of anthocyanins in
green papaya formulated by osmotic dehydration is very similar to a model system
(blackberry juiceFontainebleau sand) (Jiménez et al., 2011b), which suggests no
significant effect of the pecto-cellulosic matrix (green papaya). Finally, the model at
msucrose=1.5 mol kg1
was chosen to perform the sensitivity analysis of the model.
10.3.3 Sensitivity analysis of the model
10.3.3.1 Dimensions of fried products
The sensitivity analysis of the model to variations in size of fried products was
performed by varying the thickness of the geometry (half-thickness of chips) of ± 20 %.
Figure III.5.7 presents the comparison of the kinetics of water content (W(t)
),
anthocyanin content (A(t)
) and temperature profiles at the core and surface (T(t)
) of the
chips, obtained from simulations for each dimension (zoriginal=7.5×10⁴
m,
z20%=6.0×10⁴
m and z+20%=9.0×10⁴
m). The product zone where temperature was
higher than Tsat and liquid water content was negligible, was considered the “surface”
(Farkas et al., 1996b).
Firstly, temperature profiles show the significant effect of dimension changes on
heat transfer. In standard chips (1.5 mm thick, zoriginal=7.5×10⁴
m) the core was
maintained at saturation phase up to 110 s, whereas the product of reduced thickness
(z20%=6.0×10⁴
m), reached the hygroscopic phase after 60 s, and the thicker product
(z+20%=9.0×10⁴
m) was remained at saturation temperature throughout the treatment.
Evidently, the above has an effect on the water content profile; for example, the
standard chips presented a frying time of 105 s (time to reach an average moisture
content of W(t)
=0.07 kg kg1
NFDB), whereas a frying time of 60 s and 140 s where
obtained when the dimensions were changed of 20 % and +20 %, respectively. This
means that a reduction or an increase of 20% of chips thickness respectively decreases
or increases the frying time by 40 %.. For cassava chips, a reduction of 50 % of the
initial thickness (1.5 mm) reduced the frying time by half (Vitrac et al., 2002).
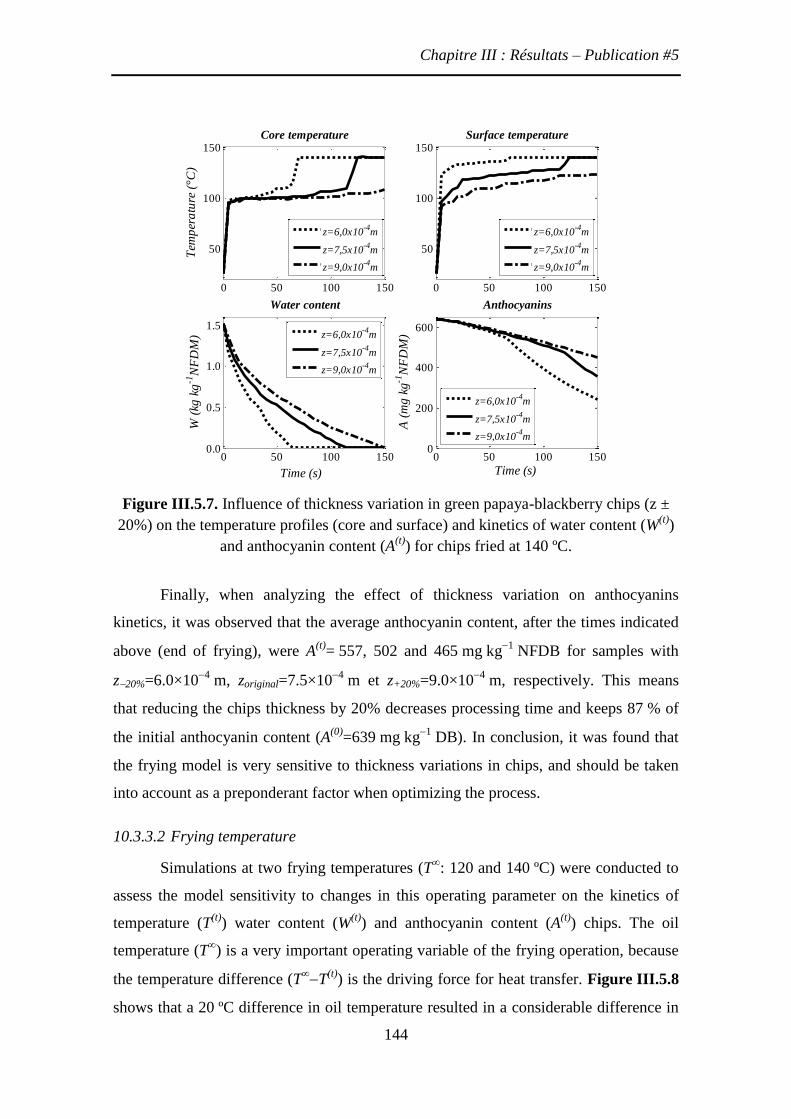
Chapitre III : Résultats – Publication #5
144
Figure III.5.7. Influence of thickness variation in green papaya-blackberry chips (z ±
20%) on the temperature profiles (core and surface) and kinetics of water content (W(t)
)
and anthocyanin content (A(t)
) for chips fried at 140 ºC.
Finally, when analyzing the effect of thickness variation on anthocyanins
kinetics, it was observed that the average anthocyanin content, after the times indicated
above (end of frying), were A(t)
= 557, 502 and 465 mg kg1
NFDB for samples with
z20%=6.0×10⁴
m, zoriginal=7.5×10⁴
m et z+20%=9.0×10⁴
m, respectively. This means
that reducing the chips thickness by 20% decreases processing time and keeps 87 % of
the initial anthocyanin content (A(0)
=639 mg kg1
DB). In conclusion, it was found that
the frying model is very sensitive to thickness variations in chips, and should be taken
into account as a preponderant factor when optimizing the process.
10.3.3.2 Frying temperature
Simulations at two frying temperatures (T∞: 120 and 140 ºC) were conducted to
assess the model sensitivity to changes in this operating parameter on the kinetics of
temperature (T(t)
) water content (W(t)
) and anthocyanin content (A(t)
) chips. The oil
temperature (T∞) is a very important operating variable of the frying operation, because
the temperature difference (T∞T
(t)) is the driving force for heat transfer. Figure III.5.8
shows that a 20 ºC difference in oil temperature resulted in a considerable difference in
0 50 100 150
50
100
150 Core temperature
Tem
per
atu
re (
°C)
z=6,0x10⁻⁴
m
z=7,5x10⁻⁴
m
z=9,0x10⁻⁴
m
0 50 100 150
50
100
150 Surface temperature
Time (s)
z=6,0x10⁻⁴
m
z=7,5x10⁻⁴
m
z=9,0x10⁻⁴
m
0 50 100 1500.0
0.5
1.0
1.5
Water content
W (
kg k
g-1
NF
DM
)
z=6,0x10⁻⁴
m
z=7,5x10⁻⁴
m
z=9,0x10⁻⁴
m
0 50 100 1500
200
400
600
Anthocyanins
Time (s)
A (
mg
kg
-1N
FD
M)
z=6,0x10⁻⁴
m
z=7,5x10⁻⁴
m
z=9,0x10⁻⁴
m
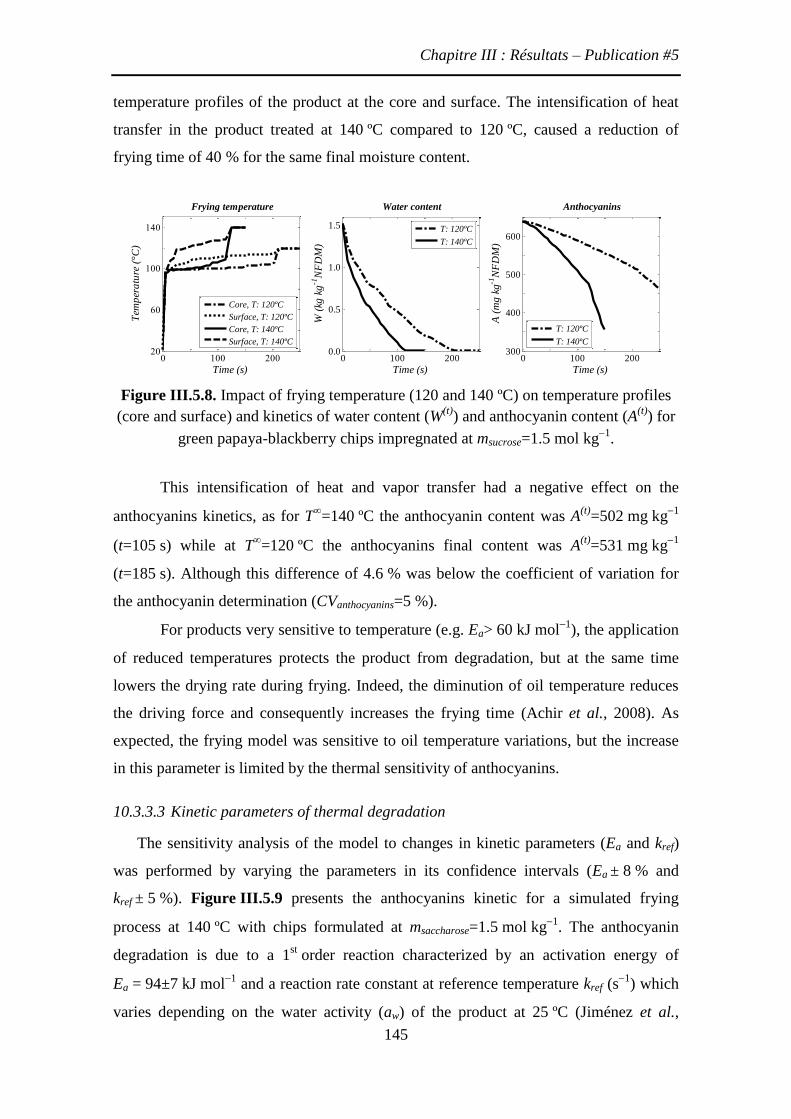
Chapitre III : Résultats – Publication #5
145
temperature profiles of the product at the core and surface. The intensification of heat
transfer in the product treated at 140 ºC compared to 120 ºC, caused a reduction of
frying time of 40 % for the same final moisture content.
Figure III.5.8. Impact of frying temperature (120 and 140 ºC) on temperature profiles
(core and surface) and kinetics of water content (W(t)
) and anthocyanin content (A(t)
) for
green papaya-blackberry chips impregnated at msucrose=1.5 mol kg1
.
This intensification of heat and vapor transfer had a negative effect on the
anthocyanins kinetics, as for T∞=140 ºC the anthocyanin content was A
(t)=502 mg kg
1
(t=105 s) while at T∞=120 ºC the anthocyanins final content was A
(t)=531 mg kg
1
(t=185 s). Although this difference of 4.6 % was below the coefficient of variation for
the anthocyanin determination (CVanthocyanins=5 %).
For products very sensitive to temperature (e.g. Ea> 60 kJ mol1
), the application
of reduced temperatures protects the product from degradation, but at the same time
lowers the drying rate during frying. Indeed, the diminution of oil temperature reduces
the driving force and consequently increases the frying time (Achir et al., 2008). As
expected, the frying model was sensitive to oil temperature variations, but the increase
in this parameter is limited by the thermal sensitivity of anthocyanins.
10.3.3.3 Kinetic parameters of thermal degradation
The sensitivity analysis of the model to changes in kinetic parameters (Ea and kref)
was performed by varying the parameters in its confidence intervals (Ea ± 8 % and
kref ± 5 %). Figure III.5.9 presents the anthocyanins kinetic for a simulated frying
process at 140 ºC with chips formulated at msaccharose=1.5 mol kg1
. The anthocyanin
degradation is due to a 1st order reaction characterized by an activation energy of
Ea = 94±7 kJ mol1
and a reaction rate constant at reference temperature kref (s1
) which
varies depending on the water activity (aw) of the product at 25 ºC (Jiménez et al.,
0 100 20020
60
100
140
Frying temperature
Time (s)
Tem
per
atu
re (
°C)
Core, T: 120ºC
Surface, T: 120ºC
Core, T: 140ºC
Surface, T: 140ºC
0 100 2000.0
0.5
1.0
1.5
Water content
Time (s)
W (
kg k
g-1
NF
DM
)
T: 120ºC
T: 140ºC
0 100 200300
400
500
600
Anthocyanins
Time (s)
A (
mg
kg
-1N
FD
M)
T: 120ºC
T: 140ºC

Chapitre III : Résultats – Publication #5
146
2011b).
Figure III.5.9. Impact of kinetic parameters (Ea and kref) variation on the anthocyanin
degradation kinetics of green papaya chips formulated at msucrose=1.5 mol kg1
and fried
at 140 ºC
The Ea variation in its confidence limits (± 8 %) caused an A(t)
maximum variation
of 12% at t=150 s, this value was slightly higher than the obtained for the variation of
kref (± 5 % ) with a maximum of 8 % for the same time. The largest deviations were
observed when the product exceeds the saturation temperature (t > 110 s). However, for
a frying time of 150 s at 140 ºC (time to reach W(t)
=0,07 kg kg1
), the anthocyanin
content variation caused by the modified parameters (Ea ± 8 % and kref ± 5 %) was not
significant (~ 1 %) because it was less than the coefficient of variation for the
anthocyanin determination (CVanthocyanins= 5 %). In contrast with previous analysis, the
variation of the kinetic parameters (Ea and kref) did not significantly change the
anthocyanin degradation kinetics.
10.3.4 Understanding the anthocyanin degradation mechanisms during frying
10.3.4.1 Spatial distribution of anthocyanin degradation
Figure III.5.10 shows the temperature profiles and anthocyanin degradation
kinetics simulated in the surface and in the core of chips. Regardless of the frying
conditions, the anthocyanin loss was higher in the peripheral zone than in the center
area. Both zones were characterized by very different temperature profiles. The core
remained predominantly at saturation temperature (Tsat), while the surface, more
hygroscopic, followed a gradual increase in temperature from Tsat at T∞.
0.2 0.4 0.6 0.8 1.0
1
2
3
4
5
kref
= f(aw
)
Water activity at 25 ºC
kre
f (s-1
)
kref
-5%
kref
= f(aw
)
kref
+5%
0 50 100 150200
400
600
kref
(s-1
)
Time (s)
A (
mg
kg
-1N
FD
M)
kref
-5%
kref
= f(aw)
kref
+5%
Experimental
0 50 100 150200
400
600
Ea (kJ mol
-1)
Time (s)
A (
mg
kg
-1N
FD
M)
Ea -8%
Ea= 94 kJ mol
-1
Ea +8%
Experimental
x10-3
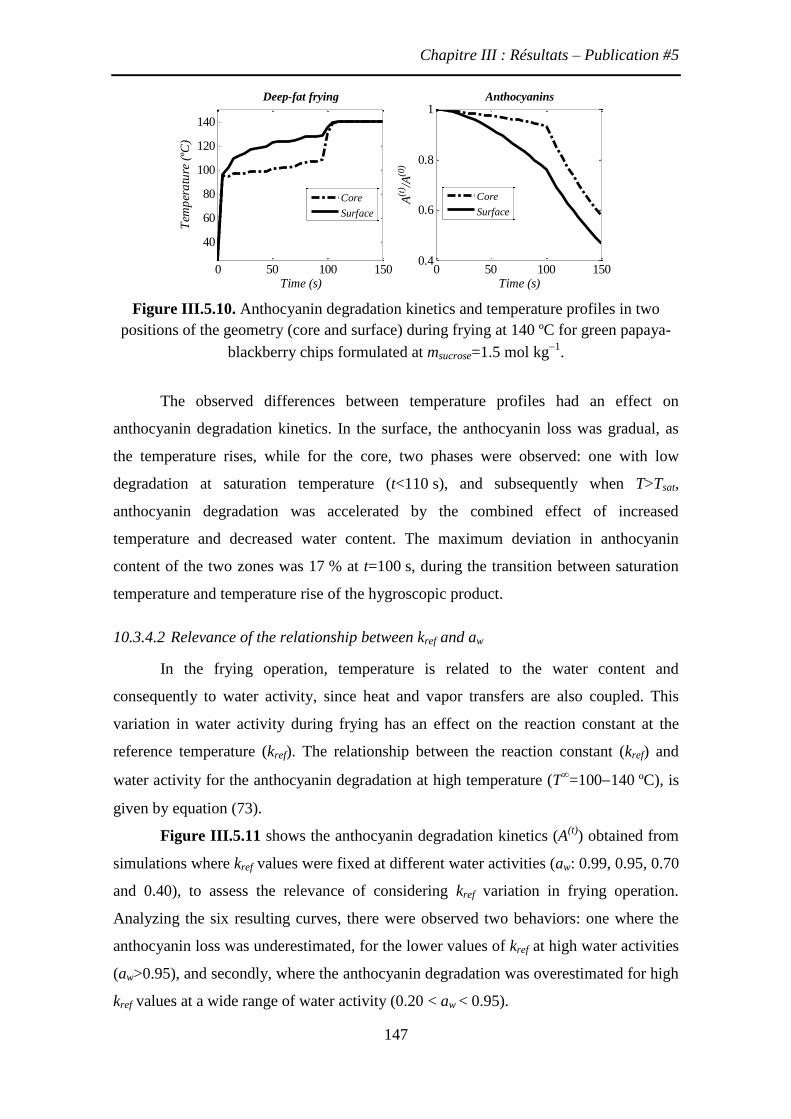
Chapitre III : Résultats – Publication #5
147
Figure III.5.10. Anthocyanin degradation kinetics and temperature profiles in two
positions of the geometry (core and surface) during frying at 140 ºC for green papaya-
blackberry chips formulated at msucrose=1.5 mol kg1
.
The observed differences between temperature profiles had an effect on
anthocyanin degradation kinetics. In the surface, the anthocyanin loss was gradual, as
the temperature rises, while for the core, two phases were observed: one with low
degradation at saturation temperature (t<110 s), and subsequently when T>Tsat,
anthocyanin degradation was accelerated by the combined effect of increased
temperature and decreased water content. The maximum deviation in anthocyanin
content of the two zones was 17 % at t=100 s, during the transition between saturation
temperature and temperature rise of the hygroscopic product.
10.3.4.2 Relevance of the relationship between kref and aw
In the frying operation, temperature is related to the water content and
consequently to water activity, since heat and vapor transfers are also coupled. This
variation in water activity during frying has an effect on the reaction constant at the
reference temperature (kref). The relationship between the reaction constant (kref) and
water activity for the anthocyanin degradation at high temperature (T∞=100140 ºC), is
given by equation (73).
Figure III.5.11 shows the anthocyanin degradation kinetics (A(t)
) obtained from
simulations where kref values were fixed at different water activities (aw: 0.99, 0.95, 0.70
and 0.40), to assess the relevance of considering kref variation in frying operation.
Analyzing the six resulting curves, there were observed two behaviors: one where the
anthocyanin loss was underestimated, for the lower values of kref at high water activities
(aw>0.95), and secondly, where the anthocyanin degradation was overestimated for high
kref values at a wide range of water activity (0.20 < aw < 0.95).
0 50 100 150
40
60
80
100
120
140
Time (s)
Tem
per
atu
re (
ºC)
Deep-fat frying
Core
Surface
0 50 100 1500.4
0.6
0.8
1
Time (s)
A(t
) /A(0
)
Anthocyanins
Core
Surface
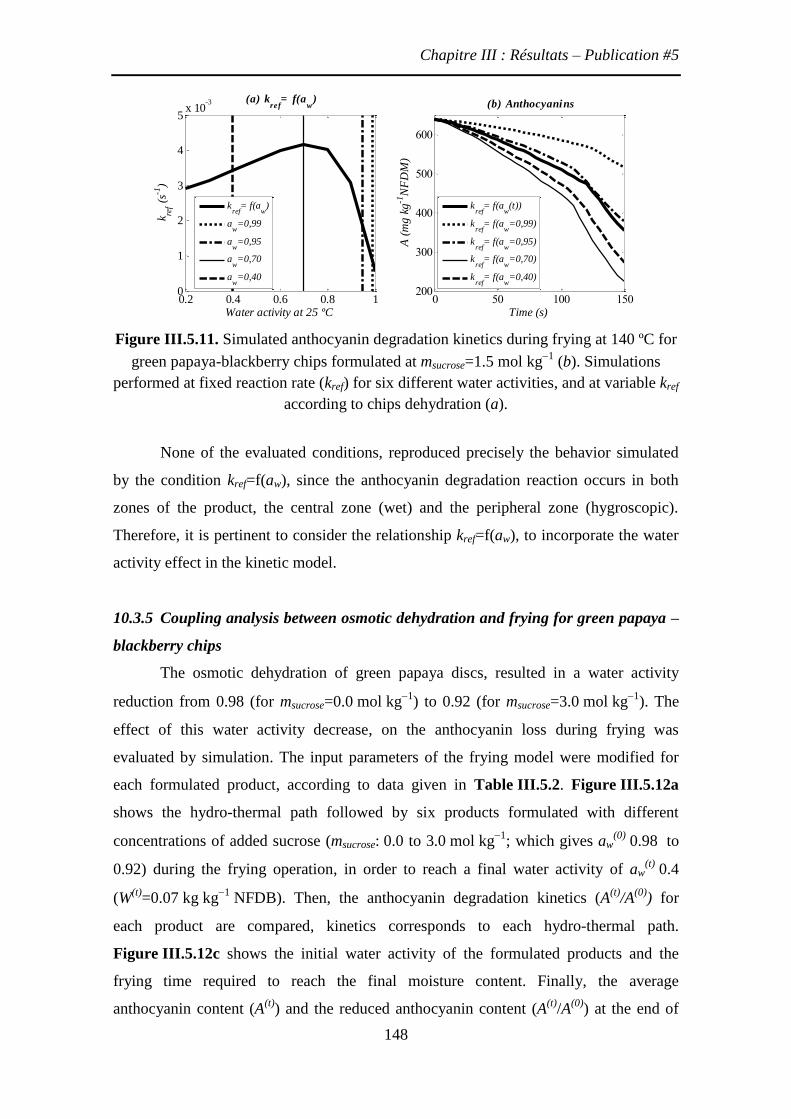
Chapitre III : Résultats – Publication #5
148
Figure III.5.11. Simulated anthocyanin degradation kinetics during frying at 140 ºC for
green papaya-blackberry chips formulated at msucrose=1.5 mol kg1
(b). Simulations
performed at fixed reaction rate (kref) for six different water activities, and at variable kref
according to chips dehydration (a).
None of the evaluated conditions, reproduced precisely the behavior simulated
by the condition kref=f(aw), since the anthocyanin degradation reaction occurs in both
zones of the product, the central zone (wet) and the peripheral zone (hygroscopic).
Therefore, it is pertinent to consider the relationship kref=f(aw), to incorporate the water
activity effect in the kinetic model.
10.3.5 Coupling analysis between osmotic dehydration and frying for green papaya –
blackberry chips
The osmotic dehydration of green papaya discs, resulted in a water activity
reduction from 0.98 (for msucrose=0.0 mol kg1
) to 0.92 (for msucrose=3.0 mol kg1
). The
effect of this water activity decrease, on the anthocyanin loss during frying was
evaluated by simulation. The input parameters of the frying model were modified for
each formulated product, according to data given in Table III.5.2. Figure III.5.12a
shows the hydro-thermal path followed by six products formulated with different
concentrations of added sucrose (msucrose: 0.0 to 3.0 mol kg1
; which gives aw(0)
0.98 to
0.92) during the frying operation, in order to reach a final water activity of aw(t)
0.4
(W(t)
=0.07 kg kg1
NFDB). Then, the anthocyanin degradation kinetics (A(t)
/A(0)
) for
each product are compared, kinetics corresponds to each hydro-thermal path.
Figure III.5.12c shows the initial water activity of the formulated products and the
frying time required to reach the final moisture content. Finally, the average
anthocyanin content (A(t)
) and the reduced anthocyanin content (A(t)
/A(0)
) at the end of
0.2 0.4 0.6 0.8 10
1
2
3
4
5x 10
-3 (a) kref
= f(aw
)
Water activity at 25 ºC
kre
f (s-1
)
kref
= f(aw)
aw=0,99
aw=0,95
aw=0,70
aw=0,40
0 50 100 150200
300
400
500
600
(b) Anthocyanins
Time (s)
A (
mg
kg
-1N
FD
M)
kref
= f(aw
(t))
kref
= f(aw
=0,99)
kref
= f(aw
=0,95)
kref
= f(aw
=0,70)
kref
= f(aw
=0,40)
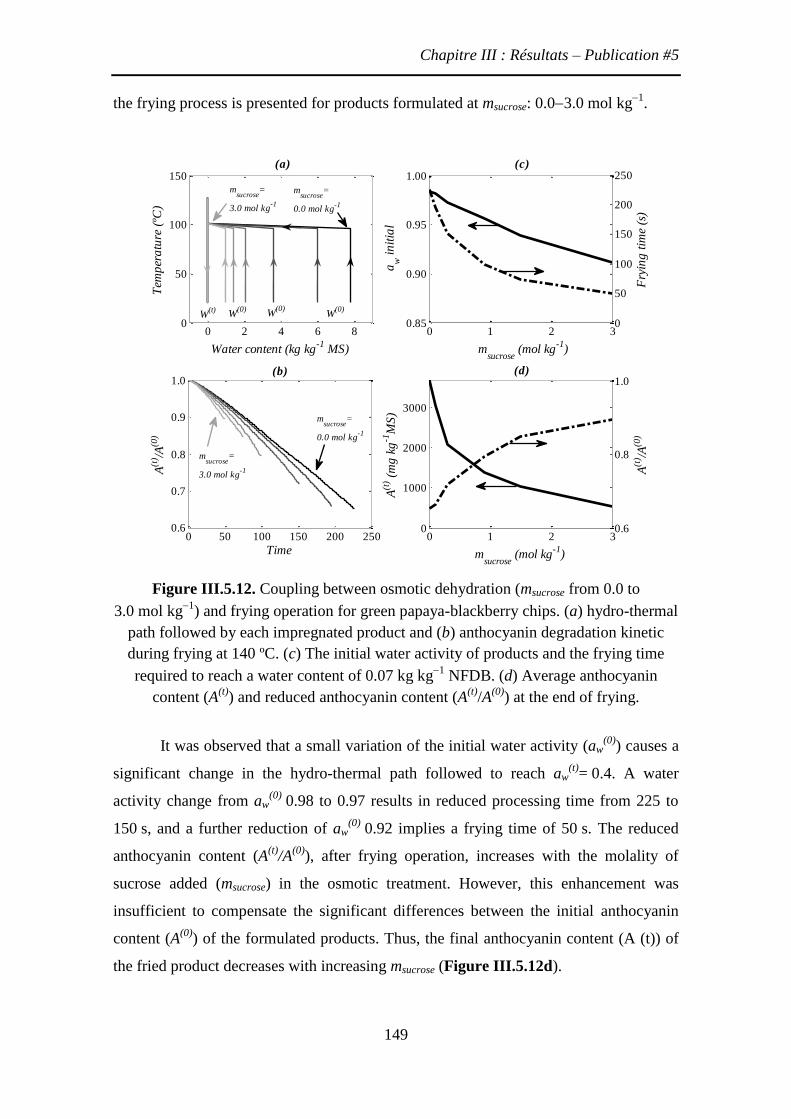
Chapitre III : Résultats – Publication #5
149
the frying process is presented for products formulated at msucrose: 0.03.0 mol kg1
.
Figure III.5.12. Coupling between osmotic dehydration (msucrose from 0.0 to
3.0 mol kg1
) and frying operation for green papaya-blackberry chips. (a) hydro-thermal
path followed by each impregnated product and (b) anthocyanin degradation kinetic
during frying at 140 ºC. (c) The initial water activity of products and the frying time
required to reach a water content of 0.07 kg kg1
NFDB. (d) Average anthocyanin
content (A(t)
) and reduced anthocyanin content (A(t)
/A(0)
) at the end of frying.
It was observed that a small variation of the initial water activity (aw(0)
) causes a
significant change in the hydro-thermal path followed to reach aw(t)
= 0.4. A water
activity change from aw(0)
0.98 to 0.97 results in reduced processing time from 225 to
150 s, and a further reduction of aw(0)
0.92 implies a frying time of 50 s. The reduced
anthocyanin content (A(t)
/A(0)
), after frying operation, increases with the molality of
sucrose added (msucrose) in the osmotic treatment. However, this enhancement was
insufficient to compensate the significant differences between the initial anthocyanin
content (A(0)
) of the formulated products. Thus, the final anthocyanin content (A (t)) of
the fried product decreases with increasing msucrose (Figure III.5.12d).
0 2 4 6 80
50
100
150
Water content (kg kg-1
MS)
Tem
per
atu
re (
ºC)
(a)
0 50 100 150 200 2500.6
0.7
0.8
0.9
1.0
Time
A(t
) /A(0
)
(b)
0 1 2 30.85
0.90
0.95
1.00
msucrose
(mol kg-1
)
aw i
nit
ial
(c)
0
50
100
150
200
250
Fry
ing
tim
e (s
)
0 1 2 30
1000
2000
3000
msucrose
(mol kg-1
)
A(t
) (m
g k
g-1
MS
)
(d)
0.6
0.8
1.0
A(t
) /A(0
)
msucrose
=
3.0 mol kg-1
msucrose
=
3.0 mol kg-1
msucrose
=
0.0 mol kg-1
msucrose
=
0.0 mol kg-1
W(0)
W(t) W
(0)W
(0)
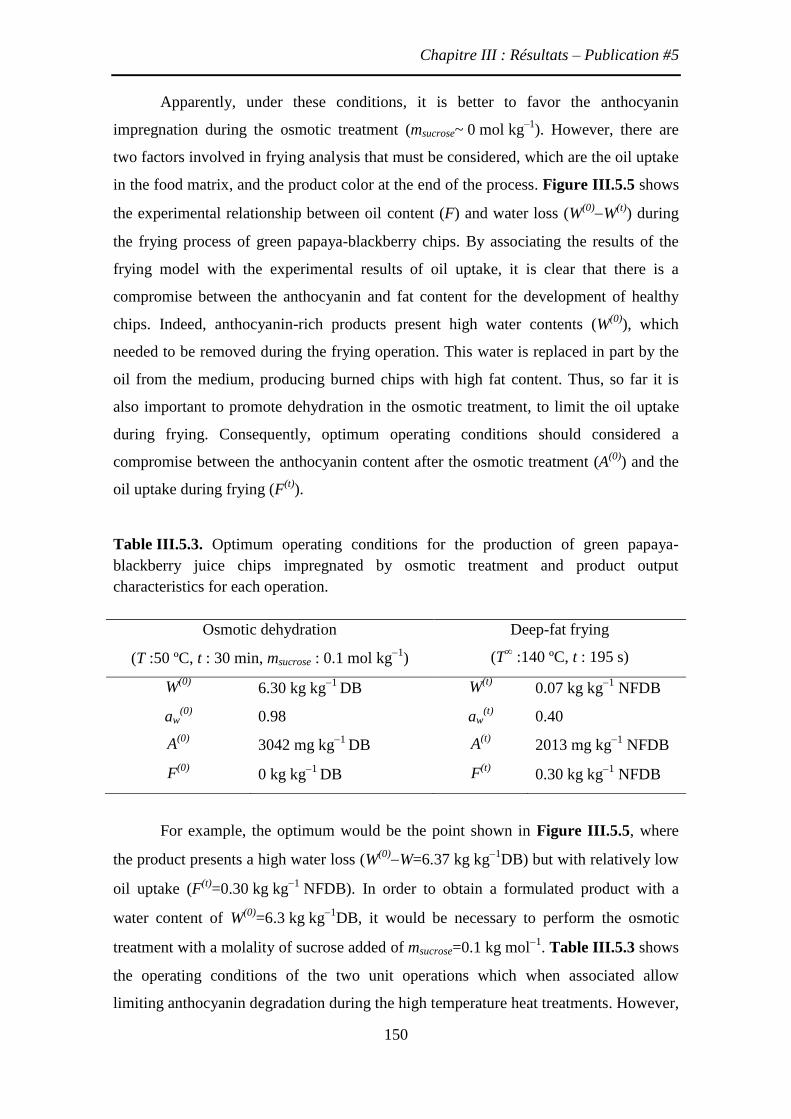
Chapitre III : Résultats – Publication #5
150
Apparently, under these conditions, it is better to favor the anthocyanin
impregnation during the osmotic treatment (msucrose~ 0 mol kg–1
). However, there are
two factors involved in frying analysis that must be considered, which are the oil uptake
in the food matrix, and the product color at the end of the process. Figure III.5.5 shows
the experimental relationship between oil content (F) and water loss (W(0)W
(t)) during
the frying process of green papaya-blackberry chips. By associating the results of the
frying model with the experimental results of oil uptake, it is clear that there is a
compromise between the anthocyanin and fat content for the development of healthy
chips. Indeed, anthocyanin-rich products present high water contents (W(0)
), which
needed to be removed during the frying operation. This water is replaced in part by the
oil from the medium, producing burned chips with high fat content. Thus, so far it is
also important to promote dehydration in the osmotic treatment, to limit the oil uptake
during frying. Consequently, optimum operating conditions should considered a
compromise between the anthocyanin content after the osmotic treatment (A(0)
) and the
oil uptake during frying (F(t)
).
Table III.5.3. Optimum operating conditions for the production of green papaya-
blackberry juice chips impregnated by osmotic treatment and product output
characteristics for each operation.
Osmotic dehydration
(T :50 ºC, t : 30 min, msucrose : 0.1 mol kg1
)
Deep-fat frying
(T∞ :140 ºC, t : 195 s)
W(0)
6.30 kg kg1
DB W(t)
0.07 kg kg1
NFDB
aw(0)
0.98 aw(t)
0.40
A(0)
3042 mg kg1
DB A(t)
2013 mg kg1
NFDB
F(0)
0 kg kg1
DB F(t)
0.30 kg kg1
NFDB
For example, the optimum would be the point shown in Figure III.5.5, where
the product presents a high water loss (W(0)W=6.37 kg kg
1DB) but with relatively low
oil uptake (F(t)
=0.30 kg kg1
NFDB). In order to obtain a formulated product with a
water content of W(0)
=6.3 kg kg1
DB, it would be necessary to perform the osmotic
treatment with a molality of sucrose added of msucrose=0.1 kg mol1
. Table III.5.3 shows
the operating conditions of the two unit operations which when associated allow
limiting anthocyanin degradation during the high temperature heat treatments. However,
Chapitre III : Résultats – Publication #5
151
at low molalities of sucrose added (msucrose~0 kg mol1
), the frying model was not able
to reproduce the experimental results, both temperature profiles and anthocyanin
degradation kinetics were underestimated under these conditions. Therefore it is
necessary to include the oil uptake in the frying model which seems to be the origin of
the observed differences.

Chapitre IV : Discussion générale
153
Chapitre IV: Résultats complémentaires et discussion
générale
L’enjeu de ce travail a été de développer différentes approches expérimentales et
de modélisation afin d’évaluer l’impact des processus impliqués dans la dégradation des
anthocyanes lors des opérations thermiques à hautes températures. Ceci, dans le but
d’identifier mais aussi d’optimiser la valeur des variables opératoires pertinentes des
opérations unitaires seules ou associées qui permettent de disposer de degré de liberté
afin de limiter la dégradation des anthocyanes dans ces traitements à haute température.
Ce chapitre vise à discuter les résultats présentés dans le Chapitre III, et à présenter
quelques résultats complémentaires. Cette discussion se concentrera, dans un premier
temps, sur la construction d’une base de données expérimentales (mise au point du
dispositif de traitement thermique à hautes températures et validation d’une méthode
rapide de dosage des anthocyanes). Nous présenterons ensuite, l’exploitation de cette
base en utilisant un modèle cinétique d’ordre 1 pour les milieux liquide et bi-phasique
(jus de mûresable de Fontainebleau), puis nous discuterons de la robustesse du modèle
proposé. Dans une seconde partie, l’effet de différents facteurs physico-chimiques sur la
dégradation des anthocyanes sera abordé. Nous traiterons de l’influence de la
température, de la présence d’oxygène dissous, de la variation de l’activité de l’eau et de
l’addition de saccharose. Dans une dernière partie, l’ensemble de ces travaux nous
permettra de fournir des stratégies de conduite d’un procédé séquentiel de formulation
par DII suivi d’un traitement à haute température (stérilisation et friture) afin de
minimiser la dégradation des anthocyanes. Enfin, l’analyse proposera une critique des
hypothèses de notre démarche qui s’appuie sur divers outils de modélisation (aliment
modèle, modèles cinétiques, modèle de friture) nécessaire pour découpler les
phénomènes mis en jeu et aider à l’interprétation.
Chapitre IV : Discussion générale
154
11 Construction d’une base de données expérimentales et étude
cinétique de la dégradation des anthocyanes
La construction d’une base de données et l’étude cinétique ont été réalisées pour
développer des outils de modélisation de cinétiques réactionnelles, qui, en association
avec un modèle de transfert d’énergie, pourraient permettre de prédire la dégradation
des anthocyanes (A(t)
) dans des milieux liquides et bi-phasiques soumis à des traitements
thermiques à hautes températures.
11.1 Le réacteur fermé pour l’étude cinétique
Le développement d’un réacteur fermé pour le traitement thermique à hautes
températures (Figure II.2) d’échantillons liquides et bi-phasiques a été une étape
prépondérante pour l’élaboration de la base de données. Sa conception devait répondre
aux critères suivants :
Système étanche capable de résister aux pressions élevées (~1000 kPa, pression
d’eau en ébullition à 180 ºC) et qui permet d’empêcher tout transfert de matière
(sortie d’eau ou entrée d’huile).
Distribution de chaleur interne la plus homogène possible (présence d’ailettes
radiales) en vue d’intensifier les transferts de chaleur et permettant des montées en
température rapide.
Possibilité d’avoir un thermocouple au sein du réacteur, qui permet d’enregistrer la
température au cours du traitement thermique, sans affecter l’étanchéité du système.
Capacité de contenir au moins 7 g de produit (la quantité d’échantillon suffisante
pour réaliser des analyses physico-chimiques).
Matériel de construction qui n’interagit pas avec l’aliment et qui soit un bon
conducteur de chaleur.
L’objectif principal de la conception d‘un réacteur fermé était de dissocier les
transferts d’énergie et de matière afin de mieux les étudier puis de mieux comprendre
ensuite leur couplage lors d’un traitement thermique à haute température en système
ouvert, comme par exemple la friture. L’hypothèse d’homogénéité du champ de
température au sein de la cellule lors de traitement d’échantillons liquides semble assez
réaliste lors du traitement de liquide (due à la convection naturelle intense du liquide),
mais elle demeure plus discutable dans le cas de produits solides (aw faible).

Chapitre IV : Discussion générale
155
La Figure IV.1 montre en effet qu’une réduction de l’activité de l’eau d’un
système bi-phasique liquide-solide (jus de mûresable) augmente significativement le
temps de traitement, passant d’une vitesse de chauffage de 1,6 K/s pour le jus de mûre
reconstitué (aw 0,99) à 1,1 K/s pour un échantillon avec une aw de 0,2 où la convection
et la conductivité thermique du produit deviennent limitantes. Cette observation nous a
amené à considérer une distribution hétérogène de température au sein de la cellule lors
de l’analyse cinétique de la dégradation des anthocyanes du mélange bi-phasique jus de
mûre/sable (Chapitre III, Publication #3). Dans ce cas, le gradient de température
observé par simulation durant le chauffage d’un échantillon à faible activité de l’eau
(aw 0,34), était très significatif et il représentait un écart de 40 ºC entre la température à
cœur et en périphérie. Cette spatialisation a eu des conséquences sur les cinétiques de
réaction, où un écart de 20 % de la teneur en anthocyanes a été estimé entre les deux
localisations (Figure III.3.7, Chapitre III, Publication #3). Afin d’accélérer les montées
en température et réduire les effets de la spatialisation, en plus d’une optimisation de la
géométrie de la cellule et des ailettes, deux bains d’huile successifs ont été utilisés : l’un
à 250 ºC et le deuxième à la température de traitement (100 à 180 ºC).
Figure IV.1. Profils de température au sein de la cellule pour le système jus de mûre-
sable de Fontainebleau à différentes activités de l’eau et pour le jus de mûre (aw 0,99).
La conception du réacteur s’est appuyée sur une modélisation en 3D des transferts
d’énergie. Dans les conditions de traitement de l’étude cinétique (deux bains d’huile
successifs, cellule remplie de liquide ou solide poreux), l’ensemble des résistances aux
transferts d’énergie (résistance de convection et résistance de contact) ont été prises en
compte. L’addition d’une réaction cinétique d’ordre 1, caractérisée par une constante k
20
60
100
140
180
0 50 100 150 200
Tem
pér
ature
(ºC
)
Temps (s)
T: 160ºC
aw 0,20 - 1,1 K/s
aw 0,38 - 1,2 K/s
aw 0,54 - 1,3 K/s
aw 0,74 - 1,4 K/s
aw 0,99 - 1,6 K/s

Chapitre IV : Discussion générale
156
et une énergie d’activation Ea, a permis d’éprouver ce réacteur en terme de spatialisation
des réactions dans son sein. Sur un domaine large des paramètres cinétiques (k120°C de
104
à 101
s1
et Ea de 50 à 300 kJ mol1
), lorsque k120°C 1103
s1
et
Ea 100 kJ mol1
, la spatialisation des réactions liées au gradient de température
devient négligeable (Figure III.3.10, Chapitre III, Publication #3). En revanche, pour
des paramètres cinétiques plus élevés il est nécessaire de prendre en compte l’impact du
gradient de température sur l’intensité des réactions. La non prise en compte de l’effet
de la spatialisation des réactions pour l’identification des paramètres cinétiques,
provoque des erreurs de 60 % pour les énergies d’activation élevées (Ea=300 kJ mol1
et
k120°C=3×10³
s1
) et de 45 % pour les constantes de réaction élevées (kref=1×101
s1
et
Ea=100 kJ mol1
). Ces ordres de grandeurs sont caractéristiques par exemple de
l’inactivation microbienne et de la dénaturation des protéines (van Boekel, 2009a).
11.2 Validation d’une méthode rapide et semi-automatisée du dosage des
anthocyanes
Le développement et la validation d’une méthode rapide de dosage des
anthocyanes par spectrophotométrie étaient une autre étape préalable à la construction
d’une base donnée conséquente. Le dosage des anthocyanes a été réalisé par la méthode
du différentiel de pH, qui est une méthode spectrophotométrique rapide, simple et
précise des anthocyanes totales, même en présence de pigments polymérisés dégradés et
d’autres composés interférents. La méthode est basée sur la transformation structurelle
que les anthocyanes présentent avec le changement du pH (coloré à pH 1,0 et incolore à
pH 4,5). L’analyse a été corrélée à la méthode de dosage par chromatographie en phase
liquide à haute performance (CLHP) (Lee et al., 2008) laquelle a reçu l’approbation en
première action du Conseil International de Méthodes Officielles de l’Association of
Analytical Communities (AOAC) (Lee et al., 2005).
Le protocole du dosage a été adapté au spectrophotomètre à plaques, afin
d’analyser un nombre plus grand d’échantillons (10 échantillons en 4 fois par plaque de
96 puits) avec une quantité minimale de réactifs (200 µL au lieu de 10 mL par
échantillon). Ce protocole semi-automatisé a été validé par la méthode de CLHP, où un
étalon commercial de kuromanine (cyanidine 3-glucoside à 593,3 mg L1
) a été co-
injecté avec 8 échantillons de jus de mûre reconstitué, sans traitement et traités à 130,
150 et 170 ºC. La Figure IV.2 montre la comparaison entre les résultats obtenus pour
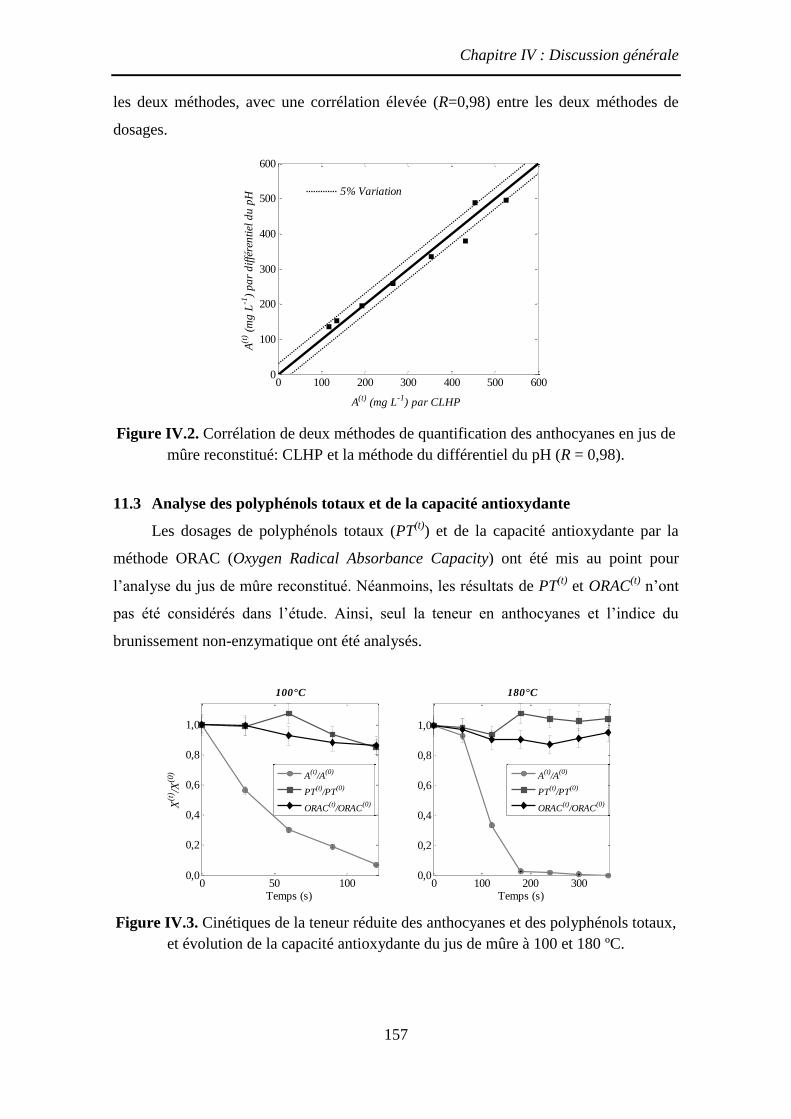
Chapitre IV : Discussion générale
157
les deux méthodes, avec une corrélation élevée (R=0,98) entre les deux méthodes de
dosages.
Figure IV.2. Corrélation de deux méthodes de quantification des anthocyanes en jus de
mûre reconstitué: CLHP et la méthode du différentiel du pH (R = 0,98).
11.3 Analyse des polyphénols totaux et de la capacité antioxydante
Les dosages de polyphénols totaux (PT(t)
) et de la capacité antioxydante par la
méthode ORAC (Oxygen Radical Absorbance Capacity) ont été mis au point pour
l’analyse du jus de mûre reconstitué. Néanmoins, les résultats de PT(t)
et ORAC(t)
n’ont
pas été considérés dans l’étude. Ainsi, seul la teneur en anthocyanes et l’indice du
brunissement non-enzymatique ont été analysés.
Figure IV.3. Cinétiques de la teneur réduite des anthocyanes et des polyphénols totaux,
et évolution de la capacité antioxydante du jus de mûre à 100 et 180 ºC.
0 100 200 300 400 500 6000
100
200
300
400
500
600
A(t)
(mg L-1
) par CLHP
A(t
) (m
g L
-1)
pa
r d
iffé
ren
tiel
du
pH 5% Variation
0 50 1000,0
0,2
0,4
0,6
0,8
1,0
100°C
Temps (s)
X(t
) /X(0
)
A(t)
/A(0)
PT(t)
/PT(0)
ORAC(t)
/ORAC(0)
0 100 200 3000,0
0,2
0,4
0,6
0,8
1,0
180°C
Temps (s)
A(t)
/A(0)
PT(t)
/PT(0)
ORAC(t)
/ORAC(0)
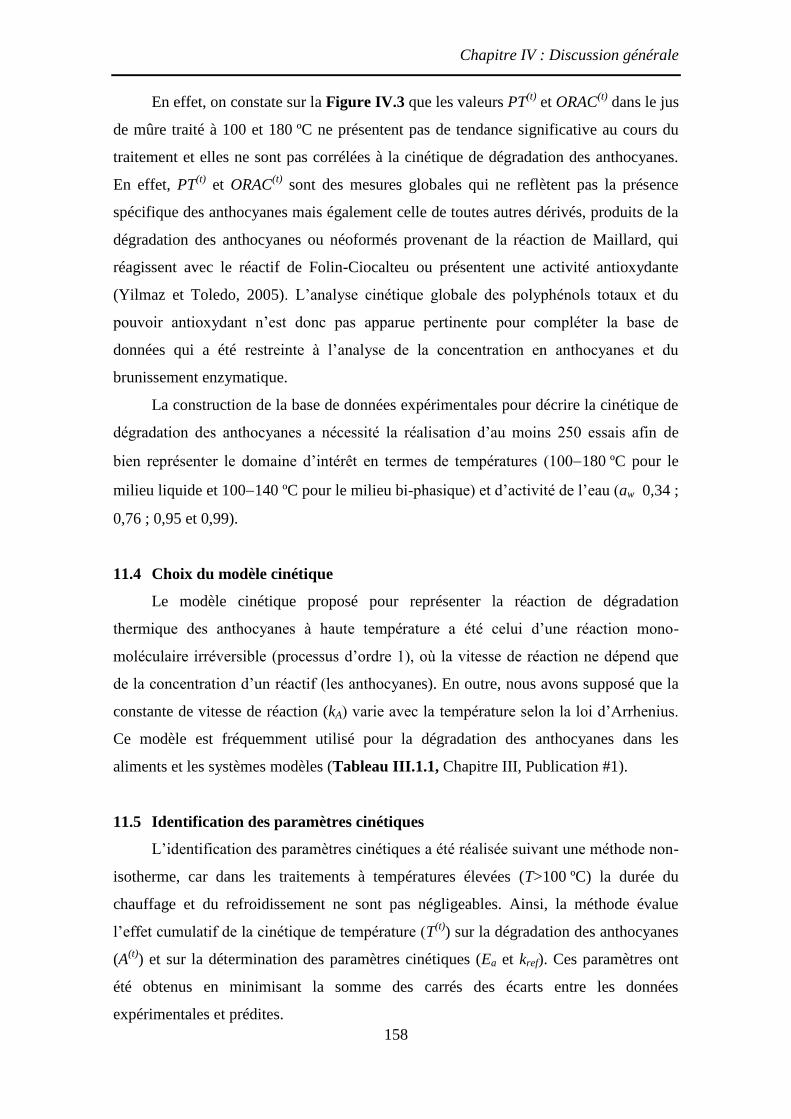
Chapitre IV : Discussion générale
158
En effet, on constate sur la Figure IV.3 que les valeurs PT(t)
et ORAC(t)
dans le jus
de mûre traité à 100 et 180 ºC ne présentent pas de tendance significative au cours du
traitement et elles ne sont pas corrélées à la cinétique de dégradation des anthocyanes.
En effet, PT(t)
et ORAC(t)
sont des mesures globales qui ne reflètent pas la présence
spécifique des anthocyanes mais également celle de toutes autres dérivés, produits de la
dégradation des anthocyanes ou néoformés provenant de la réaction de Maillard, qui
réagissent avec le réactif de Folin-Ciocalteu ou présentent une activité antioxydante
(Yilmaz et Toledo, 2005). L’analyse cinétique globale des polyphénols totaux et du
pouvoir antioxydant n’est donc pas apparue pertinente pour compléter la base de
données qui a été restreinte à l’analyse de la concentration en anthocyanes et du
brunissement enzymatique.
La construction de la base de données expérimentales pour décrire la cinétique de
dégradation des anthocyanes a nécessité la réalisation d’au moins 250 essais afin de
bien représenter le domaine d’intérêt en termes de températures (100180 ºC pour le
milieu liquide et 100140 ºC pour le milieu bi-phasique) et d’activité de l’eau (aw 0,34 ;
0,76 ; 0,95 et 0,99).
11.4 Choix du modèle cinétique
Le modèle cinétique proposé pour représenter la réaction de dégradation
thermique des anthocyanes à haute température a été celui d’une réaction mono-
moléculaire irréversible (processus d’ordre 1), où la vitesse de réaction ne dépend que
de la concentration d’un réactif (les anthocyanes). En outre, nous avons supposé que la
constante de vitesse de réaction (kA) varie avec la température selon la loi d’Arrhenius.
Ce modèle est fréquemment utilisé pour la dégradation des anthocyanes dans les
aliments et les systèmes modèles (Tableau III.1.1, Chapitre III, Publication #1).
11.5 Identification des paramètres cinétiques
L’identification des paramètres cinétiques a été réalisée suivant une méthode non-
isotherme, car dans les traitements à températures élevées (T>100 ºC) la durée du
chauffage et du refroidissement ne sont pas négligeables. Ainsi, la méthode évalue
l’effet cumulatif de la cinétique de température (T(t)
) sur la dégradation des anthocyanes
(A(t)
) et sur la détermination des paramètres cinétiques (Ea et kref). Ces paramètres ont
été obtenus en minimisant la somme des carrés des écarts entre les données
expérimentales et prédites.
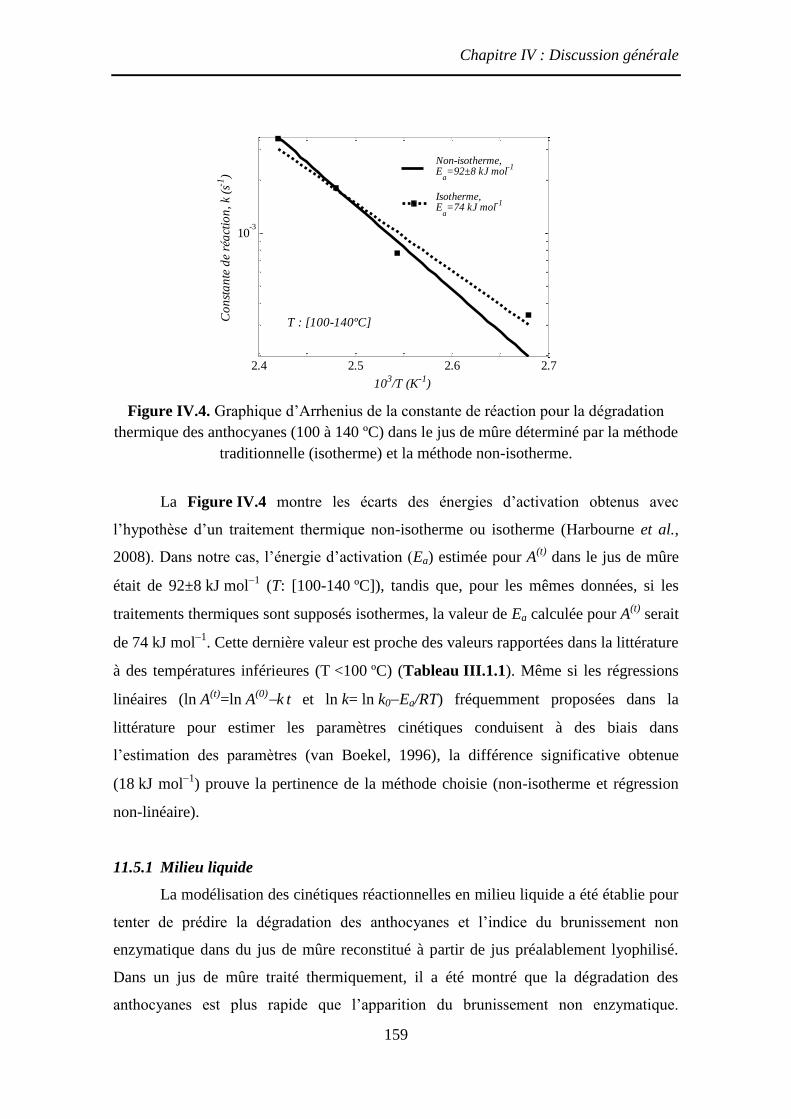
Chapitre IV : Discussion générale
159
Figure IV.4. Graphique d’Arrhenius de la constante de réaction pour la dégradation
thermique des anthocyanes (100 à 140 ºC) dans le jus de mûre déterminé par la méthode
traditionnelle (isotherme) et la méthode non-isotherme.
La Figure IV.4 montre les écarts des énergies d’activation obtenus avec
l’hypothèse d’un traitement thermique non-isotherme ou isotherme (Harbourne et al.,
2008). Dans notre cas, l’énergie d’activation (Ea) estimée pour A(t)
dans le jus de mûre
était de 92±8 kJ mol1
(T: [100-140 ºC]), tandis que, pour les mêmes données, si les
traitements thermiques sont supposés isothermes, la valeur de Ea calculée pour A(t)
serait
de 74 kJ mol1
. Cette dernière valeur est proche des valeurs rapportées dans la littérature
à des températures inférieures (T <100 ºC) (Tableau III.1.1). Même si les régressions
linéaires (ln A(t)
=ln A(0)k t et ln k= ln k0Ea/RT) fréquemment proposées dans la
littérature pour estimer les paramètres cinétiques conduisent à des biais dans
l’estimation des paramètres (van Boekel, 1996), la différence significative obtenue
(18 kJ mol1
) prouve la pertinence de la méthode choisie (non-isotherme et régression
non-linéaire).
11.5.1 Milieu liquide
La modélisation des cinétiques réactionnelles en milieu liquide a été établie pour
tenter de prédire la dégradation des anthocyanes et l’indice du brunissement non
enzymatique dans du jus de mûre reconstitué à partir de jus préalablement lyophilisé.
Dans un jus de mûre traité thermiquement, il a été montré que la dégradation des
anthocyanes est plus rapide que l’apparition du brunissement non enzymatique.
2.4 2.5 2.6 2.7
10-3
103/T (K
-1)
Co
nst
an
te d
e ré
act
ion
, k
(s-1
)
Non-isotherme,E
a=92±8 kJ mol
-1
Isotherme,E
a=74 kJ mol
-1
T : [100-140ºC]
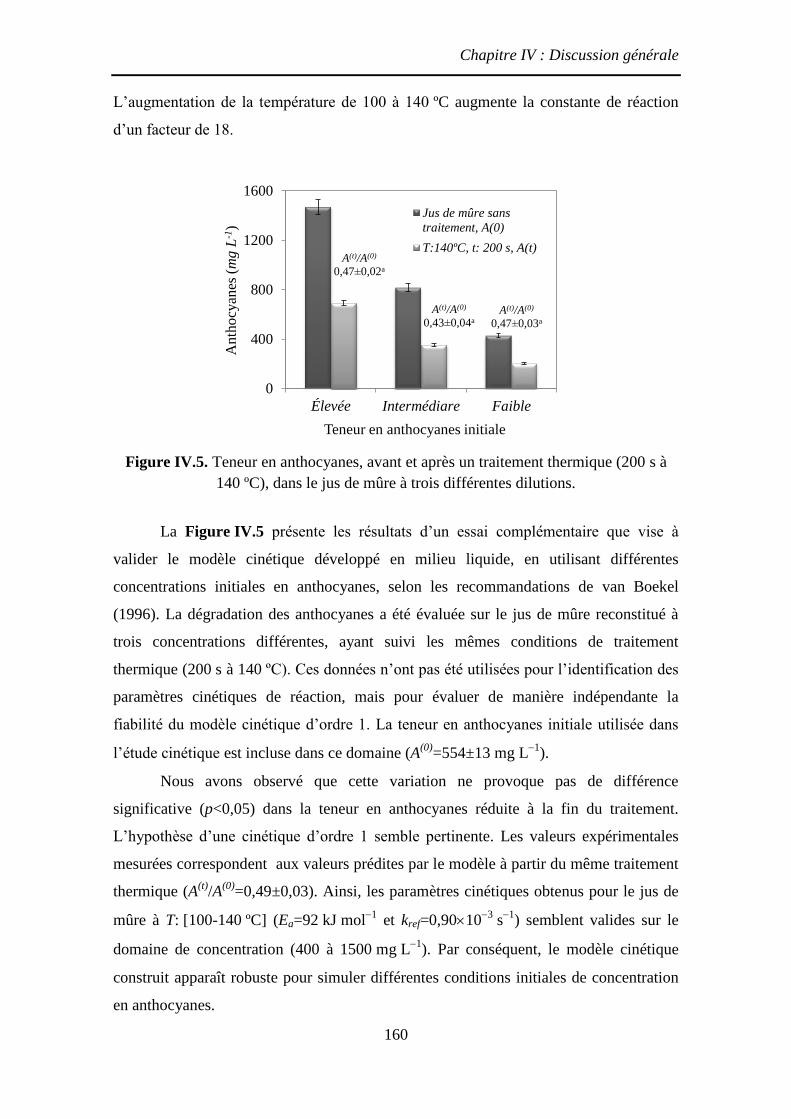
Chapitre IV : Discussion générale
160
L’augmentation de la température de 100 à 140 ºC augmente la constante de réaction
d’un facteur de 18.
Figure IV.5. Teneur en anthocyanes, avant et après un traitement thermique (200 s à
140 ºC), dans le jus de mûre à trois différentes dilutions.
La Figure IV.5 présente les résultats d’un essai complémentaire que vise à
valider le modèle cinétique développé en milieu liquide, en utilisant différentes
concentrations initiales en anthocyanes, selon les recommandations de van Boekel
(1996). La dégradation des anthocyanes a été évaluée sur le jus de mûre reconstitué à
trois concentrations différentes, ayant suivi les mêmes conditions de traitement
thermique (200 s à 140 ºC). Ces données n’ont pas été utilisées pour l’identification des
paramètres cinétiques de réaction, mais pour évaluer de manière indépendante la
fiabilité du modèle cinétique d’ordre 1. La teneur en anthocyanes initiale utilisée dans
l’étude cinétique est incluse dans ce domaine (A(0)
=554±13 mg L1
).
Nous avons observé que cette variation ne provoque pas de différence
significative (p<0,05) dans la teneur en anthocyanes réduite à la fin du traitement.
L’hypothèse d’une cinétique d’ordre 1 semble pertinente. Les valeurs expérimentales
mesurées correspondent aux valeurs prédites par le modèle à partir du même traitement
thermique (A(t)
/A(0)
=0,49±0,03). Ainsi, les paramètres cinétiques obtenus pour le jus de
mûre à T: [100-140 ºC] (Ea=92 kJ mol1
et kref=0,90103
s1
) semblent valides sur le
domaine de concentration (400 à 1500 mg L1
). Par conséquent, le modèle cinétique
construit apparaît robuste pour simuler différentes conditions initiales de concentration
en anthocyanes.
0
400
800
1200
1600
Élevée Intermédiare Faible
An
tho
cyan
es (
mg
L-1
)
Teneur en anthocyanes initiale
Jus de mûre sans
traitement, A(0)
T:140ºC, t: 200 s, A(t)
A(t)/A(0)
0,43 0,04a
A(t)/A(0)
0,47 0,03a
A(t)/A(0)
0,47 0,02a

Chapitre IV : Discussion générale
161
11.5.2 Milieu modèle bi-phasique
L’objet de l’étude en milieu solide (bi-phasique) a été d’évaluer l’impact d’une
baisse de l’activité d’eau sur la dégradation des anthocyanes à haute température (100
140 ºC) dans un système modèle bi-phasique (jus de mûre-sable de Fontainebleau). La
Figure IV.6 présente la réduction des anthocyanes dans le système jus de mûre-sable de
Fontainebleau à huit activités de l’eau différentes. Il a été constaté que les paramètres
cinétiques identifiés pour le jus de mûre ne parviennent pas à prédire la dégradation des
anthocyanes dans le milieu bi-phasique, où les écarts entre les valeurs expérimentales et
prédites ont été de 30 à 50 % pour les échantillons à plus faible activité de l’eau.
Compte tenu de ces résultats, la réduction de l’activité de l’eau a un effet négatif sur la
stabilité des anthocyanes à haute température, ce qui contredit les résultats présentés
dans de la littérature pour la dégradation des anthocyanes à des températures inférieures
(Bronum-Hansen et Flink, 1985; Erlandson et Wrolstad, 1972; Garzón et Wrolstad,
2001; Gradinaru et al., 2003; Lai et al., 2009; Thakur et Arya, 1989).
Figure IV.6. Teneur réduite en anthocyanes (A(t)
/A(0)
) après traitement thermique
(160 ºC) valeurs expérimentales et prédites par le modèle en milieu liquide (jus de
mûre), dans le système jus de mûre-sable de Fontainebleau à différentes activités de
l’eau.
L’hypothèse proposée serait que les transferts de chaleur par conduction au sein
des produits à faible aw seraient limitants. Par conséquent, des expérimentations ont été
effectuées sur un échantillon à faible activité de l’eau afin de confirmer ou infirmer cette
0,0
0,2
0,4
0,6
0,8
1,0
0,0
0,2
0,4
0,6
0,8
0,20 0,38 0,54 0,74 0,83 0,94 0,96 0,99
Ten
eur en
eau (k
g k
g-1
MF
) T
eneu
r ré
du
ite
en a
nth
ocy
anes
Activité de l'eau à 25ºC
C/Co exp C/Co pred IsothermeA(t)/A(0)
simulée
A(t)/A(0)
expérimentale
Isotherme
de sorption
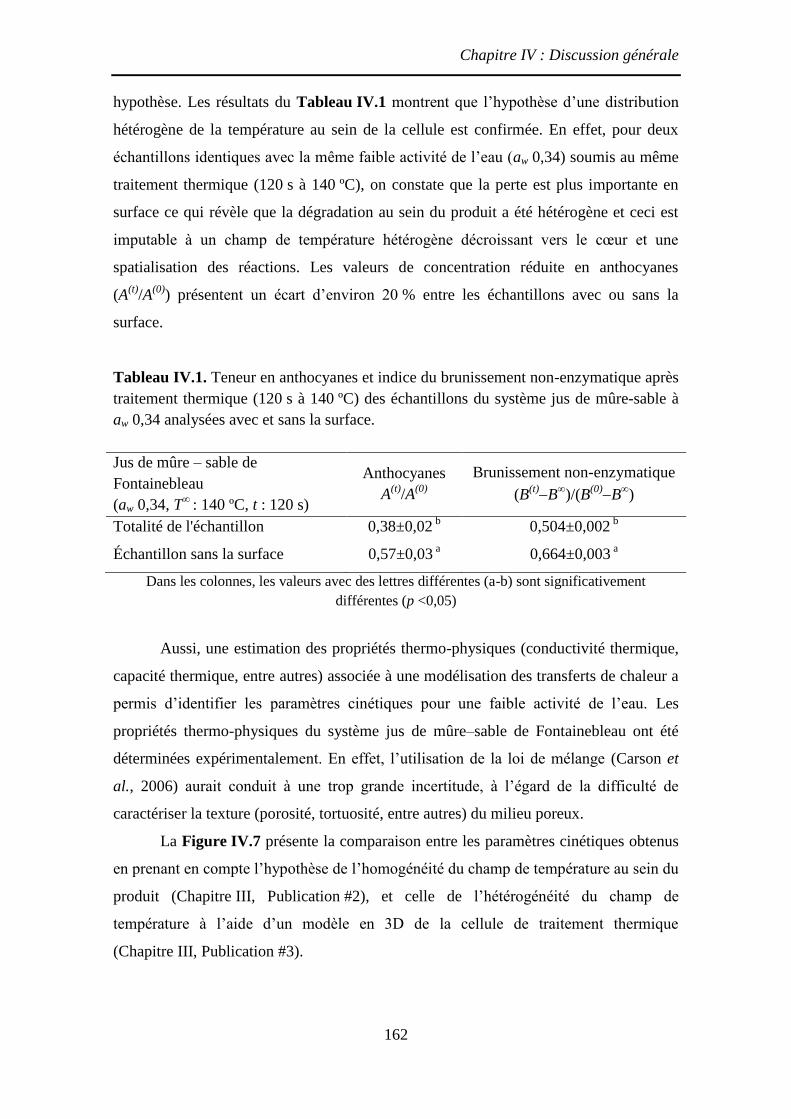
Chapitre IV : Discussion générale
162
hypothèse. Les résultats du Tableau IV.1 montrent que l’hypothèse d’une distribution
hétérogène de la température au sein de la cellule est confirmée. En effet, pour deux
échantillons identiques avec la même faible activité de l’eau (aw 0,34) soumis au même
traitement thermique (120 s à 140 ºC), on constate que la perte est plus importante en
surface ce qui révèle que la dégradation au sein du produit a été hétérogène et ceci est
imputable à un champ de température hétérogène décroissant vers le cœur et une
spatialisation des réactions. Les valeurs de concentration réduite en anthocyanes
(A(t)
/A(0)
) présentent un écart d’environ 20 % entre les échantillons avec ou sans la
surface.
Tableau IV.1. Teneur en anthocyanes et indice du brunissement non-enzymatique après
traitement thermique (120 s à 140 ºC) des échantillons du système jus de mûre-sable à
aw 0,34 analysées avec et sans la surface.
Jus de mûre – sable de
Fontainebleau
(aw 0,34, T∞
: 140 ºC, t : 120 s)
Anthocyanes
A(t)
/A(0)
Brunissement non-enzymatique
(B(t)B
∞)/(B
(0)B
∞)
Totalité de l'échantillon 0,38±0,02 b
0,504±0,002 b
Échantillon sans la surface 0,57±0,03 a 0,664±0,003
a
Dans les colonnes, les valeurs avec des lettres différentes (a-b) sont significativement
différentes (p <0,05)
Aussi, une estimation des propriétés thermo-physiques (conductivité thermique,
capacité thermique, entre autres) associée à une modélisation des transferts de chaleur a
permis d’identifier les paramètres cinétiques pour une faible activité de l’eau. Les
propriétés thermo-physiques du système jus de mûre–sable de Fontainebleau ont été
déterminées expérimentalement. En effet, l’utilisation de la loi de mélange (Carson et
al., 2006) aurait conduit à une trop grande incertitude, à l’égard de la difficulté de
caractériser la texture (porosité, tortuosité, entre autres) du milieu poreux.
La Figure IV.7 présente la comparaison entre les paramètres cinétiques obtenus
en prenant en compte l’hypothèse de l’homogénéité du champ de température au sein du
produit (Chapitre III, Publication #2), et celle de l’hétérogénéité du champ de
température à l’aide d’un modèle en 3D de la cellule de traitement thermique
(Chapitre III, Publication #3).
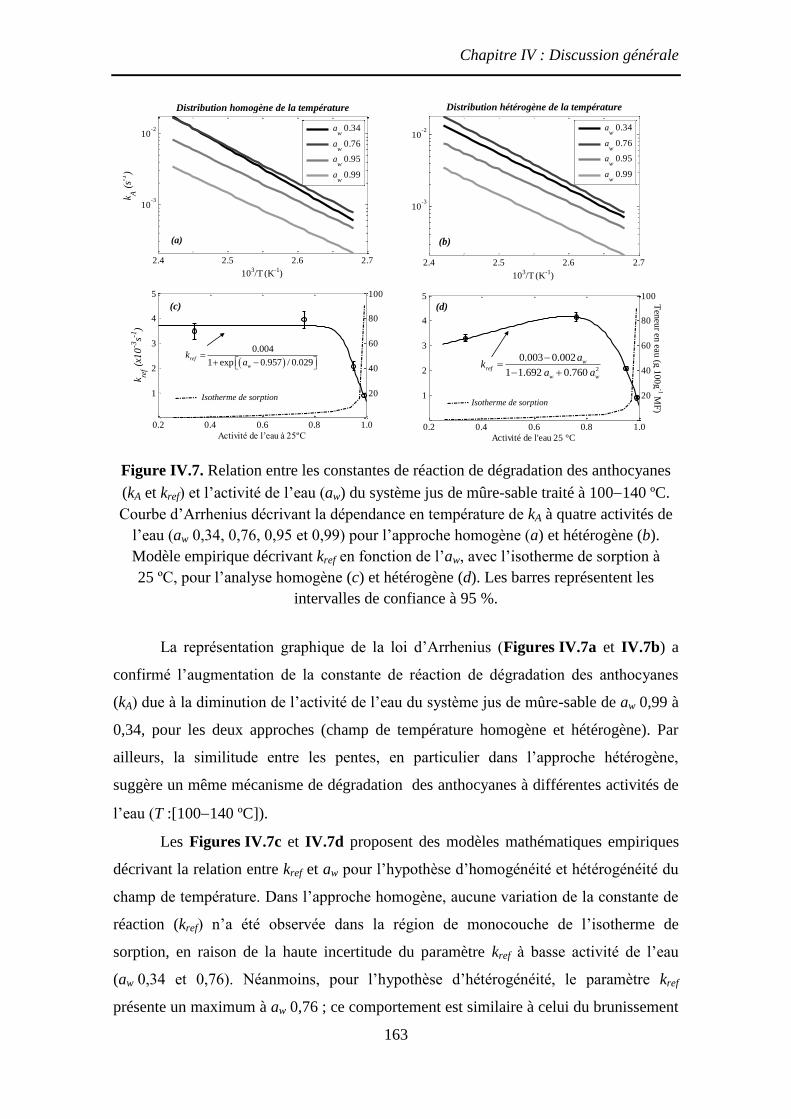
Chapitre IV : Discussion générale
163
Figure IV.7. Relation entre les constantes de réaction de dégradation des anthocyanes
(kA et kref) et l’activité de l’eau (aw) du système jus de mûre-sable traité à 100140 ºC.
Courbe d’Arrhenius décrivant la dépendance en température de kA à quatre activités de
l’eau (aw 0,34, 0,76, 0,95 et 0,99) pour l’approche homogène (a) et hétérogène (b).
Modèle empirique décrivant kref en fonction de l’aw, avec l’isotherme de sorption à
25 ºC, pour l’analyse homogène (c) et hétérogène (d). Les barres représentent les
intervalles de confiance à 95 %.
La représentation graphique de la loi d’Arrhenius (Figures IV.7a et IV.7b) a
confirmé l’augmentation de la constante de réaction de dégradation des anthocyanes
(kA) due à la diminution de l’activité de l’eau du système jus de mûre-sable de aw 0,99 à
0,34, pour les deux approches (champ de température homogène et hétérogène). Par
ailleurs, la similitude entre les pentes, en particulier dans l’approche hétérogène,
suggère un même mécanisme de dégradation des anthocyanes à différentes activités de
l’eau (T :[100140 ºC]).
Les Figures IV.7c et IV.7d proposent des modèles mathématiques empiriques
décrivant la relation entre kref et aw pour l’hypothèse d’homogénéité et hétérogénéité du
champ de température. Dans l’approche homogène, aucune variation de la constante de
réaction (kref) n’a été observée dans la région de monocouche de l’isotherme de
sorption, en raison de la haute incertitude du paramètre kref à basse activité de l’eau
(aw 0,34 et 0,76). Néanmoins, pour l’hypothèse d’hétérogénéité, le paramètre kref
présente un maximum à aw 0,76 ; ce comportement est similaire à celui du brunissement
2.4 2.5 2.6 2.7
10-3
10-2
103/T (K
-1)
k A (
s-1)
0.2 0.4 0.6 0.8 1.0
1
2
3
4
5
Activité de l’eau à 25ºC
kre
f (x1
0-3
s-1)
20
40
60
80
100
aw 0.34
aw 0.76
aw 0.95
aw 0.99
(a)
(a)
Distribution homogène de la température
0.004
1 exp 0.957 / 0.029ref
w
ka
Isotherme de sorption
(c)
2.4 2.5 2.6 2.7
10-3
10-2
103/T (K
-1)
0.2 0.4 0.6 0.8 1.0
1
2
3
4
5
Activité de l'eau 25 °C
20
40
60
80
100
aw 0.34
aw 0.76
aw 0.95
aw 0.99
(a)
(c)
2
0.003 0.002
1 1.692 0.760
wref
w w
ak
a a
Ten
eur en
eau (g
10
0g
-1 MF
)
Distribution hétérogène de la température
Isotherme de sorption
(d)
(b)
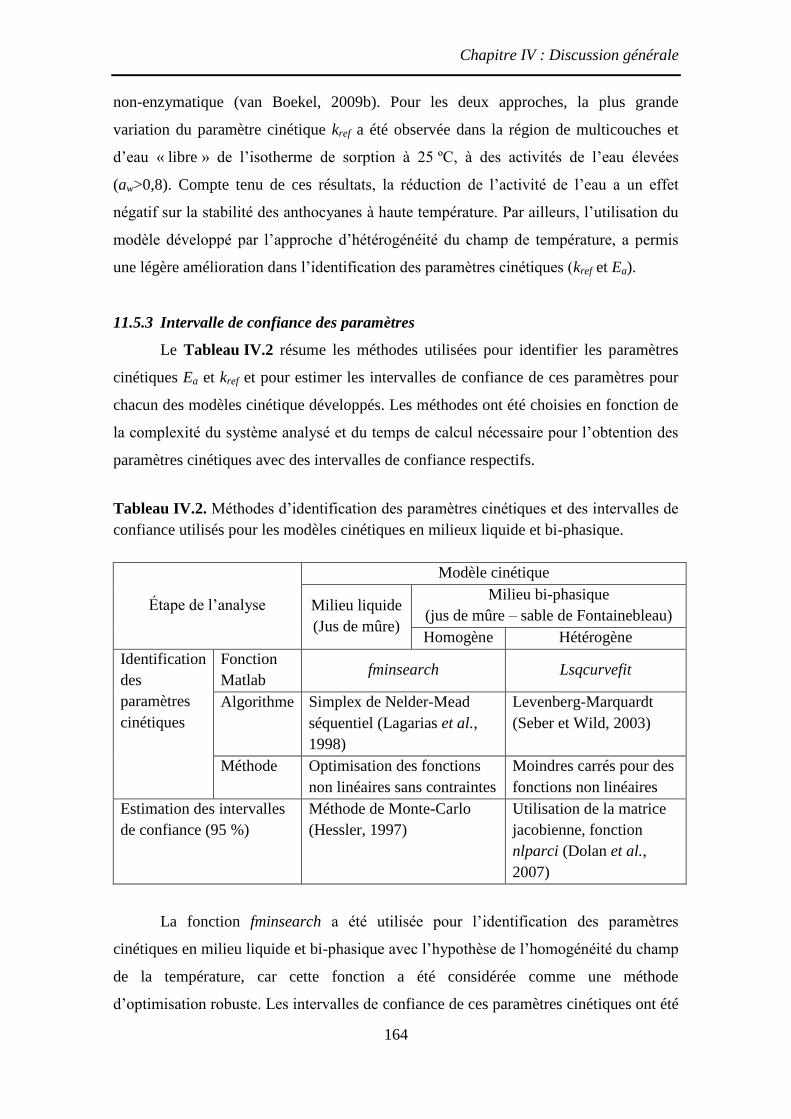
Chapitre IV : Discussion générale
164
non-enzymatique (van Boekel, 2009b). Pour les deux approches, la plus grande
variation du paramètre cinétique kref a été observée dans la région de multicouches et
d’eau « libre » de l’isotherme de sorption à 25 ºC, à des activités de l’eau élevées
(aw>0,8). Compte tenu de ces résultats, la réduction de l’activité de l’eau a un effet
négatif sur la stabilité des anthocyanes à haute température. Par ailleurs, l’utilisation du
modèle développé par l’approche d’hétérogénéité du champ de température, a permis
une légère amélioration dans l’identification des paramètres cinétiques (kref et Ea).
11.5.3 Intervalle de confiance des paramètres
Le Tableau IV.2 résume les méthodes utilisées pour identifier les paramètres
cinétiques Ea et kref et pour estimer les intervalles de confiance de ces paramètres pour
chacun des modèles cinétique développés. Les méthodes ont été choisies en fonction de
la complexité du système analysé et du temps de calcul nécessaire pour l’obtention des
paramètres cinétiques avec des intervalles de confiance respectifs.
Tableau IV.2. Méthodes d’identification des paramètres cinétiques et des intervalles de
confiance utilisés pour les modèles cinétiques en milieux liquide et bi-phasique.
Étape de l’analyse
Modèle cinétique
Milieu liquide
(Jus de mûre)
Milieu bi-phasique
(jus de mûre – sable de Fontainebleau)
Homogène Hétérogène
Identification
des
paramètres
cinétiques
Fonction
Matlab fminsearch Lsqcurvefit
Algorithme Simplex de Nelder-Mead
séquentiel (Lagarias et al.,
1998)
Levenberg-Marquardt
(Seber et Wild, 2003)
Méthode Optimisation des fonctions
non linéaires sans contraintes
Moindres carrés pour des
fonctions non linéaires
Estimation des intervalles
de confiance (95 %)
Méthode de Monte-Carlo
(Hessler, 1997)
Utilisation de la matrice
jacobienne, fonction
nlparci (Dolan et al.,
2007)
La fonction fminsearch a été utilisée pour l’identification des paramètres
cinétiques en milieu liquide et bi-phasique avec l’hypothèse de l’homogénéité du champ
de la température, car cette fonction a été considérée comme une méthode
d’optimisation robuste. Les intervalles de confiance de ces paramètres cinétiques ont été
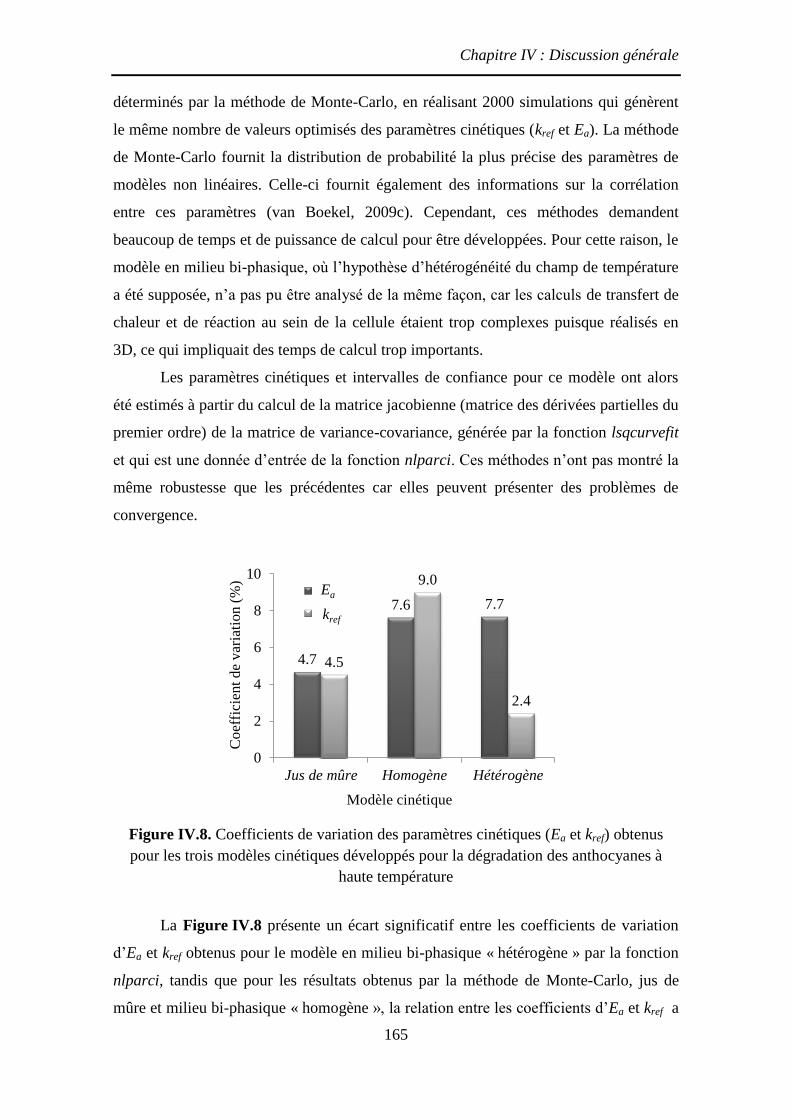
Chapitre IV : Discussion générale
165
déterminés par la méthode de Monte-Carlo, en réalisant 2000 simulations qui génèrent
le même nombre de valeurs optimisés des paramètres cinétiques (kref et Ea). La méthode
de Monte-Carlo fournit la distribution de probabilité la plus précise des paramètres de
modèles non linéaires. Celle-ci fournit également des informations sur la corrélation
entre ces paramètres (van Boekel, 2009c). Cependant, ces méthodes demandent
beaucoup de temps et de puissance de calcul pour être développées. Pour cette raison, le
modèle en milieu bi-phasique, où l’hypothèse d’hétérogénéité du champ de température
a été supposée, n’a pas pu être analysé de la même façon, car les calculs de transfert de
chaleur et de réaction au sein de la cellule étaient trop complexes puisque réalisés en
3D, ce qui impliquait des temps de calcul trop importants.
Les paramètres cinétiques et intervalles de confiance pour ce modèle ont alors
été estimés à partir du calcul de la matrice jacobienne (matrice des dérivées partielles du
premier ordre) de la matrice de variance-covariance, générée par la fonction lsqcurvefit
et qui est une donnée d’entrée de la fonction nlparci. Ces méthodes n’ont pas montré la
même robustesse que les précédentes car elles peuvent présenter des problèmes de
convergence.
Figure IV.8. Coefficients de variation des paramètres cinétiques (Ea et kref) obtenus
pour les trois modèles cinétiques développés pour la dégradation des anthocyanes à
haute température
La Figure IV.8 présente un écart significatif entre les coefficients de variation
d’Ea et kref obtenus pour le modèle en milieu bi-phasique « hétérogène » par la fonction
nlparci, tandis que pour les résultats obtenus par la méthode de Monte-Carlo, jus de
mûre et milieu bi-phasique « homogène », la relation entre les coefficients d’Ea et kref a
4.7
7.6 7.7
4.5
9.0
2.4
0
2
4
6
8
10
Jus de mûre Homogène Hétérogène
Co
effi
cien
t d
e v
aria
tio
n (
%)
Modèle cinétique
Ea
kref
Ea
kref

Chapitre IV : Discussion générale
166
été plus équilibrée. Cet écart a été trouvé, même en normalisant les paramètres
cinétiques d’initialisation avant l’identification (les valeurs d’Ea ont été divisées par
1000 et les valeurs de kref ont été multipliées par 1000). Cette normalisation vise à
donner le même poids aux paramètres, lors de l’optimisation. Les intervalles de
confiance identifiés pour les constantes de réaction à la température de référence et les
énergies d’activation sont de l’ordre de grandeur des valeurs rapportées dans la
littérature pour les paramètres cinétiques de la dégradation thermique des anthocyanes à
haute température (Harbourne et al., 2008; Mishra et al., 2008).
12 Mécanismes de dégradation thermique des anthocyanes
L’originalité des résultats obtenus au cours de l’étude cinétique de la dégradation
des anthocyanes à haute température en milieu liquide et bi-phasique (jus-sable),
montrent l’importance d’améliorer la compréhension des mécanismes impliqués dans la
réaction. Certains essais supplémentaires ont été effectués pour tenter d’élucider les
mécanismes envisageables et des hypothèses ont été également proposées pour tenter
d’expliquer les résultats obtenus.
12.1 Effet de la température
L’effet de la température sur la dégradation des anthocyanes a été étudié par
plusieurs auteurs (Buckow et al., 2010; Cisse et al., 2009; Harbourne et al., 2008;
Mishra et al., 2008; Verbeyst et al., 2011; Wang et Xu, 2007) et ils ont rapporté les
paramètres cinétiques (l’énergie d’activation et la constante de réaction) pour une
grande variété de produits riches en anthocyanes (Tableau I.1, Introduction générale).
Les paramètres ont été obtenus grâce à des cinétiques d’ordre 1 et en modélisant la
dépendance de la température selon l’équation d’Arrhenius. La plupart des études ont
été réalisées à des températures inférieures à 100 ºC, et ces traitements peuvent être
considérés comme isothermes. Cependant, certaines opérations thermiques subies par
les produits alimentaires riches en anthocyanes, impliquent des températures bien
supérieures à 100 ºC. Il s’agit par exemple de la friture sous vide des pommes de terre
bleues en fin de traitement (Da Silva et Moreira, 2008), de la stérilisation de la pulpe de
raisin (Mishra et al., 2008), de l’extrusion de farine de maïs avec des anthocyanes de
myrtille et de raisins pour les céréales de petit déjeuner (Camire et al., 2002), et le
séchage par atomisation de pulpe d’açaí (Tonon et al., 2008). Peu de données cinétiques

Chapitre IV : Discussion générale
167
obtenues à des hautes températures (>100 ºC) ont été publiées (Buckow et al., 2010;
Harbourne et al., 2008; Mishra et al., 2008; Verbeyst et al., 2011) (Tableau I.1,
Introduction générale) où l’énergie d’activation (Ea) et la constante de réaction (kA) ont
été de l’ordre de 80 kJ mol1
et 2103
s1
respectivement, valeurs qui sont relativement
proches de celles trouvées dans la présente étude (Ea=92 kJ mol1
et
k120ºC=3,5103
s1
).
Les résultats des publications #1, #2 et #3 (Chapitre III) ont montré que
l’augmentation de la température de 100 à 140 ºC dans le jus de mûre produit un
accroissement de la constante de réaction des anthocyanes (kA) de 17 fois. Au-delà de
140 ºC la vitesse de dégradation s’accélère encore plus (Chapitre III, Publication#1). À
ces températures élevées, de nombreux facteurs peuvent être impliqués dans la
dégradation des anthocyanes, tels que la formation de produits de la réaction de
Maillard. Selon Debicki-Pospisil et al. (1983), la présence de furfural et de 5-
hydroxyméthyle furfural accélère la vitesse de dégradation de la cyanidine 3-glucoside
dans le jus de mûre. En effet, la dégradation des anthocyanes est effectivement plus
rapide que la formation de produits de brunissement non-enzymatique dans le jus de
mûre reconstitué.
Par conséquent, les traitements thermiques à des températures supérieures à
140 ºC, doivent être évités pour le traitement des aliments riches en anthocyanes, car la
destruction de ces composés a été très rapide dans ces conditions (t <200 s). Cette
observation a été confirmée par les résultats de simulation de la Figure III.1.8
(Chapitre III, Publication #1), où une opération de friture à 180 ºC conduirait à la perte
totale des anthocyanes dans la croûte.
12.2 Effet de l’oxygène dissous
L’oxygène joue un rôle prépondérant dans le processus de dégradation des
polyphénols, dont les anthocyanes. La présence d’oxygène peut accélérer la dégradation
des anthocyanes, soit par un mécanisme oxydatif direct et/ou par l’action d’enzymes
d’oxydation comme la polyphénoloxydase (PPO) (Patras et al., 2010). L’effet de la
présence d’oxygène dissous sur la dégradation thermique des anthocyanes à haute
température a été évalué dans le jus de mûre traité à 180 ºC pendant 150 s. Avant le
traitement thermique, le jus a été dégazé par bullage d’argon pendant 10 min, pour avoir
une concentration en oxygène dissous inférieure à 1 mg/L. Cette concentration a été
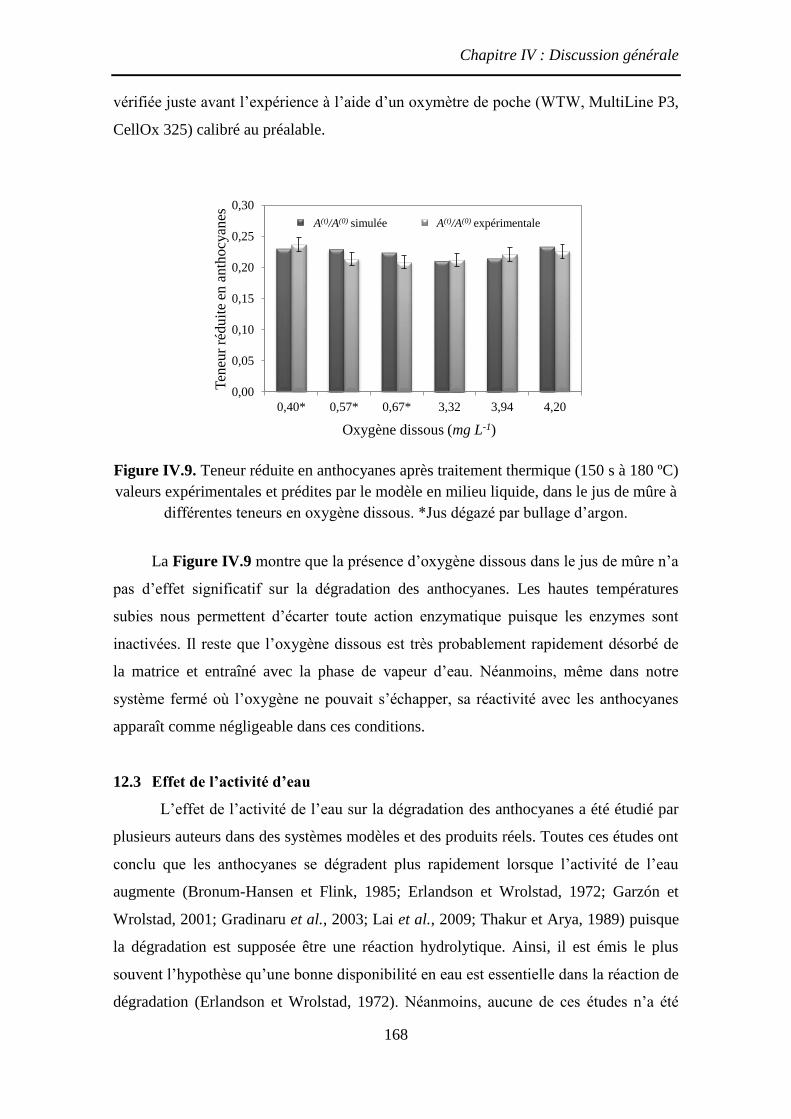
Chapitre IV : Discussion générale
168
vérifiée juste avant l’expérience à l’aide d’un oxymètre de poche (WTW, MultiLine P3,
CellOx 325) calibré au préalable.
Figure IV.9. Teneur réduite en anthocyanes après traitement thermique (150 s à 180 ºC)
valeurs expérimentales et prédites par le modèle en milieu liquide, dans le jus de mûre à
différentes teneurs en oxygène dissous. *Jus dégazé par bullage d’argon.
La Figure IV.9 montre que la présence d’oxygène dissous dans le jus de mûre n’a
pas d’effet significatif sur la dégradation des anthocyanes. Les hautes températures
subies nous permettent d’écarter toute action enzymatique puisque les enzymes sont
inactivées. Il reste que l’oxygène dissous est très probablement rapidement désorbé de
la matrice et entraîné avec la phase de vapeur d’eau. Néanmoins, même dans notre
système fermé où l’oxygène ne pouvait s’échapper, sa réactivité avec les anthocyanes
apparaît comme négligeable dans ces conditions.
12.3 Effet de l’activité d’eau
L’effet de l’activité de l’eau sur la dégradation des anthocyanes a été étudié par
plusieurs auteurs dans des systèmes modèles et des produits réels. Toutes ces études ont
conclu que les anthocyanes se dégradent plus rapidement lorsque l’activité de l’eau
augmente (Bronum-Hansen et Flink, 1985; Erlandson et Wrolstad, 1972; Garzón et
Wrolstad, 2001; Gradinaru et al., 2003; Lai et al., 2009; Thakur et Arya, 1989) puisque
la dégradation est supposée être une réaction hydrolytique. Ainsi, il est émis le plus
souvent l’hypothèse qu’une bonne disponibilité en eau est essentielle dans la réaction de
dégradation (Erlandson et Wrolstad, 1972). Néanmoins, aucune de ces études n’a été
0,00
0,05
0,10
0,15
0,20
0,25
0,30
0,40* 0,57* 0,67* 3,32 3,94 4,20
Ten
eur
réd
uit
e en
an
tho
cyan
es
Oxygène dissous (mg L-1)
A(t)/A(0) simulée A(t)/A(0) expérimentaleA(t)/A(0) simulée A(t)/A(0) expérimentale

Chapitre IV : Discussion générale
169
réalisée à des températures supérieures à 100 ºC.
Pourtant, les résultats obtenus par notre modèle cinétique en milieu bi-phasique
(Chapitre III, Publication #2 et #3) montrent que la réduction de l’activité de l’eau a au
contraire un effet négatif sur la stabilité des anthocyanes de jus de mûre soumis à un
traitement à haute température. Pour expliquer ces résultats contradictoires entre la
littérature et notre étude (Chapitre III, Publication #2), on peut émettre l’hypothèse que
la dégradation des anthocyanes dans le jus de mûre à haute température est due
principalement à des réactions de condensation entre le 5-hydroxyméthylfurfural (HMF,
produit de la dégradation des sucres) et les anthocyanes (Debicki-Pospisil et al., 1983;
Es-Safi et al., 2000). Ce mécanisme de condensation et non d’hydrolyse serait favorisé,
puisque la formation des HMF, et les réactions de condensation sont favorisées aux
faibles valeurs d’activité de l’eau.
Figure IV.10. Représentation de la constante de réaction à 120 ºC de la dégradation des
anthocyanes en fonction de l’activité de l’eau (kref=f(aw)), de la teneur en eau en base
humide (kref=f(WMF)) et en base sèche (kref=f(WMS)).
Sur la Figure IV.10 on peut observer la constante de réaction à la température
de référence (kref) en fonction de l’activité de l’eau (aw), de la teneur en eau en base
humide (WMF) et en base sèche (WMS). La variable d’état qui représente le mieux la
disponibilité de l’eau pour une éventuelle réaction de dégradation des anthocyanes à
haute température est l’activité de l’eau à 25 ºC. Aussi, il faut considérer que l’activité
de l’eau varie en fonction de la température selon l’équation de Clausius-Clapeyron
(équation (75)) :
2
1
,
, 1 2
1 1ln
w T st
w T
a H
a R T T
(75)
où Hst est l’excès de chaleur de sorption à la teneur en eau de l’échantillon (Tsimidou
et Biliaderis, 1997). Cette formule implique qu’une augmentation de la température
0,2 0,4 0,6 0,8 1,0
1
2
3
4
Activité en eau à 25°C
kre
f (x1
0-3
s-1
)
kref
= f(aw
)
0,0 0,5 1,0
1
2
3
4
Teneur en eau (kg kg-1
MF)
kre
f (x1
0-3
s-1
)
kref
= f(WMF
)
0 5 100
1
2
3
4
Teneur en eau (kg kg-1
MS)
kre
f (x1
0-3
s-1
)
kref
= f(WMS
)
Chapitre IV : Discussion générale
170
entraîne également une augmentation de l’activité de l’eau, pour une teneur en eau
constante. Néanmoins, il est très difficile de mesurer l’activité de l’eau d’un produit en
équilibre à haute température (100 à 160 ºC) et pour représenter le potentiel
d’engagement de l’eau dans la réaction de dégradation des anthocyanes, nous avons
choisi comme référence de variable d’état, l’activité de l’eau initiale à 25 ºC.
12.4 Effet du sucre ajouté
L’effet des sucres ajoutés sur la stabilité des anthocyanes dépend de différents
facteurs, comme la température, la concentration et le type de sucre. Certaines études
ont été effectuées pour élucider ces effets, révélant des résultats contradictoires. Par
exemple, un effet protecteur d’une concentration élevée en saccharose (>20 %) a été
rapporté pour les anthocyanes des fraises congelées (Wrolstad et al., 1990) et pour le
calice du bissap à températures de 30 à 60ºC (Tsai et al., 2004). Cet effet protecteur a
été attribué à la diminution de l’activité de l’eau causée par la présence de solutés. En
revanche, Rubinskiene et al. (2005) ont montré que l’addition de 10 % et 20 % de
saccharose réduit la thermo-stabilité des anthocyanes du cassis traité à 70 ºC pendant
2 h, tandis que l’accroissement supplémentaire de la teneur en saccharose jusqu’à 40 %
a un effet positif sur leur stabilité. D’autre part, la stabilité thermique des pigments de
cassis diminue linéairement avec l’augmentation de la teneur en fructose ajouté,
probablement due à la formation de furaldehydes (Debicki-Pospisil et al., 1983).
Finalement, Malien-Aubert et al. (2001) et Sadilova et al. (2009) ont observé que
l’addition de concentrations faibles en saccharose (<100 g L1
) auraient un effet
protecteur très faible sur la stabilité des anthocyanes de carotte noire à 95 ºC et de
sureau à 50 ºC, respectivement.
La Figure IV.11 présente les résultats d’un essai complémentaire qui a évalué
l’impact de l’addition de saccharose sur la stabilité thermique des anthocyanes dans le
jus de mûre reconstitué traité à haute température (140 ºC). Même si une faible tendance
peut être observée sur la stabilité des anthocyanes, les différences trouvées ne sont pas
statistiquement significatives (p <0,05). Pourtant, dans le système bi-phasique jus-sable,
la constante de réaction de dégradation des anthocyanes était multipliée par 2 lorsque
l’activité de l’eau diminuait de 0,99 à 0,95 (Chapitre III, Publication #2 et #3).

Chapitre IV : Discussion générale
171
Figure IV.11. Teneur en anthocyanes, avant et après un traitement thermique (180 s à
140 ºC), dans le jus de mûre formulé à trois teneurs en saccharose ajouté (aw 0,99 à
0,0 kg kg1
; aw 0,97 à 0,25 kg kg1
; aw 0,95 à 0,4 kg kg1
)
Dans notre système d’étude, nous avions utilisé du jus lyophilisé et du sable qui
nous permettait de moduler l’aw tout en restant relativement inerte vis-à-vis des
anthocyanes même à haute température. Dans le cas de l’addition de sucre, nous ne
pouvons pas observer indépendamment l’effet du soluté et l’effet dépresseur de
l’activité de l’eau. L’addition de saccharose conduit à une modification de l’aw. Ainsi, si
l’on compare avec nos résultats expérimentaux obtenus sur le produit modèle jus-sable,
par différence, on peut déduire que le saccharose semble avoir un effet protecteur sur les
anthocyanes et cet effet est contrebalancé par l’effet antagoniste de la réduction de l’aw.
Il convient de préciser que l’effet protecteur peut être dû au saccharose lui-même ou aux
produits des réactions qu’il peut avoir suscitées au cours du traitement thermique à
haute température.
0
100
200
300
400
500
0,00 0,25 0,40
An
tho
cyan
es (
mg
L-1
)
Teneur en saccharose ajouté (kg kg-1)
Jus de mûre formulé
sans traitement, A(0)
T:140ºC, t:180 s, A(t)
A(t)/A(0)
0,55 0,02a A(t)/A(0)
0,54 0,03a
A(t)/A(0)
0,57 0,02a

Chapitre IV : Discussion générale
172
13 Comment construire un procédé séquentiel de formulation suivi
d’un traitement à haute température ?
La formulation d’un aliment en anthocyanes par l’opération de DII aboutit à des
produits à humidités intermédiaires (aw > 0,94) instables microbiologiquement qui
nécessitent un traitement ultérieur. La stérilisation et la friture sont les deux opérations
proposées dans cette étude, pour stabiliser le produit par effet thermique associé ou non
à la réduction de l’aw. Dans le cas de la stérilisation pour des matrices végétales
(pH > 4,5), telle que la papaye verte préalablement blanchie avant la DII, l’objectif est
d’atteindre une valeur stérilisatrice F0=2,8 min (Tref=121,1 ºC, z=10 ºC) pour garantir
l’innocuité sanitaire. Quand à l’opération de friture, la baisse de l’activité de l’eau des
chips proche de aw 0,4 garantie la stabilité à température ambiante. Ces deux cibles
F0=2,8 min et aw 0,4, sont les deux valeurs retenues pour raisonner le séquençage
respectivement du procédé de la DII suivie d’une stérilisation et de la DII suivie d’une
friture. Par la suite, outre l’analyse de l’opération de DII pour formuler les anthocyanes
dans la papaye verte, l’impact des deux traitements à haute température sur le devenir
des anthocyanes sera discuté. Enfin, l’analyse proposera une critique des hypothèses de
notre démarche qui s’appuie sur divers outils de modélisation (aliment modèle, modèles
cinétiques, modèle de friture) nécessaire pour découpler les phénomènes mis en jeu et
aider à l’interprétation.
13.1 La formulation d’anthocyanes par DII
L’opération de DII des tranches de papaye verte (1,5 mm d’épaisseur) permet de
déshydrater et formuler simultanément en saccharose et en anthocyanes. L’effet de la
température de traitement et de la molalité du saccharose ajouté (msaccharose) sur le
transfert de matière pendant la DII a été analysé dans la Publication #4 (Chapitre III).
Un plan d’expériences a été utilisé pour modéliser la perte en eau (WL), le gain en
saccharose (SG) et le gain en anthocyanes (AG) à l’équilibre en fonction des variables
opératoires. Pour toutes les réponses (WL, SG et AG), le transfert de matière survient
principalement dans les cinq premières minutes d’immersion et la molalité du
saccharose (msaccharose) a été le facteur principal ayant affecté toutes les réponses. La
différence de concentration en saccharose entre la papaye verte et la solution est le
moteur des transports en DII. Une augmentation de la molalité en saccharose augmente

Chapitre IV : Discussion générale
173
le niveau de perte en eau de la papaye verte, ainsi que le gain en saccharose. En
revanche, même à l’équilibre des transferts, le gain en anthocyanes est réduit par
l’addition de saccharose. Ce phénomène trouve son explication par un effet barrière du
saccharose vis-à-vis des anthocyanes (cyanidine 3-glucoside, MM=449 g mol). Ce
phénomène est observé en particulier dans le cas de solutions ternaires sel/sucres où la
présence de sucres limite les entrées de sel (Bohuon et al., 1998). Le saccharose
augmente la viscosité de la solution et diminuerait de fait le coefficient de diffusion de
cet anthocyane (cyanidine 3-glucoside).
La température est supposée avoir un effet importante sur la DII, car elle
augmente la dynamique des transferts de matière, diminue la viscosité de la solution
hypertonique, et améliore le coefficient de diffusion de l’eau (Lenart et Lewicki, 2006).
En revanche à l’équilibre des transferts, la température (30 à 70 ºC) a eu un effet moins
important par rapport à msaccharose. Ceci provient d’une part parce que la papaye a été
blanchie préalablement à la DII et d’autre part la dégradation thermique des
anthocyanes lors de la DII peut-être considérée comme négligeable (T ≤ 70 ºC et
t ≤ 60 min). Le faible effet de la dégradation des anthocyanes sur le jus de mûre
(R. adenotrichus) traité dans nos conditions a été confirmé préalablement (Cisse et al.,
2009). Ainsi, l’orientation de l’opération de DII vers une déshydratation poussée de la
papaye verte ou une formulation directe d’anthocyanes peut être réalisée par le choix de
la concentration en saccharose (msaccharose). L’activité de l’eau en sortie de DII (T=50 ºC)
est ainsi comprise entre aw 0,95 et 0,99 pour des concentrations de saccharose de
msaccharose=3,0 et 0,0 mol kg1
, respectivement.
13.2 La DII suivie d’une stérilisation
Afin d’évaluer l’effet de la stérilisation sur les anthocyanes présents dans la
papaye verte en sortie de DII, un « simulateur » a été développé. Il associe le plan
d’expériences des transferts de matière en DII, le modèle cinétique réactionnel des
anthocyanes en milieu bi-phasique ainsi qu’un barème de stérilisation (Figure IV.12).
Nous faisons l’hypothèse que la thermo-dégradation des anthocyanes présents dans la
papaye verte suit la même cinétique que dans le milieu modèle (jus de mûre
lyophilisé+sable de Fontainebleau).

Chapitre IV : Discussion générale
174
Figure IV.12. Schéma du procédé d’obtention des tranches de papaye verte-jus de mûre
formulées par DII et stérilisées, suivant les variables opératoires et les caractéristiques
des produits à la sortie de chaque opération (W, S, A et aw sont respectivement la teneur
en eau, en sucre, en anthocyanes et l’activité de l’eau).
Selon nos résultats, la réduction de l’aw produit par l’opération de DII aboutit à
une augmentation de la réactivité des anthocyanes dans le produit formulé. En principe,
effectuer cette DII serait contre-productif comme le montre la Figure III.4.5
(Chapitre III, Publication #4). Dans cette analyse, qui ne considère pas l’effet protecteur
du saccharose, la concentration réduite en anthocyanes (A(t)
/A(0)
), après traitement de
stérilisation, diminuerait avec l’augmentation de la molalité en saccharose ajouté lors du
traitement de DII. La teneur en anthocyanes dans le produit stérilisé serait d’autant plus
faible que la concentration en anthocyanes après la DII est faible. Ceci provient de
l’effet double du sucre qui limite l’imprégnation en anthocyanes et diminue l’activité de
l’eau, ce qui, sans prendre en compte un effet protecteur, augmente la réactivité des
anthocyanes. Dans ces conditions, il est préférable de promouvoir l’incorporation du jus
de mûre dans la matrice et d’éviter la déshydratation du produit lors de l’opération de la
DII (msaccharose < 1 mol kg–1), afin d’obtenir un produit riche en anthocyanes avec une
haute activité de l’eau. En revanche l’absence de sucre aboutirait à des produits trop
acides.
Sans surprise, les simulations recommandent des barèmes de stérilisation de type
hautes ou ultra-hautes températures et temps très courts (HTST ou UHT). Dans ce cas, il
convient de mentionner que l’effet du traitement thermique est relativement faible et
l’étape de formulation devient plus prépondérante pour obtenir des produits finaux
riches en anthocyanes. Par exemple, pour une DII à faible concentration de saccharose
ajouté (msaccharose= 0,3 mol kg1
), 92 % de la teneur en anthocyanes peut être conservé,
pour une teneur finale en anthocyanes de A(t)
=550 mg kg1
papaye verte (PV). Pour
comparaison, pour une DII riche en sucre (msaccharose= 2,6 mol kg1
), 80% du capital des
↑A(t)
Tsol msaccharose T∞ t
DII Stérilisation(F0=2,8 min)
Papaye
verte
Jus de
mûre
Tranche de
papaye verte
formulé et
steriliséW(0)
S(0)
aw(0), A(0)
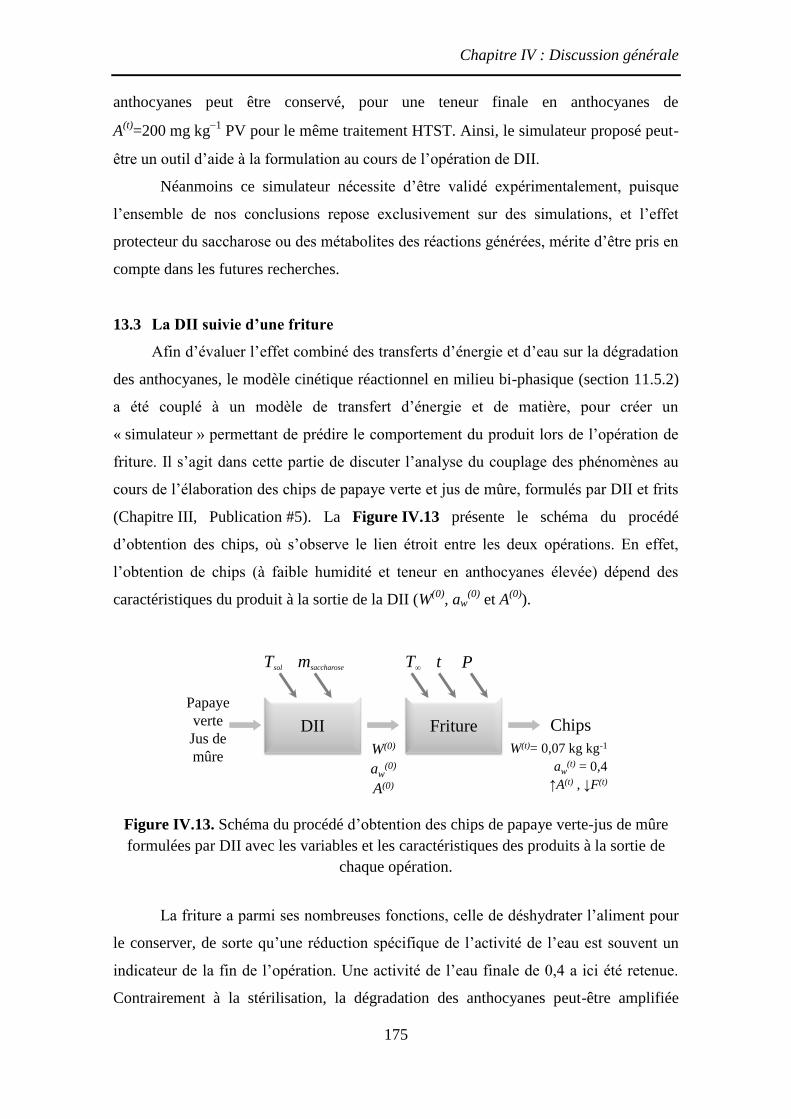
Chapitre IV : Discussion générale
175
anthocyanes peut être conservé, pour une teneur finale en anthocyanes de
A(t)
=200 mg kg1
PV pour le même traitement HTST. Ainsi, le simulateur proposé peut-
être un outil d’aide à la formulation au cours de l’opération de DII.
Néanmoins ce simulateur nécessite d’être validé expérimentalement, puisque
l’ensemble de nos conclusions repose exclusivement sur des simulations, et l’effet
protecteur du saccharose ou des métabolites des réactions générées, mérite d’être pris en
compte dans les futures recherches.
13.3 La DII suivie d’une friture
Afin d’évaluer l’effet combiné des transferts d’énergie et d’eau sur la dégradation
des anthocyanes, le modèle cinétique réactionnel en milieu bi-phasique (section 11.5.2)
a été couplé à un modèle de transfert d’énergie et de matière, pour créer un
« simulateur » permettant de prédire le comportement du produit lors de l’opération de
friture. Il s’agit dans cette partie de discuter l’analyse du couplage des phénomènes au
cours de l’élaboration des chips de papaye verte et jus de mûre, formulés par DII et frits
(Chapitre III, Publication #5). La Figure IV.13 présente le schéma du procédé
d’obtention des chips, où s’observe le lien étroit entre les deux opérations. En effet,
l’obtention de chips (à faible humidité et teneur en anthocyanes élevée) dépend des
caractéristiques du produit à la sortie de la DII (W(0)
, aw(0)
et A(0)
).
Figure IV.13. Schéma du procédé d’obtention des chips de papaye verte-jus de mûre
formulées par DII avec les variables et les caractéristiques des produits à la sortie de
chaque opération.
La friture a parmi ses nombreuses fonctions, celle de déshydrater l’aliment pour
le conserver, de sorte qu’une réduction spécifique de l’activité de l’eau est souvent un
indicateur de la fin de l’opération. Une activité de l’eau finale de 0,4 a ici été retenue.
Contrairement à la stérilisation, la dégradation des anthocyanes peut-être amplifiée
W(t)= 0,07 kg kg-1
aw(t) = 0,4
↑A(t) , ↓F(t)
Tsol msaccharose T∞ t P
DII Friture
Papaye
verte
Jus de
mûre
Chips
W(0)
aw(0)
A(0)

Chapitre IV : Discussion générale
176
durant la friture par deux processus liés à la forte déshydratation. D’une part la baisse
progressive de l’activité de l’eau augmente la réactivité des anthocyanes ; et d’autre part
la diminution de l’activité de l’eau du produit provoque, dans le domaine
hygroscopique, une augmentation de la température du produit et ainsi une plus forte
dégradation des anthocyanes. Température et activité de l’eau du produit ne sont pas
indépendantes et la trajectoire thermo-hydrique en chaque point du produit conditionne
la réaction des anthocyanes.
La Figure IV.14 présente la trajectoire thermo-hydrique suivie par trois produits
formulés à différentes concentrations de saccharose ajouté (msaccharose : 0,0 ; 1,5 et
3,0 mol kg1
; ce qui donne aw(0)
0,98 ; 0,94 et 0,92 respectivement), au cours de
l’opération de friture afin d’atteindre une activité de l’eau finale de aw(t)
0,4
(W(t)
=0,07 kg kg1
MS). Les cinétiques de dégradation des anthocyanes (A(t)
/A(0)
) sont
simulées selon le traitement thermique suivi par chaque produit. Il a été observé qu’une
faible variation de l’activité de l’eau initiale (aw(0)
) provoque un changement significatif
dans la trajectoire à suivre pour atteindre la valeur cible d’aw. Un changement de
aw(0)
0,98 à 0,94 entraîne une réduction de la durée de traitement de 225 à 75 s.
Figure IV.14. Simulation des trajectoires thermo-hydriques et cinétiques de dégradation
des anthocyanes au cours du traitement thermique de friture (cœur) de produits à trois
différentes teneurs en eau initiales
Contrairement à l’analyse précédente (stérilisation), la concentration réduite en
anthocyanes (A(t)
/A(0)), après l’opération de friture, augmente avec celle de la molalité
en saccharose ajouté (msaccharose) du traitement de DII. Néanmoins, cette hausse a été
insuffisante pour compenser les différences considérables entre les teneurs initiales en
anthocyanes (A(0)
). Ainsi, la teneur en anthocyanes (A(t)
) dans le produit fini diminue
20 40 60 80 100 120
0
2
4
6
8 Trajectoire thermohydrique au cœur
Température (ºC)
Ten
eur
en e
au (
kg k
g-1
MS
)
0 50 100 150 200
0,6
0,8
1,0 Anthocyanes réduite
Temps (s)
A(t
) /A(0
)
aw
(0)=0,98; A
(0)=3365 mg kg
-1
aw
(0)=0,94; A
(0)=640 mg kg
-1
aw
(0)=0,92; A
(0)=320 mg kg
-1
aw
(0)=0,98; t=225 s
aw
(0)=0,94; t=75 s
aw
(0)=0,92; t=50 s
W(t)
W(0)
W(0)
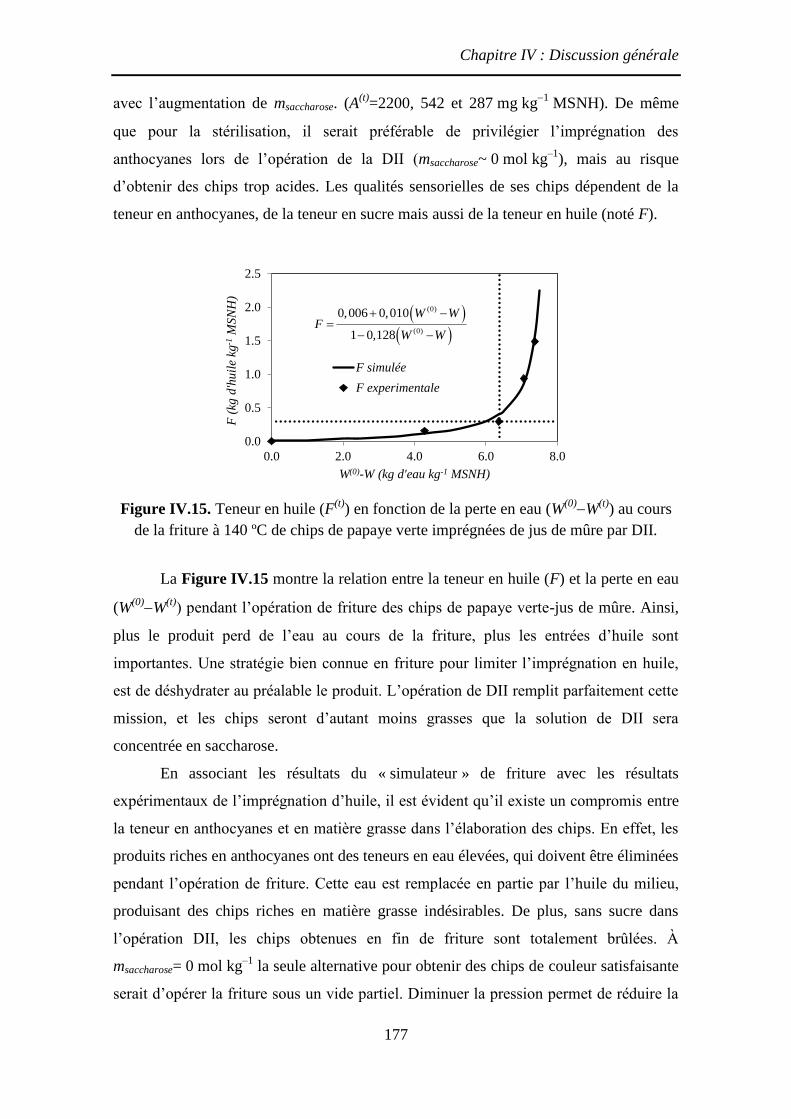
Chapitre IV : Discussion générale
177
avec l’augmentation de msaccharose. (A(t)
=2200, 542 et 287 mg kg1
MSNH). De même
que pour la stérilisation, il serait préférable de privilégier l’imprégnation des
anthocyanes lors de l’opération de la DII (msaccharose~ 0 mol kg–1
), mais au risque
d’obtenir des chips trop acides. Les qualités sensorielles de ses chips dépendent de la
teneur en anthocyanes, de la teneur en sucre mais aussi de la teneur en huile (noté F).
Figure IV.15. Teneur en huile (F(t)
) en fonction de la perte en eau (W(0)W
(t)) au cours
de la friture à 140 ºC de chips de papaye verte imprégnées de jus de mûre par DII.
La Figure IV.15 montre la relation entre la teneur en huile (F) et la perte en eau
(W(0)W
(t)) pendant l’opération de friture des chips de papaye verte-jus de mûre. Ainsi,
plus le produit perd de l’eau au cours de la friture, plus les entrées d’huile sont
importantes. Une stratégie bien connue en friture pour limiter l’imprégnation en huile,
est de déshydrater au préalable le produit. L’opération de DII remplit parfaitement cette
mission, et les chips seront d’autant moins grasses que la solution de DII sera
concentrée en saccharose.
En associant les résultats du « simulateur » de friture avec les résultats
expérimentaux de l’imprégnation d’huile, il est évident qu’il existe un compromis entre
la teneur en anthocyanes et en matière grasse dans l’élaboration des chips. En effet, les
produits riches en anthocyanes ont des teneurs en eau élevées, qui doivent être éliminées
pendant l’opération de friture. Cette eau est remplacée en partie par l’huile du milieu,
produisant des chips riches en matière grasse indésirables. De plus, sans sucre dans
l’opération DII, les chips obtenues en fin de friture sont totalement brûlées. À
msaccharose= 0 mol kg–1
la seule alternative pour obtenir des chips de couleur satisfaisante
serait d’opérer la friture sous un vide partiel. Diminuer la pression permet de réduire la
0.0
0.5
1.0
1.5
2.0
2.5
0.0 2.0 4.0 6.0 8.0
F (
kg d
'hu
ile
kg-1
MS
NH
)
W(0)-W (kg d'eau kg-1 MSNH)
F simulée
F experimentale
(0)
(0)
0,006 0,010
1 0,128
W WF
W W
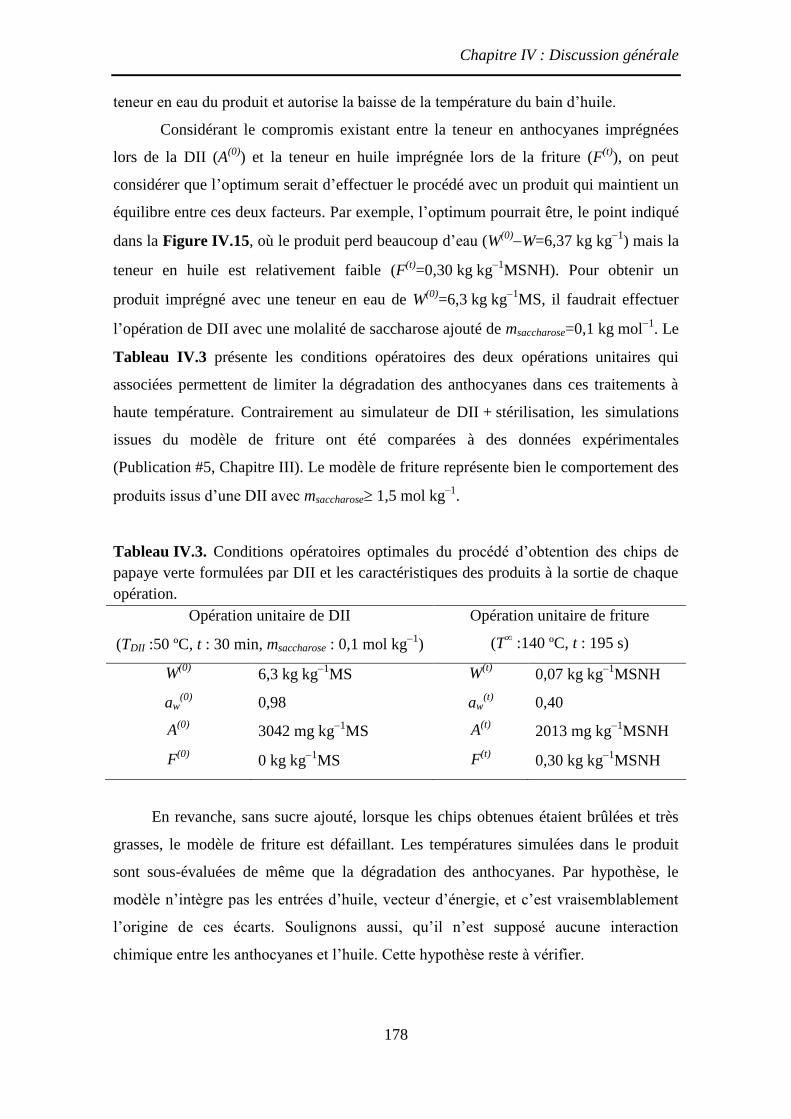
Chapitre IV : Discussion générale
178
teneur en eau du produit et autorise la baisse de la température du bain d’huile.
Considérant le compromis existant entre la teneur en anthocyanes imprégnées
lors de la DII (A(0)
) et la teneur en huile imprégnée lors de la friture (F(t)
), on peut
considérer que l’optimum serait d’effectuer le procédé avec un produit qui maintient un
équilibre entre ces deux facteurs. Par exemple, l’optimum pourrait être, le point indiqué
dans la Figure IV.15, où le produit perd beaucoup d’eau (W(0)W=6,37 kg kg
1) mais la
teneur en huile est relativement faible (F(t)
=0,30 kg kg1
MSNH). Pour obtenir un
produit imprégné avec une teneur en eau de W(0)
=6,3 kg kg1
MS, il faudrait effectuer
l’opération de DII avec une molalité de saccharose ajouté de msaccharose=0,1 kg mol1
. Le
Tableau IV.3 présente les conditions opératoires des deux opérations unitaires qui
associées permettent de limiter la dégradation des anthocyanes dans ces traitements à
haute température. Contrairement au simulateur de DII + stérilisation, les simulations
issues du modèle de friture ont été comparées à des données expérimentales
(Publication #5, Chapitre III). Le modèle de friture représente bien le comportement des
produits issus d’une DII avec msaccharose 1,5 mol kg–1
.
Tableau IV.3. Conditions opératoires optimales du procédé d’obtention des chips de
papaye verte formulées par DII et les caractéristiques des produits à la sortie de chaque
opération.
Opération unitaire de DII
(TDII :50 ºC, t : 30 min, msaccharose : 0,1 mol kg1
)
Opération unitaire de friture
(T∞ :140 ºC, t : 195 s)
W(0)
6,3 kg kg1
MS W(t)
0,07 kg kg1
MSNH
aw(0)
0,98 aw(t)
0,40
A(0)
3042 mg kg1
MS A(t)
2013 mg kg1
MSNH
F(0)
0 kg kg1
MS F(t)
0,30 kg kg1
MSNH
En revanche, sans sucre ajouté, lorsque les chips obtenues étaient brûlées et très
grasses, le modèle de friture est défaillant. Les températures simulées dans le produit
sont sous-évaluées de même que la dégradation des anthocyanes. Par hypothèse, le
modèle n’intègre pas les entrées d’huile, vecteur d’énergie, et c’est vraisemblablement
l’origine de ces écarts. Soulignons aussi, qu’il n’est supposé aucune interaction
chimique entre les anthocyanes et l’huile. Cette hypothèse reste à vérifier.
Chapitre IV : Discussion générale
179
13.4 Pertinence de la démarche de modélisation
13.4.1 Les milieux modèles
L’ensemble des résultats obtenus par simulation sont issus de la réactivité des
anthocyanes mesurée sur du jus de mûre préalablement lyophilisé, puis réhydraté et
mélangé avec ou sans sable de Fontainebleau pour obtenir des produits de faible aw et
manipulables. Le simulateur de friture de papaye verte formulée par DII a été en partie
validé et tend à signifier la pertinence de ces milieux modèles. Le comportement des
anthocyanes manifeste peu de sensibilité à la structure de la matrice (ici pecto-
cellulosique) et à d’éventuelles interactions chimiques. Les deux variables intensives
thermodynamiques, qui sont la température et l’activité de l’eau, semblent piloter
majoritairement l’avancement de la réaction des anthocyanes dans ces structures
végétales soumises à des transferts d’énergie et d’eau. L’activité de l’eau (aw) est
l’empreinte des effets conjoints d’une perte en eau et d’une entrée d’agent dépresseur tel
que le sucre. Le saccharose étant impliqué dans les réactions des anthocyanes, l’activité
de l’eau n’est pas suffisante pour prévoir le comportement des anthocyanes en présence
du sucre.
13.4.2 Modèle cinétique de dégradation
Sur le plan de la chimie des anthocyanes, le choix des schémas réactionnels
simples a été retenu. Autant pour le jus de mûre reconstitué que pour le milieu modèle
bi-phasique, sur un domaine de température inférieur a 140 ºC, la description de la
dégradation par une unique réaction d’ordre 1 apparaît convaincante, au-delà de 140 ºC
et jusqu’à 180 ºC, l’analyse cinétique prouve la nécessité de mobiliser une seconde
réaction d’ordre 1 sur ce domaine. Cette stratégie, certes efficace pour l’ajustement
numérique, reste peu convaincante en terme générique pour la compréhension d’un
schéma réactionnel explicatif, mettant par exemple en évidence des voies réactionnelles
favorisées dans certaines gammes de température. Un effort significatif a été consenti
pour décrire la dépendance des constantes de réaction k, en fonction de l’activité en eau
et de la température. La loi d’Arrhenius est efficace et des relations empiriques entre kref
et l’aw ont été proposées. En revanche, la concentration en sucre n’a pas été incorporée,
faute d’une base de données expérimentale suffisante sur l’effet du sucre. Dans
l’analyse du séquençage DII + traitement à haute température, la contribution des
interactions entre les sucres et les anthocyanes, s’affirme comme indispensable.
Chapitre IV : Discussion générale
180
13.4.3 Modèle de friture
Le modèle de friture développé par Bassama (2011) sur la friture du plantain et
transposé au cas de chips de papaye verte formulées, a été assez bien validé pour des
disques de papaye verte préalablement déshydratés par DII (msaccharose 1,5 mol kg–1
).
Ce modèle à front étalé mobilise une fonction créneau avec un unique paramètre
d’ajustement dans la loi de Darcy : la perméabilité apparente à la vapeur. Ce modèle
néglige en revanche l’imprégnation en huile. Cette hypothèse a été infirmée par des
papayes vertes formulées en anthocyanes, mais sans déshydratation
(msaccharose= 0 mol kg–1). Ce point reste contestable, de même que l’hypothèse d’absence
de transport d’eau liquide avec ces produits très riches en eau. Le transport d’eau
intense déjà constaté sur des produits similaires (pomme) installe le produit rapidement
dans le domaine hygroscopique et provoque une élévation rapide de la température du
produit (Vitrac et Bohuon, 2004). De plus, les anthocyanes étant hydrosolubles, le
transport d’eau est susceptible d’entraîner ces anthocyanes en périphérie du produit et
d’accroître leur dégradation. Il en est de même pour les sucres. Cependant, bien que
perfectible, ce modèle doit être envisagé comme un outil d’aide à la réflexion et au
raisonnement du couplage DII + friture.
Chapitre V : Conclusion générale et perspectives
181
Chapitre V : Conclusion générale et perspectives
Les anthocyanes sont les pigments naturels hydrosolubles qui offrent
l’alternative la plus économique aux colorants synthétiques. En plus, ces composés sont
également intéressants pour leurs bénéfices potentiels pour la santé, probablement
dérivés de leurs propriétés antioxydantes élevées. Cependant, ils se dégradent
facilement lors des procédés, étant très réactifs à l’oxygène, la lumière, le pH et la
température. Cette dernière en particulier, peut affecter considérablement la structure du
chromophore ainsi que ses propriétés fonctionnelles. Plusieurs auteurs ont étudié l’effet
de différents facteurs sur la stabilité des anthocyanes, mais peu d’étude ont évalué
l’impact des traitements thermiques à hautes températures (T>100 ºC), et aucun n’a
examiné l’effet combiné d’une baisse de l’activité de l’eau à des températures
supérieures à 100 ºC. S’appuyant sur ce constat, l’objectif de ce travail a été d’évaluer
l’impact des opérations thermiques à hautes températures (T>100 ºC) sur la dégradation
des anthocyanes par la caractérisation et modélisation des cinétiques réactionnelles et
des phénomènes de transferts (énergie et matière) mis en jeu. Pour avancer vers cet
objectif quatre démarches ont été menées à bien :
La conception et mise au point d‘un réacteur fermé qui a permis de dissocier les
transferts d’énergie et de matière afin de mieux les étudier puis de mieux
comprendre ensuite leur couplage lors d’un traitement thermique à haute
température en système ouvert, comme par exemple la friture.
L’analyse cinétique de la dégradation des anthocyanes et brunissement non-
enzymatique en milieu liquide (jus de mûre reconstitué) ; puis en milieu modèle bi-
phasique (jus de mûre-sable de Fontainebleau) afin d’évaluer l’impact d’une
réduction de l’activité de l’eau sur la dégradation des anthocyanes à très hautes
températures (100140 ºC) en système fermé.
L’analyse de l’impact de trois opérations unitaires (DII, stérilisation et friture) sur le
devenir des anthocyanes et l’évaluation de l’impact des processus de transfert
d’énergie avec ou sans transferts de matière impliqués dans la dégradation des
anthocyanes.
La proposition de règles de conduite de deux procédés associant chacun deux
opérations unitaires, une opération de formulation (DII) et un traitement à très haute
température (stérilisation et friture) afin de privilégier la conservation des
Chapitre V : Conclusion générale et perspectives
182
anthocyanes dans des produits réels à base de papaye verte. Pour la friture,
l’association a été réalisée à l’aide d’un modèle qui intègre les transferts de vapeur
et d’énergie et la cinétique réactionnelle
La caractérisation du réacteur s’est appuyée sur une modélisation en 3D qui
combine le transfert d’énergie et la réaction chimique, pour identifier les paramètres
cinétiques dans des conditions non-isothermes pour des aliments à humidité
intermédiaire. Des simulations ont permis d’éprouver ce réacteur en termes de
spatialisation des réactions dans son sein. Lorsque k120°C 1103
s1
et
Ea 100 kJ mol1
, la spatialisation des réactions liées au gradient de température
devient négligeable. En revanche, pour des paramètres cinétiques plus élevés il est
nécessaire de prendre en compte l’impact du gradient de température sur l’intensité des
réactions, par exemple pour les réactions d’inactivation microbienne et la dénaturation
des protéines.
L’hypothèse d’une réaction d’ordre 1 pour la dégradation des anthocyanes et le
brunissement non-enzymatique a permis de modéliser et de déterminer les paramètres
cinétiques suivant une méthode non-isotherme prenant en compte le profil de
température au sein du réacteur. Les paramètres estimés ont révélé une augmentation de
la constante de réaction de la dégradation des anthocyanes (k120ºC) de 0,9 à 3,5×10³
s-1
lorsque l’activité de l’eau diminue de 0,99 à 0,34. Il a ainsi mis en évidence l’impact
négatif d’une réduction de l’activité de l’eau sur la stabilité des anthocyanes lors de
traitement à hautes températures (T : 100140 ºC).
Ces résultats ont été validés sur une matrice alimentaire (papaye verte-jus de
mûre) soumise au couplage d’un procédé de formulation par DII suivi d’une opération
de friture, à l’aide d’un modèle qui intègre les transferts de vapeur et d’énergie et la
cinétique réactionnelle. L’intégration du modèle développé dans un modèle de friture a
permis une meilleure compréhension des phénomènes. Ce modèle peut être ainsi
incorporé dans une démarche d’optimisation séquentielle associant différentes
opérations unitaires avec des traitements thermiques á très hautes températures.
Au plan scientifique, l’originalité des résultats obtenus a permis de mettre en
évidence l’importance d’améliorer la compréhension des mécanismes impliqués dans
les réactions de dégradation thermique des anthocyanes. Les schémas réactionnels de
dégradations des anthocyanes a fortiori à hautes températures sont encore peu connus et
Chapitre V : Conclusion générale et perspectives
183
leur élucidation permettrait non seulement de mieux comprendre comment s’imbriquent
les réactions entre elles mais aussi quels sont les facteurs limitants qui gouvernent les
cinétiques observées. Ceci permettrait éventuellement de mieux comprendre comment
la présence d’eau libre, de sucres ou d’autres biomolécules peuvent moduler les
cinétiques observées.
Au plan technologique, l’intérêt des procédés alternatifs pour réduire l’effet
négatif des deux facteurs (température et activité de l’eau) est mis en évidence. Par
exemple, l’opération de friture sous vide, se justifie doublement afin de réduire la
température de saturation de l’eau en contrôlant la pression sous laquelle la friture
s’effectue et en permettant de travailler avec des produits à forte activité de l’eau. Par
contre, les résultats de cette étude, montrent que les autres alternatives qui pourraient
être envisagées pour limiter la perte en anthocyanes au cours du traitement de friture à
pression atmosphérique, comme des prétraitements de déshydratation, doivent être
analysés avec plus de précaution. Une opération de pré-séchage par exemple, entraine
une réduction de la teneur en eau des échantillons permettant des temps de friture plus
courts mais augmente aussi la réactivité des anthocyanes, ce qui aboutit à un nouveau
problème d’optimisation.
Notre démarche s’est donc montrée efficace pour la compréhension globale d’un
phénomène complexe. La modélisation est donc un outil adéquat qui dans le cadre
d’une approche multidisciplinaire des phénomènes rencontrés dans les procédés agro-
alimentaire représente une aide pertinente à la décision.
Références bibliographiques
184
Références bibliographiques
Acosta-Montoya, Ó., Vaillant, F., Cozzano, S., Mertz, C., Pérez, A., et Castro, M. (2010). Phenolic content and antioxidant capacity of tropical highland
blackberry (Rubus adenotrichus Schltdl.) during three edible maturity stages.
Food Chemistry, 119(4), 1497-1501.
Achir, N., Vitrac, O., et Trystram, G. (2008). Simulation and ability to control the
surface thermal history and reactions during deep fat frying. Chemical
Engineering and Processing: Process Intensification, 47(11), 1953-1967.
Adams, J. B. (1973). Thermal degradation of anthocyanins with particular reference to
the 3-glycosides of cyanidin. I. In acidified aqueous solution at 100°C. Journal
of the Science of Food and Agriculture, 24(7), 747-762.
Alzamora, S. M., Salvatori, D., Tapia, M. S., López-Malo, A., Welti-Chanes, J., et
Fito, P. (2005). Novel functional foods from vegetable matrices impregnated
with biologically active compounds. Journal of Food Engineering, 67(1-2), 205-
214.
Andersen, Ø. M. (2009). Recent Advances in the Field of Anthocyanins – Main Focus
on Structures. In Recent Advances in Polyphenol Research, F. Daayf & V.
Lattanzio (Eds.), Vol. 1. Oxford, UK: Wiley-Blackwell.
AOAC (1990). Fruits and fruits products. In Official Methods of Analysis of the
Association of Official Analytical Chemists International, K. Helrich (Ed.), (pp.
910-928). Arlington, USA.
Avallone, S., Rojas-Gonzalez, J. A., Trystram, G., et Bohuon, P. (2009). Thermal
Sensitivity of Some Plantain Micronutrients during Deep-Fat Frying. Journal of
Food Science, 74(5), C339-C347.
Awuah, G. B., Ramaswamy, H. S., et Economides, A. (2007). Thermal processing
and quality: Principles and overview. Chemical Engineering and Processing,
46(6), 584-602.
Baeza, R., Pérez, A., Sánchez, V., Zamora, M., et Chirife, J. (2010). Evaluation of
Norrish’s Equation for Correlating the Water Activity of Highly Concentrated
Solutions of Sugars, Polyols, and Polyethylene Glycols. Food and Bioprocess
Technology, 3(1), 87-92.
Banga, J. R., Alonso, A. A., Gallardo, J. M., et Pérez-Martín, R. I. (1993). Kinetics
of thermal degradation of thiamine and surface colour in canned tuna. Zeitschrift
für Lebensmitteluntersuchung und -Forschung A, 197(2), 127-131.
Bari, L., Hassan, P., Absar, N., Haque, M. E., Khuda, M. I. I. E., Pervin, M. M., et
al. (2006). Nutritional analysis of two local varieties of papaya (Carica papaya
L.) at different maturation stages. Pakistan Journal of Biological Sciences, 9(1),
137-140.

Références bibliographiques
185
Bassama, J. (2011). Étude expérimentale et modélisation de la formation de
l’acrylamide lors de l’opération de friture: cas du plantain. Thèse de Doctorat
en Génie des Procédés, Université Montpellier 2, Montpellier, France.
Bassama, J., Brat, P., Boulanger, R., Z.Günata, et Bohuon, P. (2011). Modelling
deep-fat frying for control of acrylamide reaction in plantain. Manuscript
sumbitted for publication.
Basu, A., Rhone, M., et Lyons, T. J. (2010). Berries: emerging impact on
cardiovascular health. Nutrition Reviews, 68(3), 168-177.
BeMiller, J. N., et Whistler, R. L. (1996). Carbohydrates. In Food Chemistry, O. R.
Fennema (Ed.), (3rd ed.) (pp. 157–224). New York: Marcel Dekker, Inc.
Benvenuti, S., Pellati, F., Melegari, M., et Bertelli, D. (2004). Polyphenols,
anthocyanins, ascorbic acid, and radical scavenging activity of Rubus, Ribes,
and Aronia. Journal of Food Science, 69(3), C164-C169.
Bohuon, P., Collignan, A., Rios, G. M., et Raoult-Wack, A. L. (1998). Soaking
process in ternary liquids: Experimental study of mass transport under natural
and forced convection. Journal of Food Engineering, 37(4), 451-469.
Bohuon, P., et Raoult-Wack, A.-L. (2002). Procédé de déshydratation osmotique. In
L'eau dans les aliments : aspects fondamentaux, signification dans les propriétés
sensorielles des aliments et dans la conduite des procédés, M. Le Meste, D.
Simatos & D. Lorient (Eds.), (pp. 405-428). Paris: Lavoisier Tec & Doc
Bronum-Hansen, K., et Flink, J. M. (1985). Anthocyanin colourants from elderberry
(Sambucus nigra L.). 3. Storage stability of the freeze dried product.
International Journal of Food Science & Technology, 20, 725–733.
Buckow, R., Kastell, A., Terefe, N. S., et Versteeg, C. (2010). Pressure and
Temperature Effects on Degradation Kinetics and Storage Stability of Total
Anthocyanins in Blueberry Juice. Journal of Agricultural and Food Chemistry,
58(18), 10076-10084.
Buglione, M., et Lozano, J. (2002). Nonenzymatic browning and chemical changes
during grape juice storage. Journal of Food Science, 67(4), 1538-1543.
Camire, M. E., Chaovanalikit, A., Dougherty, M. P., et Briggs, J. (2002). Blueberry
and grape anthocyanins as breakfast cereal colorants. Journal of Food Science,
67(1), 438-441.
Cao, S. Q., Liu, L., Pan, S. Y., Lu, Q., et Xu, X. Y. (2009). A Comparison of Two
Determination Methods for Studying Degradation Kinetics of the Major
Anthocyanins from Blood Orange. Journal of Agricultural and Food Chemistry,
57(1), 245-249.
Carrieri, G., De Bonis, M. V., Pacella, C., Pucciarelli, A., et Ruocco, G. (2009).
Références bibliographiques
186
Modeling and validation of local acrylamide formation in a model food during
frying. Journal of Food Engineering, 95(1), 90-98.
Carson, J. K., Lovatt, S. J., Tanner, D. J., et Cleland, A. C. (2006). Predicting the
effective thermal conductivity of unfrozen, porous foods. Journal of Food
Engineering, 75(3), 297-307.
Cemeroglu, B., Velioglu, S., et Isik, S. (1994). Degradation Kinetics of Anthocyanins
in Sour Cherry Juice and Concentrate. Journal of Food Science, 59(6), 1216-
1218.
Cisse, M., Vaillant, F., Acosta, O., Dhuique-Mayer, C., et Dornier, M. (2009).
Thermal Degradation Kinetics of Anthocyanins from Blood Orange, Blackberry,
and Roselle Using the Arrhenius, Eyring, and Ball Models. Journal of
Agricultural and Food Chemistry, 57(14), 6285-6291.
Clifford, M. N., et Scalbert, A. (2000). Ellagitannins - nature, occurrence and dietary
burden. Journal of the Science of Food and Agriculture, 80(7), 1118-1125.
Corradini, M. G., et Peleg, M. (2006). Linear and non-linear kinetics in the synthesis
and degradation of acrylamide in foods and model systems. Critical Reviews in
Food Science and Nutrition, 46(6), 489-517.
Costa, R. M., Oliveira, F. A. R., Delaney, O., et Gekas, V. (1999). Analysis of the
heat transfer coefficient during potato frying. Journal of Food Engineering,
39(3), 293-299.
Da Silva, P. F., et Moreira, R. G. (2008). Vacuum frying of high-quality fruit and
vegetable-based snacks. LWT - Food Science and Technology, 41(10), 1758-
1767.
Debicki-Pospisil, J., Lovric, T., Trinajstic, N., et Sabljic, A. (1983). Anthocyanin
Degradation in the Presence of Furfural and 5-Hydroxymethylfurfural. Journal
of Food Science, 48(2), 411-416.
Dolan, K. D. (2003). Estimation of kinetic parameters for nonisothermal food
processes. Journal of Food Science, 68(3), 728-741.
Dolan, K. D., Yang, L., et Trampel, C. P. (2007). Nonlinear regression technique to
estimate kinetic parameters and confidence intervals in unsteady-state
conduction-heated foods. Journal of Food Engineering, 80(2), 581-593.
Erlandson, J. A., et Wrolstad, R. E. (1972). Degradation of Anthocyanins at Limited
Water Concentration. Journal of Food Science, 37(4), 592-595.
Es-Safi, N.-E., Cheynier, V., et Moutounet, M. (2000). Study of the Reactions
between (+)-Catechin and Furfural Derivatives in the Presence or Absence of
Anthocyanins and Their Implication in Food Color Change. Journal of
Agricultural and Food Chemistry, 48(12), 5946-5954.
Références bibliographiques
187
Es-Safi, N. E., Cheynier, V., et Moutounet, M. (2002). Interactions between cyanidin
3-O-glucoside and furfural derivatives and their impact on food color changes.
Journal of Agricultural and Food Chemistry, 50(20), 5586-5595.
Fan-Chiang, H. J., et Wrolstad, R. E. (2005). Anthocyanin pigment composition of
blackberries. Journal of Food Science, 70(3), C198-C202.
Farkas, B. E., Singh, R. P., et Rumsey, T. R. (1996a). Modeling heat and mass
transfer in immersion frying. II, model solution and verification. Journal of
Food Engineering, 29(2), 227-248.
Farkas, B. E., Singh, R. P., et Rumsey, T. R. (1996b). Modeling heat and mass
transfer in immersion frying. I, model development. Journal of Food
Engineering, 29(2), 211-226.
Francis, J. A. (1994). Agro-processing opportunities for green and ripe
papaya/pawpaw in the Caribbean. Jamaica: Caribbean Industrial Research
Institute.
Furtado, P., Figueiredo, P., Chaves das Neves, H., et Pina, F. (1993). Photochemical
and thermal degradation of anthocyanidins. Journal of Photochemistry and
Photobiology A: Chemistry, 75(2), 113-118.
Gancel, A. L., Alter, P., Dhuique-Mayer, C., Ruales, J., et Vaillant, F. (2008).
Identifying Carotenoids and Phenolic Compounds In Naranjilla (Solanum
quitoense Lam. Var. Puyo Hybrid), an Andean Fruit. Journal of Agricultural
and Food Chemistry, 56(24), 11890-11899.
Garrote, R. L., Silva, E. R., et Bertone, R. A. (2001). Kinetic parameters for thermal
inactivation of cut green beans lipoxygenase calculated using unsteady-state
methods. International Journal of Food Science & Technology, 36, 377–385.
Garzón, G. A., et Wrolstad, R. E. (2001). The stability of pelargonidin-based
anthocyanins at varying water activity. Food Chemistry, 75(2), 185-196.
George, S., Brat, P., Alter, P., et Amiot, M. J. (2005). Rapid determination of
polyphenols and vitamin C in plant-derived products. Journal of Agricultural
and Food Chemistry, 53(5), 1370-1373.
Giusti, M. M., et Wrolstad, R. E. (2001). Anthocyanins. Characterization and
Measurement with UV-Visible Spectroscopy. In Current Protocols in Food
Analytical Chemistry, (pp. F1.2.1 - F1.2.13). New York: John Wiley & Sons,
Inc.
Giusti, M. M., et Jing, P. (2007). Natural pigments of berries: Functionality and
application. In Berry fruit: Value-added products for health promotion, Y. Zhao
(Ed.), (pp. 105-146). Boca Raton, FL: CRC Press, Taylor & Francis Group,
LLC.
Gradinaru, G., Biliaderis, C. G., Kallithraka, S., Kefalas, P., et Garcia-Viguera, C.
Références bibliographiques
188
(2003). Thermal stability of Hibiscus sabdariffa L. anthocyanins in solution and
in solid state: effects of copigmentation and glass transition. Food Chemistry,
83(3), 423-436.
Grenier, D., Bohuon, P., Méot, J. M., et Baillères, H. (2010). Insights into fry-drying
process of wood through a simplified approach of heat and mass transport
phenomena. Chemical Engineering and Processing: Process Intensification,
49(5), 490-499.
Halder, A., Dhall, A., et Datta, A. K. (2007). An Improved, Easily Implementable,
Porous Media Based Model for Deep-Fat Frying: Part II: Results, Validation and
Sensitivity Analysis. Food and Bioproducts Processing, 85(3), 220-230.
Hamdami, N., Monteau, J.-Y., et Le Bail, A. (2004). Transport properties of a high
porosity model food at above and sub-freezing temperatures. Part 1:
Thermophysical properties and water activity. Journal of Food Engineering,
62(4), 373-383.
Hanitzsch, E. (1991). Modification of the conventional measuring method to determine
the specific heat capacity using a Perkin-Elmer DSC 2. Thermochimica Acta,
187, 275-281.
Harbourne, N., Jacquier, J. C., Morgan, D. J., et Lyng, J. G. (2008). Determination
of the degradation kinetics of anthocyanins in a model juice system using
isothermal and non-isothermal methods. Food Chemistry, 111(1), 204-208.
He, J., et Giusti, M. (2010). Anthocyanins: Natural Colorants with Health-Promoting
Properties. Annual Review of Food Science and Technology, 1, 163-187.
Hessler, J. P. (1997). The use of Monte Carlo simulations to evaluate kinetic data and
analytic approximations. International Journal of Chemical Kinetics, 29(11),
803-817.
Hillmann, M. C. R., Burin, V. M., et Bordignon-Luiz, M. T. (2011). Thermal
degradation kinetics of anthocyanins in grape juice and concentrate.
International Journal of Food Science and Technology, 46(9), 1997-2000.
Ikoko, J., et Kuri, V. (2007). Osmotic pre-treatment effect on fat intake reduction and
eating quality of deep-fried plantain. Food Chemistry, 102(2), 523-531.
ISO (1999). NF ENC 13005. Détermination de l'incertitude élargie. In Guide pour
l'expression de l'incertitude de mesure, (pp. 39-134). Paris: AFNOR.
Jimenez, N., Bohuon, P., Lima, J., Dornier, M., Vaillant, F., et Perez, A. M. (2010).
Kinetics of Anthocyanin Degradation and Browning in Reconstituted Blackberry
Juice Treated at High Temperatures (100-180 °C). Journal of Agricultural and
Food Chemistry, 58(4), 2314-2322.
Jimenez, N., Bohuon, P., Dornier, M., Bonazzi, C., Perez, A., et Vaillant, F. (2011).
Effect of Water Activity on Anthocyanins Degradation and Browning Kinetics

Références bibliographiques
189
at High Temperatures (100–140 °C). Manuscript sumbitted for publication.
Jiménez, N., Bohuon, P., Dornier, M., Soto, M., Perez, A. M., et Vaillant, F. (2011a). Coupling of osmotic dehydration and heat treatment in green papaya
impregnated with blackberry juice solution. Manuscript sumbitted for
publication.
Jiménez, N., Bohuon, P., Dornier, M., et Vaillant, F. (2011b). 3D modeling of a
reactor to estimate degradation kinetic parameters for anthocyanins at different
water activities during heat treatment (25–140 ºC). Manuscript sumbitted for
publication.
Joshi, A. P. K., et Rupasinghe, H. P. V. (2010). Optimization of Bioactive
Fortification in Apple Snacks through Vacuum Impregnation Using Response
Surface Methodology. Food and Nutrition Sciences, 2, 45-52.
Karel, M., et Lund, D. B. (2003). Physical Principles of Food Preservation (Second
Edition, Revised and Expanded ed.). New York: Marcel Dekker, Inc.
Kearsley, M. W., et Rodriguez, N. (1981). The stability and use of natural colours in
foods: anthocyanin, beta-carotene and riboflavin. Journal of Food Technology,
16(4), 421-431.
Kechinski, C. P., Guimaraes, P. V. R., Norena, C. P. Z., Tessaro, I. C., et Marczak,
L. D. F. (2010). Degradation Kinetics of Anthocyanin in Blueberry Juice during
Thermal Treatment. Journal of Food Science, 75(2), C173-C176.
Kirca, A., Ozkan, M., et Cemeroglu, B. (2007). Effects of temperature, solid content
and pH on the stability of black carrot anthocyanins. Food Chemistry, 101(1),
212-218.
Kroh, L. W. (1994). Caramelisation in food and beverages. Food Chemistry, 51(4),
373-379.
Lagarias, J. C., Reeds, J. A., Wright, M. H., et Wright, P. E. (1998). Convergence
properties of the Nelder-Mead simplex method in low dimensions. Siam Journal
on Optimization, 9(1), 112-147.
Lai, K. P. K., Dolan, K. D., et Ng, P. K. W. (2009). Inverse Method to Estimate
Kinetic Degradation Parameters of Grape Anthocyanins in Wheat Flour Under
Simultaneously Changing Temperature and Moisture. Journal of Food Science,
74(5), E241-E249.
Lazarides, H., Lenart, A., Fito, P., Gekas, V., et Chiralt, A. (1999). Advances in
osmotic dehydration. In Processing Foods: Quality Optimization and Process
Assessment, J. C. Oliveira & F. A. R. Oliveira (Eds.). Boca Raton, FL.: CRC
Press.
Leatherhead_Food_International. (2006). The International Market for Fruit Snacks:
Trends and Developments in fruit bars, canned fruit and ambient fruit snacks,
Références bibliographiques
190
dried fruit snacks and chilled fruit snacks. Surrey, UK: Leatherhead Food
Research.
Lee, J., Durst, R. W., et Wrolstad, R. E. (2005). Determination of total monomeric
anthocyanin pigment content of fruit juices, beverages, natural colorants, and
wines by the pH differential method: Collaborative study. Journal of AOAC
International, 88(5), 1269-1278.
Lee, J. M., Rennaker, C., et Wrolstad, R. E. (2008). Correlation of two anthocyanin
quantification methods: HPLC and spectrophotometric methods. Food
Chemistry, 110(3), 782-786.
Lenart, A., et Lewicki, P. P. (2006). Osmotic Dehydration of Fruits and Vegetables. In
Handbook of Industrial Drying, A. S. Mujumdar (Ed.), (3rd ed.). Boca Raton,
FL: CRC Press.
Mahattanatawee, K., Manthey, J. A., Luzio, G., Talcott, S. T., Goodner, K., et
Baldwin, E. A. (2006). Total Antioxidant Activity and Fiber Content of Select
Florida-Grown Tropical Fruits. Journal of Agricultural and Food Chemistry,
54(19), 7355-7363.
Malien-Aubert, C., Dangles, O., et Amiot, M. J. (2001). Color Stability of
Commercial Anthocyanin-Based Extracts in Relation to the Phenolic
Composition. Protective Effects by Intra- and Intermolecular Copigmentation.
Journal of Agricultural and Food Chemistry, 49(1), 170-176.
Martens, M., Scheerlinck, N., De Belie, N., et De Baerdemaeker, J. (2001).
Numerical model for the combined simulation of heat transfer and enzyme
inactivation kinetics in cylindrical vegetables. Journal of Food Engineering,
47(3), 185-193.
Mateus, N., et Freitas, V. (2009). Anthocyanins as Food Colorants. In Anthocyanins,
C. Winefield, K. Davies & K. Gould (Eds.), (pp. 284-304). New York: Springer
Mathlouthi, M. (2001). Water content, water activity, water structure and the stability
of foodstuffs. Food Control, 12(7), 409-417.
McCann, D., Barrett, A., Cooper, A., Crumpler, D., Dalen, L., Grimshaw, K., et al. (2007). Food additives and hyperactive behaviour in 3-year-old and 8/9-year-old
children in the community: a randomised, double-blinded, placebo-controlled
trial. The Lancet, 370(9598), 1560-1567.
Mercadante, A. Z., et Bobbio, F. O. (2008). Anthocyanins in foods: Ocurrence and
physicochemical properties. In Food Colorants: Chemical and Functional
Properties, C. Socaciu (Ed.), (pp. 241-276). Boca Raton, FL.: CRC Press.
Mertz, C., Cheynier, V., Gunata, Z., et Brat, P. (2007). Analysis of phenolic
compounds in two blackberry species (Rubus glaucus and Rubus adenotrichus)
by high-performance liquid chromatography with diode array detection and
electrospray ion trap mass spectrometry. Journal of Agricultural and Food
Références bibliographiques
191
Chemistry, 55(21), 8616-8624.
Mishra, D. K., Dolan, K. D., et Yang, L. (2008). Confidence intervals for modeling
anthocyanin retention in grape pomace during nonisothermal heating. Journal of
Food Science, 73(1), E9-E15.
Moreira, R. G., Sun, X., et Chen, Y. (1997). Factors affecting oil uptake in tortilla
chips in deep-fat frying. Journal of Food Engineering, 31(4), 485-498.
Nasri, H., Simpson, R., Bouzas, J., et Torres, J. A. (1993). An unsteady-state method
to determine kinetic parameters for heat inactivation of quality factors:
Conduction-heated foods. Journal of Food Engineering, 19(3), 291-301.
Ni, H., et Datta, A. K. (1999). Moisture, oil and energy transport during deep-fat frying
of food materials. Food and Bioproducts Processing, 77(C3), 194-204.
Ou, B. X., Hampsch-Woodill, M., et Prior, R. L. (2001). Development and validation
of an improved oxygen radical absorbance capacity assay using fluorescein as
the fluorescent probe. Journal of Agricultural and Food Chemistry, 49(10),
4619-4626.
Patras, A., Brunton, N. P., O'Donnell, C., et Tiwari, B. K. (2010). Effect of thermal
processing on anthocyanin stability in foods; mechanisms and kinetics of
degradation. Trends in Food Science & Technology, 21(1), 3-11.
Peleg, M., Normand, M. D., et Corradini, M. G. (2008). Interactive software for
estimating the efficacy of non-isothermal heat preservation processes.
International Journal of Food Microbiology, 126(1-2), 250-257.
Perré, P. (1995). Drying with internal vaporisation: Introducing the concept of Identity
Drying Card. Drying Technology, 13(5-7), 1077-1097.
Piffaut, B., Kader, F., Girardin, M., et Metche, M. (1994). Comparative degradation
pathways of malvidin 3,5-diglucoside after enzymatic and thermal treatments.
Food Chemistry, 50(2), 115-120.
Prior, R. L. (2004). Absorption and Metabolism of Anthocyanins: Potential Health
Effects In Phytochemicals: Mechanisms of Action, M. S. Meskin, W. R. Bidlack,
A. J. Davies, D. S. Lewis & R. K. Randolph (Eds.): CRC Press.
Quintas, M. A. C., Brandao, T. R. S., et Silva, C. L. M. (2007). Modelling colour
changes during the caramelisation reaction. Journal of Food Engineering, 83(4),
483-491.
Reyes, L. F., et Cisneros-Zevallos, L. (2007). Degradation kinetics and colour of
anthocyanins in aqueous extracts of purple- and red-flesh potatoes (Solanum
tuberosum L.). Food Chemistry, 100(3), 885-894.
Rodrigo, C., Mateu, A., Alvarruiz, A., Chinesta, F., et Rodrigo, M. (1998). Kinetic
Parameters for Thermal Degradation of Green Asparagus Texture by Unsteady-
Références bibliographiques
192
state Method. Journal of Food Science, 63, 126–129.
Rojas-Gonzalez, J. A. (2007). Impact de l'opération de friture du plantain (Musa AAB
"barraganete") sur différents marqueurs nutritionnels : caractérisation et
modélisation. Thèse de Doctorat en Génie des Procédés, AgroParisTech, Massy,
France.
Rózek, A., García-Pérez, J. V., López, F., Güell, C., et Ferrando, M. (2010).
Infusion of grape phenolics into fruits and vegetables by osmotic treatment:
Phenolic stability during air drying. Journal of Food Engineering, 99(2), 142-
150.
Rubinskiene, M., Viskelis, P., Jasutiene, I., Viskeliene, R., et Bobinas, C. (2005).
Impact of various factors on the composition and stability of black currant
anthocyanins. Food Research International: 38 (8-9, Third International
Congress on Pigments in Food) 867-871, 38(8-9, Third International Congress
on Pigments in Food), 867-871.
Sablani, S. S., Kasapis, S., et Rahman, M. S. (2007). Evaluating water activity and
glass transition concepts for food stability. Journal of Food Engineering, 78(1),
266-271.
Sadilova, E., Stintzing, F. C., et Carle, R. (2006). Thermal degradation of acylated
and nonacylated anthocyanins. Journal of Food Science, 71(8), C504-C512.
Sadilova, E., Stintzing, F. C., Kammerer, D. R., et Carle, R. (2009). Matrix
dependent impact of sugar and ascorbic acid addition on color and anthocyanin
stability of black carrot, elderberry and strawberry single strength and from
concentrate juices upon thermal treatment. Food Research International, 42(8),
1023-1033.
Seber, G. A. F., et Wild, C. J. (2003). Nonlinear Regression. Hoboken, NJ: Wiley-
Interscience.
Shi, J., et Le Maguer, M. (2002). Osmotic dehydration of foods: Mass transfer and
modeling aspects. Food Reviews International, 18(4), 305-335.
Siriwoharn, T., Wrolstad, R. E., Finn, C. E., et Pereira, C. B. (2004). Influence of
cultivar, maturity, and sampling on blackberry (Rubus L. hybrids) anthocyanins,
polyphenolics, and antioxidant properties. Journal of Agricultural and Food
Chemistry, 52(26), 8021-8030.
Sriwimon, W., et Boonsupthip, W. (2011). Utilization of partially ripe mangoes for
freezing preservation by impregnation of mango juice and sugars. LWT - Food
Science and Technology, 44(2), 375-383.
Tangduangdee, C., Bhumiratana, S., et Tia, S. (2003). Heat and Mass Transfer
during Deep-Fat Frying of Frozen Composite Foods with Thermal Protein
Denaturation as Quality Index. ScienceAsia, 29, 355-364.
Références bibliographiques
193
Thakur, B. R., et Arya, S. S. (1989). Studies on stability of blue grape anthocyanins.
International Journal of Food Science & Technology, 24(3), 321-326.
Tonon, R. V., Brabet, C., et Hubinger, M. D. (2008). Influence of process conditions
on the physicochemical properties of acai (Euterpe oleraceae Mart.) powder
produced by spray drying. Journal of Food Engineering, 88(3), 411-418.
Tsai, P. J., Hsieh, Y. Y., et Huang, T. C. (2004). Effect of sugar on anthocyanin
degradation and water mobility in a roselle anthocyanin model system using O-
17 NMR. Journal of Agricultural and Food Chemistry, 52(10), 3097-3099.
Tsimidou, M., et Biliaderis, C. G. (1997). Kinetic Studies of Saffron (Crocus sativus
L.) Quality Deterioration. Journal of Agricultural and Food Chemistry, 45(8),
2890-2898.
USDA. (2010). National Nutrient Database for Standard Reference: Nutrient Data
Laboratory, Release 23.
van Boekel, M. A. J. S. (1996). Statistical aspects of kinetic modeling for food science
problems. Journal of Food Science, 61(3), 477-485.
van Boekel, M. A. J. S. (2009a). Temperature and Pressure Effects. In Kinetic
Modeling of Reactions in Food, (pp. 5-1 - 5-43). Boca Raton, FL.: CRC Press.
van Boekel, M. A. J. S. (2009b). Modeling the Food Matrix. In Kinetic Modeling of
Reactions in Food, (pp. 14-11 - 14-56). Boca Raton, FL.: CRC Press.
van Boekel, M. A. J. S. (2009c). Kinetics and Statistics. In Kinetic Modeling of
Reactions In Foods, (pp. 7-1 - 7-99). Boca Raton, FL: CRC Press.
Verbeyst, L., Crombruggen, K. V., Van der Plancken, I., Hendrickx, M., et Van
Loey, A. (2011). Anthocyanin degradation kinetics during thermal and high
pressure treatments of raspberries. Journal of Food Engineering, 105(3), 513-
521.
Vitrac, O., Trystram, G., et Raoult-Wack, A.-L. (2000). Deep-fat frying of food: heat
and mass transfer, transformations and reactions inside the frying material.
European Journal of Lipid Science and Technology, 102(8-9), 529-538.
Vitrac, O., Dufour, D., Trystram, G., et Raoult-Wack, A.-L. (2002).
Characterization of heat and mass transfer during deep-fat frying and its effect
on cassava chip quality. Journal of Food Engineering, 53(2), 161-176.
Vitrac, O., et Bohuon, P. (2004). Internal coupled heat and mass transfer during deep-
frying of materials with high water content: application to apple chips fried at
atmospheric pressure. Paper presented at the 9th International Congress on
Engineering and Food, Montpellier, France.
Wagner, W., et Pruss, A. (2002). The IAPWS formulation for the thermodynamic
properties of ordinary water substance for general and scientific use. Journal of

Références bibliographiques
194
Physical and Chemical Reference Data, 31(2), 387-535.
Wang, W. D., et Xu, S. Y. (2007). Degradation kinetics of anthocyanins in blackberry
juice and concentrate. Journal of Food Engineering, 82(3), 271-275.
Webb, P. A. (2001). Volume and Density Determinations for Particle Technologists.
Norcross, GA.: Micromeritics Instrument Corporation.
Welt, B. A., Teixeira, A. A., Balaban, M. O., Smerage, G. H., Hintinlang, D. E., et
Smittle, B. J. (1997). Kinetic Parameter Estimation in Conduction Heating
Foods Subjected to Dynamic Thermal Treatments. Journal of Food Science, 62,
529–534.
Wrolstad, R. E., Skrede, G., Lea, P. E. R., et Enersen, G. (1990). Influence of Sugar
on Anthocyanin Pigment Stability in Frozen Strawberries. Journal of Food
Science, 55(4), 1064-1065.
Wrolstad, R. E., Durst, R. W., et Lee, J. (2005). Tracking color and pigment changes
in anthocyanin products. Trends in Food Science & Technology, 16(9), 423-428.
Yamsaengsung, R., et Moreira, R. G. (2002). Modeling the transport phenomena and
structural changes during deep fat frying: Part I: model development. Journal of
Food Engineering, 53(1), 1-10.
Yang, Z. D., Han, Y. B., Gu, Z. X., Fan, G. J., et Chen, Z. G. (2008). Thermal
degradation kinetics of aqueous anthocyanins and visual color of purple corn
(Zea mays L.) cob. Innovative Food Science & Emerging Technologies, 9(3),
341-347.
Yilmaz, Y., et Toledo, R. (2005). Antioxidant activity of water-soluble Maillard
reaction products. Food Chemistry, 93(2), 273-278.
Impact des opérations thermiques agroalimentaires à hautes températures sur la
dégradation des anthocyanes : Caractérisation et modélisation des cinétiques
réactionnelles
Résumé : Compte tenu de l’importance des pigments naturels dans les aliments et leur
sensibilité aux traitements thermiques, les cinétiques de dégradation des anthocyanes ont été
étudiées à très hautes températures (100 à 180 ºC). Pour obtenir une base de données
expérimentale fiable dissociant les transferts d’énergie et de matière, un mini-réacteur étanche a
été utilisé pour le traitement d’une matrice modèle (jus de mûre et sable) en faisant varier la
température et l’activité de l’eau (0,20<aw<0,99). L’hypothèse d’une réaction d’ordre 1 pour la
dégradation des anthocyanes a permis de modéliser et de déterminer les paramètres cinétiques
suivant une méthode non-isotherme prenant en compte à la fois le profil de température et
indépendamment l’homogénéité ou l’hétérogénéité du champs de température au sein de la
matrice. Il a été démontré que les constantes de réaction sont très influencées par la diminution
de l’activité de l’eau, facteur qui fait augmenter la réactivité. Ces résultats originaux ont été
validés sur une matrice alimentaire (papaye verte-jus de mûre) soumise au couplage d’un
procédé de formulation par déshydratation par immersion-imprégnation, suivi d’une opération
de friture, à l’aide d’un modèle qui intègre les transferts de vapeur et d’énergie et la cinétique
réactionnelle. Le modèle permet une meilleure compréhension des phénomènes et il peut être
intégré dans une démarche d’optimisation séquentielle associant différentes opérations unitaires
avec des traitements thermiques à très hautes températures.
Mots clés : Dégradation des anthocyanes ; jus de mûre ; haute température ; cinétiques
réactionnelles ; transferts d‘énergie et matière ; modélisation ; friture ; déshydratation par
immersion-imprégnation
Impact of food thermal operations at high temperature on the degradation of
anthocyanins: Characterization and modeling of reaction kinetics
Abstract: Given the importance of natural pigments in foods and their sensitivity to heat
treatment, degradation kinetics of anthocyanins have been studied at very high temperatures
(100 to 180 ºC). For a reliable experimental database that dissociates heat and mass transfer, a
hermetic mini-reactor was used for the treatment of a model matrix (blackberry juice and sand)
by varying the temperature and water activity (0.20<aw<0.99). The assumption of a first order
reaction for the anthocyanin degradation was used to model and determine the kinetic
parameters using a non-isothermal method taking into account both the temperature profile and
independently the homogeneity or heterogeneity of the matrix temperature field. It has been
shown that the reaction rate constants are strongly influenced by the water activity reduction, a
factor that increases the anthocyanin reactivity. These original results were validated on a food
matrix (green papaya-blackberry juice) submitted to the coupling of a formulation process by
osmotic dehydration, followed by a deep-fat frying operation, using a model which includes the
vapor and heat transfer and the reaction kinetics. The model allows a better understanding of the
phenomena and can be integrated into a sequential optimization approach combining different
unit operations with heat treatments at high temperatures.
Keywords: anthocyanin degradation, blackberry juice, high temperature reaction kinetics, heat
and mass transfer, modeling, deep-fat frying, osmotic dehydration.