
structures modales et ornementations dans les musiques arabes
MODALES D2.2: Real effectiveness of OBD inspection and maintenance, and retrofits
WORK PACKAGE WP2: Knowledge of low-emission factors TASK T2.2 TASK T2.3
OBD inspection and maintenance requirements Retrofits
AUTHORS Juhani LAURIKKO -VTT, Uwe ROTH -LIST, Sébastien FAYE -LIST, Joni KEMPPAINEN -PROV, Arno AMBERLA -PROV, Dimitris MARGARITIS –CERTH, Athanasios DIMITRIADIS -CERTH
DISSEMINATION LEVEL Public (PU) STATUS Final submitted to EC. Subject to European Commission approval DUE DATE 30/04/2020 DOCUMENT DATE 31/08/2020 VERSION NUMBER 1.0
This project has received funding from the European Union’s Horizon 2020 research
and innovation programme under grant agreement No 815189.
2 MODALES D2.2 Real effectiveness of OBD inspection and maintenance, and retrofit Version 1.0 Date 31/08/2020
Quality control
Name Organisation Date
Editor in-chief: LAURIKKO, Juhani VTT 26/06/2020
Peer review 1: CHEN, Haibo LEEDS 27/06/2020
Peer review 2: ALANKUS, Orhan OKAN 30/06/2020
Authorised by (Technical Coordinator):
LAURIKKO, Juhani VTT 31/08/2020
Authorised by (Project Coordinator):
WINDER, Andrew ERTICO 31/08/2020
Submitted by: WINDER, Andrew ERTICO 31/08/2020
Revision and history chart
Version Date Main author Summary of changes
0.1 21/02/2020 LAURIKKO, Juhani Draft outline
0.2 31/03/2020 LAURIKKO, Juhani Draft template distributed
0.3 20/05/2020 LAURIKKO, Juhani 1st consolidated draft
0.4 26/06/2020 LAURIKKO, Juhani 2nd consolidated draft
0.5 01/07/2020 LAURIKKO, Juhani 3rd consolidated draft, after 1st review
0.6 27/08/2020 LAURIKKO, Juhani 4th draft, review comments done
0.7 31/08/2020 LAURIKKO, Juhani Draft final
1.0 31/08/2020 WINDER, Andrew Final submitted version
Legal disclaimer This document is issued within the framework of and for the purpose of the MODALES project. This project has received funding from the European Union’s Horizon 2020 Framework Programme, through the Innovation and Networks Executive Agency (INEA) under the powers delegated by the European Commission and under Grant Agreement No. 815189. Opinions expressed and arguments employed herein do not necessarily reflect the official views of the European Commission. Neither the European Commission nor the MODALES partners bear any responsibility for any use that may be made of the information contained herein. This document and its content are the property of the MODALES Consortium. All rights relevant to this document are determined by the applicable laws. Access to this document does not grant any right or license on the document or its con-tents. MODALES partners may use this document in conformity with the MODALES Consortium Grant Agree-ment provisions.

3 MODALES D2.2 Real effectiveness of OBD inspection and maintenance, and retrofit Version 1.0 Date 31/08/2020
Table of contents
Quality control ......................................................................................................................................... 2
Revision and history chart ....................................................................................................................... 2
Legal disclaimer ....................................................................................................................................... 2
Table of contents ..................................................................................................................................... 3
Index of figures ........................................................................................................................................ 5
Index of tables ......................................................................................................................................... 7
Glossary of terms ..................................................................................................................................... 9
List of abbreviations and acronyms....................................................................................................... 10
Executive Summary ............................................................................................................................... 13
1 Introduction ................................................................................................................................... 17
Background ............................................................................................................................ 17 1.1
Purpose and scope ................................................................................................................ 17 1.2
Document structure .............................................................................................................. 18 1.3
Deviations from the original Description of Action (DoA) ..................................................... 18 1.4
1.4.1 Description of work related to deliverable as given in the DoA.................................... 18
1.4.2 Content deviations from the original DoA .................................................................... 18
1.4.3 Time deviations from the original DoA ......................................................................... 18
2 Review of the I/M programmes and their effectiveness .............................................................. 20
Background and definitions ................................................................................................... 20 2.1
Summary of the Methodology .............................................................................................. 20 2.2
2.2.1 Light-duty vehicles ......................................................................................................... 20
2.2.2 Heavy-duty vehicles ....................................................................................................... 21
Analysis of the U.S. programmes .......................................................................................... 21 2.3
2.3.1 Effectiveness of the programme to detect high-emitters ............................................. 21
2.3.2 Cost-benefit Analysis or Cost-effectiveness Analysis .................................................... 23
Periodic technical inspections in European context ............................................................. 25 2.4
2.4.1 Background and short recapture of the past phases .................................................... 25
2.4.2 Present status ................................................................................................................ 26
2.4.3 Suggested improvements for periodic technical inspection by joint projects .............. 26
2.4.4 Other relevant studies ................................................................................................... 30
2.4.5 PM and PN emissions measurements in PTI ................................................................. 31
4 MODALES D2.2 Real effectiveness of OBD inspection and maintenance, and retrofit Version 1.0 Date 31/08/2020
2.4.6 In-Use compliance of heavy-duty diesel trucks and PTI ................................................ 35
2.4.7 On-board sensing of particulates and OBD ................................................................... 35
2.4.8 Using inspection data base to identify major reasons for failure ................................. 35
Summary and Conclusions on I/M & PTI ............................................................................... 36 2.5
Other types of emissions detection for trapping high emitters ............................................ 37 2.6
2.6.1 Remote Sensing Technologies ....................................................................................... 37
2.6.2 Application campaigns .................................................................................................. 40
2.6.3 Use of RSD data ............................................................................................................. 41
3 Review of the on-board diagnostics protocols .............................................................................. 43
Interconnected systems inside vehicles ................................................................................ 43 3.1
Overview of bus systems in automotive ............................................................................... 44 3.2
CAN bus ................................................................................................................................. 48 3.3
3.3.1 Standards overview ....................................................................................................... 48
3.3.2 Physical interface ........................................................................................................... 49
3.3.3 CAN messages ............................................................................................................... 51
3.3.4 Message structure ......................................................................................................... 51
3.3.5 Standard and extended identifier ................................................................................. 53
3.3.6 Meaning and priority of the identifier ........................................................................... 54
3.3.7 Data length code field and Data field ............................................................................ 54
3.3.8 CAN FD ........................................................................................................................... 54
Passenger cars: On-board Diagnostics (OBD) and Unified Diagnostic Service (UDS) ............ 56 3.4
3.4.1 Standards overview ....................................................................................................... 56
3.4.2 OBD CAN identifier ........................................................................................................ 58
3.4.3 OBD message structure ................................................................................................. 59
3.4.4 Parameter and Service ID (PID/SID) .............................................................................. 59
3.4.5 ISO TP ............................................................................................................................. 60
3.4.6 OBD Service IDs ............................................................................................................. 61
3.4.7 UDS Service IDs .............................................................................................................. 62
3.4.8 OBD SID/PID examples .................................................................................................. 62
3.4.9 Diagnostic Trouble Codes (DTC) .................................................................................... 63
Utility, heavy-duty and commercial vehicles: J1939 ............................................................. 63 3.5
3.5.1 Standards overview ....................................................................................................... 64
3.5.2 J1939 messages on CAN ................................................................................................ 66
3.5.3 J1939 Identifier and Parameter Group Number (PGN) ................................................. 66
3.5.4 J1939 PGN/SPN examples ............................................................................................. 67

5 MODALES D2.2 Real effectiveness of OBD inspection and maintenance, and retrofit Version 1.0 Date 31/08/2020
3.5.5 Diagnostic Trouble Codes (DTC) .................................................................................... 67
4 Performance of OBD in detecting malfunctions ........................................................................... 69
5 Potential impact of retrofits .......................................................................................................... 73
Analyse existing field data from retrofitted buses and trucks, real world emission reduction 5.1
potential ............................................................................................................................................ 73
5.1.1 Objective of the work .................................................................................................... 73
5.1.2 Test Procedures ............................................................................................................. 73
5.1.3 Emission Monitoring & Data Collection ........................................................................ 75
5.1.4 Data processing & research methods ........................................................................... 75
5.1.5 Results ........................................................................................................................... 77
5.1.6 NOx Emissions & Reduction Efficiency ........................................................................... 79
5.1.7 The influence of driving conditions ............................................................................... 84
5.1.8 Exhaust Temperatures & Reduction Efficiency ............................................................. 91
5.1.9 Temperature Relation to NOx Reduction & Emissions ................................................. 94
5.1.10 Discussion ...................................................................................................................... 97
Retrofit projects overview and analysis ................................................................................ 97 5.2
5.2.1 Germany ........................................................................................................................ 97
5.2.2 United Kingdom ............................................................................................................. 98
5.2.3 Other Countries ............................................................................................................. 99
Analysis of potentials of different applications for retrofits ................................................. 99 5.3
Methodologies to verify the durability of the retrofits ....................................................... 100 5.4
6 Conclusions and implications ...................................................................................................... 101
7 References ................................................................................................................................... 104
Reference for Chapter 2 (I/M Programmes and their effectiveness) ................................. 104 7.1
Reference for Chapter 3 (OBD protocols) ........................................................................... 110 7.2
References for Chapter 4 (Performance of OBD in detecting malfunctions) ...................... 111 7.3
References for Chapter 5 (Retrofits) ................................................................................... 112 7.4
Index of figures Figure 2-1: Distribution of Tests by Model Year in the Roadside Data (Sierra 2009) ........................... 23
Figure 2-2: Roadside vs. Smog Check Program Initial Test ASM Failure Rates (Sierra 2009) ................ 23
Figure 2-3: Resulting PM, PN and smoke emissions in FAS test with different levels of impairment of
the DPF unit (Source: Kadijk 2015) ........................................................................................................ 32
Figure 2-4: Results of the tailpipe sweep test (Source: Spreen et al., 2016) ......................................... 32
6 MODALES D2.2 Real effectiveness of OBD inspection and maintenance, and retrofit Version 1.0 Date 31/08/2020
Figure 2-5: Further analysis of the 201 vehicles that did not exceed 0,10 m-1 using the improved
opacity (Source: Spreen et al., 2016) ..................................................................................................... 33
Figure 2-6: Particulate emission test results measured in low idle speed tests (Source: Spreen et al.,
2016) ...................................................................................................................................................... 33
Figure 2-7: PN emission results measured in low idle speed tests and on chassis dynamometer
(Source: Kadijk et al. 2017) .................................................................................................................... 34
Figure 2-8: Low idle PN and PM measured on a chassis dynamometer (Source: Kadijk et al., 2017) .. 34
Figure 2-9: Inspection failure rates for different ages of light vehicles for the Netherlands over a 4-
month period in 2006 (Source: CITA, 2007) .......................................................................................... 36
Figure 2-10: Schematic setup of the three units of the remote sensing device (Source: ICCT 2018) ... 38
Figure 2-11: Alternate setup for remote sensing devices (Source: ICCT, 2018) .................................... 39
Figure 2-12: NOx emission rates of diesel cars by year of manufacture from remote sensing
campaigns in (left) London 2012 and 2013, and (right) Zurich, 2000—2012 (Source: ICCT, 2018) ...... 41
Figure 2-13: Possible applications of vehicle remote sensing in an enhanced vehicle emissions control
program (Source: ICCT, 2019) ................................................................................................................ 42
Figure 3-1: Car Electronic Control Units and sub-networks .................................................................. 44
Figure 3-2: Car OBD II physical connector and pinout .......................................................................... 49
Figure 3-3: OBD II Type B physical connector and pinout with 24V and gap in the middle bar ........... 50
Figure 3-4: J1939 physical connector and pinout.................................................................................. 50
Figure 3-5: J1939 to OBD pinout mapping ............................................................................................ 50
Figure 3-6: CiA DS-102 D-SUB 9-Pin physical connector and pinout ..................................................... 51
Figure 3-7: CANOpen CiA-DR-303-1 RJ45 physical connector and pinout ............................................ 51
Figure 3-8: LCC Frame and MAC Frame pinout ..................................................................................... 52
Figure 3-9: Start, end, redundancy check and acknowledge ................................................................ 52
Figure 3-10: Standard message with 11-bit identifier (CAN 2.0B) ........................................................ 53
Figure 3-11: Standard message with 11-bit identifier (CAN 2.0B) ........................................................ 53
Figure 3-12: Data length code and data ................................................................................................ 54
Figure 3-13: CAN FD Message ............................................................................................................... 55
Figure 3-14: Fixed Stuffed Bits in an example with CRC-17 .................................................................. 55
Figure 3-15: OBD message in relation to a CAN message ..................................................................... 59
Figure 3-16: Example request and response ......................................................................................... 60
Figure 3-17: Data extending 8 bytes ..................................................................................................... 61
Figure 3-18: Flow control ...................................................................................................................... 61
Figure 3-19: Structure of an OBD Diagnostic Trouble Code DTC .......................................................... 63
Figure 3-20: J1939 message on CAN ..................................................................................................... 66
Figure 3-21: Structure of the 29-bit CAN identifier in J1939 ................................................................. 66
Figure 3-22: Diagnostic Trouble Code structure inside the CAN data frame ........................................ 68
Figure 5-1: Revised LUB Test Cycle 2017 (CVRC, 2019) ......................................................................... 74
Figure 5-2: Operating principle of NOxBUSTER City system ................................................................. 76
Figure 5-3: Vehicle count and average NOx reduction efficiency by manufacturer ............................. 78
Figure 5-4: NOx reduction efficiency by vehicle model ........................................................................ 79
Figure 5-5: Achieved NOx emissions for 2-axle buses (Average of all buses) ....................................... 79
Figure 5-6: Achieved NOx emissions for 3-axle buses (Average of all buses) ....................................... 80
Figure 5-7: Achieved NOx emissions by body type ............................................................................... 80
Figure 5-8: Top and bottom models in NOx reduction efficiency ......................................................... 81
Figure 5-9: NOx emissions before EAT (engine out NOx) ...................................................................... 81
Figure 5-10: NOx emissions before and after EAT ................................................................................ 82

7 MODALES D2.2 Real effectiveness of OBD inspection and maintenance, and retrofit Version 1.0 Date 31/08/2020
Figure 5-11: NOx emissions in grams per kilometre ............................................................................. 83
Figure 5-12: Reduced NOx emissions per kilometre ............................................................................. 83
Figure 5-13: Average driving speeds and NOx emissions ...................................................................... 84
Figure 5-14: ADL Enviro 400H NOx emissions (g/km) related to speed ................................................ 85
Figure 5-15: MB Citaro O530 G (articulated) NOx emissions (g/km) related to speed ......................... 85
Figure 5-16: Wrightbus NRM NOx emissions (g/km) related to speed ................................................. 86
Figure 5-17: ADL Enviro 400H relation between driving speeds and exhaust temperatures ............... 86
Figure 5-18: Wrightbus NRM relation between driving speeds and exhaust temperatures ................ 87
Figure 5-19: MB Citaro O530 G Average operating speeds & exhaust temperatures .......................... 87
Figure 5-20: MB Citaro O530 average operating speeds & exhaust temperatures. ............................. 88
Figure 5-21: Exhaust temperature comparison between NRM, Enviro 400H & B5LH .......................... 89
Figure 5-22: Exhaust temperature comparison between B9TL, Enviro 400 & DB300 .......................... 89
Figure 5-23: Exhaust temperature comparison between Citaro O530 OM906 & Enviro 200 .............. 90
Figure 5-24: Exhaust temperature comparison between Citaro O530 G, O530, Lion's City A23 & A4091
Figure 5-25: Enviro 400H NOx reduction efficiency related to exhaust temperature .......................... 92
Figure 5-26: Wrightbus NRM NOx reduction efficiency related to exhaust temperature .................... 92
Figure 5-27: Enviro 200 NOx reduction efficiency related to exhaust temperature ............................. 93
Figure 5-28: Citaro O530 G NOx reduction efficiency related to exhaust temperature ....................... 93
Figure 5-29: Lion's City A21 NOx reduction efficiency related to exhaust temperature ...................... 94
Figure 5-30: Impact of reduction efficiency to emissions in typical Enviro 400H ................................. 95
Figure 5-31: Impact of reduction efficiency on emissions in typical Citaro O530 G ............................. 96
Figure 5-32: Tampering effect ............................................................................................................... 96
Index of tables Table 2-1: Summary of testing protocols for I/M programs (Source: ICCT, 2015) ................................ 22
Table 2-2: Main remote sensing technologies and manufacturers (Source: ICCT, 2019) ..................... 40
Table 3-1: Bus systems in automotive applications .............................................................................. 45
Table 3-2: Overview of the existing standards by vehicle type (numbers of standards only) .............. 46
Table 3-3: Overview of the existing standards by vehicle type (numbers of standards only) .............. 47
Table 3-4: Standards of the CAN Bus relation to OSI layers .................................................................. 48
Table 3-5: ISO 11898: Road vehicles - Controller area network (EU Standard) .................................... 48
Table 3-6: SAE J2284: High Speed CAN for Vehicle Applications (US Standard - Passenger Cars) ........ 49
Table 3-7: Standards of Passenger Cars in relation to OSI layers .......................................................... 56
Table 3-8: ISO 15765: Road vehicles - Diagnostic communication over Controller Area Network
(DoCAN) ................................................................................................................................................. 57
Table 3-9: ISO 15031: Road vehicles - Communication between vehicle and external equipment for
emissions-related diagnostics ............................................................................................................... 57
Table 3-10: ISO 14229: Road vehicles - Unified diagnostic services (UDS) ........................................... 57
Table 3-11: ISO 27145: Road vehicles - Implementation of World-Wide Harmonized On-Board
Diagnostics (WWH-OBD) communication requirements ...................................................................... 58
Table 3-12: 11-bit OBD CAN Identifier .................................................................................................. 58
Table 3-13: 29-bit OBD CAN Identifier .................................................................................................. 59
Table 3.14: Services in OBD ................................................................................................................... 61
Table 3.15: UDS Services ....................................................................................................................... 62
8 MODALES D2.2 Real effectiveness of OBD inspection and maintenance, and retrofit Version 1.0 Date 31/08/2020
Table 3.16: Example SID/PIDs................................................................................................................ 63
Table 3.17: Standards of Trucks, Busses and Tractors in relation to OSI layers .................................... 64
Table 3.18: SAE J1939: Recommended Practice for a Serial Control and Communications Vehicle
Network (US Standard - Truck and Bus) ................................................................................................ 64
Table 3.19: ISO 11192: Road vehicles - Interchange of digital information on electrical connections
between towing and towed vehicles .................................................................................................... 65
Table 3.20: Example PGN/SPNs ............................................................................................................. 67
Table 5.1: Emission limits applying to buses Source: (CVRC, 2019) ...................................................... 74
Table 5.2: Classified route-related emissions........................................................................................ 75
Table 5.3: Count of buses by body type & manufacturer ..................................................................... 77
Table 5.4: Properties & population for engine types ............................................................................ 78
Table 5.5: City bus retrofit emission limits for Germany ...................................................................... 98
Table 5.6: City bus retrofit (primary) emission limits TfL ...................................................................... 98
Table 5.7: City bus retrofit (secondary) emission limits TfL .................................................................. 99

9 MODALES D2.2 Real effectiveness of OBD inspection and maintenance, and retrofit Version 1.0 Date 31/08/2020
Glossary of terms EU Projects
Term Description
UDRIVE
EU FP7 project (2012-2016) aiming to increase understanding of road user behaviour by systematically studying road user behaviour in real life condi-tions. First and foremost it focused on the identification of relevant measures to improve road safety up to the Horizon 2020 and beyond. Sec-ondly, it focused on the identification of promising approaches for reducing harmful emissions and fuel consumption in order to make road traffic more sustainable.
uCARE “You can also reduce emissions”, EU H2020 RIA (GA 815002)
MODALES This EU Horizon 2020 project: “Modify Drivers’ behaviour to Adapt for Lower Emissions” (2019-2022, http://modales-project.eu)
ecoDriver
EU FP7 project (2011-2016) which addressed the need to consider the hu-man element when encouraging "green" driving, as driver behaviour is a critical element in energy efficiency. The focus of the project was on tech-nology working with the driver. The project delivered effective feedback to drivers on green driving by optimising the driver-powertrain-environment feedback loop.
The Auto-Oil II Programme
Final report, the Directorates General for Economic and Financial Affairs, Enterprise, Energy and Transport, Environment, Research, and Taxation and Customs Union with the support of the Joint Research Centre, 2000.
AUTOFORE
Study on the Future Options for Roadworthiness Enforcement in the Euro-pean Union by The International Motor Vehicle Inspection Committee, known as ‘CITA’, in partnership with five research institutes. Received a 50% cost compensation from EC.
CITA 2002 Second CITA Programme on Emission Testing at Periodic and Other Inspec-tions Programme Summary Report.
TEDDIE TEDDIE - A new roadworthiness emission test for diesel, vehicles involving NO, NO2 and PM measurements (by CITA)
Set I Sustainable Emissions Test (by CITA)
Set II Sustainable Emissions Test – Stage II (by CITA)

10 MODALES D2.2 Real effectiveness of OBD inspection and maintenance, and retrofit Version 1.0 Date 31/08/2020
List of abbreviations and acronyms
Abbreviation/acronyms Meaning
ACKN Acknowledge
BRS Bit Rate Switch
BS Block Size
CAN Controller Area Network
CAN FD Controller Area Network Flexible Data-Rate
CBA Cost Benefit Analysis
CF Consecutive Frames
CI Compression ignition (type of internal combustion engine)
CLD Chemiluminescence Detector
CM Conversion Method
CNG Compressed Natural Gas
CRC Cyclic Redundancy Check
CTS Clear To Send
DALED Mobile App for Low-Emission Driving
DA Destination Address
DEL Delimiter
DL Data Length
DLC Data Link Connector
DM Diagnostic Messages
DoA Description of Action (MODALES contract)
DP Data Page
DTC Diagnostic Trouble Code
EAT(S) Emissions after-treatment - (system)
ECU Electronic Control Unit
EDP Extended Data Page
EOF End of Frame
ESI Error State Indicator
EPA Environmental Protection Agency
EU European Union
EOBD European On-board Diagnostics (protocol), see also OBD-II
FDF Flexible Data Rate Format
FF First Frame
FMI Failure Mode Identifier
FS Flow Status
FSB Fixed Stuff Bit
GDI Gasoline (petrol) Direct Injection
11 MODALES D2.2 Real effectiveness of OBD inspection and maintenance, and retrofit Version 1.0 Date 31/08/2020
Abbreviation/acronyms Meaning
GE Group Extension
GPF Gasoline particulate filter (used in GDI-SI engines)
GPS Global Positioning System
HD OBD Type B variant of the OBD connector for heavy duty vehicles
IDE Identifier Extension Bit
ICE Internal Combustion Engine
I/M [vehicle] Inspections and maintenance [programme]
LCC Logical Link Control
LDV Light-duty Vehicles (i.e. Passenger Cars)
LLSP Laser Light Scattering Photometry
LNT Lean NOx Trap
MAC Media Access Control
MAF Mass Air Flow
MDI Medium Dependent Interface
MIL Malfunction Indicator Light
NDIR Non-Dispersive Infrared
NEE Non-Exhaust Emissions
NOx Nitrogen Oxides
NRMM Non-Road Mobile Machinery
NSC NOx Storage Catalyst
OBD On-Board Diagnostics
OBD-I or OBD 1 On-Board Diagnostics, first revision (in U.S.)
OBD-II or OBD 2 On-Board Diagnostic, second revision (in U.S.), see also EOBD
OC Occurrence Counter
OSI Open Systems Interconnection (model)
PF Protocol Data Unit Format
PID Parameter ID
PGN Parameter Group Number
PS Protocol Data Unit Specific
PM Particulate Matter
PM10 Particulate Matter of 10 Micrometres or Less in Diameter
PN Particle Number
PTI Periodic Technical Inspection
RRS Remote Request Substitution
RSI Road Side Inspection
RTR Remote Transmission Request
SBC Stuff Bit Counter

12 MODALES D2.2 Real effectiveness of OBD inspection and maintenance, and retrofit Version 1.0 Date 31/08/2020
Abbreviation/acronyms Meaning
SCR Selective Catalytic Reduction
SF Single Frame
SI Spark ignition (type of internal combustion engine)
SID Service ID
SOF Start of Frame
SPN Suspect Parameter Numbers
SRR Substitute Remote Request
STMin Minimum Separation Time
UDS Unified Diagnostic Service
UNECE The United Nations Economic Commission for Europe
U.S. United States (of America)
VEIP Vehicle Emissions Inspection Programme
VIN Vehicle Identification Number
WWH-OBD World-Wide Harmonized OBD

13 MODALES D2.2 Real effectiveness of OBD inspection and maintenance, and retrofit Version 1.0 Date 31/08/2020
Executive Summary This deliverable has three main themes that are addressed: 1) detecting high-emitting vehicles with
periodic tests, 2) probing the performance of Emissions after-treatment (EAT) system by on-board
diagnostics (OBD), and 3) assessing the potential of lowering the harmful emissions of vehicles by
retrofitted EAT devices. These three themes are supposed to reflect two tasks in the Work Package 2
(Knowledge of low-emission factors), namely “OBD inspection and maintenance requirements” (T2.2)
and “Retrofits” (T2.3).
The literature review on the effectiveness of inspection and maintenance (I/M) programmes, par-
ticularly proliferated in the United States (US), showed that this type of activity was started in the
1990s, and is currently replicated to over 30 states. I/M programmes were deemed necessary, be-
cause exhaust emissions from motor vehicles were precursors for inferior ambient air quality, and
thus the performance of the EAT system fitted to practically all vehicles since 1980 to curb the emis-
sions needed constant status update to ensure the maintaining of their effectiveness. Separate pro-
grammes were necessary, because only a few US states had ever started a periodic technical inspec-
tion (PTI) programme for roadworthiness of the vehicles that could have been updated to include
also emissions checks.
According to the review, a vehicle Inspections and Maintenance (I/M) programme is a compendium
of different activities and procedures targeted to monitor vehicles’ in-use emissions performance
and reinstate the performance of any emissions after-treatment technology (EAT) systems fitted, if
malfunctions are detected. The I/M programme is composed of a) procedures to gauge EAT perfor-
mance; b) cut-points or other means of judgement to make a pass/fail decision; c) rules for reinstat-
ing the EAT performance and subsequent re-testing; e) vehicle categories and model years involved;
and d) area of implementation. Historically, the emphasis in I/M has been on cars and other light-
duty vehicles, but currently, there are also programmes embracing heavy-duty vehicles, as well.
Furthermore, the more detailed examination showed how there has been almost a constant evolu-
tion of the procedures used in probing the level of emissions, as well as an equally steady evolve-
ment of the performance and complexity of the EAT systems. However, the enhanced complexity of
the procedures and related hardware requirements add costs, and the review of some cost-benefit
analyses revealed also testimonials suggesting that the cost-benefits or cost-effectiveness may not
have been so good, and that the cost effectiveness of emissions inspection programmes has steadily
declined over time.
In contrast to US, many European countries have a very long history and tradition for PTI of road
vehicles for the purpose of ensuring their roadworthiness, thus increasing the safety of traffic by
avoiding potential faults e.g. in brakes or other vital chassis systems. However, emission testing of
road vehicles as part of a PTI has much shorter existence, as they were first introduced by some
member states (MS) of the EU in the early 1980s. Furthermore, it was as late as in 1996 before the
first consolidated roadworthiness Directive (96/96/EC) included the basic requirements for emissions
checks needed to be implemented in all MS. As of today, systematic PTI activity is mandated in all EU
MS with Directive 2014/45/EU, aiming at improving the quality of vehicle tests by setting common
minimum standards for equipment, training of inspectors and assessment of deficiencies.
However, while assessing the present characteristics and the progress of PTI procedures, associated
with the upholding of the roadworthiness of motor vehicles in Europe, plentiful and proficient litera-
ture on this subject attested that the present-day common PTI procure regarding checking of exhaust

14 MODALES D2.2 Real effectiveness of OBD inspection and maintenance, and retrofit Version 1.0 Date 31/08/2020
emissions remains highly inadequate. It does not address the need to evaluate in-use performance of
the present-day EAT systems regarding crucial ambient air pollutants and precursors (NOx, PN). Also,
amendments of PTI procedures are way behind the introduction rate of EATS in vehicles. Due to in-
creasing stringency of the type approval (TA) requirements, more complex EATS are fitted to new
cars and trucks to curb emissions, but current PTI does not address most of the critical features of
their proper functioning at all. Thus, their continuous and effective operation is jeopardised, as the
PTI cannot test their performance. Moreover, it was discovered that this issue is not technical but
more of a legislative case, because according to the literature, several large scale studies have devel-
oped and presented procedures applicable to NOx and PM/PN emissions that could be implemented
as parts of the PTI regulations, but the EC has failed to do so by today.
As a further option for identifying high emitters, Remote Sensing Technologies were also studied.
Remote sensing device (RSD) measures an instantaneous emission rate of individual vehicles as they
pass by the instrument location. It is not an exact measurement, but the results are rather expressed
as emissions in g per g of fuel burned. Even if the first apparatus were successfully developed and
used in the late 1980s, it has remained more as a tool to assess the assumptions of emissions factors
in fleet emissions models such as MOBILE3 and MOBILE4, developed by U.S.EPA.
However, the technology has since taken substantial leaps, and is commercialised by several suppli-
ers. Today, a fully functional remote sensing device (RSD) set-up has, in addition to a pollutant ana-
lyser, a camera device for linking the measured values to the vehicles license plate, and in some case
even with additional vehicle data retrieved on-line OTA from a registration database using that li-
cense plate information. Furthermore, information of the acceleration of the vehicle during exhaust
plume scanning is provided. The latest models add nitrogen dioxide (NO2) to pollutants detected by
the earlier device’s nitrogen monoxide (NO), CO, carbon dioxide (CO2), hydrocarbons (HC), and ex-
haust opacity.
Nevertheless, RSD data is not particularly good for assessing emissions of individual vehicles, but
rather reflecting the characteristics of fleets. For these reasons, RSD can mainly be used for 1) Air
quality monitoring and development of emissions models; 2) In-use surveillance to determine the
average emission rates under real-driving conditions and assess the long-term durability of EAT sys-
tems, as well as 3) Vehicle inspection and maintenance, to detect if an individual vehicle has suspi-
ciously high pollutant emissions in real driving, or, inversely, if this vehicle’s after-treatment is well
maintained, and thus can it be exempted from inspection.
Regarding on-board diagnostics (OBD) and its features the literature was searched for a review of
the on-board diagnostics protocols that were found to exist in plentiful, differing in both hardware
formats and software protocols. Since its early introduction in the 1980s by the California Air Re-
sources Board (CARB), by 1988 OBD was implemented in all new cars complying with US emissions
regulations. By definition, OBD is an electronic system that performs monitoring and diagnostics with
regard to functioning of the exhaust emission relevant systems and components via an array of sen-
sors and values they provide. Should these monitored values violate their pre-assigned ranges, an
error case is determined, and its occurrence is signalled by a Malfunction Indicator Light (MIL), com-
municating to the driver that a system check should be performed. Furthermore, each identified
error is additionally stored in a readable internal memory for later retrieval.
The next evolution of the system, OBD-II, was standardised in 1998, and later on it evolved also to
become the European On-Board Diagnostics (EOBD) that was implemented in EU by 2001 (SI cars)
and 2004 (CI cars). The functionality and performance of OBD-II and EOBD are fairly identical, and
15 MODALES D2.2 Real effectiveness of OBD inspection and maintenance, and retrofit Version 1.0 Date 31/08/2020
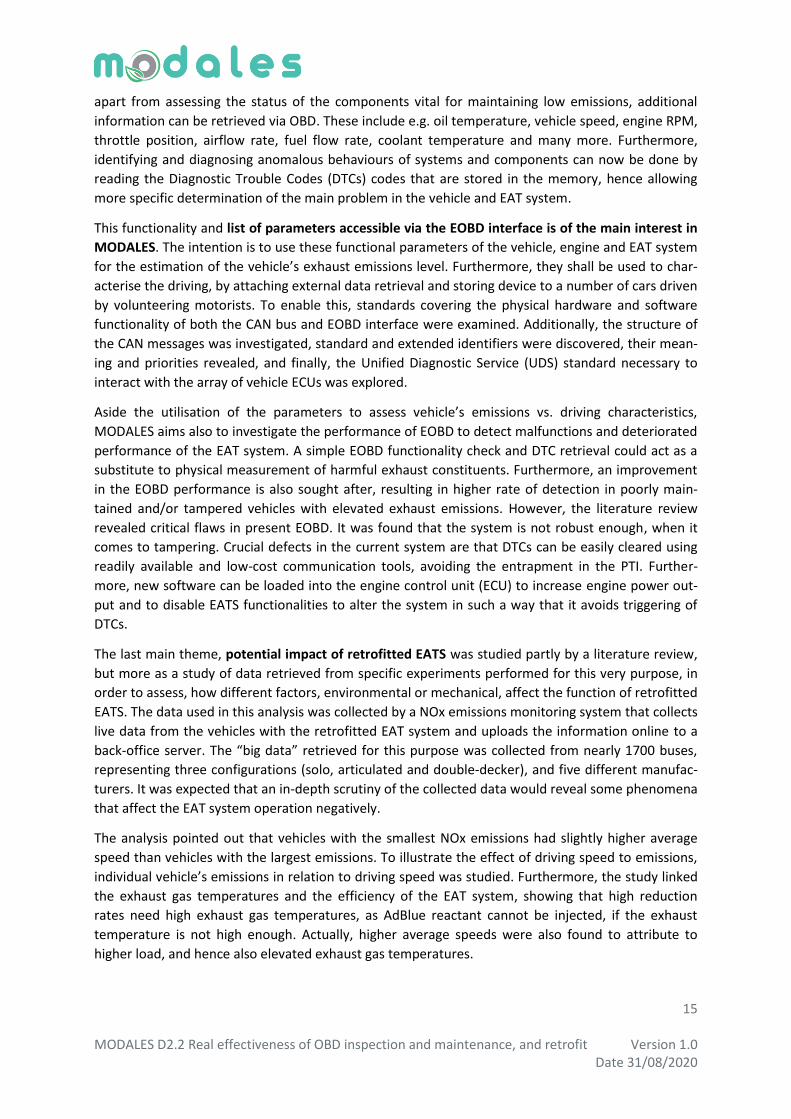
apart from assessing the status of the components vital for maintaining low emissions, additional
information can be retrieved via OBD. These include e.g. oil temperature, vehicle speed, engine RPM,
throttle position, airflow rate, fuel flow rate, coolant temperature and many more. Furthermore,
identifying and diagnosing anomalous behaviours of systems and components can now be done by
reading the Diagnostic Trouble Codes (DTCs) codes that are stored in the memory, hence allowing
more specific determination of the main problem in the vehicle and EAT system.
This functionality and list of parameters accessible via the EOBD interface is of the main interest in
MODALES. The intention is to use these functional parameters of the vehicle, engine and EAT system
for the estimation of the vehicle’s exhaust emissions level. Furthermore, they shall be used to char-
acterise the driving, by attaching external data retrieval and storing device to a number of cars driven
by volunteering motorists. To enable this, standards covering the physical hardware and software
functionality of both the CAN bus and EOBD interface were examined. Additionally, the structure of
the CAN messages was investigated, standard and extended identifiers were discovered, their mean-
ing and priorities revealed, and finally, the Unified Diagnostic Service (UDS) standard necessary to
interact with the array of vehicle ECUs was explored.
Aside the utilisation of the parameters to assess vehicle’s emissions vs. driving characteristics,
MODALES aims also to investigate the performance of EOBD to detect malfunctions and deteriorated
performance of the EAT system. A simple EOBD functionality check and DTC retrieval could act as a
substitute to physical measurement of harmful exhaust constituents. Furthermore, an improvement
in the EOBD performance is also sought after, resulting in higher rate of detection in poorly main-
tained and/or tampered vehicles with elevated exhaust emissions. However, the literature review
revealed critical flaws in present EOBD. It was found that the system is not robust enough, when it
comes to tampering. Crucial defects in the current system are that DTCs can be easily cleared using
readily available and low-cost communication tools, avoiding the entrapment in the PTI. Further-
more, new software can be loaded into the engine control unit (ECU) to increase engine power out-
put and to disable EATS functionalities to alter the system in such a way that it avoids triggering of
DTCs.
The last main theme, potential impact of retrofitted EATS was studied partly by a literature review,
but more as a study of data retrieved from specific experiments performed for this very purpose, in
order to assess, how different factors, environmental or mechanical, affect the function of retrofitted
EATS. The data used in this analysis was collected by a NOx emissions monitoring system that collects
live data from the vehicles with the retrofitted EAT system and uploads the information online to a
back-office server. The “big data” retrieved for this purpose was collected from nearly 1700 buses,
representing three configurations (solo, articulated and double-decker), and five different manufac-
turers. It was expected that an in-depth scrutiny of the collected data would reveal some phenomena
that affect the EAT system operation negatively.
The analysis pointed out that vehicles with the smallest NOx emissions had slightly higher average
speed than vehicles with the largest emissions. To illustrate the effect of driving speed to emissions,
individual vehicle’s emissions in relation to driving speed was studied. Furthermore, the study linked
the exhaust gas temperatures and the efficiency of the EAT system, showing that high reduction
rates need high exhaust gas temperatures, as AdBlue reactant cannot be injected, if the exhaust
temperature is not high enough. Actually, higher average speeds were also found to attribute to
higher load, and hence also elevated exhaust gas temperatures.

16 MODALES D2.2 Real effectiveness of OBD inspection and maintenance, and retrofit Version 1.0 Date 31/08/2020
Retrofitting of passenger cars with SCR is possible and there are some approved systems on the
marker. However, fragmented market and business to consumer -style business model sets limita-
tions. It is difficult to justify retrofitting only by emission reductions, so other incentives like tax re-
liefs or subsidies are needed. Those instruments could also include parking permits, avoiding tolls
and defying driving restrictions at low-emissions zones.
Regarding retrofits for non-road applications, the usage and installation varies a lot. This is setting
higher cost for design and testing for approval. Retrofitting same engine, but installed in another
application might require retesting and following possible in-use tests. This might raise the develop-
ment and certification costs make retrofitting non-feasible. If the installed population is only few
examples, statistical analysis of emission benefits is also difficult.

17 MODALES D2.2 Real effectiveness of OBD inspection and maintenance, and retrofit Version 1.0 Date 31/08/2020
1 Introduction
Background 1.1
The impact of road traffic on local air quality is a major policy concern. There have been numerous
technological advances and policy initiatives aimed at improving underlying vehicle and fuel technol-
ogies, reducing emissions through traffic management and seeking improvements through enforce-
ment. Zero tailpipe emission technologies may solve the problem in the long term, as it is rolled out
to the full vehicle population, but fleet renewal takes time. We need also to make more immediate
changes, during periods in which road traffic continues to be dominated by internal combustion
fleets (with its current share more than 95%).
However, such advances are hampered by a lack of understanding of the links between driving be-
haviour and emissions, and inconsistencies between laboratory tests and real-world emissions levels.
A programme funded by the UK Department for Transport in 2016 showed that on-road emissions
are significantly different from laboratory measurements. The study revealed that some cars emit up
to 12 times the permitted EU maximum. Real-world emissions can be affected by many factors in-
cluding vehicle characteristics, ambient temperature, traffic, road layout and driver behaviour. Re-
cent studies have aimed to undertake large scale activity monitoring of engines to quantify these
factors. Driver behaviour is regarded as the single biggest determinant of vehicle emissions.
The MODALES project was therefore created to advance the understanding of the co-variability of
user behaviour and vehicular emissions, in particular from powertrains, brakes and tyres. From the
understanding thus gleaned, the project aims to modify user behaviour via dedicated training, to
help local and national authorities develop effective air quality plans and enforcement strategies.
Over a 36-month timeframe, MODALES will study driving behavioural variability and recognise typical
driving patterns and practises. Based upon that knowledge, it will establish the link between real
vehicle emissions and driving behaviour through a combination of real-world measurement and la-
boratory tests.
Furthermore, MODALES will create training courses for low-emission driving, which will be taught
and validated in pilot exercises. Poor maintenance and tampering aspects will be investigated with a
fleet of cars whose emissions are intentionally influenced by lack of maintenance and/or by tamper-
ing, and MODALES will observe whether present On-Board Diagnostics (OBD) or inspections are able
to detect those. Finally, an assessment of the potential impacts of retrofits for light- and heavy-duty
road vehicles and for Non-Road Mobile Machinery (NRMM) will be performed, including promotion
of their application in the selected pilot cities with relevant pollution problems.
Purpose and scope 1.2
WP2 is the technical kick-off activity for MODALES, aimed at synthesising the state-of-the-art in cur-
rent international knowledge of vehicular emissions, in order to define key contributory factors. The
factors considered vary from the driving and maintenance behaviour of individual car users, to the
real effectiveness of OBD systems and retrofits, as well as assessing the legal situation of tampering
in different member states.
The first deliverable of the WP2, D2.1 focused on the variability of driving behaviours and low-
emission driving requirements, and the present deliverable focuses on three specific objectives of

18 MODALES D2.2 Real effectiveness of OBD inspection and maintenance, and retrofit Version 1.0 Date 31/08/2020
WP2, namely the real effectiveness of OBD systems and retrofits. The third deliverable of this work
package will be D2.3, dealing with the legal situation of tampering the vehicles’ EAT systems.
Document structure 1.3
The three main subject matters of this deliverable are each addressed in their own chapters. At first
there is a review of the I/M programmes and their effectiveness in Chapter 2, followed by a review of
the OBD protocols in Chapter 3, and an assessment of the performance of OBD in detecting malfunc-
tions in real-world use cases in Chapter 4. Finally, the third matter, the potential of retrofitting emis-
sions after-treatment technology (EAT), is discussed in Chapter 5.
Deviations from the original Description of Action (DoA) 1.4
1.4.1 Description of work related to deliverable as given in the DoA
According to the DoA, this Deliverable at hand titled “Real effectiveness of OBD inspection and
maintenance, and retrofits” should contain the following elements, carried out in Task 2.2:
Review of inspection and maintenance practices within EU Member States and existing re-
search literature across the world on the effectiveness of I/M to detect high emitting vehicles;
Review of the OBD protocols and research literature on the performance of OBD in detecting
malfunctions; and
Investigation of the “inspection data base” in some countries in Europe such as Greece and or-
der to identify the major issues in maintenance behaviour.
Furthermore, based on work in Task 2.3, it should also include the following topics:
Analyse existing field data from retrofitted buses and trucks, real world emission reduction po-
tential;
Retrofit projects overview and analysis (technology requirements are different; some targets
are less demanding than others); and
Analyse which application is potential for retrofit and which is not. Average speed, vehicle
type/base technology, vehicle age, etc.
1.4.2 Content deviations from the original DoA
Of the subjects in Task 2.2., the first two are covered by this Deliverable, but as regards investigations
of the inspection databases, the work was decided to be incorporated and reported as part of
WP4/Task 4.2. The decision was made mainly because the consortium was not able to gain access to
suitable relevant databases within the timeline of preparing this Deliverable. In order not to delay
this Deliverable any further, this part of work was decided to be transferred to Task 4.2, to be re-
ported in D4.2.
Regarding Task 2.3, all the listed themes are incorporated in this Deliverable.
1.4.3 Time deviations from the original DoA
The finalisation of this document, which is a major piece of work in MODALES, and thus required
several reviews and, as well as inputs from some industrial partners that were on reduced capacity
due to the COVID-19 Pandemic situation. Furthermore, the Deliverable was originally scheduled in

19 MODALES D2.2 Real effectiveness of OBD inspection and maintenance, and retrofit Version 1.0 Date 31/08/2020
Month 6, which turned out not to be realistic due to the fact that D2.1 was due in M7, and that de-
liverable needed to provide input into this one.
20 MODALES D2.2 Real effectiveness of OBD inspection and maintenance, and retrofit Version 1.0 Date 31/08/2020
2 Review of the I/M programmes and their
effectiveness
Background and definitions 2.1
A vehicle Inspections and Maintenance (I/M) programme is a compendium of different activities and
procedures targeted to monitor vehicles’ in-use emissions performance and reinstate, if necessary,
the performance of any emissions after-treatment technology (EAT) systems fitted. It is composed of
a) procedures to gauge EAT performance; b) cut-points or other means of judgement to make a
pass/fail decision; c) rules for reinstating the EAT performance and subsequent re-testing; e) vehicle
categories and model years involved; and d) area of implementation (EPA 2020a).
I/M programmes originate from United States, where they are now mandated on Federal level under
the 1990 Amendment of the Clean Air Act for areas of poor air quality, mainly large metropolitan
areas. Even before that, State of California enacted regulations asking a biennial “Smog Check” to be
performed on most motor vehicles manufactured in 1976 or later. This programme was started in
1982 and is still running. The programme is a joint effort between the California Air Resources Board
(CARB), the California Bureau of Automotive Repair (BAR), and the California Department of Motor
Vehicles (DVM) (BAR 2020).
I/M programs have then proliferated and currently there are more than 30 U.S. states that have im-
plemented an I/M program of some level (He & Jin 2017).
I/M programs were deemed necessary, because in US there is practically no wide-spread and sys-
tematic policy for periodic inspection of the roadworthiness and other safety-related performance
attributes of motor vehicles. The matter is decided on state level, and only a few states ever started
such safety-related inspection activities, and by today, most have abandoned them in recent years as
being non cost-effective for preventing accidents (He & Jin 2017).
Summary of the Methodology 2.2
2.2.1 Light-duty vehicles
Light-duty vehicle I/M programs entail testing of vehicles’ tailpipe and evaporative emissions for the
purpose of determining the performance of the EAT systems fitted. Originally, in the early 1990’s the
testing was based on idle/high-idle measurement of tailpipe concentrations of pollutants (CO, HC).
However, the more advanced programmes started using load-imposing tests, either as Acceleration
Simulation Mode (ASM) that uses dynamometers to impose load on the engine while accelerating, or
even more advanced procedure involving dynamometer test (IM240), which resembles a proper in-
laboratory emissions measurement, but with a shorter (240 seconds) and simpler duty cycle. In these
more advanced exercises, also NOx is measured. More details and current status of the procedures
can be found in (EPA 2020).
After the widespread implementation of OBD-II systems in vehicles, checking the status and interro-
gating the OBD diagnostic trouble code (DTC) memory has been added to the procedures in I/M pro-
grams. Originally in 1996 EPA required OBD checks as part of an I/M programme from 1998, but
eventually, the implementation was delayed until 2001 (EPA 1998). Furthermore, in many states, it
has replaced dynamometer testing altogether for better cost-benefit ratio, and EPA’s rules were
21 MODALES D2.2 Real effectiveness of OBD inspection and maintenance, and retrofit Version 1.0 Date 31/08/2020
amended to allow this (EPA 2001), but it is limited to vehicles of MY1996 or newer that have the
OBD-II implemented.
Mostly these I/M programs are recurrent, i.e. all vehicles need to be tested periodically, and as a
proof of passing the test, a window sticker is issued for the police to check. Typical testing interval is
two years for vehicles younger than 6 years, and after that the tests become annual.
Testing vehicles taken directly from use for testing of their compliance with the I/M rules is an addi-
tional feature in enhanced I/M programs. In this activity vehicles are picked-up from the traffic and
tested right at the site. Vehicle selection can be random or targeted, or a combination of both. Usual-
ly older vehicles are oversampled because of their greater potential to be high-emitters.
2.2.2 Heavy-duty vehicles
Whereas light-duty vehicles have been subject to inspection and maintenance programmes for sev-
eral decades, specific programmes for heavy vehicles are fairly new. (Posada et.al. 2015)
2.2.2.1 The Heavy-Duty Vehicle Inspection Program (HDVIP) (CARB 2019)
The Heavy-Duty Vehicle Inspection Program (HDVIP) and the Periodic Smoke Inspection Program
(PSIP) are CARB's heavy-duty vehicle inspection programs for in-use trucks and buses.
HDVIP consists of roadside testing by CARB enforcement personnel for excessive smoke, tampering,
and Emission Control Label compliance, whereas the PSIP requires annual opacity self-testing for
California fleets with two or more heavy-duty vehicles.
HDVIP requires heavy-duty trucks and buses to be inspected for excessive smoke, tampering, and
engine certification label compliance. Any heavy-duty vehicle traveling in California may be inspect-
ed, including vehicles registered in other states and foreign countries. CARB inspection teams per-
form tests at border crossings, California Highway Patrol (CHP) weigh stations, fleet facilities, and
randomly selected roadside locations. Owners of trucks and buses found in violation are subject to
minimum penalties starting at $300 per violation. Penalty payment and proof of correction must be
supplied to clear violations.
PSIP requires diesel and bus fleet owners to conduct annual smoke opacity inspections of their vehi-
cles and repair those with excessive smoke emissions to ensure compliance. CARB randomly audits
fleets, reviews maintenance and inspection records, and tests a representative sample of vehicles.
All vehicles that do not pass the test must be repaired and retested.
Analysis of the U.S. programmes 2.3
2.3.1 Effectiveness of the programme to detect high-emitters
The effectiveness of the various U.S. programmes can be analysed at least from two different ap-
proaches. At first the implications that high-emitting vehicles have to the overall air pollution, and
how much excess emissions would be avoided, if those vehicles would be eliminated, could be set
aside, we can assess the basic ability of the programme to detect those high-emitters. Such an analy-
sis was performed for the Californian Smog Check programme in 2008-2010, and reported in (Sierra
2009,). This analysis used the data from the actual programme, but also from supporting campaigns
that were either ran parallel to the main programme, or explicitly launched to support this analysis.
22 MODALES D2.2 Real effectiveness of OBD inspection and maintenance, and retrofit Version 1.0 Date 31/08/2020
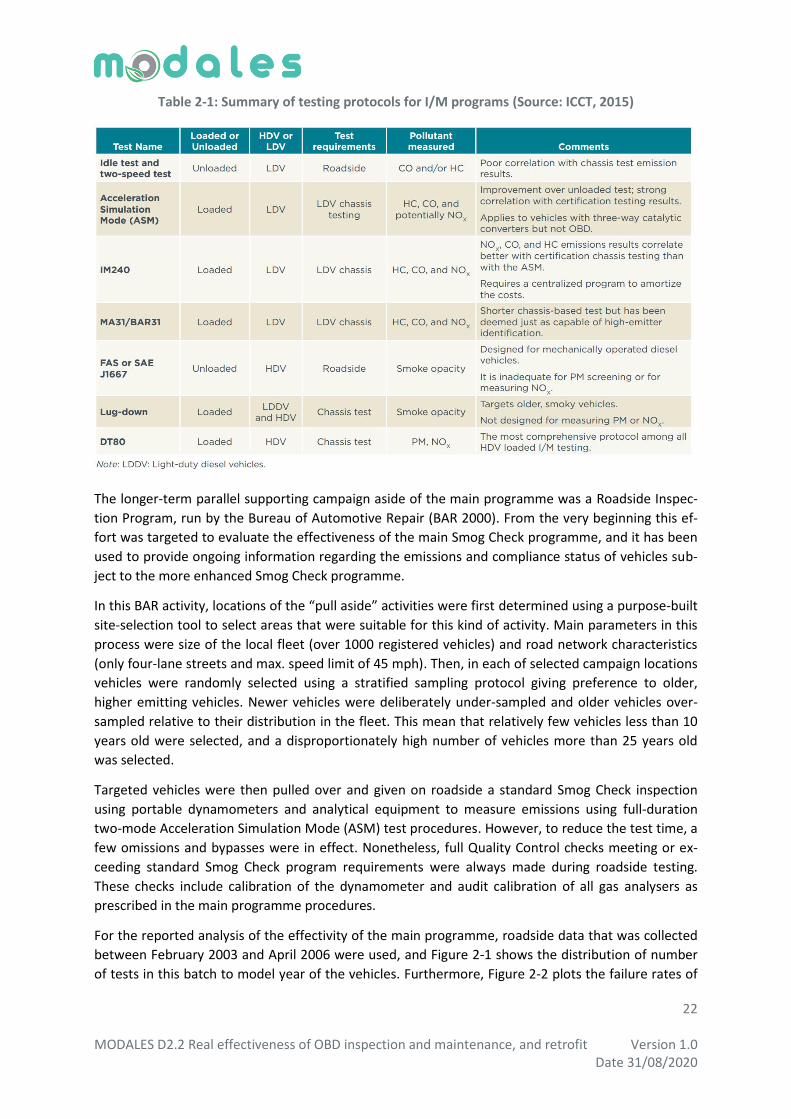
Table 2-1: Summary of testing protocols for I/M programs (Source: ICCT, 2015)
The longer-term parallel supporting campaign aside of the main programme was a Roadside Inspec-
tion Program, run by the Bureau of Automotive Repair (BAR 2000). From the very beginning this ef-
fort was targeted to evaluate the effectiveness of the main Smog Check programme, and it has been
used to provide ongoing information regarding the emissions and compliance status of vehicles sub-
ject to the more enhanced Smog Check programme.
In this BAR activity, locations of the “pull aside” activities were first determined using a purpose-built
site-selection tool to select areas that were suitable for this kind of activity. Main parameters in this
process were size of the local fleet (over 1000 registered vehicles) and road network characteristics
(only four-lane streets and max. speed limit of 45 mph). Then, in each of selected campaign locations
vehicles were randomly selected using a stratified sampling protocol giving preference to older,
higher emitting vehicles. Newer vehicles were deliberately under-sampled and older vehicles over-
sampled relative to their distribution in the fleet. This mean that relatively few vehicles less than 10
years old were selected, and a disproportionately high number of vehicles more than 25 years old
was selected.
Targeted vehicles were then pulled over and given on roadside a standard Smog Check inspection
using portable dynamometers and analytical equipment to measure emissions using full-duration
two-mode Acceleration Simulation Mode (ASM) test procedures. However, to reduce the test time, a
few omissions and bypasses were in effect. Nonetheless, full Quality Control checks meeting or ex-
ceeding standard Smog Check program requirements were always made during roadside testing.
These checks include calibration of the dynamometer and audit calibration of all gas analysers as
prescribed in the main programme procedures.
For the reported analysis of the effectivity of the main programme, roadside data that was collected
between February 2003 and April 2006 were used, and Figure 2-1 shows the distribution of number
of tests in this batch to model year of the vehicles. Furthermore, Figure 2-2 plots the failure rates of

23 MODALES D2.2 Real effectiveness of OBD inspection and maintenance, and retrofit Version 1.0 Date 31/08/2020
both the roadside-tested fleet and the initial ASM tests. Based on the information in Figure 2, the
report concludes that failure rates by model year observed in this dataset viewed against the initial
test failure rates recorded in the Smog Check VID were generally about 1.5 times higher than the
initial test failure rates seen in the programme for older vehicles. However, given the fact that the
actual size of the older vehicle population and their contribution to the total VMT remains relatively
small, this result is not very alarming, and does not contest the effectiveness of the Smog Check pro-
gramme.
Figure 2-1: Distribution of Tests by Model Year in the Roadside Data (Sierra 2009)
Figure 2-2: Roadside vs. Smog Check Program Initial Test ASM Failure Rates (Sierra 2009)
2.3.2 Cost-benefit Analysis or Cost-effectiveness Analysis
Another perspective for assessing the effectiveness of I/M programmes is associated with the bene-
fits of catching high-emitting vehicles and how much excess emissions would be avoided, if those
vehicles would be repaired or eliminated, and what the costs for running the programme are.
Over the years, there has been various Cost-Benefit Analysis (CBA) or Cost-Effectiveness Analysis
(CEA). Even the original 1990 Amendment of the Clean Air Act included an ex ante cost-benefit analy-
sis, and there has been numerous analyses published after the programmes have become wider-
spread. The following is a short summary of the findings of some of the more recent studies.
It has been well-established that I/M programs can improve local air quality by reducing pollutant
emissions (CO, hydrocarbons) (Dehart-Davis, 2002), (Washburn, 2001), (Eisinger, 2005), and nitrogen
oxide (Samoylov, 2013), and particulate matter levels, especially among pre-1985 model year vehi-
cles (Sandler, 2017). Furthermore, I/M programs may motivate pre-test repair work, improve repair

24 MODALES D2.2 Real effectiveness of OBD inspection and maintenance, and retrofit Version 1.0 Date 31/08/2020
effectiveness (Eisinger, 2005), and create incentives for manufacturers to improve the emission
characteristics of their vehicles. This has been emphasised by Harrington 1997) and (Harrington,
2000), and it was claimed that this would reduce emissions more than the amount attributed to ex-
isting programs.
There is also evidence that I/M programs with variable timing and those that target vehicles with a
higher likelihood of being high polluters, based on previous emission test results or attributes like
odometer reading and vehicle age, engine size, can be significantly more cost-effective than regular,
non-targeted annual or biennial retesting programs (Samoylov, 2013, Moghadam, 2010, Bin, 2003,
Washburn, 2001). This is based on the fact that in a general, non-targeted program the costs of test-
ing a large pool of vehicles are large, and if the testing can be more effectively targeted to vehicles
that have higher than normal likelihood of failing the tests, testing costs are reduced. Furthermore,
multiple inputs such as program participation rate, vehicle identification rate, and effective repair
rate, should be included in thorough cost-benefit analysis (Li, 2017).
Furthermore (Samoylov, 2013) claimed that a variable timing between tests, i.e. vehicles with higher
probability of failure to have more frequent testing, would bring emission benefits to be realised
from catching failing vehicles sooner.
The same author (Samoylov, 2013) also argued that combining external, out-of-program data that
was done outside of an emission inspection program, such as remote emission sensing, would more
accurately model and describe, how vehicle’s emission profile should be assembled.
On the other hand, there are also testimonials that the benefits and the cost-benefits or cost-
effectiveness may not have been so good. (Harrington et al., 2000) shows that the costs of such
programmes were higher than ex ante EPA estimates. More lately, (Sandler, 2017) showed that the
cost effectiveness of emissions inspection programmes has steadily declined over time. This may
be due to the fact that because of the legislation calling for longer warranted service life of the vehi-
cles regarding exhaust emissions, the robustness of the EAT systems have increased, and thus the
likelihood of the vehicle to become a high-emitter – no matter what – has been diminished. Fur-
thermore, (Mérel et al., 2014) found evidence that a significant amount of emissions abatement
from repairs is lost by the time a subsequent inspection is required. Therefore, the effect of VEIPs
may be overestimated, if the judgement is made only on the basis of ex ante/ex post analysis of the
emissions level of a failing vehicle, and the positive effects of the subsequent repairs.
Apart from assessing the cost-effectiveness or the cost-benefits of the programmes from the overall,
societal perspective, there has lately also been analysis from the societal equity point-of-view. One
of those is (Wessel, 2020) claiming that lower income individuals are more likely to drive vehicles
that pollute more and are more likely to fail emissions inspections conditional on vehicle characteris-
tics. Therefore, it is only fair that many of the programmes include elements like the maximum (tol-
erable) costs for rectifying non-compliant vehicles.
The state or federal intervention with the citizen’s life in U.S. is traditionally strikingly different from
the legacy and present situation in Europe, and especially in EU. In Europe and in EU, all citizens are
treated quite equally to what comes of their social status and income level. However, many of the
American I/M programmes include an entity called “waiver” (Harrington, 2007). It relates to a maxi-
mum monetary amount that was deemed acceptable to reinstate the performance of a vehicle that
failed to pass an I/M test. The practice is the following: as the “M” in the abbreviation suggests,
should a car fail in an I/M test, it is always sent to a licensed repair station for a diagnosis and esti-
25 MODALES D2.2 Real effectiveness of OBD inspection and maintenance, and retrofit Version 1.0 Date 31/08/2020
mate of a service and repair costs that were necessary to bring the vehicle to a status that it will pass
the test. Furthermore, after such repair has been conducted, the vehicle is re-tested. However,
should it still fail, there is a limit what is considered fair, and if all repair costs add up to exceed this
limit, the vehicle receives a waiver, and it can be operated normally without any restrictions. This
waiver is limited, though, for one vehicle and owner, and should the vehicle be sold, it does not free
the next owner.
This maximum cost varies depending on the programme but is around 500 to 600 USD to gasoline-
fuelled and about 1000 USD for diesel-fuelled vehicles. Furthermore, in some cases the owner of
older vehicles may be eligible for cost compensation also from a separate CAP or other consumer
programme (EPA, 2020).
Periodic technical inspections in European context 2.4
2.4.1 Background and short recapture of the past phases
In contrast to U.S. legacy, many European countries have a very long history and tradition for period-
ic inspection of road vehicles for the purpose of ensuring their roadworthiness, and thus increasing
the safety of traffic by avoiding potential faults e.g. in brakes or other vital systems of a motor vehi-
cle. However, emission testing of road vehicles as part of a PTI has much shorter existence, as they
were first introduced by some member states (MS) of the EU in the early 1980s.Still , it was as late as
in 1996 before the first consolidated roadworthiness Directive (96/96/EC) included the basic re-
quirements for emissions checks, and thus they needed to be implemented in all MS.
According to (TEDDIE, 2012) these rudimentary emission checks first addressed petrol-fuelled cars
only and included measurement of idle CO (and HC as an option), with cut-points for maximum con-
tents. In addition to these criteria pollutants, the measurements entailed CO2 to aid the determina-
tion of air-to-fuel ratio (a.k.a lambda). Furthermore, exhaust O2 concentration was measured to de-
tect excessive leaks in the exhaust system that could lead into dilution of the exhaust sample and
thus falsification of the gas analyser readings.
Apart from CO and HC readings, the air-fuel ratio control was also checked. These measurements
were done at idle and high idle, meaning that the engine speed was raised at least to 2000 rpm, to
ascertain that the lambda-control that is essential for a TWC system performance is functioning as it
should. Vehicle make/model-specific limit values established and communicated by the manufactur-
ers were favoured, but there were also global limit values, usually more lenient, to be used in the
absence of the information on specific limit values. Gas analysers used in this context for CO/CO2 and
HC were of NDIR type, and of the same type that are commonly used in garages and repair shops for
check and tune-up of the cars during maintenance operations.
For diesel engines these first stage emissions checks were based on measuring the opacity of the
exhaust gases with an opacimeter in a ‘free acceleration smoke’ (FAS) test. In a FAS test the engine is
rapidly accelerated (with clutch disengaged and gear in neutral position) from idle up to the point
that the speed limiter cuts off fuelling. Thus, the engine’s internal inertia is entertained for the pur-
pose of establishing some load, and hence to produce a more relevant and representative transient
operating sequence that better corresponds to real driving situations. Usually a few of these short
accelerations are performed, and an average of the readings is calculated. Also here, a vehicle
make/model-specific limit values are favoured, usually communicated via a plate affixed to the en-
gine, but also global not-to-exceed limit values are in use.
26 MODALES D2.2 Real effectiveness of OBD inspection and maintenance, and retrofit Version 1.0 Date 31/08/2020
The technical requirements of apparatus for measuring the opacity of exhaust gas are defined in the
international standard ISO 11614:1999. The weak point of the FAS test is that when measuring
smoke opacity, a surrogate value to the real nuisance being (fine) particulate emissions is used, and
there is no consistent correlation between results of a FAS test and actual PM measured from the
same engine.
2.4.2 Present status
Today, systematic PTI activity is now mandated in all EU MS with Directive 2014/45/EU (EU 2014a),
improving the quality of vehicle tests by setting common minimum standards for equipment, training
of inspectors and assessment of deficiencies. This Directive is supplemented with Directive
2014/47/EU (EU 2014b) on technical roadside inspections (RSI) for commercial vehicles.
These directives are stemming from the Commission, which on 20 July 2010, adopted policy orienta-
tions in which it announced a) the harmonisation and progressive strengthening of EU legislation on
roadworthiness tests and b) on technical roadside inspections; c) the inclusion of powered-two
wheelers in vehicle inspections; and d) the possible setting-up of a European electronic platform with
a view to harmonise and to exchange vehicle data.
This was deemed necessary, because in the impact assessment (EC, 2012) of this legislation, it was
concluded that in Europe, technical defects contribute heavily to accidents: it is estimated that they
are responsible for 6% of all accidents, translating into 2,000 fatalities and many more injuries yearly.
Furthermore, technical defects cause environmental damage, as according to a CITA report (AUTO-
FORE, 2007) an increase in emissions (e.g. CO, HC, NO and CO2) by some 1.2% and 5.7% on average,
has been detected. However, those can be by up to 20 times for particular vehicles, and these “gross-
emitters” are of particular concern and should be removed from operation as soon as possible for
repair or write-off, if the repair actions fail. This was already found in the European Auto Oli II pro-
gramme (Auto-Oil, 2000) that reported with regard to three-way catalyst equipped vehicles (TWC), a
properly operating inspection program for TWC cars could have the potential to reduce emissions in
the order of 35% for CO, 25% for HC and 5% for NOx, Furthermore, with regard to non-catalyst and
oxidation catalyst equipped vehicles, such an inspection program would have the potential to
achieve a 15% reduction in CO emissions; and with regard to Diesel vehicles, the emission reduction
potential is about 25% in particulate matter (PM). However, it is fair to note that these findings are
now more than 20 years old, and thus current situation may be somewhat different.
Nonetheless, detecting and eliminating the “gross emitters” is the other main operational objective
of the Roadworthiness package, and thus additions to the minimum requirements of both PTI and RSI
were introduced. In the impact assessment (EC, 2012), there were different policy options (PO, i.e.
combinations of measures) studied, and they concluded, based on the analysis of avoided emissions
and their cost-equivalent monetary savings that
2.4.3 Suggested improvements for periodic technical inspection by joint projects
The first large-scale multi-partner study to address Inspection and Maintenance in the European
context as a means of improving the emissions performance of the in-use fleet was the Auto-Oil II
programme. Especially its WG3 addressed this theme as part of periodic technical inspection (PTI). It
sought means and ways to enhance what was recently laid out in the first consolidated roadworthi-
ness Directive (96/96/EC) that included the first set of basic requirements for emissions checks.
27 MODALES D2.2 Real effectiveness of OBD inspection and maintenance, and retrofit Version 1.0 Date 31/08/2020
One of its conclusions that still stands out was: “A properly operating inspection and maintenance
programme is of crucial importance in order to ensure that expected emission reductions are real-
ised in practice, and could have the potential to bring about some additional reductions in emissions
at the time of introduction, but emission reductions will decrease over time as newer vehicles re-
place older ones”. (AO-II, 2000)
This study paved the future framework for private-public-partnership type of approach in studying
vehicle emissions, and for the further improvement of the PTI in Europe in view of better detection
of high-emitting and tampered vehicles, there has been as series of coordinated research initiatives,
co-funded by the European Commission, executed under the leadership of CITA (International Motor
Vehicle Inspection Committee). These are shortly here summarised in chronological order, with a
description of their focus and a set of main findings and/or recommendations.
2.4.3.1 2nd CITA Emission Study (CITA 2002)
The first International Motor Inspection Committee (CITA) study was mostly concentrated on the
FAS-test for diesel engines, whereas the second study was more focused on petrol-fuelled vehicles.
This programme consisted of five sub-studies:
a. a working group to consider a ‘best practice’ procedure for measuring exhaust emissions from petrol vehicles
b. a study on motorcycle exhaust emissions and noise c. a study on the use of OBD during periodic inspection d. a study on the influence of catalyst temperature on the effectiveness of periodic inspection e. a study to examine the feasibility of a large-scale data gathering exercise. Some of the main findings of this study were that no further elaboration of emission checks for pre-OBD vehicle generations (i.e. older than EURO 3) is necessary, as there will not be sufficient returns for the time and effort required. Furthermore, these vehicle generations are now 20 years or older, and their share of traffic work is quickly diminishing. On the other hand, the study saw great oppor-tunities in combining an OBD check and tailpipe emissions test. However, an urgent need for im-proved uniformity in the interpretation of the OBD type approval requirements was seen. This was manifested by the fact that significant numbers of current cars tested in this study with OBD did not comply with the applicable type approval limits.
In addition, as a general conclusion, the study suggested that the type approval directives for noise
and emissions should take more account of the needs of in-use enforcement, particularly the re-
quirements of periodic inspection.
2.4.3.2 TEDDIE (TEst (D) DIEsel) Project (CITA 2011)
TEDDIE was a one-year project funded by the DG MOVE. Its overall objective was to define new test
procedures and equipment for measuring emissions of nitric oxide (NO), nitrogen dioxide (NO2) and
particulate matter (PM) from diesel vehicles during periodic technical inspection (PTI).
In this study several preliminary recommendations were identified for consideration in relation to
the legislation and improving the effectiveness of the PTI included the following ones:
a) The free acceleration test (FAS) remains a suitable procedure for modern diesel cars. However, consideration should be given to how the functioning of the engine speed limiters can be ascer-tained so that the free acceleration test can be conducted for all vehicles without damages.

28 MODALES D2.2 Real effectiveness of OBD inspection and maintenance, and retrofit Version 1.0 Date 31/08/2020
b) In the current legislation the diesel emission limits are stated as “k” values in m-1, which are the units of opacimeters. Consideration should be given to a changeover to the measurement of the mass concentration of PM (in mg/m3) for new vehicles meeting a specific emission standard.
c) With this changeover, the legislation would need to make an allowance for the use of appropri-ate PM-measurement devices (such as LLSP instruments). There would also be a need to define a correlation between PM values in mg/m3 and k values in m-1 to be used in the devices.
d) General limit values for PM (or any adjustments to plate values) should be based on the findings of field trials.
e) Pending the results of further studies, the extension of the use of OBD in the legislation should be considered for the evaluation of components and individual systems emissions and other pa-rameters, which are relevant to PTI tests (e.g. engine speed) as a supplementary part of the emission data
2.4.3.3 CITA SET I – Sustainable Emissions Test (CITA 2015)
This project was a follow-up on the TEDDIE study and was acknowledging the latest developments in
vehicle and measurement technology. With more stringent type-approval limits in-force (Euro 5 and
Euro 6), after-treatment systems such as exhaust gas recirculation (EGR), diesel particulate filters
(DPFs), selective catalytic reduction (SCR) have become necessary. Also, use of on-board diagnostic
(OBD) is more widespread. Both petrol and diesel-fuelled vehicles were addressed in M1 and N1 cate-
gories.
This project concluded that there is no clear correlation between an emissions test and OBD check
for either petrol or diesel vehicles. Therefore, it is recommended that for Euro 4 or later vehicles,
both an emission test and an OBD check should be performed.
Furthermore, regarding petrol vehicles the limit values (cut-points) should be addressed, as follows:
a) for Euro 3 vehicles, the current limit is suitable; b) for Euro 4 or later vehicles, a revised limit of 0.1% CO should be used for the fast idle test, and
even a stricter of limit of 0.05% CO could be introduced for Euro 4 or later vehicles, but some Member States might require new equipment to test to this level;
c) the current limit is suitable for the normal idle test
In addition, for diesel vehicles the study summarised:
a) for Euro 3 vehicles, the current limit is suitable b) for Euro 4 vehicles, because some are fitted with DPFs whereas others are not, the limit
should be the plate value, but maximum 1.0 m-1 c) for Euro 5 or later vehicles (all with DPF), a general and stricter limit is practical to apply.
It is recommended that a limit of 0.2 m-1 will be used
Regarding OBD, there were several findings, such as
a) During the OBD test, any vehicles with a “P0…” DTC should fail the test. Some trouble codes might only affect cold-start emissions (e.g. glow plug function) which would not show up in a free acceleration test. But it is still important that these vehicles are rectified to avoid excessive cold start emissions
b) Introduction of a combination of OBD scanning and tailpipe concentration measurement will have the best benefit and ability to find most of the emission behaviour affecting failures on modern passenger cars
c) The use of OBD will also provide additional information useful for the correct execution of the emissions test for both petrol and diesel vehicles. These supplemental parameters include e.g.

29 MODALES D2.2 Real effectiveness of OBD inspection and maintenance, and retrofit Version 1.0 Date 31/08/2020
engine coolant temperature and engine speed. As for diesel vehicles, also the following parame-ters should also be recorded and evaluated: maximum engine speed and rising time (during FAS test)
2.4.3.4 CITA SET II - Sustainable Emission Test for diesel vehicles involving NOx measurements
(CITA 2019)
This study remains as the latest in this series of coordinated and collaborated efforts of the testing
and inspection industry, as well as the scientific community regarding vehicle emissions and their
measurement technologies related to in-use compliance checking and performance assessment.
The goal of this study was set to develop new methods for inspection of the levels of emissions of
nitrogen oxides (NOx) from M1/N1 diesel vehicles <3.5 ton, suitable for use in regulatory purposes and
to be used in Periodic Technical Inspections (PTI). These methods should assess NOx EAT perfor-
mance to ensure that the system is functioning correctly, be cost efficient and practical to implement
in the current PTI regime.
In general, the study accomplished that:
1) Test methods with load simulation show a good potential to detect emission related failures: the ratio between concentration values between vehicles that pass and fail is high (up to 4)
2) The test methods without load simulation show lower ratios (less than two) between vehi-cles that pass or fail.
A further observation wat that high idle and FAS tests are sometimes not possible because of the limitation of the cut-off speed.
Furthermore:
3) Conditioning is important for a robust result of an emission test. Especially in SCR systems the catalyst temperature is very significant for the level of NOX-concentration and the effi-ciency of the system in general.
4) Thus, it is important to have information regarding the complete EAT system as well as the software strategy and its function to evaluate possible interaction of several installed sys-tems;
5) Different EAT systems can interact and compensate for a defect in a different system.
These findings brought the study to the following conclusions:
a) To be able to effectively evaluate the NOx-behaviour of diesel engine EAT systems, there is a need for specific technical information for the vehicle, of its
- EAT system(s) installed; - Software strategy (mode of operation); - Sensor information, which already exists in most of the OBD systems like SCR temperature,
urea injection rate, EGR valve activity or NOx values in a standardised way b) Preconditioning of the vehicle is crucial for a valid test result; c) Loaded tests are more meaningful than unloaded tests; d) The combination of comprehensive OBD-information and real emission tests are necessary
for a proper evaluation; e) The tests conducted emphasise the complexity of NOx measurement in practice; f) Further tests are required to give confidence in the initial results.
For setting the limit values or thresholds for FAIL/PASS, a reference value for a fully functioning
EAT ought to be defined as part of the type approval of the future vehicles. This kind of approach
30 MODALES D2.2 Real effectiveness of OBD inspection and maintenance, and retrofit Version 1.0 Date 31/08/2020
was already suggested in the previous phase (SET I). Furthermore, for older vehicles a representative
sample of vehicles in circulation should be tested to come up with acceptable cut-points. In addi-
tion, the study suggested to assess the potential of short trip tests, as well as the use of measure-
ment sensors which are used on vehicles, e.g. within a so called MINI PEMS test.
As a part of the study, a cost benefit analysis (CBA) was performed on the proposed test proce-
dures. The test procedures considered differ in terms of costs and accuracy of emission measure-
ment. However, with more elaborate and accurate procedures, more high emitting vehicles should
be entrapped with higher benefits for air quality improvements. The CBA was based on the time
taken to perform the tests and the amount of additional faulty vehicles detected and repaired. The
more sophisticated loaded tests with more accurate equipment had highest return rates, and the
unloaded somewhat lower. However, this assessment also found that benefit-cost ratio’s (BCR’s)
decrease over time, because the total amount of diesel vehicles decreases over the investigation
period. Nevertheless, the analysis showed that the benefit-cost ratios are excellent for all investi-
gated test procedures over the time period of next 10 years.
Finally, the study concluded that further investigations were still needed. Therefore, the study rec-
ommended taking the following points for consideration in the next NOx emission study related to
PTI:
a) Further tests are required in order to a) to define thresholds; b) to get better understanding of the behaviour of EAT systems, and c) to elaborate practical procedures for PTI emission tests;
b) Short test drive as an alternative seems promising, but needs further investigation; c) Further tests should include an extended OBD-reading (diagnostic tool) and vehicle-specific in-
formation provided by the OEM; d) Specific reference values for periodic emission tests should be defined at the time of type ap-
proval (Euro 6 and further) for future vehicles; e) It seems appropriate to combine the loaded ASM2050 method with the unloaded test method
for EGR assessment and OBD – read out for better evaluation; f) Coordinated EU-wide approach is necessary.
2.4.4 Other relevant studies
One of the shortcomings of the present PTI is that it is not worthwhile to measure NOx, even if it is
the other main precursor (together with PM/PN) for low air quality, because without load, the levels
of NOx emissions remain inherently low. Using a chassis dynamometer - like in many enhanced US
I/M programmes - would facilitate more proper evaluation of the NOx emissions performance, but
high costs are an inevitable consequence. To evade high costs, low-cost alternatives have been stud-
ied, and (Latham, 2007) gives one example of such a set-up.
This project focused on the development of a new type of dynamometer for measuring exhaust
emissions from light-duty vehicles, which is cheap and relatively easy to use, but can simulate load
condition typical for real driving situations. A prototype was developed and tested using three cars,
two petrol and one diesel. The system utilises free running chassis rollers and uses vehicle brakes to
apply load to the engine. Exhaust concentrations were measured with typical PTI station (or repair
garage) equipment and combined with readout of OBD data to allow approximated mass emissions
calculations.
The outcome of this work showed the eventual potential of this kind of set-up, but the limited test
vehicle set was not large enough to ascertain the full usability of such a set-up.

31 MODALES D2.2 Real effectiveness of OBD inspection and maintenance, and retrofit Version 1.0 Date 31/08/2020
2.4.5 PM and PN emissions measurements in PTI
Apart from NOx, mass of (all) particulates (PM) or number of (very small) particulates remains an
issue regarding local air quality in many European cities. For the purpose of addressing this issue,
type approval requirements has been amended to first encompass a PM limit value (EURO 5), and
more recently a PN limit value (EURO 6). Both are imposed on CI and SI engines, but for the latter
engine type only with GDI (direct-injection) fuel delivery/combustion principle, as the traditional ex-
chamber port-fuel injection does not induce (any size) particulate formation and emissions like the
in-chamber injection and subsequent combustion.
However, GDI is needed for best efficiency. To avoid this phenomena, some manufacturers have
adopted dual injection strategy, and are using port or GDI-injection depending on the operating point
(speed, torque) of the engine, as the propensity of the GDI combustion to generate particulate emis-
sions is limited only to specific parts of the operating map, Therefore, the use of the port-type injec-
tion will be limited to those areas only, and GDI injection is used elsewhere for better fuel efficiency.
Furthermore, there are many papers published addressing the subject of how to check PM and PN
emissions in terms of PTI. The most numerous of these studies has been initiated and funded by the
Dutch Ministry of Infrastructure and the Environment that has funded several studies in this respect,
addressing both light-duty and heavy-duty classes. (Kadijk 2015), (Kadijk et al. 2015), Ligterink et al.
2016), (Kadijk et al. 2016), (Spreen et al. 2016), (Kadijk et al. 2017a), Kadijk et al. 2017b)
In (Kadijk 2015) an investigation was made on the possibilities of detecting the filtration efficiency of
DPFs, including impaired or totally abolished units with tampered OBD-systems, with instrumenta-
tion and procedures that could be implemented as part of the PTI. The methodology was to use
smoke meters with different sensitivity and a sample of DPF units with different filtration efficiency.
A set of similar DPF cores were treated by artificially “opening” of a number of plugs in the filter core
to let part of the exhaust gases flow directly thru the channels, and not thru the porous wall struc-
ture of the core. The modified filters were targeted to different levels regarding the type approval
limits, and when mounted on a test vehicle, represented different PM emissions and filtration effi-
ciencies. Figure 3 portrays a summary of measurement results for those filters, showing the reasona-
bly good correlation between PM, PN and smoke measurement results.
As main result, the study concluded that smoke tests are suitable for roadworthiness tests of diesel
vehicles with diesel particulate filters. However, the smoke test equipment must be able to measure
low smoke emissions accurately. Measurement range of a state-of-art opacimeter of 0 – 3.0 m-1
should give satisfactory results, as typical levels of smoke in FAS test with Euro 5 engines without DPF
is 0.20 to 0.40 m-1, i.e. about 10 % of the total range of the instrument, whereas common standard
opacity meters with ranges up to 10 m-1 are not sensitive enough.

32 MODALES D2.2 Real effectiveness of OBD inspection and maintenance, and retrofit Version 1.0 Date 31/08/2020
Figure 2-3: Resulting PM, PN and smoke emissions in FAS test with different levels of impairment of the DPF unit (Source: Kadijk 2015)
The work was continued and reported by (Spreen et al.,2016). In that study those two smoke meters
were used, but also a condensation particle counter (CPC) instrument was available as a supplement.
In this phase altogether 213 passenger cars and light-duty vehicles were tested using various differ-
ent methods ranging from swipe test (with a clean finger) inside the tailpipe to idle measurement of
PN at idle, and normal FAS test in between. For vehicles that showed abnormal results in any of these
tests were tested also with a tissue filter test, where a tissue was attached to cover the tailpipe exit
and the vehicle was let to idle for three minutes. Tissues were visually checked for levels of blacken-
ing and other colouration and photographed for the reference record. Figures 2-4, 2-5, and 2-6 show
results for those vehicles tested.
Figure 2-4: Results of the tailpipe sweep test (Source: Spreen et al., 2016)

33 MODALES D2.2 Real effectiveness of OBD inspection and maintenance, and retrofit Version 1.0 Date 31/08/2020
Figure 2-5: Further analysis of the 201 vehicles that did not exceed 0,10 m-1 using the improved opacity (Source: Spreen et al., 2016)
Figure 2-6: Particulate emission test results measured in low idle speed tests (Source: Spreen et al., 2016)
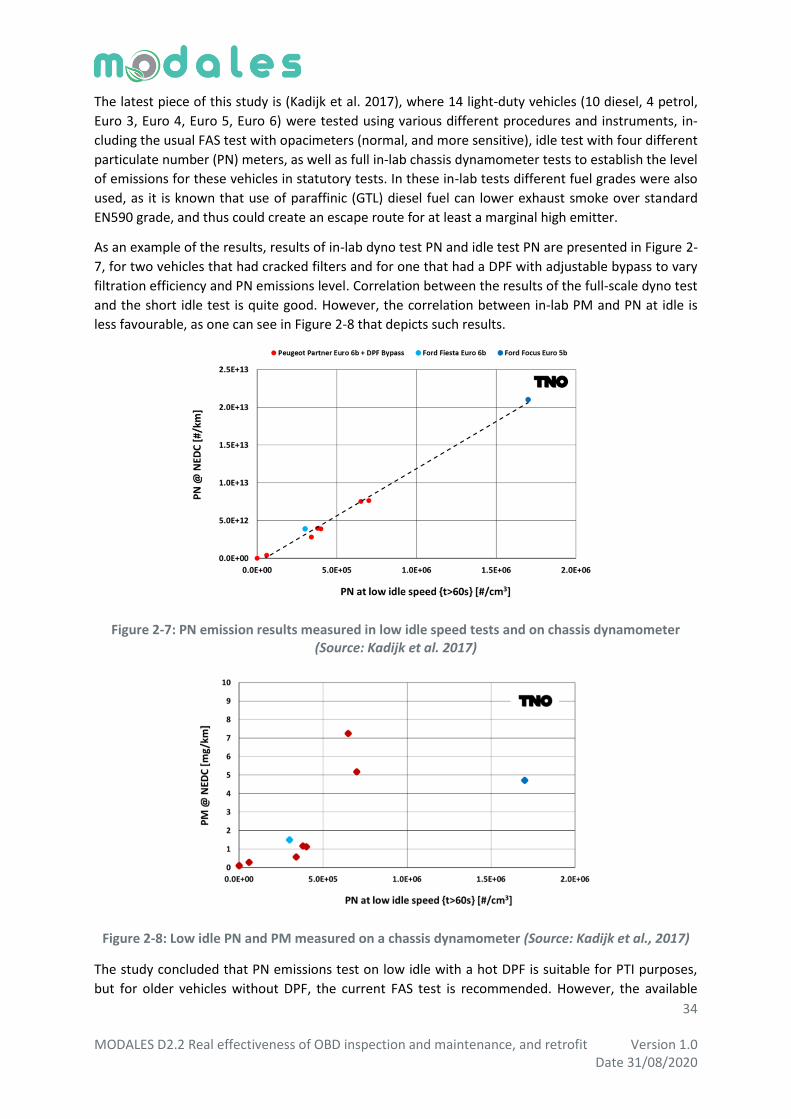
34 MODALES D2.2 Real effectiveness of OBD inspection and maintenance, and retrofit Version 1.0 Date 31/08/2020
The latest piece of this study is (Kadijk et al. 2017), where 14 light-duty vehicles (10 diesel, 4 petrol,
Euro 3, Euro 4, Euro 5, Euro 6) were tested using various different procedures and instruments, in-
cluding the usual FAS test with opacimeters (normal, and more sensitive), idle test with four different
particulate number (PN) meters, as well as full in-lab chassis dynamometer tests to establish the level
of emissions for these vehicles in statutory tests. In these in-lab tests different fuel grades were also
used, as it is known that use of paraffinic (GTL) diesel fuel can lower exhaust smoke over standard
EN590 grade, and thus could create an escape route for at least a marginal high emitter.
As an example of the results, results of in-lab dyno test PN and idle test PN are presented in Figure 2-
7, for two vehicles that had cracked filters and for one that had a DPF with adjustable bypass to vary
filtration efficiency and PN emissions level. Correlation between the results of the full-scale dyno test
and the short idle test is quite good. However, the correlation between in-lab PM and PN at idle is
less favourable, as one can see in Figure 2-8 that depicts such results.
Figure 2-7: PN emission results measured in low idle speed tests and on chassis dynamometer (Source: Kadijk et al. 2017)
Figure 2-8: Low idle PN and PM measured on a chassis dynamometer (Source: Kadijk et al., 2017)
The study concluded that PN emissions test on low idle with a hot DPF is suitable for PTI purposes,
but for older vehicles without DPF, the current FAS test is recommended. However, the available

35 MODALES D2.2 Real effectiveness of OBD inspection and maintenance, and retrofit Version 1.0 Date 31/08/2020
mobile PN testers are too expensive for most PTI stations, but work has been initiated and develop-
ment of a PTI-PN tester is on-going. Moreover, it has already been found that the new PTI-PN tester
does not work with petrol-fuelled vehicles, as their exhaust composition deviates so strongly from
that of diesel-fuelled. This remains an unsolved issue, because modern Euro 6c petrol cars are sub-
ject to strict PN limit values, and employ filters similar to those in diesel vehicles. This will also sug-
gest that in near future, those vehicles need similar control measures as diesels.
Finally, the study settled that current EOBD is not able to sufficiently judge failures in DPF, because it
has no PM or PN sensor, and the OBD system is susceptible against tampering and re-programming
with inadequate safeguards for these.
2.4.6 In-Use compliance of heavy-duty diesel trucks and PTI
The Dutch Ministry of the Environment and Infrastructure has also contracted research on in-use
emissions and compliance of heavy-duty diesel trucks (Riemersma et al. 2000), (Riemersma et al.
2009), and most recently (Vermeulen et al. 2016). Based on that experience, the research party has
addressed also issues related to PTI, or more specifically measuring NOx emissions in roadside in-
spections, in (Vermeulen et al. 2012). For this purpose, a smart emission measurement system
(SEMS) has been developed, which is able to screen the emission performance of heavy-duty vehi-
cles, while driving a short real-world trip on the road. The method is based on an automotive
NOx&O2 sensor and is combined with a GPS and data acquisition to gather data about the speed
profile of the vehicle during the test trip. As such, the authors claim that the method is a valid tool to
check the NOx emissions in an effective, robust, relatively cheap way.
2.4.7 On-board sensing of particulates and OBD
Parallel to the efforts of developing more effective measures for application in PTI, recent studies,
such as (Rostedt et.al., 2009), (Bilby et al. ,2016), (Stavros et al., 2016), (Rostedt et al., 2017), (Maricq
& Bilby, 2018), (Kontses et al., 2019), (Boveroux et al., 2019), (Burtscher et al., 2019), have also ad-
dressed the issue of high PM and PN emissions via assessment of various technologies and their po-
tentials for direct, on-board sensing of high particulate emissions and inclusion of this signal to the
overall scope of OBD. Sensor technologies that have been evaluated include different electrical
charge-based and electrical detection, as well as optical methods.
2.4.8 Using inspection data base to identify major reasons for failure
With access to a database of failure reasons of PTI tests could give a possibility to evaluate the rate of
performance shortcomings that are most commonly leading to a fail in the inspection. An example of
such data and output is depicted in Fig. 2-9, based on data from Dutch technical inspections having
taken place in 2006.
The Figure shows that the failure rate is at the highest amongst cars of 14 to 15 years of age. Fur-
thermore, we can see that exceeding the emissions cut-points is the fourth largest cause of failing
the inspection, and the highest rates for emissions are acquired at 13 and 14 years of age.
However, we may also argue that because of the EOBD system fitted to almost all cars now over 15
years of age, impairs this statistical approach, because if the vehicle in question has an emissions-
related fault, OBD renders a DTC and lights-up the MIL-light. Therefore, the motorist is duly alerted
of a problem related to emissions, and most probably rectifies the problem before taking the PTI
test. Therefore, failures because if excessive emissions in vehicles that do have a fully functioning

36 MODALES D2.2 Real effectiveness of OBD inspection and maintenance, and retrofit Version 1.0 Date 31/08/2020
EOBD, should be considered as an evidence and testimonial of the inability of the present EOBD to
duly flag high emitting vehicles as it should.
Figure 2-9: Inspection failure rates for different ages of light vehicles for the Netherlands over a 4-month period in 2006 (Source: CITA, 2007)
Summary and Conclusions on I/M & PTI 2.5
We may definitely say that United States has clearly led to path to effectively regulate and curb ex-
haust emissions from motor vehicles. The U.S. EPA has long ago developed the basic set-up of a
three-stage approach for regulating the exhaust emissions form motor cars. The first stage is the
Type Approval (TA) that has maximum permissible amounts for different pollutants that a vehicle can
emit, when tested in a laboratory according to several different test procedures. The second stage
applies to in-use vehicles, and is called “in service conformity”, (ISC). In this phase several vehicle
families are tested annually, to determine, if their emissions remain below legal limits. If malfunc-
tions are found on these “properly maintained” vehicles, a recall may be issued, and all vehicles of
that type needs to be fixed by the manufacturer. The third stage is then the Inspection and Mainte-
nance (I/M) programmes run by several states (He & Jin, 2017).
In Europe, the basic TA stage has been the only legal obligation, and no ISC has been required, with
the exception of Sweden that had nationally a U.S.-like in-service conformity programme before they
joined the EU, and were allowed to continue with it. Now ISC is also mandatory in EU, with the adop-
tion of new regulations for ISC and Real Driving Emissions (RDE) along with the new WLTP (World-
Harmonised Light-Vehicle Test Procedure) applicable to Euro 6d cars, implemented progressively
from year 2018. (Williams&Minjares, 2016) The latest addition is the “market surveillance” aspect
that allows national TA authorities to perform ISC type of testing using the RDE/PEMS setup for any
vehicle that is marketed in the country, and not just those that they have originally type approved, as
was the case before (Continental, 2019).
In U.S., EPA has also succeeded in setting type approval (TA) limit values that are applicable to much
higher mileages, because current Tier 3 limit values for the time period of 2017 to 2024 are up to
150 000 miles (appr. 241 000 km) or 15 years, whereas the current European Euro 6d is valid only up

37 MODALES D2.2 Real effectiveness of OBD inspection and maintenance, and retrofit Version 1.0 Date 31/08/2020
to 100 000 km (or 5 years) for In-service Conformity (ISC). However, the type approval requires a
160 000 test to validate the EAT system durability. Thus, we can argue that the U.S. cars have some
advantage over the European ones regarding in-built robustness and durability in normal service
conditions. Furthermore, in U.S., the extended warranty that the manufacturers have on the EAT
system is also more stringent, requiring the OEMs to repair failing vehicles, should they prematurely
fail in emissions testing (Continental, 2019).
However, I/M programmes in U.S. have not shown an overall success in curbing the excess emissions
while the vehicles age, especially, if judged by their cost-effectiveness. Nor has EPA been able to set
clear limit values or cut-points for I/M tests that are determined as part of the TA process and test-
ing. The same applies largely also to Europe, even if the present PTI testing for CO and HC is using
specific limit values that are issued by the car manufacturer, because in real-terms emissions of CO
and HC are no more considered as air quality problem, but the real precursors today are NOx and
(small) particulates that are not yet addressed by the PTI procedures.
Furthermore, despite plentiful and proficient studies and literature in the subject, the European legis-
lation on the common (minimal) PTI procure regarding exhaust emissions remains highly inadequate
to address the needs to evaluate in-use performance of the present-day EAT systems applied in all
stages of the type approval legislation regarding the precursors of crucial pollutants (NOx, PN) lead-
ing to inadequate local air quality. Also, amendments of PTI procedures are way behind the introduc-
tion of EAT in vehicles because of more stringent TA rules. The issue is more of a legislative case,
because as previous chapter have shown, several large-scale studies have developed and presented
procedures applicable to NOx and PM/PN that could be implemented as parts of the PTI regulations,
but the EC has failed to do so by today.
Other types of emissions detection for trapping high emitters 2.6
2.6.1 Remote Sensing Technologies
Remote sensing of the concentration of various pollutants in the exhaust plume of a passing vehicle
is a technology originally developed in late 1980’s in Denver University by Donald H Steadman and
his colleagues. It was first presented as CO and CO2 only version (Bishop et al., 1989), but later a HC
channel was also added (Guenther et al., 1995). In the beginning it was seen as a tool to assess the
assumptions of emissions factors in fleet emissions models such as MOBILE3 and MOBILE4, devel-
oped by U.S.EPA. (Steadman, 1989)
However, as the technology allowed screening of large volumes of vehicle in relatively short time and
reasonably costs, it was also more widely employed and used to evaluate the effects of some local
programmes like “Colorado Oxygenated Fuel Program” in 1988. (Steadman, 1989)
Furthermore, one of the first findings with this type of fleet-wide measurements was that 10% of the
vehicles produce more than 50% of the emissions (then CO). (Steadman 1989) This signalled that
some vehicles are – for one reason or another – emitting at higher rates, and detecting as well as
rectifying those vehicles would yield to good return in emissions reductions. RSD was used early on
also assess the I/M programmes. (Steadman et.al., 1996), (Steadman et.al., 1997), (Steadman et.al.,
1998)
The collected datasets from various measurement sites and recurring campaigns have been actively
used to follow the evolution of the emissions of the U.S. motor vehicle fleet over several decades,
and a vast improvement can be seen. (Bishop&Haugen, 2018) (Bishop, 2019)

38 MODALES D2.2 Real effectiveness of OBD inspection and maintenance, and retrofit Version 1.0 Date 31/08/2020
Today, a fully functional RSD set-up has in addition to a pollutant analyser (EDAR) a camera device for
linking the measured values to a license plate, and in some case even with vehicle make, model etc.
data retrieved on-line OTA from a registration database. Furthermore, additional information of the
acceleration of the vehicle during exhaust plume scanning is provided. Figures 2-10 and 2-11 portray
two different alternatives for setting up the devices.
Figure 2-10: Schematic setup of the three units of the remote sensing device (Source: ICCT 2018)
Remote sensing technology was commercialised by Envirotest Corp. (USA), and state-of-art systems
are now offered by Opus Inspection that amalgamated Envirotest in a merger in 2013. The latest
model RSD 5000 adds nitrogen dioxide (NO2) to pollutants detected by the earlier device’s nitrogen
monoxide (NO), CO, carbon dioxide (CO2), hydrocarbons (HC), and opacity. (ICCT, 2019)
Laser-based analysers have been also been used for over 20 years for on-road remote sensing (Nel-
son et.al., 1998), and a relatively recent incarnation of laser detection technology is called EDAR1
(Emissions Detection And Reporting), manufactured by Hager Environmental & Atmospheric Tech-
nologies (HEAT). It uses a laser light source above street level along with reflective strips on the road
surface to enable top-down open path remote sensing of CO, CO2, NOx, HC and PM. Unlike the more
traditional UV and IR-light-based systems, the EDAR system has the capability to scan a two-
dimensional image of the exhaust plume. This has the potential to allow for an absolute measure-
ment of each pollutant, as compared with measuring each pollutant as a ratio to CO2. More details of
this system are available in (Ropkins, 2017).
1 https://www.heatremotesensing.com/edar
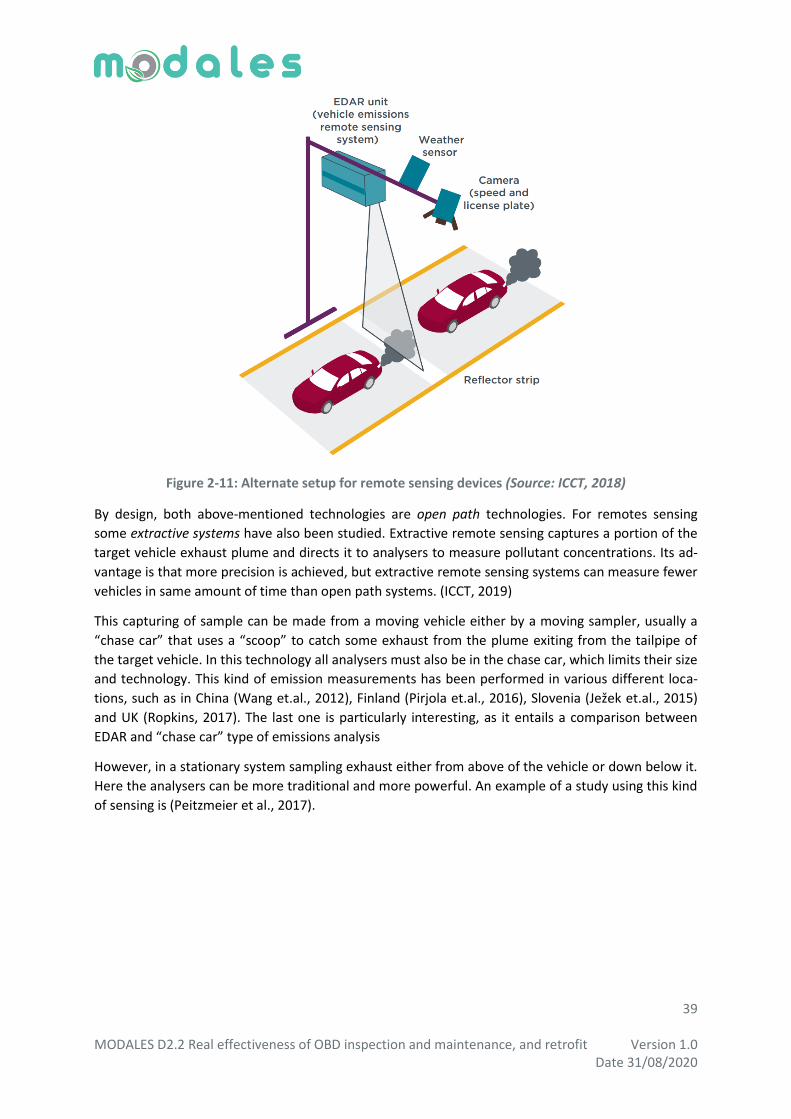
39 MODALES D2.2 Real effectiveness of OBD inspection and maintenance, and retrofit Version 1.0 Date 31/08/2020
Figure 2-11: Alternate setup for remote sensing devices (Source: ICCT, 2018)
By design, both above-mentioned technologies are open path technologies. For remotes sensing
some extractive systems have also been studied. Extractive remote sensing captures a portion of the
target vehicle exhaust plume and directs it to analysers to measure pollutant concentrations. Its ad-
vantage is that more precision is achieved, but extractive remote sensing systems can measure fewer
vehicles in same amount of time than open path systems. (ICCT, 2019)
This capturing of sample can be made from a moving vehicle either by a moving sampler, usually a
“chase car” that uses a “scoop” to catch some exhaust from the plume exiting from the tailpipe of
the target vehicle. In this technology all analysers must also be in the chase car, which limits their size
and technology. This kind of emission measurements has been performed in various different loca-
tions, such as in China (Wang et.al., 2012), Finland (Pirjola et.al., 2016), Slovenia (Ježek et.al., 2015)
and UK (Ropkins, 2017). The last one is particularly interesting, as it entails a comparison between
EDAR and “chase car” type of emissions analysis
However, in a stationary system sampling exhaust either from above of the vehicle or down below it.
Here the analysers can be more traditional and more powerful. An example of a study using this kind
of sensing is (Peitzmeier et al., 2017).

40 MODALES D2.2 Real effectiveness of OBD inspection and maintenance, and retrofit Version 1.0 Date 31/08/2020
Table 2-2: Main remote sensing technologies and manufacturers (Source: ICCT, 2019)
2.6.2 Application campaigns
Use of remote sensing for emissions measurements has not been particularly blooming in Europe,
but some efforts were started as early as 1990s for research purposes in Sweden (Sjödin, 1994) and
UK. However, during the past decade there has been a proliferation of efforts. The vast majority of
projects employed crossroad open path systems, although recent projects in England, Scotland and
France used the overhead configuration. (ICCT, 2019)
In 2016, the Bundesamt für Umwelt (Switzerland’s Federal Office for the Environment) funded the
CONOX project to compile remote sensing findings from Switzerland, Sweden, the United Kingdom,
France, and Spain since 2011 to build a European remote sensing database. In 2018, multiple reports
were published leveraging the more than 700,000 measurements from the CONOX database (Chen &
Borken-Kleefeld, 2014), (Borken-Kleefeld et al.,2018a), (Sjödin et al., 2018), (Jens Borken-Kleefeld et
al., 2018b)
The Real Urban Emissions initiative (TRUE) and others have continued to build up the database with
hundreds of thousands of new records being taken in 2018 alone, including more than 100,000 in
London (Dallmann 2018) and more than 200,000 in Paris (Dallmann 2019).

41 MODALES D2.2 Real effectiveness of OBD inspection and maintenance, and retrofit Version 1.0 Date 31/08/2020
2.6.3 Use of RSD data
Remote sensing measures an instantaneous emission rate of individual vehicles as they pass by the
instrument location. It is not an exact measurement, but the results are rather expressed as emis-
sions in g per g of fuel burned. Furthermore, location of the measurement site and ambient condi-
tions influence the results, and the reliability of the results depends to a large extent on the overall
sample size. Moreover, increasing the number of sites increase the representativeness of the meas-
urements for a wider area.
Anyhow, RSD data is not particularly good for assessing emissions of individual vehicles, but rather
giving the characteristics of fleets. For these reasons, the questions that RSD can answer are accord-
ing to (ICCT 2018) the following:
1. Air quality monitoring, planning, and vehicle emission models: What is the average emission rate
for the fleet, for different vehicle types, by emission standard, under real-driving conditions, and at
different traffic locations, as well as their development over time?
2. In-use surveillance: What is the average emission rate by manufacturer and by model under real-
driving conditions for statistically representative samples? What is the long-term durability of ex-
haust after-treatment systems?
3. Vehicle inspection and maintenance: Does an individual vehicle have suspiciously high pollutant
emissions in real driving? Or, inversely, is this vehicle’s after-treatment well maintained and can it be
exempted from vehicle inspection?
An example of using RSD data to characterise the fleet in some locations is given in Fig. 2-12.
Figure 2-12: NOx emission rates of diesel cars by year of manufacture from remote sensing cam-paigns in (left) London 2012 and 2013, and (right) Zurich, 2000—2012 (Source: ICCT, 2018)
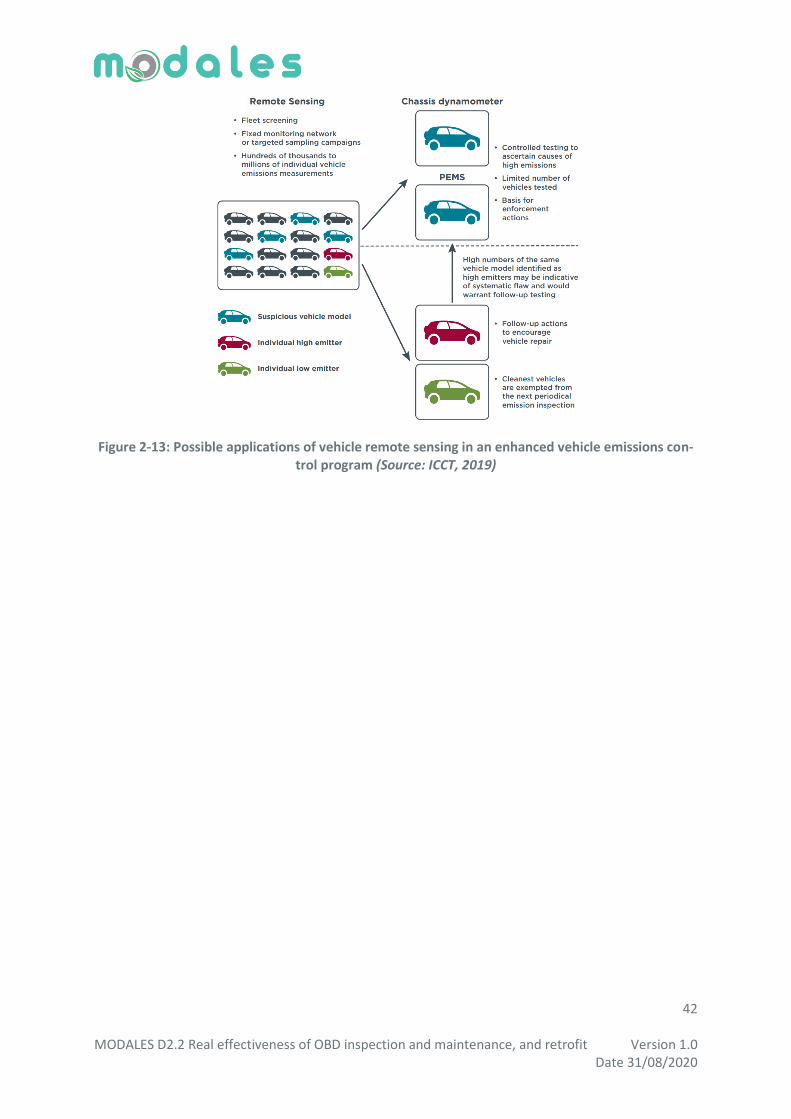
42 MODALES D2.2 Real effectiveness of OBD inspection and maintenance, and retrofit Version 1.0 Date 31/08/2020
Figure 2-13: Possible applications of vehicle remote sensing in an enhanced vehicle emissions con-trol program (Source: ICCT, 2019)
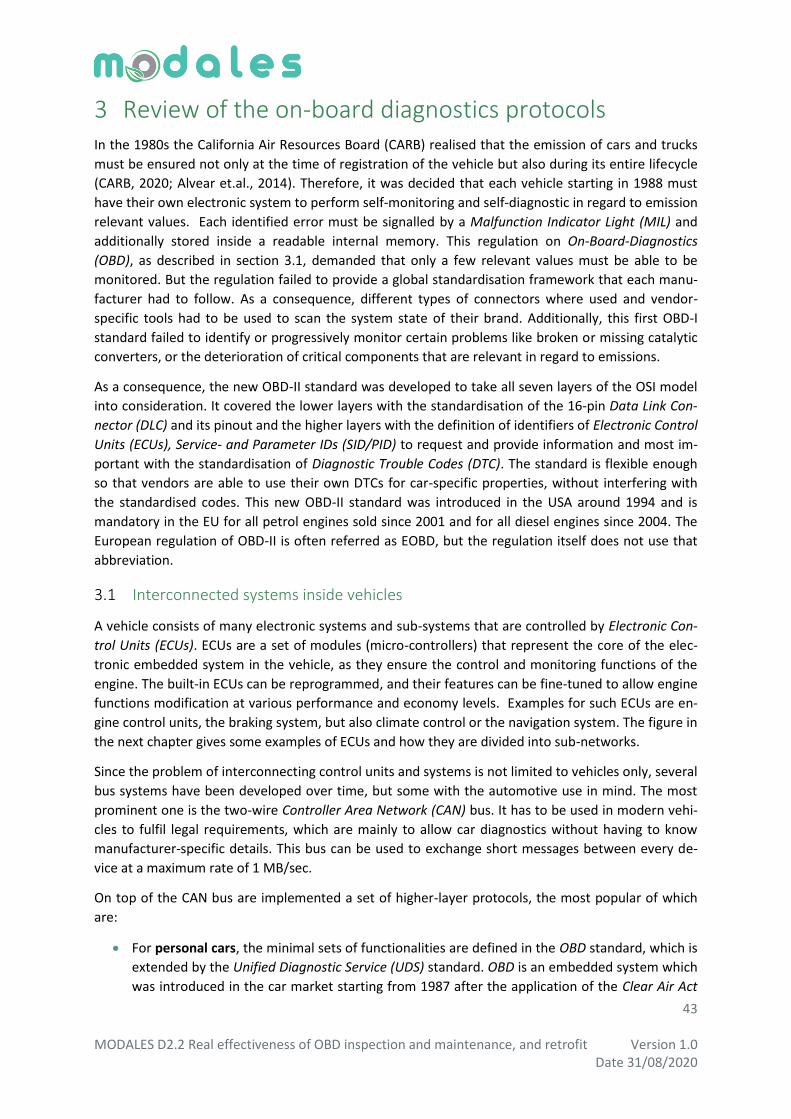
43 MODALES D2.2 Real effectiveness of OBD inspection and maintenance, and retrofit Version 1.0 Date 31/08/2020
3 Review of the on-board diagnostics protocols In the 1980s the California Air Resources Board (CARB) realised that the emission of cars and trucks
must be ensured not only at the time of registration of the vehicle but also during its entire lifecycle
(CARB, 2020; Alvear et.al., 2014). Therefore, it was decided that each vehicle starting in 1988 must
have their own electronic system to perform self-monitoring and self-diagnostic in regard to emission
relevant values. Each identified error must be signalled by a Malfunction Indicator Light (MIL) and
additionally stored inside a readable internal memory. This regulation on On-Board-Diagnostics
(OBD), as described in section 3.1, demanded that only a few relevant values must be able to be
monitored. But the regulation failed to provide a global standardisation framework that each manu-
facturer had to follow. As a consequence, different types of connectors where used and vendor-
specific tools had to be used to scan the system state of their brand. Additionally, this first OBD-I
standard failed to identify or progressively monitor certain problems like broken or missing catalytic
converters, or the deterioration of critical components that are relevant in regard to emissions.
As a consequence, the new OBD-II standard was developed to take all seven layers of the OSI model
into consideration. It covered the lower layers with the standardisation of the 16-pin Data Link Con-
nector (DLC) and its pinout and the higher layers with the definition of identifiers of Electronic Control
Units (ECUs), Service- and Parameter IDs (SID/PID) to request and provide information and most im-
portant with the standardisation of Diagnostic Trouble Codes (DTC). The standard is flexible enough
so that vendors are able to use their own DTCs for car-specific properties, without interfering with
the standardised codes. This new OBD-II standard was introduced in the USA around 1994 and is
mandatory in the EU for all petrol engines sold since 2001 and for all diesel engines since 2004. The
European regulation of OBD-II is often referred as EOBD, but the regulation itself does not use that
abbreviation.
Interconnected systems inside vehicles 3.1
A vehicle consists of many electronic systems and sub-systems that are controlled by Electronic Con-
trol Units (ECUs). ECUs are a set of modules (micro-controllers) that represent the core of the elec-
tronic embedded system in the vehicle, as they ensure the control and monitoring functions of the
engine. The built-in ECUs can be reprogrammed, and their features can be fine-tuned to allow engine
functions modification at various performance and economy levels. Examples for such ECUs are en-
gine control units, the braking system, but also climate control or the navigation system. The figure in
the next chapter gives some examples of ECUs and how they are divided into sub-networks.
Since the problem of interconnecting control units and systems is not limited to vehicles only, several
bus systems have been developed over time, but some with the automotive use in mind. The most
prominent one is the two-wire Controller Area Network (CAN) bus. It has to be used in modern vehi-
cles to fulfil legal requirements, which are mainly to allow car diagnostics without having to know
manufacturer-specific details. This bus can be used to exchange short messages between every de-
vice at a maximum rate of 1 MB/sec.
On top of the CAN bus are implemented a set of higher-layer protocols, the most popular of which
are:
For personal cars, the minimal sets of functionalities are defined in the OBD standard, which is
extended by the Unified Diagnostic Service (UDS) standard. OBD is an embedded system which
was introduced in the car market starting from 1987 after the application of the Clear Air Act
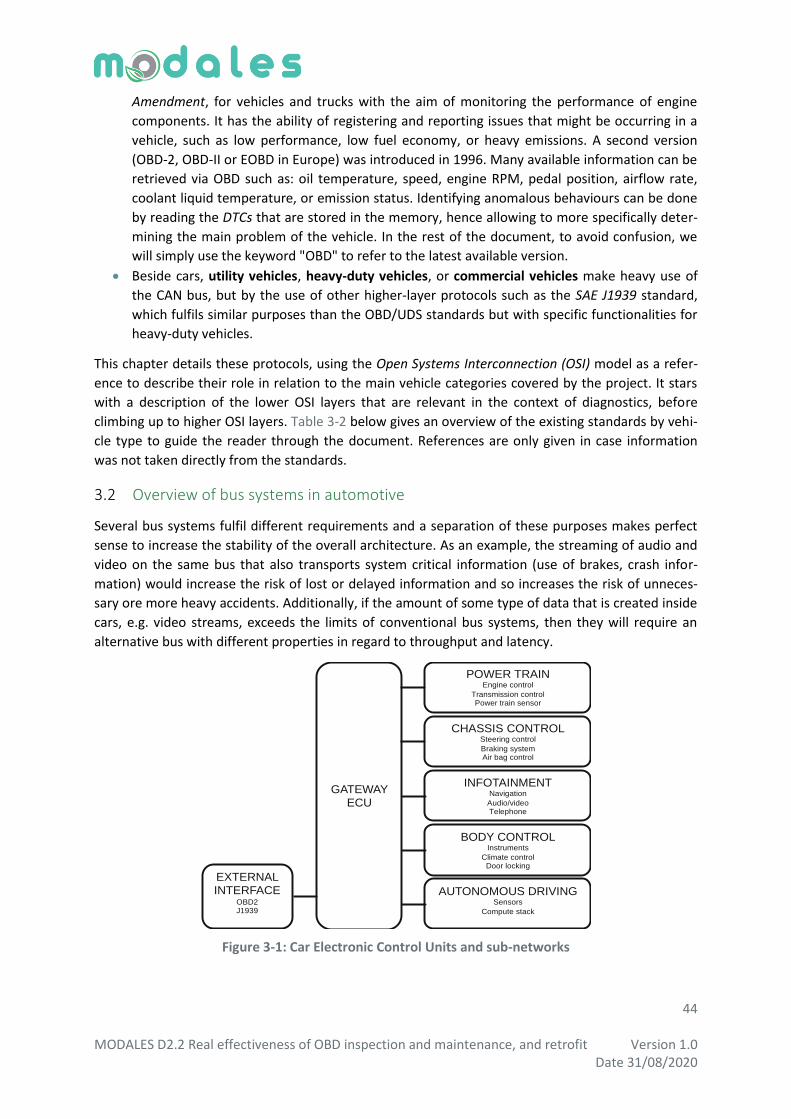
44 MODALES D2.2 Real effectiveness of OBD inspection and maintenance, and retrofit Version 1.0 Date 31/08/2020
Amendment, for vehicles and trucks with the aim of monitoring the performance of engine
components. It has the ability of registering and reporting issues that might be occurring in a
vehicle, such as low performance, low fuel economy, or heavy emissions. A second version
(OBD-2, OBD-II or EOBD in Europe) was introduced in 1996. Many available information can be
retrieved via OBD such as: oil temperature, speed, engine RPM, pedal position, airflow rate,
coolant liquid temperature, or emission status. Identifying anomalous behaviours can be done
by reading the DTCs that are stored in the memory, hence allowing to more specifically deter-
mining the main problem of the vehicle. In the rest of the document, to avoid confusion, we
will simply use the keyword "OBD" to refer to the latest available version.
Beside cars, utility vehicles, heavy-duty vehicles, or commercial vehicles make heavy use of
the CAN bus, but by the use of other higher-layer protocols such as the SAE J1939 standard,
which fulfils similar purposes than the OBD/UDS standards but with specific functionalities for
heavy-duty vehicles.
This chapter details these protocols, using the Open Systems Interconnection (OSI) model as a refer-
ence to describe their role in relation to the main vehicle categories covered by the project. It stars
with a description of the lower OSI layers that are relevant in the context of diagnostics, before
climbing up to higher OSI layers. Table 3-2 below gives an overview of the existing standards by vehi-
cle type to guide the reader through the document. References are only given in case information
was not taken directly from the standards.
Overview of bus systems in automotive 3.2
Several bus systems fulfil different requirements and a separation of these purposes makes perfect
sense to increase the stability of the overall architecture. As an example, the streaming of audio and
video on the same bus that also transports system critical information (use of brakes, crash infor-
mation) would increase the risk of lost or delayed information and so increases the risk of unneces-
sary ore more heavy accidents. Additionally, if the amount of some type of data that is created inside
cars, e.g. video streams, exceeds the limits of conventional bus systems, then they will require an
alternative bus with different properties in regard to throughput and latency.
Figure 3-1: Car Electronic Control Units and sub-networks
POWER TRAINEngine control
Transmission controlPower train sensor
CHASSIS CONTROLSteering control
Braking systemAir bag control
INFOTAINMENTNavigation
Audio/videoTelephone
BODY CONTROLInstruments
Climate controlDoor locking
AUTONOMOUS DRIVINGSensors
Compute stack
GATEWAY ECU
EXTERNAL INTERFACE
OBD2J1939
45 MODALES D2.2 Real effectiveness of OBD inspection and maintenance, and retrofit Version 1.0 Date 31/08/2020
For all these reasons, the overall network is divided into sub-networks, which might rely on different
bus standards. As described in the figure above, a commonly accepted separation is composed of five
sub-networks: Power Train, Chassis Control, Infotainment, Body Control, and Autonomous Driving.
Each sub-network uses the bus system that fulfils best its needs. In the centre of all these sub-
networks, an ECU gateway allows communication between sub-networks based on different stand-
ards.
The table below shows some examples of bus systems and their standards that are used or have
been used in vehicles. In relation to diagnostics, only the CAN bus is relevant today.
Table 3-1: Bus systems in automotive applications
Bus Standard Description
CAN ISO 11898 SAE J2284
Controller Area Network Serial bus with high- and low-speed option with event based random bus access Allow communication between ECUs and sensors with prioritized mes-sage Random bus access
K-Line ISO 9141 ISO 14230
Bidirectional solid-core solution to access ECUs Connections between sender and receiver have to be established and closed Mainly obsolete and replaced by CAN in new projects
J1850 SAE J1850 Serial bus Standardized access to vehicular network for onboard diagnostics Mainly obsolete and replaced by CAN in new projects
Ethernet IEEE 802.3 Mainly for data intensive purposes Used mostly for UDP only, without TLS
LIN ISO 17987 Local Interconnected Network Serial bus with time-based controlled bus access (delegated token) Integration of sensors and actors
FlexRay ISO 17458 Serial, deterministic and fault-tolerant bus for system-critical applications Allows both synchronous (real-time) and asynchronous data transfer
MOST ISO 21806 Media Oriented System Transport Synchronous ring bus system to transmit audio, video, voice and data via plastic optical fibre

46 MODALES D2.2 Real effectiveness of OBD inspection and maintenance, and retrofit Version 1.0 Date 31/08/2020
Table 3-2: Overview of the existing standards by vehicle type (numbers of standards only)
OSI
La
yer
CA
N
Pas
sen
ger
Car
s Tr
uck
s an
d B
us
Trac
tor
wit
h T
raile
rs
UD
S O
BD
W
WH
-OB
D
J193
9
7 A
pp
licat
ion
Lay
er
ISO
142
29
-1
ISO
142
29
-3
ISO
150
31
-5 /
SA
E J1
979
IS
O 2
714
5-3
SA
E J1
939
-71
SA
E J1
939
-73
SAE
J19
39-0
1
SAE
J19
39-8
1
ISO
119
92
-4
ISO
119
92
-2
ISO
119
92
-3
6 P
rese
nta
tio
n L
ayer
ISO
150
31
-2 /
SA
E J1
930
-DA
IS
O 1
503
1-5
/
SAE
J19
79-D
A
ISO
150
31
-6 /
SA
E J2
012
-DA
ISO
271
45
-2 /
SA
E J2
012
-DA
SAE
J19
39-D
A (
SPN
) SA
E J1
939
Ap
pen
dix
C (
SPN
) SA
E J1
939
-73
Ap
pen
dix
A
(FM
I)
5 Se
ssio
n L
ayer
IS
O 1
422
9-2
ISO
142
29
-2
4 Tr
ansp
ort
Lay
er
ISO
157
65
-2
ISO
271
45
-4
IS
O 1
576
5-2
3 N
etw
ork
Lay
er
SAE
J19
39-3
1
2 D
atal
ink
Laye
r
LCC
- L
ogi
cal
Lin
k C
on
tro
l
CA
N
Co
ntr
olle
r IS
O 1
189
8-1
ISO
157
65
-4
SAE
J19
39-2
1
ISO
118
98
-1
MA
C -
Med
ium
A
cces
s C
on
tro
l
1 P
hys
ical
La
yer
PLS
- P
hys
ica
l M
edia
Si
gnal
ling
SAE
J19
39-1
1
SAE
J19
39-1
2
SAE
J19
39-1
4
SAE
J19
39-1
5
ISO
119
92
-1
PM
A -
Ph
ysic
al
Med
ium
A
ttac
hm
en
t
CA
N
Tran
scei
ver
ISO
118
98
-2
ISO
118
98
-3
ISO
118
98
-4
ISO
118
98
-5
ISO
118
98
-6
SAE
J22
84-1
SA
E J2
284
-2
SAE
J22
84-3
SA
E J2
284
-4
SAE
J22
84-4
P
MS
- P
hys
ical
M
ediu
m
Spec
ific
atio
n
CA
N B
US
Med
ium
MD
I - M
ediu
m
Dep
end
ent
Inte
rfac
e
CA
N B
us
Co
nn
ecto
r

47 MODALES D2.2 Real effectiveness of OBD inspection and maintenance, and retrofit Version 1.0 Date 31/08/2020
Table 3-3: Overview of the existing standards by vehicle type (numbers of standards only)
P
asse
nge
r C
ars
Tru
cks
and
Bu
s Tr
acto
r w
ith
Tra
ilers
CA
N
UD
S O
BD
W
WH
-OB
D
J19
39
ISO
11
898
-x R
oad
ve
hic
les
- C
on
tro
ller
are
a n
etw
ork
(E
U S
tan
dar
d)
ISO
15
765
-x R
oad
ve
hic
les —
Dia
gno
stic
co
mm
un
icat
ion
ove
r C
on
tro
ller
Are
a N
etw
ork
(D
oC
AN
) IS
O 2
71
45-x
Ro
ad v
eh
icle
s —
Im
ple
men
tati
on
of
Wo
rld
-Wid
e
Har
mo
niz
ed
On
-Bo
ard
Dia
gno
stic
s (W
WH
-OB
D)
com
mu
nic
atio
n
req
uir
em
en
ts
SAE
J19
39-
xx R
eco
mm
en
de
d
Pra
ctic
e f
or
a Se
rial
Co
ntr
ol a
nd
C
om
mu
nic
atio
ns
Ve
hic
le
Ne
two
rk
(US
Stan
dar
d -
Tru
ck a
nd
Bu
s)
ISO
11
192
-x R
oad
ve
hic
les
— In
terc
han
ge o
f d
igit
al
info
rmat
ion
on
ele
ctri
cal
con
ne
ctio
ns
be
twe
en
to
win
g an
d t
ow
ed
ve
hic
les
SAE
J22
84-
x H
igh
Sp
eed
C
AN
fo
r V
eh
icle
A
pp
licat
ion
s (U
S St
and
ard
-
Pas
sen
ger
Car
s)
ISO
14
229
-x R
oad
ve
hic
les —
U
nif
ied
dia
gno
stic
se
rvic
es
(UD
S)
ISO
15
031
-x R
oad
ve
hic
les
— C
om
mu
nic
atio
n b
etw
een
ve
hic
le a
nd
ext
ern
al
eq
uip
me
nt
for
em
issi
on
s-re
late
d d
iagn
ost
ics
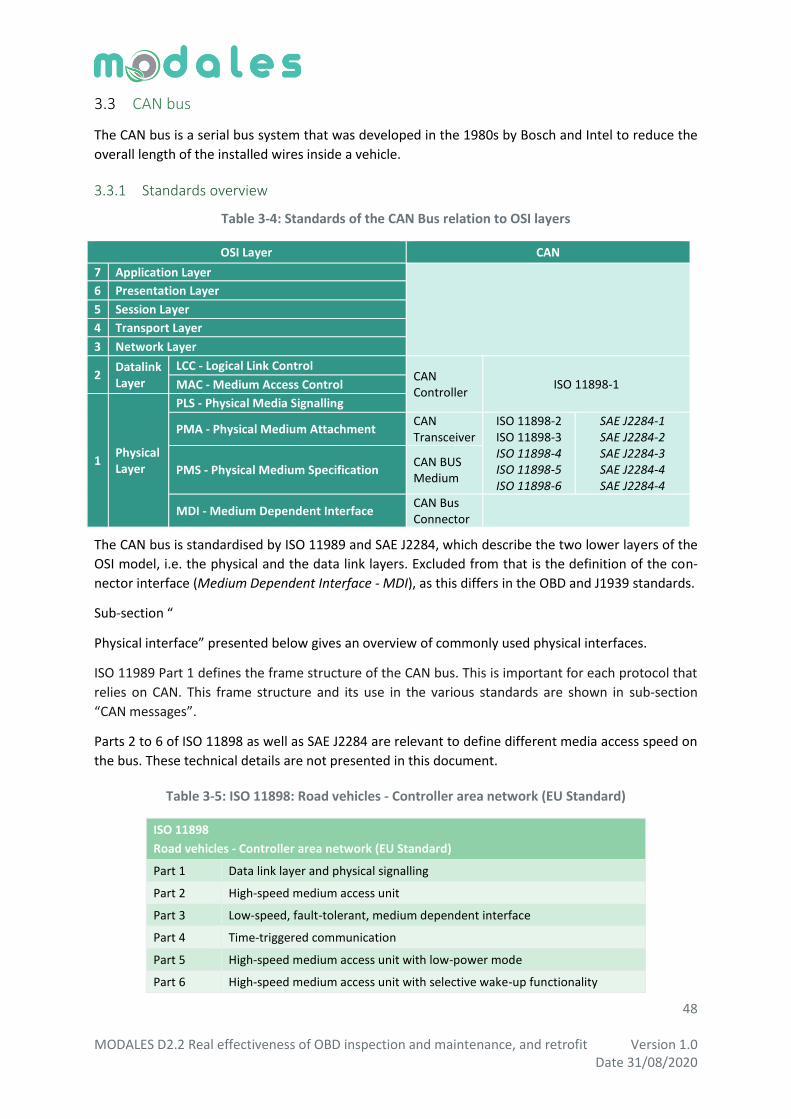
48 MODALES D2.2 Real effectiveness of OBD inspection and maintenance, and retrofit Version 1.0 Date 31/08/2020
CAN bus 3.3
The CAN bus is a serial bus system that was developed in the 1980s by Bosch and Intel to reduce the
overall length of the installed wires inside a vehicle.
3.3.1 Standards overview
Table 3-4: Standards of the CAN Bus relation to OSI layers
OSI Layer CAN
7 Application Layer
6 Presentation Layer
5 Session Layer
4 Transport Layer
3 Network Layer
2 Datalink Layer
LCC - Logical Link Control CAN Controller
ISO 11898-1 MAC - Medium Access Control
1 Physical Layer
PLS - Physical Media Signalling
PMA - Physical Medium Attachment CAN Transceiver
ISO 11898-2 ISO 11898-3 ISO 11898-4 ISO 11898-5 ISO 11898-6
SAE J2284-1 SAE J2284-2 SAE J2284-3 SAE J2284-4 SAE J2284-4
PMS - Physical Medium Specification CAN BUS Medium
MDI - Medium Dependent Interface CAN Bus Connector
The CAN bus is standardised by ISO 11989 and SAE J2284, which describe the two lower layers of the
OSI model, i.e. the physical and the data link layers. Excluded from that is the definition of the con-
nector interface (Medium Dependent Interface - MDI), as this differs in the OBD and J1939 standards.
Sub-section “
Physical interface” presented below gives an overview of commonly used physical interfaces.
ISO 11989 Part 1 defines the frame structure of the CAN bus. This is important for each protocol that
relies on CAN. This frame structure and its use in the various standards are shown in sub-section
“CAN messages”.
Parts 2 to 6 of ISO 11898 as well as SAE J2284 are relevant to define different media access speed on
the bus. These technical details are not presented in this document.
Table 3-5: ISO 11898: Road vehicles - Controller area network (EU Standard)
ISO 11898
Road vehicles - Controller area network (EU Standard)
Part 1 Data link layer and physical signalling
Part 2 High-speed medium access unit
Part 3 Low-speed, fault-tolerant, medium dependent interface
Part 4 Time-triggered communication
Part 5 High-speed medium access unit with low-power mode
Part 6 High-speed medium access unit with selective wake-up functionality
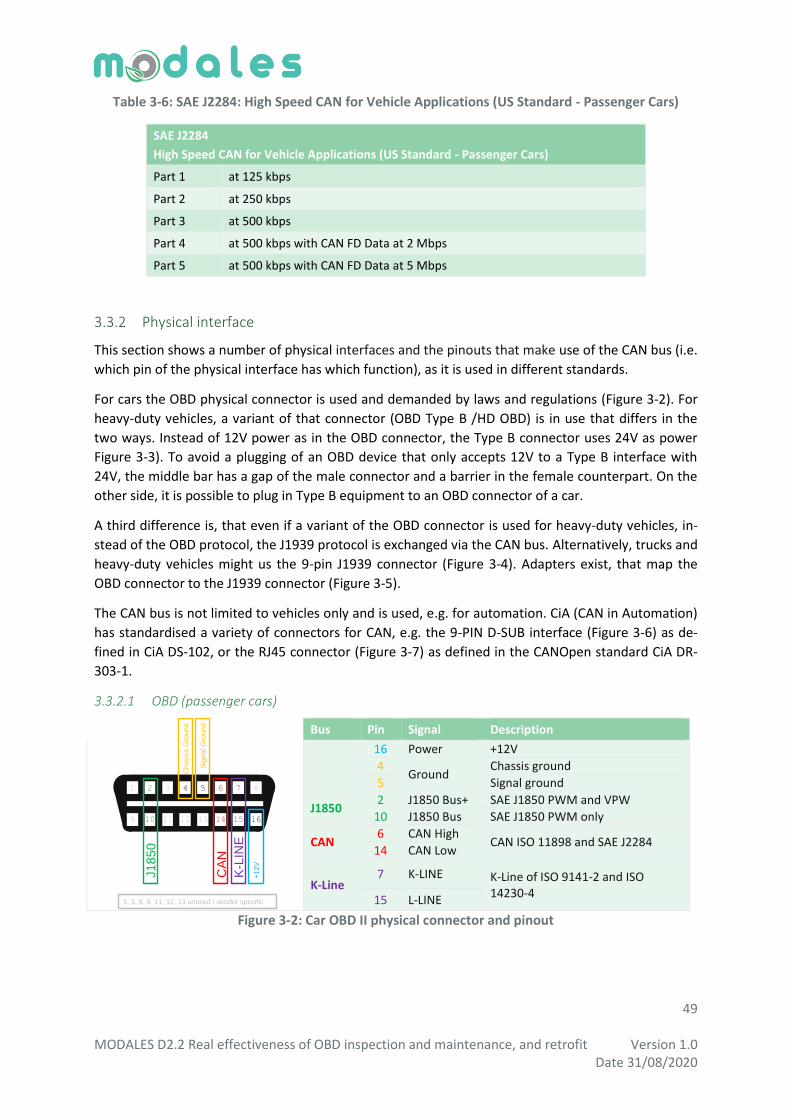
49 MODALES D2.2 Real effectiveness of OBD inspection and maintenance, and retrofit Version 1.0 Date 31/08/2020
Table 3-6: SAE J2284: High Speed CAN for Vehicle Applications (US Standard - Passenger Cars)
SAE J2284
High Speed CAN for Vehicle Applications (US Standard - Passenger Cars)
Part 1 at 125 kbps
Part 2 at 250 kbps
Part 3 at 500 kbps
Part 4 at 500 kbps with CAN FD Data at 2 Mbps
Part 5 at 500 kbps with CAN FD Data at 5 Mbps
3.3.2 Physical interface
This section shows a number of physical interfaces and the pinouts that make use of the CAN bus (i.e.
which pin of the physical interface has which function), as it is used in different standards.
For cars the OBD physical connector is used and demanded by laws and regulations (Figure 3-2). For
heavy-duty vehicles, a variant of that connector (OBD Type B /HD OBD) is in use that differs in the
two ways. Instead of 12V power as in the OBD connector, the Type B connector uses 24V as power
Figure 3-3). To avoid a plugging of an OBD device that only accepts 12V to a Type B interface with
24V, the middle bar has a gap of the male connector and a barrier in the female counterpart. On the
other side, it is possible to plug in Type B equipment to an OBD connector of a car.
A third difference is, that even if a variant of the OBD connector is used for heavy-duty vehicles, in-
stead of the OBD protocol, the J1939 protocol is exchanged via the CAN bus. Alternatively, trucks and
heavy-duty vehicles might us the 9-pin J1939 connector (Figure 3-4). Adapters exist, that map the
OBD connector to the J1939 connector (Figure 3-5).
The CAN bus is not limited to vehicles only and is used, e.g. for automation. CiA (CAN in Automation)
has standardised a variety of connectors for CAN, e.g. the 9-PIN D-SUB interface (Figure 3-6) as de-
fined in CiA DS-102, or the RJ45 connector (Figure 3-7) as defined in the CANOpen standard CiA DR-
303-1.
3.3.2.1 OBD (passenger cars)
Bus Pin Signal Description
16 Power +12V
4
Ground Chassis ground
5 Signal ground
J1850 2 J1850 Bus+ SAE J1850 PWM and VPW
10 J1850 Bus SAE J1850 PWM only
CAN 6 CAN High
CAN ISO 11898 and SAE J2284 14 CAN Low
K-Line 7 K-LINE K-Line of ISO 9141-2 and ISO
14230-4 15 L-LINE
Figure 3-2: Car OBD II physical connector and pinout
9 10 11 12 13 14 15 16
1 2 3 4 5 6 7 8
J1
850
CA
N
K-L
INE
+12V
Chassis
Gro
und
Sig
nal G
round
1, 3, 8, 9, 11, 12, 13 unused / vendor specific
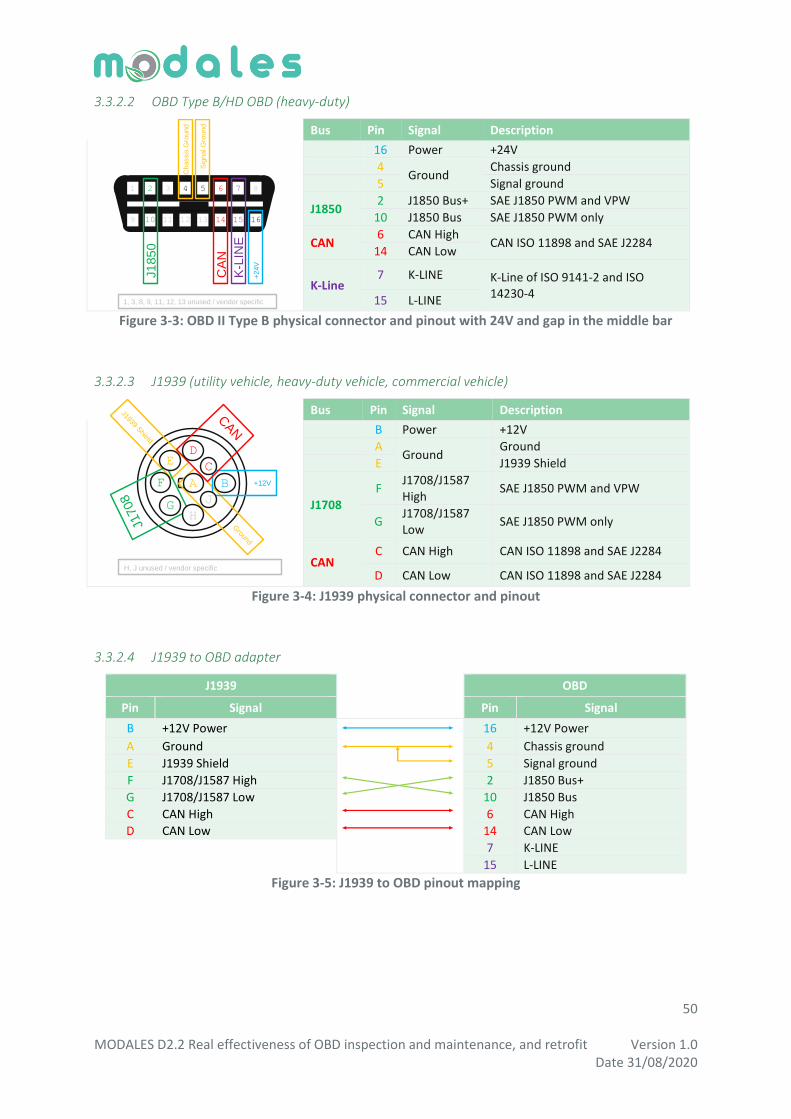
50 MODALES D2.2 Real effectiveness of OBD inspection and maintenance, and retrofit Version 1.0 Date 31/08/2020
3.3.2.2 OBD Type B/HD OBD (heavy-duty)
Bus Pin Signal Description
16 Power +24V
4 Ground
Chassis ground
5 Signal ground
J1850 2 J1850 Bus+ SAE J1850 PWM and VPW
10 J1850 Bus SAE J1850 PWM only
CAN 6 CAN High
CAN ISO 11898 and SAE J2284 14 CAN Low
K-Line 7 K-LINE K-Line of ISO 9141-2 and ISO
14230-4 15 L-LINE
Figure 3-3: OBD II Type B physical connector and pinout with 24V and gap in the middle bar
3.3.2.3 J1939 (utility vehicle, heavy-duty vehicle, commercial vehicle)
Bus Pin Signal Description
B Power +12V
A
Ground Ground
E J1939 Shield
J1708
F J1708/J1587 High
SAE J1850 PWM and VPW
G J1708/J1587 Low
SAE J1850 PWM only
CAN C CAN High CAN ISO 11898 and SAE J2284
D CAN Low CAN ISO 11898 and SAE J2284
Figure 3-4: J1939 physical connector and pinout
3.3.2.4 J1939 to OBD adapter
J1939 OBD
Pin Signal Pin Signal
B +12V Power
16 +12V Power
A Ground 4 Chassis ground
E J1939 Shield 5 Signal ground
F J1708/J1587 High 2 J1850 Bus+
G J1708/J1587 Low 10 J1850 Bus
C CAN High 6 CAN High
D CAN Low 14 CAN Low
7 K-LINE
15 L-LINE
Figure 3-5: J1939 to OBD pinout mapping
9 10 11 12 13 14 15 16
1 2 3 4 5 6 7 8
J1
850
CA
N
K-L
INE
+24V
Chassis
Gro
und
Sig
nal G
round
1, 3, 8, 9, 11, 12, 13 unused / vendor specific
Ground
J1939 Shield
J1708
+12V
H, J unused / vendor specificCAN
ED
F B
HG
J
C
A
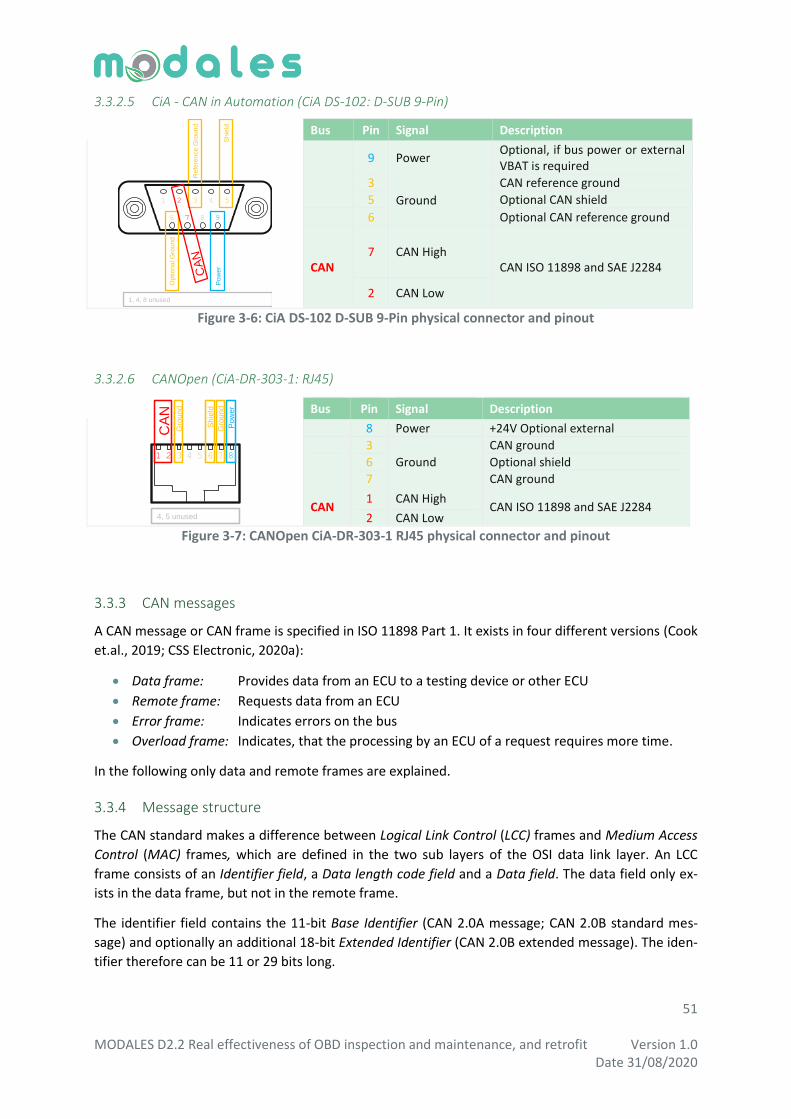
51 MODALES D2.2 Real effectiveness of OBD inspection and maintenance, and retrofit Version 1.0 Date 31/08/2020
3.3.2.5 CiA - CAN in Automation (CiA DS-102: D-SUB 9-Pin)
Bus Pin Signal Description
9 Power
Optional, if bus power or external VBAT is required
3
Ground
CAN reference ground
5 Optional CAN shield
6 Optional CAN reference ground
CAN 7 CAN High
CAN ISO 11898 and SAE J2284
2 CAN Low
Figure 3-6: CiA DS-102 D-SUB 9-Pin physical connector and pinout
3.3.2.6 CANOpen (CiA-DR-303-1: RJ45)
Bus Pin Signal Description
8 Power +24V Optional external
3
Ground
CAN ground
6 Optional shield
7 CAN ground
CAN 1 CAN High
CAN ISO 11898 and SAE J2284 2 CAN Low
Figure 3-7: CANOpen CiA-DR-303-1 RJ45 physical connector and pinout
3.3.3 CAN messages
A CAN message or CAN frame is specified in ISO 11898 Part 1. It exists in four different versions (Cook
et.al., 2019; CSS Electronic, 2020a):
Data frame: Provides data from an ECU to a testing device or other ECU
Remote frame: Requests data from an ECU
Error frame: Indicates errors on the bus
Overload frame: Indicates, that the processing by an ECU of a request requires more time.
In the following only data and remote frames are explained.
3.3.4 Message structure
The CAN standard makes a difference between Logical Link Control (LCC) frames and Medium Access
Control (MAC) frames, which are defined in the two sub layers of the OSI data link layer. An LCC
frame consists of an Identifier field, a Data length code field and a Data field. The data field only ex-
ists in the data frame, but not in the remote frame.
The identifier field contains the 11-bit Base Identifier (CAN 2.0A message; CAN 2.0B standard mes-
sage) and optionally an additional 18-bit Extended Identifier (CAN 2.0B extended message). The iden-
tifier therefore can be 11 or 29 bits long.
9
1 2 3 4 5
6 7 8P
ow
er
Shie
ld
Refe
ren
ce G
round
1, 4, 8 unused
Optional G
round
CA
N
4, 5 unused
1 2 3 4 5 6 7 8
CA
NG
round
Sh
ield
Gro
und
Pow
er

52 MODALES D2.2 Real effectiveness of OBD inspection and maintenance, and retrofit Version 1.0 Date 31/08/2020
The Data length code field simply describes how many bytes of data will follow in the Data field.
Figure 3-8: LCC Frame and MAC Frame pinout
The information of the LCC Frame are encapsulated inside a MAC frame, but the information of the
identifier field and the data length code field are integrated inside an Arbitration field and a Control
field. Additional bits indicate the start and end of the frame, allow to perform integrity checks and
support to acknowledge the receiving of a message. In the following the structure of the MAC frame
is synonymous for the CAN Message.
Figure 3-9: Start, end, redundancy check and acknowledge
All CAN messages start with one bit Start of Frame (SOF), and end with seven bits End of Frame
(EOF). The Cyclic Redundancy Check (CRC and CRC delimiter) follows right after the data field and is
followed by an Acknowledge (ACKN and ACKN delimiter) to identify that the message was received.
The CRC-15 calculation is based on the generator polynomial x15+x14+x10+x8+x7+x4+x3+1, which is usu-
ally able to detect five-bit errors or burst errors up to 15 bits. Due to the introduction of stuffed-bits
(see explanation below), this number is reduced in worst case to the detection of one-bit error only.
A sender / transmitter of a message is able to identify that the message was fully received by a re-
ceiver on base of the ACKN bit. The transmitter sends a recessive 1 as ACKN. In case a receiver has
fully read the message from the bus and the CRC check was successful, it will put a dominant 0 as the
ACKN on the bus, which overrules the 1 from the transmitter. The transmitter will observe the domi-
nant 0 on the bus and can conclude, that at least one receiver has fully accepted the message. In case
no one has fully received or accepted the message, the ACKN stays as 1 indicating to the transmitter,
that an ACKN error has occurred.
The transmitter will insert Stuffed Bits starting at the transmission of the SOF bit until the end of the
CRC-check. In case five identical bits have been send, a stuffed bit of the opposite value will be in-
cluded. In case of five 0, the stuffed bit will be a 1, and in case of five 1, the stuffed bit will be a 0. The
Identifierfield
Data lengthcode field
Data field
0-8 byte4 bit12 or 30 bit
Arbitrationfield
Controlfield
12 or 32 bit 6 bit 0-8 byte 16 bit 2 bit 7 bit1 bit
Datafield
MA
C
Fra
me
LL
C
Fra
me
CRC ACKN
Sta
rt
End
Data field
SO
F(0
)
CR
CC
RC
14
..C
RC
0
EO
F(1
11
11
11
)
R0
(0)
DL
C3
DL
C2
DL
C1
DL
C0
Arbitrationfield
Controlfield
AC
KN
(se
nd
er:
1 / r
ece
ive
r: 0
)
CR
C D
EL
(1)
AC
KN
DE
L(1
)
CRC ACKN
Sta
rt
En
d
D1
DB
7..D
B0
...D2
DB
7..D
B0
D8
DB
7..D
B0
data
actual information
ack-now-
ledge
cyclicredundancy
check
end of frame
sta
rt o
f fr
am
e
IDE
(0)ID
ID28..ID18(base)
R1
(0)
IDE
(1)
SR
R(1
) IDID17..ID0
(ext.)
IDID28..ID18
(base)
RT
R(d
ata
: 0
, re
qu
est: 1
)
data length code field
length of information

53 MODALES D2.2 Real effectiveness of OBD inspection and maintenance, and retrofit Version 1.0 Date 31/08/2020
reader will identify an error in case six or more bits of the same value have been sent (exception: EOF
with 7 time “1”). Each stuffed bit can be transparently removed from the bit-stream.
3.3.5 Standard and extended identifier
In CAN 2.0B, two types of messages are defined, Standard messages with an 11-bit identifier, and
Extended messages with a 29-bit identifier.
The standard message with an 11-bit identifier is structured as follows:
Figure 3-10: Standard message with 11-bit identifier (CAN 2.0B)
The Identifier Extension Bit (IDE) is set to 0 showing, that only 11-bit identifier are used. This struc-
ture is identical to CAN 2.0A messages, except that they use a reserved R1 bit instead of the IDE bit.
Since both bits are 0, there is no real difference to a CAN 2.0A message.
The Remote Transmission Request (RTR) bit tells if this frame is a data frame (=0) that contains data,
or a remote frame (=1) that requests data. In case that bit is 1, no data field is given.
Figure 3-11: Standard message with 11-bit identifier (CAN 2.0B)
The IDE bit is set to 1, indicating a 29-bit identifier. These additional 18 bits follow the IDE bit. The
remote transmission request bit RTE that tells if this frame is a data frame or remote frame is moved
from the position behind the base 11-bit identifier to the position right after the additional 18 bits of
the extended identifier, making it again the next bit after the identifier is fully transmitted. Its original
position is replaced by a Substitute Remote Request (SRR) bit that is only introduces to ensure that
the IDE bit is in both cases the 14th bit of the frame. Two reserved bits are introduced right after the
RTR bit, ensuring that the data length code is still separated from the RTR bit by two bits.
Data field
SO
F(0
)
CR
CC
RC
14
..C
RC
0
EO
F(1
11
11
11
)
IDE
(0)ID
ID28..ID18(base)
R0
(0)
DL
C3
DL
C2
DL
C1
DL
C0
Arbitrationfield
Controlfield
AC
KN
(se
nd
er:
1 / r
ece
ive
r: 0
)
CR
C D
EL
(1)
AC
KN
DE
L(1
)
RT
R(d
ata
: 0
, re
qu
est: 1
)
CRC ACKN
Sta
rt
En
d
D1
DB
7..D
B0
...D2
DB
7..D
B0
D8
DB
7..D
B0
rem
ote
tra
nsm
issio
n
req
ue
st
ide
nti
fie
re
xte
ns
ion
bit
rese
rve
d
11 bit identifier
meaning/content/priority
of the message
data length code field
length of information
data
actual information
ack-now-
ledge
cyclicredundancy
check
end of frame
sta
rt o
f fr
am
e
Datafield
SO
F(0
)
CR
CC
RC
14
..C
RC
0
EO
F(1
11
11
11
)
R1
(0)
R0
(0)
DL
C3
DL
C2
DL
C1
DL
C0
Arbitrationfield
Controlfield
AC
KN
(se
nd
er:
1 / r
ece
ive
r: 0
)
CR
C D
EL
(1)
AC
KN
DE
L(1
)
RT
R(d
ata
: 0
, re
qu
est: 1
)
CRC ACKN
Sta
rt
En
d
D1
DB
7..D
B0
...D2
DB
7..D
B0
D8
DB
7..D
B0
rem
ote
tra
nsm
issio
n
req
ue
st
rese
rve
d
rese
rve
d
data length code field
length of information
data
actual information
ack-now-
ledge
cyclicredundancy
check
end of frame
sta
rt o
f fr
am
e
ide
nti
fie
re
xte
ns
ion
bit
IDE
(1)
SR
R(1
) IDID17..ID0
IDID28..ID18
su
bstitu
te r
em
ote
re
qu
est
11
bit b
ase
ide
ntifie
r
18
bit
ex
ten
de
d
ide
nti
fie
r

54 MODALES D2.2 Real effectiveness of OBD inspection and maintenance, and retrofit Version 1.0 Date 31/08/2020
3.3.6 Meaning and priority of the identifier
It is important to notice that the Identifier in CAN does not represent an address but defines the
meaning or content of the data that is requested or provided. Parts of the identifier might be under-
stood as address information in the higher OSI layers that make use of the CAN-bus. As an example,
the J1939 defines parts of the identifier as from- or to-address.
The identifier is either given as ID28..ID18 or ID28..ID0 so the higher bits of the identifier are trans-
mitted first. In case two sender start to send a frame at the same time, starting with the SOF bit, a
dominant 0 will always win on the bus against a recessive 1. A sender who uses a lower identifier and
who observes the bus will notice at one moment, that it had sent a 1 but observes a 0 on the bus. In
that case, the loosing sender will stop to transmit its frame immediately and try later. The winning
sender will not realise that this event has happened and simply continues to transmit. This behaviour
creates a priority of identifiers. The lower the value of the identifier is, the higher is its priority.
3.3.7 Data length code field and Data field
The four bits of the Data length code describe how many bytes of data will follow in the Data Field.
Only 0 to 8 bytes are possible, so only combinations from 0000 up to 1000 are valid as a data length
code. In case of a remote frame (RTR=0), the data length code is 0, and the data field is skipped.
Figure 3-12: Data length code and data
3.3.8 CAN FD
CAN Flexible Data (FD) is the latest extension of the CAN standard and introduces the possibility to
transmit up to 64 Bytes of data in a single frame (CAN Newsletter, 2015; CSS Electronic, 2020d). To
ensure, that such a CAN FD frame does not block the bus for too long time, a change of transmission
speed to a higher speed is possible during the frame transmission.
A CAN FD frame is signalled by the Flexible Data Rate Format (FDF) bit, which follows either the IDE
bit of the standard message, or the RTR bit of the extended message. In both cases, CAN FD frames
do not exist as remote frames, so the remote transmission request has always to be set to 0. To indi-
cate that change of behaviour, the remote transmission request bit is renamed to Remote Request
Substitution (RRS).
Another reserved bit res follows which can be used to extend the standard in future. Depending on
the number of data bytes a change of speed not always makes sense. Therefore, the Bit Rate Switch
Data field
SO
F(0
)
CR
CC
RC
14
..C
RC
0
EO
F(1
11
11
11
)
R0
(0)
DL
C3
DL
C2
DL
C1
DL
C0
Arbitrationfield
Controlfield
AC
KN
(se
nd
er:
1 / r
ece
ive
r: 0
)
CR
C D
EL
(1)
AC
KN
DE
L(1
)
CRC ACKN
Sta
rt
En
d
D1
DB
7..D
B0
...D2
DB
7..D
B0
D8
DB
7..D
B0
data length code field
length of information
0000: 0 Byte0001: 1 Byte
….
0111: 7 Byte1000: 8 Byte
data
actual information
ack-now-
ledge
cyclicredundancy
check
end of frame
sta
rt o
f fr
am
e
IDE
(0)ID
ID28..ID18(base)
R1
(0)
IDE
(1)
SR
R(1
) IDID17..ID0
(ext.)
IDID28..ID18
(base)
RT
R(d
ata
: 0
, re
qu
est: 1
)
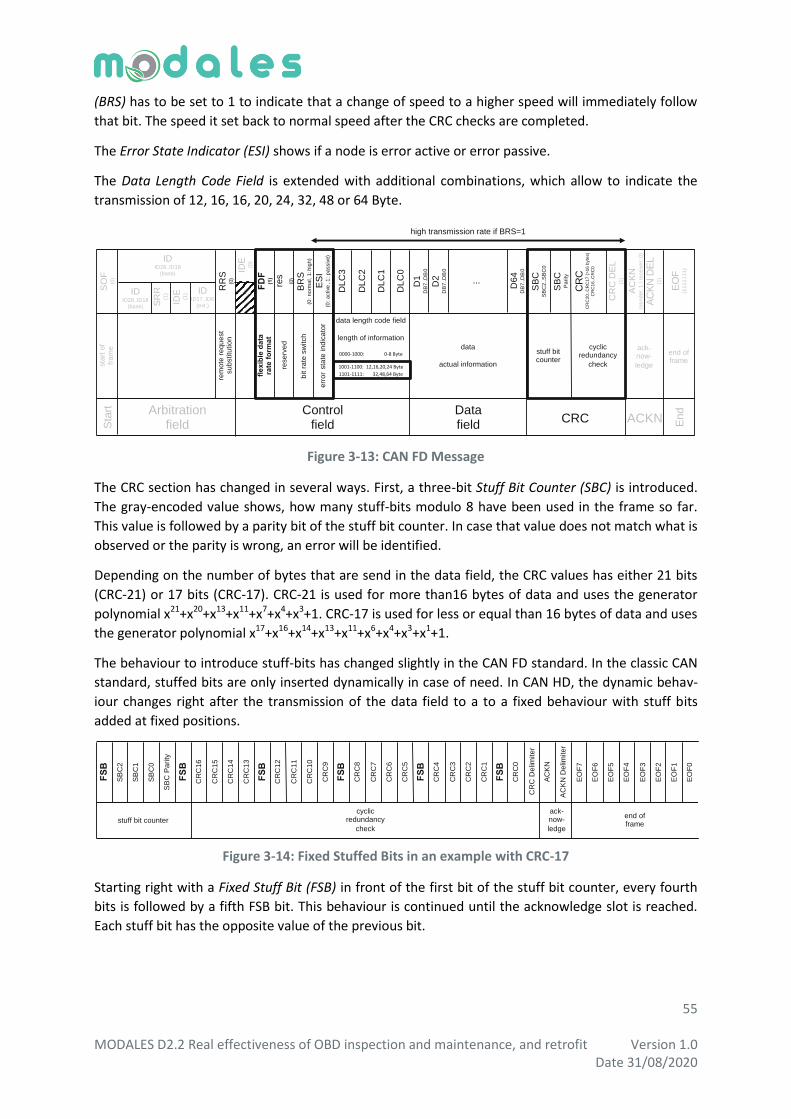
55 MODALES D2.2 Real effectiveness of OBD inspection and maintenance, and retrofit Version 1.0 Date 31/08/2020
(BRS) has to be set to 1 to indicate that a change of speed to a higher speed will immediately follow
that bit. The speed it set back to normal speed after the CRC checks are completed.
The Error State Indicator (ESI) shows if a node is error active or error passive.
The Data Length Code Field is extended with additional combinations, which allow to indicate the
transmission of 12, 16, 16, 20, 24, 32, 48 or 64 Byte.
Figure 3-13: CAN FD Message
The CRC section has changed in several ways. First, a three-bit Stuff Bit Counter (SBC) is introduced.
The gray-encoded value shows, how many stuff-bits modulo 8 have been used in the frame so far.
This value is followed by a parity bit of the stuff bit counter. In case that value does not match what is
observed or the parity is wrong, an error will be identified.
Depending on the number of bytes that are send in the data field, the CRC values has either 21 bits
(CRC-21) or 17 bits (CRC-17). CRC-21 is used for more than16 bytes of data and uses the generator
polynomial x21+x20+x13+x11+x7+x4+x3+1. CRC-17 is used for less or equal than 16 bytes of data and uses
the generator polynomial x17+x16+x14+x13+x11+x6+x4+x3+x1+1.
The behaviour to introduce stuff-bits has changed slightly in the CAN FD standard. In the classic CAN
standard, stuffed bits are only inserted dynamically in case of need. In CAN HD, the dynamic behav-
iour changes right after the transmission of the data field to a to a fixed behaviour with stuff bits
added at fixed positions.
Figure 3-14: Fixed Stuffed Bits in an example with CRC-17
Starting right with a Fixed Stuff Bit (FSB) in front of the first bit of the stuff bit counter, every fourth
bits is followed by a fifth FSB bit. This behaviour is continued until the acknowledge slot is reached.
Each stuff bit has the opposite value of the previous bit.
Data field
SO
F(0
)
CR
CC
RC
20
..C
RC
17
(>
16
byte
s)
CR
C1
6..C
RC
0
EO
F(1
11
11
11
)
DL
C3
DL
C2
DL
C1
DL
C0
Arbitrationfield
Controlfield
AC
KN
(se
nd
er:
1 / r
ece
ive
r: 0
)
CR
C D
EL
(1)
AC
KN
DE
L(1
)
CRC ACKN
Sta
rt
En
d
D1
DB
7..D
B0
...D2
DB
7..D
B0
D64
DB
7..D
B0
data length code field
length of information
0000-1000: 0-8 Byte
1001-1100: 12,16,20,24 Byte
1101-1111: 32,48,64 Byte
data
actual information
ack-now-
ledge
cyclicredundancy
check
end of frame
sta
rt o
f fr
am
e
IDE
(0)ID
ID28..ID18(base)
IDE
(1)
SR
R(1
) IDID17..ID0
(ext.)
IDID28..ID18
(base)
RR
S(0
)
FD
F(1
)
res
(0)
BR
S(0
:n
orm
al,
1:h
igh
)
ES
I(0
: a
ctive
, 1
: p
assiv
e)
bit r
ate
sw
itch
err
or
sta
te in
dic
ato
r
fle
xib
le d
ata
rate
fo
rma
t
rese
rve
d
rem
ote
re
qu
est
su
bstitu
tio
nhigh transmission rate if BRS=1
SB
CS
BC
2..S
BC
0
SB
CP
ari
ty
stuff bit counter
FS
B
SB
C2
SB
C1
SB
C0
FS
B
SB
C P
ari
ty
CR
C1
6
CR
C1
5
CR
C1
4
CR
C1
3
FS
B
CR
C1
2
CR
C1
1
CR
C1
0
CR
C9
FS
B
CR
C8
CR
C7
CR
C6
CR
C5
FS
B
CR
C4
CR
C3
CR
C2
CR
C1
FS
B
CR
C0
CR
C D
elim
ite
r
AC
KN
AC
KN
De
limite
r
EO
F7
EO
F6
EO
F5
EO
F4
EO
F3
EO
F2
EO
F1
EO
F0
ack-now-
ledge
cyclicredundancy
check
end offrame
stuff bit counter
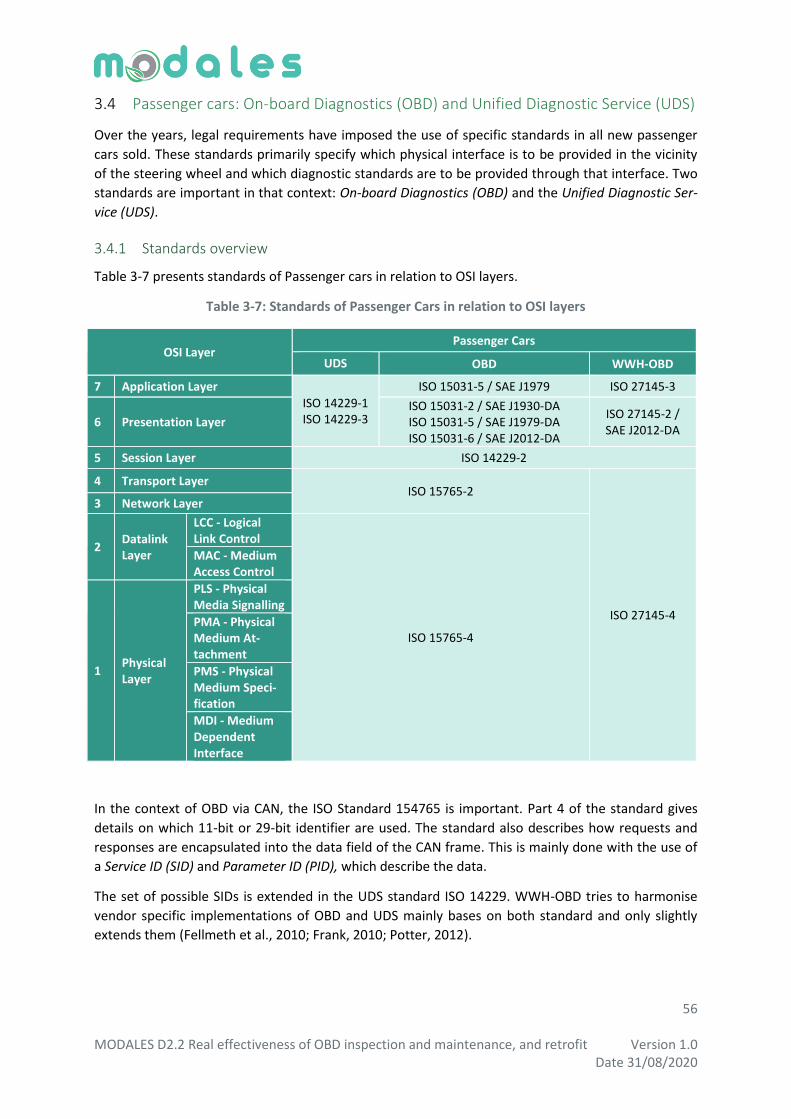
56 MODALES D2.2 Real effectiveness of OBD inspection and maintenance, and retrofit Version 1.0 Date 31/08/2020
Passenger cars: On-board Diagnostics (OBD) and Unified Diagnostic Service (UDS) 3.4
Over the years, legal requirements have imposed the use of specific standards in all new passenger
cars sold. These standards primarily specify which physical interface is to be provided in the vicinity
of the steering wheel and which diagnostic standards are to be provided through that interface. Two
standards are important in that context: On-board Diagnostics (OBD) and the Unified Diagnostic Ser-
vice (UDS).
3.4.1 Standards overview
Table 3-7 presents standards of Passenger cars in relation to OSI layers.
Table 3-7: Standards of Passenger Cars in relation to OSI layers
OSI Layer Passenger Cars
UDS OBD WWH-OBD
7 Application Layer
ISO 14229-1 ISO 14229-3
ISO 15031-5 / SAE J1979 ISO 27145-3
6 Presentation Layer ISO 15031-2 / SAE J1930-DA ISO 15031-5 / SAE J1979-DA ISO 15031-6 / SAE J2012-DA
ISO 27145-2 / SAE J2012-DA
5 Session Layer ISO 14229-2
4 Transport Layer ISO 15765-2
ISO 27145-4
3 Network Layer
2 Datalink Layer
LCC - Logical Link Control
ISO 15765-4
MAC - Medium Access Control
1 Physical Layer
PLS - Physical Media Signalling
PMA - Physical Medium At-tachment
PMS - Physical Medium Speci-fication
MDI - Medium Dependent Interface
In the context of OBD via CAN, the ISO Standard 154765 is important. Part 4 of the standard gives
details on which 11-bit or 29-bit identifier are used. The standard also describes how requests and
responses are encapsulated into the data field of the CAN frame. This is mainly done with the use of
a Service ID (SID) and Parameter ID (PID), which describe the data.
The set of possible SIDs is extended in the UDS standard ISO 14229. WWH-OBD tries to harmonise
vendor specific implementations of OBD and UDS mainly bases on both standard and only slightly
extends them (Fellmeth et al., 2010; Frank, 2010; Potter, 2012).
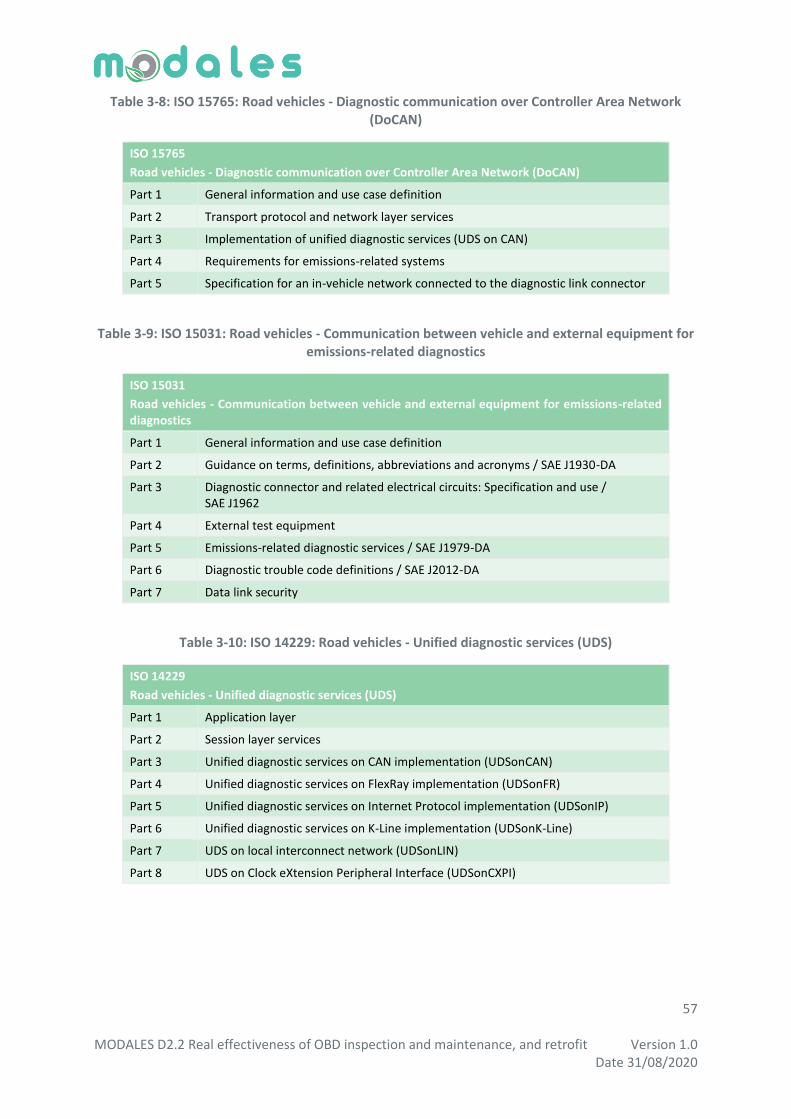
57 MODALES D2.2 Real effectiveness of OBD inspection and maintenance, and retrofit Version 1.0 Date 31/08/2020
Table 3-8: ISO 15765: Road vehicles - Diagnostic communication over Controller Area Network (DoCAN)
ISO 15765
Road vehicles - Diagnostic communication over Controller Area Network (DoCAN)
Part 1 General information and use case definition
Part 2 Transport protocol and network layer services
Part 3 Implementation of unified diagnostic services (UDS on CAN)
Part 4 Requirements for emissions-related systems
Part 5 Specification for an in-vehicle network connected to the diagnostic link connector
Table 3-9: ISO 15031: Road vehicles - Communication between vehicle and external equipment for emissions-related diagnostics
ISO 15031
Road vehicles - Communication between vehicle and external equipment for emissions-related diagnostics
Part 1 General information and use case definition
Part 2 Guidance on terms, definitions, abbreviations and acronyms / SAE J1930-DA
Part 3 Diagnostic connector and related electrical circuits: Specification and use / SAE J1962
Part 4 External test equipment
Part 5 Emissions-related diagnostic services / SAE J1979-DA
Part 6 Diagnostic trouble code definitions / SAE J2012-DA
Part 7 Data link security
Table 3-10: ISO 14229: Road vehicles - Unified diagnostic services (UDS)
ISO 14229
Road vehicles - Unified diagnostic services (UDS)
Part 1 Application layer
Part 2 Session layer services
Part 3 Unified diagnostic services on CAN implementation (UDSonCAN)
Part 4 Unified diagnostic services on FlexRay implementation (UDSonFR)
Part 5 Unified diagnostic services on Internet Protocol implementation (UDSonIP)
Part 6 Unified diagnostic services on K-Line implementation (UDSonK-Line)
Part 7 UDS on local interconnect network (UDSonLIN)
Part 8 UDS on Clock eXtension Peripheral Interface (UDSonCXPI)
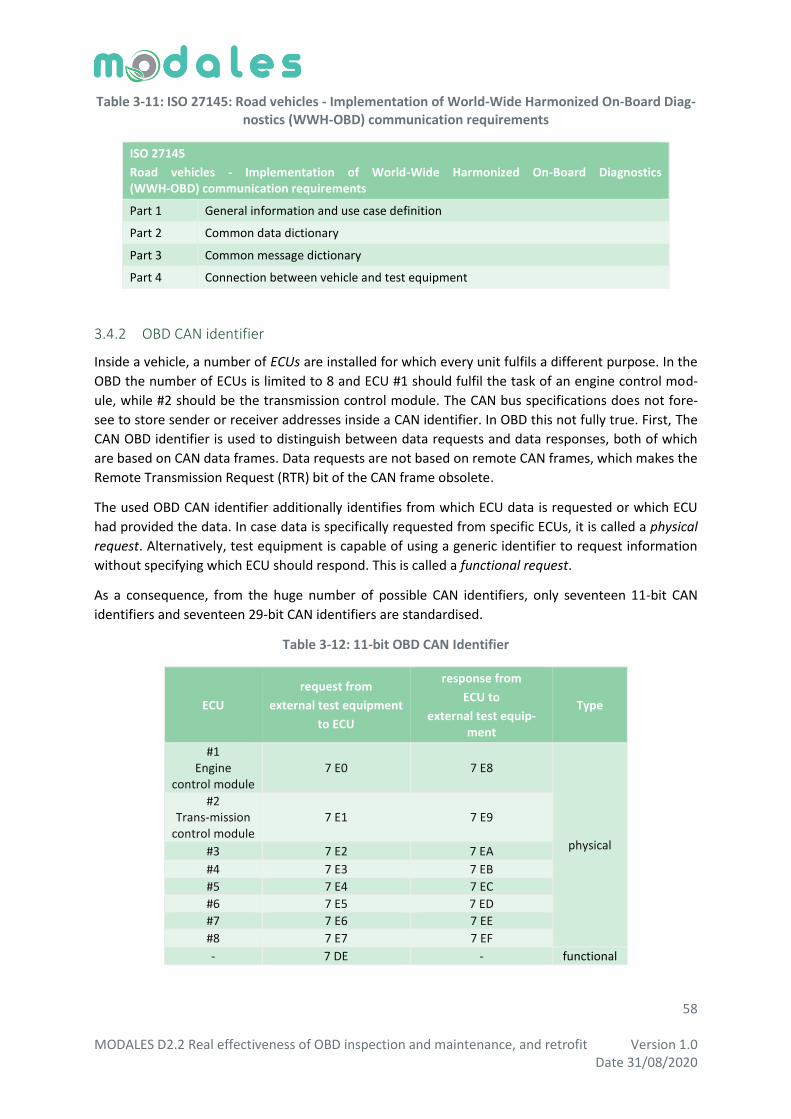
58 MODALES D2.2 Real effectiveness of OBD inspection and maintenance, and retrofit Version 1.0 Date 31/08/2020
Table 3-11: ISO 27145: Road vehicles - Implementation of World-Wide Harmonized On-Board Diag-nostics (WWH-OBD) communication requirements
ISO 27145
Road vehicles - Implementation of World-Wide Harmonized On-Board Diagnostics (WWH-OBD) communication requirements
Part 1 General information and use case definition
Part 2 Common data dictionary
Part 3 Common message dictionary
Part 4 Connection between vehicle and test equipment
3.4.2 OBD CAN identifier
Inside a vehicle, a number of ECUs are installed for which every unit fulfils a different purpose. In the
OBD the number of ECUs is limited to 8 and ECU #1 should fulfil the task of an engine control mod-
ule, while #2 should be the transmission control module. The CAN bus specifications does not fore-
see to store sender or receiver addresses inside a CAN identifier. In OBD this not fully true. First, The
CAN OBD identifier is used to distinguish between data requests and data responses, both of which
are based on CAN data frames. Data requests are not based on remote CAN frames, which makes the
Remote Transmission Request (RTR) bit of the CAN frame obsolete.
The used OBD CAN identifier additionally identifies from which ECU data is requested or which ECU
had provided the data. In case data is specifically requested from specific ECUs, it is called a physical
request. Alternatively, test equipment is capable of using a generic identifier to request information
without specifying which ECU should respond. This is called a functional request.
As a consequence, from the huge number of possible CAN identifiers, only seventeen 11-bit CAN
identifiers and seventeen 29-bit CAN identifiers are standardised.
Table 3-12: 11-bit OBD CAN Identifier
ECU
request from
external test equipment
to ECU
response from
ECU to
external test equip-ment
Type
#1 Engine
control module 7 E0 7 E8
physical
#2 Trans-mission
control module 7 E1 7 E9
#3 7 E2 7 EA
#4 7 E3 7 EB
#5 7 E4 7 EC
#6 7 E5 7 ED
#7 7 E6 7 EE
#8 7 E7 7 EF
- 7 DE - functional
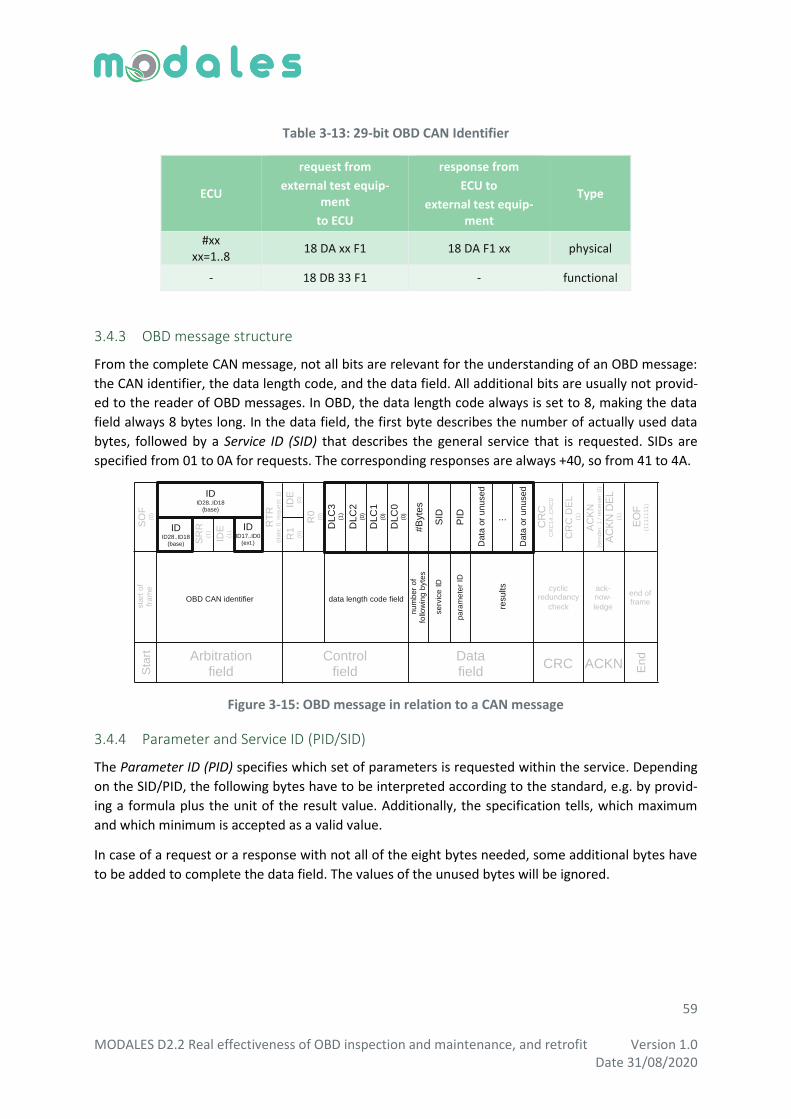
59 MODALES D2.2 Real effectiveness of OBD inspection and maintenance, and retrofit Version 1.0 Date 31/08/2020
Table 3-13: 29-bit OBD CAN Identifier
ECU
request from
external test equip-ment
to ECU
response from
ECU to
external test equip-ment
Type
#xx xx=1..8
18 DA xx F1 18 DA F1 xx physical
- 18 DB 33 F1 - functional
3.4.3 OBD message structure
From the complete CAN message, not all bits are relevant for the understanding of an OBD message:
the CAN identifier, the data length code, and the data field. All additional bits are usually not provid-
ed to the reader of OBD messages. In OBD, the data length code always is set to 8, making the data
field always 8 bytes long. In the data field, the first byte describes the number of actually used data
bytes, followed by a Service ID (SID) that describes the general service that is requested. SIDs are
specified from 01 to 0A for requests. The corresponding responses are always +40, so from 41 to 4A.
Figure 3-15: OBD message in relation to a CAN message
3.4.4 Parameter and Service ID (PID/SID)
The Parameter ID (PID) specifies which set of parameters is requested within the service. Depending
on the SID/PID, the following bytes have to be interpreted according to the standard, e.g. by provid-
ing a formula plus the unit of the result value. Additionally, the specification tells, which maximum
and which minimum is accepted as a valid value.
In case of a request or a response with not all of the eight bytes needed, some additional bytes have
to be added to complete the data field. The values of the unused bytes will be ignored.
Data field
SO
F(0
)
CR
CC
RC
14
..C
RC
0
EO
F(1
11
11
11
)
R0
(0)
DLC
3(1
)
DLC
2(0
)
DLC
1(0
)
DLC
0(0
)
Arbitrationfield
Controlfield
AC
KN
(se
nd
er:
1 / r
ece
ive
r: 0
)
CR
C D
EL
(1)
AC
KN
DE
L(1
)
CRC ACKN
Sta
rt
End
#B
yte
s
...
SID
Data
or
un
used
ack-now-
ledge
cyclicredundancy
check
end of frame
sta
rt o
f fr
am
e
IDE
(0)ID
ID28..ID18(base)
R1
(0)
IDE
(1)
SR
R(1
) IDID17..ID0
(ext.)
IDID28..ID18
(base)
RT
R(d
ata
: 0
, re
qu
est: 1
)
data length code fieldOBD CAN identifier
PID
Data
or
un
used
nu
mb
er
of
follo
win
g b
yte
s
se
rvic
eID
pa
ram
ete
r ID
resu
lts
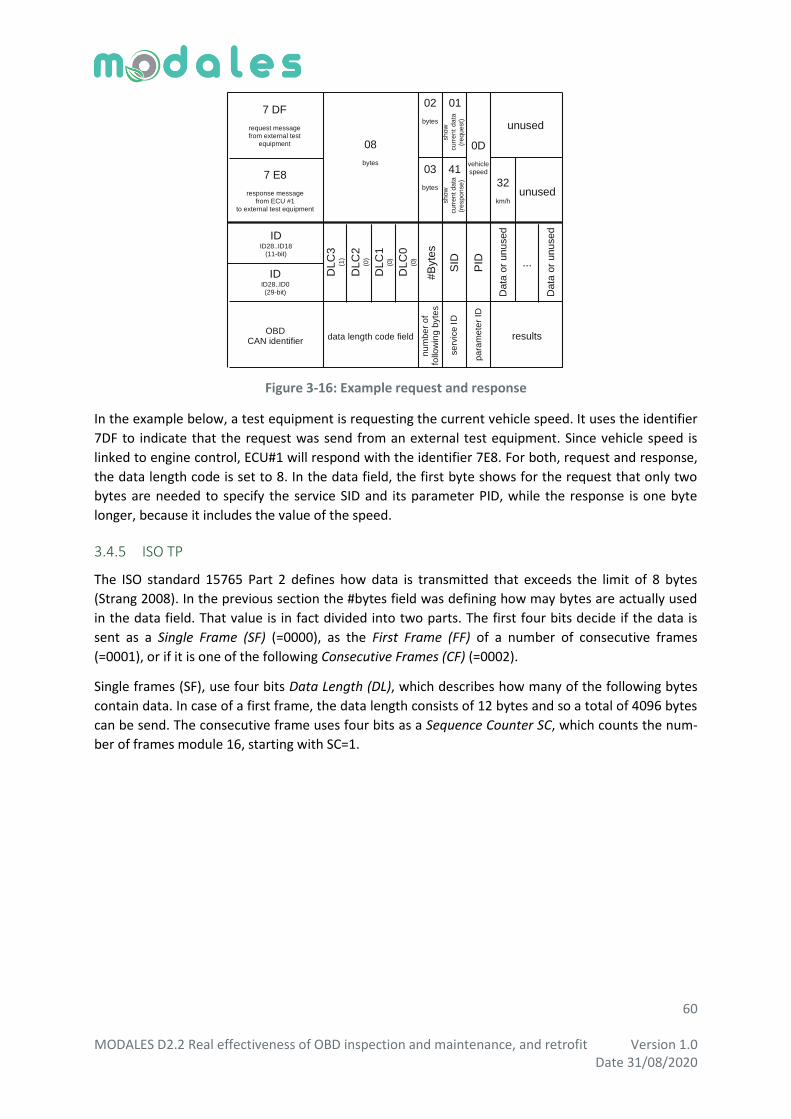
60 MODALES D2.2 Real effectiveness of OBD inspection and maintenance, and retrofit Version 1.0 Date 31/08/2020
Figure 3-16: Example request and response
In the example below, a test equipment is requesting the current vehicle speed. It uses the identifier
7DF to indicate that the request was send from an external test equipment. Since vehicle speed is
linked to engine control, ECU#1 will respond with the identifier 7E8. For both, request and response,
the data length code is set to 8. In the data field, the first byte shows for the request that only two
bytes are needed to specify the service SID and its parameter PID, while the response is one byte
longer, because it includes the value of the speed.
3.4.5 ISO TP
The ISO standard 15765 Part 2 defines how data is transmitted that exceeds the limit of 8 bytes
(Strang 2008). In the previous section the #bytes field was defining how may bytes are actually used
in the data field. That value is in fact divided into two parts. The first four bits decide if the data is
sent as a Single Frame (SF) (=0000), as the First Frame (FF) of a number of consecutive frames
(=0001), or if it is one of the following Consecutive Frames (CF) (=0002).
Single frames (SF), use four bits Data Length (DL), which describes how many of the following bytes
contain data. In case of a first frame, the data length consists of 12 bytes and so a total of 4096 bytes
can be send. The consecutive frame uses four bits as a Sequence Counter SC, which counts the num-
ber of frames module 16, starting with SC=1.
DLC
3(1
)
DLC
2(0
)
DLC
1(0
)
DLC
0(0
)
#B
yte
s
...
SID
Data
or
un
used
IDID28..ID18
(11-bit)
IDID28..ID0(29-bit)
data length code fieldOBD
CAN identifier
PID
Data
or
un
used
08
bytes
7 DF
request messagefrom external test
equipment
7 E8
response messagefrom ECU #1
to external test equipment
02
bytes
03
bytes
nu
mb
er
of
follo
win
g b
yte
s
se
rvic
eID
pa
ram
ete
r ID
results
01
41
32
km/hunused
unused
sh
ow
cu
rre
nt
da
ta
(re
qu
est)
sh
ow
cu
rre
nt d
ata
(r
esp
on
se
)
0D
vehicle
speed

61 MODALES D2.2 Real effectiveness of OBD inspection and maintenance, and retrofit Version 1.0 Date 31/08/2020
Figure 3-17: Data extending 8 bytes
Data that is send via multiple frames is responded by the receiver with a Flow Control FC (=0003). The
Flow Status (FS), tells the sender if it is Clear To Send (CTS) (=0), if it should Wait (=1) or if the receiver
had an Overflow (=3). The Block Size (BS) tells the sender how many consecutive frames the sender
might send in a row before the receiver needs time to process the data. The Minimum Separation
Time (STMin) tells the sender, how much time in milliseconds the sender needs to wait between two
consecutive frames.
Figure 3-18: Flow control
3.4.6 OBD Service IDs
The following table provides the standardised service IDs in OBD when used as a request and when
used as a response (Wikipedia, 2020a).
Table 3.14: Services in OBD
Service SID Description
Request Response
01 41 Show current data
02 42 Show freeze frame data
03 43 Show stored Diagnostic Trouble Codes
04 44 Clear Diagnostic Trouble Codes and stored values
05 45 Test results, oxygen sensor monitoring (non CAN only)
06 46 Test results, other component/system monitoring (Test results, oxygen sensor monitoring for CAN only)
4 Bit 4 Bit
0000 DL
Byte 1 Byte 3 Byte 4Byte 2 Byte 5 Byte 6 Byte 7 Byte 8
Data
7 Byte
4 Bit 12 Bit
0001 DL
Byte 1 Byte 3 Byte 4Byte 2 Byte 5 Byte 6 Byte 7 Byte 8
Data
6 Byte
4 Bit 4 Bit
0002 SN
Byte 1 Byte 3 Byte 4Byte 2 Byte 5 Byte 6 Byte 7 Byte 8
Data
≤ 7 Byte
Fir
st
Fra
me
Sin
gle
Fra
me
Co
nse
cutive
Fra
me
4 Bit 4 Bit
0003 FS
Byte 1 Byte 3Byte 2
BS
Flo
w
Con
tro
l 8 Bit 8 Bit
STMin
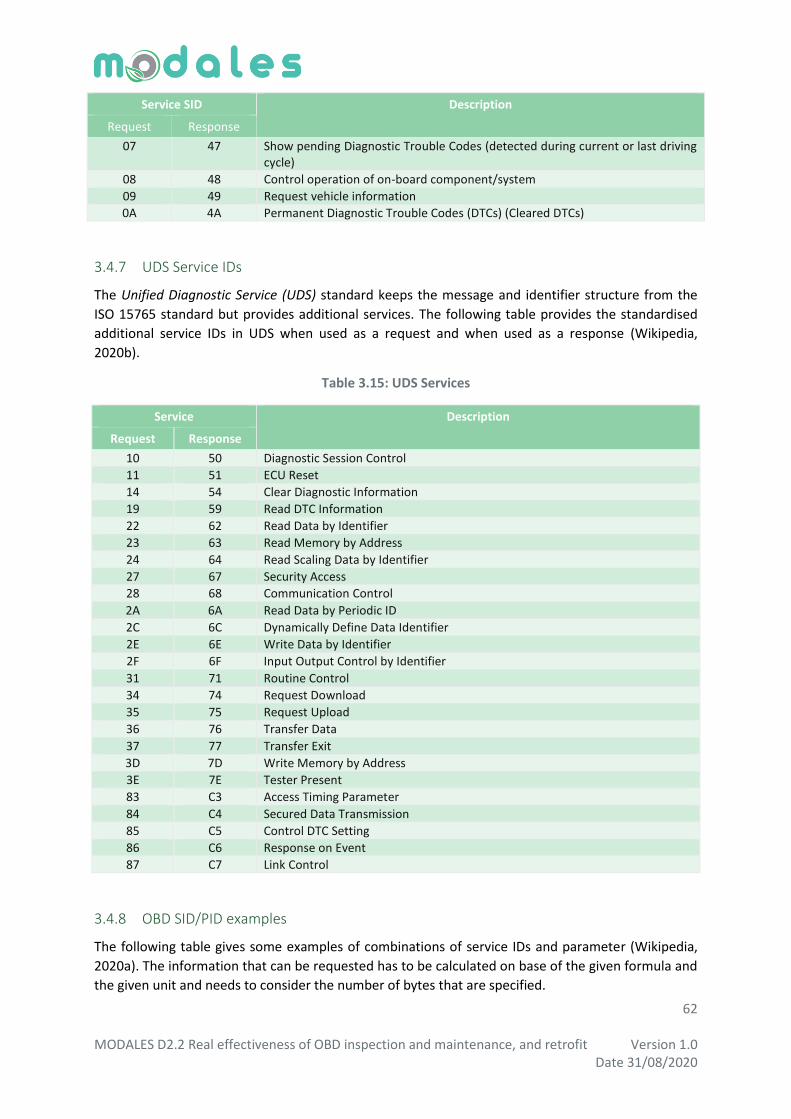
62 MODALES D2.2 Real effectiveness of OBD inspection and maintenance, and retrofit Version 1.0 Date 31/08/2020
Service SID Description
Request Response
07 47 Show pending Diagnostic Trouble Codes (detected during current or last driving cycle)
08 48 Control operation of on-board component/system
09 49 Request vehicle information
0A 4A Permanent Diagnostic Trouble Codes (DTCs) (Cleared DTCs)
3.4.7 UDS Service IDs
The Unified Diagnostic Service (UDS) standard keeps the message and identifier structure from the
ISO 15765 standard but provides additional services. The following table provides the standardised
additional service IDs in UDS when used as a request and when used as a response (Wikipedia,
2020b).
Table 3.15: UDS Services
Service Description
Request Response
10 50 Diagnostic Session Control
11 51 ECU Reset
14 54 Clear Diagnostic Information
19 59 Read DTC Information
22 62 Read Data by Identifier
23 63 Read Memory by Address
24 64 Read Scaling Data by Identifier
27 67 Security Access
28 68 Communication Control
2A 6A Read Data by Periodic ID
2C 6C Dynamically Define Data Identifier
2E 6E Write Data by Identifier
2F 6F Input Output Control by Identifier
31 71 Routine Control
34 74 Request Download
35 75 Request Upload
36 76 Transfer Data
37 77 Transfer Exit
3D 7D Write Memory by Address
3E 7E Tester Present
83 C3 Access Timing Parameter
84 C4 Secured Data Transmission
85 C5 Control DTC Setting
86 C6 Response on Event
87 C7 Link Control
3.4.8 OBD SID/PID examples
The following table gives some examples of combinations of service IDs and parameter (Wikipedia,
2020a). The information that can be requested has to be calculated on base of the given formula and
the given unit and needs to consider the number of bytes that are specified.
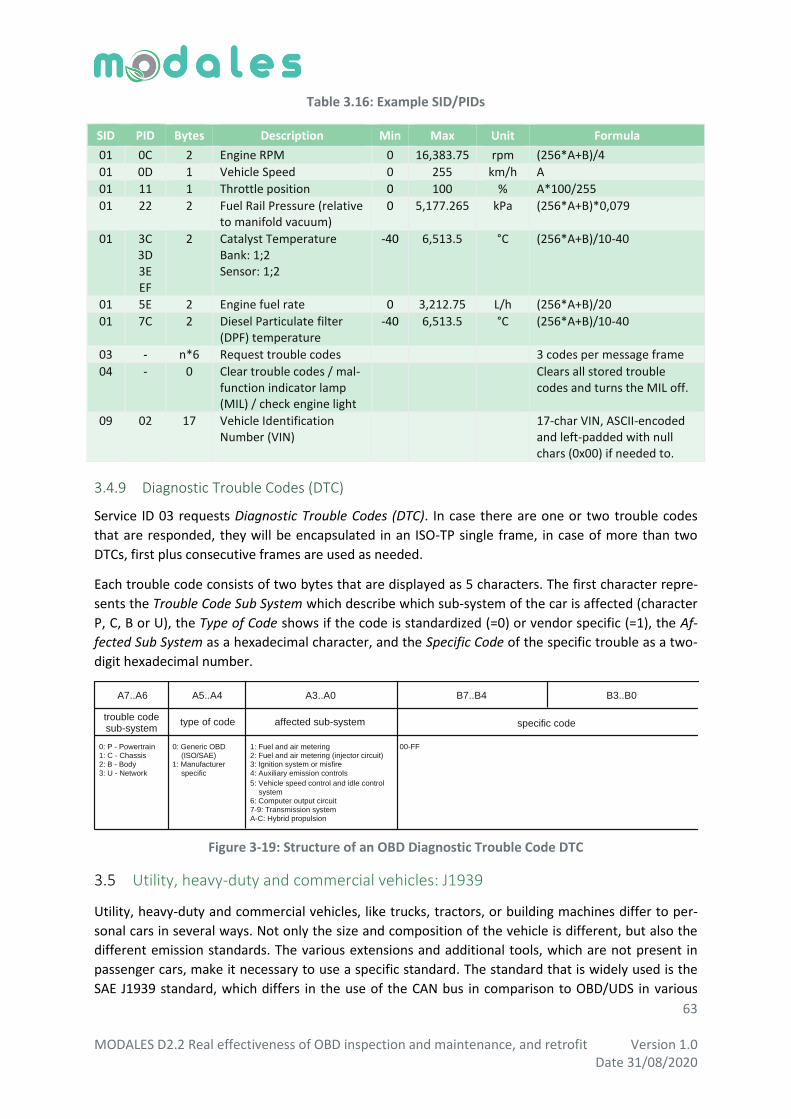
63 MODALES D2.2 Real effectiveness of OBD inspection and maintenance, and retrofit Version 1.0 Date 31/08/2020
Table 3.16: Example SID/PIDs
SID PID Bytes Description Min Max Unit Formula
01 0C 2 Engine RPM 0 16,383.75 rpm (256*A+B)/4
01 0D 1 Vehicle Speed 0 255 km/h A
01 11 1 Throttle position 0 100 % A*100/255
01 22 2 Fuel Rail Pressure (relative to manifold vacuum)
0 5,177.265 kPa (256*A+B)*0,079
01 3C 3D 3E EF
2 Catalyst Temperature Bank: 1;2 Sensor: 1;2
-40 6,513.5 °C (256*A+B)/10-40
01 5E 2 Engine fuel rate 0 3,212.75 L/h (256*A+B)/20
01 7C 2 Diesel Particulate filter (DPF) temperature
-40 6,513.5 °C (256*A+B)/10-40
03 - n*6 Request trouble codes 3 codes per message frame
04 - 0 Clear trouble codes / mal-function indicator lamp (MIL) / check engine light
Clears all stored trouble codes and turns the MIL off.
09 02 17 Vehicle Identification Number (VIN)
17-char VIN, ASCII-encoded and left-padded with null chars (0x00) if needed to.
3.4.9 Diagnostic Trouble Codes (DTC)
Service ID 03 requests Diagnostic Trouble Codes (DTC). In case there are one or two trouble codes
that are responded, they will be encapsulated in an ISO-TP single frame, in case of more than two
DTCs, first plus consecutive frames are used as needed.
Each trouble code consists of two bytes that are displayed as 5 characters. The first character repre-
sents the Trouble Code Sub System which describe which sub-system of the car is affected (character
P, C, B or U), the Type of Code shows if the code is standardized (=0) or vendor specific (=1), the Af-
fected Sub System as a hexadecimal character, and the Specific Code of the specific trouble as a two-
digit hexadecimal number.
Figure 3-19: Structure of an OBD Diagnostic Trouble Code DTC
Utility, heavy-duty and commercial vehicles: J1939 3.5
Utility, heavy-duty and commercial vehicles, like trucks, tractors, or building machines differ to per-
sonal cars in several ways. Not only the size and composition of the vehicle is different, but also the
different emission standards. The various extensions and additional tools, which are not present in
passenger cars, make it necessary to use a specific standard. The standard that is widely used is the
SAE J1939 standard, which differs in the use of the CAN bus in comparison to OBD/UDS in various
A7..A6 A5..A4
type of code affected sub-system
A3..A0 B7..B4
specific code
B3..B0
trouble codesub-system
0: P - Powertrain1: C - Chassis2: B - Body
3: U - Network
0: Generic OBD (ISO/SAE)
1: Manufacturer
specific
1: Fuel and air metering2: Fuel and air metering (injector circuit)3: Ignition system or misfire
4: Auxiliary emission controls
5: Vehicle speed control and idle control
system6: Computer output circuit7-9: Transmission system
A-C: Hybrid propulsion
00-FF
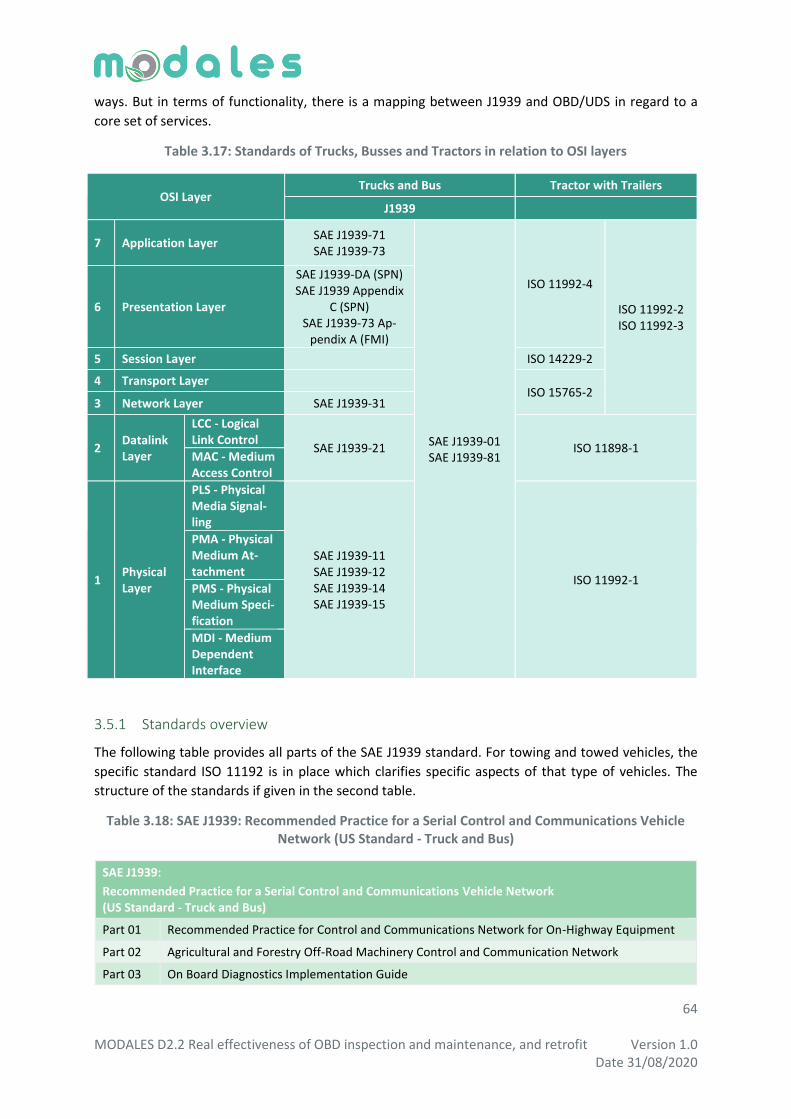
64 MODALES D2.2 Real effectiveness of OBD inspection and maintenance, and retrofit Version 1.0 Date 31/08/2020
ways. But in terms of functionality, there is a mapping between J1939 and OBD/UDS in regard to a
core set of services.
Table 3.17: Standards of Trucks, Busses and Tractors in relation to OSI layers
OSI Layer Trucks and Bus Tractor with Trailers
J1939
7 Application Layer SAE J1939-71 SAE J1939-73
SAE J1939-01 SAE J1939-81
ISO 11992-4
ISO 11992-2 ISO 11992-3
6 Presentation Layer
SAE J1939-DA (SPN) SAE J1939 Appendix
C (SPN) SAE J1939-73 Ap-
pendix A (FMI)
5 Session Layer
ISO 14229-2
4 Transport Layer ISO 15765-2
3 Network Layer SAE J1939-31
2 Datalink Layer
LCC - Logical Link Control
SAE J1939-21 ISO 11898-1 MAC - Medium Access Control
1 Physical Layer
PLS - Physical Media Signal-ling
SAE J1939-11 SAE J1939-12 SAE J1939-14 SAE J1939-15
ISO 11992-1
PMA - Physical Medium At-tachment
PMS - Physical Medium Speci-fication
MDI - Medium Dependent Interface
3.5.1 Standards overview
The following table provides all parts of the SAE J1939 standard. For towing and towed vehicles, the
specific standard ISO 11192 is in place which clarifies specific aspects of that type of vehicles. The
structure of the standards if given in the second table.
Table 3.18: SAE J1939: Recommended Practice for a Serial Control and Communications Vehicle Network (US Standard - Truck and Bus)
SAE J1939:
Recommended Practice for a Serial Control and Communications Vehicle Network (US Standard - Truck and Bus)
Part 01 Recommended Practice for Control and Communications Network for On-Highway Equipment
Part 02 Agricultural and Forestry Off-Road Machinery Control and Communication Network
Part 03 On Board Diagnostics Implementation Guide
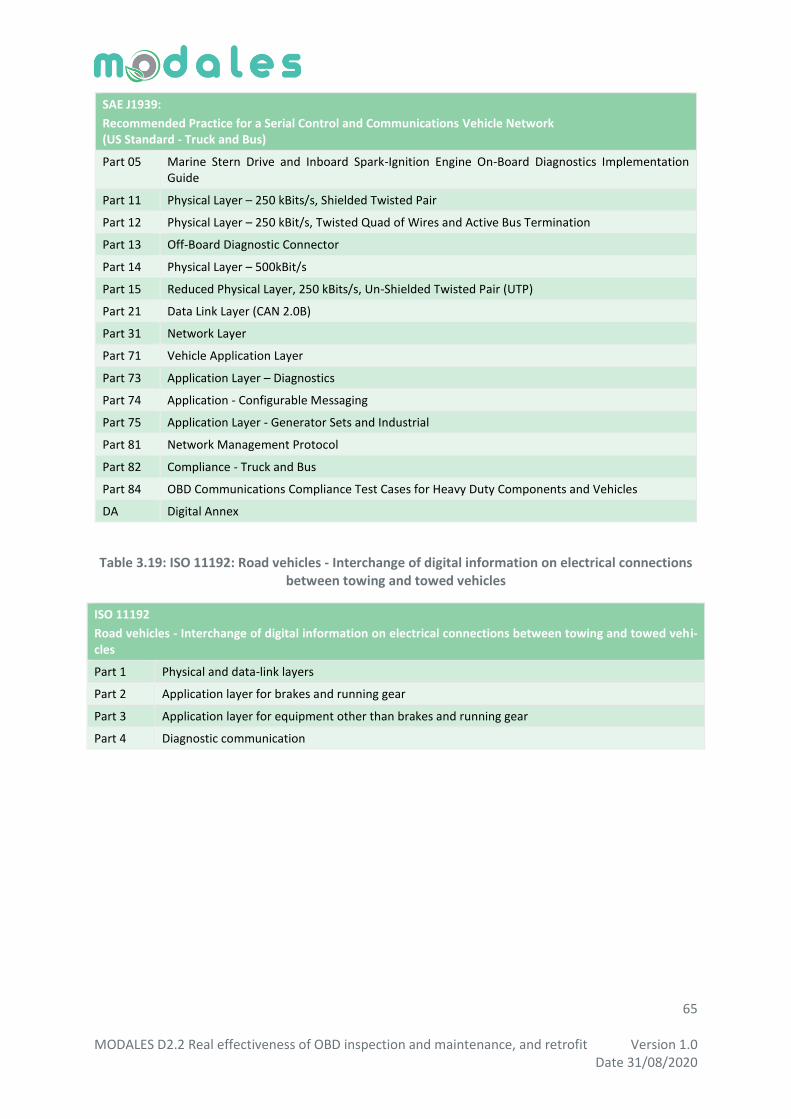
65 MODALES D2.2 Real effectiveness of OBD inspection and maintenance, and retrofit Version 1.0 Date 31/08/2020
SAE J1939:
Recommended Practice for a Serial Control and Communications Vehicle Network (US Standard - Truck and Bus)
Part 05 Marine Stern Drive and Inboard Spark-Ignition Engine On-Board Diagnostics Implementation Guide
Part 11 Physical Layer – 250 kBits/s, Shielded Twisted Pair
Part 12 Physical Layer – 250 kBit/s, Twisted Quad of Wires and Active Bus Termination
Part 13 Off-Board Diagnostic Connector
Part 14 Physical Layer – 500kBit/s
Part 15 Reduced Physical Layer, 250 kBits/s, Un-Shielded Twisted Pair (UTP)
Part 21 Data Link Layer (CAN 2.0B)
Part 31 Network Layer
Part 71 Vehicle Application Layer
Part 73 Application Layer – Diagnostics
Part 74 Application - Configurable Messaging
Part 75 Application Layer - Generator Sets and Industrial
Part 81 Network Management Protocol
Part 82 Compliance - Truck and Bus
Part 84 OBD Communications Compliance Test Cases for Heavy Duty Components and Vehicles
DA Digital Annex
Table 3.19: ISO 11192: Road vehicles - Interchange of digital information on electrical connections between towing and towed vehicles
ISO 11192
Road vehicles - Interchange of digital information on electrical connections between towing and towed vehi-cles
Part 1 Physical and data-link layers
Part 2 Application layer for brakes and running gear
Part 3 Application layer for equipment other than brakes and running gear
Part 4 Diagnostic communication

66 MODALES D2.2 Real effectiveness of OBD inspection and maintenance, and retrofit Version 1.0 Date 31/08/2020
3.5.2 J1939 messages on CAN
The J1939 message only uses a 29-bit CAN-identifier. In contrast to OBD, where the SID and PID are part of the data field, then equivalent Parameter Group Number (PGN) is part of the 29-bit identifier, which also contains the Priority P (0=high) and the Source Address SA of the message. As a conse-quence, only data that is specified by the PGN is provided in the data field. The values in the data field represent a set of Suspect Parameter Numbers (SPNs), meaning, that often multiple parameters are provided and not only one value. The size of the data field and the assignment of bits to SPNs is predefined by the PGN (Junger, 2010; Ixxat, 2020; CSS Electronic 2020b).
Figure 3-20: J1939 message on CAN
3.5.3 J1939 Identifier and Parameter Group Number (PGN)
The PNG is structured in three sections: The Data Page (DP) and the Extended Data Page (EDP) de-
cide on which standard should apply for the structure of the 29-it identifier. J1939 based identifier
are always with DP=0. The current version is given with EDP=0, while EDP=1 is reserved for future
use. EDP/DP=01 describe NMEA2000 identifiers (maritime standard) and EDP/DP=11 describe ISO
11992 diagnostics-based identifier.
Figure 3-21: Structure of the 29-bit CAN identifier in J1939
The second part of the PGN specifies the Protocol Data Unit Format (PF). The number that is given by
the PF decides on the meaning of the third section, the Protocol data unit specific (PS). In case this PF
value is below 240, the PS part represents a Destination Address (DA). This results in 240 parameter
groups which are used to target specific addresses. In case the PF value is above or equal to 240, the
PS part represents the Group Extension (GE), and so these bits are part of the parameter group. For
these 16*256=4096 parameter groups messages are broadcasted to all.
Data field
SO
F(0
)
CR
CC
RC
14
..C
RC
0
EO
F(1
11
11
11
)
R0
(0)
DLC
3
DLC
2
DLC
1
DLC
0
Arbitrationfield
Controlfield
AC
KN
(se
nd
er:
1 / r
ece
ive
r: 0
)
CR
C D
EL
(1)
AC
KN
DE
L(1
)
CRC ACKN
Sta
rt
End
SP
N1
...
SP
N2
SP
Nn
ack-now-
ledge
cyclicredundancy
check
end of frame
sta
rt o
f fr
am
e
IDE
(0)
PG
N
RT
R(d
ata
: 0
, re
qu
est: 1
)
29-bit identifier
SP
N3
suspect parameter number
PP
2..P
0
parameter
groupnumber
SA
source
address
pri
ori
ty
ID2
8
ID2
7
ID2
6
ID2
5
ID2
3
ID2
4
ID2
2
ID2
1
ID2
0
ID1
9
ID1
8
ID1
7
ID1
6
ID1
5
ID1
4
ID1
3
ID1
2
ID1
1
ID1
0
ID9
ID8
ID7
ID6
ID5
ID4
ID3
ID2
PGN parameter group number
P SA source address
ED
P
DP
ID1
ID0
PF protocol data unit format PS protocol data unit specific
DA destination address
GE group extension
< 240
≥ 240
exte
nd
ed
da
ta p
ag
e
da
ta p
ag
e
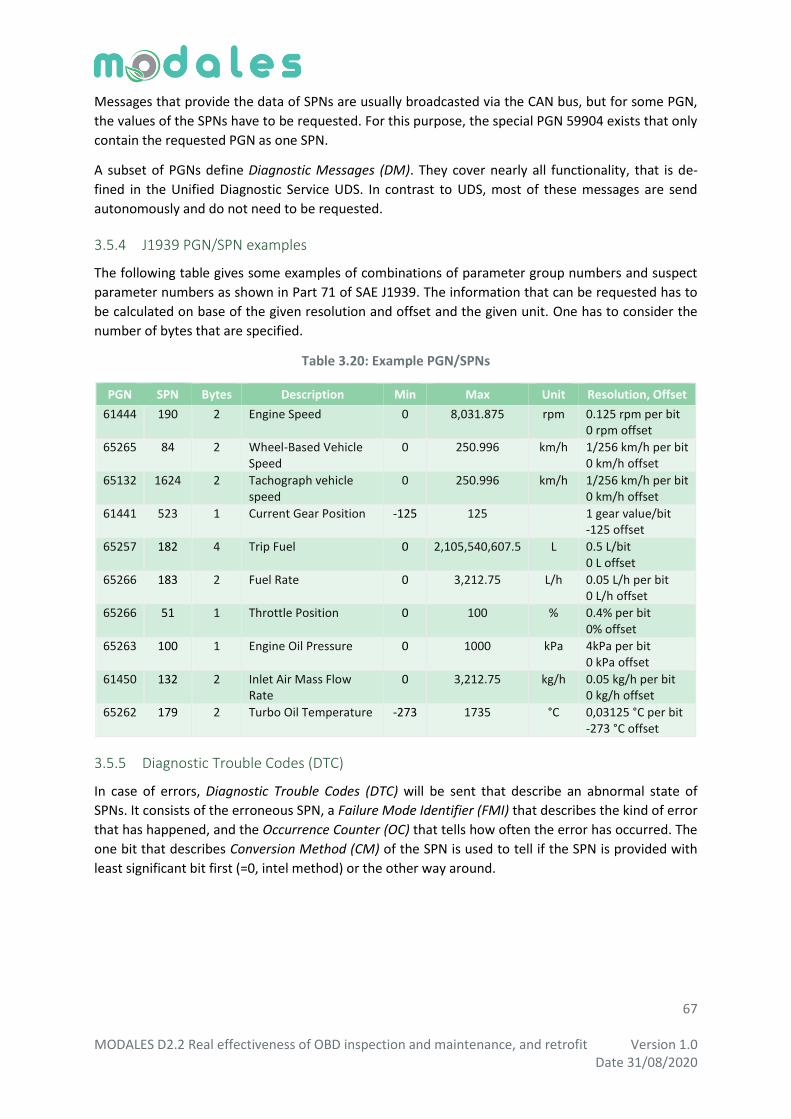
67 MODALES D2.2 Real effectiveness of OBD inspection and maintenance, and retrofit Version 1.0 Date 31/08/2020
Messages that provide the data of SPNs are usually broadcasted via the CAN bus, but for some PGN,
the values of the SPNs have to be requested. For this purpose, the special PGN 59904 exists that only
contain the requested PGN as one SPN.
A subset of PGNs define Diagnostic Messages (DM). They cover nearly all functionality, that is de-
fined in the Unified Diagnostic Service UDS. In contrast to UDS, most of these messages are send
autonomously and do not need to be requested.
3.5.4 J1939 PGN/SPN examples
The following table gives some examples of combinations of parameter group numbers and suspect
parameter numbers as shown in Part 71 of SAE J1939. The information that can be requested has to
be calculated on base of the given resolution and offset and the given unit. One has to consider the
number of bytes that are specified.
Table 3.20: Example PGN/SPNs
PGN SPN Bytes Description Min Max Unit Resolution, Offset
61444 190 2 Engine Speed 0 8,031.875 rpm 0.125 rpm per bit 0 rpm offset
65265 84 2 Wheel-Based Vehicle Speed
0 250.996 km/h 1/256 km/h per bit 0 km/h offset
65132 1624 2 Tachograph vehicle speed
0 250.996 km/h 1/256 km/h per bit 0 km/h offset
61441 523 1 Current Gear Position -125 125 1 gear value/bit -125 offset
65257 182 4 Trip Fuel 0 2,105,540,607.5 L 0.5 L/bit 0 L offset
65266 183 2 Fuel Rate 0 3,212.75 L/h 0.05 L/h per bit 0 L/h offset
65266 51 1 Throttle Position 0 100 % 0.4% per bit 0% offset
65263 100 1 Engine Oil Pressure 0 1000 kPa 4kPa per bit 0 kPa offset
61450 132 2 Inlet Air Mass Flow Rate
0 3,212.75 kg/h 0.05 kg/h per bit 0 kg/h offset
65262 179 2 Turbo Oil Temperature -273 1735 °C 0,03125 °C per bit -273 °C offset
3.5.5 Diagnostic Trouble Codes (DTC)
In case of errors, Diagnostic Trouble Codes (DTC) will be sent that describe an abnormal state of
SPNs. It consists of the erroneous SPN, a Failure Mode Identifier (FMI) that describes the kind of error
that has happened, and the Occurrence Counter (OC) that tells how often the error has occurred. The
one bit that describes Conversion Method (CM) of the SPN is used to tell if the SPN is provided with
least significant bit first (=0, intel method) or the other way around.

68 MODALES D2.2 Real effectiveness of OBD inspection and maintenance, and retrofit Version 1.0 Date 31/08/2020
Figure 3-22: Diagnostic Trouble Code structure inside the CAN data frame
co
nve
rsio
n
me
tho
d
suspect parameter numberfailure mode
identifier
19
bit
5
bit
1
bit
7
bit
occurrence count
CMSPN FMI OC
Byte 1 Byte 3 Byte 4Byte 2

69 MODALES D2.2 Real effectiveness of OBD inspection and maintenance, and retrofit Version 1.0 Date 31/08/2020
4 Performance of OBD in detecting malfunctions Vehicles that are poorly maintained or malfunctioning are important contributors to air pollution.
The goal of an inspection and maintenance (I/M) program is to ensure that vehicles remain safe, in
good working order throughout their lifetime, and do not produce excess pollution (Posada et.al.,
2015). At the core of an I/M program is the requirement that vehicle owners regularly submit their
vehicles for a standardized inspection (Shambliss et.al., 2016). If the vehicle fails inspection, it needs
to be repaired and re-inspected before it returns to normal operation.
Recently manufactured vehicles are equipped with an OBD II. OBD II monitors all engine and drive
train sensors and actuators for shorts, open circuits, lazy sensors and out of range values as well as
values that do not logically fit with other power train data. Thus, OBD II keeps track of all of the com-
ponents responsible for emissions and when one of them malfunctions, it signals the vehicle owner
by illuminating a Maintenance Indicator Lamp (MIL), Such as a check engine indicator. It also stores
Diagnostic Trouble Codes (DTCs) designed to help a technician find and repair the emission related
problem (Webster et al., 2007). OBD II also specifies the means for communicating diagnostic infor-
mation to equipment used in diagnosing, repairing and testing the vehicle.
International experience with integrating OBD into I/M procedures to detect malfunctions comes
mainly from the United States. The U.S. Environmental Protection Agency (EPA) sets guidelines for
states to follow in designing and running I/M programs as per the 1990 amendment to the Clean Air
Act. These guidelines mandate that OBD checks be integrated into any state’s I/M program for light-
duty vehicles and specify a seven-step check procedure that should be followed (U.S.EPA, 2001).
Because OBD system requirements for heavy-duty vehicles were not specified at the time of the
amendment, OBD checks were not mandatory for heavy-duty I/M programs in the United States.
However, states have requested additional guidance for heavy-duty OBD checks, and EPA has
acknowledged the possibility that there may be guidelines proposed in the future for heavy-duty
OBD in I/M programs (U.S.EPA, 2005). South Korea has designed its light-duty OBD system require-
ments to include anti-tampering features so that I/M programs can rely on OBD checks (Posada &
German, 2016). Few other countries with mature I/M programs have fully integrated OBD checks;
among the members of the European Union, only the Netherlands includes OBD checks, and the I/M
program guidelines in Japan do not specifically include OBD checks.
EPA does not recommend that vehicles older than 1994 be subjected to OBD based I/M testing, even
if it is determined that the vehicle is equipped with an OBD computer, “On-board diagnostic test
procedures” requires that the scan tool used for the OBD-I/M inspection be capable of communi-
cating with the OBD system in compliance with the Society of Automotive Engineers (SAE) Recom-
mended Practice J1979. While it is possible to perform the electronic scan portion of the OBD-I/M
check in the KOEO position for most vehicles, EPA discourages this practice because it can lead to
false failures for some makes and models of vehicles (such as 1996-2001 Subarus) and may even
have a malfunction indicator light (MIL) illuminated (U.S.EPA, 2001) [7]. The reason for not perform-
ing an OBD-I/M scan on pre-1994 OBD-equipped vehicles is because such vehicles use an earlier,
non-standardized generation of OBD system (also known as OBD I). Due to the lack of federal stand-
ards for OBD I systems, the systems themselves tend to be proprietary and may not be compatible
with the standardized OBD II scanners that will be used in most I/M programs.
Today, the available diagnostic information through OBD has considerably been improved, as its in-
troduction dates back to the early 1980s. The modern OBD systems have become more sophisticated
70 MODALES D2.2 Real effectiveness of OBD inspection and maintenance, and retrofit Version 1.0 Date 31/08/2020
and now adopt a standardized digital communications port to provide real time data in addition to a
standardized series of diagnostic trouble codes, (DTCs), which allow one to quickly identify and repair
malfunctions within the vehicle, as it provides almost complete control and also monitors parts of
chassis, body and accessory devices as well as the diagnostic control network of the vehicle
(Medashe et.al., 2020).
In OBD I/M/ inspection Process the inspector connects the inspection workstation to the vehicle's on-
board computer, and then downloads engine and emissions control data (MODULE4). The work-
station checks several OBD system functions:
Communication. Does the vehicle’s OBD system communicate with the workstation? If the ve-
hicle’s OBD system cannot communicate with the station’s workstation, the OBD system must
be repaired before the emissions test can proceed.
Readiness. Is the vehicle’s OBD system Ready to be tested? As the vehicle drives, the OBD sys-
tem checks the performance of various emissions-related components and systems. If the OBD
system has not performed enough of these self-checks, the vehicle is Not Ready for an emis-
sions test.
Diagnostic Trouble Codes (DTCs). If the OBD system has detected an emissions-related prob-
lem, it will turn on the Check Engine light and store one or more DTCs that indicate which sys-
tems or components are not performing as designed. Reviewing these codes is the first step in
diagnosing an emissions-related problem. These codes, along with other information in the
OBD system, can guide emissions repair technicians to a proper diagnosis.
Today due to the importance of I/M programs for air pollution, many researches have been per-
formed on this area providing variable patents and methods to improve inspection. Thomas Webster
et al. (2007) developed an invention which includes a vehicle device that monitors the status of the
I/M readiness monitors to determine if the vehicle is “Ready” for an emissions test. The device will
indicate to a driver that the vehicle is ready for emissions testing by alerting the user via, for exam-
ple, audio and/or visual signals or other alert indicators. Checking the readiness state of the diagnos-
tic monitors allows a driver to save time by not having to return the vehicle for testing only to find
out that the vehicle is still not ready for emissions testing. (Jhou & Chen, 2014), proposed a system
which is integrated with OBD-II, 3.5 G wireless network, and cloud computing technologies. It can
perform real time vehicle status surveillance. The monitored features cover engine rpm, vehicle
speed, coolant temperature, fault codes, and other vehicle dynamics information. The vehicle infor-
mation will be transmitted to the cloud computing server via 3.5 G wireless network for fault analy-
sis. Once cloud computing server detects fault conditions, the proposed system could classify the
fault conditions depended on vehicle type and its model year. Then the cloud computing server will
report the fault code analysis results to the user and provide the description about repair procedure.
The proposed system will greatly shorten the time to detect vehicle trouble condition.
To conclude, OBD checks could be substituted for emissions testing requirements in alternating
years, or for several consecutive years. During early stages of implementation, inspections including
emissions testing should concurrently collect OBD data to ensure that results agree, and vehicles
failing emissions tests would not pass inspection based on OBD alone. OBD check procedures should
include measures to prevent fraudulent practices, including connecting the scanning tool directly to
the vehicle and computer so the inspector cannot modify data during the inspection and ensuring
that the vehicle identification number is reported in the OBD data so that it can be matched to the
vehicle being inspected. Vehicles should also be required to display the readiness indicator during
71 MODALES D2.2 Real effectiveness of OBD inspection and maintenance, and retrofit Version 1.0 Date 31/08/2020
testing to ensure that any error codes have not been recently cleared. Once OBD checks have been
demonstrated to be effective, they can be increasingly substituted for emissions testing.
From all the above, it is observed that as part of environmental policies, numerous states require
that vehicles undergo periodic emission testing to ensure that vehicles registered in US states comply
with mandated emission requirements, which emission testing may be performed utilizing a vehicles
OBD system. Vehicles that do not meet the requirements may not qualify for registration until re-
pairs are made and may be subject to fines. However, vehicles may be improperly tampered with to
circumvent such detection. For example, vehicle owners or service companies may alter vehicles in
efforts to increase the performance of the vehicles, such as removing catalytic converters or the
catalysts from the converter, which alterations negatively impact the vehicles emissions. As part of
such modifications, the vehicle may be altered or tampered with to prevent detection of such modi-
fications, such as by changes to the engine computer and/or OBD System sensors.
Tampering with, or illegally modifying, emission control devices can substantially distort a fleet’s
impact as only a few high emitting vehicles with improperly working/removed emission control de-
vices can be held responsible for disproportionally high contributions to poor local air quality [11].
Whereas tampering with diesel particulate filters is mostly applied on light-duty vehicles, deactivat-
ing de-NOx systems like selective catalytic reduction (SCR) systems generally occurs in the heavy-duty
sector. Nonetheless, as SCR technology is deemed to become the reference in light-duty diesel vehi-
cles, it’s only a matter of time before consumers try to bypass such systems. The impact of these
measures is unambiguous, as a removed particle filter increased particle emissions number by a fac-
tor thousand, while heavy-duty de-NOx bypassing increases NOx emissions by a factor 4 to 20 for
Euro VI technology (Hooftman, 2019).
Motives for tampering are diverse. Firstly, there’s the perceived monetary gain of saving AdBlue®
expenses and the avoided maintenance. Secondly, there’s the emission test during periodic technical
inspection, which often is incapable of detecting tampering. Lastly, there’s the perceived lack of en-
forcement against it.
Some defeat devices and tampering examples are listed below (Avedo & Yarbrough, 2019):
Alterations to Fuelling, Timing Strategy
DPF Delete
EGR Delete
SCR Delete
Alterations to OBD
Software and Hardware
One important means to monitor the performance of emission control devices with which every
light- and heavy-duty vehicle in both regions and the EU is equipped, is the onboard diagnostics sys-
tem (OBD). This technology is designed to perform a diagnostic monitoring of components that are
part of a vehicle’s emission control system and to detect situations that could lead to high emissions.
Thus, it serves as an interface between the vehicle and its driver to report issues and urge repair,
while at the same time it allows the repairer to diagnose engine and after-treatment related prob-
lems. Moreover, OBD serves as a key indicator for a vehicle’s maintenance level during PTI and
throughout the vehicle’s lifetime. Besides the lack of monitoring requirements, the Europe OBD sys-
tem is not robust enough when it comes to tampering. Crucial threats to the current system are that
data trouble codes (DTC) can be cleared using low-cost communication tools, while new software can
72 MODALES D2.2 Real effectiveness of OBD inspection and maintenance, and retrofit Version 1.0 Date 31/08/2020
be loaded into the engine control unit (ECU) to increase power and to disable EATS functionalities to
alter the system in such a way that it avoids DTCs. Several measures are taken to prevent such prac-
tices, including permanent DTCs, readiness codes, and the combination of calibration ID and calibra-
tion verification numbers. DTCs are generated when a malfunction occurs in one of the systems that
are monitored by OBD. In this case, the driver will be warned when something is wrong via a dash-
board malfunction indication. Both the California OBD II and Korea OBD have clear requirements for
storing DTCs permanently, offering a better protection against clearances and thus providing a much
better technical support for PTI purposes based on OBD. The Europe OBD system, however, lacks this
fundamental possibility. One way to work around this flaw in current Europe OBD legislation is by
remote exchange of emission data and/or DTCs or monitoring them onboard.
Complementary to the permanent DTCs, readiness bits indicate the status of the ten most important
monitored systems. These bits will indicate when a certain monitor has not yet finished a complete
diagnostics cycle which can result in a failed PTI in California, in case a permanent DTC indicates an
underlying problem. If no such DTC was stored, the incomplete cycle might refer to a recent repair
during which the battery was disconnected. This back-up is not available in case for Europe OBD,
although it would not make sense for vehicle owners to erase the readiness bits as this could also
lead to a failed PTI (depending on if Europe OBD is applied complementarily to the emission test).
Instead, the vehicle owner could simply have all non-permanently stored DTC erased.
A last measure that the California OBDII and Korea OBD have against tampering is to download the
running calibration ID (CAL ID) number from the inspected vehicle and to compare this to a national
database containing the possible combinations with the calibration verification number (CVN). This
allows for the detection of non-original ECU software and thus tampering if it does not come with an
approval certificate issued by an accredited lab. This approach, however, requires all vehicle manu-
facturers to provide the regulators with every available CAL ID/CVN combination, for them to keep
the database continuously up to date. One pitfall of this approach is that the correct CAL ID can be
re-flashed into the ECU solely to pass PTI, to be reset afterwards. Also here, opportunities arise for
remote transmission of a vehicle’s CAL ID. The European OBD program requires CAL IDs to be made
available via the Europe OBD data link connector but does not mention any requirements on CVN.
Today, many researches have been performed on this area providing variable patents and methods
against tampering. The authors of (Geilen et al., 2014), developed a vehicle testing system which is
directed to vehicle testing, and in particular to a method and apparatus for detecting whether an on-
board diagnosis system of a vehicle has been improperly tampered with or altered. The present in-
vention provides a method and system for detecting whether a vehicle has been improperly tam-
pered with to prevent detecting that the vehicle does not comply with vehicle regulations by detect-
ing improper modification of a vehicle via the vehicles on-board diagnosis system.
As it is observed, the issue of vehicle tampering is of outmost importance and only through strong
legislation, issued through European Regulations, and the implementation of effective enforcement
against tampering, will consumers and companies no longer be tempted to illegally modify their ve-
hicles. Tampering is being addressed in Tasks 2.5 and 3.4 of this project and will be reported in D2.3
and D3.1.
73 MODALES D2.2 Real effectiveness of OBD inspection and maintenance, and retrofit Version 1.0 Date 31/08/2020
5 Potential impact of retrofits
Analyse existing field data from retrofitted buses and trucks, real world emission 5.1
reduction potential
5.1.1 Objective of the work
The goal of this work is to research how different factors, environmental or mechanical, affect the
function of their retrofitted emission after-treatment system. The purpose of the retrofit system is to
reduce the emissions in exhaust gases and upgrade a vehicle to achieve the latest emission stand-
ards. The European emission standards are studied and opened for gaining a more accurate picture
of the objective for a correctly working EAT (exhaust after-treatment) system.
The studied data has been collected from vehicles which have been retrofitted with Proventia’s EAT
system consisting of DPF and SCR. In the EAT system exhaust gases flow through DOC, DPF and SCR
and achieved emission values will be collected from variable vehicle sensors. The used data in this
thesis has been collected by a NOx emissions monitoring system called PROCARE Drive. The system
collects live data from the vehicles with the retrofitted EAT system and uploads the information
online.
The aim was on finding factors in different vehicle categories which cause EAT system to work ineffi-
ciently. Because of the large amount of collected data and the fact that the information has not been
categorised in any clear order, emission readings had to be tabulated for more precise analysis. To
find connections between actual emission readings and mechanical or environmental factors multi-
ple vehicle characteristics had to be sorted out too. It was expected that studying the data would
reveal some phenomena that affect the EAT system operation negatively.
5.1.2 Test Procedures
Low emission adaptations must be tested to meet the technical performance requirements. Buses
must be tested at kerb weight plus driver weight and one quarter of the specified total passenger
load using a weight of 68 kg per passenger, or half of the specified seated passenger load using a
weight of 68 kg per passenger, whichever is judged by the technical service to be the worst case for
effective performance of the retrofit system. (CVRC, 2019)
Buses operating in the UK must be tested according to the LowCVP UK Bus (LUB Revised) cycle, which
is shown in Figure 5-1. To warm the vehicle up prior to testing, only the Outer-London phase shall be
used. (CVRC, 2019)
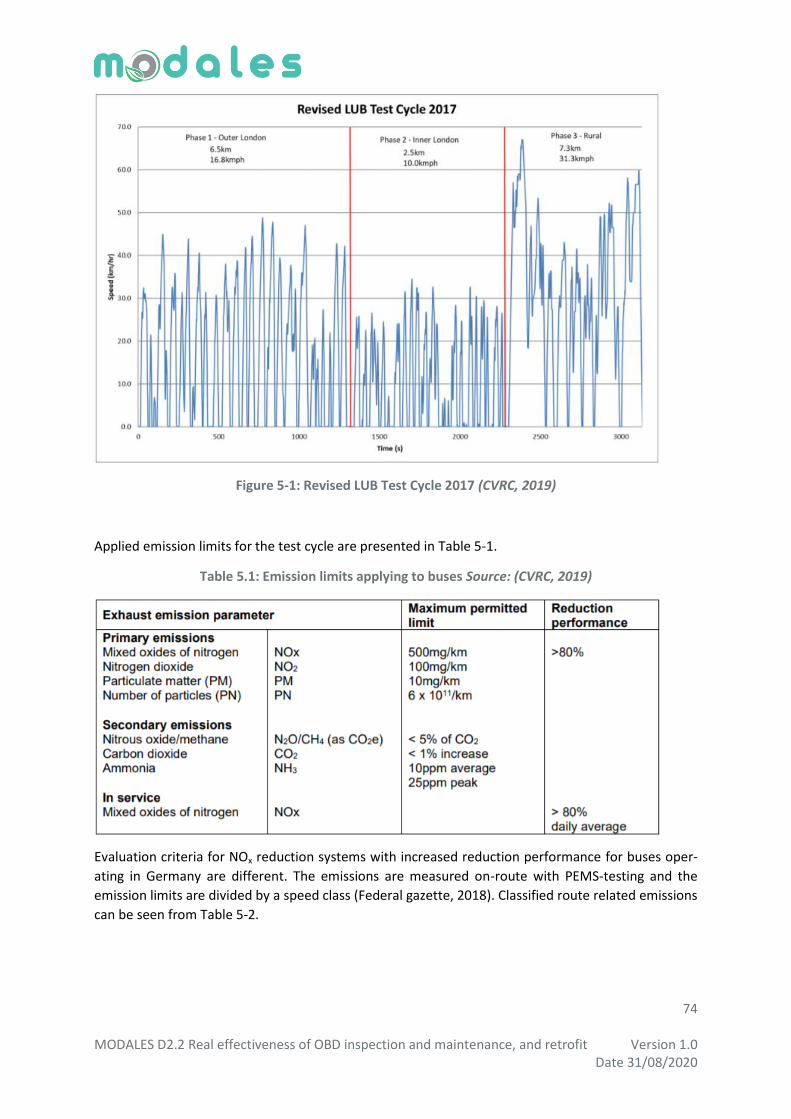
74 MODALES D2.2 Real effectiveness of OBD inspection and maintenance, and retrofit Version 1.0 Date 31/08/2020
Figure 5-1: Revised LUB Test Cycle 2017 (CVRC, 2019)
Applied emission limits for the test cycle are presented in Table 5-1.
Table 5.1: Emission limits applying to buses Source: (CVRC, 2019)
Evaluation criteria for NOx reduction systems with increased reduction performance for buses oper-
ating in Germany are different. The emissions are measured on-route with PEMS-testing and the
emission limits are divided by a speed class (Federal gazette, 2018). Classified route related emissions
can be seen from Table 5-2.

75 MODALES D2.2 Real effectiveness of OBD inspection and maintenance, and retrofit Version 1.0 Date 31/08/2020
Table 5.2: Classified route-related emissions
Speed class (km/h) Speed range (km/h) Limit (g/km)
10 7.5 - 1.,5 7.5
15 > 12.5 - 17.5 5
20 > 17.5 - 22.5 4
25 > 22.5 - 27.5 3
30 > 27.5 - 32.5 2.5
In addition to the route-related emissions, The NOx reduction efficiency must be >85% and the EAT
system must include ammonia slip catalyst with minimum volume of 800ml per 100kW engine power
(Federal gazette, 2018).
5.1.3 Emission Monitoring & Data Collection
Emission monitoring in Proventia’s EAT system has been implemented by using telematics. Telemat-
ics is a general term that refers to any device combining telecommunications and informatics. It in-
cludes controller, PROCARE Drive-unit which is connected to vehicle’s CAN bus. The controller unit is
equipped with GSM and GPS antennas to enable the place routing. Real time information about the
back pressure, exhaust gas temperature, NOx levels, AdBlue level and temperature and dosing rate is
transmitted to the web service, where operators can monitor their fleet’s emission readings.
(Proventia, Procare Drive.)
To collect the needed information, variable sensors such as temperature, backpressure, NOx and
mass air flow sensors must be installed. Exhaust temperature is measured from the inlet side of the
SCR. Exhaust gas pressure information is collected and transmitted to PROCARE Drive by using CAN
bus pressure sensor which is connected to the pipe before DOC with flexible metal tube. In order to
find out the NOx reduction, two NOx sensors must be installed. First one is connected to the inlet side
of DOC to measure the NOx in exhaust gases before the EAT system and the second measures NOx
amount after the EAT system from outlet pipe of the SCR. MAF information is received from CAN or
from sensor. MAF (Mass Air Flow) sensor is installed to the pipe between air filter and turbocharger.
Operating principle of Proventia’s NOxBUSTER EAT system is described in Figure 5-2.
5.1.4 Data processing & research methods
The work was started by thinking of measures that could be needed in analysing the achieved emis-
sion readings. After the planning was done, daily reports were exported from Procare drive. The ex-
ported files included daily values for about 2000 vehicles from start of 2019 to end of October 2019.
Before the actual analysis could be started, the received data needed to be processed to a readable
form because all the exported files were in Excel Comma Separated Value (CSV) format. The main
tool in processing the data was Excel’s Power Query add-in. Power Query allowed to combine all the
received data files in one and to format the data in clear order. Each row in the data shows daily av-
erages for certain fleet numbers. Among other things the data included values for the NOx in and out
in ppm and mg/s, reduction efficiency, MAF, SCR inlet temperature and urea dosing amount.
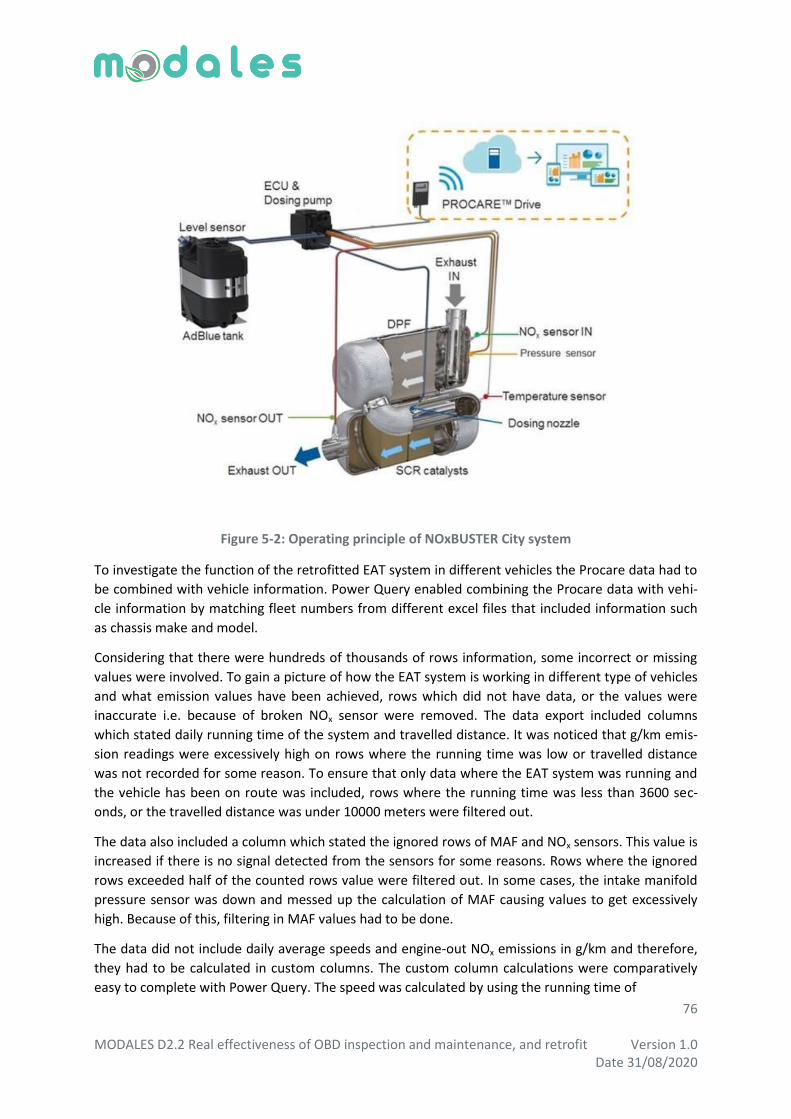
76 MODALES D2.2 Real effectiveness of OBD inspection and maintenance, and retrofit Version 1.0 Date 31/08/2020
Figure 5-2: Operating principle of NOxBUSTER City system
To investigate the function of the retrofitted EAT system in different vehicles the Procare data had to
be combined with vehicle information. Power Query enabled combining the Procare data with vehi-
cle information by matching fleet numbers from different excel files that included information such
as chassis make and model.
Considering that there were hundreds of thousands of rows information, some incorrect or missing
values were involved. To gain a picture of how the EAT system is working in different type of vehicles
and what emission values have been achieved, rows which did not have data, or the values were
inaccurate i.e. because of broken NOx sensor were removed. The data export included columns
which stated daily running time of the system and travelled distance. It was noticed that g/km emis-
sion readings were excessively high on rows where the running time was low or travelled distance
was not recorded for some reason. To ensure that only data where the EAT system was running and
the vehicle has been on route was included, rows where the running time was less than 3600 sec-
onds, or the travelled distance was under 10000 meters were filtered out.
The data also included a column which stated the ignored rows of MAF and NOx sensors. This value is
increased if there is no signal detected from the sensors for some reasons. Rows where the ignored
rows exceeded half of the counted rows value were filtered out. In some cases, the intake manifold
pressure sensor was down and messed up the calculation of MAF causing values to get excessively
high. Because of this, filtering in MAF values had to be done.
The data did not include daily average speeds and engine-out NOx emissions in g/km and therefore,
they had to be calculated in custom columns. The custom column calculations were comparatively
easy to complete with Power Query. The speed was calculated by using the running time of
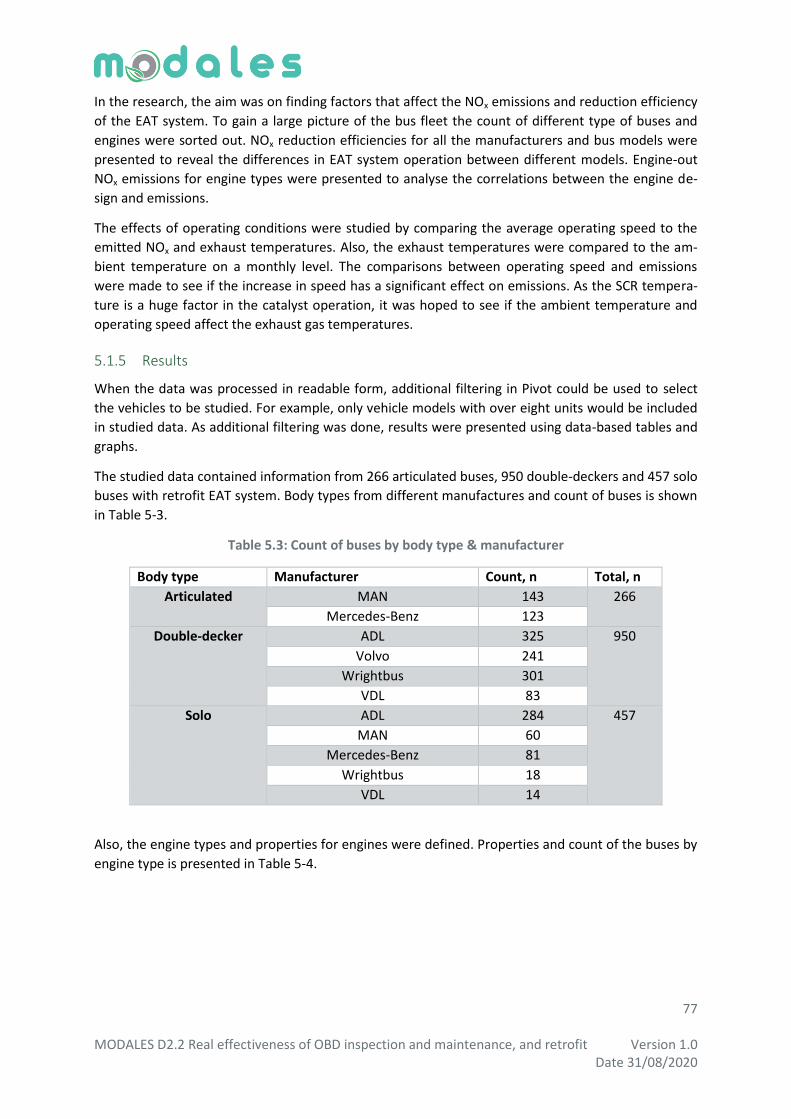
77 MODALES D2.2 Real effectiveness of OBD inspection and maintenance, and retrofit Version 1.0 Date 31/08/2020
In the research, the aim was on finding factors that affect the NOx emissions and reduction efficiency
of the EAT system. To gain a large picture of the bus fleet the count of different type of buses and
engines were sorted out. NOx reduction efficiencies for all the manufacturers and bus models were
presented to reveal the differences in EAT system operation between different models. Engine-out
NOx emissions for engine types were presented to analyse the correlations between the engine de-
sign and emissions.
The effects of operating conditions were studied by comparing the average operating speed to the
emitted NOx and exhaust temperatures. Also, the exhaust temperatures were compared to the am-
bient temperature on a monthly level. The comparisons between operating speed and emissions
were made to see if the increase in speed has a significant effect on emissions. As the SCR tempera-
ture is a huge factor in the catalyst operation, it was hoped to see if the ambient temperature and
operating speed affect the exhaust gas temperatures.
5.1.5 Results
When the data was processed in readable form, additional filtering in Pivot could be used to select
the vehicles to be studied. For example, only vehicle models with over eight units would be included
in studied data. As additional filtering was done, results were presented using data-based tables and
graphs.
The studied data contained information from 266 articulated buses, 950 double-deckers and 457 solo
buses with retrofit EAT system. Body types from different manufactures and count of buses is shown
in Table 5-3.
Table 5.3: Count of buses by body type & manufacturer
Body type Manufacturer Count, n Total, n
Articulated MAN 143 266
Mercedes-Benz 123
Double-decker ADL 325 950
Volvo 241
Wrightbus 301
VDL 83
Solo ADL 284 457
MAN 60
Mercedes-Benz 81
Wrightbus 18
VDL 14
Also, the engine types and properties for engines were defined. Properties and count of the buses by
engine type is presented in Table 5-4.

78 MODALES D2.2 Real effectiveness of OBD inspection and maintenance, and retrofit Version 1.0 Date 31/08/2020
Table 5.4: Properties & population for engine types
Engine Euro class Count, n Original EAT EGR
Cummins ISBe 4,5 IV 90 SCR -
V 184 SCR -
Cummins ISBe 6,7 IV 21 SCR -
V 308 SCR -
OM906 hLA V/EEV 31 SCR / SCR + DPF -
OM457 hLA V/EEV 162 SCR / SCR + DPF -
Volvo D9 IV 3 SCR -
V 184 SCR -
Volvo D5E/D5F V 54 SCR -
D2066 LUH IV 52 PM-Kat X
V/EEV 123 CRT X
D2866 LUH III 8 EGR X
IV 3 PM-Kat X
To see a wider picture about function of the EAT system, first it would be wise to compare the effi-
ciency between different manufacturers and models. As seen in Figure 5-3, clearly, the best efficien-
cy is achieved within MAN and Mercedes-Benz.
Figure 5-3: Vehicle count and average NOx reduction efficiency by manufacturer
The filtering within models to show vehicles with eight units or more was chosen to include both
Wrightbus Streetlite models. Efficiencies between different models are shown in Figure 5-4.
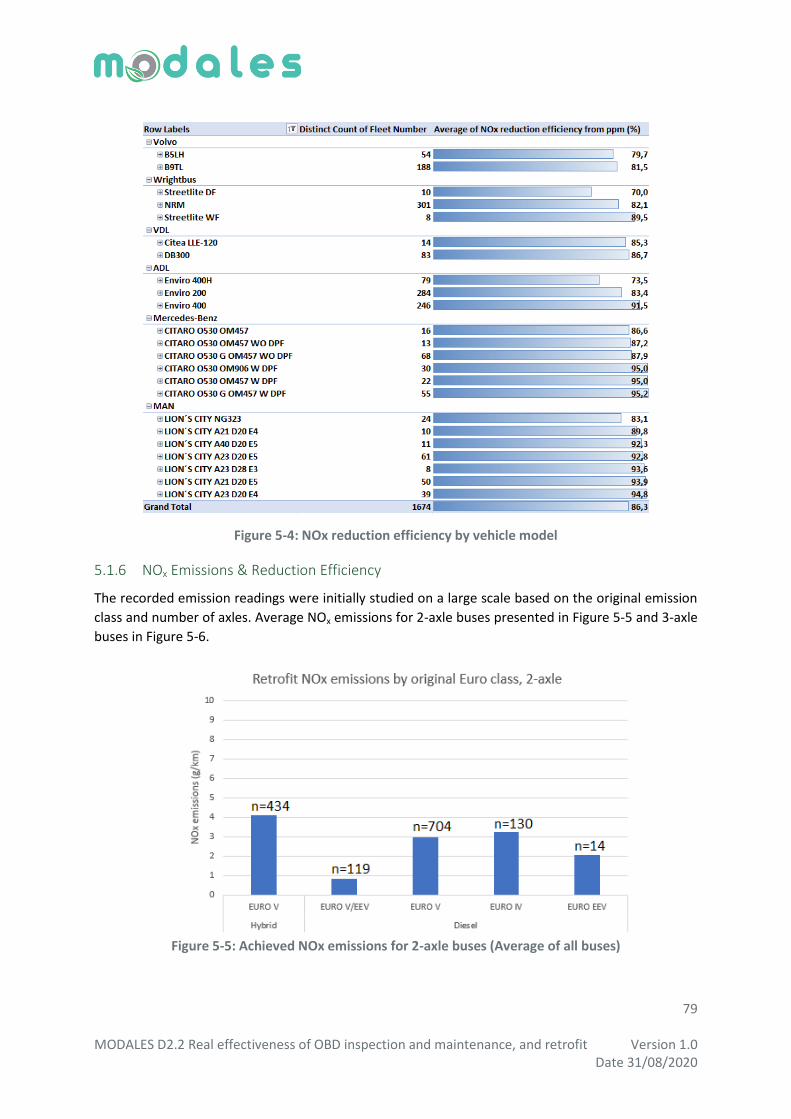
79 MODALES D2.2 Real effectiveness of OBD inspection and maintenance, and retrofit Version 1.0 Date 31/08/2020
Figure 5-4: NOx reduction efficiency by vehicle model
5.1.6 NOx Emissions & Reduction Efficiency
The recorded emission readings were initially studied on a large scale based on the original emission
class and number of axles. Average NOx emissions for 2-axle buses presented in Figure 5-5 and 3-axle
buses in Figure 5-6.
Figure 5-5: Achieved NOx emissions for 2-axle buses (Average of all buses)

80 MODALES D2.2 Real effectiveness of OBD inspection and maintenance, and retrofit Version 1.0 Date 31/08/2020
Figure 5-6: Achieved NOx emissions for 3-axle buses (Average of all buses)
Emissions for vehicles divided by body type are seen on Figure 5-7.
Figure 5-7: Achieved NOx emissions by body type
The average NOx reduction efficiencies during the period from January to October were compared
between the models with the best and the worst reduction efficiency. Figure 5-8, where n=count of
included vehicles, reveals that the EAT in MAN and Mercedes buses functions in great efficiency
about 95% while the bottom end is working with little over 80% efficiency. Figure also shows that the
vehicles with worst efficiency are equipped with Cummins and Volvo engines, therefore closer in-
spection of engines’ NOx emissions and design is needed.

81 MODALES D2.2 Real effectiveness of OBD inspection and maintenance, and retrofit Version 1.0 Date 31/08/2020
Figure 5-8: Top and bottom models in NOx reduction efficiency
As engine emissions were compared, Volvo and Cummins engines generated notably higher NOx
emissions in combustion process than the rest. Raw engine-out emissions by different engine types
and count of buses are presented in Figure 5-9 below.
Figure 5-9: NOx emissions before EAT (engine out NOx)
Figure 5-10 represents the NOx emissions within the vehicle models with the best and the worst re-
duction efficiencies on a four-month period from July to September. Orange beams indicate the raw
engine-out NOx emissions, grey beams show the tailpipe emissions after the EAT system and the blue
line is reduction efficiency.

82 MODALES D2.2 Real effectiveness of OBD inspection and maintenance, and retrofit Version 1.0 Date 31/08/2020
Figure 5-10: NOx emissions before and after EAT
Figure 5-10 shows that three out of five bottom models are hybrids, and there is significant differ-
ence in NOx emissions between Enviro 400H and NRM, although both models use series hybrid tech-
nology and the same Cummins’ engine.
To see a picture of emissions during driving, comparison of emissions over the travelled distance was
done. NOx emissions in grams per kilometre for the same vehicle models are shown in the Figure 5-
11. Buses with Cummins, Volvo and Mercedes engines have been originally equipped with SCR cata-
lyst.
The graph 5-11 shows average NOx emissions in g/km before and after the EAT for different vehicles.
Green arrow on the right side of the picture represents the estimated scale of achieved emissions
with the original SCR, in this case for buses with Cummins, Volvo and Mercedes engines. The estima-
tion is based on research results, where various Euro III, IV, V and EEV buses were tested on Braun-
schweig, Helsinki2 and Helsinki3 test cycles (VTT Research Notes, 2007 & City bus performance eval-
uation, 2019). The researches were conducted by VTT Technical Research Centre of Finland, which is
a state owned and controlled non-profit limited liability company.
Comparing the emissions over the travelled distance reveals that the reduced amount of NOx is near-
ly same between some models even the reduction efficiency and the emissions from tailpipe vary a
lot. Figure 5-12 shows the average amount of reduced NOx emissions in distance of one kilometre for
these bus models.
By looking at the reduced grams of NOx per kilometre, it can be noted that the amounts between
buses with best and worst NOx reduction efficiencies are quite similar. For example, Citaro O530 G
and B9TL have both reached average reduction of slightly over 18 g/km even the reduction efficiency
in Citaro is notably higher.
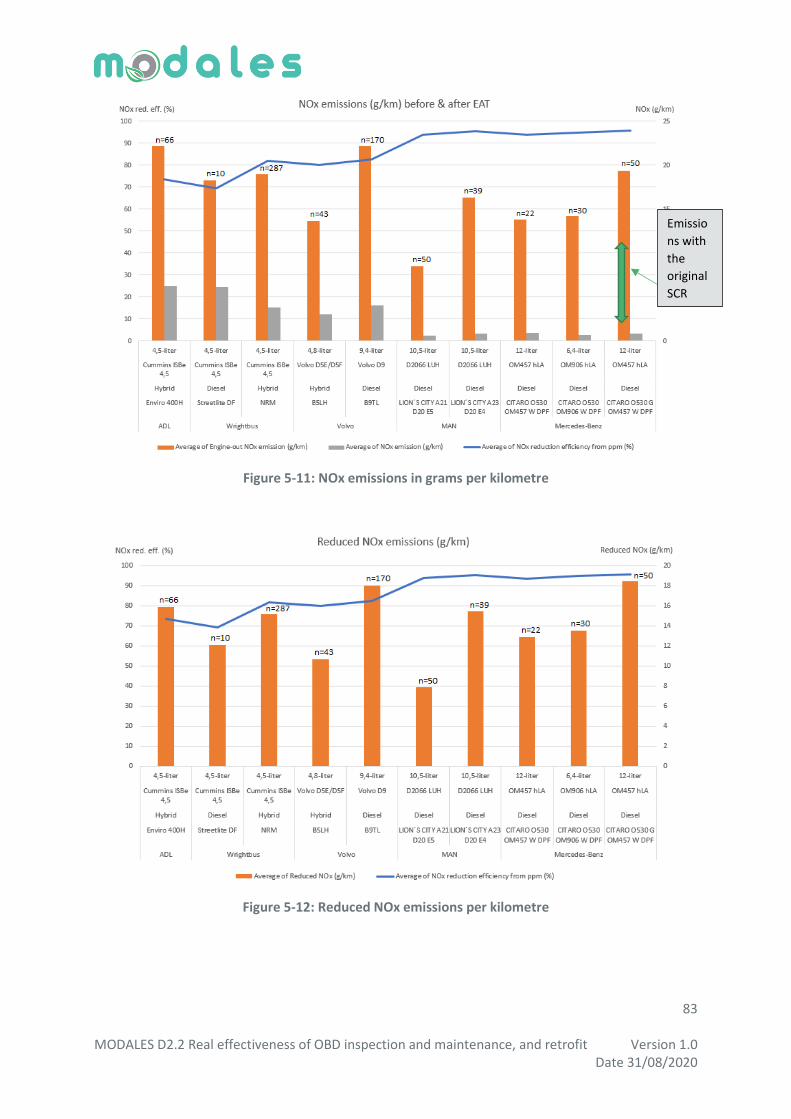
83 MODALES D2.2 Real effectiveness of OBD inspection and maintenance, and retrofit Version 1.0 Date 31/08/2020
Figure 5-11: NOx emissions in grams per kilometre
Figure 5-12: Reduced NOx emissions per kilometre
Emissio
ns with
the
original
SCR
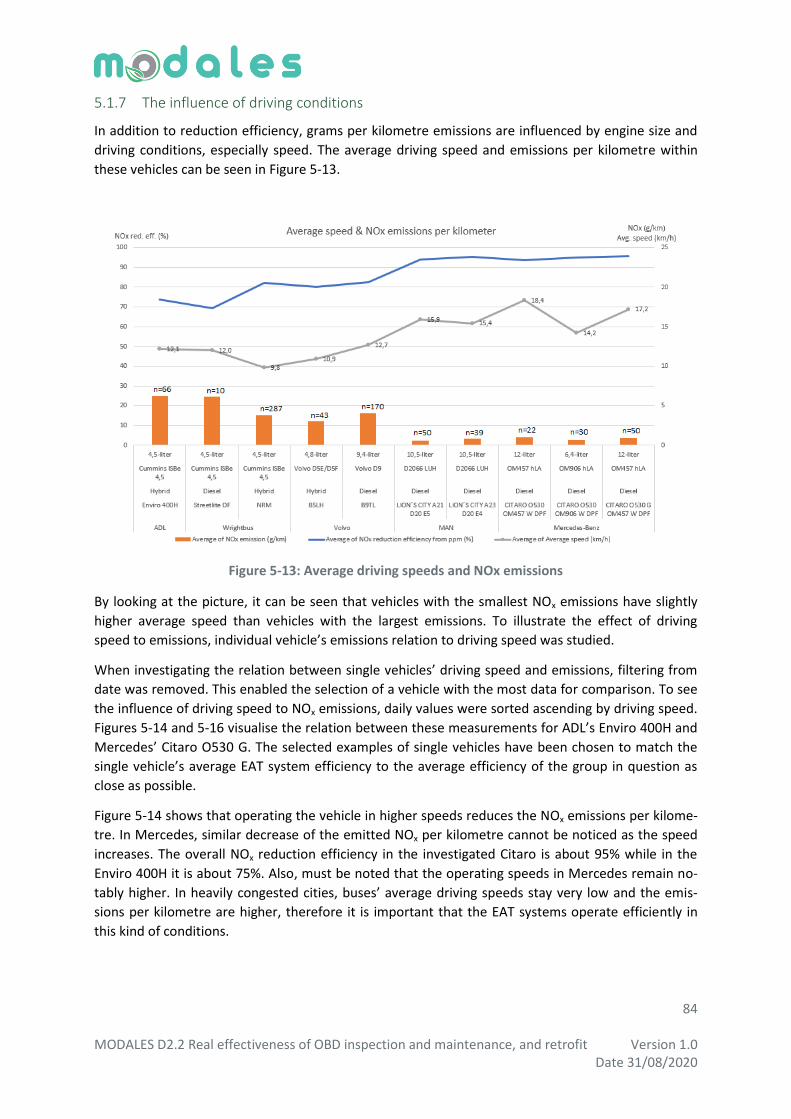
84 MODALES D2.2 Real effectiveness of OBD inspection and maintenance, and retrofit Version 1.0 Date 31/08/2020
5.1.7 The influence of driving conditions
In addition to reduction efficiency, grams per kilometre emissions are influenced by engine size and
driving conditions, especially speed. The average driving speed and emissions per kilometre within
these vehicles can be seen in Figure 5-13.
Figure 5-13: Average driving speeds and NOx emissions
By looking at the picture, it can be seen that vehicles with the smallest NOx emissions have slightly
higher average speed than vehicles with the largest emissions. To illustrate the effect of driving
speed to emissions, individual vehicle’s emissions relation to driving speed was studied.
When investigating the relation between single vehicles’ driving speed and emissions, filtering from
date was removed. This enabled the selection of a vehicle with the most data for comparison. To see
the influence of driving speed to NOx emissions, daily values were sorted ascending by driving speed.
Figures 5-14 and 5-16 visualise the relation between these measurements for ADL’s Enviro 400H and
Mercedes’ Citaro O530 G. The selected examples of single vehicles have been chosen to match the
single vehicle’s average EAT system efficiency to the average efficiency of the group in question as
close as possible.
Figure 5-14 shows that operating the vehicle in higher speeds reduces the NOx emissions per kilome-
tre. In Mercedes, similar decrease of the emitted NOx per kilometre cannot be noticed as the speed
increases. The overall NOx reduction efficiency in the investigated Citaro is about 95% while in the
Enviro 400H it is about 75%. Also, must be noted that the operating speeds in Mercedes remain no-
tably higher. In heavily congested cities, buses’ average driving speeds stay very low and the emis-
sions per kilometre are higher, therefore it is important that the EAT systems operate efficiently in
this kind of conditions.
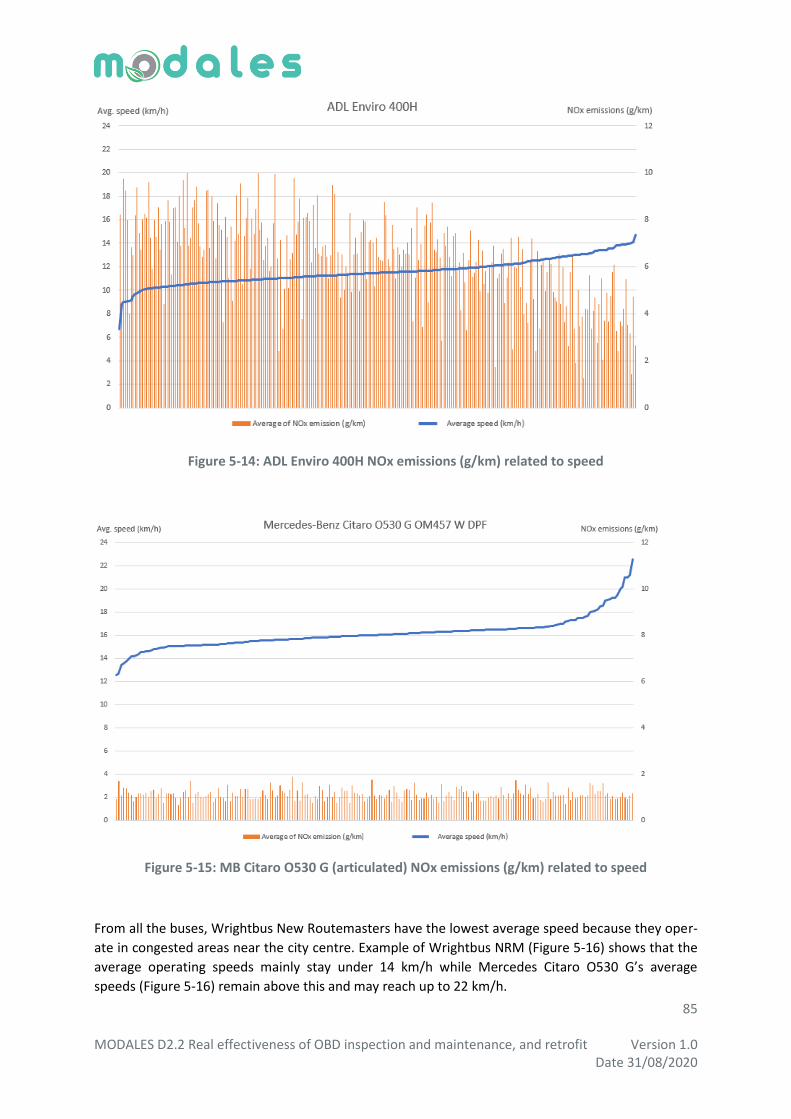
85 MODALES D2.2 Real effectiveness of OBD inspection and maintenance, and retrofit Version 1.0 Date 31/08/2020
Figure 5-14: ADL Enviro 400H NOx emissions (g/km) related to speed
Figure 5-15: MB Citaro O530 G (articulated) NOx emissions (g/km) related to speed
From all the buses, Wrightbus New Routemasters have the lowest average speed because they oper-
ate in congested areas near the city centre. Example of Wrightbus NRM (Figure 5-16) shows that the
average operating speeds mainly stay under 14 km/h while Mercedes Citaro O530 G’s average
speeds (Figure 5-16) remain above this and may reach up to 22 km/h.

86 MODALES D2.2 Real effectiveness of OBD inspection and maintenance, and retrofit Version 1.0 Date 31/08/2020
Figure 5-16: Wrightbus NRM NOx emissions (g/km) related to speed
As mentioned earlier in this document, exhaust temperature is a significant factor for operation of
the aftertreatment system. The relation between operating speed and exhaust temperature was
investigated in the same buses than the examples above. As the average speed increases a slightly
rising trend is noticeable in temperatures within Enviro 400H and New Routemaster (Figures 5-17
and 5-18).
Figure 5-17: ADL Enviro 400H relation between driving speeds and exhaust temperatures

87 MODALES D2.2 Real effectiveness of OBD inspection and maintenance, and retrofit Version 1.0 Date 31/08/2020
Figure 5-18: Wrightbus NRM relation between driving speeds and exhaust temperatures
In addition to articulated Citaro, average speed and temperatures were also studied in a solo Citaro
which is equipped with the same OM457 engine. Figure 5-19 represents the behaviour of exhaust
temperatures with increasing speed for articulated Citaro O530 G and Figure 5-20 for a solo bus Cita-
ro O530.
Figure 5-19: MB Citaro O530 G Average operating speeds & exhaust temperatures
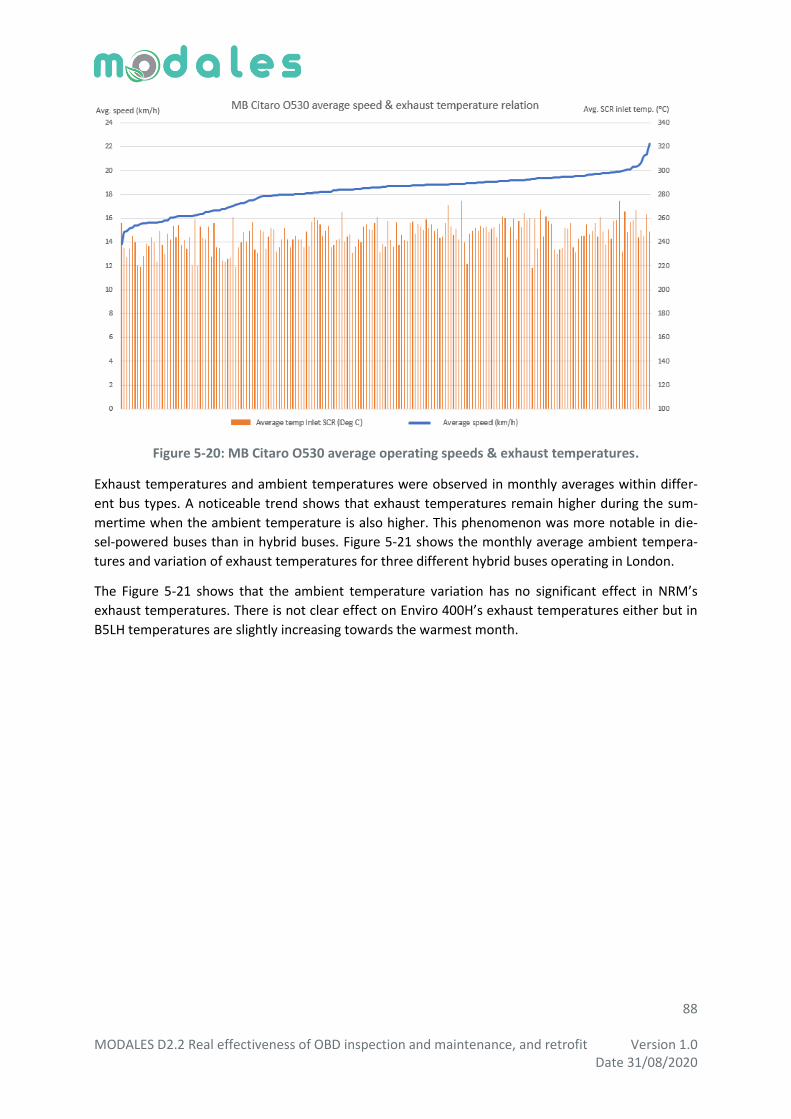
88 MODALES D2.2 Real effectiveness of OBD inspection and maintenance, and retrofit Version 1.0 Date 31/08/2020
Figure 5-20: MB Citaro O530 average operating speeds & exhaust temperatures.
Exhaust temperatures and ambient temperatures were observed in monthly averages within differ-
ent bus types. A noticeable trend shows that exhaust temperatures remain higher during the sum-
mertime when the ambient temperature is also higher. This phenomenon was more notable in die-
sel-powered buses than in hybrid buses. Figure 5-21 shows the monthly average ambient tempera-
tures and variation of exhaust temperatures for three different hybrid buses operating in London.
The Figure 5-21 shows that the ambient temperature variation has no significant effect in NRM’s
exhaust temperatures. There is not clear effect on Enviro 400H’s exhaust temperatures either but in
B5LH temperatures are slightly increasing towards the warmest month.
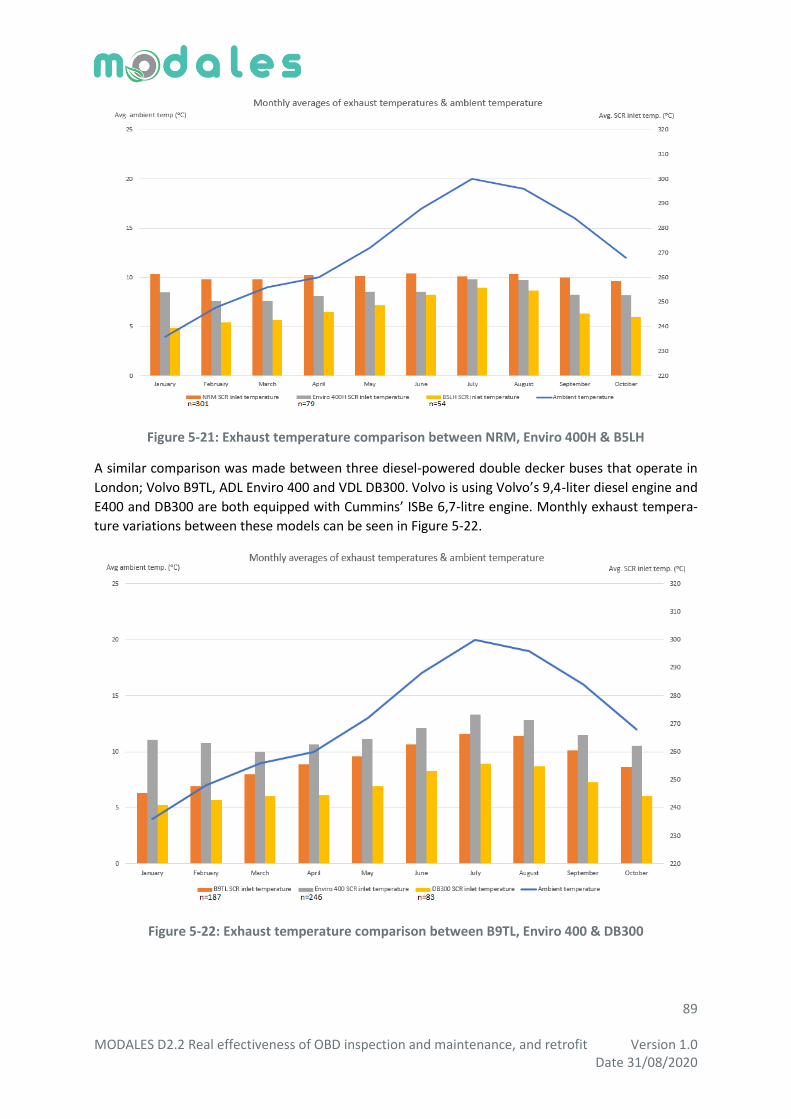
89 MODALES D2.2 Real effectiveness of OBD inspection and maintenance, and retrofit Version 1.0 Date 31/08/2020
Figure 5-21: Exhaust temperature comparison between NRM, Enviro 400H & B5LH
A similar comparison was made between three diesel-powered double decker buses that operate in
London; Volvo B9TL, ADL Enviro 400 and VDL DB300. Volvo is using Volvo’s 9,4-liter diesel engine and
E400 and DB300 are both equipped with Cummins’ ISBe 6,7-litre engine. Monthly exhaust tempera-
ture variations between these models can be seen in Figure 5-22.
Figure 5-22: Exhaust temperature comparison between B9TL, Enviro 400 & DB300
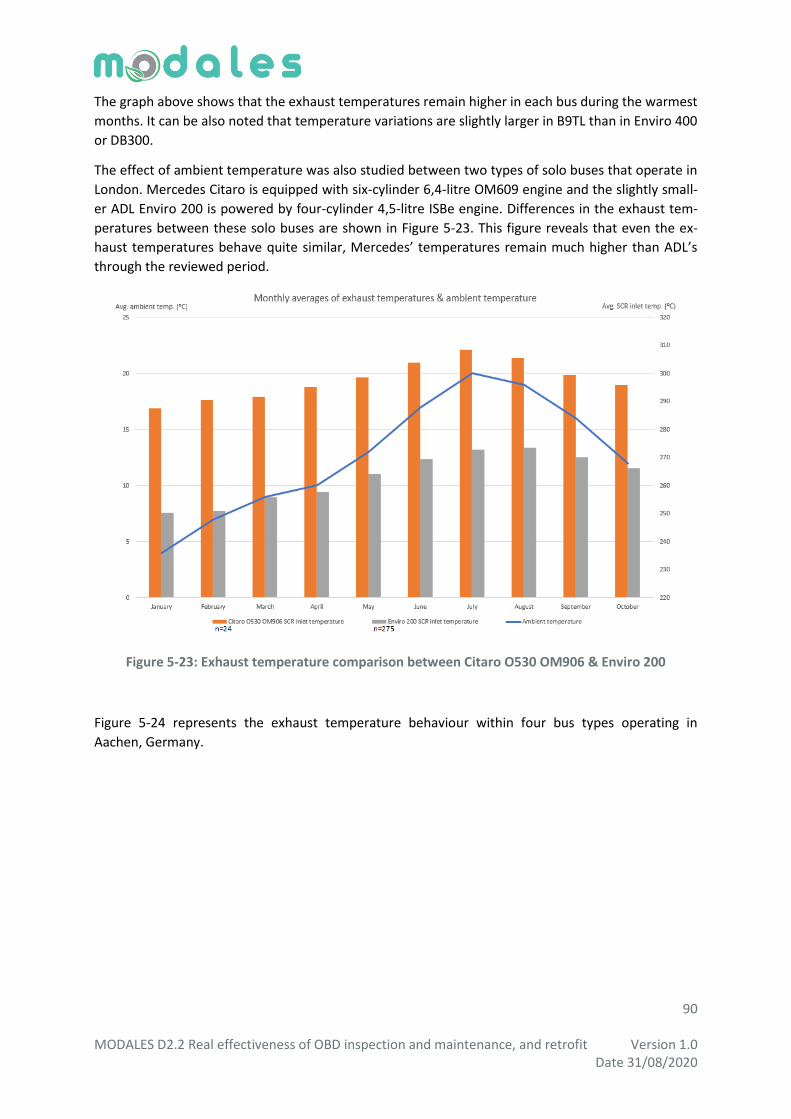
90 MODALES D2.2 Real effectiveness of OBD inspection and maintenance, and retrofit Version 1.0 Date 31/08/2020
The graph above shows that the exhaust temperatures remain higher in each bus during the warmest
months. It can be also noted that temperature variations are slightly larger in B9TL than in Enviro 400
or DB300.
The effect of ambient temperature was also studied between two types of solo buses that operate in
London. Mercedes Citaro is equipped with six-cylinder 6,4-litre OM609 engine and the slightly small-
er ADL Enviro 200 is powered by four-cylinder 4,5-litre ISBe engine. Differences in the exhaust tem-
peratures between these solo buses are shown in Figure 5-23. This figure reveals that even the ex-
haust temperatures behave quite similar, Mercedes’ temperatures remain much higher than ADL’s
through the reviewed period.
Figure 5-23: Exhaust temperature comparison between Citaro O530 OM906 & Enviro 200
Figure 5-24 represents the exhaust temperature behaviour within four bus types operating in
Aachen, Germany.

91 MODALES D2.2 Real effectiveness of OBD inspection and maintenance, and retrofit Version 1.0 Date 31/08/2020
Figure 5-24: Exhaust temperature comparison between Citaro O530 G, O530, Lion's City A23 & A40
The EAT systems in all these bus models are operating in high, over 90% NOx reduction efficiency.
Both Mercedes’ buses, Citaro O530 and O530 G are powered by 12-liter OM457 diesel engine while
Lion’s City A23 and A40 are both using smaller MAN’s 10.5-liter D2066 LUH engine. By looking at the
picture, it can be seen that exhaust temperatures in Mercedes’ buses are correlating with ambient
temperatures more than temperatures in MAN’s buses. Also, it should be noted that temperatures in
solo Citaros are staying notably lower than in articulated Citaro O530 G.
5.1.8 Exhaust Temperatures & Reduction Efficiency
The behaviour of the EAT system when exhaust gas temperatures are increasing were compared
between various bus models. The following graphics include the daily values for all the buses that
had recorded data in period of 10 months from January to October. The n in the figure states the
count of buses and the light blue on the background indicates the daily values of NOx reduction effi-
ciency with increasing average SCR temperatures, which is presented with the orange line. The dark
blue trendline has been included in order to ease the interpretation. When comparing Enviro 400H
and NRM, graphics reveal that exhaust temperatures remain slightly higher in NRM and the average
reduction efficiency is about 80% when the average temperature is 250, while in the 400H the effi-
ciency reaches 70% in the same temperature. The relation between NOx reduction efficiency and
exhaust temperatures between these models are shown in Figures 5-25 and 5-26.

92 MODALES D2.2 Real effectiveness of OBD inspection and maintenance, and retrofit Version 1.0 Date 31/08/2020
Figure 5-25: Enviro 400H NOx reduction efficiency related to exhaust temperature
Figure 5-26: Wrightbus NRM NOx reduction efficiency related to exhaust temperature
In comparison ADL’s Enviro 200 is also equipped with the same Cummins ISBe engine but without
hybrid technology. The behaviour of the EAT system is similar with Enviro 400H when temperatures
increase, but the overall efficiency remains higher due to slightly higher exhaust temperatures. Envi-
ro 200’s EAT system efficiency related to exhaust gas temperatures is presented in Figure 5-27.
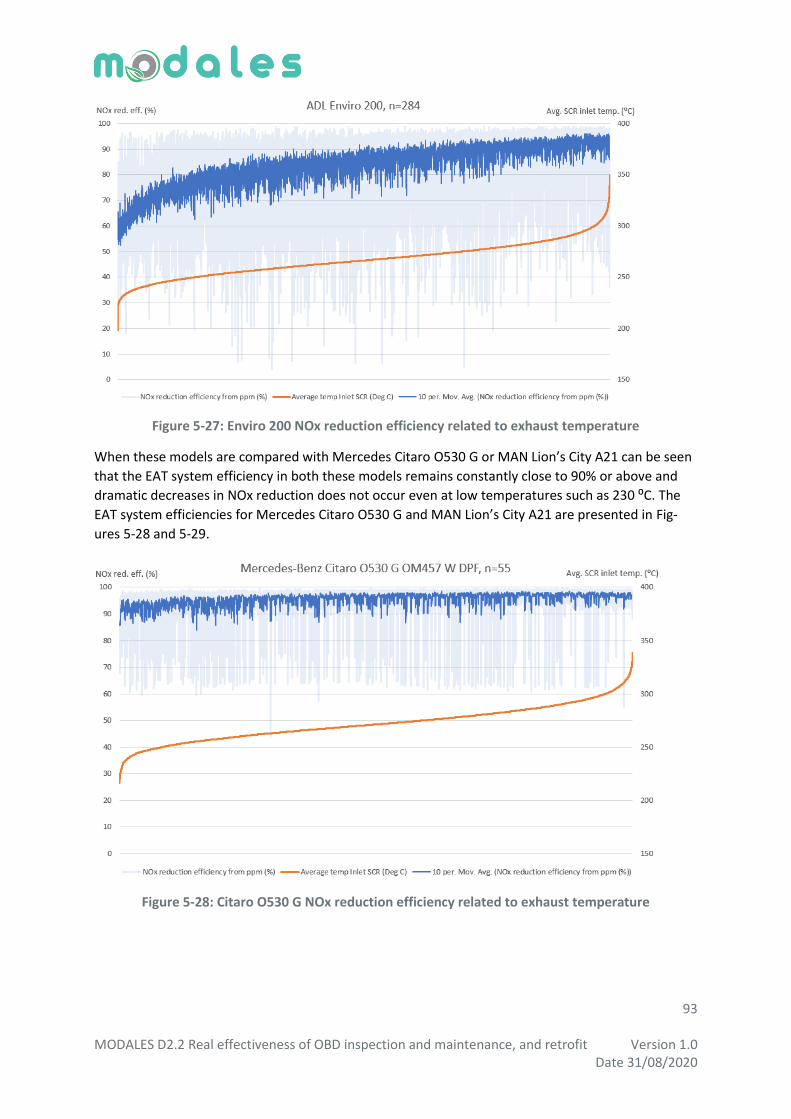
93 MODALES D2.2 Real effectiveness of OBD inspection and maintenance, and retrofit Version 1.0 Date 31/08/2020
Figure 5-27: Enviro 200 NOx reduction efficiency related to exhaust temperature
When these models are compared with Mercedes Citaro O530 G or MAN Lion’s City A21 can be seen
that the EAT system efficiency in both these models remains constantly close to 90% or above and
dramatic decreases in NOx reduction does not occur even at low temperatures such as 230 ⁰C. The
EAT system efficiencies for Mercedes Citaro O530 G and MAN Lion’s City A21 are presented in Fig-
ures 5-28 and 5-29.
Figure 5-28: Citaro O530 G NOx reduction efficiency related to exhaust temperature
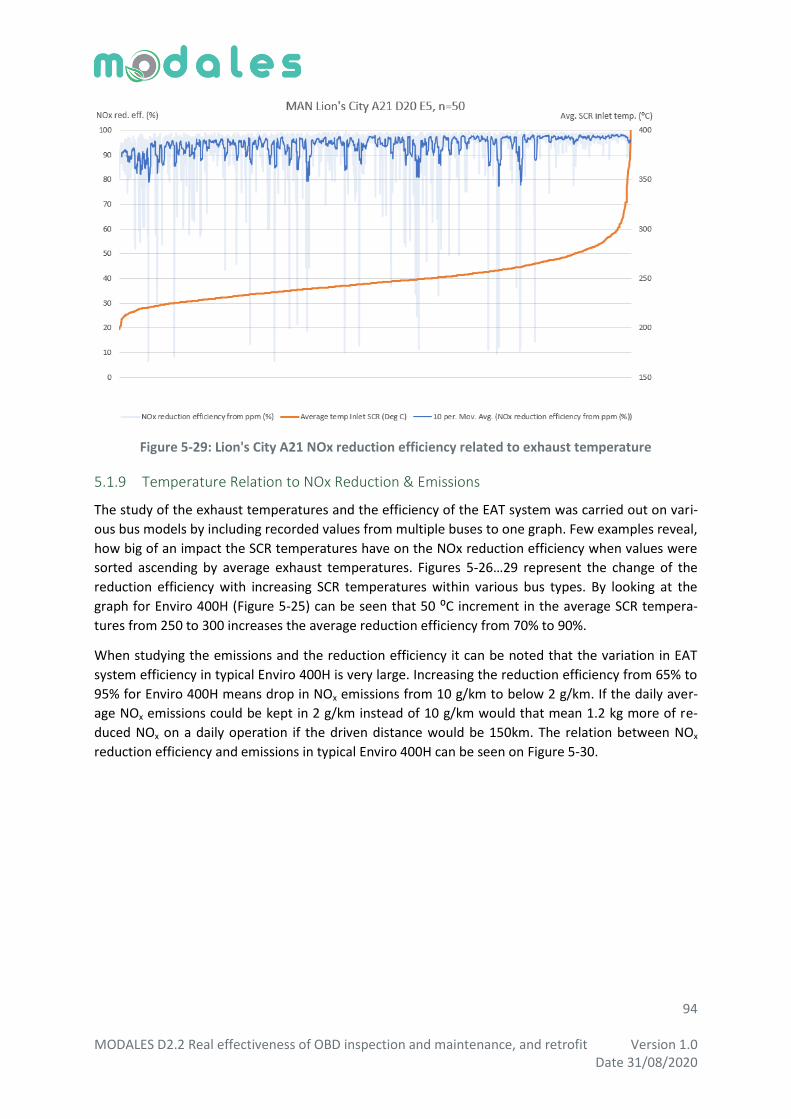
94 MODALES D2.2 Real effectiveness of OBD inspection and maintenance, and retrofit Version 1.0 Date 31/08/2020
Figure 5-29: Lion's City A21 NOx reduction efficiency related to exhaust temperature
5.1.9 Temperature Relation to NOx Reduction & Emissions
The study of the exhaust temperatures and the efficiency of the EAT system was carried out on vari-
ous bus models by including recorded values from multiple buses to one graph. Few examples reveal,
how big of an impact the SCR temperatures have on the NOx reduction efficiency when values were
sorted ascending by average exhaust temperatures. Figures 5-26…29 represent the change of the
reduction efficiency with increasing SCR temperatures within various bus types. By looking at the
graph for Enviro 400H (Figure 5-25) can be seen that 50 ⁰C increment in the average SCR tempera-
tures from 250 to 300 increases the average reduction efficiency from 70% to 90%.
When studying the emissions and the reduction efficiency it can be noted that the variation in EAT
system efficiency in typical Enviro 400H is very large. Increasing the reduction efficiency from 65% to
95% for Enviro 400H means drop in NOx emissions from 10 g/km to below 2 g/km. If the daily aver-
age NOx emissions could be kept in 2 g/km instead of 10 g/km would that mean 1.2 kg more of re-
duced NOx on a daily operation if the driven distance would be 150km. The relation between NOx
reduction efficiency and emissions in typical Enviro 400H can be seen on Figure 5-30.
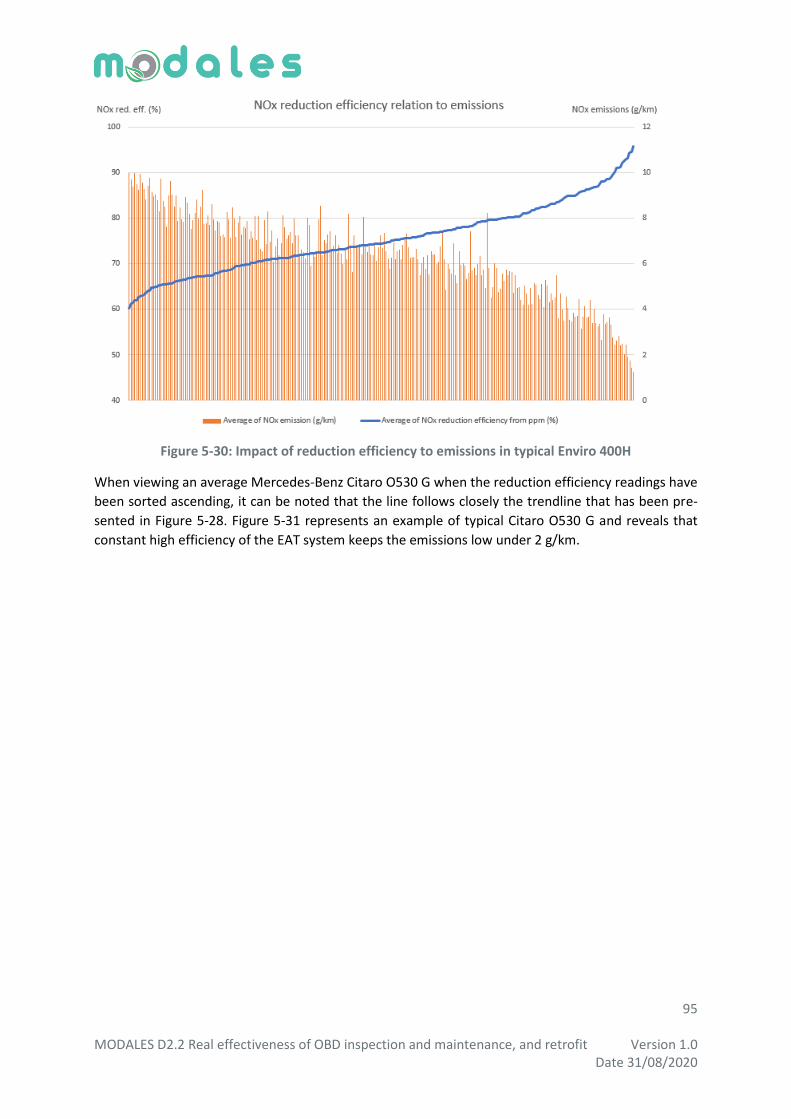
95 MODALES D2.2 Real effectiveness of OBD inspection and maintenance, and retrofit Version 1.0 Date 31/08/2020
Figure 5-30: Impact of reduction efficiency to emissions in typical Enviro 400H
When viewing an average Mercedes-Benz Citaro O530 G when the reduction efficiency readings have
been sorted ascending, it can be noted that the line follows closely the trendline that has been pre-
sented in Figure 5-28. Figure 5-31 represents an example of typical Citaro O530 G and reveals that
constant high efficiency of the EAT system keeps the emissions low under 2 g/km.
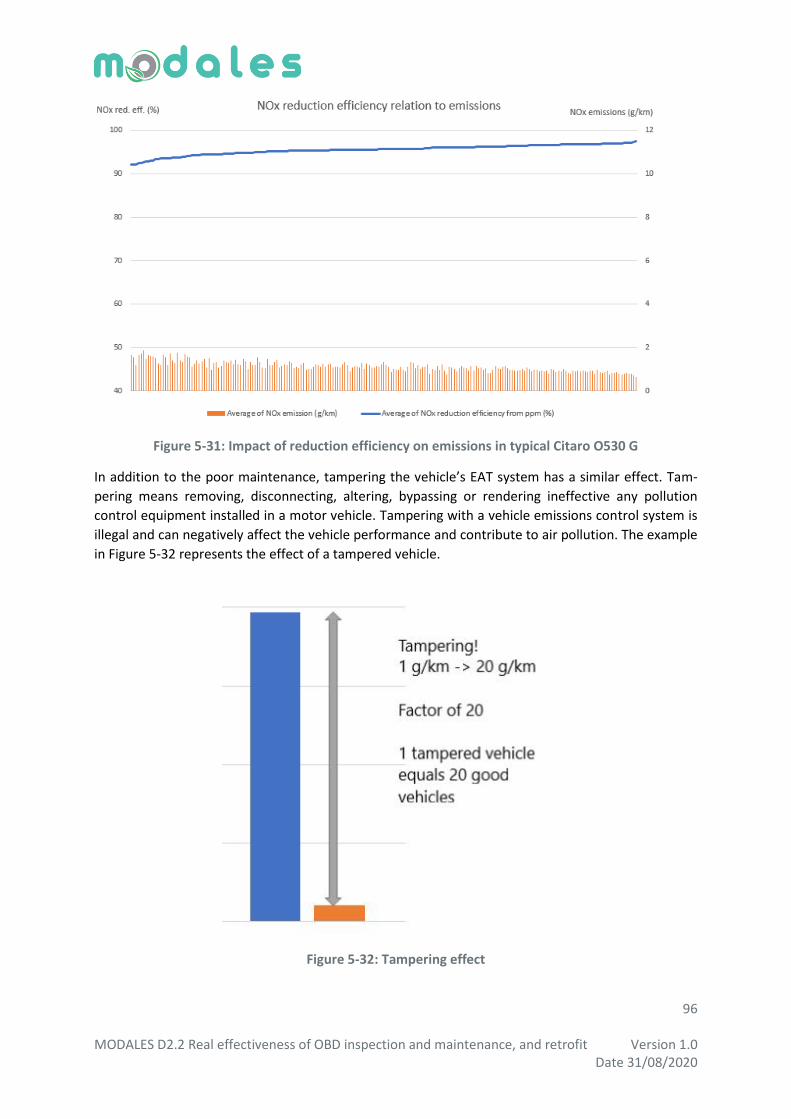
96 MODALES D2.2 Real effectiveness of OBD inspection and maintenance, and retrofit Version 1.0 Date 31/08/2020
Figure 5-31: Impact of reduction efficiency on emissions in typical Citaro O530 G
In addition to the poor maintenance, tampering the vehicle’s EAT system has a similar effect. Tam-
pering means removing, disconnecting, altering, bypassing or rendering ineffective any pollution
control equipment installed in a motor vehicle. Tampering with a vehicle emissions control system is
illegal and can negatively affect the vehicle performance and contribute to air pollution. The example
in Figure 5-32 represents the effect of a tampered vehicle.
Figure 5-32: Tampering effect
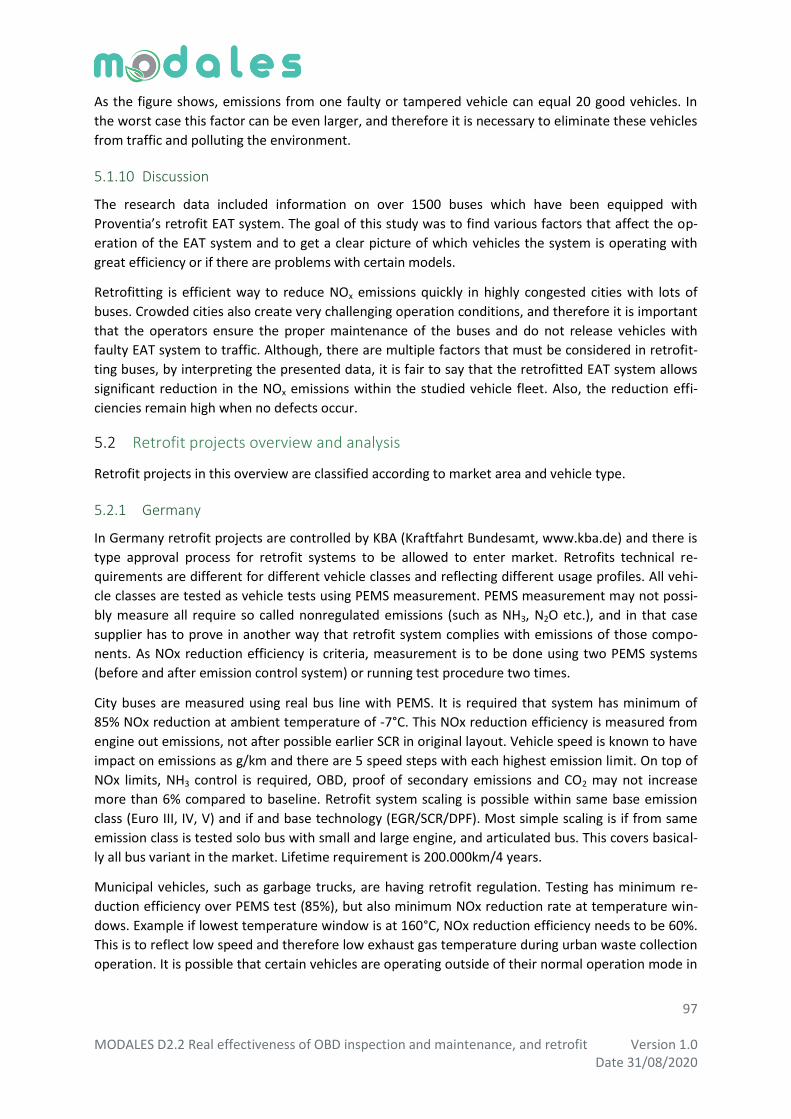
97 MODALES D2.2 Real effectiveness of OBD inspection and maintenance, and retrofit Version 1.0 Date 31/08/2020
As the figure shows, emissions from one faulty or tampered vehicle can equal 20 good vehicles. In
the worst case this factor can be even larger, and therefore it is necessary to eliminate these vehicles
from traffic and polluting the environment.
5.1.10 Discussion
The research data included information on over 1500 buses which have been equipped with
Proventia’s retrofit EAT system. The goal of this study was to find various factors that affect the op-
eration of the EAT system and to get a clear picture of which vehicles the system is operating with
great efficiency or if there are problems with certain models.
Retrofitting is efficient way to reduce NOx emissions quickly in highly congested cities with lots of
buses. Crowded cities also create very challenging operation conditions, and therefore it is important
that the operators ensure the proper maintenance of the buses and do not release vehicles with
faulty EAT system to traffic. Although, there are multiple factors that must be considered in retrofit-
ting buses, by interpreting the presented data, it is fair to say that the retrofitted EAT system allows
significant reduction in the NOx emissions within the studied vehicle fleet. Also, the reduction effi-
ciencies remain high when no defects occur.
Retrofit projects overview and analysis 5.2
Retrofit projects in this overview are classified according to market area and vehicle type.
5.2.1 Germany
In Germany retrofit projects are controlled by KBA (Kraftfahrt Bundesamt, www.kba.de) and there is
type approval process for retrofit systems to be allowed to enter market. Retrofits technical re-
quirements are different for different vehicle classes and reflecting different usage profiles. All vehi-
cle classes are tested as vehicle tests using PEMS measurement. PEMS measurement may not possi-
bly measure all require so called nonregulated emissions (such as NH3, N2O etc.), and in that case
supplier has to prove in another way that retrofit system complies with emissions of those compo-
nents. As NOx reduction efficiency is criteria, measurement is to be done using two PEMS systems
(before and after emission control system) or running test procedure two times.
City buses are measured using real bus line with PEMS. It is required that system has minimum of
85% NOx reduction at ambient temperature of -7°C. This NOx reduction efficiency is measured from
engine out emissions, not after possible earlier SCR in original layout. Vehicle speed is known to have
impact on emissions as g/km and there are 5 speed steps with each highest emission limit. On top of
NOx limits, NH3 control is required, OBD, proof of secondary emissions and CO2 may not increase
more than 6% compared to baseline. Retrofit system scaling is possible within same base emission
class (Euro III, IV, V) and if and base technology (EGR/SCR/DPF). Most simple scaling is if from same
emission class is tested solo bus with small and large engine, and articulated bus. This covers basical-
ly all bus variant in the market. Lifetime requirement is 200.000km/4 years.
Municipal vehicles, such as garbage trucks, are having retrofit regulation. Testing has minimum re-
duction efficiency over PEMS test (85%), but also minimum NOx reduction rate at temperature win-
dows. Example if lowest temperature window is at 160°C, NOx reduction efficiency needs to be 60%.
This is to reflect low speed and therefore low exhaust gas temperature during urban waste collection
operation. It is possible that certain vehicles are operating outside of their normal operation mode in

98 MODALES D2.2 Real effectiveness of OBD inspection and maintenance, and retrofit Version 1.0 Date 31/08/2020
these test cycles. Focus on regulation is at low speed operations and as such easy to justify. Lifetime
requirement is 200.000km or 4 years.
Table 5.5: City bus retrofit emission limits for Germany
Speed class [km/h] Speed range [km/h] Limit [NOx g/km]
10 7.5-12.5 7.5
15 >12.5-17.5 5
20 >17.5-22.5 4
25 >22.5-27.5 3
30 >27.5-32.5 2.5
Light commercial vehicles (N1, 2.8-3.5tn) are following similar limits as municipal vehicles and mini-
mum of 85% NOx reduction at PEMS test. Approval lists vehicle model variants included in type ap-
proval and in general scaling to lower power is possible, but scaling is more limited to variable engine
sizes.
Passenger cars are also tested as PEMS test and limit is NOx 270mg/km at PEMS test. PEMS route
includes 1/3 of urban, 1/3 of rural and 1/3 or highway driving. Highest speed at highway part is up to
145km/h. Same limitations on secondary emissions and CO2 increase (max +6%) apply also to pas-
senger cars. Lifetime requirement is 100.000km or 5 years is applicable for light commercial vehicles
and passenger cars.
5.2.2 United Kingdom
Buses, coaches and trucks are within retrofit regulations and process is coordinated by Energy Saving
Trust (EST), unless buses are operated in London, then Transport for London (TfL) is coordinator.
Retrofit in London has long history and DPF / SCR retrofits have been in place for several years. Cur-
rent latest regulation if for buses originally Euro IV and V. Test procedure includes testing of actual
vehicles on chassis dyno as well certain period of field testing after passing emission limits at test
laboratory. Buses are tested on LUB cycle, or Millbrook test cycle in London and couches on LUC cy-
cle. NOx emissions should be less than 0.5 g/km and NO2 less than 0.1g/km. Several details include
secondary emission measurements and also particle number limit. Heavy duty trucks and refuse col-
lection vehicles (garbage trucks) have their own test cycles. Garbage trucks have lower ambient tem-
perature during test (+10°C) as well lifting arm operation and waste compaction operations during
testing. Testing includes periods for dense urban collection, suburban collection, as well transfer
operation. Design lifetime of retrofit system is 7 years.
Emission monitoring telemetry is mandatory in all buses in London. Due to variable driving conditions
and sometimes heavy congestions, average driving speeds are significantly lower than in test cycles.
Lower speed lowers exhaust gas temperatures and further increase emissions (as g/km).
Table 5.6: City bus retrofit (primary) emission limits TfL

99 MODALES D2.2 Real effectiveness of OBD inspection and maintenance, and retrofit Version 1.0 Date 31/08/2020
Table 5.7: City bus retrofit (secondary) emission limits TfL
source:
https://energysavingtrust.org.uk/sites/default/files/CAZ%20CVRC%20Chassis%20DynamometerTest%20Procedures%20for%20Lo
w%20Emission%20Adaptations%20v11.0%2023Sep2019.pdf
5.2.3 Other Countries
UN ECE R132 is retrofit regulation covering on-road and non-road vehicles. Target is to have similar
process as new homologation tests for engines. This requirement is technologically sound, but com-
mercially heavy. Retrofit market is fragmented and market potential is not always very clear. Also
emission tests are made with engines at dyno, which standardizes conditions. On the other hand,
during diesel-gate scandal it was widely discussed that real drive emissions are what counts. Possible
drivetrain features can affect emission performance heavily, see also previous Chapter 5.1..
There have been local retrofit regulations to cover range of vehicle, on-road or non-road, in several
countries and cities. As a smallest scale those have been single tendering rounds with vehicles of
some pieces. And as larger scale those have covered hundreds of vehicles operating in certain limited
area. Such retrofit projects have been in at least Netherlands, Spain, Italy, Nordic Countries and un-
der VERT – organisation.
Analysis of potentials of different applications for retrofits 5.3
Obviously retrofitting on-road vehicles operating in dense population areas are most attractive appli-
cations for retrofitting. Vehicle population / type is high enough to justify test and design cost for
each variant. And emissions are reduced directly from street corridors where exposure is highest.
Retrofitting of passenger cars with SCR is possible and there are approvals for those. Fragmented
market and business to consumer -style business sets different limitations. It is difficult to justify ret-
rofitting only by emission reductions, also other tools are needed. Those tools could include incen-
tives, driving restrictions etc.
For non-road applications, usage and installation varies a lot. This is setting higher cost for design and
testing for approval. Retrofitting same engine but installed in another application might require re-
testing and following possible in-use tests. This might raise the development and certification costs
100 MODALES D2.2 Real effectiveness of OBD inspection and maintenance, and retrofit Version 1.0 Date 31/08/2020
make retrofitting non-feasible. If installed population is only few examples, statistical analysis of
emission benefits is difficult.
In generally, retrofitting should reduce emissions (converter into financial terms), higher than instal-
lation and operation costs over lifetime. Cost/benefit of reduce NOx gram varies geographically and
it is not possible to set just one value. If certain vehicles are creating locally high emission spot -
example one bus line polluting certain bus stop at street corridor – then value for NOx from those
buses is different than other bus operating in other area where there is no specific emission problem.
Residual value of vehicle and lifetime cost of retrofit system should be in balance.
Methodologies to verify the durability of the retrofits 5.4
In German regulations retrofits are verified under type approval and those are controlled by KBA.
KBA has right to test vehicles and make in-service conformity tests to retrofit systems. This includes
partial testing, such as function of certain OBD part or full testing of the system in including PEMS
testing. Manufacturers of emission control devices are requested to do annual in-service conformity
tests for duration of four years and report those to KBA.
In London all retrofitted buses (which are to reach latest Euro VI emission level) are equipped with
some sort of remote telemetry to monitor emission performance of the buses. TfL has set general
guidelines how emission monitoring system should work and what parameters are to be reported. By
having common rules and principles, different calculation methods and possible unwanted filtrations
are minimized.
Durability monitoring should be continuous and transparent. In chapter 5.1., it was demonstrated
that one single non-working after-treatment system is emitting 20 times more NOx emission than
properly functioning. For this reason, fixing faults as early as possible is great benefit for environ-
ment.
PEMS measurement of selected vehicles periodically gives reference emissions. Telemetry gives indi-
cation of emissions, but sensor drifting, and other inaccuracies are left out. For sorting out worst
emitters, online telemetry is the fastest tool.

101 MODALES D2.2 Real effectiveness of OBD inspection and maintenance, and retrofit Version 1.0 Date 31/08/2020
6 Conclusions and implications This deliverable combines literature review of three main themes: detecting high-emitting vehicles
with periodic inspections and tests, probing and gauging the performance of EAT systems by on-
board diagnostics (OBD), and assessing the potential of lowering the harmful emissions of vehicles
and NRMM by retrofitted EAT devices.
While comparing the characteristics of the inspection and maintenance (I/M) programmes in US, and
the procedural progress of PTI, associated with the upholding of the roadworthiness of motor vehi-
cles in Europe, an interesting fact was revealed. Namely, in US the preservation of air quality has
always had the highest rank regarding the inspection of the condition and performance of motor
vehicles, while in Europe, safety-related aspects have always been the most important features of
such an inspection. This is clearly reflected in the fact that in US there are numerous states and
densely-populated urbanizations, where emissions-related I/M programmes are mandatory for safe-
guarding low exhaust emissions. However, there is no periodic inspection (PTI) that should take care
for the safety-related issues. In contrast, the European directives relating to the contents and proce-
dures of PTI are clearly emphasising safety aspects, like the condition of brakes and other chassis
items, over probing the performance of the EAT system. Furthermore, knowing how adversely motor
vehicles have for several decades attributed to the bad ambient air quality in US, this is no surprise.
The more detailed review of the US I/M programmes showed, how there has been almost constant
evolution of the procedures used in probing the level of in-use emissions, as well as an equally steady
evolvement of the performance and complexity of the EAT systems. However, similar progress has
not taken place in Europe, as the emissions checks included in present version of the prescription for
PTI does not include any relevant means to gauge emissions of NOx and particulates (PM, PN) that
are the primary contributors and precursors for low ambient air quality in many European cities.
Furthermore, it was discovered that this issue is not technical but more of a legislative case, because
according to the literature, several large scale studies have developed and presented procedures
applicable to NOx and PM/PN that could be implemented as parts of the PTI regulations, but the EC
legislators has failed to do so by today.
Furthermore, despite the apparent pre-eminence of the US programmes, many of the cost-benefit
analysis reviewed criticise the system about high costs vs. achieved improvements in air quality. But,
it is only fair to say that if there has not been I/M programmes, the air quality in most of the metrop-
olis of United States would be simply intolerable. Equally, the more lenient approach that EU has
taken regarding checking the levels of exhaust emissions, in association with the periodic technical
inspections now mandatory across Europe, is shown to have contributed to the worsening of ambi-
ent air quality in many densely-populated and heavily-trafficked cities.
However, partially this is situation due to fraudulent attitude of many European car manufacturers
and the resulting wide-spread incompliance of the EAT systems fitted in EURO 5 diesel-powered cars.
But, partially it is also due to the fact that even if several good quality attempts has been made to
enhance the scope and effectiveness of the PTI-procedures regarding the most important contribu-
tors, NOx and particulate emissions, the legislators have not been able to implement those in related
directives. Instead, the response to the epidemic exceedance of air quality guidelines observed
across Europe has been the attempts to restrict traffic. As by law, the local authorities are in charge
of the air quality and should react if exceeds in the air quality limit values happen repeatedly. Should
this happen, the authorities need to create a plan, how to harness this adverse phenomenon. Usual-

102 MODALES D2.2 Real effectiveness of OBD inspection and maintenance, and retrofit Version 1.0 Date 31/08/2020
ly, they cannot do more than place restrictions to the traffic, and create zoning systems, where the
type approval emissions level of the vehicles is used as a distinguishing factor and form the basis for
approving or denying access. Today, these “low emissions zones” are quite widespread across Euro-
pean cities.
As a further option for identifying high emitters, Remote Sensing Technologies were also studied.
Remote sensing device (RSD) measures an instantaneous emission rate of individual vehicles as they
pass by the instrument location. It is not an exact measurement, and the results are rather expressed
as emissions in g per g of fuel burned. As such, it can give valuable information for air quality moni-
toring and development of emissions models. It can also be used for in-use surveillance, to deter-
mine the average emission rates under real-driving conditions and assess the long-term durability of
EAT systems.
First introduced already in late 1980s, the technology has ever since taken substantial leaps, and is
now commercialised by several suppliers. Today, a fully functional remote sensing device (RSD) set-
up has a pollutant analyser and a camera device for linking the measured values to a license plate,
and in some case even with additional vehicle data retrieved simultaneously on-line OTA from a reg-
istration database. Furthermore, information of the acceleration of the vehicle during exhaust plume
scanning is provided. The latest models add nitrogen dioxide (NO2) to pollutants detected by the
earlier device’s nitrogen monoxide (NO), CO, carbon dioxide (CO2), hydrocarbons (HC), and exhaust
opacity.
Nevertheless, even if RSD data is not particularly good for assessing emissions of individual vehicles,
but rather giving the characteristics of fleets, RSD can be used for vehicle inspection and mainte-
nance purposes to detect, if an individual vehicle has suspiciously high pollutant emissions in real
driving, or, inversely, if this vehicle’s after-treatment is well maintained, and thus can it be exempted
from inspection.
Furthermore, in US the development and use of system diagnostics (OBD) as means to constantly
monitor the condition and functioning of the EAT system has been a pioneering work. The first gen-
eration of OBD was introduced in US already in late 1980’s, about two decades ahead compared to
Europe, where EOBD became a standard feature as late as in 2001 (SI) and 2004 (CI).
The functionality and performance of OBD-II and EOBD are fairly identical, and apart from assessing
the status of the components vital for maintaining low emissions, additional information can be re-
trieved via OBD. These include e.g. oil temperature, vehicle speed, engine RPM, throttle position,
airflow rate, fuel flow rate, coolant temperature, and more. These parameters accessible via the
EOBD interface are of the main interest in MODALES. The designed concept is to use these functional
parameters for the estimation of the vehicle’s exhaust emissions level, as well as to characterise the
driving, by attaching external data retrieval and storing device to a number of cars driven by volun-
teering motorists. To enable all this, standards covering the physical hardware and software func-
tionality of both the CAN bus and EOBD interface were examined. Furthermore, the structure of the
CAN messages was investigated, and finally, the Unified Diagnostic Service (UDS) standard was ex-
plored. All this gave necessary abilities to interact with the array of vehicle ECUs and monitor/record
a host of emissions-related parameters.
However, the open standard for OBD-purpose only covers a subset of all potentially available data
accessible via the EOBD/CAN-interface, but the rest are non-standard, largely OEM specific. Further-
more, EOBD is also relevant only to passenger cars and vans, because HD vehicles have altogether

103 MODALES D2.2 Real effectiveness of OBD inspection and maintenance, and retrofit Version 1.0 Date 31/08/2020
another kind of architecture and set of standards. Thus, in WP4 a serious effort is made to “crack”
the messages and attain as large compendium as possible of parameters that are accessible, and can
be monitored for simultaneously assess the exhaust emissions levels and characterise the driving
patterns of the motorist at the wheel. This fusion of information shall be used for the benefit of the
DALED app, to be developed for the purpose of training and helping motorists to drive their particu-
lar vehicle in a low-emission style.
Aside the utilisation of the parameters to assess vehicle’s emissions vs. driving characteristics,
MODALES aims also to investigate the performance of EOBD to detect malfunctions and deteriorated
performance of the EAT system. MODALES is expected to assess, whether a simple EOBD functionali-
ty check and DTC retrieval could act as a substitute to physical measurement of harmful exhaust con-
stituents. Furthermore, an improvement in the EOBD performance is also sought after, resulting in
higher rate of detection in poorly maintained and/or tampered vehicles with elevated exhaust emis-
sions. However, the review revealed critical flaws in present EOBD. It was found that the system is
system is not robust enough regarding tampering. Crucial defects in the current system are that DTCs
can be easily cleared using readily available and low-cost communication tools, thus avoiding the
entrapment in the PTI. Furthermore, new software can be loaded into the engine control unit (ECU)
to increase engine power output and to disable EATS functionalities to alter the system in such a way
that it avoids triggering of DTCs.
Task 2.5 and the corresponding Deliverable D2.3 will address the situation of criminalisation of the
tampering and restricting in any way the performance of the EAT systems.
The last main theme, potential impact of retrofitted EATS was studied partly by a literature review,
but more as a study of data retrieved from specific experiments performed for this very purpose, in
order to assess, how different factors, environmental or mechanical, affect the function of retrofitted
EATS. The data used in this analysis was collected by a NOx emissions monitoring system that collects
live data from the vehicles with the retrofitted EAT system and uploads the information online to a
back-office server. The “big data” retrieved for this purpose was collected from nearly 1700 buses,
representing three configurations and five different manufacturers. It was expected that an in-depth
scrutiny of the collected data would reveal some phenomena that affect the EAT system operation
negatively.
Retrofitting of passenger cars with SCR is possible and there are some approved systems on the
marker. However, fragmented market and business to consumer -style business model sets limita-
tions. It is difficult to justify retrofitting only by emission reductions, so other incentives like tax re-
liefs or subsidies are needed. Those instruments could also include parking permits, avoiding tolls
and defying driving restrictions at low-emissions zones.
Regarding retrofits for non-road applications, the usage and installation varies a lot. This is setting
higher cost for design and testing for approval. Retrofitting same engine, but installed in another
application might require retesting and following possible in-use tests. This might raise the develop-
ment and certification costs make retrofitting non-feasible. If the installed population is only few
examples, statistical analysis of emission benefits is also difficult.

104 MODALES D2.2 Real effectiveness of OBD inspection and maintenance, and retrofit Version 1.0 Date 31/08/2020
7 References
Reference for Chapter 2 (I/M Programmes and their effectiveness) 7.1
EPA (2020a). Vehicle Emissions Inspection and Maintenance (I/M): Policy, Guidance and Test Proce-dures. U.S. EPA, accessed on 12.4.2020. https://www.epa.gov/state-and-local-transportation/vehicle-emissions-inspection-and-maintenance-im-policy-guidance-and BAR (2020). California Bureau of Automotive Repair (BAR), Smog-Check Program. https://bar.ca.gov/Consumer/Smog_Check_Program_General_Information.aspx, accessed on 1.7.2020 Hui He, Lingzhi Jin, (2017). A Historical Review of the U.S. Vehicle Emission Compliance Program and Emission Recall Cases; International Council on Clean Transportation (ICCT), 2017, 73 p. https://theicct.org/sites/default/files/publications/EPA-Compliance-and-Recall_ICCT_White-Paper_12042017_vF.pdf EPA, (1998). Final Rule Amendment to On-Board Diagnostic Checks Requirement for I/M Programs; Environmental Protection Agency, Office of Air and Radiation, EPA420-F-98-017, April 1998. 3 p. EPA, (2001). Environmental Protection Agency (EPA): Amendments to Vehicle Inspection Mainte-nance Program Requirements Incorporating the On-board Diagnostic Check; Federal Register/Vol. 66, No. 66/Thursday, April 5, 2001. Francisco Posada, Zifei Yang, and Rachel Muncrief, (2015). Review of Current Practices and New De-velopments in Heavy-Duty Vehicle Inspection and Maintenance Programs. White Paper, International Council on Clean Transportation, ICCT 2015. https://theicct.org/sites/default/files/publications/HDV%20insp-maint%20White%20Paper%20v2.pdf CARB, (2019). CARB Heavy-Duty Inspection and Maintenance Program, accessed on 12.4.2020 https://ww2.arb.ca.gov/our-work/programs/heavy-duty-diesel-inspection-periodic-smoke-inspection-program Sierra, (2009). Evaluation of the California Smog Check Program Using Random Roadside Data, Re-port No. SR09-03-01, Sierra Research, Inc., March 12, 2009, 71 p. https://ww3.arb.ca.gov/msprog/smogcheck/march09/roadsidereport.pdf BAR, (2000). Roadside Inspection Program, Smog Check Performance Evaluation Report 2000-02, Bureau of Automotive Repair, February 9, 2000, 22 p. https://www.epa.gov/sites/production/files/2016-06/documents/roadside.pdf Leisha Dehart-Davis, Elizabeth Corley, Michael O. Rodgers, (2002). Evaluating Vehicle Inspec-tion/Maintenance Programs Using On-Road Emissions Data: The Atlanta Reference Method, Volume: 26 issue: 2, page(s): 111-146; April 1, 2002. https://doi.org/10.1177/0193841X02026002001 Scott Washburn, Joseph Seet, Fred Mannering, (2001). Statistical modeling of vehicle emissions from inspection/maintenance testing data: an exploratory analysis; Transportation Research Part D: Transport and Environment, Volume 6, Issue 1, January 2001, Pages 21-36.

105 MODALES D2.2 Real effectiveness of OBD inspection and maintenance, and retrofit Version 1.0 Date 31/08/2020
https://doi.org/10.1016/S1361-9209(00)00011-0 Eisinger, D.S. (2005). Evaluating Inspection and Maintenance Programs: A Policy-Making Framework. Journal of the Air & Waste Management Association, 55, 147-162. https://doi.org/10.1080/10473289.2005.10464609 Samoylov, Alex V., (2013). Improvement of the Efficiency of Vehicle Inspection and Maintenance Programs through Incorporation of Vehicle Remote Sensing Data and Vehicle Characteristics http://hdl.handle.net/1853/50410 Nicholas J. Sanders, Ryan Sandler, (2017); Technology and The Effectiveness of Regulatory Programs Over Time: Vehicle Emissions and Smog Checks With a Changing Fleet, Working Paper 23966, Na-tional Bureau of Economic Research, Cambridge, MA, October 2017 https://www.nber.org/papers/w23966.pdf Harrington, W., (1997). Fuel Economy and Motor Vehicle Emissions. Journal of Environmental Eco-nomics and Management, 33, 240-252. https://doi.org/10.1006/jeem.1997.0994 Winston Harrington, Virginia McConnell, Amy Ando, (2000). Are vehicle emission inspection pro-grams living up to expectations? Transportation Research Part D: Transport and Environment, Vol-ume 5, Issue 3, May 2000, Pages 153-172; https://doi.org/10.1016/S1361-9209(99)00029-2 Moghadam, Arian Khaleghi; Livernois, John, (2010). The abatement cost function for a representative vehicle inspection and maintenance program, Transportation Research Part D: Transport and Envi-ronment; Volume 15, Issue 5, July 2010, Pages 285-297, https://doi.org/10.1016/j.trd.2010.02.009 Bin, Okmyung, (2003). A logit analysis of vehicle emissions using inspection and maintenance testing data; Transportation Research Part D: Transport and Environment; Volume 8, Issue 3, May 2003, Pages 215-227. https://doi.org/10.1016/S1361-9209(03)00004-X Ying Li, (2017). Evaluating and Improving the Effectiveness of Vehicle Inspection and Maintenance Programs: A Cost-Benefit Analysis Framework. Journal of Environmental Protection Vol. 08 No.12 (2017), Article ID:80670, 26 pages. 10.4236/jep.2017.812095 Pierre Mérel, Aaron Smith, Jeffrey Williams, Emily Wimberger, (2014). Cars on crutches: How much abatement do smog check repairs actually provide? J. Environ. Econ. Manage., 67 (2014), pp. 371-395 https://doi.org/10.1016/j.jeem.2013.12.006 Ryan J Wessel, (2020). Policing the poor: The impact of vehicle emissions inspection programs across income; Transportation Research Part D: Transport and Environment; Volume 78, January 2020, 102207. https://doi.org/10.1016/j.trd.2019.102207 Harrington, W, McConnell, V, (2007). Controlling Automobile Air Pollution, International library of environmental economics and policy. Aldershot, England; Burlington, VT; Ashgate, 2007. 546 p. https://doi.org/10.4324/9781351161084 EPA, (2020b). Vehicle Emissions California Waivers and Authorizations, accessed 1.7.2020. https://www.epa.gov/state-and-local-transportation/vehicle-emissions-california-waivers-and-authorizations EU, (2014a). Directive 2014/45/EU http://data.europa.eu/eli/dir/2014/45/oj
106 MODALES D2.2 Real effectiveness of OBD inspection and maintenance, and retrofit Version 1.0 Date 31/08/2020
EU, (2014b). Directive 2014/47/EU http://data.europa.eu/eli/dir/2014/47/oj EC, 2012. ROADWORTHINESS PACKAGE - IMPACT ASSESSMENT - SWD(2012) 206 Final https://ec.europa.eu/transport/road_safety/sites/roadsafety/files/pdf/road_worthiness_package/impact_assessment_en.pdf Summary of Impact Assessment; COM(2012) 380 final {SWD(2012) 206 final} Brussels, 13.7.2012 AUTOFORE, (2007). AUTOFORE: Study on the Future Options for Roadworthiness Enforcement in the European Union, CITA 2007. 42 p + Appendix 17p. https://citainsp.org/wp-content/uploads/2016/01/Autofore_Final_report_without_links.pdf AO-II, (2000). Auto-Oil 2000 - The Auto-Oil II Programme, Final report, the Directorates General for Economic and Financial Affairs, Enterprise, Energy and Transport, Environment, Research, and Taxa-tion and Customs Union with the support of the Joint Research Centre, 2000. https://ec.europa.eu/environment/archives/autooil/pdf/auto-oil_en.pdf CITA, (2002). Second CITA Programme on Emission Testing at Periodic and Other Inspections Pro-gramme Summary Report Brussels, CITA/2E-RSP/SR/Final; CITA 2002. 16 p + Annex 1 p. https://citainsp.org/wp-content/uploads/2016/01/2E-RSP-ProgrammeSummaryReport.pdf CITA, (2011). Paul Boulter; Günter Afflerbach, Pascal Buekenhoudt, Christian Förster, Peter Stricker, Michael Horn, Hans-Jürgen Mäurer, Axel Richter, Christoph Nolte, David Weissenberger, Thomas Ost, Wim Labro, Wolfgang H Schulz, Ron Oliver, Kai-Uwe Weitz: TEDDIE - A new roadworthiness emission test for diesel, vehicles involving NO, NO2 and PM measurements Final Report; CITA, Brussels, 2011. https://citainsp.org/wp-content/uploads/2016/01/teddie_final_report.pdf CITA, (2015). Tim Barlow, Gerhard Müller, Hans-Jürgen Mäurer, Pascal Buekenhoudt, Prof. Dr. Wolf-gang H. Schulz, Isabella Geis, Antonio Multari, Georges Petelet: SET - Sustainable Emissions Test - Final Report; CITA 2015. 103 p. https://citainsp.org/wp-content/uploads/2016/01/CITA-SET-Study-Sept-2015.pdf CITA, (2019). Pascal Buekenhoudt, Gerhard Müller, Hans-Jürgen Mäurer, Antonio Sánchez González, John Stephenson, Antonio Multari, Georges Pettelet, Wolfgang H. Schulz: CITA SET II Project Sustain-able Emission Test for diesel vehicles involving NOx measurements, Final Report; CITA 2019. https://citainsp.org/wp-content/uploads/2019/03/SET-II.pdf Latham, S., (2007). An innovative dynamometer: free-running rollers to provide a potential cheap representative roadside emission procedure. TRL report PPR 216. TRL Limited, Wokingham, United Kingdom. 71 p. 978-1-84608-840-7; retrieved on 16.04.2020 from https://trl.co.uk/reports/PPR216 Kadijk, G., (2015). Roadworthiness Test Investigations of Diesel Particulate Filters, Report TNO 2013 R10160 v3, June 2015, 30 p. Kadijk, G., Ligterink, N.E., Mensch, P. van, Spreen, J.S., Vermeulen, R.J., Vonk, W.A., (2015). Emissions of Nitrogen Oxides and Particulates of Diesel Vehicles. Report TNO 2015 R10838, June 2015, 16 p. Norbert E. Ligterink, Gerrit Kadijk, Pim van Mensch, Richard Smokers, (2016). NOx emissions of Euro 5 and Euro 6 diesel passenger cars – test results in the lab and on the road; Report TNO 2016 10083; March 2016. 33 p. DOI: 10.13140/RG.2.2.30386.61126.
107 MODALES D2.2 Real effectiveness of OBD inspection and maintenance, and retrofit Version 1.0 Date 31/08/2020
Kadijk, G., Spreen, J.G., Mark, P.J. van der, (2016). Diesel Particulate Filters for Light-Duty Vehicles: Operation, Maintenance, Repair and Inspection. Report TNO 2016 R10958; July 2016, 20 p. J.S. Spreen, G. Kadijk, R.J. Vermeulen, V.A.M. Heijne, N.E. Ligterink, U. Stelwagen, R.T.M. Smokers, P.J. van der Mark, G. Geilenkirchen, (2016). Assessment of road vehicle emissions: methodology of the Dutch in-service testing programmes; Report TNO 2016 R11178v2, October 2016, 86 p. G Kadijk, M. Elstgeest, N.E. Ligterink, P.J. van der Mark, (2017). Investigation into a Periodic Technical Inspection (PTI) test method to check for presence and proper functioning of Diesel Particulate Filters in light-duty diesel vehicles – part 2, Report TNO 2017a R10530, May 2017, 85 p. G. Kadijk, A. Mayer, (2017b). NPTI – the New Periodic Technical Inspection emission test procedure for vehicles with emission control systems. White Paper, Zürich, ETH Conference June 20st, 2017b. 12 p. Riemersma, I.J.R., Rijkeboer, R.C., Jordaan, K, (2000). Final Report In-Use Compliance Programme, Trucks 1998 – 2000, TNO report nr. 00.OR.VM.077.1/IJR, November 2000. Riemersma, I.J.R, Vermeulen, R.J., (2009). Final Report on the In Use Testing Program for Heavy Duty Vehicles 2001-2006, TNO report nr. MON-RPT-033-DTS-2009-00038, January 8, 2009. R.J. Vermeulen W.A. Vonk R.N. van Gijlswijk E.G. Buskermolen, (2016). The Netherlands In-Service Emissions Testing Programme for Heavy-Duty Vehicles 2015-2016 – Annual report; Report TNO 2016 R11270, 41 p. Vermeulen, R.J., Ligterink N.E., Vonk W.A., Baarbé H.L., (2012). A smart and robust NOx emission evaluation tool for the environmental screening of heavy-duty vehicles, TAP Paper 49, 19th Interna-tional Transport and Air Pollution Conference 2012, Thessaloniki, Greece. 11 p. Rostedt, A., Marjamäki, M., Yli-Ojanperä, J., Keskinen, J., Janka, K., Niemelä, V. and Ukkonen, A. (2009). Non-Collecting Electrical Sensor for Particle Concentration Measurement. Aerosol Air Qual. Res. 9: 470-477. doi: 10.4209/aaqr.2009.03.0023. David Bilby, David J. Kubinski, M. Matti Maricq, (2016). Current amplification in an electrostatic trap by soot dendrite growth and fragmentation: Application to soot sensors; Journal of Aerosol Science, Volume 98, August 2016, Pages 41-58. https://doi.org/10.1016/j.jaerosci.2016.03.003 Amanatidis, Stavros, M. Matti Maricq, Leonidas Ntziachristos, and Zissis Samaras, 2016. Measuring Number, Mass, and Size of Exhaust Particles with Diffusion Chargers: The Dual Pegasor Particle Sen-sor. Journal of Aerosol Science 92: 1–15. https://doi.org/10.1016/j.jaerosci.2015.10.005 Rostedt, A., Ntziachristos, L., Simonen, P., Rönkkö, T. et al., (107). A New Miniaturized Sensor for Ultra-Fast On-Board Soot Concentration Measurements, SAE Int. J. Engines 10(4):1859-1865, 2017, https://doi.org/10.4271/2017-01-1008. M. Matti Maricq, David Bilby, (2018). The impact of voltage and flow on the electrostatic soot sensor and the implications for its use as a diesel particulate filter monitor, Journal of Aerosol Science 124:41-53, October 2018, DOI: 10.1016/j.jaerosci.2018.07.002
108 MODALES D2.2 Real effectiveness of OBD inspection and maintenance, and retrofit Version 1.0 Date 31/08/2020
D. Kontses, S. Geivanidis and Z. Samaras, (2019). Review of Legislative Requirements and Methods for the Estimation of PN/PM Emissions for Advanced Light-duty OBD Applications, 23rd Transport and Air Pollution Conference, Thessaloniki, Greece, 2019. 12 p. François Boveroux, Séverine Cassiers, Pascal Buekenhoudt Francesco Contino, Laurent Chavatte, Philippe De Meyer, Hervé Jeanmart, Sebastian Verhelst, (2019). Feasibility Study of a New Test Pro-cedure to Identify High Emitters of Particulate Matter during Periodic Technical Inspection, SAE Technical Paper 2019-01-1190, April 2019, DOI:10.4271/2019-01-1190 H. Burtscher, T. Lutz, and A. Mayer, (2019). A New Periodic Technical Inspection for Particle Emis-sions of Vehicles, Emiss. Control Sci. Technol., vol. 5, no. 3, pp. 279–287, Sep. 2019. DOI: 10.1007/s40825-019-00128-z Williams, Martin; Minjares, Ray, (2016). A Technical Summary of Euro 6/Vi Vehicle Emission Stand-ards. The Briefing Paper, ICCT 2016, 12 p. Continental, (2019). Worldwide Emission Standards and Related Regulations Passenger Cars / Light and Medium Duty Vehicles, May 2019. Continental Automotive, 2019 https://www.continental-automotive.com/getattachment/8f2dedad-b510-4672-a005-3156f77d1f85/EMISSIONBOOKLET_2019.pdf Gary A. Bishop, John R. Starkey, Anne Ihlenfeldt, Walter J. Williams, Donald H Stedman, (1989). IR Long-Path Photometry: A Remote Sensing Tool for Automobile Emissions, Analytical Chemistry 61(10): 671A-677A, May 1989. DOI: 10.1021/ac00185a002 Guenther, P. L.; Stedman, D. H.; Bishop, G. A.; Bean, J. H.; Quine, R. W., (1995). A hydrocarbon detec-tor for the remote sensing of vehicle emissions. Review of Scientific Instruments 66, 3024 (1995); https://doi.org/10.1063/1.1146498 Donald H Stedman, G. A. Bishop, (1989). Automobile Carbon-Monoxide Emission Inventory Using Remote Sensing, University of Denver, Denver, CO, January 1989. Stedman and Bishop, (1996). Measuring the Emissions of Passing Cars, Accounts of Chemical Re-search, 29(10), p. 489, 1996. Stedman, Bishop, Aldrete, Slott, (1997). On-Road Evaluation of an Automobile Emission Test Pro-gram, ES&T., 31, p. 927, 1997. Stedman, Bishop, Slott, (1998). (Repair Avoidance and Evaluating Inspection and Maintenance Pro-grams, ES&T, 32, p. 1544, 1998. Gary A. Bishop and Molly J. Haugen, (2018). The Story of Ever Diminishing Vehicle Tailpipe Emissions as Observed in the Chicago, Illinois Area. Environ. Sci. Technol. 2018, 52, 7587−7593, DOI:10.1021/acs.est.8b00926 Gary A. Bishop, (2019). Three decades of on-road mobile source emissions reductions in South Los Angeles. Journal of the Air & Waste Management Association 2019, 69 (8), 967-976. DOI: 10.1080/10962247.2019.1611677

109 MODALES D2.2 Real effectiveness of OBD inspection and maintenance, and retrofit Version 1.0 Date 31/08/2020
(ICCT 2018) Jens Borken-Kleefeld and Tim Dallmann; Remote Sensing of Motor Vehicle Exhaust Emis-sions; International Council on Clean Transportation, ICCT 2018; 40 p. Åke Sjödin, (1994). On-Road Emission Performance of Late-Model TWC-Cars as Measured by Remote Sensing; Air & Waste 44, no. 4, April 1994: 397–404; https://doi.org/10.1080/1073161X.1994.10467261 (ICCT 2019) Yoann Bernard, John German, Rachel Muncrief; Worldwide Use of Remote Sensing to Measure Motor Vehicle Emissions; International Council on Clean Transportation, ICCT 2019; 21 p. D.D. Nelson, M.S. Zahniser, J.B. McManus, C.E. Kolb, J.L. Jiménez, (1998). A Tunable Diode Laser Sys-tem for the Remote Sensing of On-Road Vehicle Emissions, Applied Physics B 67, no. 4 (October 1, 1998): 433–41, https://doi.org/10.1007/s003400050527 Karl Ropkins, Timothy H. DeFries, Francis Pope, David C. Green, Jim Kemper, Sandeep Kishan, Gary W. Fuller, Hu Li, Jim Sidebottome, Leigh R. Crilley, Louisa Kramer, William J. Bloss, J. Stewart Hager, (2017). Evaluation of EDAR vehicle emissions remote sensing technology; Science of The Total Envi-ronment, Volume 609, 31 December 2017, Pages 1464-1474, https://doi.org/10.1016/j.scitotenv.2017.07.137 Xing Wang et al., (2012). On-Road Diesel Vehicle Emission Factors for Nitrogen Oxides and Black Car-bon in Two Chinese Cities; Atmospheric Environment 46 (January 1, 2012): 45–55, https://doi.org/10.1016/j.atmosenv.2011.10.033 Liisa Pirjola, Aleš Dittrichm, Jarkko V. Niemi, Sanna Saarikoski, Hilkka Timonen, Heino Kuuluvainen, Anssi Järvinen, Anu Kousa, Topi Rönkkö, Risto Hillamo, (2016). Physical and Chemical Characteriza-tion of Real-World Particle Number and Mass Emissions from City Buses in Finland; Environmental Science & Technology 50, no. 1 (January 5, 2016): 294–304, https://doi.org/10.1021/acs.est.5b04105 I. Ježek, T. Katrašnik, D. Westerdahl and G. Mocnik, (2015). Black Carbon, Particle Number Concentra-tion and Nitrogen Oxide Emission Factors of Random In-Use Vehicles Measured with the on-Road Chasing Method, Atmospheric Chemistry and Physics 15, no. 19 (October 5, 2015): 11011–26, https://doi.org/10.5194/acp-15-11011-2015 Peitzmeier, C., Loschke, C., Wiedenhaus, H. et al., (2017) Real-world vehicle emissions as measured by in situ analysis of exhaust plumes. Environ Sci Pollut Res 24, 23279–23289 (2017). https://doi.org/10.1007/s11356-017-9941-1 Yuche Chen, Jens Borken-Kleefel, (2014). Real-driving emissions from cars and light commercial vehi-cles – Results from 13 years remote sensing at Zurich/CH, Atmospheric Environment, Vol 88, May 2014, Pages 157-164, https://doi.org/10.1016/j.atmosenv.2014.01.040 Jens Borken-Kleefeld et al., (2018). Comparing Emission Rates Derived from Remote Sensing with PEMS and Chassis Dynamometer Tests—CONOX Task 1 Report; Federal Office for the Environment, Switzerland, May 2018. https://www.ivl.se/download/18.2aa26978160972788071cd7b/1529408235244/comparing-emissionrates-derived-from-remote-sensing-with-pems-and-chassis-dynamometer-tests-conox-task1-report.pdf
110 MODALES D2.2 Real effectiveness of OBD inspection and maintenance, and retrofit Version 1.0 Date 31/08/2020
Å Sjödin et al., (2018). Real-Driving Emissions from Diesel Passenger Cars Measured by Remote Sens-ing and as Compared with PEMS and Chassis Dynamometer Measurements—CONOX Task 2 Report; Federal Office for the Environment, Switzerland, May 2018. https://www.ivl.se/download/18.2aa26978160972788071cd79/1529407789751/real-driving-emissions-from-diesel-passengers-cars-measured-by-remote-sensingand-as-compared-with-pems-and-chassis-dynamometer-measurements-conox-task-2-r.pdf Jens Borken-Kleefeld et al., (2018b). Contribution of Vehicle Remote Sensing to In-Service/Real Driv-ing Emissions Monitoring—CONOX Task 3 Report; Federal Office for the Environment, Switzerland, May 2018. https://www.ivl.se/download/18.2aa26978160972788071cd7b/1529408235244/comparing-emission-rates-derivedfrom-remote-sensing-with-pems-and-chassis-dynamometer-tests-conox-task1-report.pdf
Tim Dallmann, Yoann Bernard, Uwe Tietge, Rachel Muncrief, (2018); Remote sensing of motor vehi-cle emissions in London. The Real Urban Emissions (TRUE) Initiative, November 2018, 26 p. https://theicct.org/publications/true-london-dec2018 Tim Dallmann, Yoann Bernard, Uwe Tietge, Rachel Muncrief, (2019). Remote sensing of motor vehi-cle emissions in Paris; The Real Urban Emissions (TRUE) Initiative; September 2019, 44 p. https://theicct.org/sites/default/files/publications/TRUE_ParisRS_study_20190909.pdf
Reference for Chapter 3 (OBD protocols) 7.2
Strang, T., Röckl, M., (2008). “Vehicle Networks - CAN-based Higher Layer Protocols”, Lecture Vehicle Networks WS 2008/2009, STI Innsbruck/University of Innsbruck, online: https://www.sti-innsbruck.at/sites/default/files/courses/fileadmin/documents/vn-ws0809/03-vn-CAN-HLP.pdf Fellmeth, P. and Sohnle, H., (2010). „Quo Vadis SAE J1939”, Elektronik automotive 12.2010, pp 22-25, article in German language, online: https://assets.vector.com/cms/content/know-how/_technical-articles/commercial_vehicles/ Quo_Vadis_J1939_ElektronikAutomotive_201012_PressArticle_DE.pdf Junger, M., (2010). “Introduction to J1939”, Version 1.1 2010-04-27, Vector, online: https://assets.vector.com/cms/content/know-how/_application-notes/AN-ION-1-3100_Introduction_to_J1939.pdf Frank, H., (2012). „Diagnosewerkzeuge für WWH-OBD“, Automobil Elektronik 04/2012, pp 18-19, article in German language, online: https://assets.vector.com/cms/content/know-how/_technical-articles/diagnostics/WWH_OBD_AEL_201208_PressArticle_DE.pdf Potter, G., (2012). “WWH-OBD - The Road Less Travelled... - World Wide Harmonization of On-Board Diagnostics”, Automotive Testing Expo 2012, October 23, https://www.ukintpress-conferences.com/uploads/SPTXNA12/Day1_2_Greg_Potter.pdf Alvear, O., Calafate, C.T., Cano, J.-C., and Manzoni, P., (2014). “VEWE: A Vehicle ECU Wireless Emula-tion Tool Supporting OBD-II Communication and Geopositioning”, S. Guo et al. (Eds.): ADHOC-NOW 2014, LNCS 8487, pp. 432–445, 2014. Springer International Publishing Switzerland 2014 CAN Newsletter, (2015). “CAN in Automation: CAN FD and the CRC issue”, CAN Newsletter 1/2015, pp 4-14, online: https://can-newsletter.org/uploads/media/raw/e6cbd155b5f394b2d9edefed962ce0eb.pdf
111 MODALES D2.2 Real effectiveness of OBD inspection and maintenance, and retrofit Version 1.0 Date 31/08/2020
Slavskaya, P., (2017). “Vehicle bus ISO/OSI model visualized“, Oct 12, 2017, online: https://medium.com/@thrashmetalsoul/vehicle-bus-iso-osi-model-visialized-d47460bc158f Cook, J. A., Freudenberg, J. S., (2019). „Controller Area Network (CAN)“, EECS 461, revised September 2019, Electrical Engineering and Computer Science (EECS), University of Michigan, online https://www.eecs.umich.edu/courses/eecs461/doc/CAN_notes.pdf / https://ethz.ch/content/dam/ethz/special-interest/mavt/dynamic-systems-n-control/idsc-dam/Lectures/Embedded-Control-Systems/LectureNotes/CAN_NXP_S32K.pdf CSS Electronic, (2020a). “CAN Bus Explained - A Simple Intro (2020)”, Online: https://www.csselectronics.com/screen/page/simple-intro-to-can-bus/language/en CSS Electronic, (2020b). “J1939 Explained - A Simple Intro (2020)”, online: https://www.csselectronics.com/screen/page/simple-intro-j1939-explained CSS Electronic, (2020c). “OBD2 Explained - A Simple Intro (2020)”, Online: https://www.csselectronics.com/screen/page/simple-intro-obd2-explained CSS Electronic, (2020d). “A Simple Intro to CAN FD”, online: https://www.csselectronics.com/screen/page/can-fd-flexible-data-rate-intro/language/en Ixxat, (2020). “SAE J1939 - All you need for development and production.”, online: https://www.ixxat.com/technologies/fieldbuses/sae-j1939 Wikipedia, (2020a). “OBD-II PIDs”, online: https://en.wikipedia.org/wiki/OBD-II_PIDs Wikipedia, (2020b). “Unified Diagnostic Services“, online: https://en.wikipedia.org/wiki/Unified_Diagnostic_Services California Air Resource Board – CARB, (2020). “On-Board Diagnostic II (OBD II) Systems Fact Sheet”, online: https://ww2.arb.ca.gov/resources/fact-sheets/board-diagnostic-ii-obd-ii-systems-fact-sheet
References for Chapter 4 (Performance of OBD in detecting malfunctions) 7.3
Francisco Posada, Zifei Yang, Rachel Muncrief, (2015). Review of Current Practices and New Devel-
opments in Heavy-Duty Vehicle Inspection and Maintenance Programs The International Council on
Clean Transportation.
http://www.theicct.org/review-current-practices-and-new-developments-heavy-duty-vehicle-
inspection-andmaintenance-programs.
Sarah Chambliss, Ray Minjares, Anup Bandivadekar; (2016). On-Board Diagnostic (OBD) Checks for
Inspection and Maintenance in India. ICCT, The International Council On Clean Trasportation, June
2016.
Webster et al. (2007). United States, Patent Application. Pub. No.: US 2007/0073458 A1. Pub. Date:
Mar. 29, 2007

112 MODALES D2.2 Real effectiveness of OBD inspection and maintenance, and retrofit Version 1.0 Date 31/08/2020
U.S. EPA, (2001). Performing Onboard Diagnostic System Checks as Part of a Vehicle Inspection and
Maintenance Program, http://www3.epa.gov/obd/r01015.pdf
U.S. EPA. (2005). Regulations Requiring Onboard Diagnostic Systems on 2010 and Later Heavy-Duty
Engines Used in Highway Vehicles Over 14,000 Pounds; Revisions to Onboard Diagnostic Require-
ments for Diesel Highway Vehicles Under 14,000 Pounds. Summary and Analysis of Comments,
http://www3.epa.gov/obd/regtech/420r08018.pdf.
Posada, F, and German, J. (2016). Review of LDV OBD requirements under the European, Korean and
Californian emission programs. The International Council on Clean Transportation. Retrieved from
http://www.theicct.org/review-ldv-obd-requirements-under-european-korean-and-californian-
emission-programs.
U.S.EPA (2001). United States, Environmental Protection Agency (EPA). Performing Onboard Diagnos-
tic System Checks as Part of a Vehicle Inspection and Maintenance Program. EPA420-R-01-015, June
2001
Medashe, Michael; Oluwaseyi, Abolarin; Matthew Sunday, (2020). Specifications and Analysis of Dig-
itized Diagnostics of Automobiles: A Case Study of on Board Diagnostic (OBD II). International Journal
of Engineering Research & Technology (IJERT). ISSN: 2278-0181. Vol. 9 Issue 01, January-2020.
MODULE 4 – Vehicle Emissions Inspection, Diagnostic and Repair Information. Massachusetts Vehicle
Check. https://www.mavehiclecheck.com/repair-industry-helpful-tools-and-resources
Jheng-Syu Jhou and Shi-Huang Chen, (2014). The implementation of OBD-II vehicle diagnostic system
integrated with cloud computation technology. Intelligent Data Analyss and Its Applications, Volume
I, Advances in Intelligent Systems and Computing 297, 2014
Nils Hooftman, (2019). “uCARe” Project, You Can Always Reduce Emissions. Deliverable number D1.3
Tampering, Issue date: 19-12-2019.
Frank Acevedo and Cody Yarbrough, (2019). Tampering & Aftermarket Defeat Devices. Midwest
Clean Diesel Initiative Steering Committee Meeting. April 25, 2019
Geilen et al., (2014), United States, Patent Application. Patent No.: US 8,666,588 B2. Date of Patent:
Mar. 4, 2014
References for Chapter 5 (Retrofits) 7.4
CVRC, 2019 Clean Vehicle Retrofit Certification (CVRC), 2019, Chassis Dynamometer Test Proce-
dures for Approval of Low Emission Adaptations. The Energy Saving Trust (EST), UK.
https://energysavingtrust.org.uk/sites/default/files/CAZ%20CVRC%20Chassis%20DynamometerTest
%20Procedures%20for%20Low%20Emission%20Adaptations%20v11.0%2023Sep2019.pdf
113 MODALES D2.2 Real effectiveness of OBD inspection and maintenance, and retrofit Version 1.0 Date 31/08/2020
For more information:
MODALES Project Coordinator
ERTICO - ITS Europe
Avenue Louise 326
1050 Brussels, Belgium
www.modales-project.eu
This project has received funding from the European Union’s Horizon 2020 research
and innovation programme under grant agreement No 815189.