Microfiltration tangentielle appliquée à l'oenologie ...
235
Transcript of Microfiltration tangentielle appliquée à l'oenologie ...
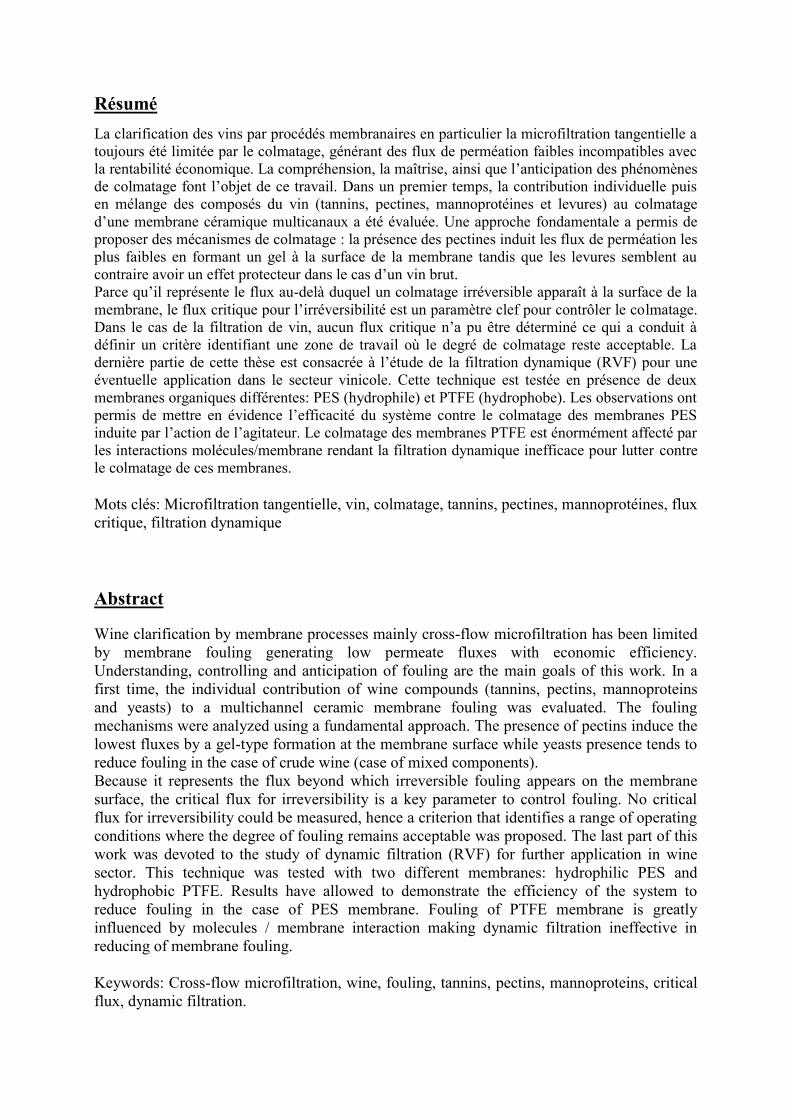
Résumé La clarification des vins par procédés membranaires en particulier la microfiltration tangentielle a toujours été limitée par le colmatage, générant des flux de perméation faibles incompatibles avec la rentabilité économique. La compréhension, la maîtrise, ainsi que l’anticipation des phénomènes de colmatage font l’objet de ce travail. Dans un premier temps, la contribution individuelle puis en mélange des composés du vin (tannins, pectines, mannoprotéines et levures) au colmatage d’une membrane céramique multicanaux a été évaluée. Une approche fondamentale a permis de proposer des mécanismes de colmatage : la présence des pectines induit les flux de perméation les plus faibles en formant un gel à la surface de la membrane tandis que les levures semblent au contraire avoir un effet protecteur dans le cas d’un vin brut. Parce qu’il représente le flux au-delà duquel un colmatage irréversible apparaît à la surface de la membrane, le flux critique pour l’irréversibilité est un paramètre clef pour contrôler le colmatage. Dans le cas de la filtration de vin, aucun flux critique n’a pu être déterminé ce qui a conduit à définir un critère identifiant une zone de travail où le degré de colmatage reste acceptable. La dernière partie de cette thèse est consacrée à l’étude de la filtration dynamique (RVF) pour une éventuelle application dans le secteur vinicole. Cette technique est testée en présence de deux membranes organiques différentes: PES (hydrophile) et PTFE (hydrophobe). Les observations ont permis de mettre en évidence l’efficacité du système contre le colmatage des membranes PES induite par l’action de l’agitateur. Le colmatage des membranes PTFE est énormément affecté par les interactions molécules/membrane rendant la filtration dynamique inefficace pour lutter contre le colmatage de ces membranes. Mots clés: Microfiltration tangentielle, vin, colmatage, tannins, pectines, mannoprotéines, flux critique, filtration dynamique
Abstract
Wine clarification by membrane processes mainly cross-flow microfiltration has been limited by membrane fouling generating low permeate fluxes with economic efficiency. Understanding, controlling and anticipation of fouling are the main goals of this work. In a first time, the individual contribution of wine compounds (tannins, pectins, mannoproteins and yeasts) to a multichannel ceramic membrane fouling was evaluated. The fouling mechanisms were analyzed using a fundamental approach. The presence of pectins induce the lowest fluxes by a gel-type formation at the membrane surface while yeasts presence tends to reduce fouling in the case of crude wine (case of mixed components). Because it represents the flux beyond which irreversible fouling appears on the membrane surface, the critical flux for irreversibility is a key parameter to control fouling. No critical flux for irreversibility could be measured, hence a criterion that identifies a range of operating conditions where the degree of fouling remains acceptable was proposed. The last part of this work was devoted to the study of dynamic filtration (RVF) for further application in wine sector. This technique was tested with two different membranes: hydrophilic PES and hydrophobic PTFE. Results have allowed to demonstrate the efficiency of the system to reduce fouling in the case of PES membrane. Fouling of PTFE membrane is greatly influenced by molecules / membrane interaction making dynamic filtration ineffective in reducing of membrane fouling. Keywords: Cross-flow microfiltration, wine, fouling, tannins, pectins, mannoproteins, critical flux, dynamic filtration.
Cette thèse s’est déroulée au Laboratoire de Génie Chimique de Toulouse, au sein du département Bioprocédés et Systèmes Microbiens (BioSyM). Je souhaite donc tout d’abord remercier Joël BERTRAND, Pierre AIMAR et Béatrice BISCANS directeurs du laboratoire, de m’avoir accueilli au cours de ces trois années. Ces travaux de recherche se sont déroulés dans le cadre d’une collaboration entre le Laboratoire de Génie Chimique et l’équipe procédés de la faculté d’œnologie de Bordeaux en partenariat avec la société PERA. Je remercie Xavier PERA pour le soutien financier de la thèse ainsi que Jean Luc FAVAREL et Aude BESSIERE pour leur soutien technique et scientique pendant les travaux. J’associe à ces remerciements l’ensemble du personnel de PERA pour l’aide apportée tout au long de cette thèse. La direction de ce travail a été assurée par Claire ALBASI et Audrey DEVATINE que je remercie pour le recul qu’elles ont su apporter ainsi que pour les discussions scientifiques que nous avons eues et qui m’ont beaucoup appris, notamment à avoir un regard critique et à se poser toujours la question de la pertinence de l’objectif fixé. Je tiens également à les remercier aussi pour leurs disponibilités tout au long de ces trois années, en particulier lorsque je me suis confronté aux doutes. Je tiens egalement à souligner la grande confiance qu’elles m’ont accordée ainsi que les opportunités de collaborations avec des partenaires nationaux qu’elles m’ont offertes. Je tiens à remercier Martine MIETTON-PEUCHOT d’avoir présidé le jury de soutenance ainsi que pour les discussions scientifiques pendant ces trois années de thèse. Je tiens à exprimer ma gratitude à Carme GUELL-SAPERAS et Marie PIERRE-BELLEVILLE d’avoir accepté de lire et juger ce travail en tant que rapporteurs. Je remercie également Patrice BACCHIN, Geneviève GESAN-GUIZIOU et Jean-Luc FAVAREL d’avoir accepté de siéger au jury de cette thèse. Un grand merci à Patricia TAILLANDIER pour son apport scientifique en ce qui concerne la chimie du vin ; mais aussi pour sa confiance en moi et pour l’opportunité qu’elle m’a offerte pour découvrir le monde de l’enseignement. J’exprime ma gratitude à Patrice BACCHIN pour son apport scientifique en ce qui concerne la physico-chimie des solutions, la pression osmotique et les flux critiques. Je lui suis très reconnaissant pour son savoir qu’il a su me faire partarger. Je tiens à remercier aussi Luc FILLAUDEAU d’avoir accpeté de nous prêter gracieusement le pilote de filtration dynamique ainsi de son aide et des ses conseils pour réaliser les filtrations dynamiques. Je voudrais remercier les responsables et le personnel de la cave coopérative de Rabastens spécialement Jean-Noel BARRAU et Cédric MONVIEL d’avoir pris soin de la cuve du vin stockée à la cave. Je tiens également à remercier Sébastien DURAND de Purpan pour l’analyse des composés phénoliques. Je tiens à remercier l’ensemble du personnel du laboratoire spécialement le service technique : Jean-louis Nadalin, Christine Rey-Rouch, Marie-Line Pern, Marie Morère et Bernard Gali. Je remercie aussi l’ensemble des permanents et doctorants qui ont rendu ces trois années très conviviales.
Je n’oublierai jamais les bons moments passés au laboratoire en compagnie de tous mes collègues. Une pensée plus particulière à Jordan, Etienne, Marjorie, Claudia, Omar, Noura, Laurence, Julien, Amandine, Raphaël, Diana, Joyce, Anne Laure, Marianne et Aurélie. Je remercie aussi la communauté libanaise de Toulouse : Georges, Joseph, Marlène, Fadi, Nadine, Phélomène, Hikmat, Micheline, Jack, Fares, Serge, Maha, William, Wissam, Rana, Rania et Nancy pour leur amitié. Pour finir, un merci dans égal à mes parents et mes sœurs pour votre soutien inconditionnel : sans vous rien n’était possible….
A ma famille et à tous qui ont cru en moi
Table des matières Nomenclature .............................................................................................................................. i
Liste des figures ........................................................................................................................ iii
Liste des tableaux ...................................................................................................................... ix
Introduction générale ............................................................................................................... 1
Chapitre I: Synthèse bibliographique .................................................................................... 5
Préambule ................................................................................................................................... 6
1. Introduction ............................................................................................................................ 9
2. Wine’s composition .............................................................................................................. 11
2.1. Wine colloids .......................................................................................................................... 12
2.1.1. Phenolic compounds ......................................................................................................... 12
2.1.2. Polysaccharides ................................................................................................................ 13
2.1.3. Proteins ............................................................................................................................. 14
2.2. Wine particles ......................................................................................................................... 15
2.2.1. Yeasts ............................................................................................................................... 15
2.2.2. Bacteria ............................................................................................................................. 15
2.2.3. Tartrate crystals ................................................................................................................ 16
2.2.4. Colloidal aggregates ......................................................................................................... 16
3. CFMF principle and its applications in oenology ................................................................ 17
3.1. Wine final filtration ................................................................................................................ 18
3.2. Other applications ................................................................................................................... 19
4. CFMF fouling mechanisms in oenology .............................................................................. 20
4.1. Mathematical description of fouling ...................................................................................... 23
4.2. Fouling by wine components .................................................................................................. 24
4.2.1. Fouling by wine colloids .................................................................................................. 25
4.2.1.1. Fouling by wine’s polysaccharides............................................................................ 27
4.2.1.2. Fouling by wine polyphenols .................................................................................... 28
4.2.1.3. Fouling by wine proteins ........................................................................................... 30
4.2.2. Fouling by wine particles ................................................................................................. 31
4.3. Parameters influencing membrane fouling ............................................................................. 33
4.3.1. Operating conditions ........................................................................................................ 33
4.3.1.1. Transmembrane pressure ........................................................................................... 33
4.3.1.2. Permeate flux ............................................................................................................. 34
4.3.1.3. Cross-flow velocity ................................................................................................... 35
4.3.1.4. Temperature ............................................................................................................... 36
4.3.2. Membrane characteristics ................................................................................................. 37
4.3.3. Fluid characteristics .......................................................................................................... 40
5. Membrane cleaning .............................................................................................................. 42
5.1. Hydraulic and mechanical techniques .................................................................................... 42
5.2. Chemical techniques ............................................................................................................... 43
6. Innovations and commercial proposal .................................................................................. 44
7. Conclusion ............................................................................................................................ 47
References ................................................................................................................................ 48
Conclusion du chapitre ............................................................................................................. 54
Chapitre II: Matériel et Méthodes ....................................................................................... 56
1. Matériel et procédure de filtration tangentielle .................................................................... 57
1.1. Pilote de filtration tangentielle ............................................................................................... 57
1.2. Membrane de microfiltration tangentielle .............................................................................. 60
2. Les vins expérimentaux ........................................................................................................ 61
3. Protocoles et conditions de filtrations .................................................................................. 62
3.1. Les filtrations tangentielles à pression constante ................................................................... 62
3.2. Détermination du flux critique ............................................................................................... 65
3.3. Les filtrations frontales ........................................................................................................... 67
3.4. Filtrations dynamiques ........................................................................................................... 68
4. Méthodes d’analyses des vins .............................................................................................. 68
4.1. Mesure de la turbidité ............................................................................................................. 68
4.2. Indice des polyphénols totaux ................................................................................................ 68
4.3. Les caractéristiques chromatiques du vin ............................................................................... 69
4.4. Dosage des anthocyanes totaux .............................................................................................. 69
4.5. Dosage des tanins totaux ........................................................................................................ 70
4.6. Dosage des tanins par UHPLC ............................................................................................... 71
4.7. Dosage des polysaccharides totaux ........................................................................................ 72
4.8. Granulométrie laser ................................................................................................................ 73
4.9. Mesure de viscosité dynamique .............................................................................................. 73
5. Culture de levures ................................................................................................................. 73
Références ................................................................................................................................ 75
Chapitre III: Molécules du vin et colmatage ...................................................................... 76
Préambule ................................................................................................................................. 77
Partie III.1 ................................................................................................................................. 79
1. Introduction ....................................................................................................................... 81
2. Theory ............................................................................................................................... 83
3. Materials and methods ...................................................................................................... 87
3.1. Red wine ................................................................................................................................. 87
3.2. Chemicals and yeast culture ................................................................................................... 87
3.3. Wine analytical ....................................................................................................................... 88
3.4. Cross-flow microfiltration pilot .............................................................................................. 88
3.5. Microfiltration experiments procedure ................................................................................... 90
3.5.1. Cross-flow filtrations ........................................................................................................ 90
3.5.2. Dead-end filtrations .......................................................................................................... 90
3.5.3. Chemical cleaning ............................................................................................................ 91
4. Results and discussion ...................................................................................................... 92
4.1. Impact of wine molecules ....................................................................................................... 92
4.1.1. Filtered Wine .................................................................................................................... 92
4.1.2. Impact of added tannins.................................................................................................... 93
4.1.3. Impact of added pectins .................................................................................................... 95
4.1.4. Impact of added mannoproteins ....................................................................................... 98
4.1.5. Impact of yeasts .............................................................................................................. 100
4.1.6. Analysis of the initial fluxes ........................................................................................... 102
4.2. Fouling analysis .................................................................................................................... 103
4.2.1. Fouling by tannins molecules ......................................................................................... 103
4.2.2. Fouling with wine polysaccharides ................................................................................ 106
4.3. Influence of CFMF on chemical composition of wines ......................................... 110
4.4. Initial turbidity: a factor for predicting microfiltration performance? .................................. 114
5. Conclusion ...................................................................................................................... 115
References .............................................................................................................................. 116
Partie III.2 ............................................................................................................................... 119
1. Introduction ..................................................................................................................... 120
2. Résultats et discussion .................................................................................................... 121
2.1. Incidence des lies de levures ................................................................................................ 121
2.2. Impact du vin brut ................................................................................................................ 123
3. Conclusion ...................................................................................................................... 129
Références .............................................................................................................................. 130
Chapitre IV: Conditions critiques de colmatage ............................................................... 132
Préambule ............................................................................................................................... 133
1. Introduction ........................................................................................................................ 135
2. Background ........................................................................................................................ 137
3. Materials and Methods ....................................................................................................... 140
3.1. Red wine ............................................................................................................................... 140
3.2. Chemicals ............................................................................................................................. 140
3.3. Wine components analysis ................................................................................................... 140
3.4. Experimental apparatus ........................................................................................................ 142
3.5. Critical flux determination: the method of SWB .................................................................. 144
3.6. Calculation method of the irreversible and reversible resistance ......................................... 145
4. Results ................................................................................................................................ 145
4.1. Determination of the critical flux for filtered wine (FW) ..................................................... 145
4.2. Effect of the added molecules .............................................................................................. 147
4.2.1. Impact of tannins on the evolution of the critical flux.................................................... 147
4.2.2 Impact of polysaccharides on the evolution of the critical flux ....................................... 149
5. Discussion .......................................................................................................................... 152
6. Conclusion .......................................................................................................................... 157
References .............................................................................................................................. 157
Conclusion du chapitre ........................................................................................................... 160
Chapitre V: Filtration Dynamique ..................................................................................... 161
1. Introduction ..................................................................................................................... 162
2. Matériel et Méthodes ...................................................................................................... 164
2.1. Pilote de filtration dynamique ..................................................................................... 164
2.2. Module de filtration dynamique RVF et membranes ........................................................... 167
2.3. Fluides filtrés et protocoles expérimentaux .......................................................................... 168
3. Résultats et discussion .................................................................................................... 169
3.1. Pertes de charge linéiques et pressions transmembranaires imposée, locale et moyenne .... 169
3.2. Perméabilités à l’eau ............................................................................................................. 171
3.3. Vin filtré ............................................................................................................................... 173
3.4. Vin brut (VF + Mél. A) ........................................................................................................ 176
4. Conclusion ...................................................................................................................... 182
Références .............................................................................................................................. 183
Conclusions générales et perspectives .......................................................................... 185
REFERENCES ....................................................................................................................... 191
ANNEXE I : Compression osmotique et filtration ................................................................ 203
III. Résultats ........................................................................................................................... 207
ANNEXE II: Chromatogrammes de Thiolyse ....................................................................... 209
ANNEXE III : Résultats de la Granulométrie ........................................................................ 212
ANNEXE IV: Viscosité du vin .............................................................................................. 214
i
Nomenclature
A Surface de la membrane colmatée à un temps t m²
A0 Surface de la membrane m²
D Diamètre du canal m
f Facteur de friction
FCV Facteur de concentration volumique
J Flux de perméat m3/m²/s ou m/s
J0 Flux initial de la membrane m/s
Jci Flux critique pour l’irréversibilité m/s
Kc Coefficient de résistance du modèle de blocage complet des
pores
KS Coefficient de résistance du modèle de blocage standard des
pores
Ki Coefficient de résistance du modèle de colmatage intermédiaire
des pores
Kg Coefficient de résistance du modèle de filtration sur gâteau
KA Surface bloquée de la membrane par unité de volume total filtré m²/m3
KB Surface bloquée de la section transversale par unité de volume
total filtré
m²/m3
KD Surface occupée par le gâteau formé par unité de volume total
filtré
m²/m3
L Longueur de la membrane m
Lp Perméabilité l/h.m².bar
N Fréquence de rotation Hz
n Blocking index
Q Débit volumique l/h
Rm Résistance hydraulique de la membrane neuve m-1
Rads Résistance hydraulique due à l’adsorption m-1
Rht Résistance hydraulique totale m-1
Rf Résistance hydraulique due au colmatage m-1
Rrf Résistance hydraulique réversible m-1
Rif Résistance hydraulique irréversbile m-1
ii
Rg Résistance hydraulique du gâteau m-1
Re Nombre de Reynolds
S Section de passage m²
t Temps s
TMPmoy Pression transmembranaire moyenne Pa ou bar
V Volume m3 ou ml
VRR Volumetric reduction ratio
µ Viscosité Pa.s-1
ΔP Pression transmembranaire (chapitre1,3,4)
Perte de charge (chapitre 2,5)
Pa ou bar
ΔΠ Pression osmotique Pa ou bar
ΔPag Pression additionnelle due à l’agitation Pa ou bar
ν Vitesse tangentielle m/s
ρ Masse volumique Kg/m3
τw Taux de cisaillement Pa
iii
Liste des figures
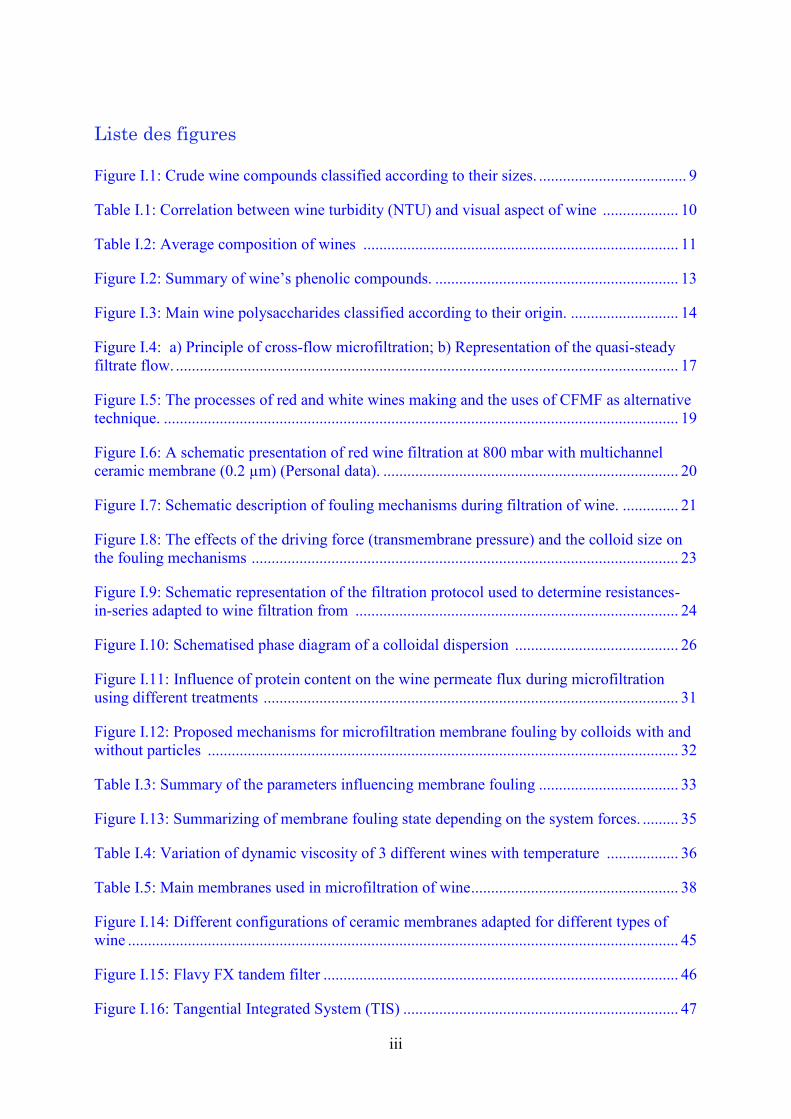
Figure I.1: Crude wine compounds classified according to their sizes. ..................................... 9
Table I.1: Correlation between wine turbidity (NTU) and visual aspect of wine ................... 10
Table I.2: Average composition of wines ............................................................................... 11
Figure I.2: Summary of wine’s phenolic compounds. ............................................................. 13
Figure I.3: Main wine polysaccharides classified according to their origin. ........................... 14
Figure I.4: a) Principle of cross-flow microfiltration; b) Representation of the quasi-steady filtrate flow. .............................................................................................................................. 17
Figure I.5: The processes of red and white wines making and the uses of CFMF as alternative technique. ................................................................................................................................. 19
Figure I.6: A schematic presentation of red wine filtration at 800 mbar with multichannel ceramic membrane (0.2 µm) (Personal data). .......................................................................... 20
Figure I.7: Schematic description of fouling mechanisms during filtration of wine. .............. 21
Figure I.8: The effects of the driving force (transmembrane pressure) and the colloid size on the fouling mechanisms ........................................................................................................... 23
Figure I.9: Schematic representation of the filtration protocol used to determine resistances-in-series adapted to wine filtration from ................................................................................. 24
Figure I.10: Schematised phase diagram of a colloidal dispersion ......................................... 26
Figure I.11: Influence of protein content on the wine permeate flux during microfiltration using different treatments ........................................................................................................ 31
Figure I.12: Proposed mechanisms for microfiltration membrane fouling by colloids with and without particles ...................................................................................................................... 32
Table I.3: Summary of the parameters influencing membrane fouling ................................... 33
Figure I.13: Summarizing of membrane fouling state depending on the system forces. ......... 35
Table I.4: Variation of dynamic viscosity of 3 different wines with temperature .................. 36
Table I.5: Main membranes used in microfiltration of wine .................................................... 38
Figure I.14: Different configurations of ceramic membranes adapted for different types of wine .......................................................................................................................................... 45
Figure I.15: Flavy FX tandem filter ......................................................................................... 46
Figure I.16: Tangential Integrated System (TIS) ..................................................................... 47
iv
Figure II.1: Le pilote de microfiltration tangentielle et le matériel associé ............................. 57
Tableau II.1: Etalonnage de la vitesse tangentielle .................................................................. 58
Figure II.2: Schéma du montage du pilote de microfiltration tangentielle .............................. 59
Figure II.3: Membrane céramique multicanaux de Novasep ................................................... 60
Tableau II.2: Caractéristique de la membrane céramique utilisée ........................................... 60
Figure II.4: Schéma de vinification et des traitements pour la production de la matrice de base .................................................................................................................................................. 61
Tableau II.3: Les concentrations des composés étudiées en filtration tangentielle.................. 62
Tableau II.4: La composition des mélanges de molécules du vin étudiés ............................... 62
Tableau II.5: Procédure du lavage chimique de la membrane. ................................................ 63
Tableau II.6: Caractéristiques hydrodynamiques pour une filtration effectuée à une vitesse tangentielle de 2 m/s ................................................................................................................. 64
Figure II.5: Evolution du facteur de friction en fonction du nombre de Reynolds ................. 65
Figure II.6: Présentation schématique du principe des échelons de pression .......................... 65
Figure II.7: L’évolution du flux de perméation en fonction de la pression transmembranaire, technique de SWB ................................................................................................................... 66
Tableau II.7: Les composés étudiés en filtration frontale et leurs concentrations ................... 68
Figure II.8: Structure du noyau 2-phenyl benzopyrone (structure de base des anthocyanes et des tanins) ................................................................................................................................. 69
Tableau II.8: Gradient de solvants utilisé lors des analyses de thiolyse .................................. 72
Tableau II.9: Composition du milieu de culture synthétique ................................................... 74
Figure III.1.1: Illustration of the fouling mechanisms considered by the blocking laws. ........ 84
Table III.1.1: The blocking models and their schematic representation .................................. 86
Figure III.1.2: Vinification scheme used to elaborate the red wine ......................................... 87
Figure III.1.3: a) Scheme of the experimental setup used in this study. b) The configuration of the multi-channel ceramic membrane (P = pressure sensor; T= temperature sensor). ............ 89
Figure III.1.4: A summary of cross-flow microfiltration experiments. ................................... 90
Figure III.1.5: A summary of dead-end microfiltration experiments ....................................... 91
Table III.1.2: Chemical cleaning procedure after filtration experiment................................... 91
v
Figure III.1.6: Permeate flux profiles of FW at 0.5 and 1 bars. ............................................... 92
Figure III.1.7: Variation of permeate flux during cross-flow microfiltration of wines loaded with different concentration of tannins at different transmembrane pressure .......................... 94
Figure III.1.8: Effect of tannins concentration and transmembrane pressure on total resistance .................................................................................................................................................. 95
Figure III.1.9: Permeate flux versus permeate volume data obtained during cross-flow microfiltration of all wines added with pectins. ....................................................................... 96
Figure III.1.10: Total resistance during wines containing pectins at different concentrations (0.05, 0.25 and 0.5 g/l) and transmembrane pressure (0.5 and 1 bars). ................................... 97
Figure III.1.11: Impact of adding enzymes on filtration performances ................................... 98
Figure III.1.12: Permeate fluxes versus permeate volume during filtration wines added with mannoproteins .......................................................................................................................... 99
Figure III.1.13: Total resistance versus permeate volume during filtration wines added with mannoproteins ........................................................................................................................ 100
Figure III.1.14: Permeate fluxes versus permeate volume during filtration wines added with yeasts ...................................................................................................................................... 101
Figure III.1.15: Total resistance versus permeate volume during filtration wines added with yeasts ...................................................................................................................................... 101
Table III.1.3: Summary of the initial fluxes obtained with different filtrations ..................... 102
Table III.1.4: Summary of parameters associated to various blocking models for FW added with tannins ............................................................................................................................ 104
Figure III.1.16: Linearized plot of permeate flux versus time for different pore blocking models for FW added with tannins: (a) complete pore blocking, (b) intermediate pore blocking, (c) standard pore blocking and (d) cake filtration. ................................................. 105
Figure III.1.17: A plot of d²t/dV² vs. dt/dV curves for wine added with tannins ................... 106
Table III.1.5: Summary of parameters associated to various blocking models for FW added with polysaccharides .............................................................................................................. 107
Figure III.1.18: Linearized plot of permeate flux versus time for different pore blocking models for FW added with polysaccharides (0.2 g/l mannoproteins or 0.25 g/l pectins): (a) complete pore blocking, (b) intermediate pore blocking, (c) standard pore blocking and (d) cake filtration. ......................................................................................................................... 108
Figure III.1.19: A plot of d²t/dV² vs. dt/dV curves for FW added with polysaccharides (0.2 g/l mannoproteins or 0.25 g/l pectins) ......................................................................................... 109
Table III.1.6: Analytical composition of different wines before and after filtration.............. 112
vi
Table III.1.7: Tannins subunits (mg/l) profiles before and after filtration of wines added with tannins (mDP = mean degree of polymerization, %gal = fraction of galloylation, % EGC = % epicatechin). ........................................................................................................................... 113
Table III.1.8: The possible relationship between permeate fluxes at 0.5 bar and the initial turbidity (obtained after filtering a volume of 3000 ml) ........................................................ 114
Figure III.2.1 : Les effets de la présence des lies sur les flux de perméation ......................... 122
Figure III.2.2: Evolution des résistances hydrauliques en présence des lies de levures ........ 123
Figure III.2.3 : Flux de perméation en fonction du volume lors de la MFT à 0.5 et 1 bar du vin brut ................................................................................................................................... 124
Figure III.2.4 : Résistances hydrauliques totales obtenues lors de la filtration du vin brut à 0.5 et 1 bar .................................................................................................................................... 125
Tableau III.2.1 : Analyses des caractéristiques du vin brut avant et après filtration.............. 126
Figure III.2.5 : Impact des levures sur la filtration des vins bruts .......................................... 127
Figure III.2.6 : Impact de la présence des levures sur les résistances hydrauliques totales obtenues .................................................................................................................................. 128
Figure III.2.7:Schéma illustrant les mécanismes de colmatage en absence et en présence des levures. ................................................................................................................................... 129
Figure IV.1: Diagram representing the state of colloidal system at different flux values where Rm = membrane resistance, Rads = resistance due to adsorption, Rrf = reversible resistance and Rif = irreversible resistance. ................................................................................................... 138
Figure IV.2: Schematic representation, as seen by authors, of the critical flux of irreversibility and its relationship with the strong form and weak form of critical flux (Rf = fouling resistance). .............................................................................................................................. 139
Table IV.1: Analytical composition of wine added with tested molecules. ........................... 141
Figure IV.3: a) Scheme of the experimental setup for the critical flux determination b) the multi-channel ceramic membrane configuration .................................................................... 143
Table IV.2: Chemical cleaning procedure after filtration experiment. .................................. 143
Figure IV.4: Square wave barovelocimetry method to measure the critical flux ................. 144
Table IV.3: Number of steps and the associated pressure. .................................................... 144
Figure IV.5: Permeate flux and ΔP evolution during filtration of FW and their associated steps numbers. ................................................................................................................................. 146
Figure IV.6: Evolution of reversible Rrf and irreversible Rif fouling resistance during filtration of FW and the associated transmembrane pressure (mbars). ................................................ 147
vii
Figure IV.7: Permeate flux evolution during ΔP stepping performed with FW containing 1.25 g/l and 2.5 g/l tannins. ............................................................................................................ 148
Figure IV.8: Impact of tannins on reversible Rrf () and irreversible Rif () fouling. .......... 149
Figure IV. 9: Permeate flux evolution during ΔP stepping performed with FW + 0.1 g/l mannoproteins, FW + 0.2 g/l mannoproteins, FW + 0.25 g/l pectins and FW + 0.5 g/l pectins. ................................................................................................................................................ 150
Figure IV.10: Pectins’s impact on reversible Rrf () and irreversible Rif () fouling. .......... 151
Figure IV.11: Mannoproteins’ impact on reversible Rrf () and irreversible Rif () fouling. ................................................................................................................................................ 152
Figure IV.12. A- Pectic gel layer at membrane surface B- Pectic gel layer compaction C- Unstructured pectic gel layer. ................................................................................................. 155
Figure IV.13. Comparison of critical flux for irreversibility (the bar gives here the lower value of critical flux for FW and the upper value of critical flux for FW with added molecules) and the threshold flux. ................................................................................................................... 156
Figure V.1 : Comparaison des principes de filtration frontale, filtration tangentielle et filtration dynamique ............................................................................................................... 163
Figure V.2 : Illustration du dispositif expérimental de filtration dynamique ......................... 166
Figure V.3: Le module RVF contenant 4 membranes (M1, M2, M3 et M4) et 2 hélices (H1 et H2). ......................................................................................................................................... 167
Tableau V.1 : Déroulement des campagnes de filtration dynamique (TMPmoy. = pression transmembranaire moyenne (cf.V.3.1) et N = fréquence de rotation). .................................. 169
Figure V.4 : Evolution de la perte de charge (ΔP) en fonction des débits massiques (Q) dans la boucle de circulation. ............................................................................................................. 170
Tableau V.2 : Les valeurs de la moyenne des pressions additionnelles en fonction de la fréquence d’agitation [12] ...................................................................................................... 171
Figure V.5 : Perméabilités à l’eau en fonction de la fréquence de rotation : a) campagne PES ; b) campagne PTFE. ................................................................................................................ 173
Figure V.6. : Evolution de la perméabilité lors de la filtration du VF sur membranes PES et PTFE. ...................................................................................................................................... 174
Figure V.7 : Evolution de la résistance hydraulique totale en fonction du volume filtré pendant la filtration du VF sur membranes PES et PTFE ................................................................... 175
Figure V.8 : Perméabilités à l’eau à 0 Hz après filtration de VF .......................................... 176
Figure V.9 : Performances du système RVF pendant la filtration du VF + Mél. A sans et avec agitation à des fréquences différents : a) campagne PES ; b) campagne PTFE ..................... 178
viii
Figure V.10 : Evolution de la résistance hydraulique totale durant la filtration du VF+ Mél.A sur membranes PES et PTFE. ................................................................................................ 179
Figure V.11 : Représentation graphique de la dérivée de la résistance par rapport à la dérivée du volume filtré en fonction de la fréquence de rotation ....................................................... 181
Figure V.12 : Perméabilités obtenues lors de la filtration VF + Mél. A sur membranes PES avec une fréquence de rotation de 40 Hz en diminuant progressivement la pression transmembranaire. .................................................................................................................. 182
Figure V.13 : Facteurs affectant le colmatage des membranes PTFE et PES. ....................... 183
ix
Liste des tableaux
Table I.1: Correlation between wine turbidity (NTU) and visual aspect of wine ................... 10
Table I.2: Average composition of wines ............................................................................... 11
Table I.3: Summary of the parameters influencing membrane fouling ................................... 33
Table I.4: Variation of dynamic viscosity of 3 different wines with temperature .................. 36
Table I.5: Main membranes used in microfiltration of wine .................................................... 38
Tableau II.1: Etalonnage de la vitesse tangentielle .................................................................. 58
Tableau II.2: Caractéristique de la membrane céramique utilisée ........................................... 60
Tableau II.3: Les concentrations des composés étudiées en filtration tangentielle.................. 62
Tableau II.4: La composition des mélanges de molécules du vin étudiés ............................... 62
Tableau II.5: Procédure du lavage chimique de la membrane. ................................................ 63
Tableau II.6: Caractéristiques hydrodynamiques pour une filtration effectuée à une vitesse tangentielle de 2 m/s ................................................................................................................. 64
Tableau II.7: Les composés étudiés en filtration frontale et leurs concentrations ................... 68
Tableau II.8: Gradient de solvants utilisé lors des analyses de thiolyse .................................. 72
Tableau II.9: Composition du milieu de culture synthétique ................................................... 74
Table III.1.1: The blocking models and their schematic representation .................................. 86
Table III.1.2: Chemical cleaning procedure after filtration experiment................................... 91
Table III.1.3: Summary of the initial fluxes obtained with different filtrations ..................... 102
Table III.1.4: Summary of parameters associated to various blocking models for FW added with tannins ............................................................................................................................ 104
Table III.1.5: Summary of parameters associated to various blocking models for FW added with polysaccharides .............................................................................................................. 107
Table III.1.6: Analytical composition of different wines before and after filtration.............. 112
Table III.1.7: Tannins subunits (mg/l) profiles before and after filtration of wines added with tannins. ................................................................................................................................... 113
Table III.1.8: The possible relationship between permeate fluxes at 0.5 bar and the initial turbidity (obtained after filtering a volume of 3000 ml) ........................................................ 114
Tableau III.2.1 : Analyses des caractéristiques du vin brut avant et après filtration.............. 126
x
Table IV.1: Analytical composition of wine added with tested molecules. ........................... 141
Table IV.2: Chemical cleaning procedure after filtration experiment. .................................. 143
Table IV.3: Number of steps and the associated pressure. .................................................... 144
Tableau V.1 : Déroulement des campagnes de filtration dynamique (TMPmoy. = pression transmembranaire moyenne (cf.V.3.1) et N = fréquence de rotation). .................................. 169
Tableau V.2 : Les valeurs de la moyenne des pressions additionnelles en fonction de la fréquence d’agitation ............................................................................................................. 171
Introduction générale
Introduction générale
2
En fin de fermentations alcoolique et malolactique le vin brut contient des particules en
suspension de différentes origines qui sont responsables de sa turbidité. Ces particules ont
tendance à sédimenter, à floculer ou rester en suspension et sont en partie éliminées par
décantation et soutirage. Cette phase de clarification spontanée peut être accélérée par des
techniques de filtration et décantation. Un vin clarifié et stable a une valeur marchande plus
élevée compte tenu de l’exigence du consommateur et du négoce qui peuvent rejeter un vin
présentant un aspect trouble. La limpidité est par ailleurs indispensable à l’appréciation
organoleptique du vin.
Dans les opérations du processus de vinification, la filtration des vins est une étape importante
pour une présentation du vin adaptée au goût du consommateur (respect qualitatif et
organoleptique, stabilité microbiologique). Traditionnellement, l’obtention de la limpidité
nécessite plusieurs passages sur des filtres à plateaux ou des filtres à plaques, matériels qui
consomment des quantités importantes d’adjuvants de filtration. La pression réglementaire en
matière d’environnement est croissante depuis quelques années dans le secteur vinicole.
Celle-ci concerne tous types de déchets solides (produits issus de la transformation du raisin,
médias filtrants, etc) dû à la fermeture des décharges en 2002 ou liquides sous forme
d’effluents, obligeant alors les professionnels à réduire le taux des polluants et à favoriser les
technologies dites propres.
A ce jour et par rapport à ces opérations technologiques traditionnelles de clarification, la
microfiltration tangentielle (MFT) constitue une véritable alternative permettant, en un seul
passage, l’obtention d’un vin brillant et microbiologiquement pauvre en germes. En outre,
cette technique est automatisable et limite l’utilisation de terres de filtration, plaques et
lentilles. Si les principales applications de la MFT sont la clarification et la stabilité
microbiologique avant la mise en bouteilles, cette technique peut intervenir à différents stades
du schéma de vinification. Elle peut limiter toute déviation microbiologique si elle est utilisée
de façon précoce après fermentations ou avant par la clarification des moûts. Cette dernière
reste encore un challenge pour la MFT.
Malgré ses avantages, ce procédé a longtemps souffert d’une mauvaise réputation dans le
secteur œnologique, ce qui a freiné son développement. En effet, les premiers essais menés
sur le vin ont montré une chute rapide et très importante des flux de perméation ainsi que des
rétentions excessives des composés du vin malgré le flux tangentiel. Ces observations ont été
reliées au colmatage des membranes par les différents constituants du vin retenus lors de cette
Introduction générale
3
opération, affectant ainsi la rentabilité économique du procédé et la qualité organoleptique du
produit ainsi que des difficultés de régénération des membranes. Ceci était lié à une
inadéquation entre les matériaux membranaires utilisés, les seuils de coupure, le choix des
conditions opératoires (vitesse tangentielle et pression transmembranaire) et les
caractéristiques du vin.
Ces constats ont aussi conduit au développement de travaux de recherche dans le but
d’identifier les composés du vin impliqués réellement dans le colmatage, d’identifier des
matériaux membranaires adaptés et de mettre en œuvre des techniques de décolmatage
adéquates. Les premiers travaux ont été conduits sur des membranes minérales et se sont
intéressés au rôle joué par les polysaccharides du vin. Des travaux se sont ensuite enchaînés
sur des membranes organiques en prenant en compte les polysaccharides et les composés
phénoliques. Puis les chercheurs se sont intéressés au rôle des particules présentes dans le vin
(levures, bactéries et agrégats colloïdaux). Enfin, l’impact de la nature du matériau
membranaire dans les phénomènes d’adsorption des molécules du vin a été étudié.
Tous ces travaux ont permis de mettre en évidence le développement d’un colmatage
irréversible des membranes par les composés du vin. Les analyses effectuées sur les
membranes ont permis d’identifier la présence des polysaccharides et des composés
phénoliques. Des observations réalisées au MEB ont mis en évidence la présence d’un dépôt
de matière organique, hétérogène et adhérent au matériau membranaire. En effet, des
interactions physico-chimiques peuvent se développer à l’interface matériaux/vins et entre les
molécules elles-mêmes induisant des chutes importantes de flux de perméation. Par ailleurs,
les travaux ont souligné l’impact du matériau membranaire et le rôle joué par les propriétés de
surface sur la formation et la réversibilité du colmatage.
Malgré les contributions apportées par les travaux de recherche antérieurs, il existe encore peu
de connaissances fondamentales du procédé. Même s’il est admis que les macromolécules
comme les polysaccharides, les composés phénoliques et les protéines ainsi que les particules
sont impliquées dans l’encrassement de la membrane, l’impact et la contribution individuels
des composés sont méconnus à ce jour. De même, les mécanismes impliqués dans le
colmatage ne sont pas identifiés ; par exemple, la formation d’une seconde membrane par les
particules ayant sa propre sélectivité pourrait même protéger partiellement la membrane du
blocage interne de ses pores.
Introduction générale
4
L’étude présentée dans ce manuscrit est axée sur l’identification et la compréhension des
phénomènes de colmatage ainsi que sur la détermination des mécanismes de colmatage
impliqués afin d’optimiser et de maîtriser les procédés existants de filtration tangentielle.
Cette thèse s’inscrit dans le cadre d’une collaboration entre le Laboratoire de Génie Chimique
de Toulouse, l’équipe de génie des procédés de la faculté d’œnologie de l’université de
Bordeaux et la société « PERA ». Le travail de recherche développé au cours de cette thèse
est organisé autour de 3 objectifs principaux, interdépendants :
- L’étude de l’impact individuel des molécules du vin sur le colmatage d’une
membrane céramique mutlicanaux ainsi que l’identification des mécanismes de
colmatage impliqués dans ces filtrations.
- La recherche des conditions opératoires critiques de filtration afin de limiter ou
contrôler le colmatage.
- L’application d’une technologie novatrice pour la filière œnologique : la filtration
dynamique RVF puisque les filtres tangentiels semblent toucher leurs limites de
progrès.
Ce manuscrit rapportant l’ensemble de ces résultats est organisé en 5 chapitres. Le premier
chapitre expose à travers une synthèse bibliographique, présentée sous forme d’un article
scientifique (El RAYESS et al., Cross-flow microfiltration applied to œnology : a review :
Journal of Membrane Science 382 2011 1-19), la problématique liée au colmatage des
membranes par les molécules du vin ainsi que les différents paramètres influençant les
performances de la microfiltration tangentielle. Le deuxième chapitre présente le matériel et
les méthodes utilisé au cours de ce travail, détaillant le pilote de filtration, le vin étudié et les
molécules modèles utilisées, les conditions de filtration et les analyses effectuées sur le vin.
Le chapitre III est consacré aux résultats obtenus lors de la filtration des molécules modèles
afin d’étudier leurs impacts individuels et les mécanismes de colmatage ainsi que leurs
impacts en mélange de molécules. Le chapitre IV, présenté sous forme d’un article
scientifique (resoumis au Journal of Membrane Science après une première évaluation),
détaillent les résultats obtenus lors de la recherche des conditions critiques de colmatage
spécialement le flux critique d’irréversibilité lors de la filtration du vin. Dans le chapitre V,
les performances d’un module de filtration dynamique (RVF) seront évaluées dans le cadre de
la filtration du vin en présence de deux matériaux membranaires différents. Enfin, les
conclusions de ce travail et les perspectives qui en découlent seront développées.
Chapitre I:
Synthèse bibliographique
Chapitre I : Synthèse bibliographique
6
Préambule
Cette première partie de la thèse a été consacrée à une étude bibliographique sur l’ensemble
des travaux de recherche menés sur la microfiltration tangentielle du vin. Cette étude sera
présentée sous forme d’une review scientifique publiée dans Journal of Membrane Science
(El RAYESS et al., Cross-flow microfiltration applied to œnology : a review : Journal of
Membrane Science 382 (2011) 1-19).
La microfiltration tangentielle permet de réaliser simultanément la clarification et la
stabilisation microbiologique des vins. Ce procédé présente une alternative aux techniques de
filtration traditionnelles utilisées en œnologie, tant en termes de respect de l’environnement
que par sa polyvalence.
En dépit de ses avantages, le développement de cette technique dans le secteur est limité par
des faibles performances de filtration dues au colmatage des membranes par les composés du
vin. Ce colmatage peut avoir plusieurs conséquesces: i) une diminution importante des flux de
perméation et des problèmes de régénération des matériaux membranaires, ayant un impact
négatif sur la rentabilité économique du procédé, ii) des rétentions importantes en molécules
du vin par formation possible d’une seconde membrane ayant sa propre sélectivité.
Ces problèmes ont conduit au développement des travaux de recherche sur l’identification des
molécules responsables du colmatage et la compréhension des mécanismes de colmatage mis
en jeu. Les premières études ont identifié le rôle colmatant des polysaccharides du vin sur les
membranes minérales. Puis, ces mêmes composés associés aux composés phénoliques ont été
mis en cause lors d’essais de filtration sur des membranes organiques. Des travaux plus
récents ont montré le rôle important joué par les particules du vin (levures, bactéries lactiques
et agrégats colloïdaux) sur le colmatage des membranes.
Les travaux de recherche ont aussi souligné le rôle des propriétés physico-chimiques de la
membrane et des intéractions entre les molécules du vin et la membrane, sur l’adsorption
initiale des constituants du vin et la structuration du colmatage. Compte tenu de la diversité
des composés présents dans le vin et de leur comportement physico-chimique différent, il
semble que les matériaux polaires présentent moins d’affinité vis-à-vis des polyphénols.
Cependant, des travaux plus récents désignent les matériaux apolaires comme étant moins
favorables à l’adosprtion des composés du vin sur les membranes.
Chapitre I : Synthèse bibliographique
7
Pour mieux décrire et illustrer toutes les avancées scientifiques faites dans le domaine, ce
chapitre a été divisé en 7 sous-chapitres. Après une introduction présentant un aperçu
historique de l’introduction de la microfiltration tangentielle dans le secteur œnologique, la
composition chimique du vin a été résumée vue l’implication de ces composés dans le
colmatage des membranes. Une troisième partie est dédiée aux principes de la microfiltration
tangentielle, à sa polyvalence et à ses avantges pour le secteur vinicole. Ensuite, le problème
de colmatage des membranes pendant cette opération est évoqué en détaillant le rôle joué par
les composés du vin ainsi que les paramètres influençant la formation du colmatage. Le
cinquième sous-chapitre est consacré aux techniques chimiques et mécaniques mises en place
pour limiter le colmatage et pour régénerer les membranes. Les derniers modèles de filtres
tangentiels proposés par les constructeurs ainsi que leurs avancées technologiques sont
exposés dans le sixième sous-chapitre. Le dernier sous-chapitre conclut par une vue générale
sur les points qui font défaut dans le domaine œnologique pour mieux comprendre le
colmatage et pour pouvoir augmenter les performances de la microfiltration tangentielle.
Chapitre I : Synthèse bibliographique
8
Cross-flow Microfiltration applied to oenology: A review (Article accepté au Journal of Membrane Science 382 (2011) 1-19)
Abstract
The cross-flow microfiltration applied to wine filtration has become a legitimate alternative to
conventional filtration processes. However, membrane fouling which affects the operating
costs and the plant maintenance, limit the widespread application of this technique. The aim
of this review is to provide a better understanding of the development of the cross-flow
microfiltration in wine industry, as well as the complexity of wine composition and its
consequences on membrane fouling. This review covers also the impact of the operating
conditions and the membrane characteristics on fouling mechanisms. Strategies to limit
fouling as well as the latest innovations and commercial proposal are discussed in this paper.
Keywords: cross-flow microfiltration, wine, fouling, polysaccharides, polyphenols.
Chapitre I : Synthèse bibliographique
9
1. Introduction
Filtration as a means of wine clarification goes back to ancient times. After alcoholic and
malolactic fermentations, the crude wine is a complex medium presenting a turbid aspect.
This latter is not well accepted by the consumer and wine needs to be clarified. Three groups
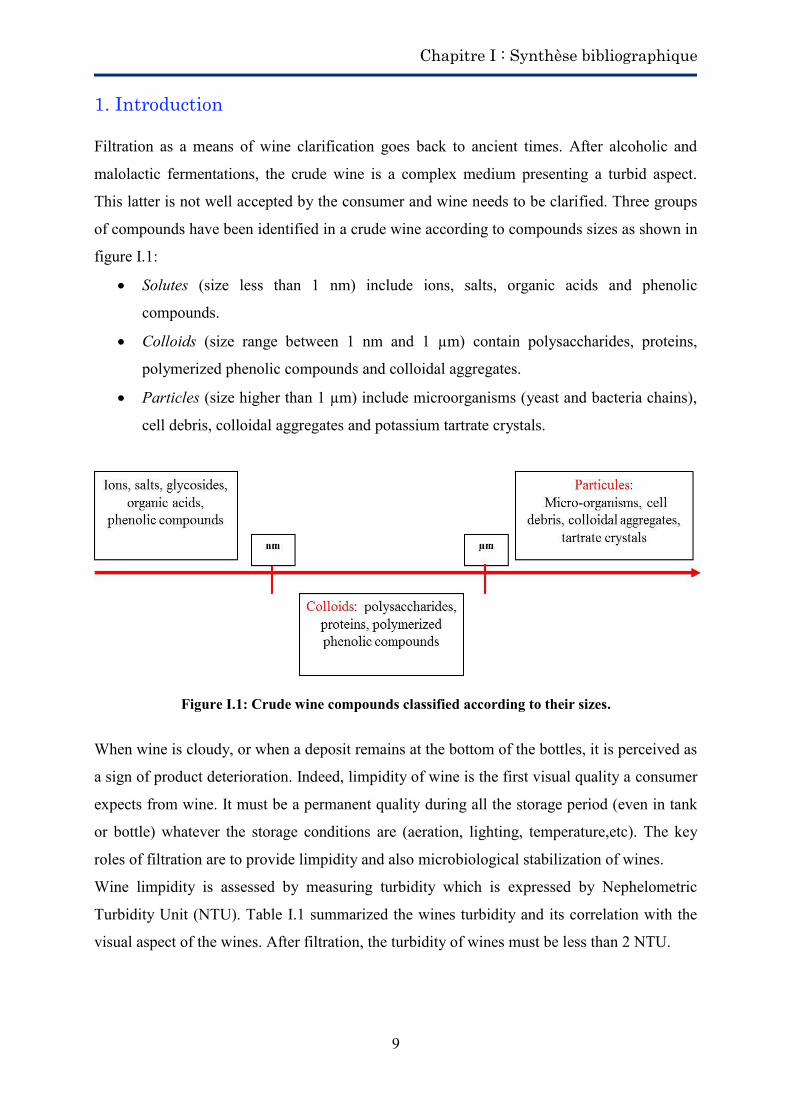
of compounds have been identified in a crude wine according to compounds sizes as shown in
figure I.1:
Solutes (size less than 1 nm) include ions, salts, organic acids and phenolic
compounds.
Colloids (size range between 1 nm and 1 µm) contain polysaccharides, proteins,
polymerized phenolic compounds and colloidal aggregates.
Particles (size higher than 1 µm) include microorganisms (yeast and bacteria chains),
cell debris, colloidal aggregates and potassium tartrate crystals.
Figure I.1: Crude wine compounds classified according to their sizes.
When wine is cloudy, or when a deposit remains at the bottom of the bottles, it is perceived as
a sign of product deterioration. Indeed, limpidity of wine is the first visual quality a consumer
expects from wine. It must be a permanent quality during all the storage period (even in tank
or bottle) whatever the storage conditions are (aeration, lighting, temperature,etc). The key
roles of filtration are to provide limpidity and also microbiological stabilization of wines.
Wine limpidity is assessed by measuring turbidity which is expressed by Nephelometric
Turbidity Unit (NTU). Table I.1 summarized the wines turbidity and its correlation with the
visual aspect of the wines. After filtration, the turbidity of wines must be less than 2 NTU.

Chapitre I : Synthèse bibliographique
10
Table I.1: Correlation between wine turbidity (NTU) and visual aspect of wine [2]
Brilliant Haziness White wine < 1.1 NTU > 4.4 NTU Rosé wine < 1.4 NTU > 5.8 NTU Red wine < 2.0 NTU > 8.0 NTU
Stabilization could be divided into physico-chemical and microbiological stabilization.
Physico-chemical stabilization (not insured by filtration) prevents the formation of organic
and inorganic hazes and deposits after packaging. Microbiological stabilization by
microfiltration is guaranteed by eliminating yeasts and bacteria that can destroy or modify a
wine’s taste. Wine stability is defined as a state or a condition such as the wine will not, for
some definite period of time, exhibit undesirable physical, chemical, or organoleptic changes
[1]. These undesirable changes that denote wine instability were listed by: browning or other
color deterioration, haziness or very slight cloudiness, cloudiness, deposits and undesirable
taste or odor [1,2]. Many examples of colloidal instability had been identified in wines, for
example the protein and polyphenols instability, iron and copper cloudiness, pectins and yeast
polysaccharides haziness… [1,2].
Early, wineries were equipped with diatomaceous earth filters. This technique showed quickly
its limits in terms of wine quality, wine loss and its implementation especially in cooperative
cellars (non-automated process). In the mean time, cross-flow microfiltration (CFMF) was
widespread used in food industry and biotechnology. It appeared as a promising process to
replace the traditional filtration methods.
The first wine filtration tests using membrane goes back to 1960 in California and to 1964 in
France. The first trials of cross-flow microfiltration have been conducted in oenology at the
beginning of the 80’s. The used membranes at the time migrated from other industries and
were not specific to wine [3,4]. This resulted in affecting the organoleptic quality of wines
and increased temperatures during the process. In the mid-80’s, ultrafiltration (UF) and CFMF
of wine have been the focus of large interest and research effort [5,6]. The ultrafiltration
technique was unsuitable for wine filtration due to the loss of wine quality [6]. From 1990,
large progress on wine CFMF was realized by the constructors especially on organic
membrane [7,8]; The development of membrane materials associated with a better
understanding of the compounds involved in the membrane fouling led to the selection of
membranes suitable for wine filtration [7,8].
Chapitre I : Synthèse bibliographique
11
Nowadays, this technique is well accepted in wine industry and becomes to be widely used in
cellars. Despite the progress made, however, the large-scale development of CFMF is still
hampered by the technological and economical barriers induced by membrane fouling.
The purpose of this paper is to provide an overview on the CFMF process applied to oenology
in order to highlight the application, the problems and the progress of this technique in
oenology sector. Given the complexity of wine composition, wine compounds which are
susceptible to have an impact on membrane fouling are presented. The implement and the
application of the CFMF in oenology are then discussed. This section will be followed by a
summary of the fouling mechanisms that hamper the development of this technique in
oenology. The review will also deal with the role of wine chemistry in fouling phenomena as
well as the impact of the operating parameters. To conclude, strategies to limit fouling are
revised as well as the latest progress and propositions to improve CFMF at the industrial
scale.
2. Wine’s composition
Wines are alcoholic drinks obtained from the fermentation of grapes. Their composition is
determined by the composition of the grape, which depends on genetic characters, on vine
growing conditions, on grape ripeness at harvest, and on wine-making practices. These latter
involve a series of successive operations, the sequence of which varies considerably
depending on the wine type. Wines’ composition depends also on yeast and bacterial strains
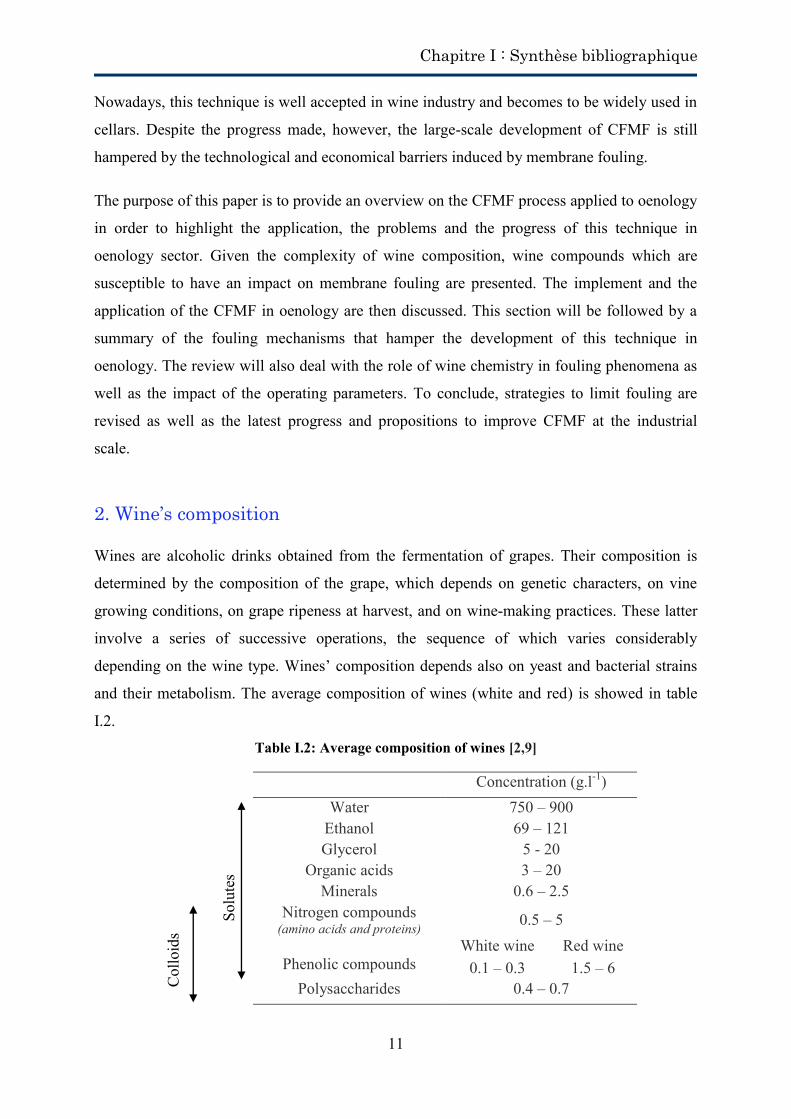
and their metabolism. The average composition of wines (white and red) is showed in table
I.2.
Table I.2: Average composition of wines [2,9]
Concentration (g.l-1)
Solu
tes
Water 750 – 900 Ethanol 69 – 121 Glycerol 5 - 20 Organic acids 3 – 20 Minerals 0.6 – 2.5
Nitrogen compounds (amino acids and proteins) 0.5 – 5
Phenolic compounds
White wine Red wine 0.1 – 0.3 1.5 – 6
Polysaccharides 0.4 – 0.7
Col
loid
s
Chapitre I : Synthèse bibliographique
12
In the following paragraphs, colloids and particles will be only presented due to their
implication in the fouling phenomena during CFMF.
2.1. Wine colloids
2.1.1. Phenolic compounds
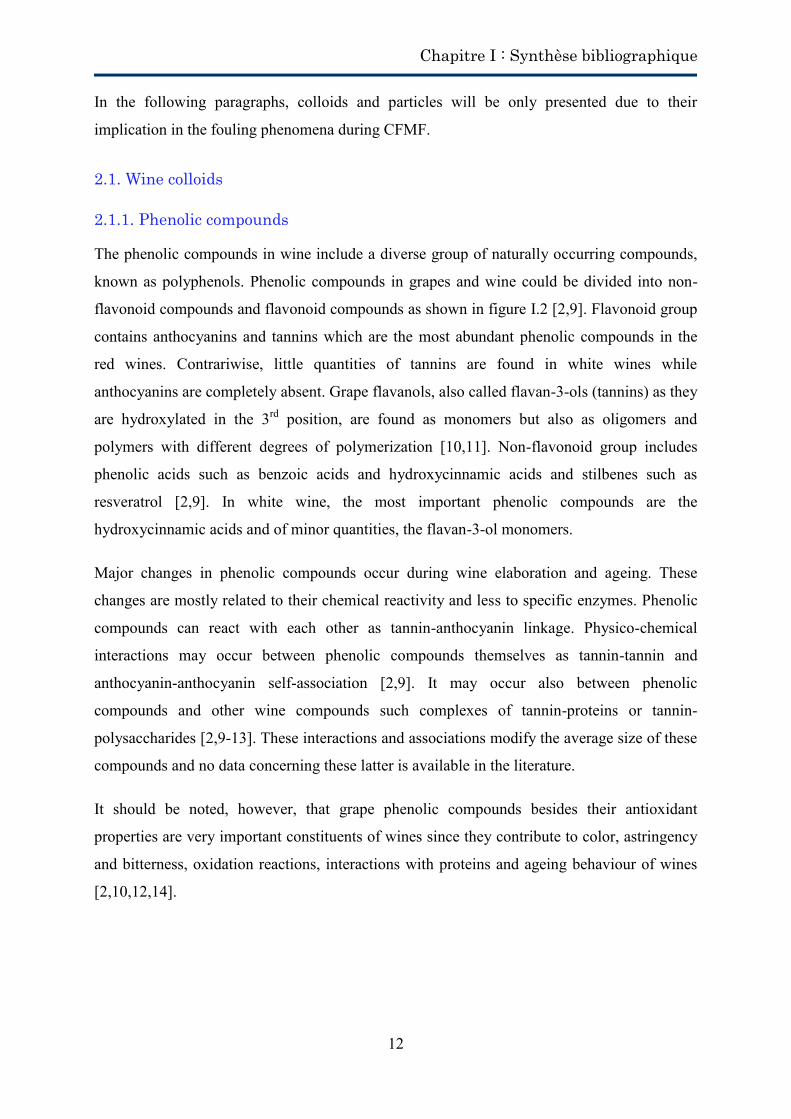
The phenolic compounds in wine include a diverse group of naturally occurring compounds,
known as polyphenols. Phenolic compounds in grapes and wine could be divided into non-
flavonoid compounds and flavonoid compounds as shown in figure I.2 [2,9]. Flavonoid group
contains anthocyanins and tannins which are the most abundant phenolic compounds in the
red wines. Contrariwise, little quantities of tannins are found in white wines while
anthocyanins are completely absent. Grape flavanols, also called flavan-3-ols (tannins) as they
are hydroxylated in the 3rd position, are found as monomers but also as oligomers and
polymers with different degrees of polymerization [10,11]. Non-flavonoid group includes
phenolic acids such as benzoic acids and hydroxycinnamic acids and stilbenes such as
resveratrol [2,9]. In white wine, the most important phenolic compounds are the
hydroxycinnamic acids and of minor quantities, the flavan-3-ol monomers.
Major changes in phenolic compounds occur during wine elaboration and ageing. These
changes are mostly related to their chemical reactivity and less to specific enzymes. Phenolic
compounds can react with each other as tannin-anthocyanin linkage. Physico-chemical
interactions may occur between phenolic compounds themselves as tannin-tannin and
anthocyanin-anthocyanin self-association [2,9]. It may occur also between phenolic
compounds and other wine compounds such complexes of tannin-proteins or tannin-
polysaccharides [2,9-13]. These interactions and associations modify the average size of these
compounds and no data concerning these latter is available in the literature.
It should be noted, however, that grape phenolic compounds besides their antioxidant
properties are very important constituents of wines since they contribute to color, astringency
and bitterness, oxidation reactions, interactions with proteins and ageing behaviour of wines
[2,10,12,14].
Chapitre I : Synthèse bibliographique
13
Figure I.2: Summary of wine’s phenolic compounds.
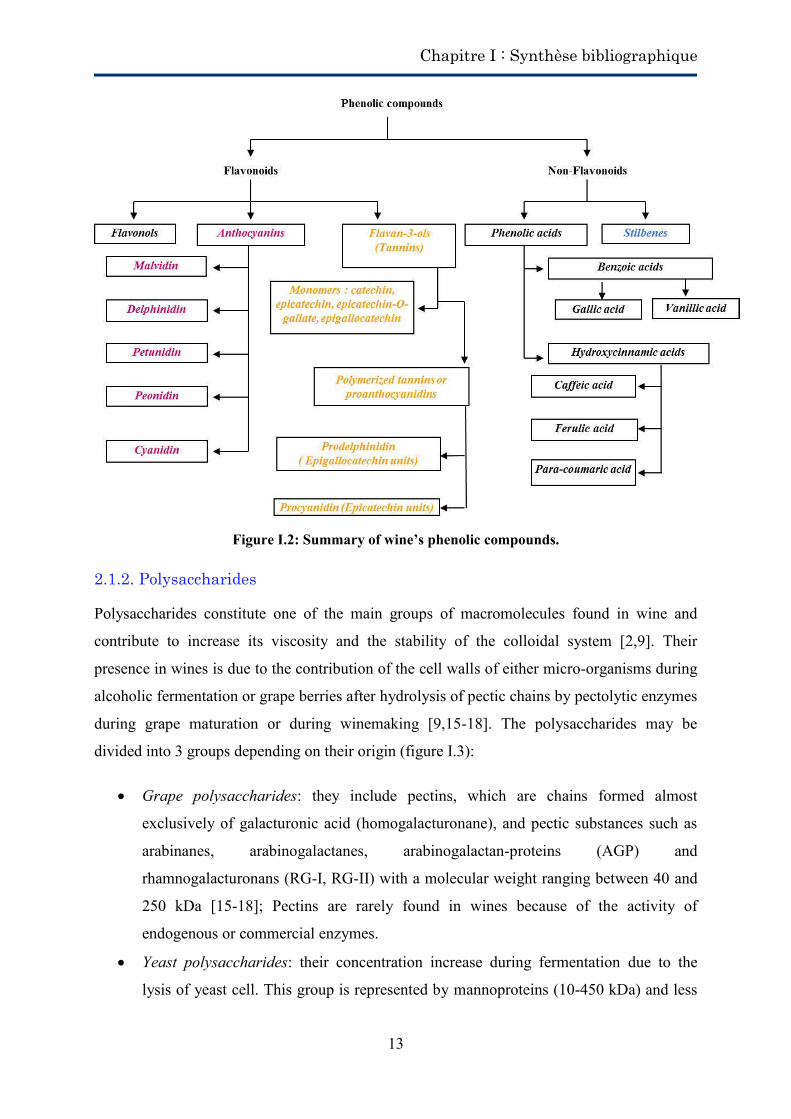
2.1.2. Polysaccharides
Polysaccharides constitute one of the main groups of macromolecules found in wine and
contribute to increase its viscosity and the stability of the colloidal system [2,9]. Their
presence in wines is due to the contribution of the cell walls of either micro-organisms during
alcoholic fermentation or grape berries after hydrolysis of pectic chains by pectolytic enzymes
during grape maturation or during winemaking [9,15-18]. The polysaccharides may be
divided into 3 groups depending on their origin (figure I.3):
Grape polysaccharides: they include pectins, which are chains formed almost
exclusively of galacturonic acid (homogalacturonane), and pectic substances such as
arabinanes, arabinogalactanes, arabinogalactan-proteins (AGP) and
rhamnogalacturonans (RG-I, RG-II) with a molecular weight ranging between 40 and
250 kDa [15-18]; Pectins are rarely found in wines because of the activity of
endogenous or commercial enzymes.
Yeast polysaccharides: their concentration increase during fermentation due to the
lysis of yeast cell. This group is represented by mannoproteins (10-450 kDa) and less
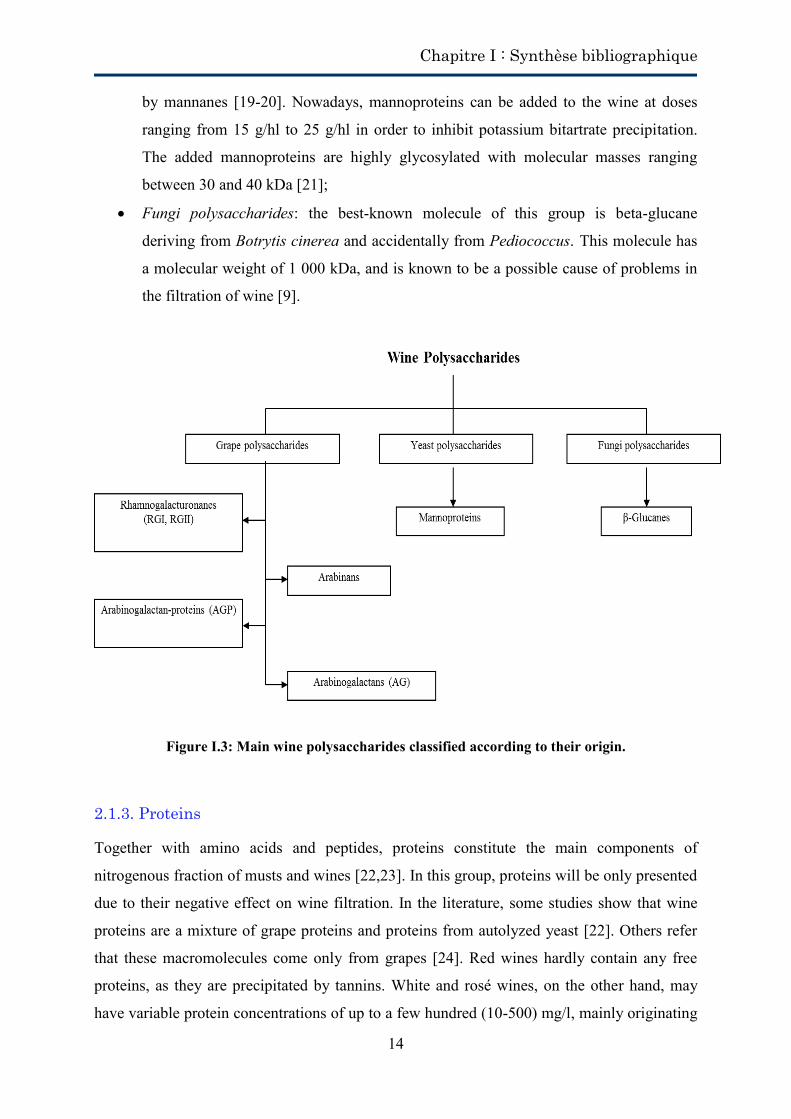
Chapitre I : Synthèse bibliographique
14
by mannanes [19-20]. Nowadays, mannoproteins can be added to the wine at doses
ranging from 15 g/hl to 25 g/hl in order to inhibit potassium bitartrate precipitation.
The added mannoproteins are highly glycosylated with molecular masses ranging
between 30 and 40 kDa [21];
Fungi polysaccharides: the best-known molecule of this group is beta-glucane
deriving from Botrytis cinerea and accidentally from Pediococcus. This molecule has
a molecular weight of 1 000 kDa, and is known to be a possible cause of problems in
the filtration of wine [9].
Figure I.3: Main wine polysaccharides classified according to their origin.
2.1.3. Proteins
Together with amino acids and peptides, proteins constitute the main components of
nitrogenous fraction of musts and wines [22,23]. In this group, proteins will be only presented
due to their negative effect on wine filtration. In the literature, some studies show that wine
proteins are a mixture of grape proteins and proteins from autolyzed yeast [22]. Others refer
that these macromolecules come only from grapes [24]. Red wines hardly contain any free
proteins, as they are precipitated by tannins. White and rosé wines, on the other hand, may
have variable protein concentrations of up to a few hundred (10-500) mg/l, mainly originating
Chapitre I : Synthèse bibliographique
15
from grapes [2]. Some of these proteins have been identified. They are pathogenesis-related
proteins involved in the defense mechanism of plants against fungal attacks [22,24]. Among
these proteins, the most abundant are chitinases and thaumatin-like proteins with low
molecular masses ranging between 20 and 30 kDa. Instability of proteins in white wines is
one of the most common non-microbial defects of commercial wines [21]. Denaturation of
proteins in white wines may result from unfavorable storage conditions, leading to their
aggregation [22]. The denatured protein can subsequently precipitate to form an amorphous
sediment or deposit or flocculate and thus produce a suspended and unattractive haze in the
bottled wine that reduces its commercial value, making it unacceptable for sale [22-25].
2.2. Wine particles
Suspended particles in wine play a major role in winemaking and especially in wine
clarification. This group includes microorganisms (yeast and bacteria chains), cell debris,
colloidal aggregates and tartrate crystals. They are retained by the filters but may be found
accidentally in the final wine.
2.2.1. Yeasts
Yeasts are unicellular eukaryotic micro-organisms with an ovoid form and size range between
2 and 10 µm. They carry out the alcoholic fermentation which is the anaerobic transformation
of must sugars into alcohol. 16 yeast genera are associated with winemaking. Saccharomyces
cerevisiae is the predominant yeast in winemaking [26]. Other yeasts, such as species of
Brettanomyces, Kluyveromyces, Schizosaccharomyces, Torulaspora, Zygosaccharomyces and
Saccharomycodes, may be present during the fermentation or ageing of the wine [26-28].
Wine alcoholic fermentations can be divided into two types: uninoculated (spontaneous or
natural fermentations) with unpredictable results and directly inoculated by adding a selected
yeast strain. At the beginning of vinification, the yeast population is 105 – 106 yeasts per
milliliter of must to reach 107 – 108 yeasts per milliliter during alcoholic fermentation [25,
26]. A few weeks after the completion of fermentation, the yeast viable population is less than
a few hundred cells per ml. Because of their size, yeasts settle easily and are partially
removed by settling and racking operations.
2.2.2. Bacteria
Few species of bacteria are able to grow in wines. This is due to acidic pH (3.0 – 3.8) and
ethanol concentration of these wines. Two distinct types of bacteria may play an important
Chapitre I : Synthèse bibliographique
16
role on the final quality of wines. These bacteria are lactic acid bacteria and acetic acid
bacteria [25,26].
Lactic acid bacteria belong to the group of Gram-positive microorganisms. They are small
cells (size between 0.5 and 1 micron) round shaped or slightly elongated forming pairs or
chains. At the beginning of the alcoholic fermentation, there are 103 to 104 bacteria per ml.
After the end of the alcoholic fermentation, the number of bacteria may reach 106-108 bacteria
per ml and perform the so-called malolactic fermentation [26]. This latter is the
transformation of malic acid into lactic acid leading to a slight deacidification and a possible
improvement of the organoleptic quality of wine [9,26]. The main specie of lactic acid
bacteria in wine, responsible for carrying out the malolactic fermentation, is Oenococcus oeni.
The presence or growth of acetic acid bacteria (Gram-negative) is undesirable since it has
generally been related to wine spoilage, mostly by increasing the acetic acid and thus, the
volatile acidity. The main specie found in wines is Acetobacter and it may reach 108 bacteria
per ml in contaminated wines.
2.2.3. Tartrate crystals
Tartaric acid and its salts (potassium bitartrate and calcium tartrate) are normal constituents of
musts and wines. Musts are usually saturated with potassium bitartrate. The formation of
alcohol during fermentation acts to decrease the solubility of potassium bitartrate and calcium
tartrate, thus, producing a supersaturated solution in the wine [2]. This may result in
crystallization of tartrate salts when the wine is bottled and stored at low temperatures [9,21].
Such crystallization is considered undesirable and generally do not meet with consumer
acceptance. Consequently, winemakers employ various treatment methods before bottling a
wine to prevent this problem. The most extensively used methods are cold stabilization, ion-
exchange process and electro-dialysis.
2.2.4. Colloidal aggregates
Colloidal aggregates are the result of the agglomeration of the macromolecules of wines. This
resulted in instability and it is responsible for most physico-chemical disorders and deposits in
wines. Phenolic compounds, polysaccharides and proteins are the main constituents of these
macromolecules as well as traces of many other compounds. The exact composition of these
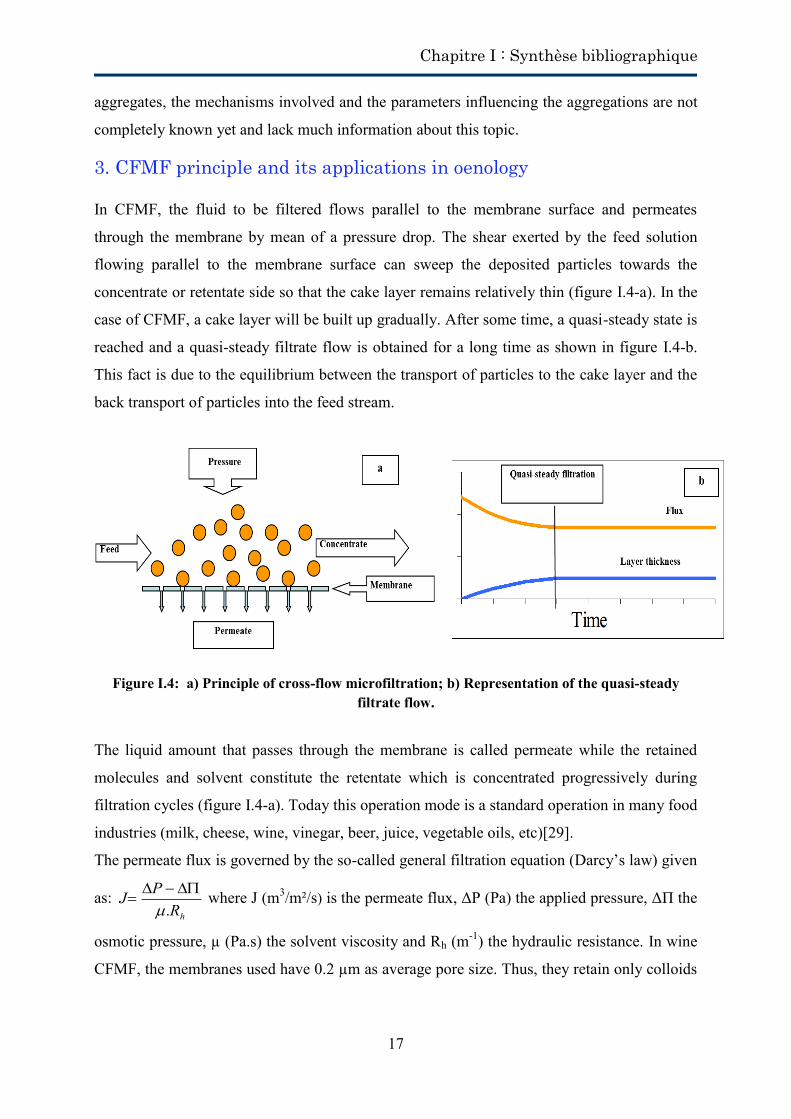
Chapitre I : Synthèse bibliographique
17
aggregates, the mechanisms involved and the parameters influencing the aggregations are not
completely known yet and lack much information about this topic.
3. CFMF principle and its applications in oenology
In CFMF, the fluid to be filtered flows parallel to the membrane surface and permeates
through the membrane by mean of a pressure drop. The shear exerted by the feed solution
flowing parallel to the membrane surface can sweep the deposited particles towards the
concentrate or retentate side so that the cake layer remains relatively thin (figure I.4-a). In the
case of CFMF, a cake layer will be built up gradually. After some time, a quasi-steady state is
reached and a quasi-steady filtrate flow is obtained for a long time as shown in figure I.4-b.
This fact is due to the equilibrium between the transport of particles to the cake layer and the
back transport of particles into the feed stream.
Figure I.4: a) Principle of cross-flow microfiltration; b) Representation of the quasi-steady filtrate flow.
The liquid amount that passes through the membrane is called permeate while the retained
molecules and solvent constitute the retentate which is concentrated progressively during
filtration cycles (figure I.4-a). Today this operation mode is a standard operation in many food
industries (milk, cheese, wine, vinegar, beer, juice, vegetable oils, etc)[29].
The permeate flux is governed by the so-called general filtration equation (Darcy’s law) given
as: hR
PJ.
where J (m3/m²/s) is the permeate flux, ΔP (Pa) the applied pressure, ΔП the
osmotic pressure, µ (Pa.s) the solvent viscosity and Rh (m-1) the hydraulic resistance. In wine
CFMF, the membranes used have 0.2 µm as average pore size. Thus, they retain only colloids
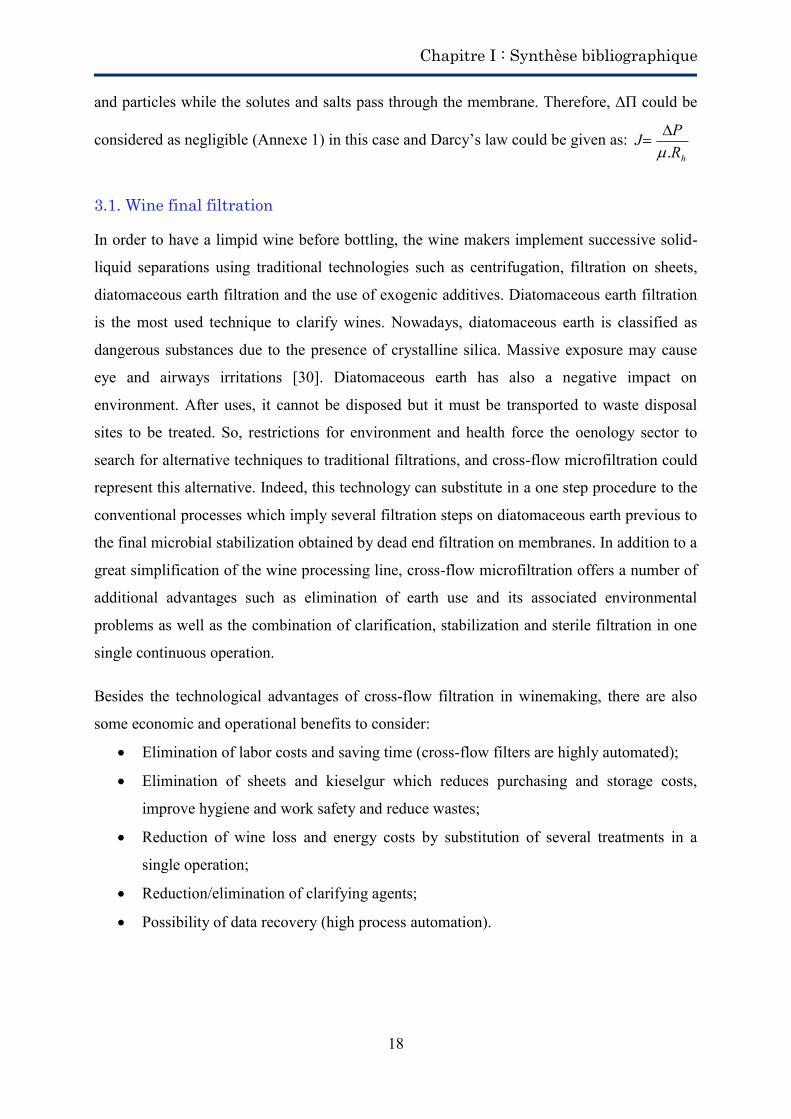
Chapitre I : Synthèse bibliographique
18
and particles while the solutes and salts pass through the membrane. Therefore, ΔП could be
considered as negligible (Annexe 1) in this case and Darcy’s law could be given as: hR
PJ.
3.1. Wine final filtration
In order to have a limpid wine before bottling, the wine makers implement successive solid-
liquid separations using traditional technologies such as centrifugation, filtration on sheets,
diatomaceous earth filtration and the use of exogenic additives. Diatomaceous earth filtration
is the most used technique to clarify wines. Nowadays, diatomaceous earth is classified as
dangerous substances due to the presence of crystalline silica. Massive exposure may cause
eye and airways irritations [30]. Diatomaceous earth has also a negative impact on
environment. After uses, it cannot be disposed but it must be transported to waste disposal
sites to be treated. So, restrictions for environment and health force the oenology sector to
search for alternative techniques to traditional filtrations, and cross-flow microfiltration could
represent this alternative. Indeed, this technology can substitute in a one step procedure to the
conventional processes which imply several filtration steps on diatomaceous earth previous to
the final microbial stabilization obtained by dead end filtration on membranes. In addition to a
great simplification of the wine processing line, cross-flow microfiltration offers a number of
additional advantages such as elimination of earth use and its associated environmental
problems as well as the combination of clarification, stabilization and sterile filtration in one
single continuous operation.
Besides the technological advantages of cross-flow filtration in winemaking, there are also
some economic and operational benefits to consider:
Elimination of labor costs and saving time (cross-flow filters are highly automated);
Elimination of sheets and kieselgur which reduces purchasing and storage costs,
improve hygiene and work safety and reduce wastes;
Reduction of wine loss and energy costs by substitution of several treatments in a
single operation;
Reduction/elimination of clarifying agents;
Possibility of data recovery (high process automation).
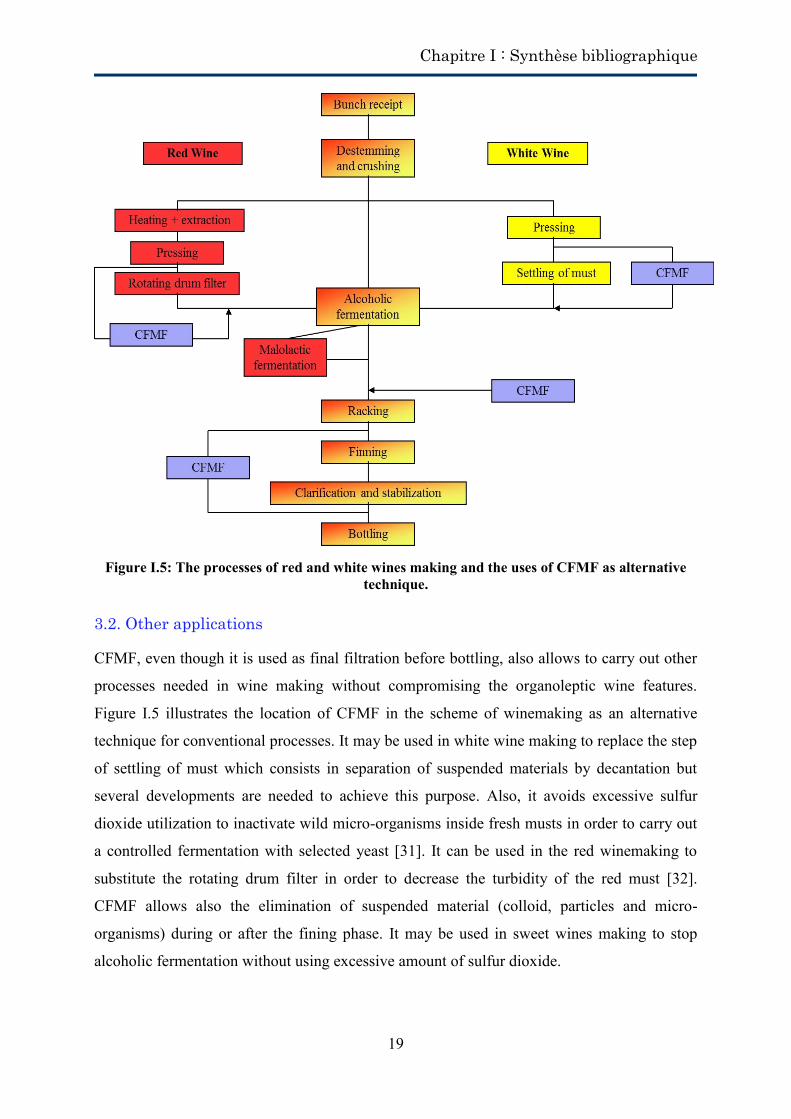
Chapitre I : Synthèse bibliographique
19
Figure I.5: The processes of red and white wines making and the uses of CFMF as alternative
technique.
3.2. Other applications
CFMF, even though it is used as final filtration before bottling, also allows to carry out other
processes needed in wine making without compromising the organoleptic wine features.
Figure I.5 illustrates the location of CFMF in the scheme of winemaking as an alternative
technique for conventional processes. It may be used in white wine making to replace the step
of settling of must which consists in separation of suspended materials by decantation but
several developments are needed to achieve this purpose. Also, it avoids excessive sulfur
dioxide utilization to inactivate wild micro-organisms inside fresh musts in order to carry out
a controlled fermentation with selected yeast [31]. It can be used in the red winemaking to
substitute the rotating drum filter in order to decrease the turbidity of the red must [32].
CFMF allows also the elimination of suspended material (colloid, particles and micro-
organisms) during or after the fining phase. It may be used in sweet wines making to stop
alcoholic fermentation without using excessive amount of sulfur dioxide.
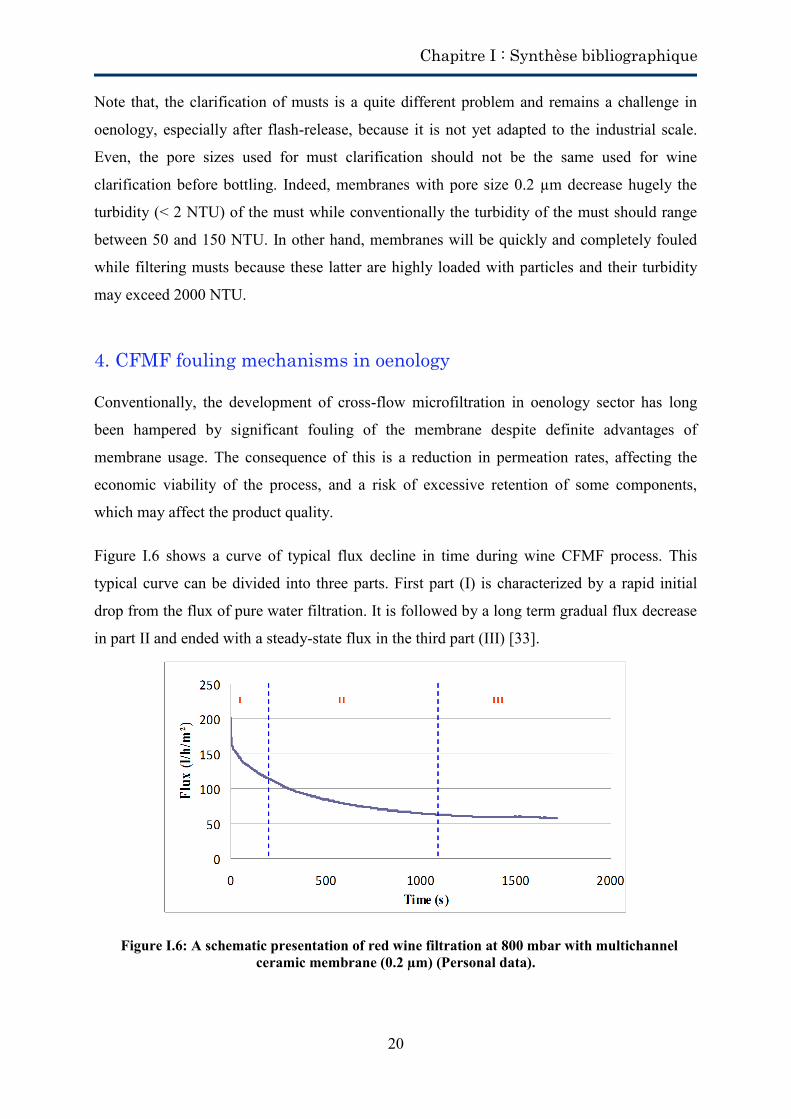
Chapitre I : Synthèse bibliographique
20
Note that, the clarification of musts is a quite different problem and remains a challenge in
oenology, especially after flash-release, because it is not yet adapted to the industrial scale.
Even, the pore sizes used for must clarification should not be the same used for wine
clarification before bottling. Indeed, membranes with pore size 0.2 µm decrease hugely the
turbidity (< 2 NTU) of the must while conventionally the turbidity of the must should range
between 50 and 150 NTU. In other hand, membranes will be quickly and completely fouled
while filtering musts because these latter are highly loaded with particles and their turbidity
may exceed 2000 NTU.
4. CFMF fouling mechanisms in oenology
Conventionally, the development of cross-flow microfiltration in oenology sector has long
been hampered by significant fouling of the membrane despite definite advantages of
membrane usage. The consequence of this is a reduction in permeation rates, affecting the
economic viability of the process, and a risk of excessive retention of some components,
which may affect the product quality.
Figure I.6 shows a curve of typical flux decline in time during wine CFMF process. This
typical curve can be divided into three parts. First part (I) is characterized by a rapid initial
drop from the flux of pure water filtration. It is followed by a long term gradual flux decrease
in part II and ended with a steady-state flux in the third part (III) [33].
Figure I.6: A schematic presentation of red wine filtration at 800 mbar with multichannel ceramic membrane (0.2 µm) (Personal data).
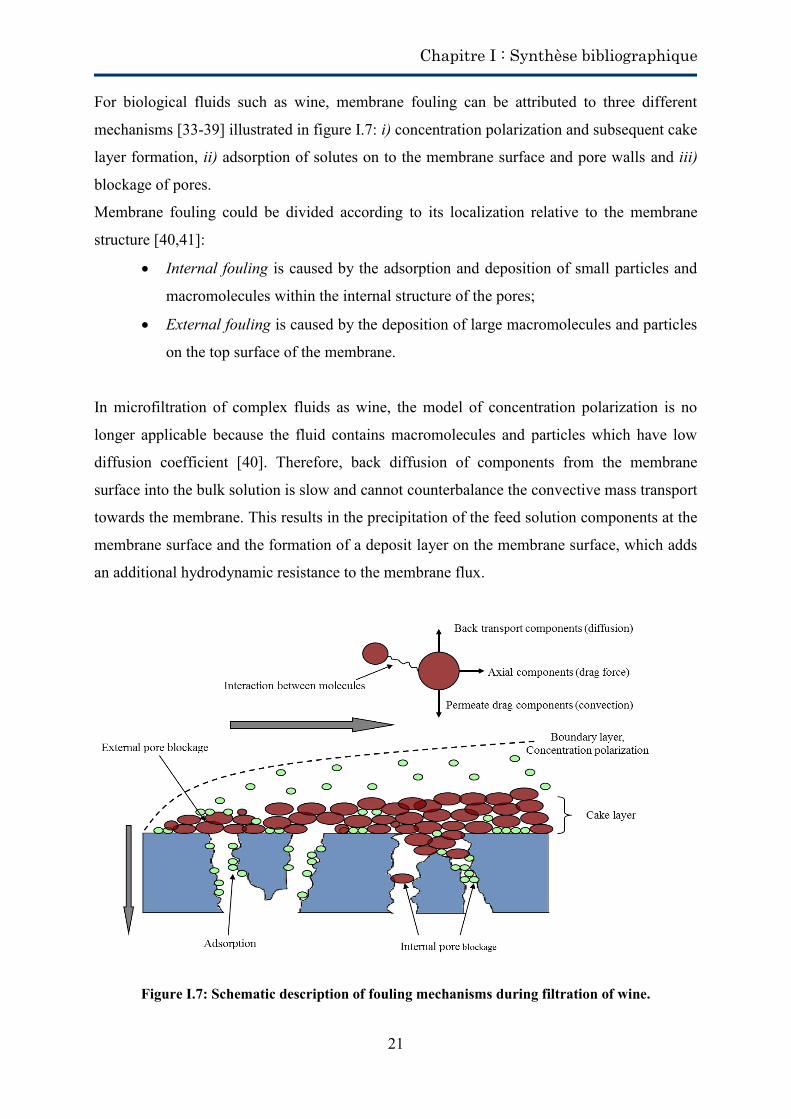
Chapitre I : Synthèse bibliographique
21
For biological fluids such as wine, membrane fouling can be attributed to three different
mechanisms [33-39] illustrated in figure I.7: i) concentration polarization and subsequent cake
layer formation, ii) adsorption of solutes on to the membrane surface and pore walls and iii)
blockage of pores.
Membrane fouling could be divided according to its localization relative to the membrane
structure [40,41]:
Internal fouling is caused by the adsorption and deposition of small particles and
macromolecules within the internal structure of the pores;
External fouling is caused by the deposition of large macromolecules and particles
on the top surface of the membrane.
In microfiltration of complex fluids as wine, the model of concentration polarization is no
longer applicable because the fluid contains macromolecules and particles which have low
diffusion coefficient [40]. Therefore, back diffusion of components from the membrane
surface into the bulk solution is slow and cannot counterbalance the convective mass transport
towards the membrane. This results in the precipitation of the feed solution components at the
membrane surface and the formation of a deposit layer on the membrane surface, which adds
an additional hydrodynamic resistance to the membrane flux.
Figure I.7: Schematic description of fouling mechanisms during filtration of wine.
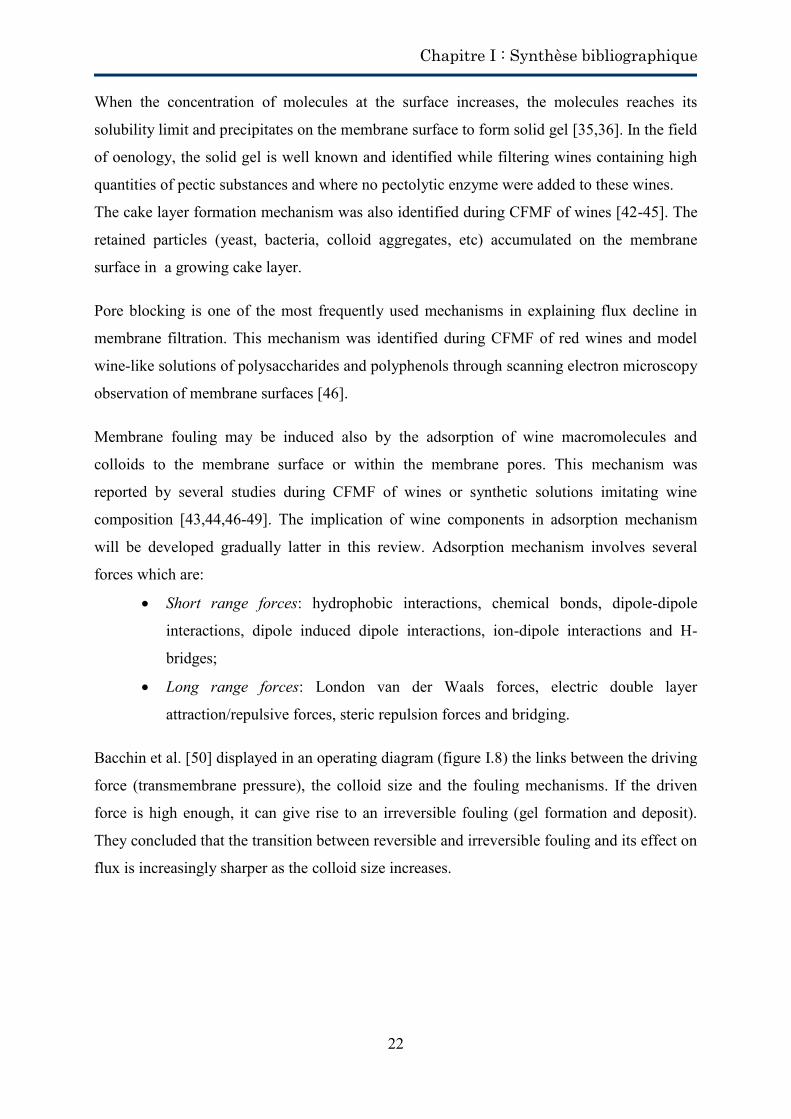
Chapitre I : Synthèse bibliographique
22
When the concentration of molecules at the surface increases, the molecules reaches its
solubility limit and precipitates on the membrane surface to form solid gel [35,36]. In the field
of oenology, the solid gel is well known and identified while filtering wines containing high
quantities of pectic substances and where no pectolytic enzyme were added to these wines.
The cake layer formation mechanism was also identified during CFMF of wines [42-45]. The
retained particles (yeast, bacteria, colloid aggregates, etc) accumulated on the membrane
surface in a growing cake layer.
Pore blocking is one of the most frequently used mechanisms in explaining flux decline in
membrane filtration. This mechanism was identified during CFMF of red wines and model
wine-like solutions of polysaccharides and polyphenols through scanning electron microscopy
observation of membrane surfaces [46].
Membrane fouling may be induced also by the adsorption of wine macromolecules and
colloids to the membrane surface or within the membrane pores. This mechanism was
reported by several studies during CFMF of wines or synthetic solutions imitating wine
composition [43,44,46-49]. The implication of wine components in adsorption mechanism
will be developed gradually latter in this review. Adsorption mechanism involves several
forces which are:
Short range forces: hydrophobic interactions, chemical bonds, dipole-dipole
interactions, dipole induced dipole interactions, ion-dipole interactions and H-
bridges;
Long range forces: London van der Waals forces, electric double layer
attraction/repulsive forces, steric repulsion forces and bridging.
Bacchin et al. [50] displayed in an operating diagram (figure I.8) the links between the driving
force (transmembrane pressure), the colloid size and the fouling mechanisms. If the driven
force is high enough, it can give rise to an irreversible fouling (gel formation and deposit).
They concluded that the transition between reversible and irreversible fouling and its effect on
flux is increasingly sharper as the colloid size increases.
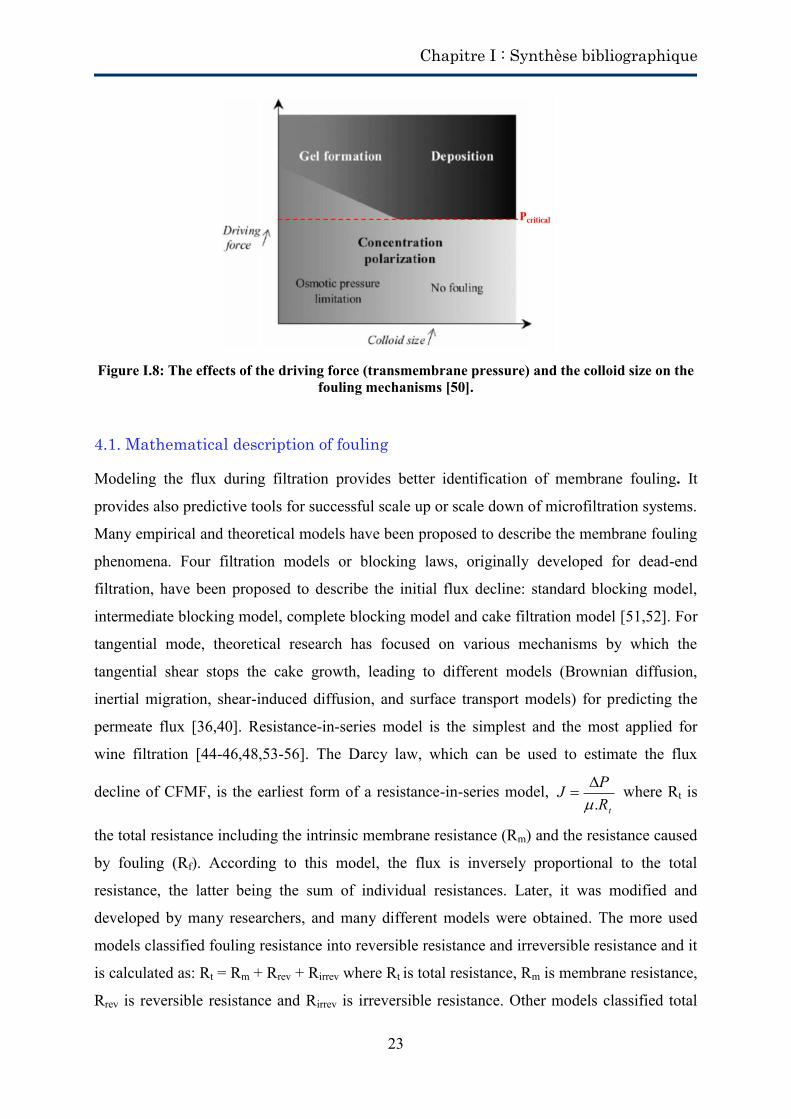
Chapitre I : Synthèse bibliographique
23
Figure I.8: The effects of the driving force (transmembrane pressure) and the colloid size on the
fouling mechanisms [50].
4.1. Mathematical description of fouling
Modeling the flux during filtration provides better identification of membrane fouling. It
provides also predictive tools for successful scale up or scale down of microfiltration systems.
Many empirical and theoretical models have been proposed to describe the membrane fouling
phenomena. Four filtration models or blocking laws, originally developed for dead-end
filtration, have been proposed to describe the initial flux decline: standard blocking model,
intermediate blocking model, complete blocking model and cake filtration model [51,52]. For
tangential mode, theoretical research has focused on various mechanisms by which the
tangential shear stops the cake growth, leading to different models (Brownian diffusion,
inertial migration, shear-induced diffusion, and surface transport models) for predicting the
permeate flux [36,40]. Resistance-in-series model is the simplest and the most applied for
wine filtration [44-46,48,53-56]. The Darcy law, which can be used to estimate the flux
decline of CFMF, is the earliest form of a resistance-in-series model, tR
PJ.
where Rt is
the total resistance including the intrinsic membrane resistance (Rm) and the resistance caused
by fouling (Rf). According to this model, the flux is inversely proportional to the total
resistance, the latter being the sum of individual resistances. Later, it was modified and
developed by many researchers, and many different models were obtained. The more used
models classified fouling resistance into reversible resistance and irreversible resistance and it
is calculated as: Rt = Rm + Rrev + Rirrev where Rt is total resistance, Rm is membrane resistance,
Rrev is reversible resistance and Rirrev is irreversible resistance. Other models classified total
Chapitre I : Synthèse bibliographique
24
resistance into membrane resistance, adsorption resistance, pore blocking resistance,
concentration polarization resistance, internal fouling resistance, external fouling resistance
and resistance of the cake layer [35,57].
These different resistances are conventionally measured through a series of filtration
experiments, as shown in figure I.9, comprising: pure-water filtration, the complex liquid
filtration, and pure water filtration following cake removal. However, such experiments are
not always practical and, in any case, assume complete decoupling of all resistances.
Figure I.9: Schematic representation of the filtration protocol used to determine resistances-in-series adapted to wine filtration from [57].
4.2. Fouling by wine components
Wines show considerable variation in filtration performance due to the complex mixture of
suspended and colloidal matter that comes from components naturally present in the grape
juice, those developed during fermentations and those introduced during fining treatments.
Membrane fouling during filtration of biological origin solutions such as wine, results from a
combination of several mechanisms: adsorption on membrane material, internal fouling of the
pores (pore blocking) by macromolecules and small particles, and external pore fouling by
particles and retained species forming a cake [40]. The impact of these different mechanisms
and the transition from one to another depend on the composition of the fluid to be filtered,
hydrodynamic conditions, characteristics of the membrane, the physico-chemical interactions
that occur between wine constituents and the surface membrane, and the physicochemical
interactions between the constituents themselves [58-60]. For the following, fouling by wine
Chapitre I : Synthèse bibliographique
25
components will be divided into 2 parts: fouling by wine colloids and fouling by wine
particles.
4.2.1. Fouling by wine colloids
The colloidal state in wines is not accurately defined at this time. A wide range of unrelated
substances with very different origins and chemical compositions are able to form colloidal
dispersions. Colloids in wine are pectic substances, yeast polysaccharides, proteins, and
molecular aggregates resulting from the association of small solutes such as polyphenol
aggregates. The colloid dispersions in wine during filtration may be stable or unstable
depending on several physico-chemical parameters (pH, surface interactions, hydrodynamic
conditions, etc). Vernhet et al. [44] showed that the macromolecular compounds present in
wines induce a sharp and irreversible fouling. The importance of this fouling is dependent on
the composition of wine colloids and their complexes and aggregates; there is a lack of
information concerning their composition, size distribution and volume fraction.
In the following part, a special attention will be made to the general knowledge on colloids
given the limited information available on wine colloids. It is also essential for understanding
and explaining some fouling behaviours.
The phenomena of adsorption, adhesion and aggregation in liquid media result from a
complex balance between the interactions that occur between the different colloids, surfaces
and solvents. The interactions involved in these phenomena are:
Interactions of Lifshtitz-van der Waals;
Electrostatic repulsion related to the recovery of electrical double layer
surrounding two charged constituents in the solution;
Polar interactions or acid-base Lewis character;
Forces associated to Brownian motion.
A major characteristic of colloidal systems is to have properties very changeable depending
on their volume fraction or concentration. Five different phases appear relative to the
concentration and the degree of destabilization as shown in figure I.10 [50,60]
“Gas” phase: diluted dispersion of stable particles having a free and random
motion;
“Liquid” phase: network of stable colloids interacting by repulsion then moving
from and towards equilibrium position;
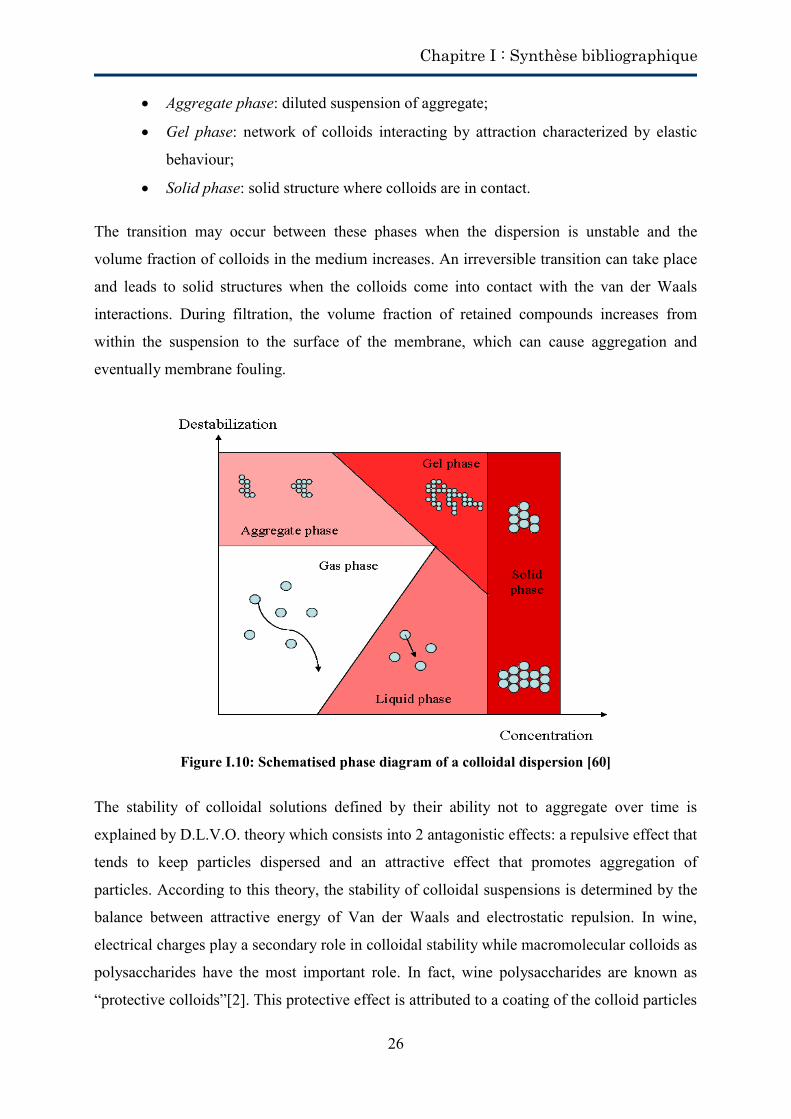
Chapitre I : Synthèse bibliographique
26
Aggregate phase: diluted suspension of aggregate;
Gel phase: network of colloids interacting by attraction characterized by elastic
behaviour;
Solid phase: solid structure where colloids are in contact.
The transition may occur between these phases when the dispersion is unstable and the
volume fraction of colloids in the medium increases. An irreversible transition can take place
and leads to solid structures when the colloids come into contact with the van der Waals
interactions. During filtration, the volume fraction of retained compounds increases from
within the suspension to the surface of the membrane, which can cause aggregation and
eventually membrane fouling.
Figure I.10: Schematised phase diagram of a colloidal dispersion [60]
The stability of colloidal solutions defined by their ability not to aggregate over time is
explained by D.L.V.O. theory which consists into 2 antagonistic effects: a repulsive effect that
tends to keep particles dispersed and an attractive effect that promotes aggregation of
particles. According to this theory, the stability of colloidal suspensions is determined by the
balance between attractive energy of Van der Waals and electrostatic repulsion. In wine,
electrical charges play a secondary role in colloidal stability while macromolecular colloids as
polysaccharides have the most important role. In fact, wine polysaccharides are known as
“protective colloids”[2]. This protective effect is attributed to a coating of the colloid particles
Chapitre I : Synthèse bibliographique
27
that prevents them from agglomerating. This was highlighted by the effect of mannoproteins
on wine protein stability [61] and on tartaric stability [62]. This protective effect is not only
specific to mannoproteins but also to pectic polysaccharides. When decomposing the pectic
polysaccharides by adding pectolytic enzymes, the system becomes unstable and colloids (as
proteins, tannins, ferrous phosphate, ferric ferrocyanide and copper sulfide) tend to flocculate.
Therefore, wine clarification becomes easier to process.
4.2.1.1. Fouling by wine’s polysaccharides
Several studies [5, 43,44,46-49,63-66] have reported the incidence of wine polysaccharides on
the performance of microfiltration membranes. They have demonstrated their negative effect
on the permeation flux. Feuillat et al. [5] pointed out while filtering 2 red wines on 0.2 µm
ceramic membrane, big losses in polysaccharides up to 66 %.
The researchers noticed that the membrane fouling by a given wine is not directly related to
its total polysaccharides content but rather to the composition, structure of these
polysaccharides and the balance between different groups of polysaccharides [47,65]. At wine
pH, wine polysaccharides are essentially basic (donor of electron pair, H+ acceptor) and
hydrophilic macromolecules. They are adsorbed in very small quantities due to unfavorable
acid/base interactions. The adsorbed compounds are essentially arabinogalactan type II (AG-
II) and mannoproteins [47]. While studying the effects of membrane surface properties on
wine polysaccharides adsorption, it was shown that polysaccharides adsorption was negligible
under static conditions and shown to be governed by membrane polarity. It decreased as
surface polarity increased due to hydrophilic repulsion between surface and the hydrophilic
macromolecules. However, it is well known that these results cannot be extrapolated to
dynamic conditions during membrane filtration.
A recent study [49] had provided evidence that different membrane materials (polypropylene
(PP) and polyethersulfone (PES)) exhibit different levels of adsorption of typical foulants in
wine such as polysaccharides. In contradiction with [47], it was shown that larger amounts of
polysaccharides were adsorbed to PES than to PP membrane. To notice that, PES membrane
presents hydrophilic character while PP membrane has hydrophobic character.
The results of a study [65] on an organic membrane (PES) with synthetic solutions show that
the effects of polysaccharides on fouling are not similar, due to the nature of polysaccharides
fraction involved in the fouling. It was shown that the pectic polysaccharide of low molecular
Chapitre I : Synthèse bibliographique
28
weight (rhamnogalacturonan type II: RG-II) have no noticeable effect on the permeation flux,
whereas mannoproteins play a crucial role in reducing the fluxes. It was shown that
mannoproteins have the most pronounced fouling effect among the polysaccharides in wine.
Their impact on the flow is dependent on their concentration. This effect results from their
natural abundance and their high molecular weight. But their effect is reduced by sealing the
presence of pectic polysaccharides, suggesting that the performance of the membrane will
depend on the balance between the polysaccharides from the grapes and those from yeast.
Vernhet et al. [46] tested the effect of wine polysaccharides on three organic membranes (M1
and M2 made from PES+PVP with different amount of polyvinylpyrrolidone (PVP) and M4
made from polyvinylchloride (PVC)). They showed that the polysaccharides adsorption was
negligible in static membranes for the three membranes. They related these results to
membrane wetting and conditioning with the synthetic wine that promotes hydrophilic
repulsion between materials and polysaccharides. By filtering wines enriched with
polysaccharides, no significant differences were observed between the three membranes in
terms of amount and nature of the deposited polysaccharides. A specific deposition of
arabinogalactan-proteins type II (AGP-II) and mannoproteins was noticed on the surface of
the membrane. Scanning electron microscopy observations revealed the presence of
aggregates within the most external pores of the membranes, partially blocking these pores
and leading to more or less regular surface deposits. Membrane fouling by polysaccharides is
considered to be related to their accumulation on membranes, mostly at the pores entrance and
on surface. The adsorption of polysaccharides is quantitatively very low because of
unfavorable acid/base interactions with membrane (polysaccharides are hydrophilic and basic,
donor of electron pair, molecules).
Belleville et al. [66] have shown while filtering a wine on mineral membrane that the RG-II
presents an abnormally high fouling power even if it has a low molecular weight. It could be
explained by its preferential adsorption in the positive charged membrane given its negative
charge at pH of wine. Also, they have shown that an insoluble polysaccharide fraction
(predominantly a linear arabinan) induces a significant reduction in filtration rate.
4.2.1.2. Fouling by wine polyphenols
Several studies have reported the involvement of wine phenolic compounds in the membrane
fouling during cross-flow microfiltration [3,43,46-49,55,64,66,67,68].
Chapitre I : Synthèse bibliographique
29
Poirier et al. [3] has repeatedly pointed out that the phenolic compounds of wine may play a
role in membrane fouling while filtering a wine on alumina membrane. He also highlighted
the adsorption of dye on the membrane, which could partly explain the obtained poor
permeate fluxes. Other studies [64,66] have shown that the colloidal deposit on an alumina
membrane showed an intense red color, and therefore it was not exclusively composed of
polysaccharides but also probably contain polyphenols. According to Czekaj et al. [55], while
filtering two white wines having the same initial turbidity, the different polyphenol
concentrations of the 2 wines may explain the different performances observed during
filtration.
The involvement of wine polyphenols in the membrane fouling has been identified by
washing the fouled membrane with acidified methanol [43]. Significant increases in
permeability were obtained. This fact can be attributed to the elimination of the layers of
phenolic compounds because the other wine constituents are insoluble in this solvent. HPLC
analysis of methanol extracts of fouled membrane revealed that during cross-flow
microfiltration, polyphenols interact with the membrane material. It is worth to notice that
polyphenols are amphipathic molecules with hydrophobic aromatic rings and hydrophilic
phenolic hydroxyl groups. So their adsorption involves both hydrophobic effects and the
formation of hydrogen bonds. The preferential adsorption of phenolic compounds with low
polarity suggests the predominance of hydrophobic interactions.
Phenolic compounds have a much more important affinity for membranes than the
polysaccharides and there are both quantitative and qualitative differences between the
different materials tested. To better understand the impact of phenolic compounds on
membrane fouling, some studies were investigating the relationship between the polarity of
surfaces and adsorption of flavan-3-ols and procyanidins monomers [47,49]. The overall
results show that flavan-3-ols and procyanidins mainly react as acidic compounds (acceptor of
electron pair or donor of H+) due to their hydroxyl (OH) groups of phenolic nuclei and
highlight the importance of the formation of H bonds in their physico-chemical reactivity.
They also note that once the number of nuclei phenols is greater than two, the affinity of
compounds to surfaces is greatly increased regardless of the polarity of the latter.
Polyphenol adsorption under static conditions increased with the polarity of the membrane
and the ability of its surface to act as hydrogen acceptor (basic character) in hydrogen bonding
which strengthens the interaction [47]. There is a direct relationship between membrane
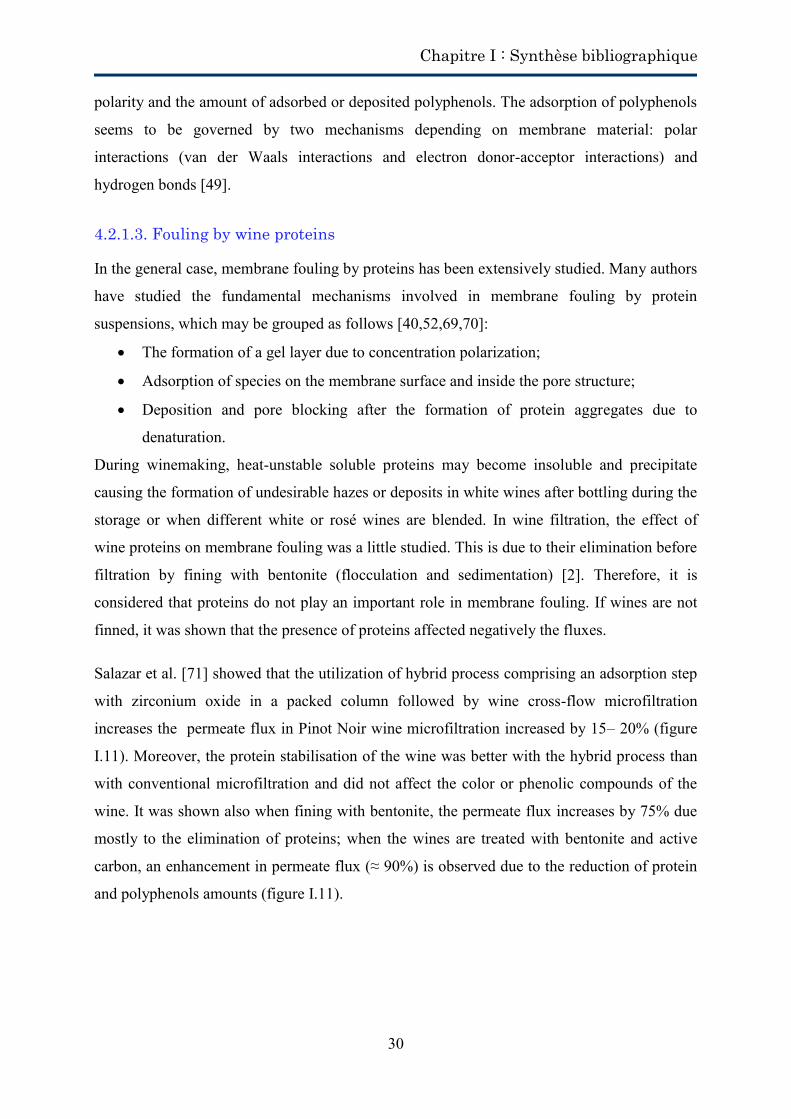
Chapitre I : Synthèse bibliographique
30
polarity and the amount of adsorbed or deposited polyphenols. The adsorption of polyphenols
seems to be governed by two mechanisms depending on membrane material: polar
interactions (van der Waals interactions and electron donor-acceptor interactions) and
hydrogen bonds [49].
4.2.1.3. Fouling by wine proteins
In the general case, membrane fouling by proteins has been extensively studied. Many authors
have studied the fundamental mechanisms involved in membrane fouling by protein
suspensions, which may be grouped as follows [40,52,69,70]:
The formation of a gel layer due to concentration polarization;
Adsorption of species on the membrane surface and inside the pore structure;
Deposition and pore blocking after the formation of protein aggregates due to
denaturation.
During winemaking, heat-unstable soluble proteins may become insoluble and precipitate
causing the formation of undesirable hazes or deposits in white wines after bottling during the
storage or when different white or rosé wines are blended. In wine filtration, the effect of
wine proteins on membrane fouling was a little studied. This is due to their elimination before
filtration by fining with bentonite (flocculation and sedimentation) [2]. Therefore, it is
considered that proteins do not play an important role in membrane fouling. If wines are not
finned, it was shown that the presence of proteins affected negatively the fluxes.
Salazar et al. [71] showed that the utilization of hybrid process comprising an adsorption step
with zirconium oxide in a packed column followed by wine cross-flow microfiltration
increases the permeate flux in Pinot Noir wine microfiltration increased by 15– 20% (figure
I.11). Moreover, the protein stabilisation of the wine was better with the hybrid process than
with conventional microfiltration and did not affect the color or phenolic compounds of the
wine. It was shown also when fining with bentonite, the permeate flux increases by 75% due
mostly to the elimination of proteins; when the wines are treated with bentonite and active
carbon, an enhancement in permeate flux (≈ 90%) is observed due to the reduction of protein
and polyphenols amounts (figure I.11).
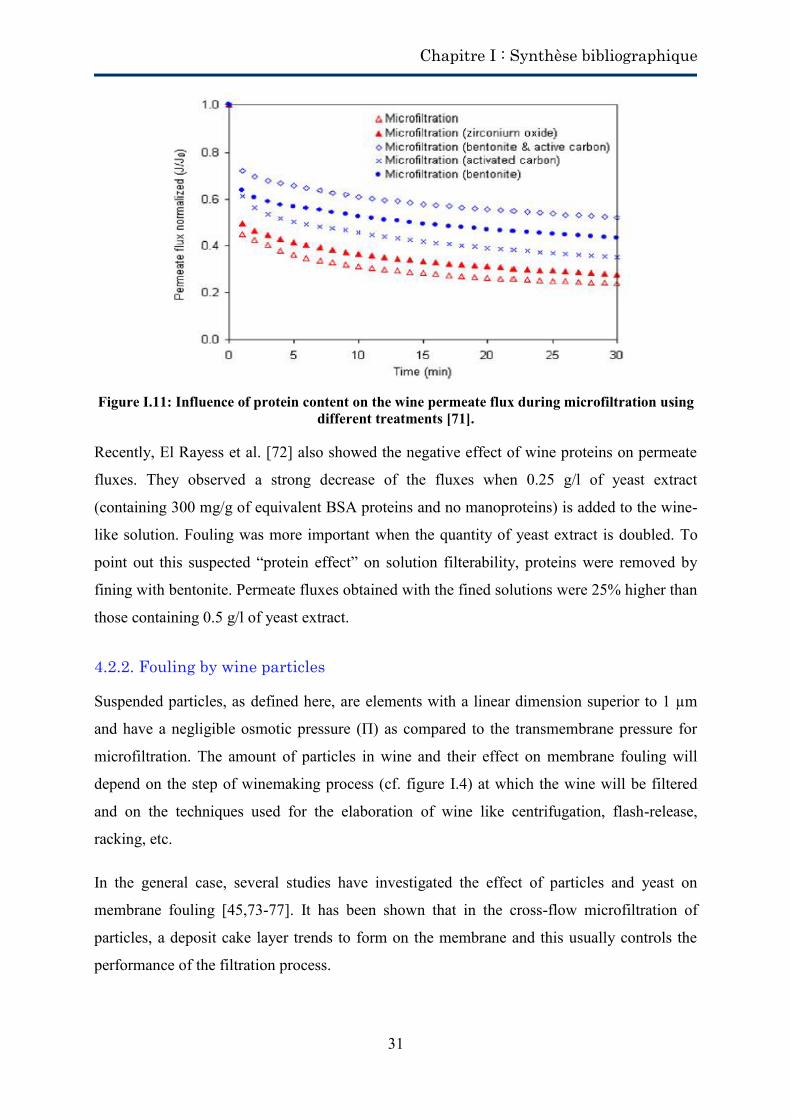
Chapitre I : Synthèse bibliographique
31
Figure I.11: Influence of protein content on the wine permeate flux during microfiltration using
different treatments [71].
Recently, El Rayess et al. [72] also showed the negative effect of wine proteins on permeate
fluxes. They observed a strong decrease of the fluxes when 0.25 g/l of yeast extract
(containing 300 mg/g of equivalent BSA proteins and no manoproteins) is added to the wine-
like solution. Fouling was more important when the quantity of yeast extract is doubled. To
point out this suspected “protein effect” on solution filterability, proteins were removed by
fining with bentonite. Permeate fluxes obtained with the fined solutions were 25% higher than
those containing 0.5 g/l of yeast extract.
4.2.2. Fouling by wine particles
Suspended particles, as defined here, are elements with a linear dimension superior to 1 µm
and have a negligible osmotic pressure (Π) as compared to the transmembrane pressure for
microfiltration. The amount of particles in wine and their effect on membrane fouling will
depend on the step of winemaking process (cf. figure I.4) at which the wine will be filtered
and on the techniques used for the elaboration of wine like centrifugation, flash-release,
racking, etc.
In the general case, several studies have investigated the effect of particles and yeast on
membrane fouling [45,73-77]. It has been shown that in the cross-flow microfiltration of
particles, a deposit cake layer trends to form on the membrane and this usually controls the
performance of the filtration process.
Chapitre I : Synthèse bibliographique
32
Yeast cells have been shown to form compressible cakes under transmembrane pressure
within the range 0 – 4 bars [77]. It was also shown that large particles in crude wine were only
implied in reversible fouling while the removal of these particles did not modify the
irreversible fouling [44]. During their experiments on cross-flow microfiltration of wine
containing yeasts, Boissier et al. [45] proved that the increase in the total resistance related to
yeast deposition is due to the compaction of the cake layer on the surface of the membrane.
The same authors [45] found also that fouling is governed by fines particles (lactic bacteria
and colloidal aggregates) more than yeast. The scanning electronic microscopy observations
showed that these fines particles formed a coherent and adherent cake on the membrane
surface. It must be noticed that the lactic bacteria concentrations are too high comparing those
found in wines after malolactic fermentations or aged wines.
Czekaj et al. [54] studied the effect of particles and macromolecular aggregates of wine on the
membrane fouling. They concluded that the removal of large particles, aggregates and high
macromolecular weight fraction from the wine, led to a change in fouling behavior. They
observed a reduction in the final total resistance (20 times lower).
Other works have investigated the effect of yeast and colloidal solutions (essentially proteins)
on membrane fouling [74-76]. They showed that yeast cells would then lead to a less compact
deposit at the membrane surface and enhance permeate flow compared to solutions containing
only colloids. In fact, external cake of rejected particles plays an important role in filtration
processes. It may act as a secondary or dynamic membrane which screens the first membrane
from the more strongly fouling species of smaller size (figure I.12). However, it is depending
on the yeast or particles concentration, on the membrane characteristics as well as on the
hydrodynamic conditions [74,75].
Figure I.12: Proposed mechanisms for microfiltration membrane fouling by colloids with and without particles [75].
Chapitre I : Synthèse bibliographique
33
4.3. Parameters influencing membrane fouling
It is well known that several parameters of the CFMF process play a key role in membrane
fouling. The control of fouling requires the implementation of technological solutions to
compensate the decrease of productivity. This could be achieved through a judicious choice of
the membrane material and an optimal choice of operating conditions used for filtration. The
parameters influencing membrane fouling, summarized in table I.3, cover hydrodynamics and
operating conditions, membrane characteristics as well as the fluid characteristics.
Table I.3: Summary of the parameters influencing membrane fouling
Parameters
Operating conditions
Transmembrane pressure, permeate flux, cross-flow velocity and temperature
Membrane charcteristics
Pore size, porosity, hydrophilicity / hydrophobicity character and surface free energy
Fluid characteristics
Physico-chemical interactions (electrostatic, polar, etc), pH, ionic strength, suspension concentration, suspension size and viscosity
4.3.1. Operating conditions
4.3.1.1. Transmembrane pressure
Darcy’s law indicates that the flow rate of a liquid through a porous membrane is directly
proportional to the applied pressure gradient. In fact, studies showed that this law is valid for
free colloidal solutions or solutions containing large particles. Tarleton and Wakeman [78]
found that the permeate flux is not proportional to the hydraulic pressure gradient during
filtration and only small increases in flux are observed for increases in pressure when feeds
contain a high proportions of particle fines. Jaffrin et al. [79] showed, while filtering red wine
and white wine, that an increase in transmembrane pressure increases the fluxes of the both
filtrations. The results highlight also that the flow rate was not proportional to the applied
pressure. Same observations were found by Vernhet el al. [44] and Cassano et al. [56]. This
can be explained by the high amount of colloids and fine particles in the crude wines.
Poirier et al. [3] revealed that the permeate flux of wine increases when the transmembrane
pressure passes from 1 to 3 bar, then it remains almost identical when the pressure rises till 9
bar. Song and Elimelech [34] showed that if the applied pressure is smaller than a pressure
which is named as “critical pressure”, the particles brought to the membrane surface by
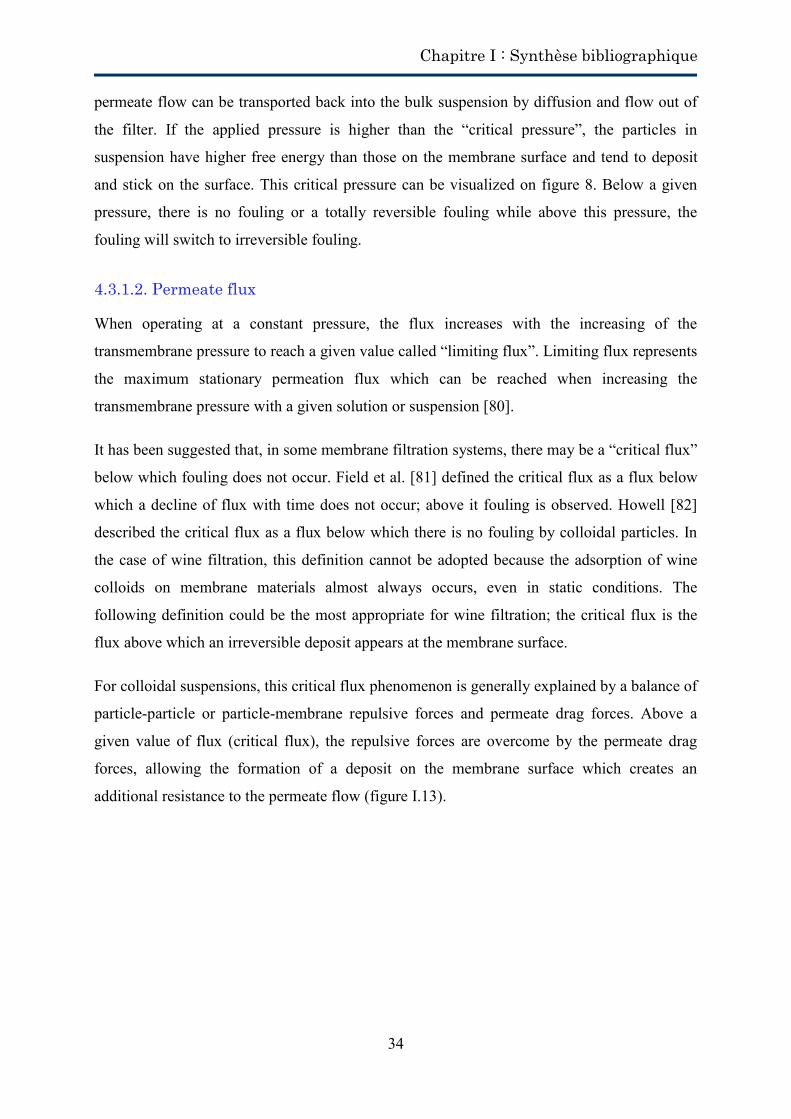
Chapitre I : Synthèse bibliographique
34
permeate flow can be transported back into the bulk suspension by diffusion and flow out of
the filter. If the applied pressure is higher than the “critical pressure”, the particles in
suspension have higher free energy than those on the membrane surface and tend to deposit
and stick on the surface. This critical pressure can be visualized on figure 8. Below a given
pressure, there is no fouling or a totally reversible fouling while above this pressure, the
fouling will switch to irreversible fouling.
4.3.1.2. Permeate flux
When operating at a constant pressure, the flux increases with the increasing of the
transmembrane pressure to reach a given value called “limiting flux”. Limiting flux represents
the maximum stationary permeation flux which can be reached when increasing the
transmembrane pressure with a given solution or suspension [80].
It has been suggested that, in some membrane filtration systems, there may be a “critical flux”
below which fouling does not occur. Field et al. [81] defined the critical flux as a flux below
which a decline of flux with time does not occur; above it fouling is observed. Howell [82]
described the critical flux as a flux below which there is no fouling by colloidal particles. In
the case of wine filtration, this definition cannot be adopted because the adsorption of wine
colloids on membrane materials almost always occurs, even in static conditions. The
following definition could be the most appropriate for wine filtration; the critical flux is the
flux above which an irreversible deposit appears at the membrane surface.
For colloidal suspensions, this critical flux phenomenon is generally explained by a balance of
particle-particle or particle-membrane repulsive forces and permeate drag forces. Above a
given value of flux (critical flux), the repulsive forces are overcome by the permeate drag
forces, allowing the formation of a deposit on the membrane surface which creates an
additional resistance to the permeate flow (figure I.13).
Chapitre I : Synthèse bibliographique
35
Figure I.13: Summarizing of membrane fouling state depending on the system forces.
In the literature, many researchers have been studying the critical flux, but only one paper can
be found about critical flux concerning wine filtration [45]. The aim of this work was to
evaluate, under different hydrodynamic conditions, the properties of the deposited layers
formed by yeast and fine particles (lactic bacteria and colloidal aggregates). They found that
fouling by yeast cells in synthetic solutions can be avoided by maintaining the permeate flux
under 2 x 10⁻⁴ m.s-1. They also found, when filtering solutions containing yeasts and wine
macromolecules, that macromolecules enhance the hydraulic resistance by fouling internally
the yeast cell cake formed at the membrane surface.
4.3.1.3. Cross-flow velocity
Several studies have revealed cross-flow velocity to be a major influence on membrane
fouling [3,42,79,83]. The cross-flow velocity affects the mass transport of particles away from
the membrane surface, and thus the resultant cake layer thickness, by increasing the shear
stress and so shear-induced diffusion. So, an increase in cross-flow velocity improves the
permeate flow rate.
For wine filtration, Mietton-Peuchot et al. [42] observed that increasing in cross-flow velocity
from 0.8 to 1.6 to 2.5 m/s doesn’t affect significantly the permeate flux. Jaffrin et al. [79] also
showed that for both wines studied (red and white wines); there is no systematic variation of
fluxes with fluid velocity. Those both observations are in contradiction with the theory. In
Chapitre I : Synthèse bibliographique
36
opposition, Poirier et al. [3] and Lüdemann [83] found that increasing flow velocities
improved flux rate. This improvement of permeate flux seems to be linearly with the
increasing of the flow velocity [83]. But, it must be noticed that the used white wine was
finned with bentonite, so it is impoverished in total colloids especially proteins and the
amounts in colloidal particles/aggregates were lower.
The most used cross-flow velocity in wine cross-flow microfiltration is 2 m.s-1. It insures
satisfying shear stress and preserves the wine quality. In fact, any increase in cross-flow
velocity induces a rise in the temperature of the wine and can alter the organoleptic
characteristics of the wine.
4.3.1.4. Temperature
The permeate flow in Darcy’s law is inversely proportional to the viscosity (µ). The viscosity
increases with solute concentration and decreases with temperature. So temperature impacts
on membrane filtration through its influence on permeate fluid viscosity. A possible method
for analyzing the influence of temperature on R, would be to do two series of flux
measurements: one in which the viscosity of the feed liquid is increased by adding viscosity
increasing solutes and one in which the viscosity of the feed liquid is increased by lowering
the temperature. The temperature effect can then be separated from the viscosity effect.
A rise in temperature will affect positively the permeate flow. In other hand, it is well known
that wine temperature should not exceed 25°C, in order to not modify the organoleptic
characteristics. Recently, Romat & Jarny [84] tested the impact of temperature on wine
viscosity. The results are shown in table I.4. The results showed an increase in wine viscosity
when decreasing the temperature. This observation is more important for sweet wines.
Table I.4: Variation of dynamic viscosity of 3 different wines with temperature [84]
Sample Dynamic viscosity (mPa.s)
20 °C 15 °C 10 °C 4 °C
Water 1.00 1.14 1.30 1.56
Bordeaux dry white wine 2.53 2.58 3.02 3.67
Bordeaux red wine 2.22 2.64 3.12 3.86
Bordeaux sweet white wine 3.84 4.52 5.41 6.88
Chapitre I : Synthèse bibliographique
37
The decrease in temperature doesn’t only affect the viscosity but it decreases the Brownian
movement of particles and favours the attraction between particles.
Lüdemann [83] showed, while filtering a fined white wine with a cross-flow microfiltration
pilot, that an increase of the filtration temperature not only yields higher flux rates but also
has a positive effect on back-flushing. This observation could be explained by an alteration of
the colloidal systems in the wine and the reduction of the viscosity.
Jaffrin et al. [79] found that the total resistance decrease linearly when temperature increases.
The rate of decrease is larger for the red wine. They related this fact also to the changes in the
colloidal system of the deposited layer.
4.3.2. Membrane characteristics
It is well known that membrane characteristics such as pore size, porosity, surface free
energy, charge, roughness, hydrophilicity / hydrophobicity, etc., have a direct impact on
membrane fouling. There is a wide variety of membrane materials proposed for the tangential
filtration of wines. They are divided into organic membranes and ceramic membranes. Table
I.5 reports the main membrane materials used in wine filtration as mentioned in the literature.
Pore size and pore size distribution on membrane fouling are likely to be one of the
parameters affecting membrane performance. A narrow pore size distribution is preferred to
control membrane fouling in cross-flow microfiltration. The effects of pore size and pore size
distribution on membrane fouling are strongly related to the feed solution characteristics and
in particular the particle size distribution. Poirier et al. [3] tested 3 average pore sizes (0.2,
0.45 and 1.2 µm) for wine filtration and they found similar membrane performances in term
of permeate flux. Also, Peri et al. [6] performed wine filtration with membranes having
average pore diameter less than 0.2 µm (0.2µm, 0.02 µm and 0.005 µm). It was concluded
that membrane with average pore diameter of 0.2 µm showed the best results in term of
permeate flux and wine quality. Chang et al. [85] found while investigating the effect of pore
size on flux from alcohol-distillery wastes, that the flux produced from 0.05 µm pore size to
be higher than that from 0.4 µm membrane. In general, a membrane with a higher porosity
will have a better distribution of the permeate flux on the porous surface and should lead to
less fouling.
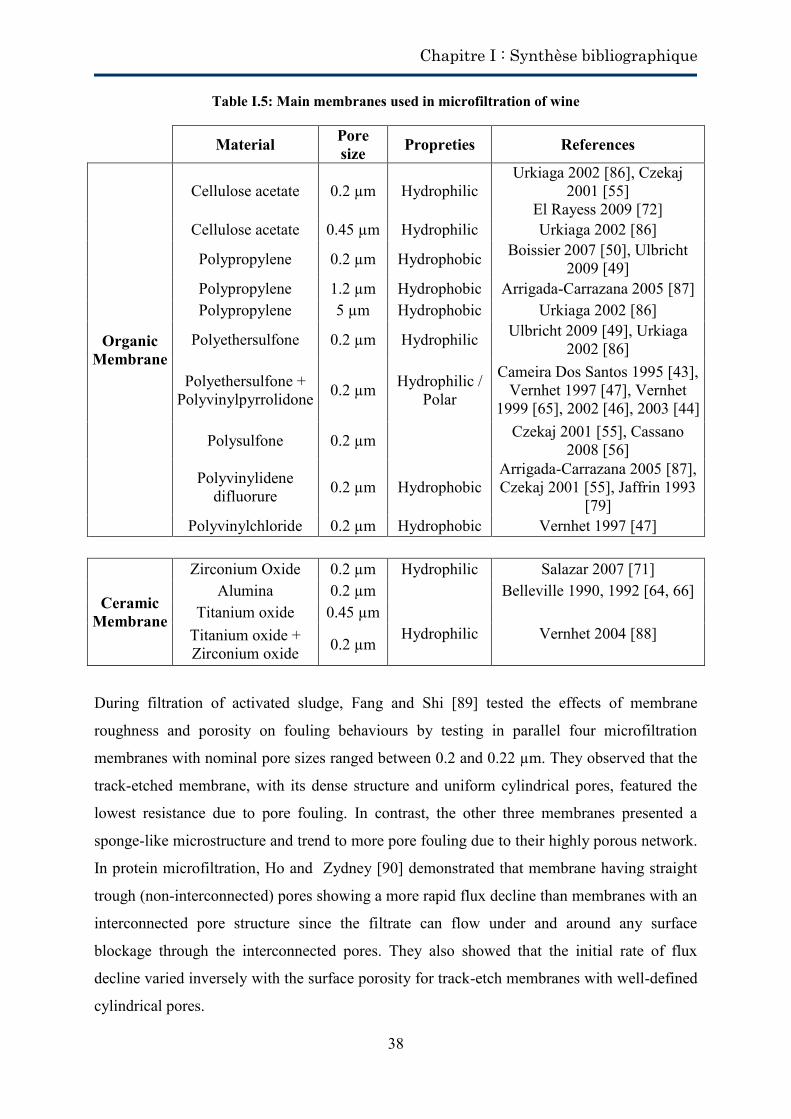
Chapitre I : Synthèse bibliographique
38
Table I.5: Main membranes used in microfiltration of wine
Material Pore size Propreties References
Organic Membrane
Cellulose acetate 0.2 µm Hydrophilic Urkiaga 2002 [86], Czekaj
2001 [55] El Rayess 2009 [72]
Cellulose acetate 0.45 µm Hydrophilic Urkiaga 2002 [86]
Polypropylene 0.2 µm Hydrophobic Boissier 2007 [50], Ulbricht 2009 [49]
Polypropylene 1.2 µm Hydrophobic Arrigada-Carrazana 2005 [87] Polypropylene 5 µm Hydrophobic Urkiaga 2002 [86]
Polyethersulfone 0.2 µm Hydrophilic Ulbricht 2009 [49], Urkiaga 2002 [86]
Polyethersulfone + Polyvinylpyrrolidone 0.2 µm Hydrophilic /
Polar
Cameira Dos Santos 1995 [43], Vernhet 1997 [47], Vernhet
1999 [65], 2002 [46], 2003 [44]
Polysulfone 0.2 µm Czekaj 2001 [55], Cassano 2008 [56]
Polyvinylidene difluorure 0.2 µm Hydrophobic
Arrigada-Carrazana 2005 [87], Czekaj 2001 [55], Jaffrin 1993
[79] Polyvinylchloride 0.2 µm Hydrophobic Vernhet 1997 [47]
Ceramic Membrane
Zirconium Oxide 0.2 µm Hydrophilic Salazar 2007 [71] Alumina 0.2 µm Belleville 1990, 1992 [64, 66]
Titanium oxide 0.45 µm Hydrophilic Vernhet 2004 [88] Titanium oxide +
Zirconium oxide 0.2 µm
During filtration of activated sludge, Fang and Shi [89] tested the effects of membrane
roughness and porosity on fouling behaviours by testing in parallel four microfiltration
membranes with nominal pore sizes ranged between 0.2 and 0.22 µm. They observed that the
track-etched membrane, with its dense structure and uniform cylindrical pores, featured the
lowest resistance due to pore fouling. In contrast, the other three membranes presented a
sponge-like microstructure and trend to more pore fouling due to their highly porous network.
In protein microfiltration, Ho and Zydney [90] demonstrated that membrane having straight
trough (non-interconnected) pores showing a more rapid flux decline than membranes with an
interconnected pore structure since the filtrate can flow under and around any surface
blockage through the interconnected pores. They also showed that the initial rate of flux
decline varied inversely with the surface porosity for track-etch membranes with well-defined
cylindrical pores.
Chapitre I : Synthèse bibliographique
39
Kuiper et al. [91] noticed that beer filtration through slits gives a much higher flux than
through circular pores. The difference in flux is approximately a factor 4 to 5. They attributed
this observation to the fact that slit cannot be blocked completely by a spherical particle and
particles have less membrane surface to adhere to. And, if a colloid layer grows on the inside
of the pores, the flow resistance of a slit decreases much less than that of a circle.
In membrane science, materials always show different fouling behaviours due to their free
surface energy and their hydrophilicity / hydrophobicity character. In general, membrane
fouling occurs more readily on hydrophobic membranes than on hydrophilic ones because of
the attractive hydrophobic interaction between foulants and membranes. As a result, much
attention has been given to reduce fouling by modifying hydrophobic membranes to relatively
hydrophilic. Recent experience [49,86] in wine filtration had indicated that membranes with
the same pore structure and sizes but made from different membrane polymer (cf. table 5) had
shown quite different filtration performance. Researchers have mentioned that the
polysaccharides and tannins adsorption take part in irreversible fouling of membranes during
the cross-flow microfiltration of wine. This adsorption is dependent on the membrane surface
properties, especially its surface free energy, and could be minimized by the development of
adequate materials. Belleville et al. [64,66] showed that the small chain of acidic
polysaccharides (rhamnogalacturonans) were adsorbed on the alumina membrane and
adsorption was attributed to electrostatic interactions between positively charged alumina and
negatively charged polysaccharides at wine pH. Vernhet et al. [47] concluded that
polysaccharides adsorption is governed by membrane polarity: it decreased as surface polarity
increased due to hydrophilic repulsion between surface and the hydrophilic macromolecules.
They also observed a direct relationship between the adsorption of polyphenols and
membrane polarity. Polyphenols adsorption increased as the polarity and the basic component
of the membrane surface free energy increased.
Ulbricht et al. [49] showed that the adsorption of polysaccharides and polyphenols occurs
more on polar polyethersulfone (PES) membranes than on non-polar polypropylene
membranes. In fact, polar interactions were much stronger with polyethersulfone membrane
than with polypropylene membrane and hydrogen bonds towards the additive PVP in PES
may further increase adsorption tendency. It is worth to notice that the polyphenol compound
used by Ulbricht et al. [49] is tannic acid which not represents the true polyphenol groups in
the wine.
Chapitre I : Synthèse bibliographique
40
So, the apolar character of the PP membrane results in a different behaviour of membrane
fouling by wine macromolecules, which remains very limited. The total lack of polar bonds is
therefore a decisive factor in sealing materials by the macromolecules of wine. Therefore, it is
interesting to further study on the PP membranes (or other apolar material) which may
enhance permeate fluxes during cross-flow microfiltration and results in longer service life.
4.3.3. Fluid characteristics
It is well admitted that membrane fouling depends on the hydrodynamic conditions and
membrane characteristics as well as on the composition and the characteristics of the fluid to
be filtered. Fluid characteristics (pH, particles size, interactions, etc.) will strongly impact the
physico-chemical interactions that occur between the fluid constituents and the membrane
surface as well as the physico-chemical interactions between these constituents [92, 93].
As mentioned before, wine is a complex medium containing solutes, colloids and large
particles. The main difficulties with a fluid such as wine are related to the unawareness of the
whole particulate fraction and colloids which constitutes the fluid. It lacks information on the
composition of the colloids, their stability, their size distribution and volume fraction that may
represent. These parameters vary from one product to another, due to the type of cultivar, the
climate, the techniques used for winemaking and the storage conditions.
Many fluid characteristics have an impact on wine filtration. These characteristics include pH,
ethanol content, physico-chemical interactions and particle size.
It was shown that improvement of the permeation flux of water is obtained by increasing the
repulsive forces between colloidal particles. This increase of repulsive forces is achieved by
changing the pH of the solution which affects the surface charge of colloidal particles [94]. A
feature of most of the colloidal compounds is that they generally have a charge. The overall
charge of the main fractions of polysaccharides in wine and different fractions of phenolic
compounds was determined. Generally, the wine has a pH range between 3 and 4 and the
overall charge is neutral [95]. The polysaccharide fractions are negatively charged in hydro-
alcoholic model solution at pH 3.5 but there are important differences in the absolute value of
their negative charge density which is a function of pH. For mannoproteins, the charge
density varies only slightly depending on the pH in the range tested (pH 2-9). Most of the
mannoproteins present in wine are neutral. Instead of mannoproteins, pectic polysaccharides
have a very significant increase of net negative charge in the pH range tested. This charge is
Chapitre I : Synthèse bibliographique
41
due to the carboxylic groups of uronic acids. Thus, electrostatic interactions that can develop
between these polysaccharides and other macromolecules, as well as between themselves, are
very dependent on the pH of wine.
The determination of the charge of phenolic compounds was only performed in hydro-
alcoholic model solution at pH of 3.5. All the studied tannins exhibit negligible surface
charges at wine’s pH because the hydroxyl groups of tannins are not dissociated at this pH.
The interactions between molecules and surfaces as well as molecules themselves will depend
on pH, but also on the physico-chemical properties of macromolecules. As mentioned in
paragraph 4.2.1, there is considerable heterogeneity within each group of wine colloids
(polysaccharides, proteins and polyphenols) and neither the structures nor the mechanisms
involved in the formation of instabilities are known. So nowadays, little informations are
available and the colloidal system remains little explored.
The alcohol content plays an important role in membrane filtration. Ethanol is considered as a
wetting agent. It was shown when wetting membranes with ethanol before filtrations, higher
fluxes are obtained due to pore activation and reduction of surface tension but there is no
significant effect on fouling propensity [96]. Nowadays, there are no studies concerning the
effect of ethanol content in wine on membrane filtration.
Particle size has been identified in literature to play a role in membrane fouling. Depending
on the relative size of colloidal particles and membrane pores, fouling may occur due to either
accumulation of particles on the membrane surface and build-up of a cake or penetration
within the membrane pores. As a general rule, a reduced particle size in the feed resulted in
lower overall flux levels. Boissier et al. [45] have shown that yeast alone always formed
reversible deposits while fine particles induced very low permeate fluxes and formed an
irreversible deposit.
The crude wine is a very polydispersed medium system containing particles with size range
between 0.1µm and 100 µm. This very high polydispersity made the determination of the size
distribution impossible. Another factor affecting the size distribution measure is the
wavelength used (633 nm), especially for colloidal particles of red wine.
Chapitre I : Synthèse bibliographique
42
5. Membrane cleaning
In general, there have been many attempts to reduce membrane fouling and enhance the
permeate flux during the CFMF of wine. Till now, few studies [97-100] are referenced in the
literature concerning the cleaning of the membranes by mechanical or chemical techniques in
enology. So, a summary of different cleaning techniques will be proposed in following.
5.1. Hydraulic and mechanical techniques
Various hydraulic and mechanical methods have been investigated to reduce the resistance caused
by concentration polarization in order to improve the efficiency of the separation process and
decrease operating cost. There are a number of non-chemical membrane cleaning techniques
available, including back-flushing, cross-flushing and back-shocking [101-103]. In most
previous work using these techniques, the flushing pulses have been applied to the feed space.
Although these techniques, applied in a non-continuous way, can be successfully used to
clean some foulant layers off membranes and (partially) restore the flux, they seem to be
inefficient in the removal of adhesive foulants [55].
The cross-flushing is the simplest technique to be implemented. The permeate outlet is
temporarily closed which cancels the permeate flux and hence the contribution of particles on
the membrane. The shear stress erodes the deposit formed. The effectiveness of this method is
limited to a little adhering deposit to the top surface of the membrane.
Back-flushing or back-washing is the common practice to minimize fouling. Filtrate is
pumped back through the membrane into the feed channel to give a periodic backwash to lift
deposited material off the membrane surface. The efficiency of this technique is limited to
remove the deposits or cakes at the membrane surface. If the deposits adhere strongly or if
pore fouling has occurred, it may be fairly ineffective.
Back-pulsing methods are relatively novel methods in comparison with the other methods.
The principle of these methods is reversing the feed pressure at high frequency to force the
fluid in reverse direction through/into the membrane. Back-pulsing is similar to the more
familiar technique of back-flushing which is common commercially. However, in back-
flushing, flow reversal through the membrane occurs for a few seconds once every several
minutes, while in back-pulsing, flow reversal occurs every few seconds or less and reverse
pressure pulses are applied for very short periods of time.
Chapitre I : Synthèse bibliographique
43
Some researchers used the ultrasound waves to enhance the permeate flux [103,104]. The
passage of ultrasounds waves through a suspension can cause many phenomena, including
particle dispersion, viscosity reduction and changes in particle surface properties. Ultrasound
waves can weaken the deposit and makes it more sensitive to the action of the shear stress.
The application of the ultrasonic fields depends on the suspension concentration. Increasing
the suspension concentration reduces the filtration rate enhancements possible with an
ultrasonic field by attenuating the sound waves.
The use of an external electric field is a promising approach towards improving the permeate
flux in cross-flow filtration. A superimposed electric field induces a force on charged
biopolymers in order to reduce the surface layer on the membrane. Electrical field treatment
can reduce membrane fouling by microbial inactivation and the enhancement of particle
coagulation. Park [97] showed, while testing electric field on microfiltration in the wine-
brewery industry, that the membrane resistances in the electro-microfiltration at 24 V were
reduced by 85.1%. He showed also when the electric field was increased to 8 V, 15 V and 24
V the permeate velocities were increased by 60.0%, 95.5% and 133.3% respectively. This
effectiveness of this technique is limited by the cross-flow velocity. It was noted that high
cross-flow velocities do not guarantee a reduction in fouling [105].
Several studies on the use of gas bubbling have been reported to enhance ultrafiltration
performance resulting in higher permeate fluxes [106]. In this technique, gas/air is dispersed
in the liquid stream to generate two-phase flow which produces very high turbulences along
the membrane surface. This high turbulence on the membrane surface reduces the deposition
of solid particles on membrane surface and resultantly, the permeate flux increases. This
technique is limited in wine filtration according to the gas used. Gases not containing oxygen
can be used because wine quality is degraded with contact with oxygen.
Various researchers have used different turbulence promoting techniques in order to control
the fouling on membrane surface. These techniques include: use of turbulence promoters;
dynamic filtration; pulsating flows; jet flows and vortex waves [105-111].
5.2. Chemical techniques
Chemical cleaning is performed when the various hydraulic and mechanical cleaning
techniques cannot restore flux. Cleaning agents divided into different categories:
- Acid (HNO3, H2SO4, HCl, Citric acid…) – for dissolving mineral and salts;
Chapitre I : Synthèse bibliographique
44
- Base (NaOH) - for dissolving protein and other organic foulants;
- Oxidizing agents (H2O2, NaOCl) - for biological foulants;
- Surfactants, detergents (Ultrasil, Froclean, etc) - for organic foulants;
- Enzymes (Protease, Alpha amylase, Polygalacturonase) - for severe fouling.
In wine industry, sodium hydroxide is the most used in the range of 1-5 % depending on
fouling level and membrane material. Reagents containing chloride molecules are banned in
the food industry.
In wine filtration, enzymes are used to reduce membrane fouling and enhance permeate flux
more than as cleaning technique. Several enzyme preparations are available on the market and
all have pectolytic activity (hydrolysis of pectins). It was shown that breaking the pectins
molecules into smaller components will expose some of the positively charged particles as
proteins and leads to an electrostatic aggregation of oppositely charged and flocculation of the
cloud. Humbert-gauffard et al. [98] tested the efficiency of a commercial enzyme preparation
in wines in relation to filterability by measuring the Vmax. They showed that adding 5 g/l of B-
glucanase will increase the filterability of white wine by 55 % and red wine by 40 %. Several
other studies have indicated the positive effect of pectolytic enzymes on wine filterability
[99,100].
6. Innovations and commercial proposal
Many modifications have been made on tangential filters since the mid of 80’s. The first
CFMF of wine were realized with filters equipped with ceramic membranes. The results
obtained were not satisfactory: flows per m² were too low, the ratio filtration area over
volume occupied by the membranes was low, and there was a significant loss in the quality of
filtrated wines. Between 1990 and 2000, the filters were developed and set up, and equipped
with organic membranes. Large progress of optimization was realized by the constructors,
despite the inconvenience of organic membranes due to their fragility. This type of
membranes was privileged because the ratio filtration area over volume occupied by the
membranes was favourable (hollow fibres). The margin of progress has been made on the
choice of membrane materials and their consistency with the physico-chemistry of wine.
In 2000, new ceramic hollow fibres membranes were developed specially for wine filtration
in order to optimize the ratio filtration surface on membrane volume. The advantage of these
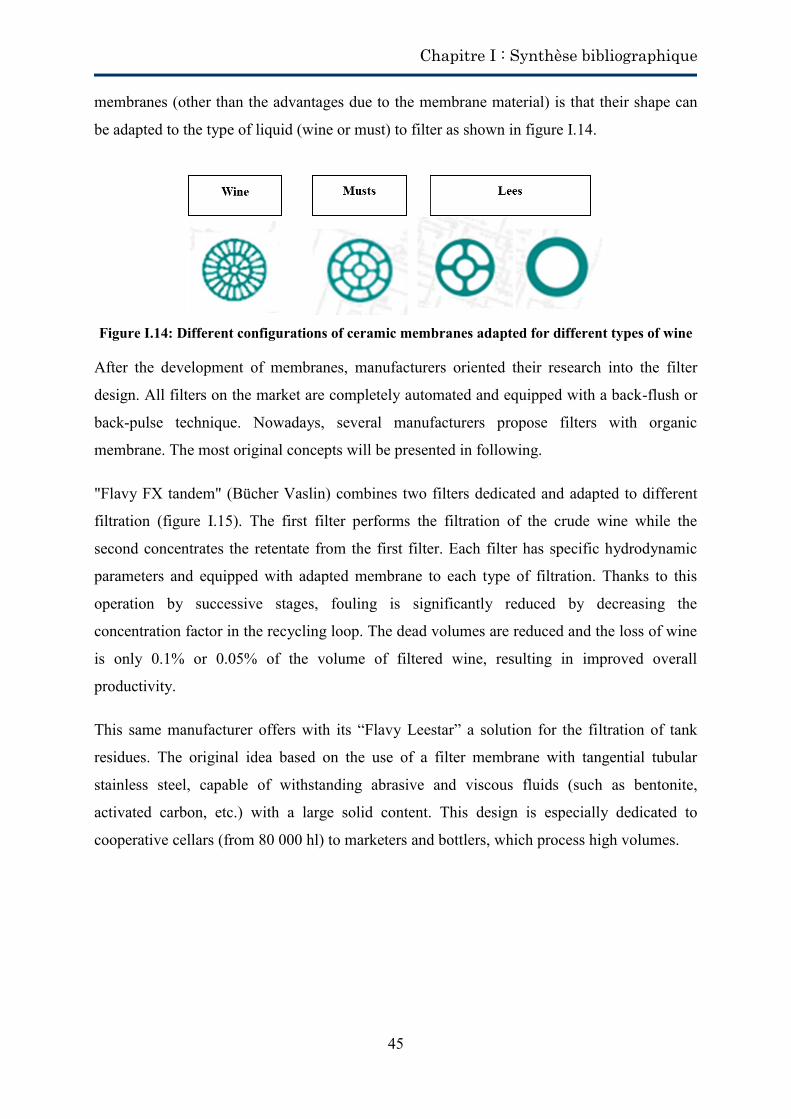
Chapitre I : Synthèse bibliographique
45
membranes (other than the advantages due to the membrane material) is that their shape can
be adapted to the type of liquid (wine or must) to filter as shown in figure I.14.
Figure I.14: Different configurations of ceramic membranes adapted for different types of wine
After the development of membranes, manufacturers oriented their research into the filter
design. All filters on the market are completely automated and equipped with a back-flush or
back-pulse technique. Nowadays, several manufacturers propose filters with organic
membrane. The most original concepts will be presented in following.
"Flavy FX tandem" (Bücher Vaslin) combines two filters dedicated and adapted to different
filtration (figure I.15). The first filter performs the filtration of the crude wine while the
second concentrates the retentate from the first filter. Each filter has specific hydrodynamic
parameters and equipped with adapted membrane to each type of filtration. Thanks to this
operation by successive stages, fouling is significantly reduced by decreasing the
concentration factor in the recycling loop. The dead volumes are reduced and the loss of wine
is only 0.1% or 0.05% of the volume of filtered wine, resulting in improved overall
productivity.
This same manufacturer offers with its “Flavy Leestar” a solution for the filtration of tank
residues. The original idea based on the use of a filter membrane with tangential tubular
stainless steel, capable of withstanding abrasive and viscous fluids (such as bentonite,
activated carbon, etc.) with a large solid content. This design is especially dedicated to
cooperative cellars (from 80 000 hl) to marketers and bottlers, which process high volumes.
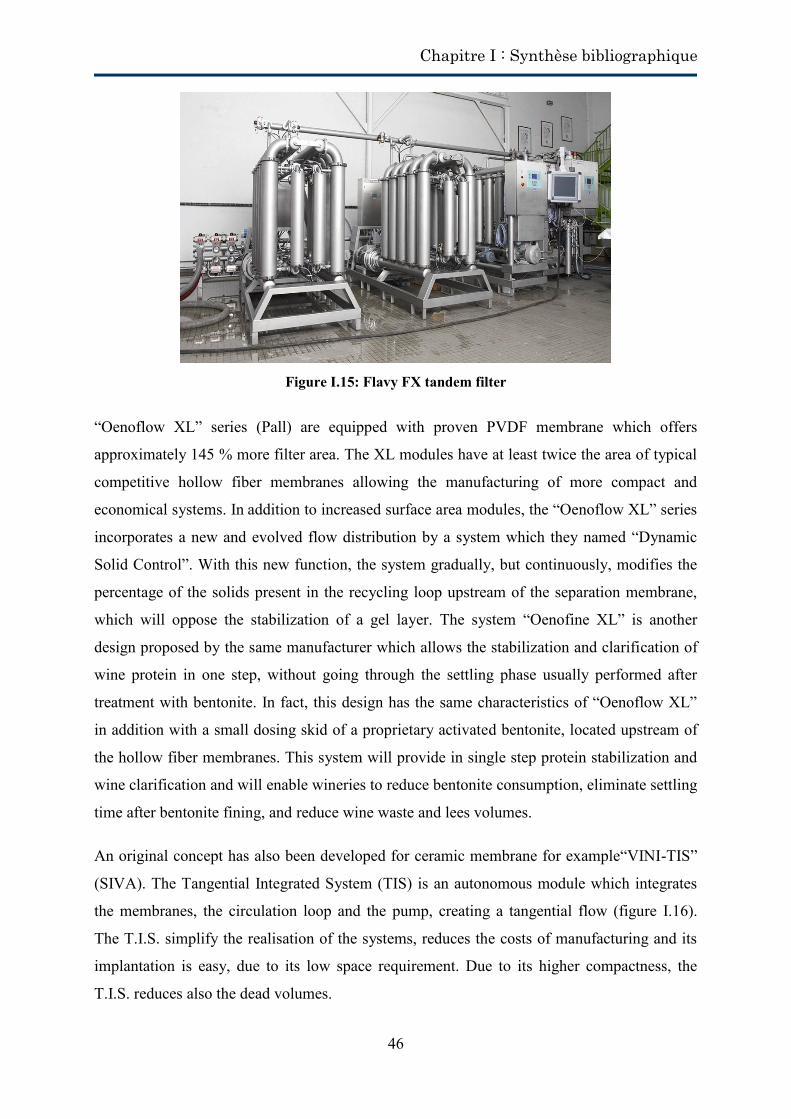
Chapitre I : Synthèse bibliographique
46
Figure I.15: Flavy FX tandem filter
“Oenoflow XL” series (Pall) are equipped with proven PVDF membrane which offers
approximately 145 % more filter area. The XL modules have at least twice the area of typical
competitive hollow fiber membranes allowing the manufacturing of more compact and
economical systems. In addition to increased surface area modules, the “Oenoflow XL” series
incorporates a new and evolved flow distribution by a system which they named “Dynamic
Solid Control”. With this new function, the system gradually, but continuously, modifies the
percentage of the solids present in the recycling loop upstream of the separation membrane,
which will oppose the stabilization of a gel layer. The system “Oenofine XL” is another
design proposed by the same manufacturer which allows the stabilization and clarification of
wine protein in one step, without going through the settling phase usually performed after
treatment with bentonite. In fact, this design has the same characteristics of “Oenoflow XL”
in addition with a small dosing skid of a proprietary activated bentonite, located upstream of
the hollow fiber membranes. This system will provide in single step protein stabilization and
wine clarification and will enable wineries to reduce bentonite consumption, eliminate settling
time after bentonite fining, and reduce wine waste and lees volumes.
An original concept has also been developed for ceramic membrane for example“VINI-TIS”
(SIVA). The Tangential Integrated System (TIS) is an autonomous module which integrates
the membranes, the circulation loop and the pump, creating a tangential flow (figure I.16).
The T.I.S. simplify the realisation of the systems, reduces the costs of manufacturing and its
implantation is easy, due to its low space requirement. Due to its higher compactness, the
T.I.S. reduces also the dead volumes.
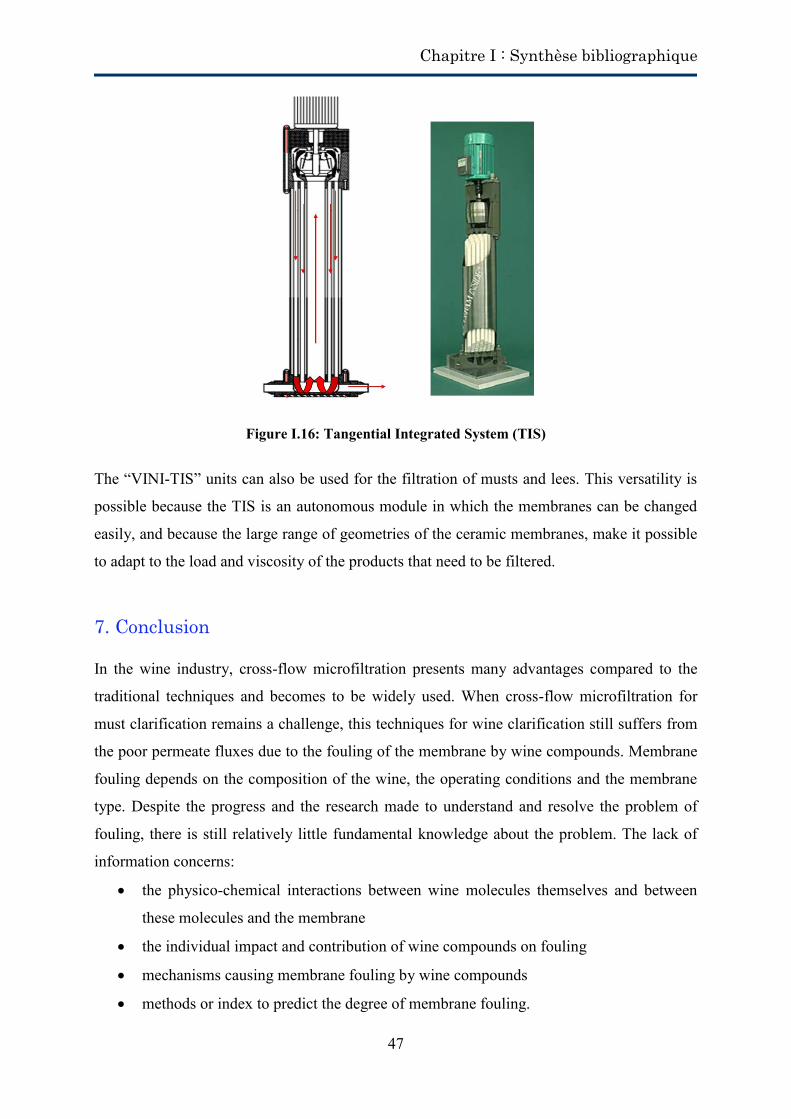
Chapitre I : Synthèse bibliographique
47
Figure I.16: Tangential Integrated System (TIS)
The “VINI-TIS” units can also be used for the filtration of musts and lees. This versatility is
possible because the TIS is an autonomous module in which the membranes can be changed
easily, and because the large range of geometries of the ceramic membranes, make it possible
to adapt to the load and viscosity of the products that need to be filtered.
7. Conclusion
In the wine industry, cross-flow microfiltration presents many advantages compared to the
traditional techniques and becomes to be widely used. When cross-flow microfiltration for
must clarification remains a challenge, this techniques for wine clarification still suffers from
the poor permeate fluxes due to the fouling of the membrane by wine compounds. Membrane
fouling depends on the composition of the wine, the operating conditions and the membrane
type. Despite the progress and the research made to understand and resolve the problem of
fouling, there is still relatively little fundamental knowledge about the problem. The lack of
information concerns:
the physico-chemical interactions between wine molecules themselves and between
these molecules and the membrane
the individual impact and contribution of wine compounds on fouling
mechanisms causing membrane fouling by wine compounds
methods or index to predict the degree of membrane fouling.
Chapitre I : Synthèse bibliographique
48
In oenology, it will also be interesting to test new type of filtration as the dynamic filtration or
new membrane types as microsieves because the configurations and the principles of the
conventional filters reach their limits.
References
[1] G. Thoukis, Chemistry of wine stabilization: a review, in: A. Dinsmoor Webb, chemistry of wine making, American Chemical society, Washington, 1974.
[2] P. Ribéreau-Gayon, Y. Glories, A. Maujean, D. dubourdieu., Handbook of enology Volume 2 : The chemistry of wine, stabilization and treatments, 2nd ed., Dunod, Paris, 2006.
[3] D. Poirier, M. Bennasar, B. Tarodo de la Fuente, J. Gillot, D. Garcera, Clarification et stabilisations des vins par ultrafiltration tangentielle sur membranes minérales, Lait 64 (1984) 141-142.
[4] M. Serrano, B. Pontens, P. Ribéreau-Gayon, Etude de différentes membranes de microfiltration tangentielle: comparaison avec la filtration sur précouche de diatomées, J. Int. Sci. Vigne Vin, 26 (2) (1992) 97-116.
[5] M. Feuillat, D. Peyron, J.L. Berger, Influence de la microfiltration tangentielle des vins sur leur composition physico-chimique et leurs caractères sensoriels. Application aux vins de Bourgogne. Bulletin de l’OIV, 60 (1987) 227-244.
[6] C. Peri, M. Riva, P. Decio, Crossflow membrane filtration of wines: comparison of permformance of ultrafiltration, microfiltration and intermediate cut-off membranes, Am. J. Enol. Vitic. 39 (1988) 162-168.
[7] B. Gautier, Une nouvelle approche révolutionnaire et performante de la filtration tangentielle des vins, Revue des oenologues et des techniques vitivinicoles et oenologiques 109 (2003) 27-30.
[8] A. Vernhet, A. Grangeon, Innovations dans la microfiltration des vins: membranes et procédés, Revue des oenologues et des techniques vitivinicoles et oenologiques, 113 (2004) 37-40.
[9] C. Flanzy, Œnologie : fondements scientifiques et technologiques, Lavoisier TEC&DOC, Paris, 1998.
[10] R. Gawel, Red wine astringency: a review, Aust. J. Grape Wine R., 4 (1998) 74-95. [11] J.G. Handique, J.B. Baruah, Polyphenolic compounds: an overview, React. Funct.
Polym. 52 (3) (2002) 163-188. [12] K. Chira, J.-H. Su, C. Saucier, P.-L. Teissèdre, Les polyphénols du raisin,
Phytothérapie 6 (2008) 75-82. [13] R. Boulton, The copigmentation of anthocyanins and its role in the color of red
wine: A critical review, Am. J. Enol. Vitic. 52 (2001) 67-87. [14] E. Haslam, Vegetable tannins-lessons of a phytochemical lifetime, Phytochemistry
68 (2007) 2713-2721. [15] P. Pellerin, T. Doco, S. Vidal, P. Williams, J.M. Brillouet, M.A. Oneill, Structural
characterization of red wine rhamnogalacturonan II. Carbohyd. Res. 290 (1996) 183-197.
[16] S. Vidal, P. Williams, T. Doco, M. Moutounet, P. Pellerin, The polysaccharides of red wine: total fractionation and characterization. Carbohyd. Polym. 54 (2003) 439-447.
Chapitre I : Synthèse bibliographique
49
[17] P. Pellerin, S. Vidal, P. Williams, J.M. Brillouet, Characterization of 5 type-II arabinogalactan-protein fractions from red wine of increasing uronic-acid content, Carbohyd. Res. 277 (1995) 135-143.
[18] S. Vidal, P. Williams, M.A. O'Neill, P. Pellerin, Polysaccharides from grape berry cell walls. Part I: tissue distribution and structural characterization of the pectic polysaccharides. Carbohyd.Polym. 45 (2001) 315-323.
[19] R.M. Llauberes, D. Dubourdieu, J.C. Villettaz, Exocellular polysaccharides from Saccharomyces in wine, J. Sci. Food Agric. 41 (1987) 277-286.
[20] M. Feuillat, Yeast macromolecules: Origin, composition, and enological interest. Am. J. Enol. Vitic. 54 (2003) 211-213.
[21] R. Marchal, P. Jeandet, Use of enological additives for colloids and tartrate salt ttabilization in white wines and for improvement of sparkling wine foaming properties, in: M. Victoria Moreno-Arribas, M. Carmen Polo, Wine chemistry and biochemistry, Springer science, New york, 2009, pp. 127-158.
[22] R.B. Ferreira, M.A. Piçarra-Pereira, S. Monteiro, V.B. Loureiro and A.R. Teixeira, The wine proteins, Trends Food Sci. & Technol. 12 (2002) 230–239.
[23] H. Dawes, S. Boyes, J. Keene and D. Heatherbell, Protein instability of wines: Influence of protein isoelectric point, Am. J. Enol. Vitic. 45 (1994) 319–326.
[24] R.B. Ferreira, S. Monteiro, M.A. Piçarra-Pereira, M.C. Tanganho, V.B. Loureiro and A.R. Teixeira, Characterization of the proteins from grapes and wines by immunological methods, Am. J. Enol. Vitic. 51 (2000) 2–28.
[25] E.J. Waters, W. Wallace and P.J. Williams, Heat haze characteristics of fractionated wine proteins, Am. J. Enol. Vitic. 42 (1991) 123–127.
[26] A. Lonvaud-Funel, V. Renouf, P. Strehaiano, Microbiologie du vin : bases fondamentales et applications, Lavoisier, Cachan, 2010.
[27] H. König, G. Unden, J. Fröhlich, Biology of microorganisms on grapes, in must and in wine, Springer science, New York, 2009.
[28] V. Renouf, Description et caractérisation de la diversité microbienne durant l'élaboration du vin : Interactions et équilibres – Relation avec la qualité du vin, Ph.D. Thesis, Institut National Polytechnique de Toulouse, 2006.
[29] G. Daufin, J.L. Escudier, H. Carrere, S. Berot, L. Fillaudeau, M. Decloux, Recent and emerging applications of membrane processes in the food and dairy industry, Food Bioprod. Process. 79 (2001) 89-102.
[30] A.G. Cook, P. Weinstein, J.A. Centeno, Health effects of natural dusts: role of trace elements and compounds, Biol. Trace Elem. Res. 103 (2005) 1-15.
[31] R. Irrmann, Microfiltration tangentielle : Application en œnologie, Rev. Fr. Oenol. 137 (1992) 17-19.
[32] M. Blain, Clarification des moûts de chauffage de la vendange par filtration tangentielle: Expérimentations complémentaires sur les moûts et les vins, pour démontrer la polyvalence du même matériel, Revue des oenologues et des techniques vitivinicoles et œnologiques, 93S (1999) 41-43.
[33] L.F. Song, Flux decline in crossflow microfiltration and ultrafiltration: mechanisms and modeling of membrane fouling, J. Membr. Sci. 139 (1998) 183-200.
[34] L.F. Song, M. Elimelech, Theory of concentration polarization in cross-flow filtration, J. Chem. Soc., Faraday Trans. 91 (1995) 3389-3398.
[35] W.R. Bowen, F. Jenner, Theoretical descriptions of membrane filtration of colloids and fine particles: An assessment and review, Adv. Colloid Interface Sci. 56 (1995) 141-200.
[36] J.G. Wijmans, S. Nakao, C.A. Smolders, Flux limitation in ultrafiltration: osmotic pressure model and gel layer model, J. Membr. Sci. 20 (1984) 115-124.
Chapitre I : Synthèse bibliographique
50
[37] A.L. Zydney, C.H. Colton, A concentration polarization model for the filtrate flux in cross-flow microfiltration of particulate suspensions, Chem. Eng. Commun. 47 (1986) 1-21.
[38] A. Broeckmann, J. Busch, T. Wintgens, W. Marquardt, Modeling of pore blocking and cake layer formation in membrane filtration for wastewater treatment, Desalination 189 (2006) 97-109.
[39] I.G. Wenten, Mechanisms and control of fouling in cross-flow microfiltration, Filtr. Separat. 32 (1995) 252-253.
[40] G. Belfort, R.H. Davis, A.L. Zydney, The behaviour of suspensions and macromolecules solutions in cross-flow microfiltration, J. Membr. Sci. 96 (1994) 1-58.
[41] Q. Gan, R.W. Field, M.R. Bird, R. England, J.A. Howell, M.T. McKechnie, C.L. Oshaughnessy, Beer clarification by cross-flow microfiltration: Fouling mechanisms and flux enhancement. Chem. Eng. Res. Des. 75 (1997) 3-8.
[42] M. Mietton-Peuchot, V. Milisic, R. Ben Aim, Microfiltration tangentielle des boissons. Influence des caractéristiques hydrodynamiques, Lait 64 (1984) 121-128.
[43] P.J. Cameira Dos Santos, Colmatage en microfiltration tangentielle: mise en evidence d’interactions entre les polysaccharides et les polyphénols d’un vin et des membranes polymériques, Ph. D. Thesis. University of Montpellier II. Ecole Nationale Supérieure Agronomique de Montpellier, 1995.
[44] A. Vernhet, D. Cartalade, M. Moutounet, Contribution to the understanding of fouling build-up during microfiltration of wines, J. Membr. Sci. 211 (2003) 357-370.
[45] B. Boissier, F. Lutin, M. Moutounet, A. Vernhet, Particles deposition during the cross-flow microfiltration of red wines-incidence of the hydrodynamic conditions and of the yeast to fines ratio, Chem. Eng. Process. 47 (2008) 276-286.
[46] A. Vernhet, M. Moutounet, Fouling of organic microfiltration membranes by wine constituents: importance, relative impact of wine polysaccharides and polyphenols and incidence of membrane properties, J. Membr. Sci. 201 (2002) 103-122.
[47] A. Vernhet, M.N. BellonFontaine, J.M. Brillouet, E. Roesink, M. Moutounet, Wetting properties of microfiltration membrane: Determination by means of the capillary rise technique and incidence on the adsorption of wine polysaccharide and tannins, J. Membr. Sci. 128 (1997) 163-174.
[48] M. Zator, M. Ferrando, F. Lopez, C. Guell, Microfiltration of protein/dextran/polyphenol solutions: Characterization of fouling and chemical cleaning efficiency using confocal microscopy, J: Membr. Sci. 344 (2009) 82-91.
[49] M. Ulbricht, W. Ansorge, I. Danielzik, M. Konig, O. Schuster, Fouling in microfiltration of wine: The influence of the membrane polymer on adsorption of polyphenols and polysaccharides. Sep. Purif. Technol. 68 (2009) 335-342.
[50] P. Bacchin, D. Si-Hassen, V. Starov, M.J. Clifton, P. Aimar, A unifying model for concentration polarization, gel-layer formation and particle deposition in cross-flow membrane filtration of colloidal suspensions, Chem. Eng. Sci. 57 (2002) 77-91.
[51] J. Hermia, Constant pressure blocking filtration laws-application to power-law non-Newtonian fluids, Trans IchemE 60 (1982) 183-187.
[52] C.C. Ho, A.L. Zydney, A combined pore blockage and cake filtration model for protein fouling during microfiltration, J. Colloid Interface Sci. 232 (2000) 389-399.
[53] F. Delagarza, R. Boulton, The modelling of wine filtrations, Am. J. Enol. Vitic. 35 (1984) 189-195.
[54] P. Czekaj, F. Lopez, C. Guell, Membrane fouling during microfiltration of fermented beverages, J. Membr. Sci. 166 (2000) 199-212.
Chapitre I : Synthèse bibliographique
51
[55] P. Czekaj, F. Lopez, C. Guell, Membrane fouling by turbidity constituents of beer and wine: characterization and prevention by means of infrasonic pulsing, J. Food Eng. 49 (2001) 25-36.
[56] A. Cassano, A. Mecchia, E. Drioli, Analyses of hydrodynamic resistances and operating parameters in the ultrafiltration of grape must, J. Food Eng. 89 (2008) 171-177.
[57] J.W. Cho, G. Amy, J. Pellegrino, Membrane filtration of natural organic matter: Initial comparison of rejection and flux decline characteristics with ultrafiltration and nanofiltration membranes, Water Res. 33 (1999) 2517-2526.
[58] P. Bacchin, P. Aimar, V. Sanchez, Model for colloidal fouling of membranes, AIChE J. 41 (1995) 368.
[59] H. Li, A.G. Fane, H.G.L. Coster, S. Vigneswaran, An assessment of depolarisation models of cross-flow microfiltration by direct observation through the membrane, J. Membr. Sci. 172 (2000) 135
[60] P. Bacchin, P. Aimar, Critical fouling conditions induced by colloidal surface interaction: from causes to consequences, Desalination. 175 (2005) 21-27.
[61] V. Ledoux, L. Dulau, D. Dubourdieu, Interprétation de l’amélioration de la stabilité protéique des vins au cours de l’élevage sur lies, J. Int. Sci. Vigne Vin 26 (1992) 239-251.
[62] S. Lubbers, B. Leger, C. Charpentier, M. Feuillat, Effet colloïde-protecteur d’extraits de parois de levures sur la stabilité tartrique d’une solution hydro-alcoolique modèle, J. Int. Sci. Vigne Vin 27 (1993) 13-22.
[63] J.C. Villetaz, Les colloïdes colmatants et la filtration des vins, Rev. Fr. Oenol. 122 (1990) 59-64.
[64] M.P. Belleville, J.M. Brillouet, B.T. Delafuente, M. Moutounet, Polysaccharide effects on cross-flow microfiltration of 2 red wines with a microporous alumina membrane, J.Food Sci. 55 (1990) 1598-1602.
[65] A. Vernhet, P. Pellerin, M.P. Belleville, J. Planque, M. Moutounet, Relative impact of major wine polysaccharides on the performances of an organic microfiltration membrane, Am. J. Enol. Vitic. 50 (1999) 51-56.
[66] M.P. Belleville, J.M. Brillouet, B.T. Delafuente, M. Moutounet, Fouling colloids during microporous alumina membrane filtration of wine, J.Food Sci. 57 (1992) 396-400.
[67] R. Veyre, Carbosep ultrafiltration inorganic membranes in the food-industry, Lait 64 (1984) 261-275.
[68] H. Susanto, Y. Feng, M. Ulbricht, Fouling behavior of aqueous solutions of polyphenolic compounds during ultrafiltration, J. Food Eng. 91 (2009) 333-340.
[69] M. Meireles, P. Aimar, V. Sanchez, Albumin denaturation during ultrafiltration: Effects of operating conditions and consequences on membrane fouling, Biotechnol. Bioeng. 38 (1991) 528-534.
[70] E.M. Tracey, R.H. Davis, Protein fouling of track-etched polycarbonate microfiltration membranes, J. Colloid Interface Sci. 167 (1994) 104-116.
[71] F.N. Salazar, J.P.F. de Bruijn, L. Seminario, C. Guell, F. Lopez, Improvement of wine crossflow microfiltration by a new hybrid process, J. Food Eng. 79 (2007) 1329-1336.
[72] Y. El Rayess, C. Albasi, P. Bacchin, P. Taillandier, J. Raynal, M. Mietton-Peuchot, A. Devatine, Impact of the physico-chemistry of the wine on membrane filtration performance, GPE-EPIC, Congress Venise, June 2009.
Chapitre I : Synthèse bibliographique
52
[73] H. Li, A.G. Fane, H.G.L. Coster, S. Vigneswaran, Direct observation of particle deposition on the membrane surface during crossflow microfiltration, J. Membr. Sci. 149 (1998) 83-97.
[74] V.T. Kuberkar, R.H. Davis, Effects of added yeast on protein transmission on flux in cross-flow membrane microfiltration, Biotechnol. Prog. 15 (1999) 472-479.
[75] C. Guell, P. Czekaj, R.H. Davis, Microfiltration of protein mixtures and the effects of yeast on membrane fouling, J. Membr. Sci. 155 (1999) 113-122.
[76] L. Fillaudeau, H. Carrere, Yeast cells, beer composition and mean pore diameter impacts on fouling and retention during cross-flow filtration of beer with ceramic membranes. J. Membr. Sci. 196 (2002) 39-57.
[77] M. Meireles, C. Molle, J.M. Clifton, P. Aimar, The origin of high hydraulic resistance for filter cakes of deformable particles: cell-bed deformation or surface layer effect?, Chem. Eng. Sci. 59 (2004) 5819-5829.
[78] E.S. Tarleton, R.J. Wakeman, Understanding flux decline in cross-flow microfiltration. 2. Effects of process parameters, Chem. Eng. Res. Des. 72 (1994a) 431-440.
[79] M.Y. Jaffrin, B.B. Gupta, A. Chaibi, Effect of physical parameters on the microfiltration of wine on a flat polymeric membrane, Chem. Eng. Process. 32 (1993) 379-387.
[80] P. Bacchin, P. Aimar, R.W. Field, Critical and sustainable fluxes: Theory, experiments and applications. J. Membr. Sci. 281 (2006) 42-69.
[81] R.W. Field, D. Wu, J.A. Howell, B.B. Gupta, Critical flux concept for microfiltration fouling, J. Membr. Sci. 100 (1995) 259-272.
[82] J.A. Howell, Sub-critical flux operation in microfiltration, J. Membr. Sci. 107 (1995) 165-171.
[83] A. Lüdemann, Wine clarification with a cross-flow microfiltration system, Am. J. Enol. Vitic. 38 (1987) 228-235.
[84] H. Romat, G. Reynou, Notion de rhéologie en œnologie : Application à l’influence de la température sur la viscosité et des conséquences sur quelques pratiques œnologiques et sur la filtrabilité des vins, Revue des œnologues et des techniques vitivinicoles et œnologiques, 138 (2010) 15-17.
[85] I.S. Chang, K.H. Choo, C.H. Lee, U.H. Pek, U.C. Koh, S.W. Kim, J.H. Koh, Application of ceramic membrane as a pretreatment in anaerobic-digestion of alcohol-distillery, J. Membr. Sci. 90 (1994) 131-139.
[86] A. Urkiaga, L. De las Fuentes, M. Acilu, J. Uriarte, Membrane comparison for wine clarification by microfiltration, Desalination 148 (2002) 115-120.
[87] J.P. Arriagada-Carrazana, C. Saez-Navarrete, R. Brodeu, Membrane filtration effects on aromatic and phenolic quality of Cabernet Sauvignon wines, J. Food Eng. 68 (2005) 363-368.
[88] A. Vernhet, A. Grangeon, Innovations dans la microfiltration des vins : membranes et procédés, Revue des œnologues 113 (2004) 37-40.
[89] H.H.P. Fang, X.L. Shi, Pore fouling of microfiltration membranes by activated sludge, J. Membr. Sci. 264 (2005) 161-166.
[90] C.C. Ho, A.L. Zydney, Theoretical analysis of the effect of membrane morphology on fouling during microfiltration, Sep. Sci. Technol. 34 (1999) 2461-2483.
[91] S. Kuiper, C. Van Rijn, W. Nijdam, O. Raspe, H. Van Wolferen, G. Krijnen, M. Elwenspoek, Filtration of lager beer with microsieves: flux, permeate haze and in-line microscope observations, J. Membr. Sci. 196 (2002) 159-170.
Chapitre I : Synthèse bibliographique
53
[92] S.P. Palecek, A.L. Zydney, Intermolecular electrostatic interactions and their effect on flux and proteins deposition during protein filtration, Biotechnol. Progr. 10 (1994) 207-213.
[93] S.T. Kelly, A.L. Zydney, Protein fouling during microfiltration: Comparative behavior of different model proteins, Biotechnol. Bioeng. 55 (1997) 91-100.
[94] G. Singh, L.F. Song, Experimental correlations of pH and ionic strength effects on the colloidal fouling of silica nanoparticles in crossflow ultrafiltration, J. Membr. Sci. 303 (2007) 112-118.
[95] J. Senee, B. Robillard, M. Vignes-Adler, The zeta potential of the endogenous particles of a wine of Champagne in a relation to the foaming behaviour, Colloid Surface B, 21 (2001) 59-67.
[96] J. Kochan, T. Wintgens, R. Hochstrat, T. Melin, Impact of wetting agents on the filtration performance of polymeric ultrafiltration membranes, Desalination 241 (2009) 34-42.
[97] Y.G. Park, Effect of hydraulic pressure and electric field on electro-microfiltration in the wine-brewery industry, Desalination 191 (2006) 411-416.
[98] A. Humbert-Goffard, C. Saucier, V. Moine-Ledoux, R.M. Canal-Llaubères, D. Dubourdieu, Y. Glories, An essay for glucanase activity in wine, Enzyme Microb. Technol. 34 (2004) 537-543.
[99] R.M. Canal-Llaubères, G. Reynou-Gravier, A. Embeita, Intérêt économique d’une pectinsase purifiée pour l’extraction et le débourbage : Synthèse d’essais industriels en blanc et rosé, Revue des œnologues 137 (2010) 12-14.
[100] H. Romat, G. Reynou, Proposition de critères de filtration en application de coefficient de colmatage (partie 2/2), Revue des œnologues 124 (2007) 36-38.
[101] S.G. Redkar, R.H. Davis, Cross-flow microfiltration with high-frequency reverse filtration, Aiche J. 41 (1995) 501-508.
[102] V. Kuberkar, P. Czekaj, R. Davis, Flux enhancement for membrane filtration of bacterial suspensions using high-frequency backpulsing, Biotechnol. Bioeng. 60 (1998) 77-87.
[103] R.J. Wakeman, E.S. Tarleton, An experimental-study of electroacoustic cross-flow microfiltration, Chem. Eng. Res. Des. 69 (1991) 386-397.
[104] D. Chen, L.K. Weavers, H.W. Walker, J.J. Lenhart, Ultrasonic control of ceramic membrane fouling caused by natural organic matter and silica particles, J. Membr. Sci. 276 (2006) 135-144.
[105] R.J. Wakeman, C.J. Williams, Additional techniques to improve microfiltration, Sep. Purif. Technol. 26 (2002) 3-18.
[106] Z.F. Cui, K.I.T. Wright, Flux enhancements with gas sparging in downwards crossflow ultrafiltration: Performance and mechanism, J. Membr. Sci. 117 (1996) 109-116.
[107] T.Y. Chiu, A.E. James, Effects of axial baffles in non-circular multi-channel ceramic membranes using organic feed, Sep. Purif. Technol. 51 (2006) 233-239.
[108] B.B. Gupta, A. Chaibi, M.Y. Jaffrin, Ultrafiltration of albumin ethanol solutions on mineral membranes, Sep. Sci. Technol. 30 (1995) 53-71.
[109] M.Y. Jaffrin, Dynamic shear-enhanced membrane filtration: A review of rotating disks, rotating membranes and vibrating systems, J. Membr. Sci. 324 (2008) 7-25.
[110] J.A. Howell, R.W. Field, D.X. Wu, Yeast-cell microfiltration – Flux enhancement and pulsatile flow systems, J. Membr. Sci. 80 (1993) 59-71.
[111] H.R. Millward, B.J. Bellhouse, I.J. Sobey, R.W.H. Lewis, Enhancement of plasma filtration using the concept of the vortex wave, J. Membr. Sci. 100 (1995) 121-129
Chapitre I : Synthèse bibliographique
54
Conclusion du chapitre
A ce jour la microfiltration tangentielle demeure une opération onéreuse qui souffre de sa
mauvaise réputation liée à ses performances limitées et mal maîtrisées en terme de flux de
perméation. Cependant, son caractère entièrement automatisable, la qualité du produit obtenu
(la plupart du temps) ainsi que les nouvelles législations concernant les rejets de terres de
diatomées lui permettent d’être présente dans cette filière quelque peu réticente et encore très
traditionaliste.
Comme il a été mentionné, cette technique est freinée par le colmatage de la membrane par
les composés du vin, lui-même dépendant de la nature de la membrane, de la composition
chimique du vin à filtrer et des conditions opératoires. Malgré les avancées scientifiques
réalisées afin de comprendre et de résoudre le problème de colmatage, il y a encore peu de
connaissances fondamentales concernant ce sujet.
Ce manque de connaissances constitue à l’heure actuelle un verrou pour le développement de
la microfiltration tangentielle dans le secteur vinicole. Les connaissances à approfondir
concernent :
- L’impact et la contribution individuelle de chaque composé du vin sur le colmatage des
membranes.
- L’identification des mécanismes provoquant le colmatage des membranes.
- La stabilité ou l’instabilité des systèmes colloïdaux (nature des interactions et
mécanismes impliqués) ainsi que l’impact des conditions opératoires sur ces systèmes
(flux critiques, pression critique ou concentration critique).
- La nécessité d’un test ou d’un indice simple pouvant prédire le degré du colmatage d’un
vin.
Cette étude a permis de réveler le manque de connaissances et d’études académiques
concernant les mécanismes de colmatage par les molécules du vin ainsi que la contribution
individuelle de chacune des molécules. Ainsi, notre étude a été orientée par la suite vers :
- L’évaluation de la contribution individuelle de chacune des molécules de vin identifiée
comme colmatante.
Chapitre I : Synthèse bibliographique
55
- La compréhension et la modélisation des mécanismes de colmatage induits par les
molécules étudiées.
- La recherche des conditions opératoires critiques dans le but de limiter le colmatage et
améliorer les performances.
- La recherche d’un nouveau procédé pouvant créer une rupture technologique, les
limites de progrès des filtres conventionnels étant quasiment atteints.
Chapitre II:
Matériel et Méthodes
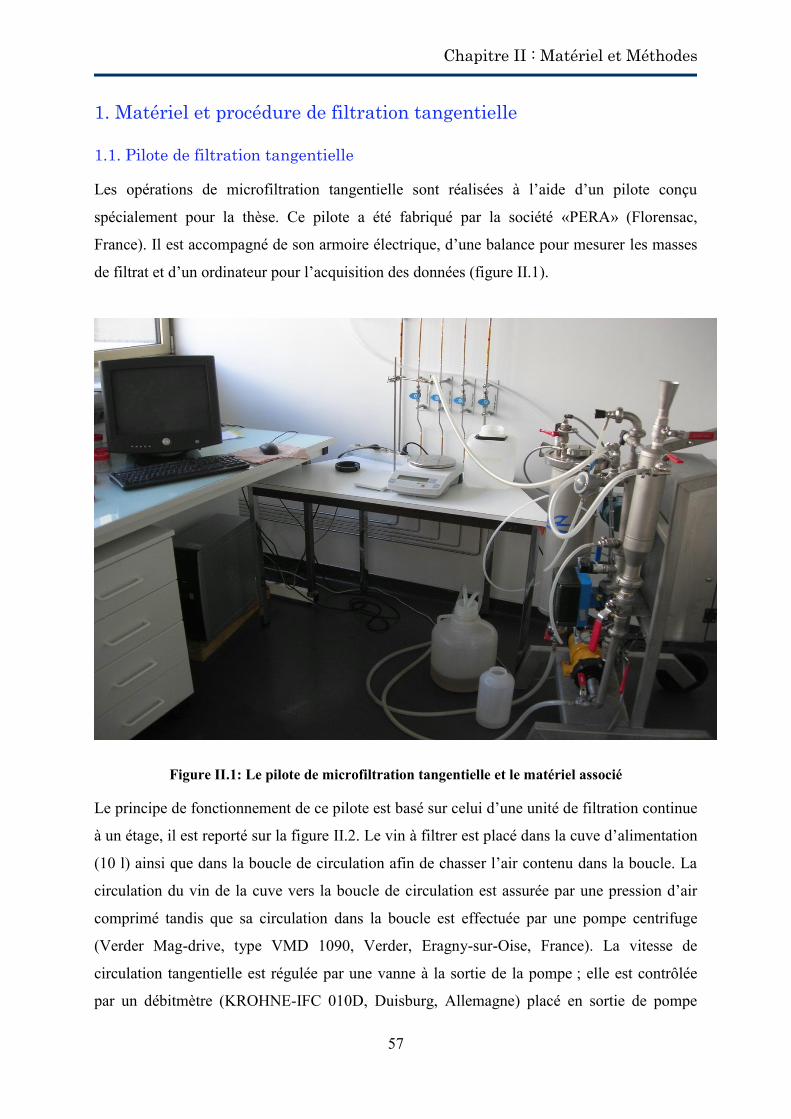
Chapitre II : Matériel et Méthodes
57
1. Matériel et procédure de filtration tangentielle
1.1. Pilote de filtration tangentielle
Les opérations de microfiltration tangentielle sont réalisées à l’aide d’un pilote conçu
spécialement pour la thèse. Ce pilote a été fabriqué par la société «PERA» (Florensac,
France). Il est accompagné de son armoire électrique, d’une balance pour mesurer les masses
de filtrat et d’un ordinateur pour l’acquisition des données (figure II.1).
Figure II.1: Le pilote de microfiltration tangentielle et le matériel associé
Le principe de fonctionnement de ce pilote est basé sur celui d’une unité de filtration continue
à un étage, il est reporté sur la figure II.2. Le vin à filtrer est placé dans la cuve d’alimentation
(10 l) ainsi que dans la boucle de circulation afin de chasser l’air contenu dans la boucle. La
circulation du vin de la cuve vers la boucle de circulation est assurée par une pression d’air
comprimé tandis que sa circulation dans la boucle est effectuée par une pompe centrifuge
(Verder Mag-drive, type VMD 1090, Verder, Eragny-sur-Oise, France). La vitesse de
circulation tangentielle est régulée par une vanne à la sortie de la pompe ; elle est contrôlée
par un débitmètre (KROHNE-IFC 010D, Duisburg, Allemagne) placé en sortie de pompe
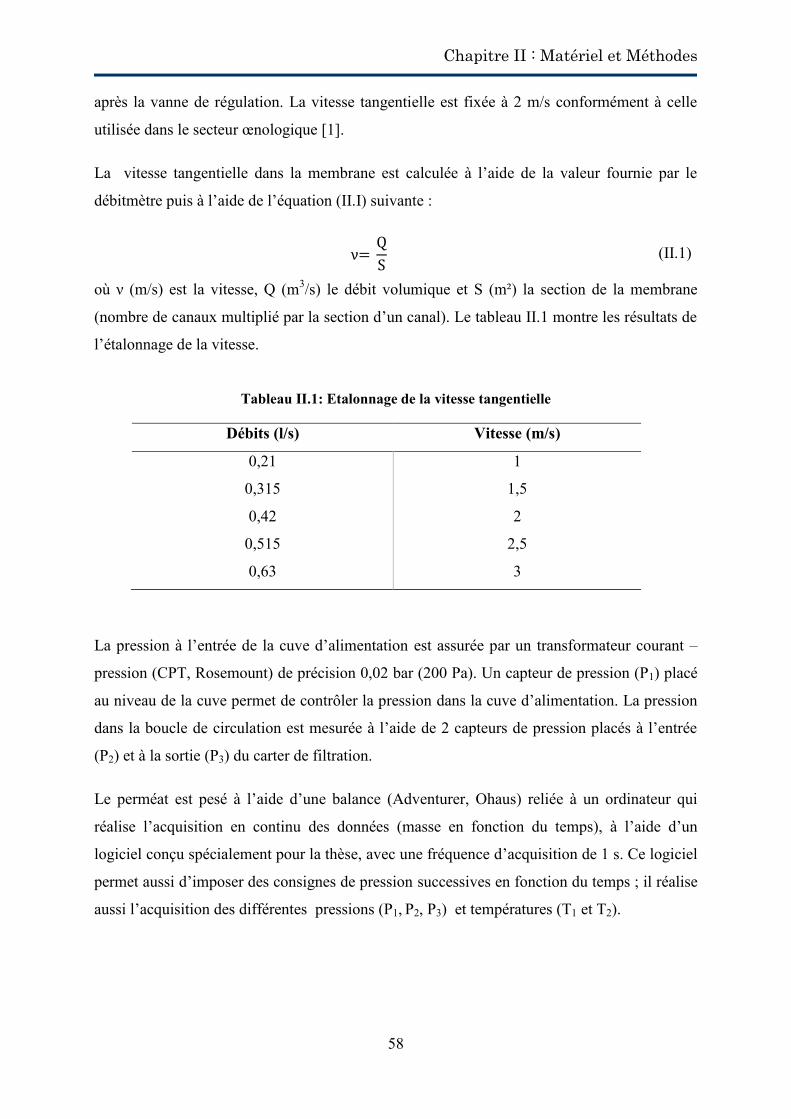
Chapitre II : Matériel et Méthodes
58
après la vanne de régulation. La vitesse tangentielle est fixée à 2 m/s conformément à celle
utilisée dans le secteur œnologique [1].
La vitesse tangentielle dans la membrane est calculée à l’aide de la valeur fournie par le
débitmètre puis à l’aide de l’équation (II.I) suivante :
(II.1)
où ν (m/s) est la vitesse, Q (m3/s) le débit volumique et S (m²) la section de la membrane
(nombre de canaux multiplié par la section d’un canal). Le tableau II.1 montre les résultats de
l’étalonnage de la vitesse.
Tableau II.1: Etalonnage de la vitesse tangentielle
Débits (l/s) Vitesse (m/s)
0,21 1
0,315 1,5
0,42 2
0,515
0,63
2,5
3
La pression à l’entrée de la cuve d’alimentation est assurée par un transformateur courant –
pression (CPT, Rosemount) de précision 0,02 bar (200 Pa). Un capteur de pression (P1) placé
au niveau de la cuve permet de contrôler la pression dans la cuve d’alimentation. La pression
dans la boucle de circulation est mesurée à l’aide de 2 capteurs de pression placés à l’entrée
(P2) et à la sortie (P3) du carter de filtration.
Le perméat est pesé à l’aide d’une balance (Adventurer, Ohaus) reliée à un ordinateur qui
réalise l’acquisition en continu des données (masse en fonction du temps), à l’aide d’un
logiciel conçu spécialement pour la thèse, avec une fréquence d’acquisition de 1 s. Ce logiciel
permet aussi d’imposer des consignes de pression successives en fonction du temps ; il réalise
aussi l’acquisition des différentes pressions (P1, P2, P3) et températures (T1 et T2).
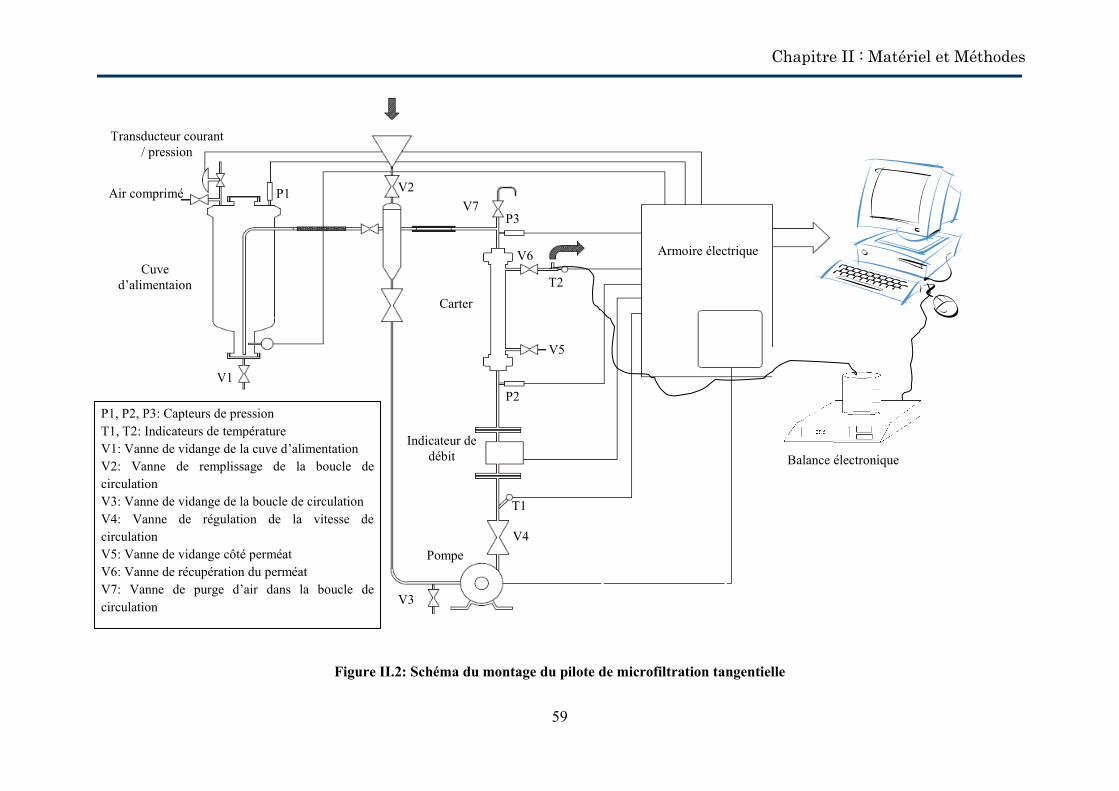
Chapitre II : Matériel et Méthodes
59
Figure II.2: Schéma du montage du pilote de microfiltration tangentielle
Transducteur courant / pression
Cuve d’alimentaion
Pompe
Indicateur de débit
T1
T2
P1
P2
P3
Armoire électrique
Balance électronique
Carter
Air comprimé
V1
V4
V2 V7
V5
V6
V3
P1, P2, P3: Capteurs de pression T1, T2: Indicateurs de température V1: Vanne de vidange de la cuve d’alimentation V2: Vanne de remplissage de la boucle de circulation V3: Vanne de vidange de la boucle de circulation V4: Vanne de régulation de la vitesse de circulation V5: Vanne de vidange côté perméat V6: Vanne de récupération du perméat V7: Vanne de purge d’air dans la boucle de circulation
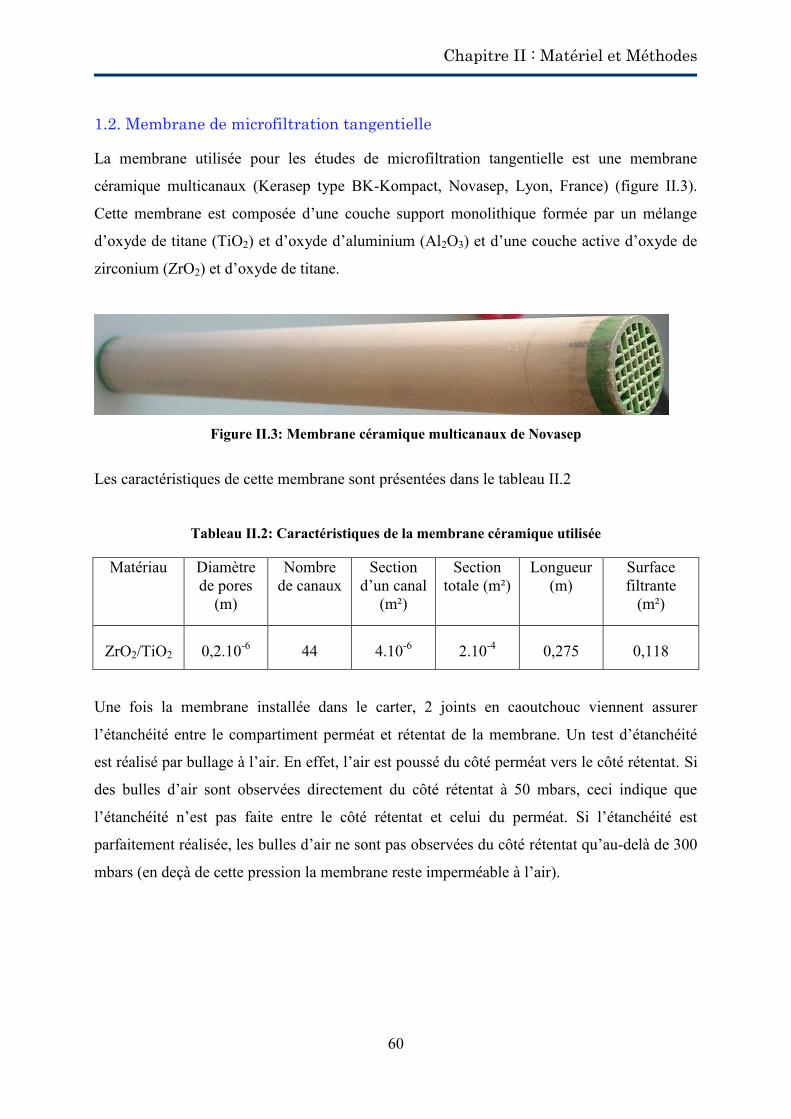
Chapitre II : Matériel et Méthodes
60
1.2. Membrane de microfiltration tangentielle
La membrane utilisée pour les études de microfiltration tangentielle est une membrane
céramique multicanaux (Kerasep type BK-Kompact, Novasep, Lyon, France) (figure II.3).
Cette membrane est composée d’une couche support monolithique formée par un mélange
d’oxyde de titane (TiO2) et d’oxyde d’aluminium (Al2O3) et d’une couche active d’oxyde de
zirconium (ZrO2) et d’oxyde de titane.
Figure II.3: Membrane céramique multicanaux de Novasep
Les caractéristiques de cette membrane sont présentées dans le tableau II.2
Tableau II.2: Caractéristiques de la membrane céramique utilisée
Matériau Diamètre de pores
(m)
Nombre de canaux
Section d’un canal
(m²)
Section totale (m²)
Longueur (m)
Surface filtrante
(m²)
ZrO2/TiO2 0,2.10-6 44 4.10-6 2.10-4 0,275 0,118
Une fois la membrane installée dans le carter, 2 joints en caoutchouc viennent assurer
l’étanchéité entre le compartiment perméat et rétentat de la membrane. Un test d’étanchéité
est réalisé par bullage à l’air. En effet, l’air est poussé du côté perméat vers le côté rétentat. Si
des bulles d’air sont observées directement du côté rétentat à 50 mbars, ceci indique que
l’étanchéité n’est pas faite entre le côté rétentat et celui du perméat. Si l’étanchéité est
parfaitement réalisée, les bulles d’air ne sont pas observées du côté rétentat qu’au-delà de 300
mbars (en deçà de cette pression la membrane reste imperméable à l’air).
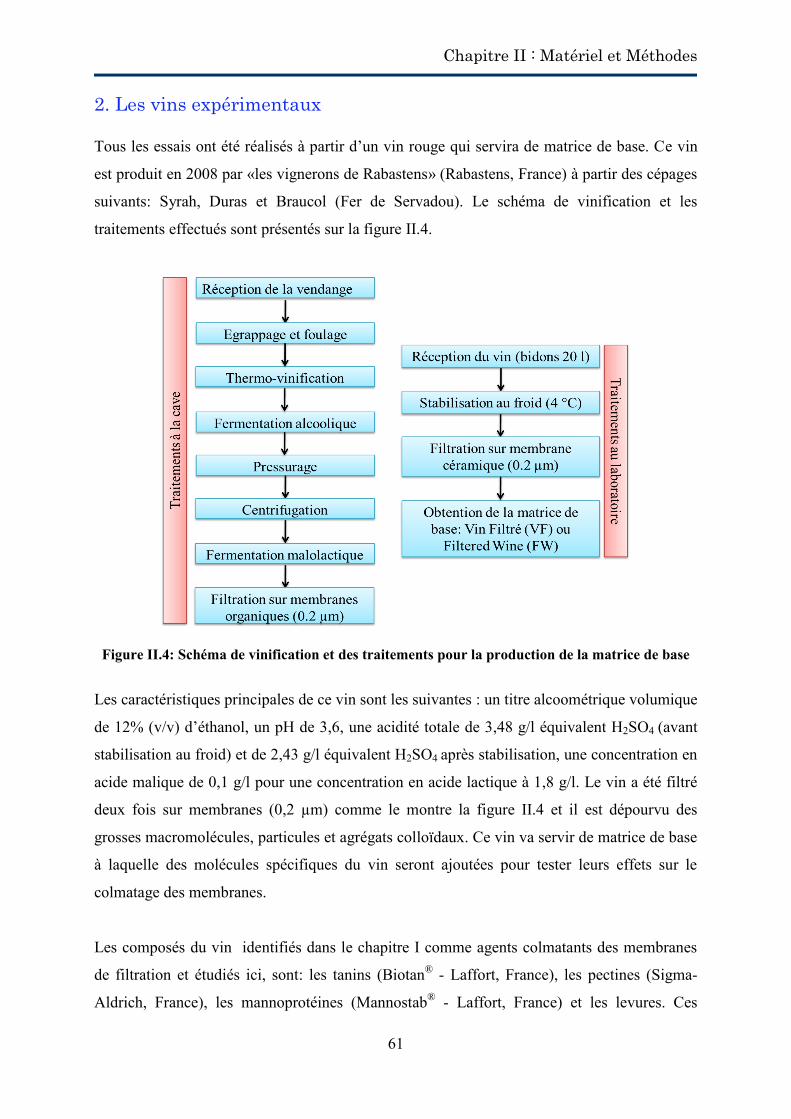
Chapitre II : Matériel et Méthodes
61
2. Les vins expérimentaux
Tous les essais ont été réalisés à partir d’un vin rouge qui servira de matrice de base. Ce vin
est produit en 2008 par «les vignerons de Rabastens» (Rabastens, France) à partir des cépages
suivants: Syrah, Duras et Braucol (Fer de Servadou). Le schéma de vinification et les
traitements effectués sont présentés sur la figure II.4.
Figure II.4: Schéma de vinification et des traitements pour la production de la matrice de base
Les caractéristiques principales de ce vin sont les suivantes : un titre alcoométrique volumique
de 12% (v/v) d’éthanol, un pH de 3,6, une acidité totale de 3,48 g/l équivalent H2SO4 (avant
stabilisation au froid) et de 2,43 g/l équivalent H2SO4 après stabilisation, une concentration en
acide malique de 0,1 g/l pour une concentration en acide lactique à 1,8 g/l. Le vin a été filtré
deux fois sur membranes (0,2 µm) comme le montre la figure II.4 et il est dépourvu des
grosses macromolécules, particules et agrégats colloïdaux. Ce vin va servir de matrice de base
à laquelle des molécules spécifiques du vin seront ajoutées pour tester leurs effets sur le
colmatage des membranes.
Les composés du vin identifiés dans le chapitre I comme agents colmatants des membranes
de filtration et étudiés ici, sont: les tanins (Biotan® - Laffort, France), les pectines (Sigma-
Aldrich, France), les mannoprotéines (Mannostab® - Laffort, France) et les levures. Ces
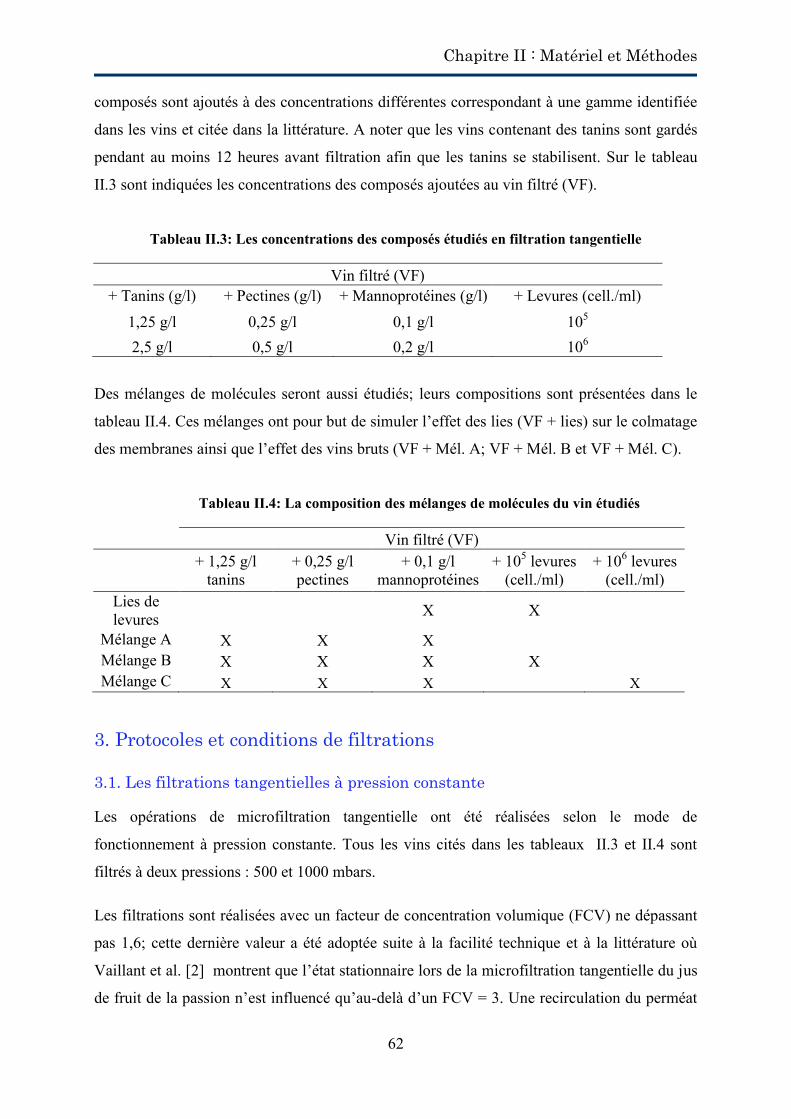
Chapitre II : Matériel et Méthodes
62
composés sont ajoutés à des concentrations différentes correspondant à une gamme identifiée
dans les vins et citée dans la littérature. A noter que les vins contenant des tanins sont gardés
pendant au moins 12 heures avant filtration afin que les tanins se stabilisent. Sur le tableau
II.3 sont indiquées les concentrations des composés ajoutées au vin filtré (VF).
Tableau II.3: Les concentrations des composés étudiés en filtration tangentielle
Vin filtré (VF) + Tanins (g/l) + Pectines (g/l) + Mannoprotéines (g/l) + Levures (cell./ml)
1,25 g/l 0,25 g/l 0,1 g/l 105 2,5 g/l 0,5 g/l 0,2 g/l 106
Des mélanges de molécules seront aussi étudiés; leurs compositions sont présentées dans le
tableau II.4. Ces mélanges ont pour but de simuler l’effet des lies (VF + lies) sur le colmatage
des membranes ainsi que l’effet des vins bruts (VF + Mél. A; VF + Mél. B et VF + Mél. C).
Tableau II.4: La composition des mélanges de molécules du vin étudiés
Vin filtré (VF)
+ 1,25 g/l tanins
+ 0,25 g/l pectines
+ 0,1 g/l mannoprotéines
+ 105 levures (cell./ml)
+ 106 levures (cell./ml)
Lies de levures X X
Mélange A X X X Mélange B X X X X
Mélange C X X X X
3. Protocoles et conditions de filtrations
3.1. Les filtrations tangentielles à pression constante
Les opérations de microfiltration tangentielle ont été réalisées selon le mode de
fonctionnement à pression constante. Tous les vins cités dans les tableaux II.3 et II.4 sont
filtrés à deux pressions : 500 et 1000 mbars.
Les filtrations sont réalisées avec un facteur de concentration volumique (FCV) ne dépassant
pas 1,6; cette dernière valeur a été adoptée suite à la facilité technique et à la littérature où
Vaillant et al. [2] montrent que l’état stationnaire lors de la microfiltration tangentielle du jus
de fruit de la passion n’est influencé qu’au-delà d’un FCV = 3. Une recirculation du perméat
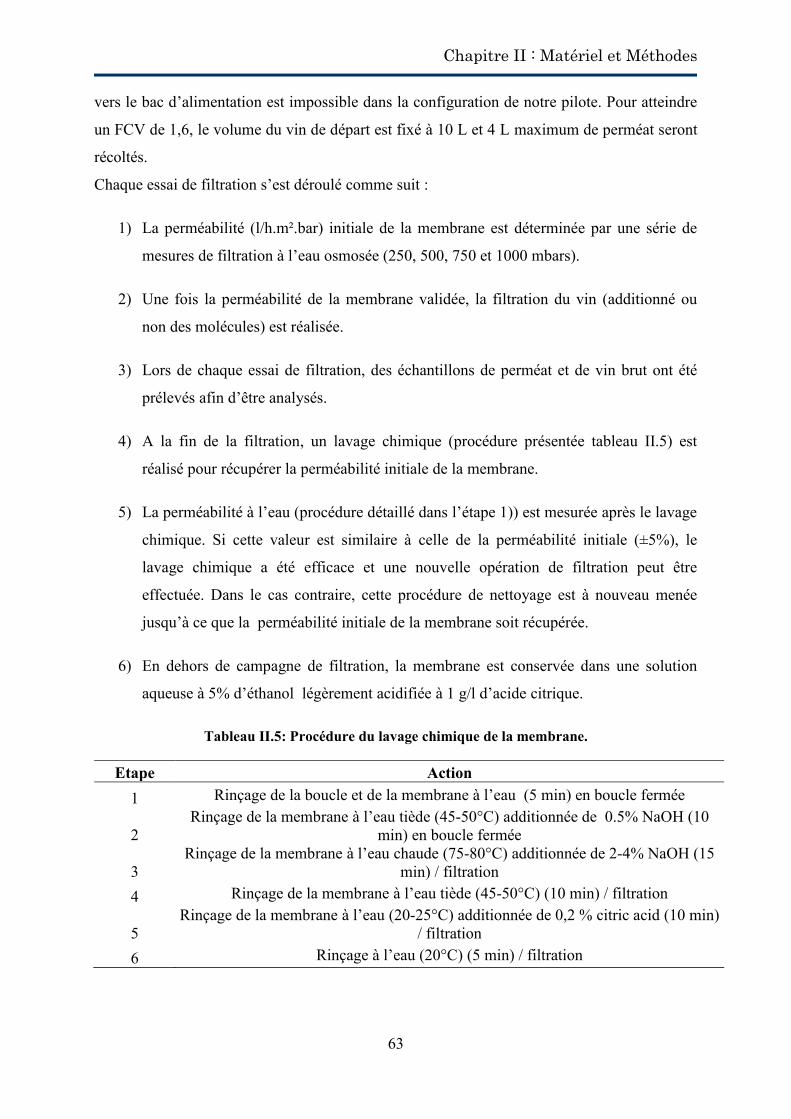
Chapitre II : Matériel et Méthodes
63
vers le bac d’alimentation est impossible dans la configuration de notre pilote. Pour atteindre
un FCV de 1,6, le volume du vin de départ est fixé à 10 L et 4 L maximum de perméat seront
récoltés.
Chaque essai de filtration s’est déroulé comme suit :
1) La perméabilité (l/h.m².bar) initiale de la membrane est déterminée par une série de
mesures de filtration à l’eau osmosée (250, 500, 750 et 1000 mbars).
2) Une fois la perméabilité de la membrane validée, la filtration du vin (additionné ou
non des molécules) est réalisée.
3) Lors de chaque essai de filtration, des échantillons de perméat et de vin brut ont été
prélevés afin d’être analysés.
4) A la fin de la filtration, un lavage chimique (procédure présentée tableau II.5) est
réalisé pour récupérer la perméabilité initiale de la membrane.
5) La perméabilité à l’eau (procédure détaillé dans l’étape 1)) est mesurée après le lavage
chimique. Si cette valeur est similaire à celle de la perméabilité initiale (±5%), le
lavage chimique a été efficace et une nouvelle opération de filtration peut être
effectuée. Dans le cas contraire, cette procédure de nettoyage est à nouveau menée
jusqu’à ce que la perméabilité initiale de la membrane soit récupérée.
6) En dehors de campagne de filtration, la membrane est conservée dans une solution
aqueuse à 5% d’éthanol légèrement acidifiée à 1 g/l d’acide citrique.
Tableau II.5: Procédure du lavage chimique de la membrane.
Etape Action 1 Rinçage de la boucle et de la membrane à l’eau (5 min) en boucle fermée
2 Rinçage de la membrane à l’eau tiède (45-50°C) additionnée de 0.5% NaOH (10
min) en boucle fermée
3 Rinçage de la membrane à l’eau chaude (75-80°C) additionnée de 2-4% NaOH (15
min) / filtration 4 Rinçage de la membrane à l’eau tiède (45-50°C) (10 min) / filtration
5 Rinçage de la membrane à l’eau (20-25°C) additionnée de 0,2 % citric acid (10 min)
/ filtration 6 Rinçage à l’eau (20°C) (5 min) / filtration
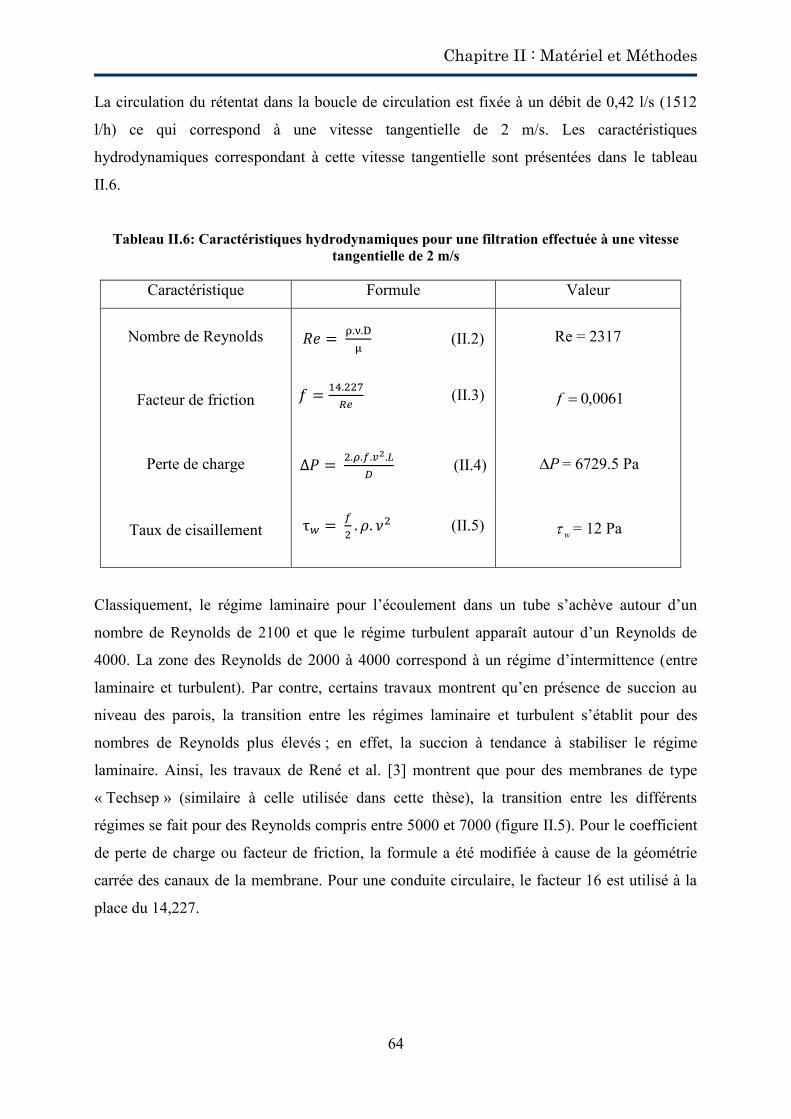
Chapitre II : Matériel et Méthodes
64
La circulation du rétentat dans la boucle de circulation est fixée à un débit de 0,42 l/s (1512
l/h) ce qui correspond à une vitesse tangentielle de 2 m/s. Les caractéristiques
hydrodynamiques correspondant à cette vitesse tangentielle sont présentées dans le tableau
II.6.
Tableau II.6: Caractéristiques hydrodynamiques pour une filtration effectuée à une vitesse tangentielle de 2 m/s
Caractéristique Formule Valeur
Nombre de Reynolds
(II.2) Re = 2317
Facteur de friction
(II.3) 0061,0f
Perte de charge
(II.4) P = 6729.5 Pa
Taux de cisaillement
(II.5)
w = 12 Pa
Classiquement, le régime laminaire pour l’écoulement dans un tube s’achève autour d’un
nombre de Reynolds de 2100 et que le régime turbulent apparaît autour d’un Reynolds de
4000. La zone des Reynolds de 2000 à 4000 correspond à un régime d’intermittence (entre
laminaire et turbulent). Par contre, certains travaux montrent qu’en présence de succion au
niveau des parois, la transition entre les régimes laminaire et turbulent s’établit pour des
nombres de Reynolds plus élevés ; en effet, la succion à tendance à stabiliser le régime
laminaire. Ainsi, les travaux de René et al. [3] montrent que pour des membranes de type
« Techsep » (similaire à celle utilisée dans cette thèse), la transition entre les différents
régimes se fait pour des Reynolds compris entre 5000 et 7000 (figure II.5). Pour le coefficient
de perte de charge ou facteur de friction, la formule a été modifiée à cause de la géométrie
carrée des canaux de la membrane. Pour une conduite circulaire, le facteur 16 est utilisé à la
place du 14,227.
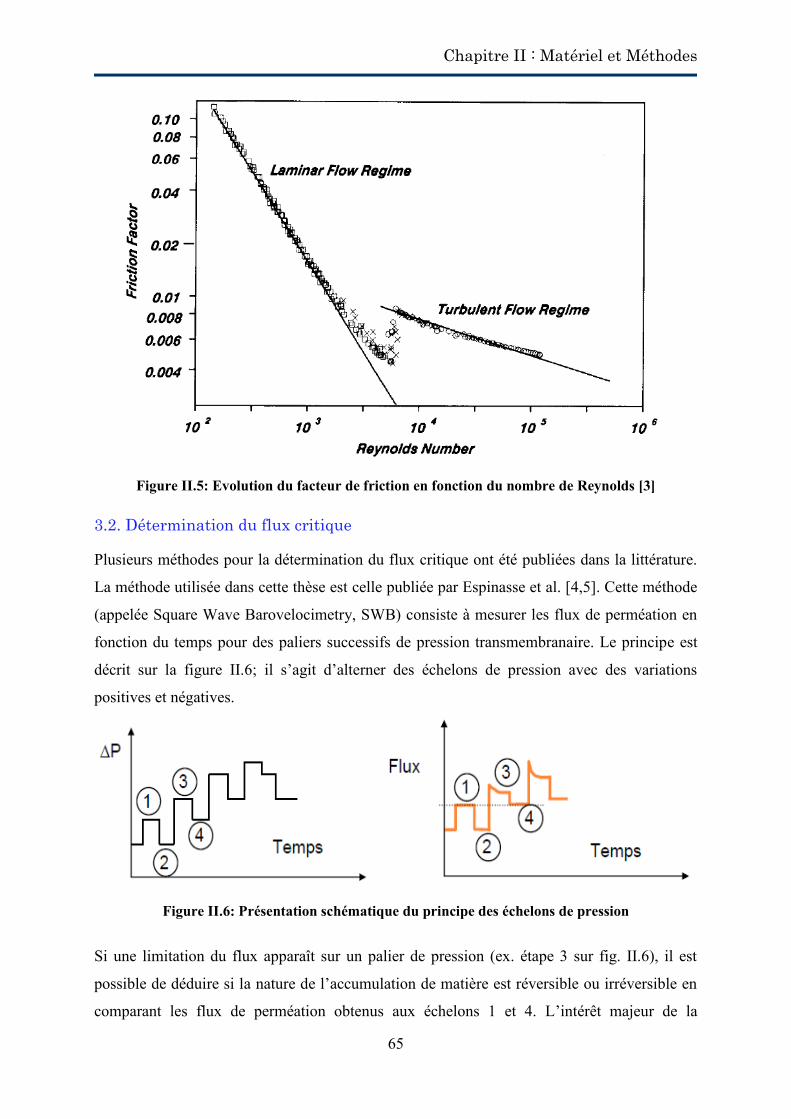
Chapitre II : Matériel et Méthodes
65
Figure II.5: Evolution du facteur de friction en fonction du nombre de Reynolds [3]
3.2. Détermination du flux critique
Plusieurs méthodes pour la détermination du flux critique ont été publiées dans la littérature.
La méthode utilisée dans cette thèse est celle publiée par Espinasse et al. [4,5]. Cette méthode
(appelée Square Wave Barovelocimetry, SWB) consiste à mesurer les flux de perméation en
fonction du temps pour des paliers successifs de pression transmembranaire. Le principe est
décrit sur la figure II.6; il s’agit d’alterner des échelons de pression avec des variations
positives et négatives.
Figure II.6: Présentation schématique du principe des échelons de pression
Si une limitation du flux apparaît sur un palier de pression (ex. étape 3 sur fig. II.6), il est
possible de déduire si la nature de l’accumulation de matière est réversible ou irréversible en
comparant les flux de perméation obtenus aux échelons 1 et 4. L’intérêt majeur de la
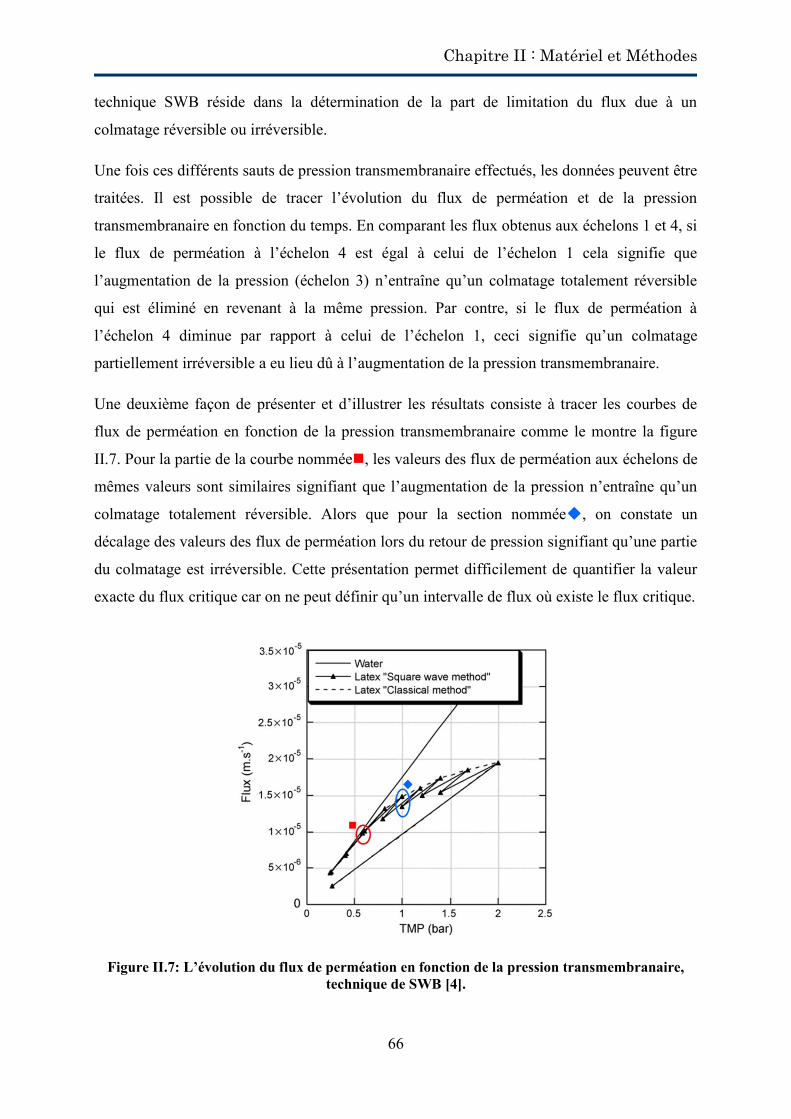
Chapitre II : Matériel et Méthodes
66
technique SWB réside dans la détermination de la part de limitation du flux due à un
colmatage réversible ou irréversible.
Une fois ces différents sauts de pression transmembranaire effectués, les données peuvent être
traitées. Il est possible de tracer l’évolution du flux de perméation et de la pression
transmembranaire en fonction du temps. En comparant les flux obtenus aux échelons 1 et 4, si
le flux de perméation à l’échelon 4 est égal à celui de l’échelon 1 cela signifie que
l’augmentation de la pression (échelon 3) n’entraîne qu’un colmatage totalement réversible
qui est éliminé en revenant à la même pression. Par contre, si le flux de perméation à
l’échelon 4 diminue par rapport à celui de l’échelon 1, ceci signifie qu’un colmatage
partiellement irréversible a eu lieu dû à l’augmentation de la pression transmembranaire.
Une deuxième façon de présenter et d’illustrer les résultats consiste à tracer les courbes de
flux de perméation en fonction de la pression transmembranaire comme le montre la figure
II.7. Pour la partie de la courbe nommée, les valeurs des flux de perméation aux échelons de
mêmes valeurs sont similaires signifiant que l’augmentation de la pression n’entraîne qu’un
colmatage totalement réversible. Alors que pour la section nommée, on constate un
décalage des valeurs des flux de perméation lors du retour de pression signifiant qu’une partie
du colmatage est irréversible. Cette présentation permet difficilement de quantifier la valeur
exacte du flux critique car on ne peut définir qu’un intervalle de flux où existe le flux critique.
Figure II.7: L’évolution du flux de perméation en fonction de la pression transmembranaire, technique de SWB [4].
Chapitre II : Matériel et Méthodes
67
Une représentation plus pratique consiste à représenter le ratio de la résistance de colmatage
sur la résistance de la membrane (Rc /Rm) en fonction du flux de perméation. Comme
préalablement mentionné, cette technique permet de quantifier les résistances réversible et
irréversible. La résistance irréversible qui peut apparaître en augmentant la pression (ex :
échelon 3) peut être calculée en comparant les résistances obtenues, par exemple, aux
échelons 1 et 4. La signification mathématique (II.6) est présentée comme suivant : ric,3
Rm = (
Rc
Rm)4 (
Rc
Rm)1 (II.6)
Où ric,3
est la résistance irréversible due à l’augmentation de la pression à l’échelon 3,
(Rc/Rm)4 est le ratio de la résistance de colmatage sur la résistance de la membrane à
l’échelon 4 et (Rc/Rm)1 est le ratio de la résistance de colmatage sur la résistance de la
membrane à l’échelon 1.
Ainsi, pour calculer la résistance totale irréversible (Ric) à un échelon n, il suffit d’additionner
toutes les résistances irréversibles (ric) de tous les échelons précédents y compris
l’échelon n (II .7):
Ric=(ric,n+ric,n 1+ric,n 2+…) (II.7)
La résistance réversible (Rrc) à un échelon n peut être déduite par l’équation suivante (II.8): Rrc
Rm =
Rc
Rm
Ric
Rm (II.8)
Le flux critique d’irréversibilité (Jci, notion définie dans le chapitre 4) peut être déduit de la
courbe des résistances réversibles et irréversibles en fonction du flux de perméation. Les
résistances irréversibles forment aux premiers échelons une droite parallèle à l’axe des
abscisses. Le flux auquel les valeurs de la résistance irréversible dévient de la droite parallèle
constitue le flux critique pour l’irréversibilité.
3.3. Les filtrations frontales
Les filtrations frontales ont été réalisées dans le but d’identifier les mécanismes de colmatage.
Ces filtrations ont été menées dans le pilote présenté sur la figure II.2. La seule différence
entre la conduite du mode frontal et celle du mode tangentiel est la mise en route de la pompe
de circulation. La pompe est arrêtée complètement dans le cas du mode frontal et la vanne V4
est fermée.
Chapitre II : Matériel et Méthodes
68
Les vins étudiés en mode frontal sont présentés dans le tableau II.7. Les filtrations frontales
ont été réalisées à deux pressions constantes : 500 et 1000 mbars.
Tableau II.7: Les composés étudiés en filtration frontale et leurs concentrations
Vin filtré (VF) + Tanins + Pectins + Mannoprotéines 1,25 g/l
0,25 g/l 0,2 g/l 2,5 g/l
3.4. Filtrations dynamiques
Le pilote pour les filtrations dynamiques ainsi que les protocoles utilisés seront détaillés dans
le chapitre V.
4. Méthodes d’analyses des vins
La composition en macromolécules des vins utilisés a été analysée avant et après filtration.
Ces analyses ont permis de déterminer l’efficacité de la filtration en regard de la limpidité et
de quantifier les éventuelles pertes en composés.
4.1. Mesure de la turbidité
La mesure de la turbidité traduit la présence de trouble ou la présence de particules et
macromolécules en suspension. Elle est exprimée en NTU (Nephlometric Turbidity Unit) qui
correspond à la mesure de la lumière diffusée par une suspension sous un angle de 90° par
rapport à la direction du faisceau incident. Pour chaque manipulation, la mesure de turbidité
du vin avant et après filtration sera effectuée à l’aide d’un turbidimètre d’EUTECH
Instruments (modèle TN-100) (Figure III-4). Ce turbidimètre est étalonné à l’aide des
solutions étalon commerciales de 0,2 NTU, 2 NTU, 80 NTU et 200 NTU.
4.2. Indice des polyphénols totaux
L’indice des polyphénols totaux (IPT) est la mesure de la quantité de molécules à noyaux
benzéniques (noyaux A et B, figure II.8) contenues dans un vin rouge notamment les tanins et
les anthocyanes. Le vin est dilué 100 fois et la densité optique mesurée à 280 nm à l’aide d’un
spectrophotomètre Agilent 8453 UV/VIS par rapport à l'eau sous 1 cm de parcours optique
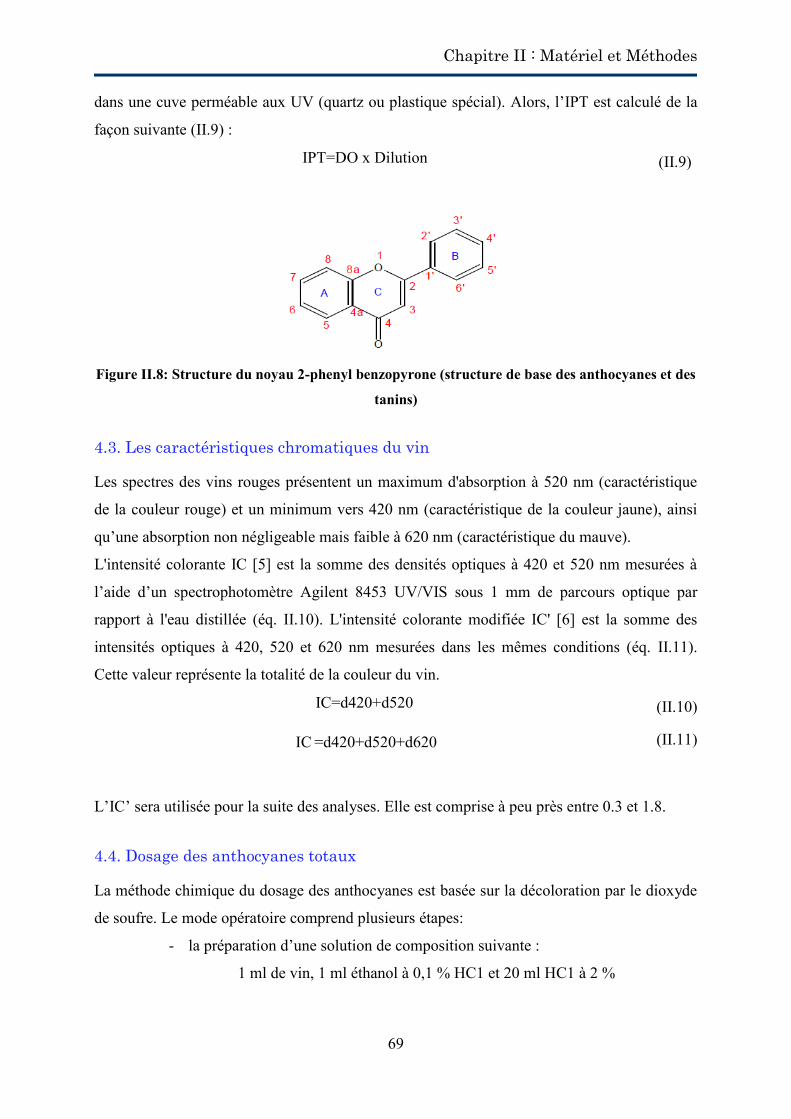
Chapitre II : Matériel et Méthodes
69
dans une cuve perméable aux UV (quartz ou plastique spécial). Alors, l’IPT est calculé de la
façon suivante (II.9) :
IPT=DO x Dilution (II.9)
Figure II.8: Structure du noyau 2-phenyl benzopyrone (structure de base des anthocyanes et des
tanins)
4.3. Les caractéristiques chromatiques du vin
Les spectres des vins rouges présentent un maximum d'absorption à 520 nm (caractéristique
de la couleur rouge) et un minimum vers 420 nm (caractéristique de la couleur jaune), ainsi
qu’une absorption non négligeable mais faible à 620 nm (caractéristique du mauve).
L'intensité colorante IC [5] est la somme des densités optiques à 420 et 520 nm mesurées à
l’aide d’un spectrophotomètre Agilent 8453 UV/VIS sous 1 mm de parcours optique par
rapport à l'eau distillée (éq. II.10). L'intensité colorante modifiée IC' [6] est la somme des
intensités optiques à 420, 520 et 620 nm mesurées dans les mêmes conditions (éq. II.11).
Cette valeur représente la totalité de la couleur du vin.
IC=d420+d520 (II.10)
IC =d420+d520+d620 (II.11)
L’IC’ sera utilisée pour la suite des analyses. Elle est comprise à peu près entre 0.3 et 1.8.
4.4. Dosage des anthocyanes totaux
La méthode chimique du dosage des anthocyanes est basée sur la décoloration par le dioxyde
de soufre. Le mode opératoire comprend plusieurs étapes:
- la préparation d’une solution de composition suivante :
1 ml de vin, 1 ml éthanol à 0,1 % HC1 et 20 ml HC1 à 2 %

Chapitre II : Matériel et Méthodes
70
- dans deux tubes à essais on place 10 ml de la solution précédente auxquels on
ajoute, dans le premier 4 ml d'eau distillée et dans le second 4 ml d'une solution de bisulfite de
sodium à 15 % (solution du commerce d = 1,24 diluée au 1/2).
- la décoloration est pratiquement instantanée, cependant on mesure les densités
optiques après 20 minutes d attente. Ces mesures sont faites à 520 nm à l’aide d’un
spectrophotomètre Agilent 8453 UV/VIS par rapport à l'eau sous 1 cm de parcours optique
La concentration est donnée en mg/l en reportant la différence des densités optiques à une
courbe étalon établie à l'aide de la formule (II.12) [7]:
[Anthocyanes]=875 x Δd (mg/l) (II.12)
4.5. Dosage des tanins totaux
Les tanins de vin rouge sont constitués de chaînes proanthocyanidines plus ou moins
polymérisés. Le chauffage en milieu acide entraîne la rupture de certaines liaisons et la
formation de carbocations qui se transforment en anthocyanidines si le milieu est
suffisamment oxydant (Réaction de Bate-Smith). Le dosage des tanins pour les vins utilisant
cette propriété était mis en place par Ribéreau-Gayon et Stonestreet en 1966 [8].
Le mode opératoire est le suivant:
- dans deux tubes à essais (normal et à hydrolyse) ajouter en suivant :
4 ml de vin dilué 50 fois
2 ml d'eau distillée
6 ml HC1 (12 N) ou HC1 concentré
- placer soit un réfrigérant rempli de glace pilée sur le tube à hydrolyse, soit un
bouchon étanche et porter le tout au bain-marie à 100° C pendant 30 minutes
- une fois la transformation terminée, laisser refroidir et ajouter 1 ml d'éthanol
dans les deux tubes
- mesurer la densité optique des deux tubes à 550 nm par rapport à l'eau sous 1
cm de parcours optique
La concentration en g/L est donnée en reportant la différence de densités optique à une courbe
étalon tracée à partir de la formule (II.13) [8]:
[Tanins totaux]=1 ,33 x Δd (g/l) (II.13)
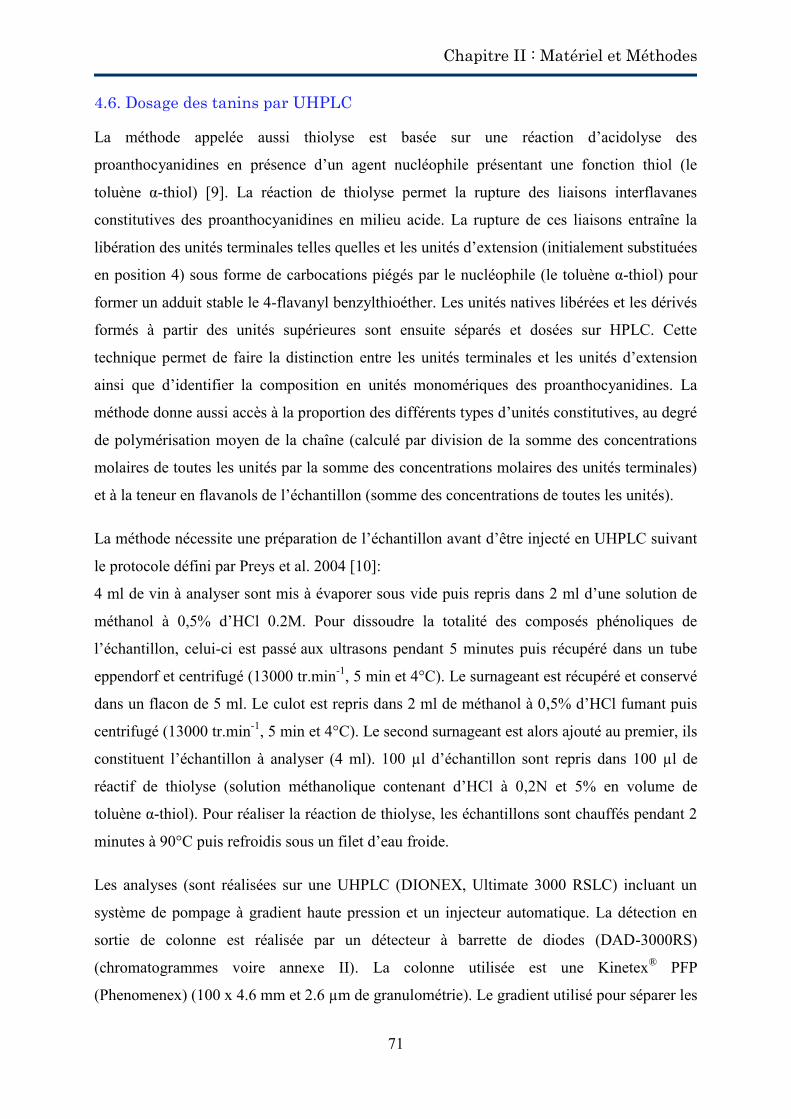
Chapitre II : Matériel et Méthodes
71
4.6. Dosage des tanins par UHPLC
La méthode appelée aussi thiolyse est basée sur une réaction d’acidolyse des
proanthocyanidines en présence d’un agent nucléophile présentant une fonction thiol (le
toluène α-thiol) [9]. La réaction de thiolyse permet la rupture des liaisons interflavanes
constitutives des proanthocyanidines en milieu acide. La rupture de ces liaisons entraîne la
libération des unités terminales telles quelles et les unités d’extension (initialement substituées
en position 4) sous forme de carbocations piégés par le nucléophile (le toluène α-thiol) pour
former un adduit stable le 4-flavanyl benzylthioéther. Les unités natives libérées et les dérivés
formés à partir des unités supérieures sont ensuite séparés et dosées sur HPLC. Cette
technique permet de faire la distinction entre les unités terminales et les unités d’extension
ainsi que d’identifier la composition en unités monomériques des proanthocyanidines. La
méthode donne aussi accès à la proportion des différents types d’unités constitutives, au degré
de polymérisation moyen de la chaîne (calculé par division de la somme des concentrations
molaires de toutes les unités par la somme des concentrations molaires des unités terminales)
et à la teneur en flavanols de l’échantillon (somme des concentrations de toutes les unités).
La méthode nécessite une préparation de l’échantillon avant d’être injecté en UHPLC suivant
le protocole défini par Preys et al. 2004 [10]:
4 ml de vin à analyser sont mis à évaporer sous vide puis repris dans 2 ml d’une solution de
méthanol à 0,5% d’HCl 0.2M. Pour dissoudre la totalité des composés phénoliques de
l’échantillon, celui-ci est passé aux ultrasons pendant 5 minutes puis récupéré dans un tube
eppendorf et centrifugé (13000 tr.min-1, 5 min et 4°C). Le surnageant est récupéré et conservé
dans un flacon de 5 ml. Le culot est repris dans 2 ml de méthanol à 0,5% d’HCl fumant puis
centrifugé (13000 tr.min-1, 5 min et 4°C). Le second surnageant est alors ajouté au premier, ils
constituent l’échantillon à analyser (4 ml). 100 µl d’échantillon sont repris dans 100 µl de
réactif de thiolyse (solution méthanolique contenant d’HCl à 0,2N et 5% en volume de
toluène α-thiol). Pour réaliser la réaction de thiolyse, les échantillons sont chauffés pendant 2
minutes à 90°C puis refroidis sous un filet d’eau froide.
Les analyses (sont réalisées sur une UHPLC (DIONEX, Ultimate 3000 RSLC) incluant un
système de pompage à gradient haute pression et un injecteur automatique. La détection en
sortie de colonne est réalisée par un détecteur à barrette de diodes (DAD-3000RS)
(chromatogrammes voire annexe II). La colonne utilisée est une Kinetex® PFP
(Phenomenex) (100 x 4.6 mm et 2.6 µm de granulométrie). Le gradient utilisé pour séparer les
Chapitre II : Matériel et Méthodes
72
composés est présenté dans le tableau II.8. Le four est thermostaté à 45 °C, le volume
d’injection est de 5µl et le débit est de 3 ml/min.
Tableau II.8: Gradient de solvants utilisé lors des analyses de thiolyse
Temps (min) Solvant A (%) (eau/acide formique – 98/2, v/v)
Solvant B (%) (eau/acide formique/ acétonitrile – 18/2/80,
v/v/v)
0 95 5 2,7 82 18 3,43 82 18
5 62 38 6,13 62 38 6,55 20 80 7,28 20 80 7,5 95 5 8,4 95 5
4.7. Dosage des polysaccharides totaux
Le principe de la méthode est de précipiter les polysaccharides en milieu acide et en présence
d’alcool (80%). Ce protocole est basé sur la méthode d’Usseglio-Tomasset [11]. Le mode
opératoire est le suivant:
- centrifuger 20 mL de vin pendant 15 min à 5000 R.P.M.
- récupérer le surnageant dans un erlenmeyer de 100 mL
- précipiter les polysaccharides en ajoutant 4 mL de HCl 36% dilué 1/1
- ajouter 80 mL d’éthanol à 95%
- agiter avec agitateur magnétique pendant 15 min
- laisser précipiter 24h à 4°C
- sécher des filtres (0,45µm) à 40°C pendant 30 min ; peser les filtres séchés (P1)
- filtrer sous vide la solution
- placer les filtres contenant les polysaccharides à 40°C pendant 30 min ; peser
les filtres séchés (P2)
[Polysaccharides totaux]=P2-P1 (mg/l) (II.14)
Chapitre II : Matériel et Méthodes
73
4.8. Granulométrie laser
Le principe de l’analyse utilise la quantité de lumière laser déviée par les molécules du vin et
la mesure de l’angle de cette déviation. Les particules fines dévient une faible quantité de
lumière laser suivant des angles de déviation importants, et inversement pour les particules
plus grossières. La lumière laser est déviée par les particules rencontrées sur son axe de
propagation selon les lois de diffraction, diffusion et réflexion. Les intensités résultantes sont
recueillies par des photodiodes puis numérisées. Les mesures de la granulométrie laser des
vins additionnés des macromolécules ont été réalisées avec un Zetasizer Nano S (Malvern
instruments, Malvern, U.K.) équipé d’un laser type He-Ne (633 nm). Les mesures sont
réalisées à 25°C et avec un angle de faisceau incident de 173° (Résultats voire annexe III).
4.9. Mesure de viscosité dynamique
La rhéologie étudie l’écoulement ou la déformation des corps sous l’effet des contraintes qui
leur sont appliquées, compte tenu de la vitesse d’application de ces contraintes ou plus
généralement de leur variation au cours du temps ainsi que de la température. La viscosité
dynamique (Pa.s) est la pente obtenue en traçant la courbe de l’évolution de la contrainte de
cisaillement en fonction de vitesse de cisaillement. Les essais ont été effectués avec un
rhéomètre à contrainte imposée de type AR-2000 ex (TA instruments), équipé d’une module
de mesure à géométrie de couette (double cylindre concentrique). La température est régulée à
20°C. L’essai proprement dit est réalisé en imposant successivement 20 vitesses de
cisaillement comprises entre 0,05 s-1 et 300 s-1 par pas de 10 s-1 (Voire annexe IV).
5. Culture de levures
Les levures (Saccharomyces Cerevisiae) nécessaires à la mise en œuvre de notre étude
proviennent d’une culture en milieu synthétique que nous avons réalisée. La levure est un
organisme eucaryote dont la performance de multiplication cellulaire par bourgeonnement est
essentiellement déterminée par la disponibilité des substrats, la présence d’inhibiteurs et les
conditions environnementales. En absence d’éthanol et de métabolites secondaires, les levures
sont sensibles à deux facteurs environnementaux principaux : la température et le pH. La
température optimale de croissance est autour de 30°C. Ayant pris connaissance de tous ces
paramètres, nous réalisons une culture de levures en milieu synthétique. Le milieu de culture
synthétique nécessaire à la culture de levures contient différents éléments nutritionnels
indispensables à leur multiplication. Ils sont détaillés dans le tableau II.9:
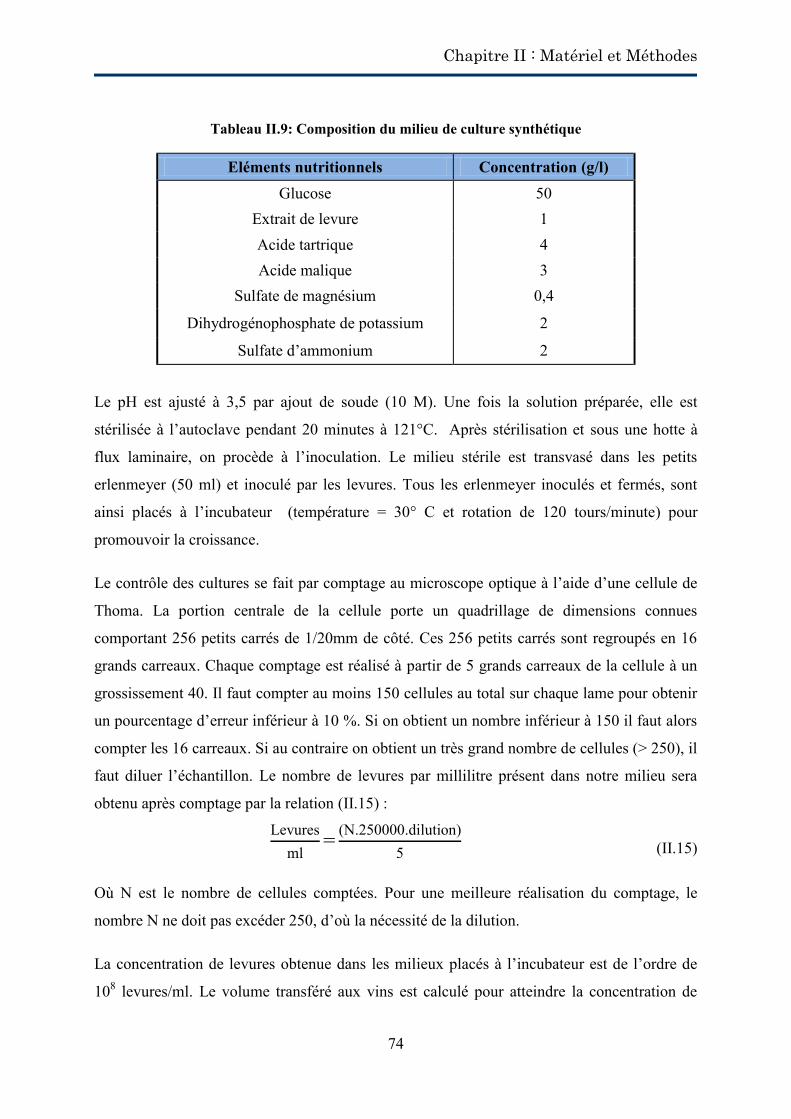
Chapitre II : Matériel et Méthodes
74
Tableau II.9: Composition du milieu de culture synthétique
Eléments nutritionnels Concentration (g/l) Glucose 50
Extrait de levure 1 Acide tartrique 4 Acide malique 3
Sulfate de magnésium 0,4
Dihydrogénophosphate de potassium 2
Sulfate d’ammonium 2
Le pH est ajusté à 3,5 par ajout de soude (10 M). Une fois la solution préparée, elle est
stérilisée à l’autoclave pendant 20 minutes à 121°C. Après stérilisation et sous une hotte à
flux laminaire, on procède à l’inoculation. Le milieu stérile est transvasé dans les petits
erlenmeyer (50 ml) et inoculé par les levures. Tous les erlenmeyer inoculés et fermés, sont
ainsi placés à l’incubateur (température = 30° C et rotation de 120 tours/minute) pour
promouvoir la croissance.
Le contrôle des cultures se fait par comptage au microscope optique à l’aide d’une cellule de
Thoma. La portion centrale de la cellule porte un quadrillage de dimensions connues
comportant 256 petits carrés de 1/20mm de côté. Ces 256 petits carrés sont regroupés en 16
grands carreaux. Chaque comptage est réalisé à partir de 5 grands carreaux de la cellule à un
grossissement 40. Il faut compter au moins 150 cellules au total sur chaque lame pour obtenir
un pourcentage d’erreur inférieur à 10 %. Si on obtient un nombre inférieur à 150 il faut alors
compter les 16 carreaux. Si au contraire on obtient un très grand nombre de cellules (> 250), il
faut diluer l’échantillon. Le nombre de levures par millilitre présent dans notre milieu sera
obtenu après comptage par la relation (II.15) :
Levuresml
= (N.250000.dilution)5
(II.15)
Où N est le nombre de cellules comptées. Pour une meilleure réalisation du comptage, le
nombre N ne doit pas excéder 250, d’où la nécessité de la dilution.
La concentration de levures obtenue dans les milieux placés à l’incubateur est de l’ordre de
108 levures/ml. Le volume transféré aux vins est calculé pour atteindre la concentration de
Chapitre II : Matériel et Méthodes
75
levures souhaitée (105 et 106 lev./ml) ; par exemple, 1 ml de levain est transféré à 1 l de vin
pour avoir une concentration de 105 levures/ml.
Références
[1] J.-M. Desseigne, Microfiltration tangentielle : mises en œuvre en œnologie, Itinéraires de l’Institut Français de la Vigne et du Vin, 19 (2008) 32 pages. [2] F. Vaillant, P. Millan, G. O’Brien, M. Dornier, M. Decloux, M. Reynes, Cross flow microfiltration of passion fruit juice after partial enzymatic liquefaction, J. Food Eng. 42 (1999) 215-224. [3] F. René, M. Lalande, Momentum and mass transfer during ultrafiltration of dextran with tubular mineral membranes in turbulent flow regime, J. Membr. Sci. 56 (1991) 29-48. [4] B. Espinasse, P. Bacchin, P. Aimar, On an experimental method to measure critical flux in ultrafiltration, Desalintaion 146 (2002) 91-96. [5] B. Espinasse, P. Bacchin, P. Aimar, Filtration method characterizing the reversibility of colloidal fouling layers at a membrane surface: Analysis through critical flux and osmotic pressure, J. Colloid Interface Sci. 320 (2008) 483-490. [6] P. Sudraud, Interprétation des courbes d’adsorption des vins rouges, Ann. Technol. Agric. 7 (1958) 203-208. [7] Y. Glories, La couleur des vins rouges, Connaiss. Vigne Vin 18 (1984) 195−217. [8] P. Ribéreau-Gayon, E. Stonestreet, Le dosage des anthocyanes dans les vins rouges, Bulletin de la société de chimie 9 (1965) 2649-2652. [9] P. Ribéreau-Gayon, E. Stonestreet, Le dosage des tanins du vin rouge et détermination de leur structure, Chimie Analytique 48 (1966) 188-192. [10] C. Prieur, J. Rigaud, V. Cheynier, M. Moutounet, Oligomeric and polymeric procyanidins from grape seeds, Phytochemistry 36 (1994) 781-784. [11] S. Preys, J.M. Souquet, E. Meudec, C. Morel-Salmi, V. Cheynier, Development of a rapid quantative method to analyse proanthocyanidins in red wines, XXII International Conference on Polyphenols, Helsinki (Finland), August (2004). [12] L. Usseglio-Tomasset, Les colloïdes glucidiques solubles des moûts et des vins, Connaiss. Vigne Vin 10 (1976) 193-226.
Chapitre III:
Molécules du vin et
colmatage
Chapitre III : Molécules du vin et colmatage
77
Préambule
Lors des opérations de microfiltration tangentielle du vin et malgré le flux tangentiel, un
colmatage progressif des membranes s’installe. Ce colmatage se traduit par une diminution
importante des flux de perméation. L’encrassement des membranes durant les opérations de
microfiltration tangentielle de fluides biologiques, comme le vin et la bière, est la résultante
de phénomènes d’adsorption, de dépôt de surface et/ou en profondeur et de la formation d’un
gâteau de filtration par les éléments retenus.
Des études ont été réalisées pour comprendre et minimiser ces phénomènes de rétention.
L’analyse des constituants du vin ainsi que des composés retenus par les membranes ont
permis d’identifier les molécules du vin susceptibles de colmater les membranes. Le seuil de
coupure ainsi que la nature des matériaux membranaires ont été étudiés afin d’obtenir la
limpidité et la stabilité microbiologique désirées tout en limitant les interactions
produit/matériau et les phénomènes de rétention.
Dans la filière œnologique, les contraintes liées aux besoins de production à l’échelle
industrielle (flux de perméation compris entre 50 et 200 l/h.m² - faisabilité d’une installation
industrielle avec une surface de filtration comprise entre 10 et 120 m² - vitesse tangentielle
comprise entre 1 et 3 m/s) ont dirigé les recherches depuis quelques années vers l’amélioration
des conditions hydrodynamiques et des procédés de décolmatage.
Indépendamment de la nature de la membrane, il est aussi admis que les composés colloïdaux
(comme les polysaccharides, les polyphénols, les protéines, etc) ainsi que les particules
(comme les levures, les bactéries, les agrégats colloïdaux, etc) sont impliqués dans les
phénomènes de colmatage; cependant, à ce jour, les mécanismes et les conditions impliquant
un colmatage ne sont pas totalement identifiés pas plus que l’impact individuel de chaque
composé qui pourrait contribuer à cette interprétation des phénomènes, et par là même à la
limitation de leurs effets néfastes. Ainsi, peu de travaux ont été consacrés au rôle des
particules du vin et leur contribution dans la formation d’un dépôt en filtration. Une meilleure
compréhension des mécanismes engendrant le colmatage des membranes lors de la
microfiltration du vin est donc d’une importance cruciale pour plusieurs raisons; elle
permettra de: i) réduire et contrôler l’encrassement des membranes, ii) adapter les conditions
opératoires de filtration iii) améliorer les procédures de nettoyage, iv) choisir un matériau
membranaire approprié.
Chapitre III : Molécules du vin et colmatage
78
L’objectif de cette étude est de déterminer l’impact individuel, puis en mélanges, de certains
composés du vin (tanins, pectinss, mannoprotéines et levures) lors des opérations de
microfiltration tangentielle du vin. Une identification des mécanismes de colmatage régissant
ces filtrations accompagne cette étude. Elle a été menée sur le pilote équipé par une
membrane céramique multicanaux (caractéristiques du pilote et de la membrane détaillés dans
le chapitre II) en utilisant comme matrice de base un vin rouge filtré (caractéristiques dans la
partie. II.2) additionné de molécules colmatantes.
Ce chapitre est divisé en deux parties :
- III.1 : Cette partie sera présentée sous forme d’un article scientifique qui sera soumis à
Separation and purification technology. Les objectifs sont de déterminer l’impact
individuel des tanins, des pectinss, des mannoprotéines et des levures sur le colmatage
de la membrane céramique lors des opérations de microfiltration tangentielle ainsi que
la caractérisation des mécanismes de colmatage impliqués dans les filtrations
précédentes. Pour y parvenir, nous utiliserons les modèles classiques de colmatage
gouvernés par une équation mathématique commune : d2tdV2 = . (
dtdV
)n. Cette démarche
est novatrice par rapport aux études déjà menées sur la microfiltration tangentielle
appliquée aux vins; en effet, seul le modèle des résistances en série a jusque-là été
utilisé.
- III.2 : Cette partie sera consacrée à l’étude de l’impact des mélanges de molécules
(utilisées individuellement dans la partie III.1) sur le colmatage.
Partie III.1
Article à soumettre à Separation and purification technology
Chapitre III : Molécules du vin et colmatage
80
Individual impact of wine components on multichannel ceramic membrane
fouling during cross-flow microfiltration: Analysis of fouling mechanisms
Abstract
The aim of this study was to investigate the individual impact on wine molecules as tannins,
pectins, mannoproteins and yeasts on multichannel ceramic membrane fouling during wine
cross-flow microfiltration. The characterisation of fouling mechanisms involved in the
previous filtrations was realized by using the classical fouling models and the analysis of the
total resistance curves. It was shown that the obtained initial fluxes are dependant of the
nature of studied molecules and their concentration. According to their increasing effect on
permeate flux decline, the studied wine components could be ranked as : yeasts <
mannoproteins < tannins < pectins. During the filtration of wine added with tannins, it was
found that the filtrations were governed by the cake layer formation mechanism. The presence
of pectins caused the formation of gel-type layer which is found to be compressible with high
pressures. For wines added with mannoproteins filtrations, it was shown that there is a
threshold concentration above it a plateau value of permeate flux is obtained. It was also
found that dilute suspension of yeasts didn’t form a ca e at the membrane surface. At last, the
initial turbidity of the solutions cannot be used as predictive tools to membrane performances
during wine filtration.
Keywords: Cross-flow microfiltration, wine, tannins, pectins, mannoproteins.
Chapitre III : Molécules du vin et colmatage
81
1. Introduction
Clarifying wines using membrane filtration has begun to set up in oenology sector since the
mid 1980’s [1]. Compared to the conventional clarification process such as centrifugation,
filtration on sheets and diatomaceous earth filtration…, cross-flow microfiltration can bring
the following benefits: i) combination of clarification, microbiological stabilization and sterile
filtration in one single continuous operation; ii) reducing wine loss and energy costs by
substitution of several traditional filtrations; iii) elimination the use of diatomaceous earth,
thereby, reducing production costs and the problem of waste disposal leading to an improve in
hygiene and work safety; iv) highly automated processes reducing costs and possibility of data
recovery [2].
Unfortunately, a main problem occurs in practical application of cross-flow microfiltration in
wine industry which is membrane fouling. It manifests by the reduction of permeate flux with
time, caused by the wine components. This has caused difficulties in obtaining an economical
flux rate and good production.
When filtering a fluid of biological origin as wine and considering its complexity, membrane
fouling can be attributed to three different mechanisms: i) concentration polarization and
subsequent cake layer formation, ii) adsorption of solutes on to the membrane surface and
pore walls, iii) blockage of pores [2,3]. The model of concentration polarization is no longer
applicable to the microfiltration of wine because the fluid contains macromolecules and
particles which have low diffusion coefficient. Therefore, back diffusion of components from
the membrane surface into the bulk solution is slow and cannot counterbalance the convective
mass transport towards the membrane.
Membrane fouling could also be divided according to its location relative to the membrane
structure:
Internal fouling is caused by the adsorption and deposition of small particles and
macromolecules within the internal structure of the pores;
External fouling is caused by the deposition of large macromolecules and particles
on the top of membrane surface.
Works concerning wine cross-flow microfiltration highlighted that wine macromolecules as
polyphenols, polysaccharides and proteins as well as wine particles as yeast, bacteria and cell
Chapitre III : Molécules du vin et colmatage
82
debris are responsible of membrane fouling [3-6]. Many researchers have demonstrated the
negative effect of wine polysaccharides and polyphenols on the permeation flux especially by
adsorption of these molecules on membrane materials [3,4,7]. A recent study [7] had provided
evidence that different membrane materials exhibit different levels of adsorption of typical
foulants in wine such as polysaccharides and polyphenol. Adsorption of these components is
less on hydrophobic membrane than on hydrophilic membrane.
Belleville et al. [4] attributed the fouling of an alumina membrane mainly to polysaccharides.
Researchers noticed that the membrane fouling by a given wine is not directly related to its
total polysaccharides content but rather to the composition, structure of these polysaccharides
and the balance between different groups of polysaccharides.
In the first studies, the participation of phenolic compounds to membrane fouling was
highlighted by the red colour of membrane at the end of the filtration [2]. The involvement of
wine polyphenols in the membrane fouling was been identified by washing the fouled
membrane with acidified methanol. Significant increases in permeability were obtained.
According to Czekaj et al. [8], while filtering two white wines having the same initial
turbidity, the different polyphenol concentrations of these 2 wines may explain the different
performances observed during filtration.
In wine filtration, the effect of wine proteins on membrane fouling was a little studied. This is
due to their elimination before filtration by fining with bentonite especially in white wines.
The impact of wine proteins on membrane fouling was elucidated by eliminating them from
wine through fining with bentonite [5,9] or adsorption on zirconium oxide column [5].
Only little also is known about the impact of wine particles on membrane fouling. It was
shown that a reversible deposit is always formed during the filtration of wines containing only
yeasts. Boissier et al. [6] showed that, among wine particles, lactic bacteria and colloidal
aggregates tend to govern the membrane fouling more than yeasts.
There have been numerous attempts to reduce membrane fouling by mechanical (back-
flushing, back-pulsing and cross-flushing) and chemical cleaning. These steps are time
consuming and adding up mechanical and chemical stress to the filtration devices resulting in
a loss of capacity and efficiency of the equipment. However, these techniques seem to be
inefficient within the first 15 minutes of filtration (in situ observations on industrial
equipment) depending on wine composition, treatments and operating conditions. Also, a
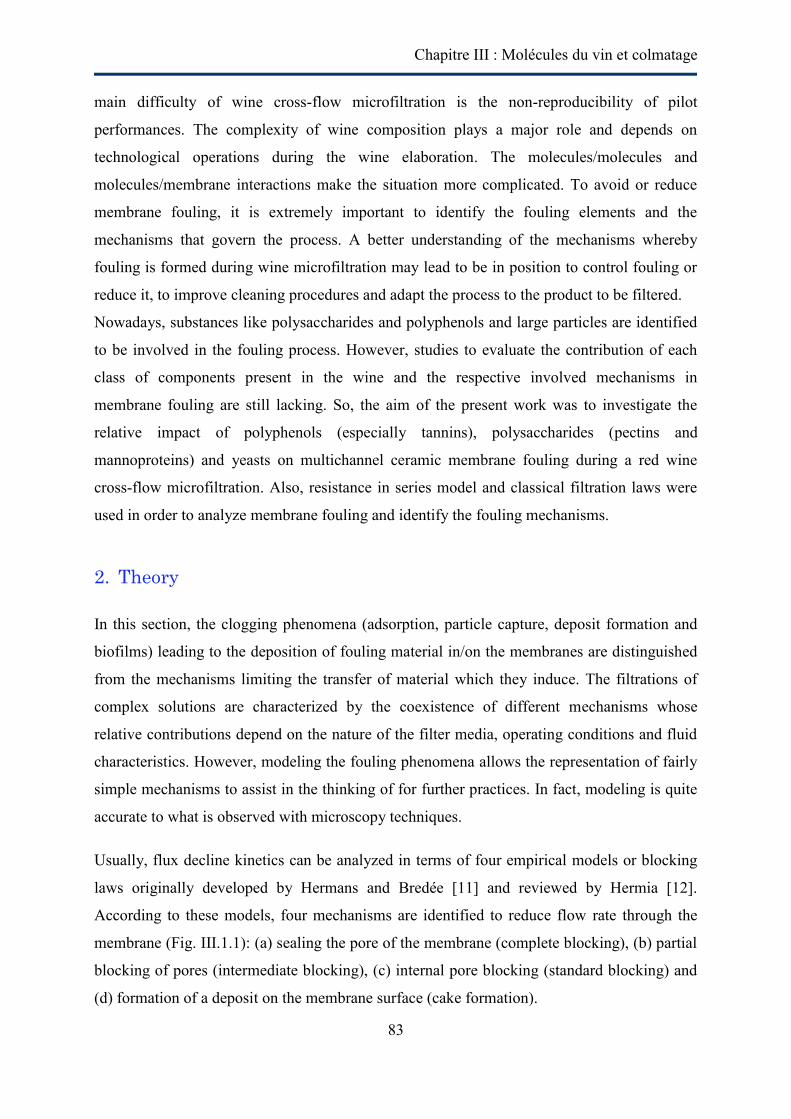
Chapitre III : Molécules du vin et colmatage
83
main difficulty of wine cross-flow microfiltration is the non-reproducibility of pilot
performances. The complexity of wine composition plays a major role and depends on
technological operations during the wine elaboration. The molecules/molecules and
molecules/membrane interactions make the situation more complicated. To avoid or reduce
membrane fouling, it is extremely important to identify the fouling elements and the
mechanisms that govern the process. A better understanding of the mechanisms whereby
fouling is formed during wine microfiltration may lead to be in position to control fouling or
reduce it, to improve cleaning procedures and adapt the process to the product to be filtered.
Nowadays, substances like polysaccharides and polyphenols and large particles are identified
to be involved in the fouling process. However, studies to evaluate the contribution of each
class of components present in the wine and the respective involved mechanisms in
membrane fouling are still lacking. So, the aim of the present work was to investigate the
relative impact of polyphenols (especially tannins), polysaccharides (pectins and
mannoproteins) and yeasts on multichannel ceramic membrane fouling during a red wine
cross-flow microfiltration. Also, resistance in series model and classical filtration laws were
used in order to analyze membrane fouling and identify the fouling mechanisms.
2. Theory
In this section, the clogging phenomena (adsorption, particle capture, deposit formation and
biofilms) leading to the deposition of fouling material in/on the membranes are distinguished
from the mechanisms limiting the transfer of material which they induce. The filtrations of
complex solutions are characterized by the coexistence of different mechanisms whose
relative contributions depend on the nature of the filter media, operating conditions and fluid
characteristics. However, modeling the fouling phenomena allows the representation of fairly
simple mechanisms to assist in the thinking of for further practices. In fact, modeling is quite
accurate to what is observed with microscopy techniques.
Usually, flux decline kinetics can be analyzed in terms of four empirical models or blocking
laws originally developed by Hermans and Bredée [11] and reviewed by Hermia [12].
According to these models, four mechanisms are identified to reduce flow rate through the
membrane (Fig. III.1.1): (a) sealing the pore of the membrane (complete blocking), (b) partial
blocking of pores (intermediate blocking), (c) internal pore blocking (standard blocking) and
(d) formation of a deposit on the membrane surface (cake formation).
Chapitre III : Molécules du vin et colmatage
84
Figure III.1.1: Illustration of the fouling mechanisms considered by the blocking laws.
These models have been developed for dead-end filtration with membranes having identical
circular pores (identical pore diameter and length). The parameters considered by these
models have a physical meaning and contribute to the comprehension of the mechanisms of
membrane fouling. The four models are based on the laws of constant pressure filtration and
can be described by a common mathematical equation (III.1.1):
(
)
(III.1.1)
The representation of this equation in logarithmic scale gives directly the value of the
obtained slope (n). The exponent n (blocking index) characterizes the filtration mechanism
while k (resistance coefficient) allows the evaluation of the characteristic parameters of the
retained model.
i) Complete pore blocking (n=2) [13-15]
According to this model, each molecule, bigger than the pore diameter, is retained at the
surface of the membrane and blocks completely the pores entrance. Moreover, the molecules
never settle on other molecules which have previously been deposited. The linearized form of
this model is presented by equation III.1.2:
l (III.1.2)
The parameter Kc can be expressed in terms of the blocked surface of the membrane per unit
of filtered volume that flow through the membrane (KA) and the initial permeate flux (J0)
using the following equation:
(III.1.3)
Chapitre III : Molécules du vin et colmatage
85
Therefore, the active membrane surface is reduced over time as a consequence of its pores
being completely blocked.
ii) Standard blocking model (n=3/2) [13-15]
This model considers that the inner pores walls are covered gradually and uniformly by
molecules smaller than pore size. This decreases the pore volume proportionally to the filtered
volume. Therefore, the cross-section of the pores decreases over time. The linearized form is
given by the equation (III.1.4)
(III.1.4)
The parameter Ks can be expressed in terms of the cross section blocked surface per unit of
total volume that flow through the membrane (KB), the initial permeate flux (J0), the
membrane surface blocked at time t (A) and the initial membrane surface (A0) according to
equation (III.1.5):
(III.1.5)
This model is often used to define the mechanism due to the adsorption of molecules on the
inner wall of the membranes and adhesion of these molecules on each other.
iii) Intermediate pore blocking model (n=1) [13-15]
As well as the complete blocking model, this model assumes that the molecules block the
entrance of the pores. But, it considers also that molecules can settle on others previously
retained by the membrane. This means that not all molecules approaching the surface of the
membrane block a pore entrance. The linear form of this model is expressed by the following
equation:
(III.1.6)
The parameter Ki is expressed according to the blocked surface of the membrane per unit of
total volume that flow through the membrane (KA). The active membrane surface decreases
over time. Therefore, the probability of a molecule to block a pore decreases continuously
over time. So Ki is expressed by the equation (III.1.7)
(III.1.7)
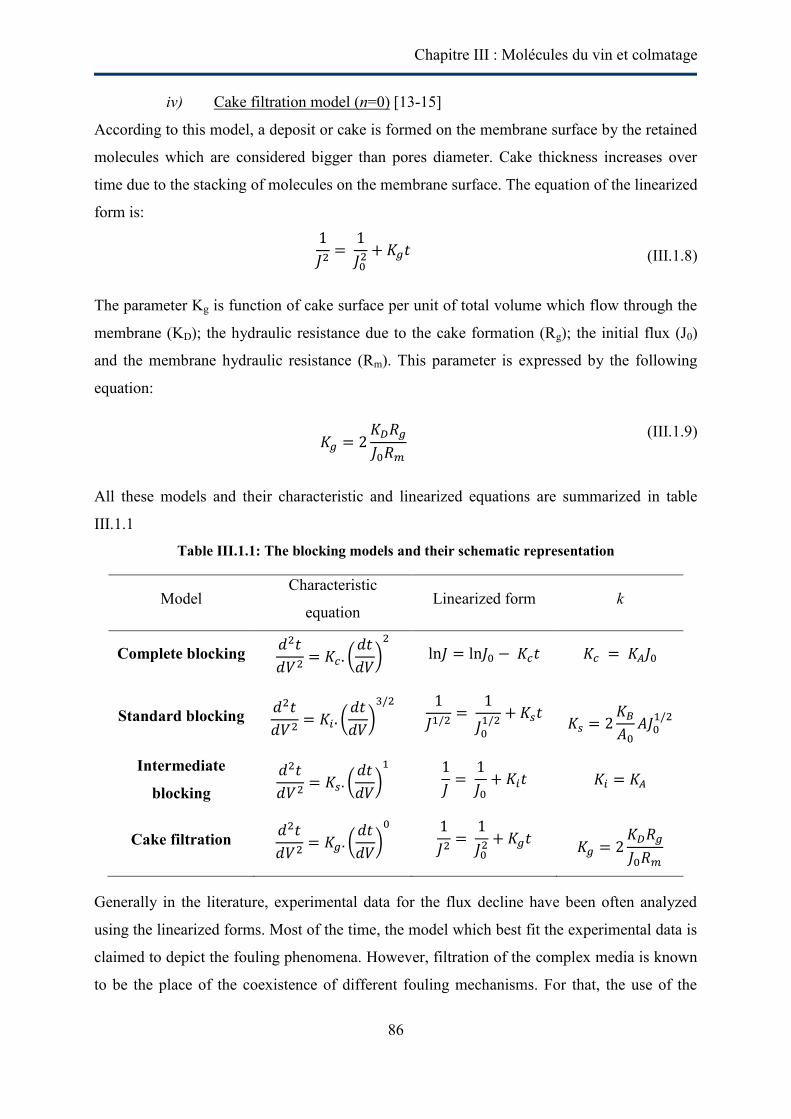
Chapitre III : Molécules du vin et colmatage
86
iv) Cake filtration model (n=0) [13-15]
According to this model, a deposit or cake is formed on the membrane surface by the retained
molecules which are considered bigger than pores diameter. Cake thickness increases over
time due to the stacking of molecules on the membrane surface. The equation of the linearized
form is:
(III.1.8)
The parameter Kg is function of cake surface per unit of total volume which flow through the
membrane (KD); the hydraulic resistance due to the cake formation (Rg); the initial flux (J0)
and the membrane hydraulic resistance (Rm). This parameter is expressed by the following
equation:
(III.1.9)
All these models and their characteristic and linearized equations are summarized in table
III.1.1
Table III.1.1: The blocking models and their schematic representation
Model Characteristic
equation Linearized form k
Complete blocking
(
)
Standard blocking
(
)
Intermediate
blocking
(
)
Cake filtration
(
)
Generally in the literature, experimental data for the flux decline have been often analyzed
using the linearized forms. Most of the time, the model which best fit the experimental data is
claimed to depict the fouling phenomena. However, filtration of the complex media is known
to be the place of the coexistence of different fouling mechanisms. For that, the use of the
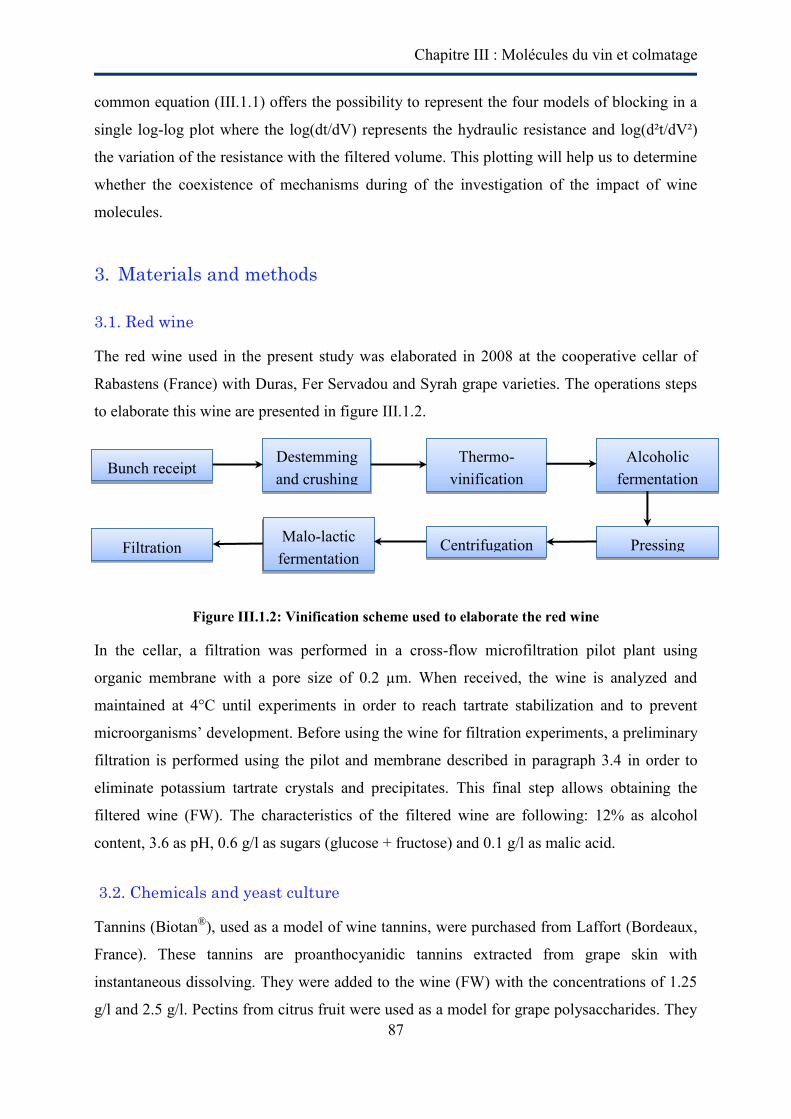
Chapitre III : Molécules du vin et colmatage
87
common equation (III.1.1) offers the possibility to represent the four models of blocking in a
single log-log plot where the log(dt/dV) represents the hydraulic resistance and log(d²t/dV²)
the variation of the resistance with the filtered volume. This plotting will help us to determine
whether the coexistence of mechanisms during of the investigation of the impact of wine
molecules.
3. Materials and methods
3.1. Red wine
The red wine used in the present study was elaborated in 2008 at the cooperative cellar of
Rabastens (France) with Duras, Fer Servadou and Syrah grape varieties. The operations steps
to elaborate this wine are presented in figure III.1.2.
Figure III.1.2: Vinification scheme used to elaborate the red wine
In the cellar, a filtration was performed in a cross-flow microfiltration pilot plant using
organic membrane with a pore size of 0.2 µm. When received, the wine is analyzed and
maintained at 4°C until experiments in order to reach tartrate stabilization and to prevent
microorganisms’ development. Before using the wine for filtration experiments, a preliminary
filtration is performed using the pilot and membrane described in paragraph 3.4 in order to
eliminate potassium tartrate crystals and precipitates. This final step allows obtaining the
filtered wine (FW). The characteristics of the filtered wine are following: 12% as alcohol
content, 3.6 as pH, 0.6 g/l as sugars (glucose + fructose) and 0.1 g/l as malic acid.
3.2. Chemicals and yeast culture
Tannins (Biotan®), used as a model of wine tannins, were purchased from Laffort (Bordeaux,
France). These tannins are proanthocyanidic tannins extracted from grape skin with
instantaneous dissolving. They were added to the wine (FW) with the concentrations of 1.25
g/l and 2.5 g/l. Pectins from citrus fruit were used as a model for grape polysaccharides. They
Bunch receipt Alcoholic
fermentation Destemming and crushing
Thermo-vinification
Centrifugation Filtration Malo-lactic fermentation
Pressing
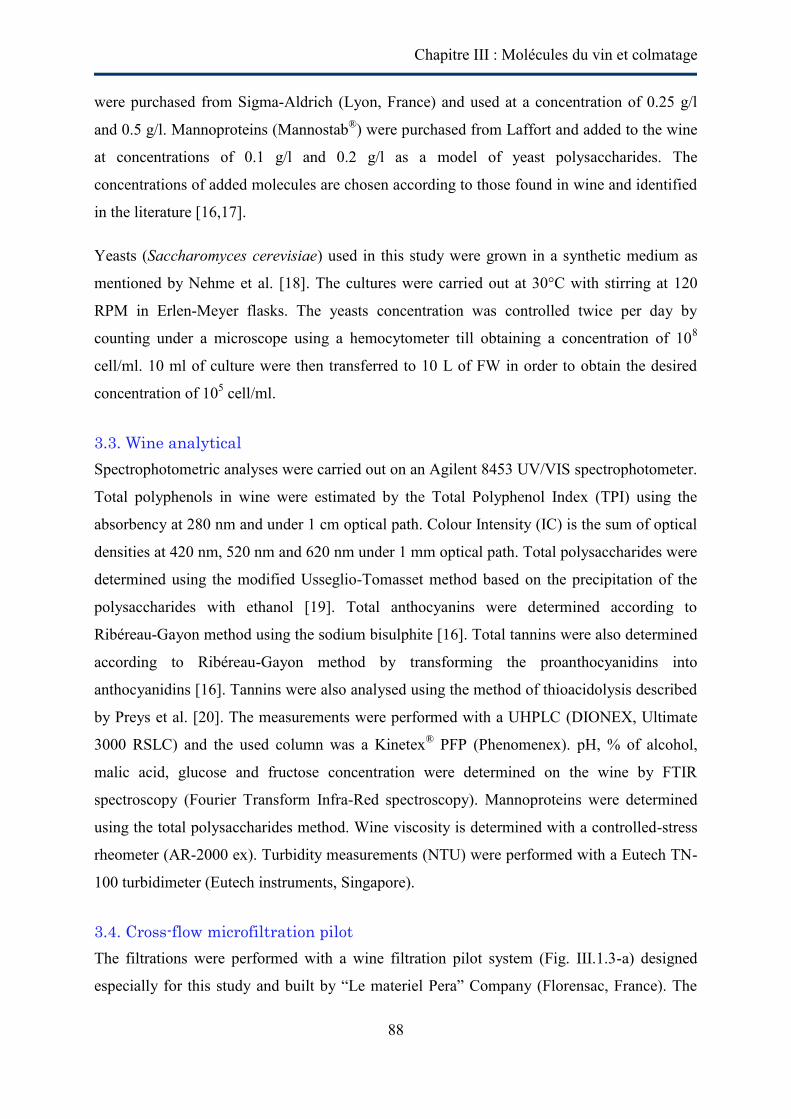
Chapitre III : Molécules du vin et colmatage
88
were purchased from Sigma-Aldrich (Lyon, France) and used at a concentration of 0.25 g/l
and 0.5 g/l. Mannoproteins (Mannostab®) were purchased from Laffort and added to the wine
at concentrations of 0.1 g/l and 0.2 g/l as a model of yeast polysaccharides. The
concentrations of added molecules are chosen according to those found in wine and identified
in the literature [16,17].
Yeasts (Saccharomyces cerevisiae) used in this study were grown in a synthetic medium as
mentioned by Nehme et al. [18]. The cultures were carried out at 30°C with stirring at 120
RPM in Erlen-Meyer flasks. The yeasts concentration was controlled twice per day by
counting under a microscope using a hemocytometer till obtaining a concentration of 108
cell/ml. 10 ml of culture were then transferred to 10 L of FW in order to obtain the desired
concentration of 105 cell/ml.
3.3. Wine analytical
Spectrophotometric analyses were carried out on an Agilent 8453 UV/VIS spectrophotometer.
Total polyphenols in wine were estimated by the Total Polyphenol Index (TPI) using the
absorbency at 280 nm and under 1 cm optical path. Colour Intensity (IC) is the sum of optical
densities at 420 nm, 520 nm and 620 nm under 1 mm optical path. Total polysaccharides were
determined using the modified Usseglio-Tomasset method based on the precipitation of the
polysaccharides with ethanol [19]. Total anthocyanins were determined according to
Ribéreau-Gayon method using the sodium bisulphite [16]. Total tannins were also determined
according to Ribéreau-Gayon method by transforming the proanthocyanidins into
anthocyanidins [16]. Tannins were also analysed using the method of thioacidolysis described
by Preys et al. [20]. The measurements were performed with a UHPLC (DIONEX, Ultimate
3000 RSLC) and the used column was a Kinetex® PFP (Phenomenex). pH, % of alcohol,
malic acid, glucose and fructose concentration were determined on the wine by FTIR
spectroscopy (Fourier Transform Infra-Red spectroscopy). Mannoproteins were determined
using the total polysaccharides method. Wine viscosity is determined with a controlled-stress
rheometer (AR-2000 ex). Turbidity measurements (NTU) were performed with a Eutech TN-
100 turbidimeter (Eutech instruments, Singapore).
3.4. Cross-flow microfiltration pilot
The filtrations were performed with a wine filtration pilot system (Fig. III.1.3-a) designed
especially for this study and built by “Le materiel Pera” Company (Florensac, France). The
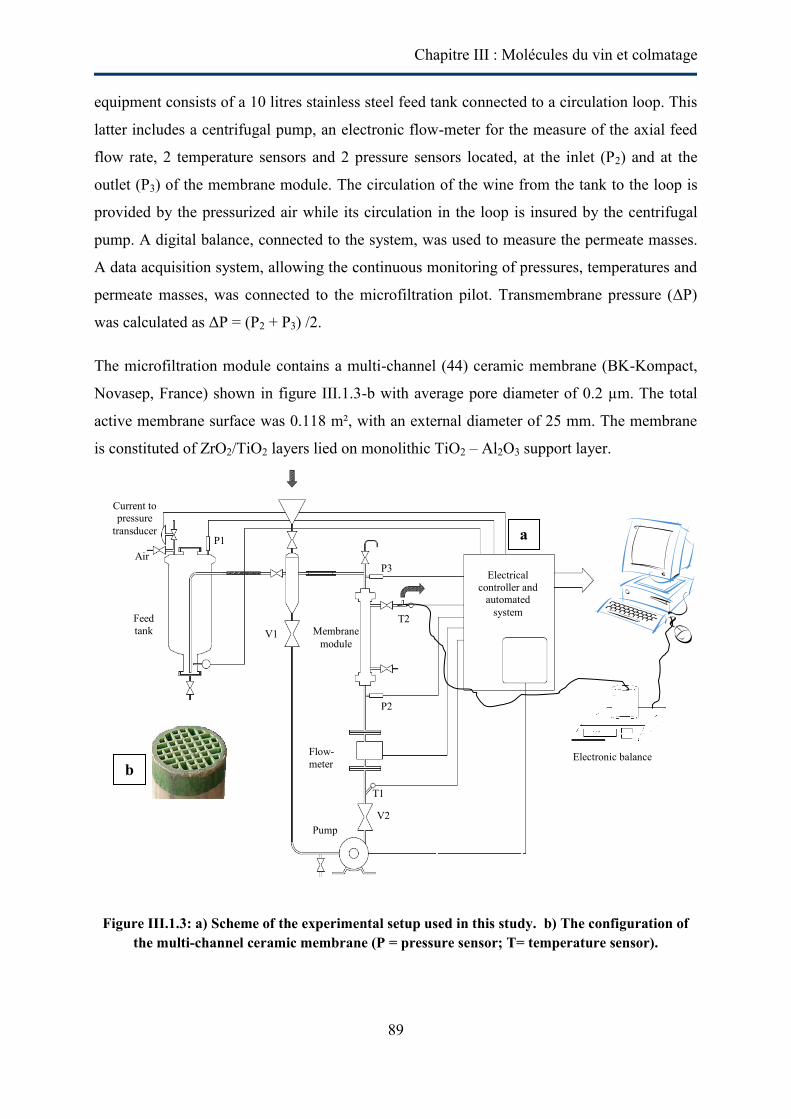
Chapitre III : Molécules du vin et colmatage
89
equipment consists of a 10 litres stainless steel feed tank connected to a circulation loop. This
latter includes a centrifugal pump, an electronic flow-meter for the measure of the axial feed
flow rate, 2 temperature sensors and 2 pressure sensors located, at the inlet (P2) and at the
outlet (P3) of the membrane module. The circulation of the wine from the tank to the loop is
provided by the pressurized air while its circulation in the loop is insured by the centrifugal
pump. A digital balance, connected to the system, was used to measure the permeate masses.
A data acquisition system, allowing the continuous monitoring of pressures, temperatures and
permeate masses, was connected to the microfiltration pilot. Transmembrane pressure (ΔP)
was calculated as ΔP = (P2 + P3) /2.
The microfiltration module contains a multi-channel (44) ceramic membrane (BK-Kompact,
Novasep, France) shown in figure III.1.3-b with average pore diameter of 0.2 µm. The total
active membrane surface was 0.118 m², with an external diameter of 25 mm. The membrane
is constituted of ZrO2/TiO2 layers lied on monolithic TiO2 – Al2O3 support layer.
Figure III.1.3: a) Scheme of the experimental setup used in this study. b) The configuration of the multi-channel ceramic membrane (P = pressure sensor; T= temperature sensor).
Current to pressure
transducer
Feed tank
Pump
Flow- meter
T1
T2
P1
P2
P3 Electrical controller and
automated system
Electronic balance
Membrane module
Air
a
b
V1
V2
Chapitre III : Molécules du vin et colmatage
90
3.5. Microfiltration experiments procedure
3.5.1. Cross-flow filtrations
Cross-flow microfiltration experiments were realized in order to investigate the respective
impact of tannins, mannoproteins, pectins and yeasts on membrane fouling. Figure III.1.4
summarize all conducted experiments and the imposed conditions. The experiments consisted
in constant TMP microfiltration runs. Each solution is filtered at two different pressures: 0.5
and 1 bars. The impact of the different added molecules was studied for two different
concentrations.
All experiments were carried out with 10 L of the interest suspension. This volume was
chosen in order to keep the volumetric reduction ratio (VRR) lower than 1.6. The solution to
be filtered is placed in the feed tank and the circulation loop in order to expel the air inside the
loop. The flow velocity is fixed at 2 m/s that is conventionally used in wine filtration (without
damaging wine), corresponding to Reynolds number equal to 2306 and 12.1 Pa as wall shear
stress. According to Renée and Lalande [21], the value of Reynolds number corresponds to
laminar flow regime.
Figure III.1.4: A summary of cross-flow microfiltration experiments.
3.5.2. Dead-end filtrations
In order to identify the fouling mechanisms, dead-end filtrations were carried out on the same
membrane and in the same pilot depicted in figure III.1.3. To run in dead-end mode with this
pilot, the pump was stopped and the valves V1 and V2 were closed. The circulation of the
wine in the pilot is only provided by the pressurized air. Experiments were performed with 10
Cross-flow microfiltration
Tanins
1.25 g/l
2.5 g/l
Pectins
0.25 g/l
0.5 g/l
Mannoproteins
0.1 g/l
0.2 g/l
Yeasts
105 cell/ml
0.5 bar 1 bar
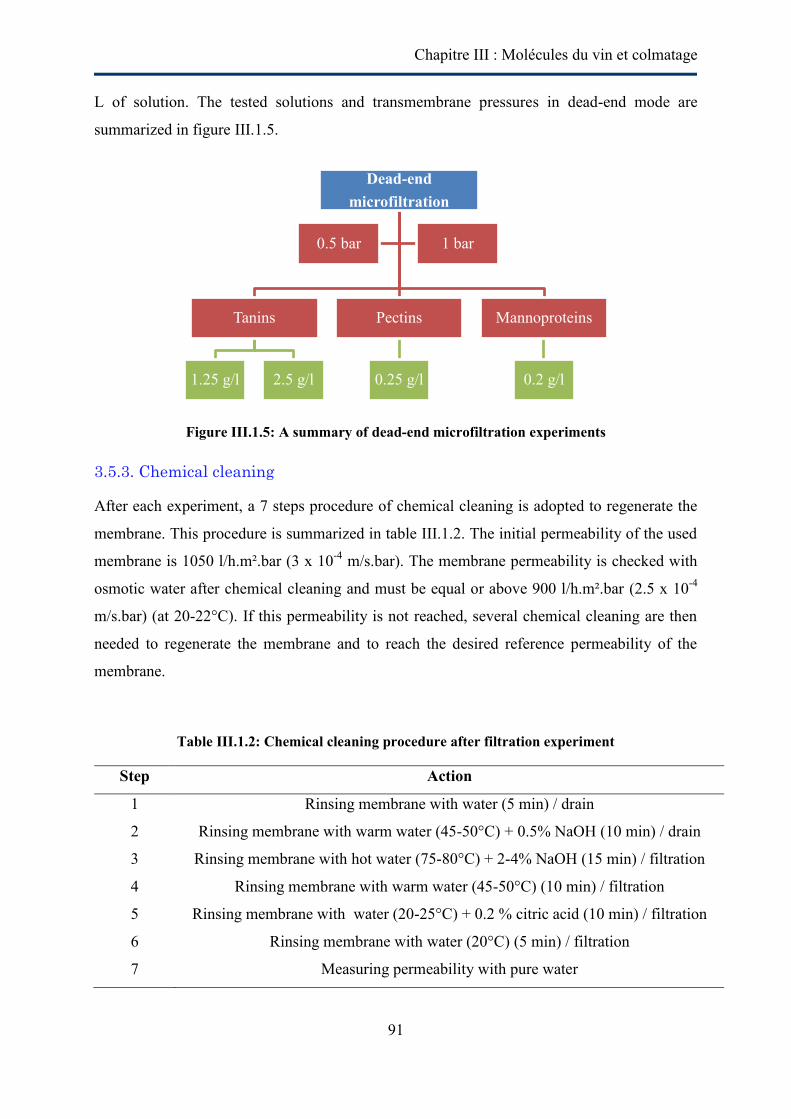
Chapitre III : Molécules du vin et colmatage
91
L of solution. The tested solutions and transmembrane pressures in dead-end mode are
summarized in figure III.1.5.
Figure III.1.5: A summary of dead-end microfiltration experiments
3.5.3. Chemical cleaning
After each experiment, a 7 steps procedure of chemical cleaning is adopted to regenerate the
membrane. This procedure is summarized in table III.1.2. The initial permeability of the used
membrane is 1050 l/h.m².bar (3 x 10⁻⁴ m/s.bar). The membrane permeability is checked with
osmotic water after chemical cleaning and must be equal or above 900 l/h.m².bar (2.5 x 10⁻⁴
m/s.bar) (at 20-22°C). If this permeability is not reached, several chemical cleaning are then
needed to regenerate the membrane and to reach the desired reference permeability of the
membrane.
Table III.1.2: Chemical cleaning procedure after filtration experiment
Step Action
1 Rinsing membrane with water (5 min) / drain
2 Rinsing membrane with warm water (45-50°C) + 0.5% NaOH (10 min) / drain
3 Rinsing membrane with hot water (75-80°C) + 2-4% NaOH (15 min) / filtration
4 Rinsing membrane with warm water (45-50°C) (10 min) / filtration
5 Rinsing membrane with water (20-25°C) + 0.2 % citric acid (10 min) / filtration
6 Rinsing membrane with water (20°C) (5 min) / filtration
7 Measuring permeability with pure water
Dead-end microfiltration
Tanins
1.25 g/l 2.5 g/l
Pectins
0.25 g/l
Mannoproteins
0.2 g/l
0.5 bar 1 bar
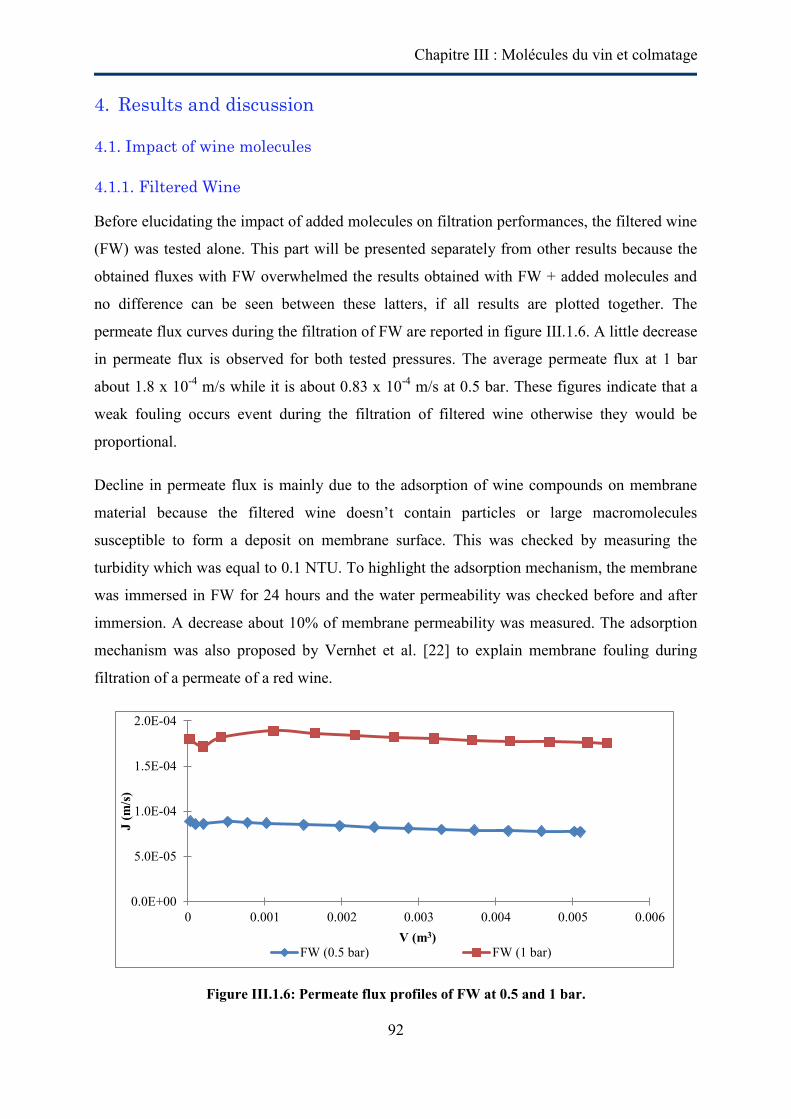
Chapitre III : Molécules du vin et colmatage
92
4. Results and discussion
4.1. Impact of wine molecules
4.1.1. Filtered Wine
Before elucidating the impact of added molecules on filtration performances, the filtered wine
(FW) was tested alone. This part will be presented separately from other results because the
obtained fluxes with FW overwhelmed the results obtained with FW + added molecules and
no difference can be seen between these latters, if all results are plotted together. The
permeate flux curves during the filtration of FW are reported in figure III.1.6. A little decrease
in permeate flux is observed for both tested pressures. The average permeate flux at 1 bar
about 1.8 x 10⁻⁴ m/s while it is about 0.83 x 10⁻⁴ m/s at 0.5 bar. These figures indicate that a
weak fouling occurs event during the filtration of filtered wine otherwise they would be
proportional.
Decline in permeate flux is mainly due to the adsorption of wine compounds on membrane
material because the filtered wine doesn’t contain particles or large macromolecules
susceptible to form a deposit on membrane surface. This was checked by measuring the
turbidity which was equal to 0.1 NTU. To highlight the adsorption mechanism, the membrane
was immersed in FW for 24 hours and the water permeability was checked before and after
immersion. A decrease about 10% of membrane permeability was measured. The adsorption
mechanism was also proposed by Vernhet et al. [22] to explain membrane fouling during
filtration of a permeate of a red wine.
Figure III.1.6: Permeate flux profiles of FW at 0.5 and 1 bar.
0.0E+00
5.0E-05
1.0E-04
1.5E-04
2.0E-04
0 0.001 0.002 0.003 0.004 0.005 0.006
J (m
/s)
V (m3) FW (0.5 bar) FW (1 bar)
Chapitre III : Molécules du vin et colmatage
93
For the following results analysis, this 10% variation due to adsorption will be considered in
the error range of the flux measurements. Moreover this value has been obtained after 24
hours of wine membrane contact while all the following experiments won’t last more than 80
minutes.
After the four next paragraphs devoted to the filtration versus filtered volume of several wine
solutions, a last fifthparagraph will focus on the initial flux values for all theses solutions.
4.1.2. Impact of added tannins
The impact of wine tannins was studied at 2 concentrations: 1.25 g/l and 2.5 g/l. Each solution
was filtered at 2 different transmembrane pressures (ΔP): 0.5 and 1 bar. Figure III.1.7 shows
experimental data for the permeate flux as a function of filtered volume for wines added with
different concentrations of tannins. It can be seen that the lower permeate flux (1.9 x 10⁻⁵ m/s)
was obtained with wines containing 2.5 g/l tannins. The impact of tannin concentration is
noticeable while observing flux decreases. Wines containing 1.25 g/l tannins present higher
fluxes than those containing 2.5 g/l tannins. Czekaj et al. [8] showed while filtering two white
wines having the same initial turbidity, the different polyphenol concentrations of the 2 wines
may explain the different performances observed during filtration.
It may also be observed that the permeate flux almost at the beginning of the filtrations,
increased with an increase in ΔP. This result can be expected because a higher filtration
driving force is caused by increasing the ΔP. The initial permeate flux increased from 8 x 10⁻⁵
m/s at 0.5 bar to 1.8 x 10⁻⁴ m/s at 1 bar for wines containing 1.25 g/l tannins and from 3.2 x
10-5 m/s (0.5 bar) to 6.6 x 10⁻⁵ m/s (1 bar) for solutions containing 2.5 g/l tannins. In other
hand, the permeate fluxes seem to stabilize at 2 x 10⁻⁵ m/s whatever the filtration conditions.
This fact could be explained by the stabilization of the permeate flux by the cross-flow
velocity independently of the transmembrane pressure.
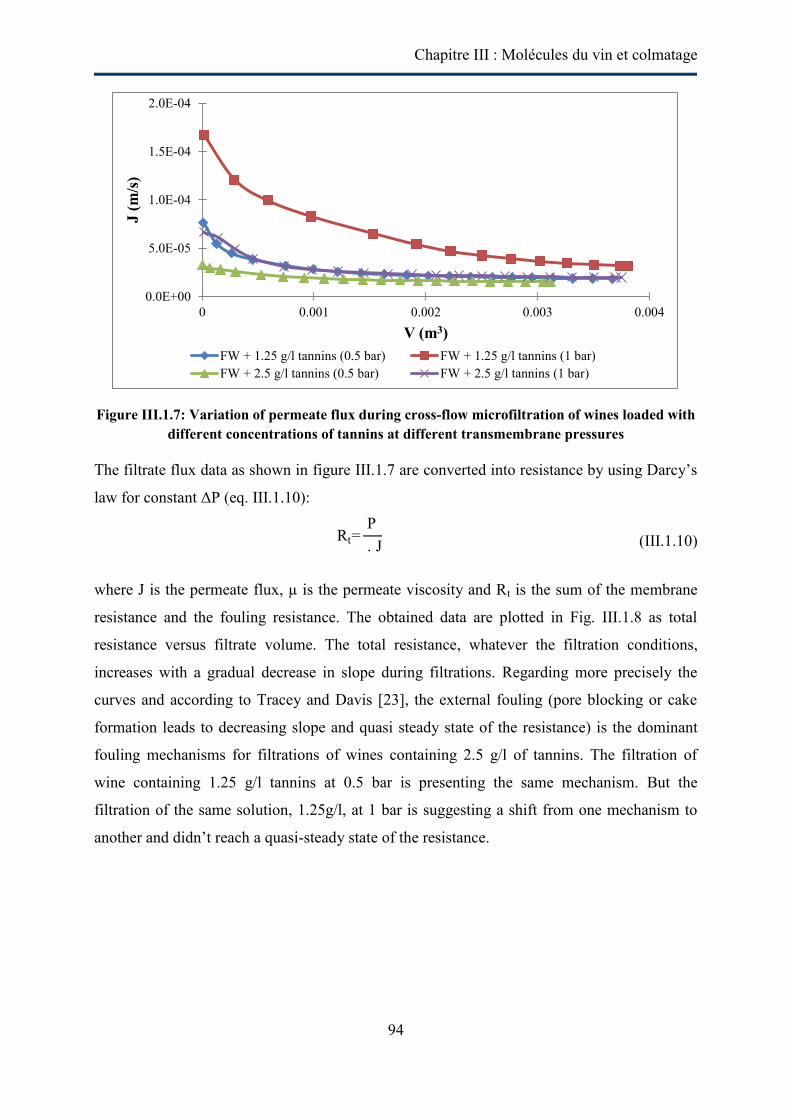
Chapitre III : Molécules du vin et colmatage
94
Figure III.1.7: Variation of permeate flux during cross-flow microfiltration of wines loaded with different concentrations of tannins at different transmembrane pressures
The filtrate flux data as shown in figure III.1.7 are converted into resistance by using Darcy’s
law for constant ΔP (eq. III.1.10):
Rt= P . J
(III.1.10)
where J is the permeate flux, µ is the permeate viscosity and Rt is the sum of the membrane
resistance and the fouling resistance. The obtained data are plotted in Fig. III.1.8 as total
resistance versus filtrate volume. The total resistance, whatever the filtration conditions,
increases with a gradual decrease in slope during filtrations. Regarding more precisely the
curves and according to Tracey and Davis [23], the external fouling (pore blocking or cake
formation leads to decreasing slope and quasi steady state of the resistance) is the dominant
fouling mechanisms for filtrations of wines containing 2.5 g/l of tannins. The filtration of
wine containing 1.25 g/l tannins at 0.5 bar is presenting the same mechanism. But the
filtration of the same solution, 1.25g/l, at 1 bar is suggesting a shift from one mechanism to
another and didn’t reach a quasi-steady state of the resistance.
0.0E+00
5.0E-05
1.0E-04
1.5E-04
2.0E-04
0 0.001 0.002 0.003 0.004
J (m
/s)
V (m3) FW + 1.25 g/l tannins (0.5 bar) FW + 1.25 g/l tannins (1 bar)FW + 2.5 g/l tannins (0.5 bar) FW + 2.5 g/l tannins (1 bar)
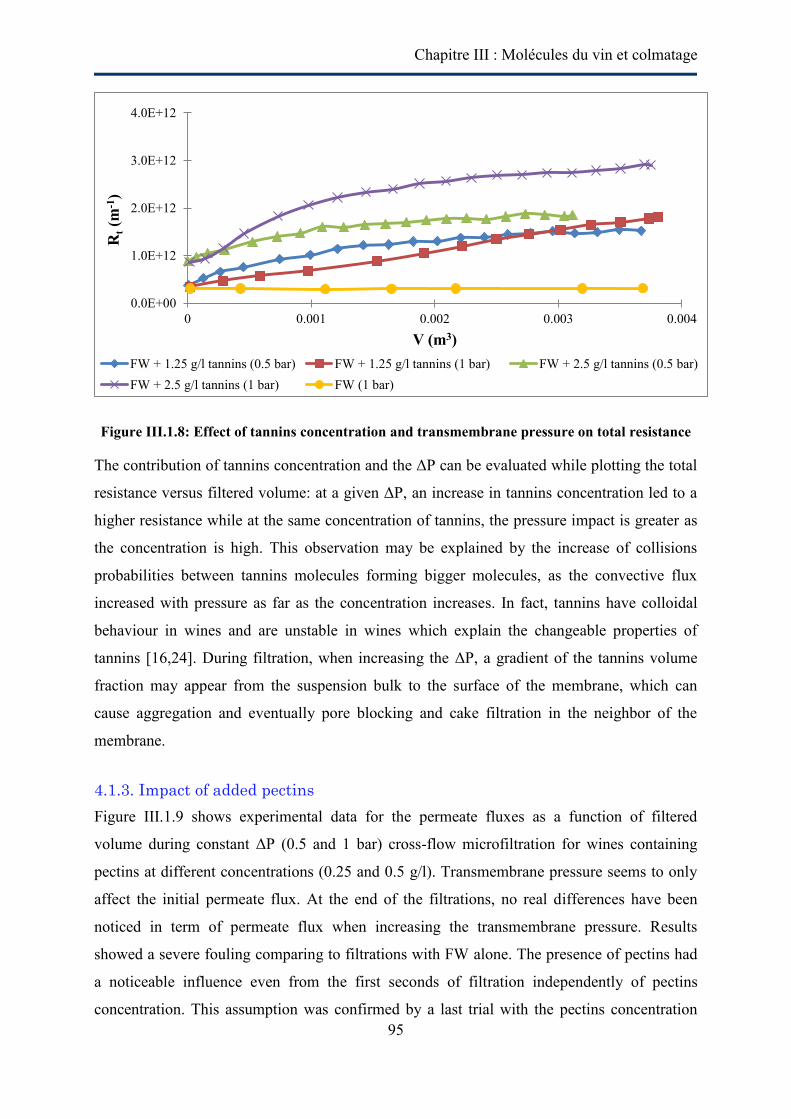
Chapitre III : Molécules du vin et colmatage
95
Figure III.1.8: Effect of tannins concentration and transmembrane pressure on total resistance
The contribution of tannins concentration and the ΔP can be evaluated while plotting the total
resistance versus filtered volume: at a given ΔP, an increase in tannins concentration led to a
higher resistance while at the same concentration of tannins, the pressure impact is greater as
the concentration is high. This observation may be explained by the increase of collisions
probabilities between tannins molecules forming bigger molecules, as the convective flux
increased with pressure as far as the concentration increases. In fact, tannins have colloidal
behaviour in wines and are unstable in wines which explain the changeable properties of
tannins [16,24]. During filtration, when increasing the ΔP, a gradient of the tannins volume
fraction may appear from the suspension bulk to the surface of the membrane, which can
cause aggregation and eventually pore blocking and cake filtration in the neighbor of the
membrane.
4.1.3. Impact of added pectins
Figure III.1.9 shows experimental data for the permeate fluxes as a function of filtered
volume during constant ΔP (0.5 and 1 bar) cross-flow microfiltration for wines containing
pectins at different concentrations (0.25 and 0.5 g/l). Transmembrane pressure seems to only
affect the initial permeate flux. At the end of the filtrations, no real differences have been
noticed in term of permeate flux when increasing the transmembrane pressure. Results
showed a severe fouling comparing to filtrations with FW alone. The presence of pectins had
a noticeable influence even from the first seconds of filtration independently of pectins
concentration. This assumption was confirmed by a last trial with the pectins concentration
0.0E+00
1.0E+12
2.0E+12
3.0E+12
4.0E+12
0 0.001 0.002 0.003 0.004
Rt (
m-1
)
V (m3) FW + 1.25 g/l tannins (0.5 bar) FW + 1.25 g/l tannins (1 bar) FW + 2.5 g/l tannins (0.5 bar)FW + 2.5 g/l tannins (1 bar) FW (1 bar)
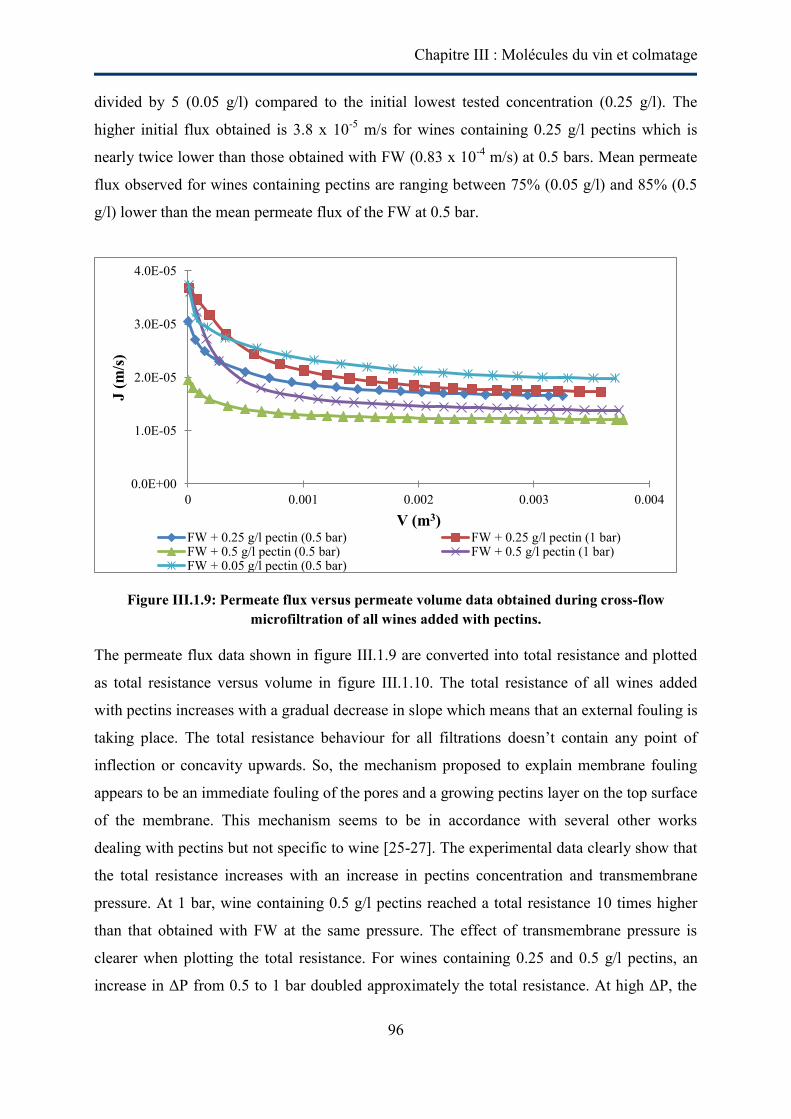
Chapitre III : Molécules du vin et colmatage
96
divided by 5 (0.05 g/l) compared to the initial lowest tested concentration (0.25 g/l). The
higher initial flux obtained is 3.8 x 10⁻⁵ m/s for wines containing 0.25 g/l pectins which is
nearly twice lower than those obtained with FW (0.83 x 10⁻⁴ m/s) at 0.5 bars. Mean permeate
flux observed for wines containing pectins are ranging between 75% (0.05 g/l) and 85% (0.5
g/l) lower than the mean permeate flux of the FW at 0.5 bar.
Figure III.1.9: Permeate flux versus permeate volume data obtained during cross-flow microfiltration of all wines added with pectins.
The permeate flux data shown in figure III.1.9 are converted into total resistance and plotted
as total resistance versus volume in figure III.1.10. The total resistance of all wines added
with pectins increases with a gradual decrease in slope which means that an external fouling is
taking place. The total resistance behaviour for all filtrations doesn’t contain any point of
inflection or concavity upwards. So, the mechanism proposed to explain membrane fouling
appears to be an immediate fouling of the pores and a growing pectins layer on the top surface
of the membrane. This mechanism seems to be in accordance with several other works
dealing with pectins but not specific to wine [25-27]. The experimental data clearly show that
the total resistance increases with an increase in pectins concentration and transmembrane
pressure. At 1 bar, wine containing 0.5 g/l pectins reached a total resistance 10 times higher
than that obtained with FW at the same pressure. The effect of transmembrane pressure is
clearer when plotting the total resistance. For wines containing 0.25 and 0.5 g/l pectins, an
increase in ΔP from 0.5 to 1 bar doubled approximately the total resistance. At high ΔP, the
0.0E+00
1.0E-05
2.0E-05
3.0E-05
4.0E-05
0 0.001 0.002 0.003 0.004
J (m
/s)
V (m3) FW + 0.25 g/l pectin (0.5 bar) FW + 0.25 g/l pectin (1 bar)FW + 0.5 g/l pectin (0.5 bar) FW + 0.5 g/l pectin (1 bar)FW + 0.05 g/l pectin (0.5 bar)
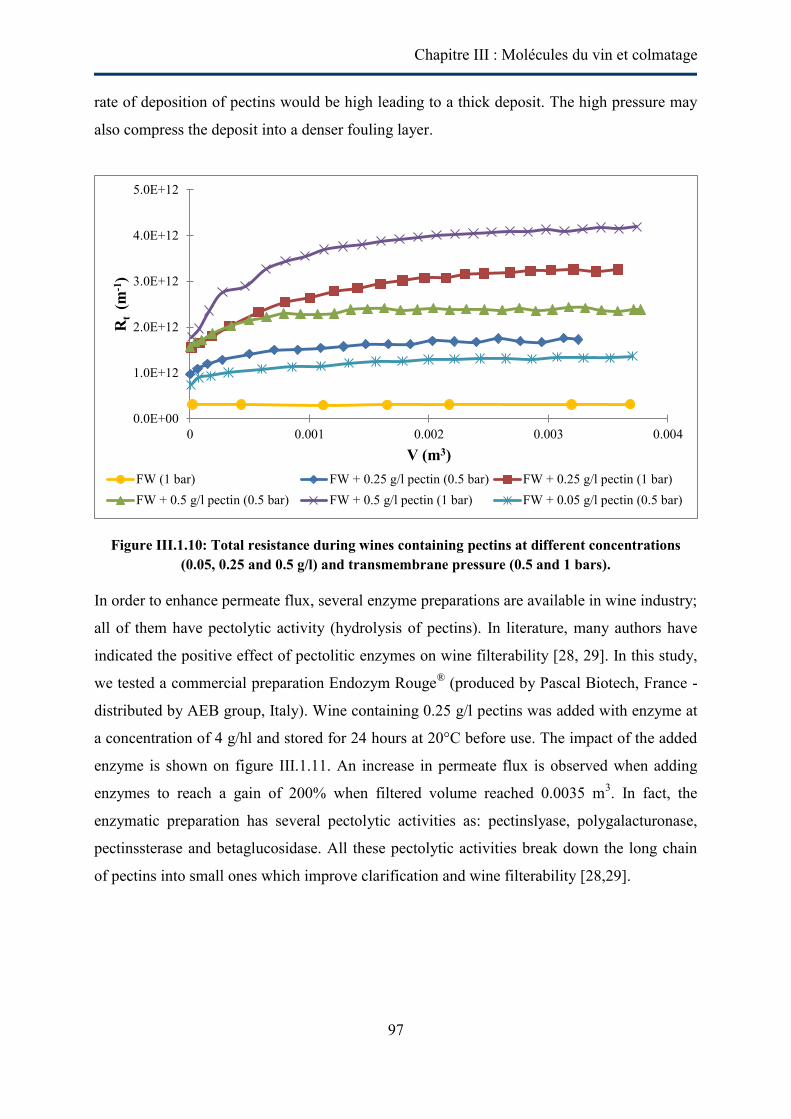
Chapitre III : Molécules du vin et colmatage
97
rate of deposition of pectins would be high leading to a thick deposit. The high pressure may
also compress the deposit into a denser fouling layer.
Figure III.1.10: Total resistance during wines containing pectins at different concentrations (0.05, 0.25 and 0.5 g/l) and transmembrane pressure (0.5 and 1 bars).
In order to enhance permeate flux, several enzyme preparations are available in wine industry;
all of them have pectolytic activity (hydrolysis of pectins). In literature, many authors have
indicated the positive effect of pectolitic enzymes on wine filterability [28, 29]. In this study,
we tested a commercial preparation Endozym Rouge® (produced by Pascal Biotech, France -
distributed by AEB group, Italy). Wine containing 0.25 g/l pectins was added with enzyme at
a concentration of 4 g/hl and stored for 24 hours at 20°C before use. The impact of the added
enzyme is shown on figure III.1.11. An increase in permeate flux is observed when adding
enzymes to reach a gain of 200% when filtered volume reached 0.0035 m3. In fact, the
enzymatic preparation has several pectolytic activities as: pectinslyase, polygalacturonase,
pectinssterase and betaglucosidase. All these pectolytic activities break down the long chain
of pectins into small ones which improve clarification and wine filterability [28,29].
0.0E+00
1.0E+12
2.0E+12
3.0E+12
4.0E+12
5.0E+12
0 0.001 0.002 0.003 0.004
Rt (
m-1
)
V (m3) FW (1 bar) FW + 0.25 g/l pectin (0.5 bar) FW + 0.25 g/l pectin (1 bar)FW + 0.5 g/l pectin (0.5 bar) FW + 0.5 g/l pectin (1 bar) FW + 0.05 g/l pectin (0.5 bar)
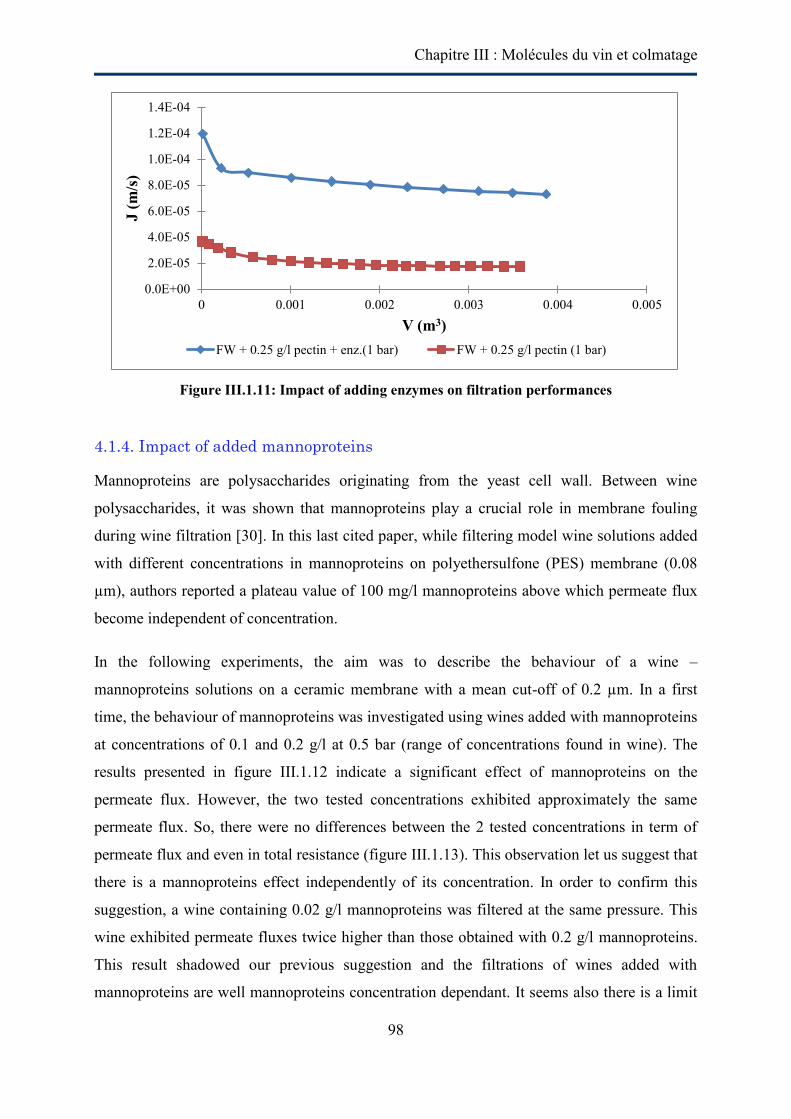
Chapitre III : Molécules du vin et colmatage
98
Figure III.1.11: Impact of adding enzymes on filtration performances
4.1.4. Impact of added mannoproteins
Mannoproteins are polysaccharides originating from the yeast cell wall. Between wine
polysaccharides, it was shown that mannoproteins play a crucial role in membrane fouling
during wine filtration [30]. In this last cited paper, while filtering model wine solutions added
with different concentrations in mannoproteins on polyethersulfone (PES) membrane (0.08
µm), authors reported a plateau value of 100 mg/l mannoproteins above which permeate flux
become independent of concentration.
In the following experiments, the aim was to describe the behaviour of a wine –
mannoproteins solutions on a ceramic membrane with a mean cut-off of 0.2 µm. In a first
time, the behaviour of mannoproteins was investigated using wines added with mannoproteins
at concentrations of 0.1 and 0.2 g/l at 0.5 bar (range of concentrations found in wine). The
results presented in figure III.1.12 indicate a significant effect of mannoproteins on the
permeate flux. However, the two tested concentrations exhibited approximately the same
permeate flux. So, there were no differences between the 2 tested concentrations in term of
permeate flux and even in total resistance (figure III.1.13). This observation let us suggest that
there is a mannoproteins effect independently of its concentration. In order to confirm this
suggestion, a wine containing 0.02 g/l mannoproteins was filtered at the same pressure. This
wine exhibited permeate fluxes twice higher than those obtained with 0.2 g/l mannoproteins.
This result shadowed our previous suggestion and the filtrations of wines added with
mannoproteins are well mannoproteins concentration dependant. It seems also there is a limit
0.0E+00
2.0E-05
4.0E-05
6.0E-05
8.0E-05
1.0E-04
1.2E-04
1.4E-04
0 0.001 0.002 0.003 0.004 0.005
J (m
/s)
V (m3) FW + 0.25 g/l pectin + enz.(1 bar) FW + 0.25 g/l pectin (1 bar)
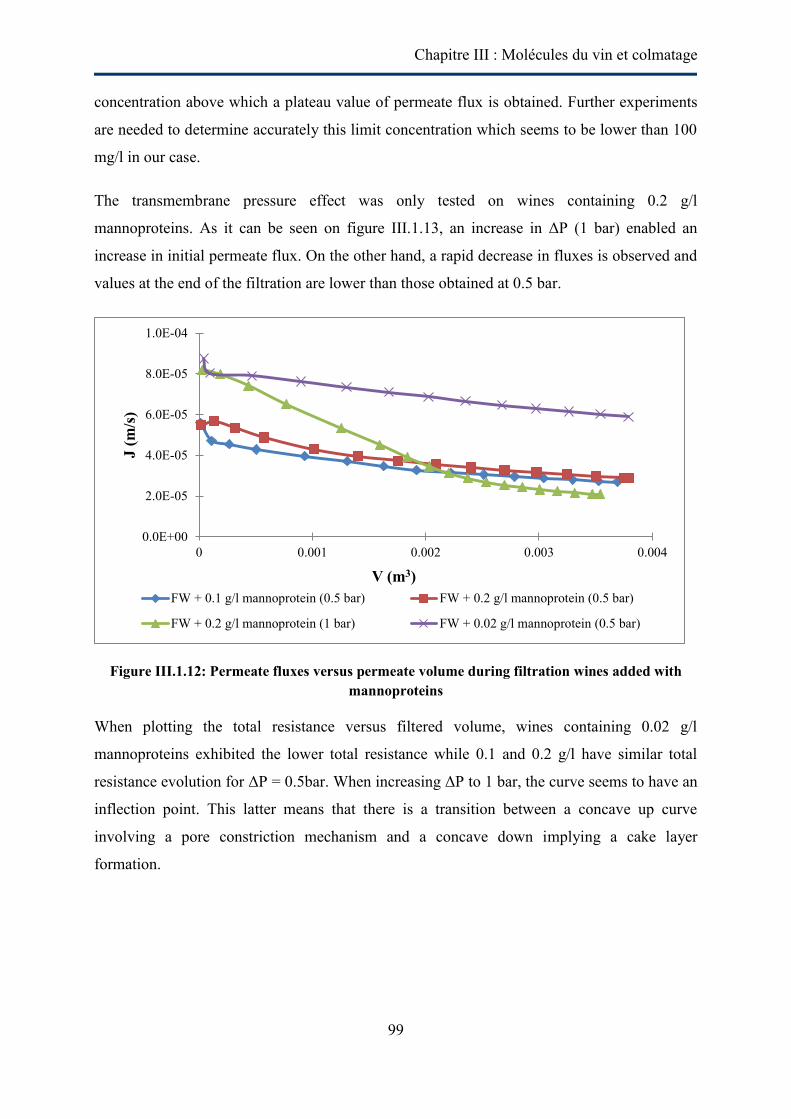
Chapitre III : Molécules du vin et colmatage
99
concentration above which a plateau value of permeate flux is obtained. Further experiments
are needed to determine accurately this limit concentration which seems to be lower than 100
mg/l in our case.
The transmembrane pressure effect was only tested on wines containing 0.2 g/l
mannoproteins. As it can be seen on figure III.1.13, an increase in ΔP (1 bar) enabled an
increase in initial permeate flux. On the other hand, a rapid decrease in fluxes is observed and
values at the end of the filtration are lower than those obtained at 0.5 bar.
Figure III.1.12: Permeate fluxes versus permeate volume during filtration wines added with mannoproteins
When plotting the total resistance versus filtered volume, wines containing 0.02 g/l
mannoproteins exhibited the lower total resistance while 0.1 and 0.2 g/l have similar total
resistance evolution for ΔP = 0.5bar. When increasing ΔP to 1 bar, the curve seems to have an
inflection point. This latter means that there is a transition between a concave up curve
involving a pore constriction mechanism and a concave down implying a cake layer
formation.
0.0E+00
2.0E-05
4.0E-05
6.0E-05
8.0E-05
1.0E-04
0 0.001 0.002 0.003 0.004
J (m
/s)
V (m3) FW + 0.1 g/l mannoprotein (0.5 bar) FW + 0.2 g/l mannoprotein (0.5 bar)
FW + 0.2 g/l mannoprotein (1 bar) FW + 0.02 g/l mannoprotein (0.5 bar)
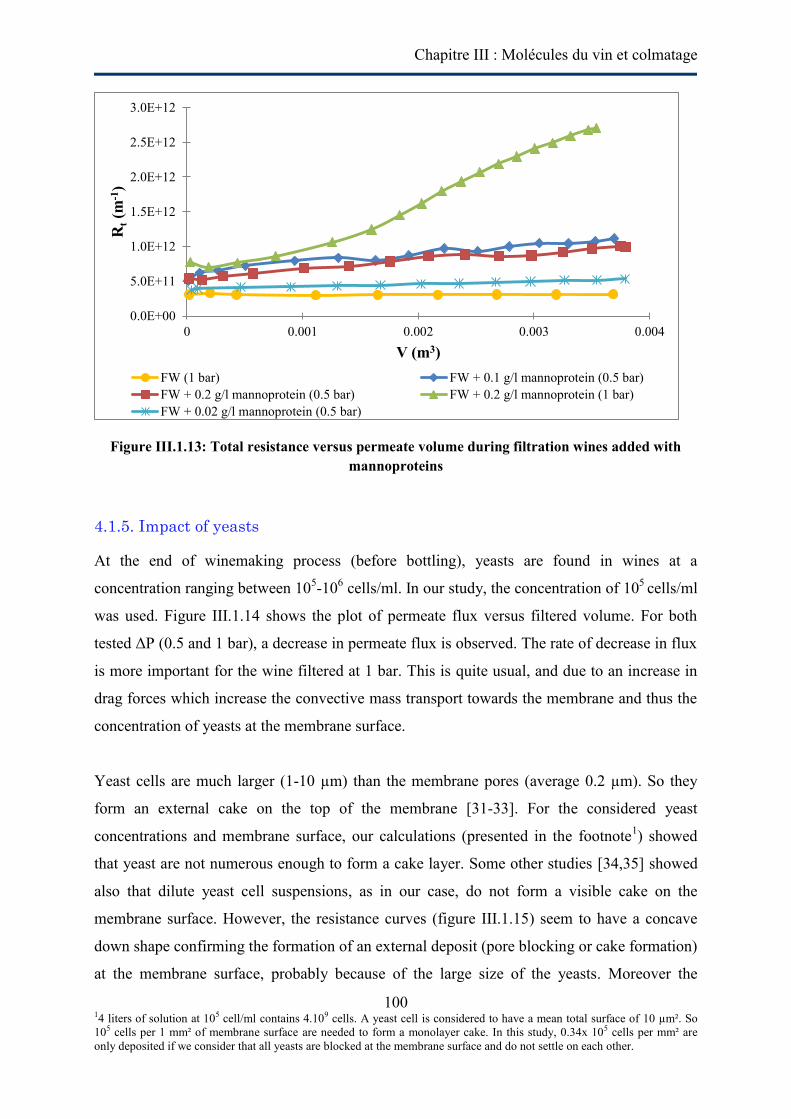
Chapitre III : Molécules du vin et colmatage
100 14 liters of solution at 105 cell/ml contains 4.109 cells. A yeast cell is considered to have a mean total surface of 10 µm². So 105 cells per 1 mm² of membrane surface are needed to form a monolayer cake. In this study, 0.34x 10⁵ cells per mm² are only deposited if we consider that all yeasts are blocked at the membrane surface and do not settle on each other.
Figure III.1.13: Total resistance versus permeate volume during filtration wines added with mannoproteins
4.1.5. Impact of yeasts
At the end of winemaking process (before bottling), yeasts are found in wines at a
concentration ranging between 105-106 cells/ml. In our study, the concentration of 105 cells/ml
was used. Figure III.1.14 shows the plot of permeate flux versus filtered volume. For both
tested ΔP (0.5 and 1 bar), a decrease in permeate flux is observed. The rate of decrease in flux
is more important for the wine filtered at 1 bar. This is quite usual, and due to an increase in
drag forces which increase the convective mass transport towards the membrane and thus the
concentration of yeasts at the membrane surface.
Yeast cells are much larger (1-10 µm) than the membrane pores (average 0.2 µm). So they
form an external cake on the top of the membrane [31-33]. For the considered yeast
concentrations and membrane surface, our calculations (presented in the footnote1) showed
that yeast are not numerous enough to form a cake layer. Some other studies [34,35] showed
also that dilute yeast cell suspensions, as in our case, do not form a visible cake on the
membrane surface. However, the resistance curves (figure III.1.15) seem to have a concave
down shape confirming the formation of an external deposit (pore blocking or cake formation)
at the membrane surface, probably because of the large size of the yeasts. Moreover the
0.0E+00
5.0E+11
1.0E+12
1.5E+12
2.0E+12
2.5E+12
3.0E+12
0 0.001 0.002 0.003 0.004
Rt (
m-1
)
V (m3) FW (1 bar) FW + 0.1 g/l mannoprotein (0.5 bar)FW + 0.2 g/l mannoprotein (0.5 bar) FW + 0.2 g/l mannoprotein (1 bar)FW + 0.02 g/l mannoprotein (0.5 bar)
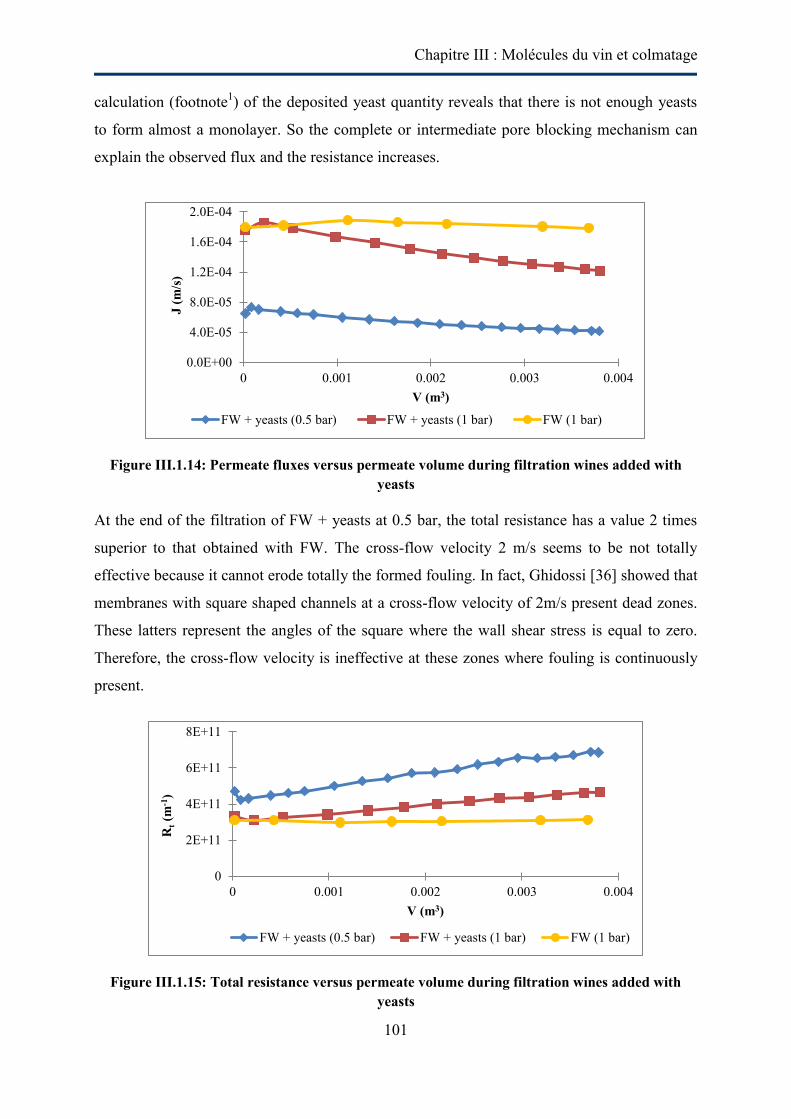
Chapitre III : Molécules du vin et colmatage
101
calculation (footnote1) of the deposited yeast quantity reveals that there is not enough yeasts
to form almost a monolayer. So the complete or intermediate pore blocking mechanism can
explain the observed flux and the resistance increases.
Figure III.1.14: Permeate fluxes versus permeate volume during filtration wines added with yeasts
At the end of the filtration of FW + yeasts at 0.5 bar, the total resistance has a value 2 times
superior to that obtained with FW. The cross-flow velocity 2 m/s seems to be not totally
effective because it cannot erode totally the formed fouling. In fact, Ghidossi [36] showed that
membranes with square shaped channels at a cross-flow velocity of 2m/s present dead zones.
These latters represent the angles of the square where the wall shear stress is equal to zero.
Therefore, the cross-flow velocity is ineffective at these zones where fouling is continuously
present.
Figure III.1.15: Total resistance versus permeate volume during filtration wines added with yeasts
0.0E+00
4.0E-05
8.0E-05
1.2E-04
1.6E-04
2.0E-04
0 0.001 0.002 0.003 0.004
J (m
/s)
V (m3)
FW + yeasts (0.5 bar) FW + yeasts (1 bar) FW (1 bar)
0
2E+11
4E+11
6E+11
8E+11
0 0.001 0.002 0.003 0.004
Rt (
m-1
)
V (m3)
FW + yeasts (0.5 bar) FW + yeasts (1 bar) FW (1 bar)
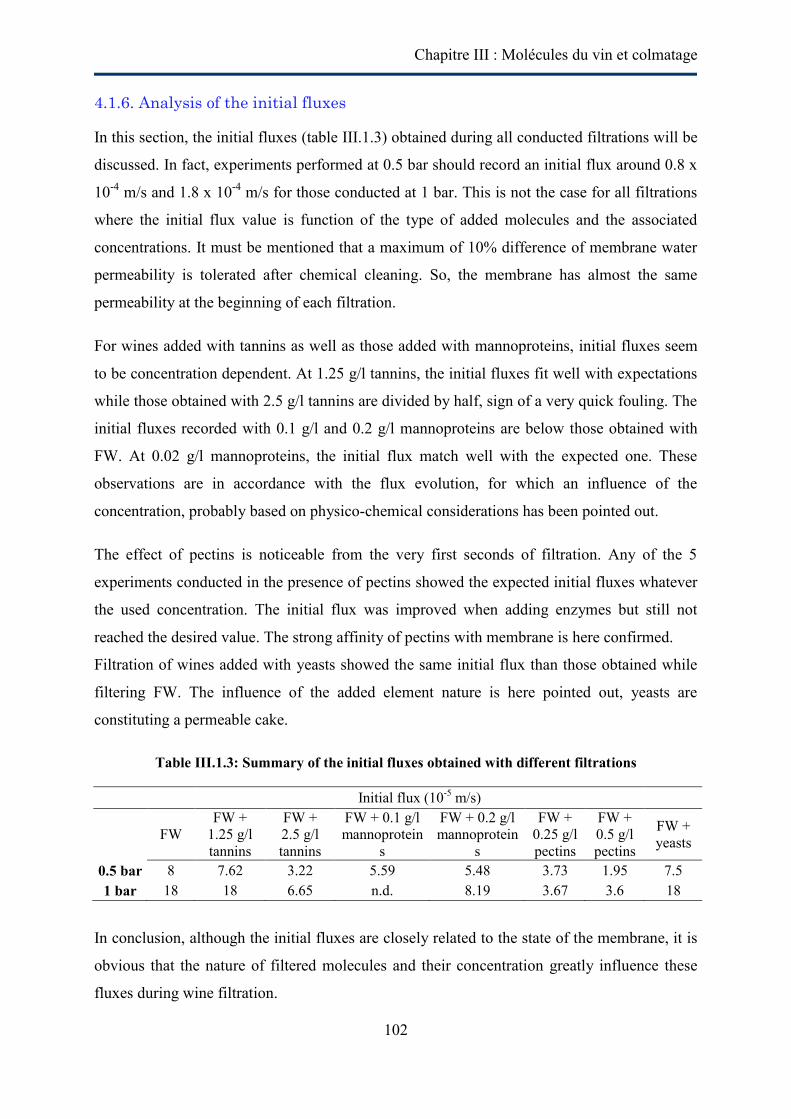
Chapitre III : Molécules du vin et colmatage
102
4.1.6. Analysis of the initial fluxes
In this section, the initial fluxes (table III.1.3) obtained during all conducted filtrations will be
discussed. In fact, experiments performed at 0.5 bar should record an initial flux around 0.8 x
10-4 m/s and 1.8 x 10⁻⁴ m/s for those conducted at 1 bar. This is not the case for all filtrations
where the initial flux value is function of the type of added molecules and the associated
concentrations. It must be mentioned that a maximum of 10% difference of membrane water
permeability is tolerated after chemical cleaning. So, the membrane has almost the same
permeability at the beginning of each filtration.
For wines added with tannins as well as those added with mannoproteins, initial fluxes seem
to be concentration dependent. At 1.25 g/l tannins, the initial fluxes fit well with expectations
while those obtained with 2.5 g/l tannins are divided by half, sign of a very quick fouling. The
initial fluxes recorded with 0.1 g/l and 0.2 g/l mannoproteins are below those obtained with
FW. At 0.02 g/l mannoproteins, the initial flux match well with the expected one. These
observations are in accordance with the flux evolution, for which an influence of the
concentration, probably based on physico-chemical considerations has been pointed out.
The effect of pectins is noticeable from the very first seconds of filtration. Any of the 5
experiments conducted in the presence of pectins showed the expected initial fluxes whatever
the used concentration. The initial flux was improved when adding enzymes but still not
reached the desired value. The strong affinity of pectins with membrane is here confirmed.
Filtration of wines added with yeasts showed the same initial flux than those obtained while
filtering FW. The influence of the added element nature is here pointed out, yeasts are
constituting a permeable cake.
Table III.1.3: Summary of the initial fluxes obtained with different filtrations
Initial flux (10-5 m/s)
FW FW +
1.25 g/l tannins
FW + 2.5 g/l tannins
FW + 0.1 g/l mannoprotein
s
FW + 0.2 g/l mannoprotein
s
FW + 0.25 g/l pectins
FW + 0.5 g/l pectins
FW + yeasts
0.5 bar 8 7.62 3.22 5.59 5.48 3.73 1.95 7.5 1 bar 18 18 6.65 n.d. 8.19 3.67 3.6 18
In conclusion, although the initial fluxes are closely related to the state of the membrane, it is
obvious that the nature of filtered molecules and their concentration greatly influence these
fluxes during wine filtration.
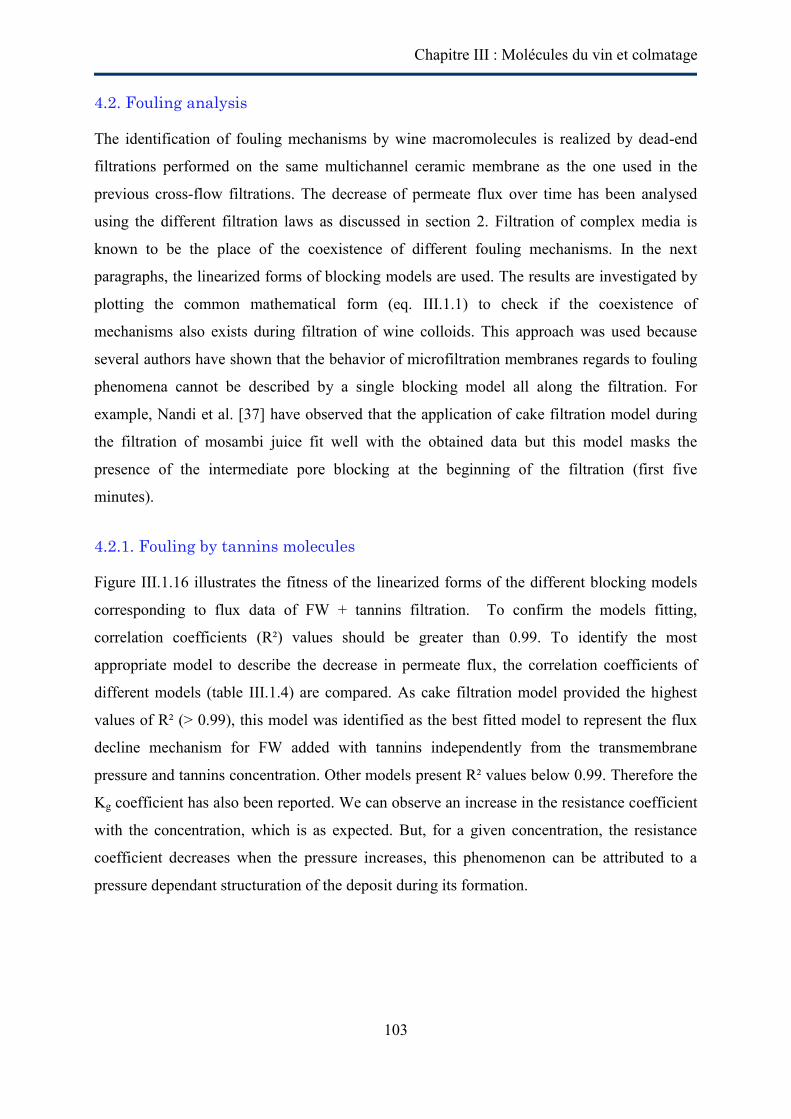
Chapitre III : Molécules du vin et colmatage
103
4.2. Fouling analysis
The identification of fouling mechanisms by wine macromolecules is realized by dead-end
filtrations performed on the same multichannel ceramic membrane as the one used in the
previous cross-flow filtrations. The decrease of permeate flux over time has been analysed
using the different filtration laws as discussed in section 2. Filtration of complex media is
known to be the place of the coexistence of different fouling mechanisms. In the next
paragraphs, the linearized forms of blocking models are used. The results are investigated by
plotting the common mathematical form (eq. III.1.1) to check if the coexistence of
mechanisms also exists during filtration of wine colloids. This approach was used because
several authors have shown that the behavior of microfiltration membranes regards to fouling
phenomena cannot be described by a single blocking model all along the filtration. For
example, Nandi et al. [37] have observed that the application of cake filtration model during
the filtration of mosambi juice fit well with the obtained data but this model masks the
presence of the intermediate pore blocking at the beginning of the filtration (first five
minutes).
4.2.1. Fouling by tannins molecules
Figure III.1.16 illustrates the fitness of the linearized forms of the different blocking models
corresponding to flux data of FW + tannins filtration. To confirm the models fitting,
correlation coefficients (R²) values should be greater than 0.99. To identify the most
appropriate model to describe the decrease in permeate flux, the correlation coefficients of
different models (table III.1.4) are compared. As cake filtration model provided the highest
values of R² (> 0.99), this model was identified as the best fitted model to represent the flux
decline mechanism for FW added with tannins independently from the transmembrane
pressure and tannins concentration. Other models present R² values below 0.99. Therefore the
Kg coefficient has also been reported. We can observe an increase in the resistance coefficient
with the concentration, which is as expected. But, for a given concentration, the resistance
coefficient decreases when the pressure increases, this phenomenon can be attributed to a
pressure dependant structuration of the deposit during its formation.
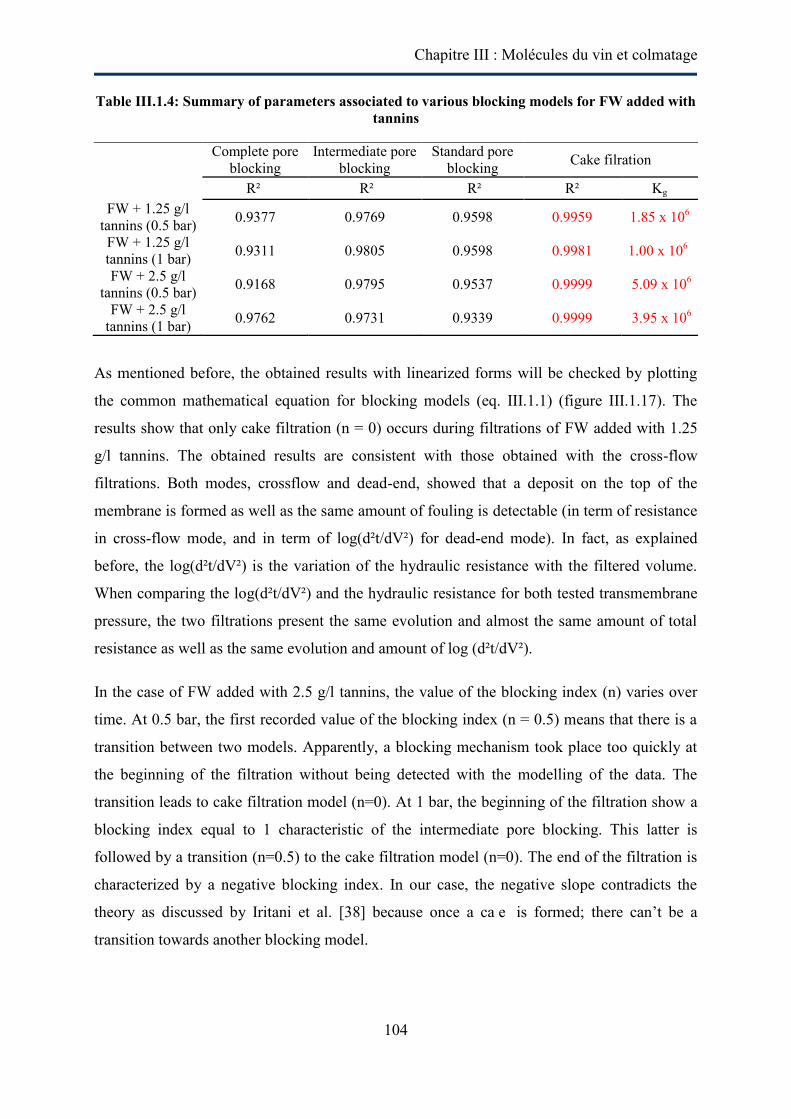
Chapitre III : Molécules du vin et colmatage
104
Table III.1.4: Summary of parameters associated to various blocking models for FW added with tannins
Complete pore
blocking Intermediate pore
blocking Standard pore
blocking Cake filration
R² R² R² R² Kg FW + 1.25 g/l
tannins (0.5 bar) 0.9377 0.9769 0.9598 0.9959 1.85 x 10⁶
FW + 1.25 g/l tannins (1 bar) 0.9311 0.9805 0.9598 0.9981 1.00 x 10⁶
FW + 2.5 g/l tannins (0.5 bar) 0.9168 0.9795 0.9537 0.9999 5.09 x 10⁶
FW + 2.5 g/l tannins (1 bar) 0.9762 0.9731 0.9339 0.9999 3.95 x 10⁶
As mentioned before, the obtained results with linearized forms will be checked by plotting
the common mathematical equation for blocking models (eq. III.1.1) (figure III.1.17). The
results show that only cake filtration (n = 0) occurs during filtrations of FW added with 1.25
g/l tannins. The obtained results are consistent with those obtained with the cross-flow
filtrations. Both modes, crossflow and dead-end, showed that a deposit on the top of the
membrane is formed as well as the same amount of fouling is detectable (in term of resistance
in cross-flow mode, and in term of log(d²t/dV²) for dead-end mode). In fact, as explained
before, the log(d²t/dV²) is the variation of the hydraulic resistance with the filtered volume.
When comparing the log(d²t/dV²) and the hydraulic resistance for both tested transmembrane
pressure, the two filtrations present the same evolution and almost the same amount of total
resistance as well as the same evolution and amount of log (d²t/dV²).
In the case of FW added with 2.5 g/l tannins, the value of the blocking index (n) varies over
time. At 0.5 bar, the first recorded value of the blocking index (n = 0.5) means that there is a
transition between two models. Apparently, a blocking mechanism took place too quickly at
the beginning of the filtration without being detected with the modelling of the data. The
transition leads to cake filtration model (n=0). At 1 bar, the beginning of the filtration show a
blocking index equal to 1 characteristic of the intermediate pore blocking. This latter is
followed by a transition (n=0.5) to the cake filtration model (n=0). The end of the filtration is
characterized by a negative blocking index. In our case, the negative slope contradicts the
theory as discussed by Iritani et al. [38] because once a ca e is formed; there can’t be a
transition towards another blocking model.
Chapitre III : Molécules du vin et colmatage
105
Figure III.1.16: Linearized plot of permeate flux versus time for different pore blocking models for FW added with tannins: (a) complete pore
blocking, (b) intermediate pore blocking, (c) standard pore blocking and (d) cake filtration.
Chapitre III : Molécules du vin et colmatage
106
Figure III.1.17: A plot of d²t/dV² vs. dt/dV curves for wine added with tannins
It was surprising to find that tannins can form a deposit during microfiltration because these
molecules have a size range below the cut-off of the membranes. Tannins are unstable
molecules and their physico-chemistry aspect behavior is not well known yet. Several authors
have shown that tannins can self-associate and eventually aggregate to form colloidal particles
[24,39]. So, the cake formation by tannins molecules may be induced by the convective flux.
This latter can enhance the physico-chemical interactions between tannin molecules leading to
aggregation phenomena. According to Vernhet and Moutounet [3] and Susanto et al. [40],
adsorption on the membrane surface as well as on pore wall, followed either by pore blocking
and pore narrowing due to solute-solute interaction seemed to be the most plausible fouling
mechanism during filtration solutions containing tannins. According to our observations, the
most plausible mechanisms is a fast interaction between tannins and the membrane
(adsorption), quickly followed by tannins-tannins interactions leading to aggregates that can
block the pores and then form a deposit at the membrane surface.
4.2.2. Fouling with wine polysaccharides
The fouling mechanisms during filtration of wines overloaded with polysaccharides have been
studied for the following solutions: FW + 0.2 g/l mannoproteins and FW + 0.25 g/l pectins.
The linearized forms for the different blocking models obtained during filtration of these
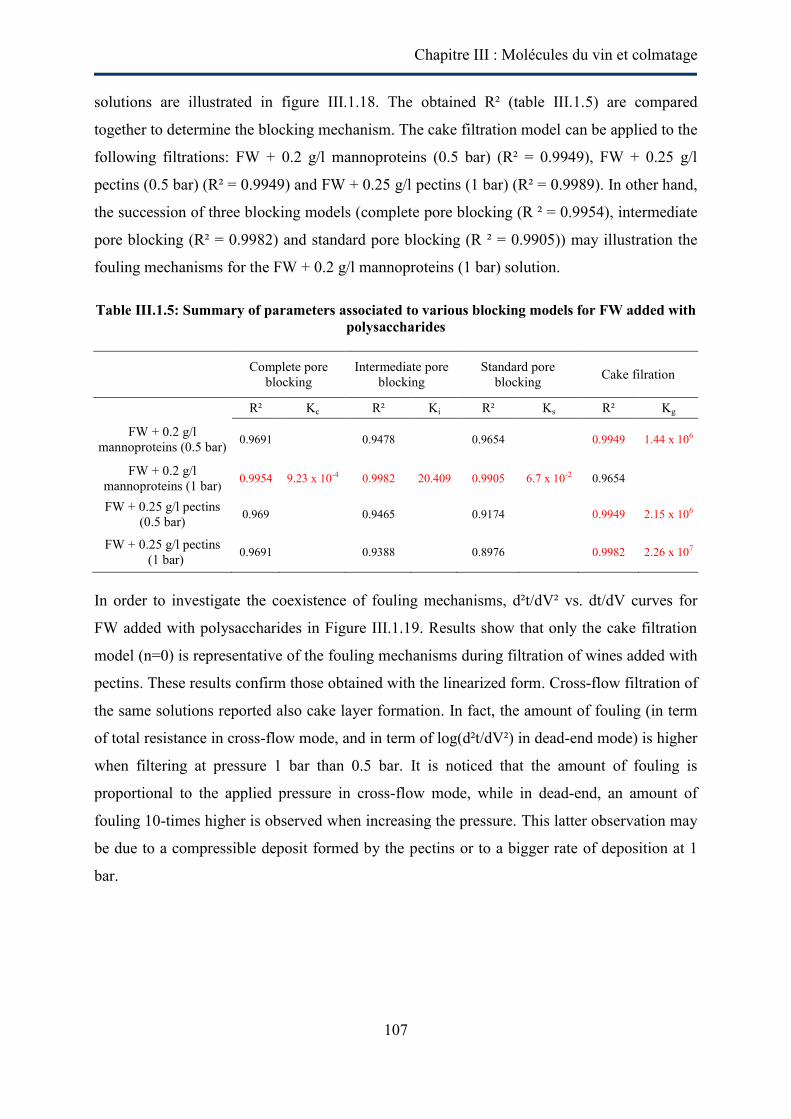
Chapitre III : Molécules du vin et colmatage
107
solutions are illustrated in figure III.1.18. The obtained R² (table III.1.5) are compared
together to determine the blocking mechanism. The cake filtration model can be applied to the
following filtrations: FW + 0.2 g/l mannoproteins (0.5 bar) (R² = 0.9949), FW + 0.25 g/l
pectins (0.5 bar) (R² = 0.9949) and FW + 0.25 g/l pectins (1 bar) (R² = 0.9989). In other hand,
the succession of three blocking models (complete pore blocking (R ² = 0.9954), intermediate
pore blocking (R² = 0.9982) and standard pore blocking (R ² = 0.9905)) may illustration the
fouling mechanisms for the FW + 0.2 g/l mannoproteins (1 bar) solution.
Table III.1.5: Summary of parameters associated to various blocking models for FW added with polysaccharides
Complete pore
blocking Intermediate pore
blocking Standard pore
blocking Cake filration
R² Kc R² Ki R² Ks R² Kg
FW + 0.2 g/l mannoproteins (0.5 bar) 0.9691 0.9478 0.9654 0.9949 1.44 x 10⁶
FW + 0.2 g/l mannoproteins (1 bar) 0.9954 9.23 x 10⁻⁴ 0.9982 20.409 0.9905 6.7 x 10⁻² 0.9654
FW + 0.25 g/l pectins (0.5 bar) 0.969 0.9465 0.9174 0.9949 2.15 x 10⁶
FW + 0.25 g/l pectins (1 bar) 0.9691 0.9388 0.8976 0.9982 2.26 x 10⁷
In order to investigate the coexistence of fouling mechanisms, d²t/dV² vs. dt/dV curves for
FW added with polysaccharides in Figure III.1.19. Results show that only the cake filtration
model (n=0) is representative of the fouling mechanisms during filtration of wines added with
pectins. These results confirm those obtained with the linearized form. Cross-flow filtration of
the same solutions reported also cake layer formation. In fact, the amount of fouling (in term
of total resistance in cross-flow mode, and in term of log(d²t/dV²) in dead-end mode) is higher
when filtering at pressure 1 bar than 0.5 bar. It is noticed that the amount of fouling is
proportional to the applied pressure in cross-flow mode, while in dead-end, an amount of
fouling 10-times higher is observed when increasing the pressure. This latter observation may
be due to a compressible deposit formed by the pectins or to a bigger rate of deposition at 1
bar.
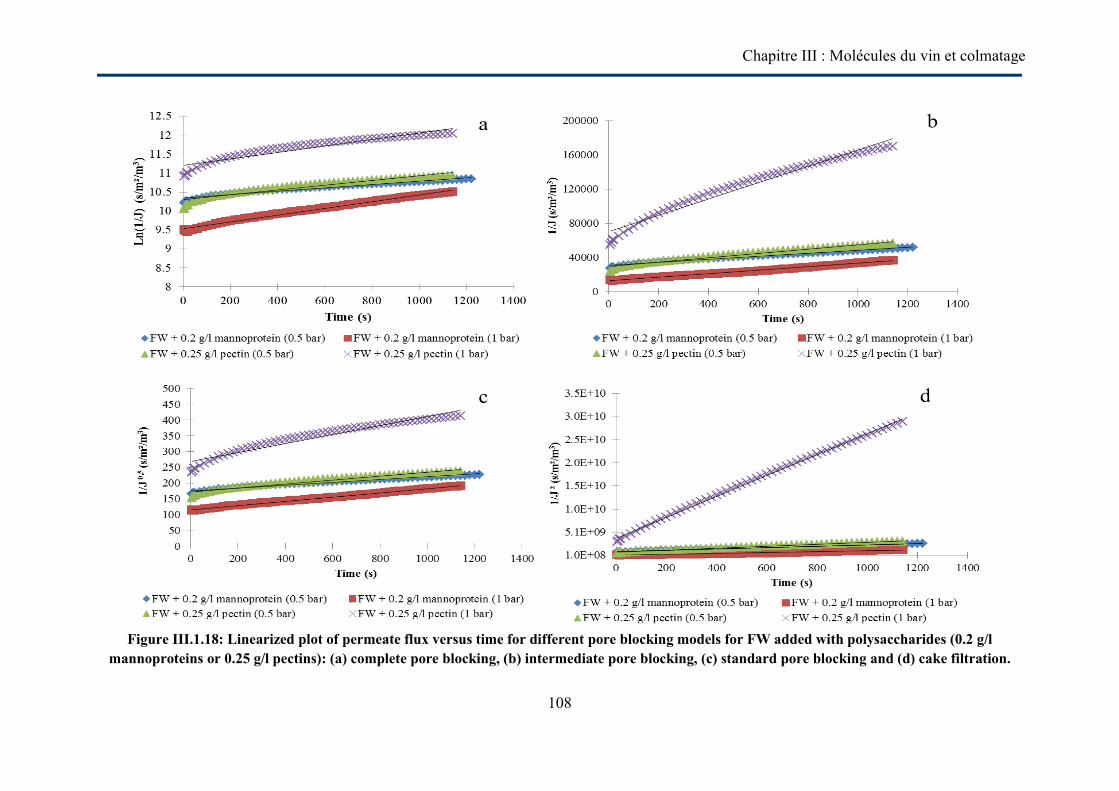
Chapitre III : Molécules du vin et colmatage
108
Figure III.1.18: Linearized plot of permeate flux versus time for different pore blocking models for FW added with polysaccharides (0.2 g/l
mannoproteins or 0.25 g/l pectins): (a) complete pore blocking, (b) intermediate pore blocking, (c) standard pore blocking and (d) cake filtration.
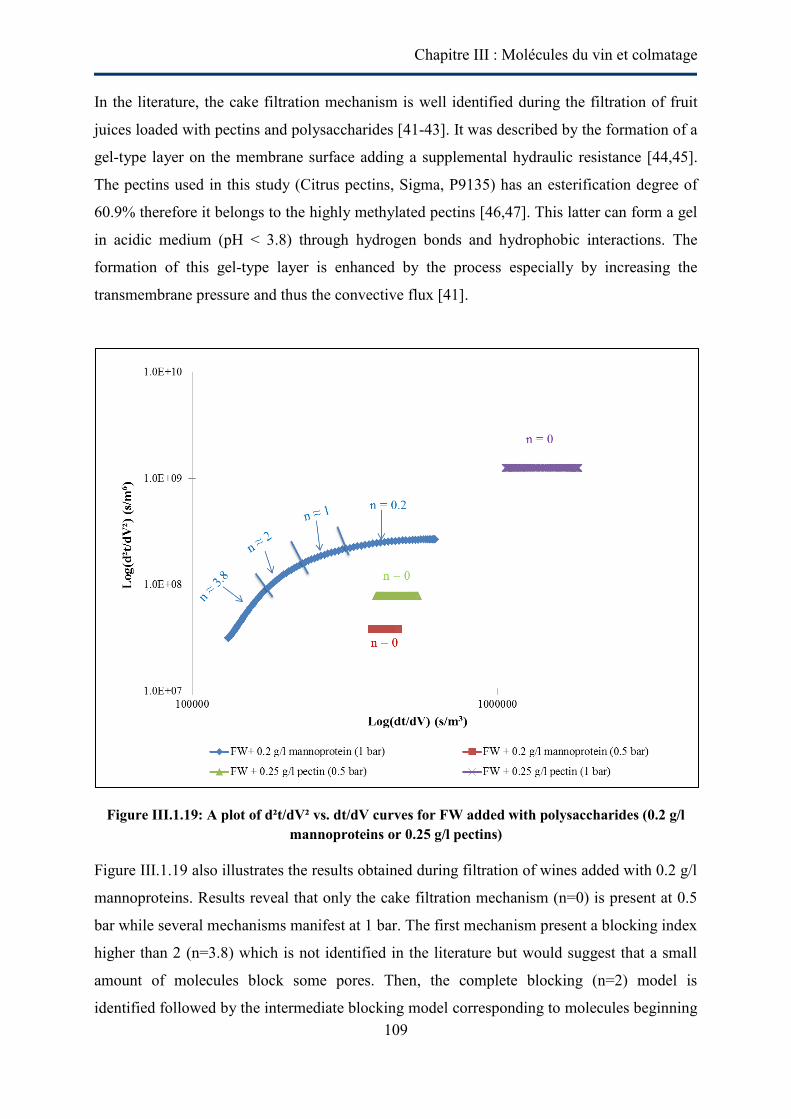
Chapitre III : Molécules du vin et colmatage
109
In the literature, the cake filtration mechanism is well identified during the filtration of fruit
juices loaded with pectins and polysaccharides [41-43]. It was described by the formation of a
gel-type layer on the membrane surface adding a supplemental hydraulic resistance [44,45].
The pectins used in this study (Citrus pectins, Sigma, P9135) has an esterification degree of
60.9% therefore it belongs to the highly methylated pectins [46,47]. This latter can form a gel
in acidic medium (pH < 3.8) through hydrogen bonds and hydrophobic interactions. The
formation of this gel-type layer is enhanced by the process especially by increasing the
transmembrane pressure and thus the convective flux [41].
Figure III.1.19: A plot of d²t/dV² vs. dt/dV curves for FW added with polysaccharides (0.2 g/l mannoproteins or 0.25 g/l pectins)
Figure III.1.19 also illustrates the results obtained during filtration of wines added with 0.2 g/l
mannoproteins. Results reveal that only the cake filtration mechanism (n=0) is present at 0.5
bar while several mechanisms manifest at 1 bar. The first mechanism present a blocking index
higher than 2 (n=3.8) which is not identified in the literature but would suggest that a small
amount of molecules block some pores. Then, the complete blocking (n=2) model is
identified followed by the intermediate blocking model corresponding to molecules beginning
Chapitre III : Molécules du vin et colmatage
110
to settle on other retained molecules. The end of the filtration seems to be governed by cake
layer formation. These results are consistent with those obtained from the linearized forms.
They can also explain the unusual shape of the total resistance curve obtained while filtering
the same solution in cross-flow mode (figure III.1.13). In cross-flow filtration of the same
solution, an inflection point in the total resistance curve was observed and reported as a
transition between serveral fouling mechanisms. These mechanisms have been identified by
the analysis of fouling in dead-end mode: complete blocking and intermediate blocking
mechanism and cake layer formation. A transition in blocking mechanisms was also observed
by Ye et al. [48] during filtration of model solution of extracellular polymeric substances
(EPS). They showed that the beginning of the filtration was governed by the standard
blocking mechanism followed by a cake layer formation.
4.3. Influence of CFMF on chemical composition of wines
Analytical measurements carried out on samples from feed and permeate of the CFMF of
wines are reported in table III.1.6. The wine characteristics as pH, % of ethanol, total acidity
and total anthocyanin were affected neither by the added compounds nor by the process.
These parameters were, respectively, 3.6, 12.07%, 2.48 g/l H2SO4 and 350-360 mg/l. The
value of total acidity is low because the wines undergo malo-lactic fermentation and tartaric
acid stabilization.
When adding tannins to the wines, an increase in turbidity, colour intensity (IC), total
polyphenol index (TPI) and total tannins is observed depending on the added concentration.
For wines containing 1.25 g/l tannins, a decrease of 3.2-5% in IC, 3.4-6.2% in IPT and 7.4-
8.6% in total tannins is observed after filtration. For wines added with 2.5 g/l tannins, a loss
about 7.5% in IC, 5.6-6.2% in IPT and 5.6-7.6% in total tannins is noticed. So, no significant
differences in term of quality loss are observed between both tested concentrations.
Thiolysis analyses were performed on wine added with tannins in order to investigate a
possible affinity of some tannins compound to membrane material. Tannins subunits
concentration and their qualitative composition (mean degree of polymerization (mDP),
fraction of galloylation and % of epicatechin) are presented in table III.1.7. There are no real
differences concerning the qualitative composition of tannins between feeds and permeates. A
little decrease in mDP (2.5-6.5%) is only noticed. A little decrease in subunits concentrations
is noticed except epicatechin-thiol (extension unit). This would means that polymeric tannins
are more retained by the membrane than the monomeric units. According to Arriagada-
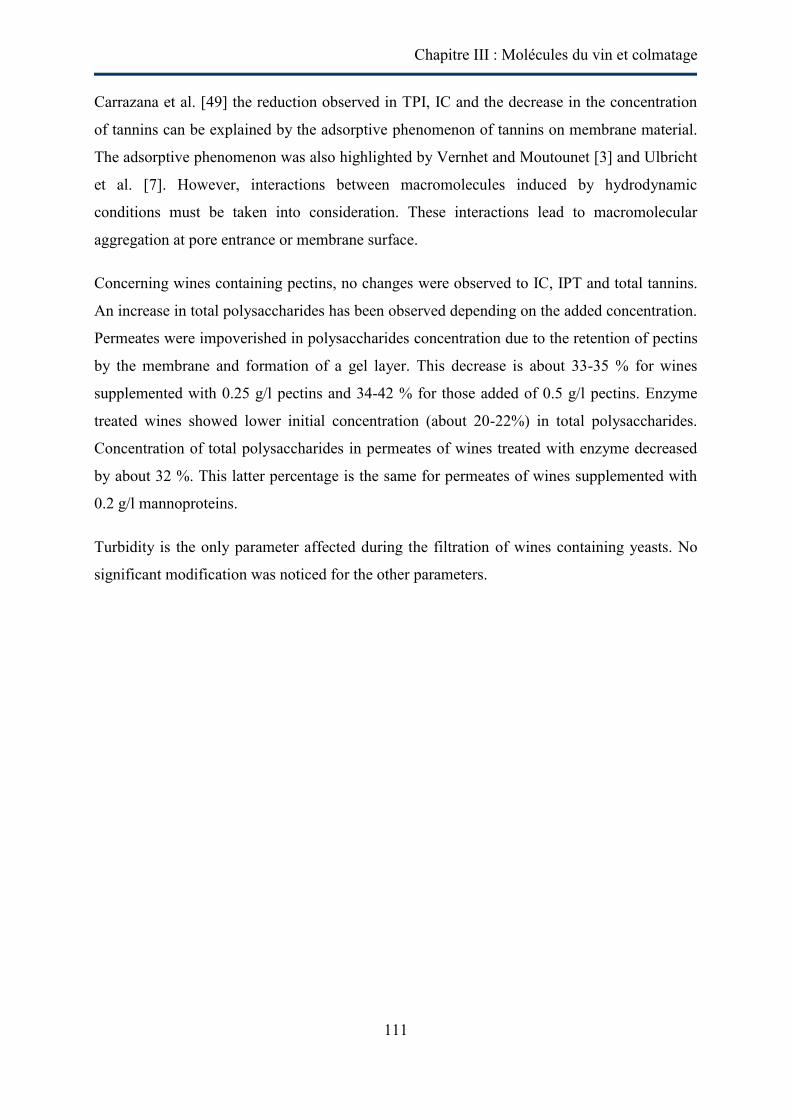
Chapitre III : Molécules du vin et colmatage
111
Carrazana et al. [49] the reduction observed in TPI, IC and the decrease in the concentration
of tannins can be explained by the adsorptive phenomenon of tannins on membrane material.
The adsorptive phenomenon was also highlighted by Vernhet and Moutounet [3] and Ulbricht
et al. [7]. However, interactions between macromolecules induced by hydrodynamic
conditions must be taken into consideration. These interactions lead to macromolecular
aggregation at pore entrance or membrane surface.
Concerning wines containing pectins, no changes were observed to IC, IPT and total tannins.
An increase in total polysaccharides has been observed depending on the added concentration.
Permeates were impoverished in polysaccharides concentration due to the retention of pectins
by the membrane and formation of a gel layer. This decrease is about 33-35 % for wines
supplemented with 0.25 g/l pectins and 34-42 % for those added of 0.5 g/l pectins. Enzyme
treated wines showed lower initial concentration (about 20-22%) in total polysaccharides.
Concentration of total polysaccharides in permeates of wines treated with enzyme decreased
by about 32 %. This latter percentage is the same for permeates of wines supplemented with
0.2 g/l mannoproteins.
Turbidity is the only parameter affected during the filtration of wines containing yeasts. No
significant modification was noticed for the other parameters.
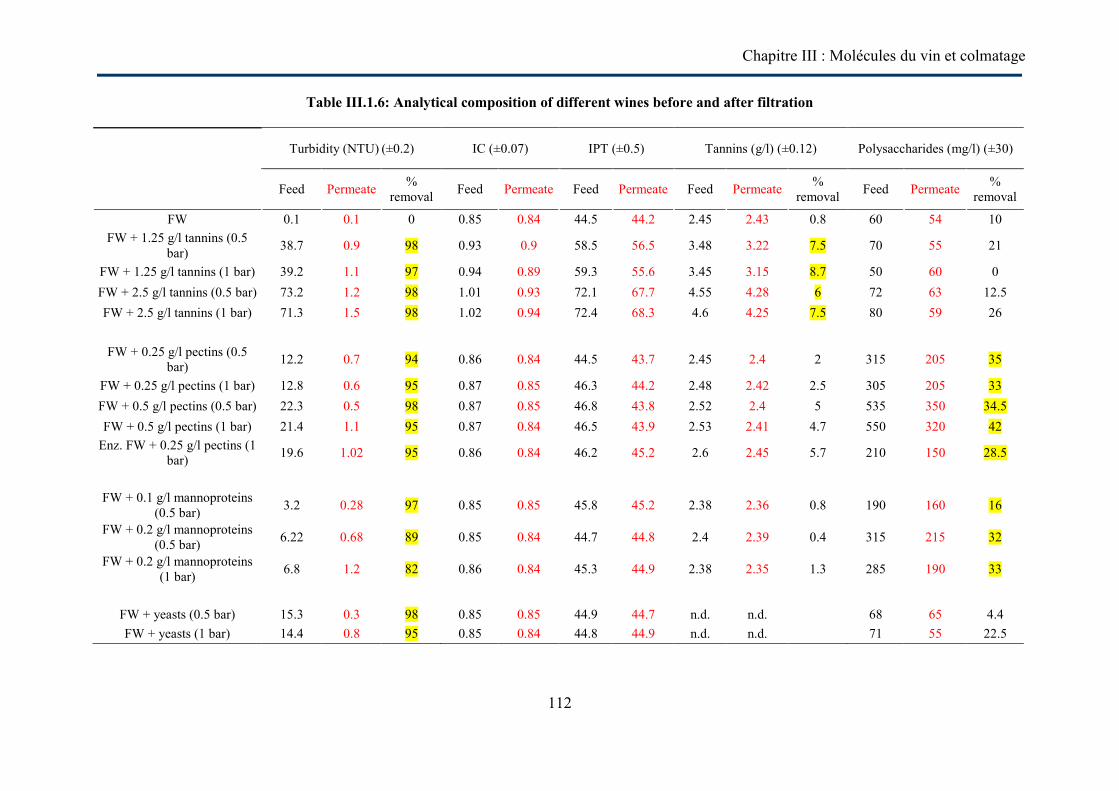
Chapitre III : Molécules du vin et colmatage
112
Table III.1.6: Analytical composition of different wines before and after filtration
Turbidity (NTU) (±0.2) IC (±0.07) IPT (±0.5) Tannins (g/l) (±0.12) Polysaccharides (mg/l) (±30)
Feed Permeate %
removal Feed Permeate Feed Permeate Feed Permeate % removal Feed Permeate %
removal
FW 0.1 0.1 0 0.85 0.84 44.5 44.2 2.45 2.43 0.8 60 54 10 FW + 1.25 g/l tannins (0.5
bar) 38.7 0.9 98 0.93 0.9 58.5 56.5 3.48 3.22 7.5 70 55 21
FW + 1.25 g/l tannins (1 bar) 39.2 1.1 97 0.94 0.89 59.3 55.6 3.45 3.15 8.7 50 60 0 FW + 2.5 g/l tannins (0.5 bar) 73.2 1.2 98 1.01 0.93 72.1 67.7 4.55 4.28 6 72 63 12.5 FW + 2.5 g/l tannins (1 bar) 71.3 1.5 98 1.02 0.94 72.4 68.3 4.6 4.25 7.5 80 59 26
FW + 0.25 g/l pectins (0.5
bar) 12.2 0.7 94 0.86 0.84 44.5 43.7 2.45 2.4 2 315 205 35
FW + 0.25 g/l pectins (1 bar) 12.8 0.6 95 0.87 0.85 46.3 44.2 2.48 2.42 2.5 305 205 33 FW + 0.5 g/l pectins (0.5 bar) 22.3 0.5 98 0.87 0.85 46.8 43.8 2.52 2.4 5 535 350 34.5 FW + 0.5 g/l pectins (1 bar) 21.4 1.1 95 0.87 0.84 46.5 43.9 2.53 2.41 4.7 550 320 42
Enz. FW + 0.25 g/l pectins (1 bar) 19.6 1.02 95 0.86 0.84 46.2 45.2 2.6 2.45 5.7 210 150 28.5
FW + 0.1 g/l mannoproteins
(0.5 bar) 3.2 0.28 97 0.85 0.85 45.8 45.2 2.38 2.36 0.8 190 160 16
FW + 0.2 g/l mannoproteins (0.5 bar) 6.22 0.68 89 0.85 0.84 44.7 44.8 2.4 2.39 0.4 315 215 32
FW + 0.2 g/l mannoproteins (1 bar) 6.8 1.2 82 0.86 0.84 45.3 44.9 2.38 2.35 1.3 285 190 33
FW + yeasts (0.5 bar) 15.3 0.3 98 0.85 0.85 44.9 44.7 n.d. n.d. 68 65 4.4 FW + yeasts (1 bar) 14.4 0.8 95 0.85 0.84 44.8 44.9 n.d. n.d. 71 55 22.5
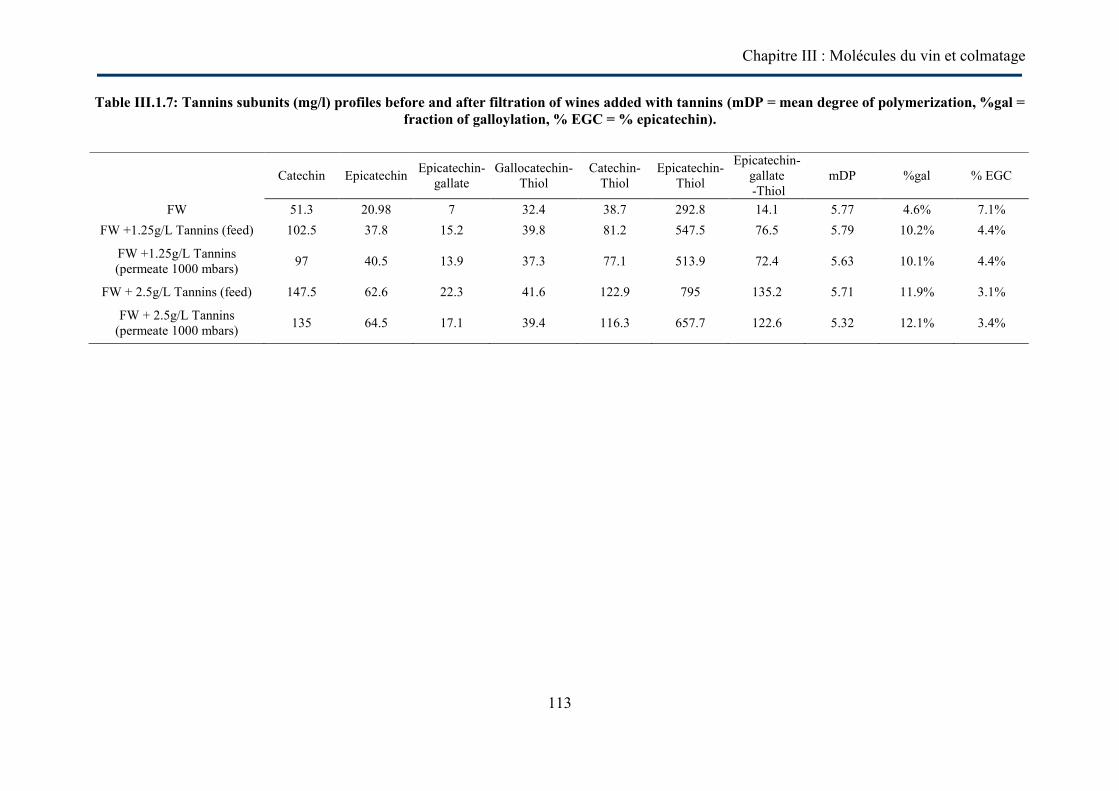
Chapitre III : Molécules du vin et colmatage
113
Table III.1.7: Tannins subunits (mg/l) profiles before and after filtration of wines added with tannins (mDP = mean degree of polymerization, %gal = fraction of galloylation, % EGC = % epicatechin).
Catechin Epicatechin Epicatechin-gallate
Gallocatechin-Thiol
Catechin-Thiol
Epicatechin-Thiol
Epicatechin-gallate -Thiol
mDP %gal % EGC
FW 51.3 20.98 7 32.4 38.7 292.8 14.1 5.77 4.6% 7.1% FW +1.25g/L Tannins (feed) 102.5 37.8 15.2 39.8 81.2 547.5 76.5 5.79 10.2% 4.4%
FW +1.25g/L Tannins (permeate 1000 mbars) 97 40.5 13.9 37.3 77.1 513.9 72.4 5.63 10.1% 4.4%
FW + 2.5g/L Tannins (feed) 147.5 62.6 22.3 41.6 122.9 795 135.2 5.71 11.9% 3.1%
FW + 2.5g/L Tannins (permeate 1000 mbars) 135 64.5 17.1 39.4 116.3 657.7 122.6 5.32 12.1% 3.4%
Chapitre III : Molécules du vin et colmatage
114
4.4. Initial turbidity: a factor for predicting microfiltration performance?
Turbidity measures the light scattering properties of a solution, consequently providing the
lost direct measure of the concentration of polydisperse particles and macromolecules in a
solution. These measures depend on the shape, size, mineral composition and concentrations
of particles. Czekaj et al. [50] observed that membrane fouling depends strongly on the initial
turbidity of the solution while filtering model turbidity solutions of tannic acid and gelatin.
Vaillant et al. [51] showed that a lower initial turbidity value gives rise to higher permeation
fluxes, and a higher initial turbidity value reduces permeation fluxes when these are compared
at the same VRR. They conclude that turbidity appears to be an influential factor that allows
discrimination between different juice lots of the same fruit species.
This last conclusion, if confirmed in the case of wine, may be useful for future industrial
applications. It may also facilitate the implementation of industrial applications of cross-flow
microfiltration to wine clarification. To validate this idea, a comparison was made between
the performances of wines added with macromolecules filtered at 0.5 bar and the initial
turbidity. For each wine, permeate flux was calculated when a volume of 3000 ml is filtered
in order to compare at the same VRR (1.4). Results, presented in table III.1.8, showed that
FW + 2.5 g/l tannins have the highest initial turbidity (73.2 NTU) but does not present the
lower permeate flux (1.53 x 10⁻⁵ m/s). This latter (1.22 x 10⁻⁵ m/s) was recorded for FW + 0.5
g/L pectins which have initial turbidity equal to 22.3 NTU. The highest permeate flux (4.56 x
10-5 m/s) has been obtained with FW + yeasts which have an initial turbidity of 15.3 NTU.
Table III.1.8: The possible relationship between permeate fluxes at 0.5 bar and the initial turbidity (obtained after filtering a volume of 3000 ml)
J (m/s) Turbidity (NTU) FW + 1.25 g/l tannins 1.92 10-5 38.7 FW + 2.5 g/l tannins 1.53 10-5 73.2
FW + 0.1 g/l mannoproteins 2.91 10-5 3.2 FW + 0.2 g/l mannoproteins 3.10 10-5 6.22
FW + 0.25 g/l pectins 1.66 10-5 12.2 FW + 0.5 g/l pectins 1.22 10-5 22.3
FW + yeasts 4.56 10-5 15.3
Therfore, the prediction of filtration performance by measuring the initial turbidity is not valid
in the case of wine. However, wine filtrations performances seem to depend on the nature and
Chapitre III : Molécules du vin et colmatage
115
the concentrations of molecules present in the crude wine. These latters depend strongly on
the processes and steps used to elaborate the wine.
Considering all the previous results and the fluxes obtained after filtering a volume of 3000
ml, wine molecules could be ranked, independently of their concentrations, according to their
increasing effect on permeate flux decline as : yeasts < mannoproteins < tannins < pectins.
Although this classification provides some answers on the individual impact of wines
molecules on membrane fouling, the relationship between wine filterability and its
composition still remains unclear.
5. Conclusion The aim of this study was to test the individual impact of wines components on a
multichannel ceramic membrane fouling during a red wine cross-flow microfiltration and to
investigate the fouling mechanisms. The tested wine constituents: tannins, pectins,
mannoproteins and yeast induced permeate flux declines but with different impacts on
membrane fouling. Filtered wine (FW) induced a little loss of membrane permeability, due to
the adsorption of wine molecules on membrane material. Wines colloids had a strong impact
on membrane fouling. Independently of their concentrations found in wine, they can be
ranked according to their increasing effect on permeate flux as: mannoproteins < tannins <
pectins.
The mean fluxes obtained during the filtration of FW alone are 0.8 x 10⁻⁴ m/s at 0.5 bar and
1.8 x 10⁻⁴ m/s at 1 bar. These fluxes are the initial fluxes at which all the filtration of wines
added with molecules should begin. This was not the case for all filtrations where it was
demonstrated that the obtained initial fluxes are function of the type of added molecules and
their concentrations.
Almost the same permeate fluxes were obtained at the end of the filtration of wines added
with tannins. The fluxes seem to be stabilized by the cross-flow velocity and are not affected
by the transmembrane pressure and the tannins concentration. Quick adsorption followed by
pore blocking or/and aggregation is the most plausible mechanism to explain fouling by wine
tannins.
The strong impact of pectins is due to the formation of the gel layer at the membrane surface.
The results showed that even if the pectins concentration is divided by 10 times fold, a severe
Chapitre III : Molécules du vin et colmatage
116
fouling will be observed. The enzymed wine by a commercial preparation showed permeate
fluxes 4 times higher than that non-enzymed.
For wines added with mannoproteins filtrations, it was shown that there is a threshold
concentration (≤ 0.1 g/l) above it a plateau value of permeate flux is obtained. Further
experiments are needed to determine the exact value of this concentration. The coexistence of
different fouling mechanism was highlighted with wines containing mannoproteins but the
end of the filtrations are governed by the cake layer filtration mechanisms.
The analytical measurement showed that cross-flow microfiltration may induce a loss till 8%
in total tannins, 6% in IPT and 35% in total polysaccharides. The loss in total polysaccharides
may affect the quality of wine but more studies with real wines are needed to assess this point.
No relationship was found between the initial turbidity and filtration performances. So, the
use of the initial turbidity of wines as a prediction tool for filtration performance is not valid
in the case of wine.
References
[1] D. Poirier, M. Bennasar, B. Tarodo de la Fuente, J. Gillot, D. Garcera, Clarification et stabilisations des vins par ultrafiltration tangentielle sur membranes minérales, Lait 64 (1984) 141-142. [2] Y. El Rayess, C. Albasi, P. Bacchin, P. Taillandier, J. Raynal, M. Mietton-Peuchot, A. Devatine, Cross-flow microfiltration applied to oenology: A review, J. Membr. Sci. 382 (2011) 1-19. [3] A. Vernhet, M. Moutounet, Fouling of organic microfiltration membranes by wine constituents: importance, relative impact of wine polysaccharides and polyphenols and incidence of membrane properties, J. Membr. Sci. 201 (2002) 103-122. [4] M.P. Belleville, J.M. Brillouet, B.T. Delafuente, M. Moutounet, Fouling colloids during microporous alumina membrane filtration of wine, J.Food Sci. 57 (1992) 396-400. [5] F.N. Salazar, J.P.F. de Bruijn, L. Seminario, C. Guell, F. Lopez, Improvement of wine crossflow microfiltration by a new hybrid process, J. Food Eng. 79 (2007) 1329-1336. [6] B. Boissier, F. Lutin, M. Moutounet, A. Vernhet, Particles deposition during the cross-flow microfiltration of red wines-incidence of the hydrodynamic conditions and of the yeast to fines ratio, Chem. Eng. Process. 47 (2008) 276-286. [7] M. Ulbricht, W. Ansorge, I. Danielzik, M. Konig, O. Schuster, Fouling in microfiltration of wine: The influence of the membrane polymer on adsorption of polyphenols and polysaccharides. Sep. Purif. Technol. 68 (2009) 335-342. [8] P. Czekaj, F. Lopez, C. Guell, Membrane fouling during microfiltration of fermented beverages, J. Membr. Sci. 166 (2000) 199-212. [9] Y. El Rayess, C. Albasi, P. Bacchin, P. Taillandier, J. Raynal, M. Mietton-Peuchot, A. Devatine, Impact of the physico-chemistry of the wine on membrane filtration performance, GPE-EPIC, Congress Venise, June 2009.
Chapitre III : Molécules du vin et colmatage
117
[10] P. Aimar, P. Bacchin and A. Maurel, Filtration membranaire (OI, NF, UF, MFT) Aspects théoriques: perméabilité et sélectivité. Techniques de l’ingénieur J2790 (2010) v2-1 – v2-20. [11] P.H. Hermans and H.L. Bredee, Principles of the mathematical treatment of constant pressure filtration, J. Soc. Chem. Ind. 55T (1936), p. 1-11 [12] J. Hermia, Constant pressure blocking filtration laws-application to power-law non-Newtonian fluids, Trans IchemE 60 (1982) 183-187. [13] A. Grenier, M. Meireles, P. Aimar and P. Carvin, Analysing flux decline in dead-end filtration, Chem. Eng. Res. Des. 8 (2008) 1281-1293. [14] C.C. Ho, A.L. Zydney, A combined pore blockage and cake filtration model for protein fouling during microfiltration, J. Colloid Interface Sci. 232 (2000) 389-399. [15] M. Cinta Vincent Vela, S. Alvarez Blanco, J. Lora Garcia and E. Bergantinos Rodreiguez, Analysis of membrane pore blocking models applied to the ultrafiltration of PEG, Sep. Pur. Technol. 62 (2008) 489-498. [16] P. Ribéreau-Gayon, Y. Glories, A. Maujean, D. dubourdieu., Handbook of enology Volume 2 : The chemistry of wine, stabilization and treatments, 2nd ed., Dunod, Paris, 2006. [17] C. Flanzy, Œnologie : fondements scientifiques et technologiques, Lavoisier TEC&DOC, Paris, 1998. [18] N. Nehme, F. Mathieu, P. Taillandier, Impact of the co-culture of Saccharomyces cerevisiae–Oenococcus oeni on malolactic fermentation and partial characterization of a yeast-derived inhibitory peptidic fraction. Food Microbiology, 27 (2010) 150-157. [19] L. Usseglio-Tomasset, Les colloïdes glucidiques solubles des moûts et des vins. Connaissance de la vigne et du vin, 10 (1976) 193-226. [20] S. Preys, J.M. Souquet, E. Meudec, C. Morel-Salmi, V. Cheynier, Development of a rapid quantative method to analyse proanthocyanidins in red wines. XXII International Conference on Polyphenols, Helsinki, Finland, 25-28 August (2004). [21] F. René, M. Lalande, Momentum and mass transfer during ultrafiltration of dextran with tubular mineral membranes in turbulent flow regime, J. Membr. Sci. 56 (1991) 29-48. [22] A. Vernhet, D. Cartalade, M. Moutounet, Contribution to the understanding of fouling build-up during microfiltration of wines, J. Membr. Sci. 211 (2003) 357-370. [23] E.M. Tracey, R.H. Davis, Protein fouling of track-etched polycarbonate microfiltration membranes, J. Colloid Interface Sci. 167 (1994) 104-116. [24] C. Poncet-Legrand, D. Cartalade, J.-L. Putaux, V. Cheynier and A. Vernhet, Flavan-3-ol aggregation in model ethanolic solutions: incidence of polyphenol structure, concentration, ethanol content and ionic strength, Langmuir 19 (2003) 10563-10572. [25] R.Jiraratananon, D. Uttapap, C. Tangamornuskun, Self-forming dynamic membrane for ultrafiltration of pineapple juice, J. Membr. Sci. 129 (1997) 135-143. [26] K. Riedl, B. Girard, R.W. Lencki, Influence of membrane structure on fouling layer morphology during apple juice clarification, J. Membr. Sci. 139 (1998) 155-166. [27] P. Rai, G.C. Majumdar, S. Dasgupta, S. De, Understanding ultrafiltration performance with mosambi juice in an unstirred batch cell, J. Food Process Eng. 28 (2005) 166-180. [28] R.M. Canal-Llaubères, G. Reynou-Gravier, A. Embeita, Intérêt économique d’une pectinsase purifiée pour l’extraction et le débourbage : Synthèse d’essais industriels en blanc et rosé, Revue des œnologues 137 (2010) 12-14. [29] A. Humbert-Goffard, C. Saucier, V. Moine-Ledoux, R.M. Canal-Llaubères, D. Dubourdieu, Y. Glories, An essay for glucanase activity in wine, Enz. Microbial Technol. 34 (2004) 537-543. [30] A. Vernhet, P. Pellerin, M.P. Belleville, J. Planque, M. Moutounet, Relative impact of major wine polysaccharides on the performances of an organic microfiltration membrane, Am. J. Enol. Vitic. 50 (1999) 51-56. [31] V.T. Kuberkar, R.H. Davis, Effects of added yeast on protein transmission on flux in
Chapitre III : Molécules du vin et colmatage
118
cross-flow membrane microfiltration, Biotechnol. Prog. 15 (1999) 472-479. [32] C. Guell, P. Czekaj, R.H. Davis, Microfiltration of protein mixtures and the effects of yeast on membrane fouling, J. Membr. Sci. 155 (1999) 113-122. [33] L. Fillaudeau, H. Carrere, Yeast cells, beer composition and mean pore diameter impacts on fouling and retention during cross-flow filtration of beer with ceramic membranes. J. Membr. Sci. 196 (2002) 39-57 [34] B. Keskinler, G. Akay, B.K. Bayhan, E. Erhan, Effect of ionic environment on the cross- flow microfiltration behavior of yeast suspensions, J. Membr. Sci. 206 (2002) 351-360. [35] B. Keskinler, E. Yildiz, E. Erhan, M. Dogru, B.K. Bayhan, G. Akay, Cross-flow microfiltration of low concentration-nonliving yeast suspension, J. Membr. Sci. 223 (2004) 56-69. [36] R. Ghidossi, Membranes céramiques: optimization de la géométrie par simulation numérique et application industrielle, Ph.D. Thesis, Université de Provence d’Aix-Marseille I (2006). [37] B.K. Nandi, B. Das, R. Uppaluri and M.K. Purkait, Microfiltration of mosambi juice using low cost ceramic membrane, J. Food Eng. 95 (2009) 597-605. [38] E. Iritani, Y. Mukai, Y.Tanaka and T. Murase, Flux decline behavior in dead-end microfiltration of protein solutions, J. Membr. Sci. 103 (1995) 181-191. [39] V. Riou, A. Vernhet, T. Doco and M. Moutounet, Aggregation of grape seed tannins in model wine – effect of wine polysaccharides, Food Hydrocolloids 16 (2002) 17-23. [40] H. Susanto, Y. Feng, M. Ulbricht, Fouling behavior of aqueous solutions of polyphenolic compounds during ultrafiltration, J. Food Eng. 91 (2009) 333-340. [41] P. Rai, G. C. Majumdar, S. DasGupta and S. De, Modeling of sucrose permeation through a pectins gel during ultrafiltration of depectinsized mosambi [Citrus sinensis (L.) Osbeck] juice, J. Food Sci. 71 (2006) 87-94. [42] P. Rai, G. C. Majumdar, S. DasGupta and S. De, Modeling of permeate flux of synthetic fruit juice and mosambi juice (Citrus sinensis (L.) Osbeck) in stirred continuous ultrafiltration, LWT 40 (2007) 1765-1773. [43] B.K. Nandi, R. Uppaluri and M.K. Purkait, Identification of optimal membrane morphological parameters during microfiltration of mosambi juice using low cost ceramic membranes, LWT 44 (2011) 214-223. [44] D.E. Kirk, M.W. Montgomery and M.G. Kortekaas, Clarification of pear juice by hollow fiber ultrafiltration, J. Food Sci. 48 (1983) 1663-1667. [45] G. T. Vladisavljevic, P. Vukosavljevic and B. Bukvic, Permeate flux and fouling resistance in ultrafiltration of depectinsized apple juice using ceramic membranes, J. Food Eng. 60 (2003) 241-247. [46] A.C.K. Sato, P.R. Oliveira and R.L. Cunha, Rheology of mixed pectins solutions, Food Biophysics 3 (2008) 100-109. [47] W.W. Wai, A.F.M. AlKarkhi and A. Mat Easa, Comparing biosorbent ability of modified citrus and durian rind pectins, Carbohydr. Polymer. 79 (2010) 584-589. [48] Y. Ye, P. Le Clech, V. Chen, A.G. Fane and B. Jefferson, Fouling mechanisms of alginate solutions as model extracellular polymeric substances, Desalination 175 (2005) 7-20. [49] J.P. Arriagada-Carrazana, C. Saez-Navarrete, R. BrodeuMembrane filtration effects on aromatic and phenolic quality of Cabernet Sauvignon wines, J. Food Eng. 68 (2005) 363-368. [50] P. Czekaj, F. Lopez, C. Guell, Membrane fouling by turbidity constituents of beer and wine: characterization and prevention by means of infrasonic pulsing, J. Food Eng. 49 (2001) 25-36. [51] F.Vaillant, A.M. Perez, O. Acosta, M. Dornier, Turbidity of pulpy fruit juice: A key factor for predicting cross-flow microfiltration performance, J. Membr. Sci. 325 (2008) 404-412.
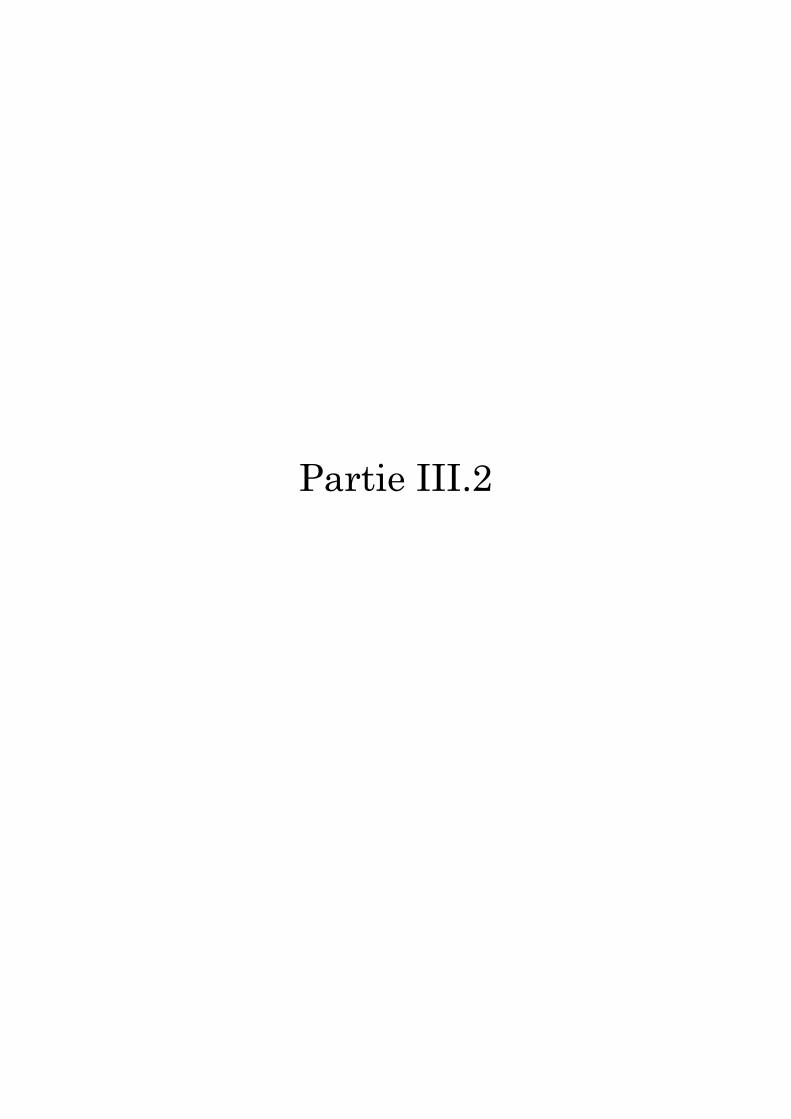
Partie III.2

Chapitre III : Molécules du vin et colmatage
120
1. Introduction
Le vin après fermentation est un produit trouble. Ce trouble est lié à la présence des
macromolécules en suspension ainsi que de microorganismes et d’agrégats colloïdaux. Le
colmatage durant la filtration du vin est la résultante de l’adsorption / colmatage interne des
membranes par les macromolécules et formation d’un dépôt par les particules et les
macromolécules retenues. L’impact relatif de ces mécanismes dépend fortement de la
composition du fluide à filtrer (surtout des interactions physico-chimiques entre les molécules
elles-mêmes), des conditions hydrodynamiques et de la nature du matériau membranaire.
La partie III.1 a été consacrée à l’étude de l’impact individuel des molécules des vins
identifiées comme colmatantes sur le colmatage d’une membrane céramique multicanaux
ainsi qu’à l’identification des mécanismes de colmatage. La partie III.2 sera consacrée à
l’étude de l’impact des mélanges de ces molécules (mimant le vin brut) sur le colmatage. Des
travaux préalables ont montré que la nature et le type de colmatage par certains composés
colloïdaux peuvent être modifiés par la présence d’autres composés [1-9].
Le but de cette partie est alors d’étudier l’impact du mélange de macromolécules (1.25 g/l
tanins, 0.25 g/l pectinss et 0.1 g/l mannoprotéines) sur le colmatage de la membrane en se
servant des résultats obtenuslors de la filtration des molécules étudiées individuellement.
L’étude se poursuivra sur l’étude de l’impact de la présence des particules (levures) sur le
colmatage induit par le mélange de macromolécules. Pour se faire, nous avons choisi de nous
placer dans deux situations type d’utilisation de membranes à la cave : 1) la filtration en
présence de lies de levures (dépôt de levures de fond de cuve) et 2) la filtration de vin brut
avant la mise en bouteille. Ces deux cas indiquent le choix des concentrations précitées dans
le tableau II.4.
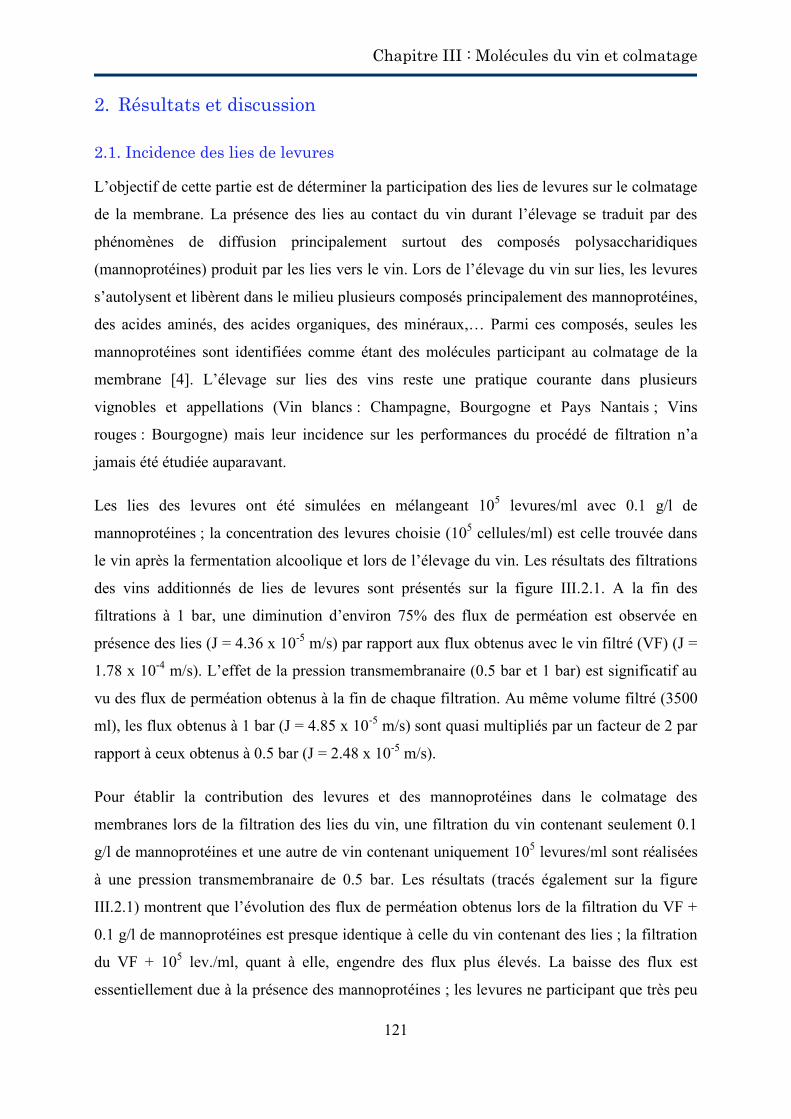
Chapitre III : Molécules du vin et colmatage
121
2. Résultats et discussion
2.1. Incidence des lies de levures
L’objectif de cette partie est de déterminer la participation des lies de levures sur le colmatage
de la membrane. La présence des lies au contact du vin durant l’élevage se traduit par des
phénomènes de diffusion principalement surtout des composés polysaccharidiques
(mannoprotéines) produit par les lies vers le vin. Lors de l’élevage du vin sur lies, les levures
s’autolysent et libèrent dans le milieu plusieurs composés principalement des mannoprotéines,
des acides aminés, des acides organiques, des minéraux,… Parmi ces composés, seules les
mannoprotéines sont identifiées comme étant des molécules participant au colmatage de la
membrane [4]. L’élevage sur lies des vins reste une pratique courante dans plusieurs
vignobles et appellations (Vin blancs : Champagne, Bourgogne et Pays Nantais ; Vins
rouges : Bourgogne) mais leur incidence sur les performances du procédé de filtration n’a
jamais été étudiée auparavant.
Les lies des levures ont été simulées en mélangeant 105 levures/ml avec 0.1 g/l de
mannoprotéines ; la concentration des levures choisie (105 cellules/ml) est celle trouvée dans
le vin après la fermentation alcoolique et lors de l’élevage du vin. Les résultats des filtrations
des vins additionnés de lies de levures sont présentés sur la figure III.2.1. A la fin des
filtrations à 1 bar, une diminution d’environ 75% des flux de perméation est observée en
présence des lies (J = 4.36 x 10⁻⁵ m/s) par rapport aux flux obtenus avec le vin filtré (VF) (J =
1.78 x 10⁻⁴ m/s). L’effet de la pression transmembranaire (0.5 bar et 1 bar) est significatif au
vu des flux de perméation obtenus à la fin de chaque filtration. Au même volume filtré (3500
ml), les flux obtenus à 1 bar (J = 4.85 x 10⁻⁵ m/s) sont quasi multipliés par un facteur de 2 par
rapport à ceux obtenus à 0.5 bar (J = 2.48 x 10⁻⁵ m/s).
Pour établir la contribution des levures et des mannoprotéines dans le colmatage des
membranes lors de la filtration des lies du vin, une filtration du vin contenant seulement 0.1
g/l de mannoprotéines et une autre de vin contenant uniquement 105 levures/ml sont réalisées
à une pression transmembranaire de 0.5 bar. Les résultats (tracés également sur la figure
III.2.1) montrent que l’évolution des flux de perméation obtenus lors de la filtration du VF +
0.1 g/l de mannoprotéines est presque identique à celle du vin contenant des lies ; la filtration
du VF + 105 lev./ml, quant à elle, engendre des flux plus élevés. La baisse des flux est
essentiellement due à la présence des mannoprotéines ; les levures ne participant que très peu
Chapitre III : Molécules du vin et colmatage
122
au colmatage. Il faut noter que, d’après ces résultats, les effets de la présence des 2 composés
ensemble ne s’additionnent pas.
Figure III.2.1 : Les effets de la présence des lies sur les flux de perméation
En traçant les courbes de résistance hydraulique totale en fonction du volume de perméat
(figure III.2.2), on remarque que les courbes obtenues lors de la filtration des lies à 0.5 bar et
1 bar se rejoignent à la fin de la filtration (volume filtré = 3500 ml). La résistance engendrée
par la filtration à 0.5 bar est plus importante que celle engendrée à 1 bar ; cependant, nous
pouvions remarquer que cet effet s’inverse à la fin de la filtration. Cette observation permet
de conclure que l’augmentation de la pression transmembranaire dans le cas de la filtration
des lies induit une augmentation du flux convectif qui par la suite entraîne une quantité
importante de matière à la surface de la membrane dont les répercussions sur le colmatage
seront plus notables dans des longs cycles de filtration. Des résultats similaires sont obtenus
par Boissier et al. [8] lors de la filtration d’un vin contenant des levures ; ils proposent la
compaction du dépôt formé par les levures pour expliquer l’augmentation de la résistance
avec la pression transmembranaire.
D’un autre côté, les évolutions des résistances du vin chargé en levures et celui chargé en
mannoprotéines et le vin additionné des lies montre qu’il existe un effet additionnel des
0.0E+00
4.0E-05
8.0E-05
1.2E-04
1.6E-04
2.0E-04
0 0.001 0.002 0.003 0.004
J (m
/s)
V (m3) VF+ lies (0.5 bar) VF + lies (1 bar)VF + lev. (0.5 bar) VF (1 bar)VF + 0.1 g/l mannop. (0.5 bar)
Chapitre III : Molécules du vin et colmatage
123
levures et mannoprotéines sur le colmatage de la membrane lors de la filtration des lies. En
effet, les résultats montrent que les lies engendrent des résistances plus élevées (≈ 23% tout au
long de la filtration) que celles obtenues avec les mannoprotéines. Alors, une partie de la
résistance induite par les levures vient s’ajouter à celle induite par les mannoprotéines.
Figure III.2.2: Evolution des résistances hydrauliques en présence des lies de levures
2.2. Impact du vin brut
Le vin brut est constitué d’un mélange de molécules en suspension interagissant entre elles.
Pour simuler le vin brut (VF + Mél. A.), le vin filtré (VF) a été additionné de 1.25 g/l tanins,
de 0.25 g/l pectinss et de 0.1 g/l mannoprotéines ; il est dépourvu de particules (en particulier
les microorganismes). A ce vin brut (VF + Mél. A) sont ajoutées 105 lev. / ml pour former le
VF + Mél. B. et 106 lev. / ml afin d’obtenir VF + Mél. C.
Tout d’abord, l’évolution des flux de perméation du VF + Mél A. en fonction du volume filtré
du vin brut est illustrée par la figure III.2.3. A 3500 ml du volume filtré, le flux obtenu à 1 bar
avec le brut (J = 1.41 x 10⁻⁵ m/s) est enivron 12 fois inférieur à celui obtenu avec le vin filtré à
la même pression (J = 1.78 x 10⁻⁴ m/s) signe d’un colmatage sévère de la membrane. Les flux
de perméation du VF + Mél A. ne sont pas affectés par l’augmentation de la pression
transmembranaire, puisqu’à l’état stationnaire, on obtient les mêmes flux de perméation à 0.5
0.0E+00
5.0E+11
1.0E+12
1.5E+12
0 0.001 0.002 0.003 0.004
Rht
(m-1
)
V (m3) VF+ lies (0.5 bar) VF + lies (1 bar)VF + lev. (0.5 bar) VF (1 bar)VF + 0.1 g/l mannop. (0.5 bar)
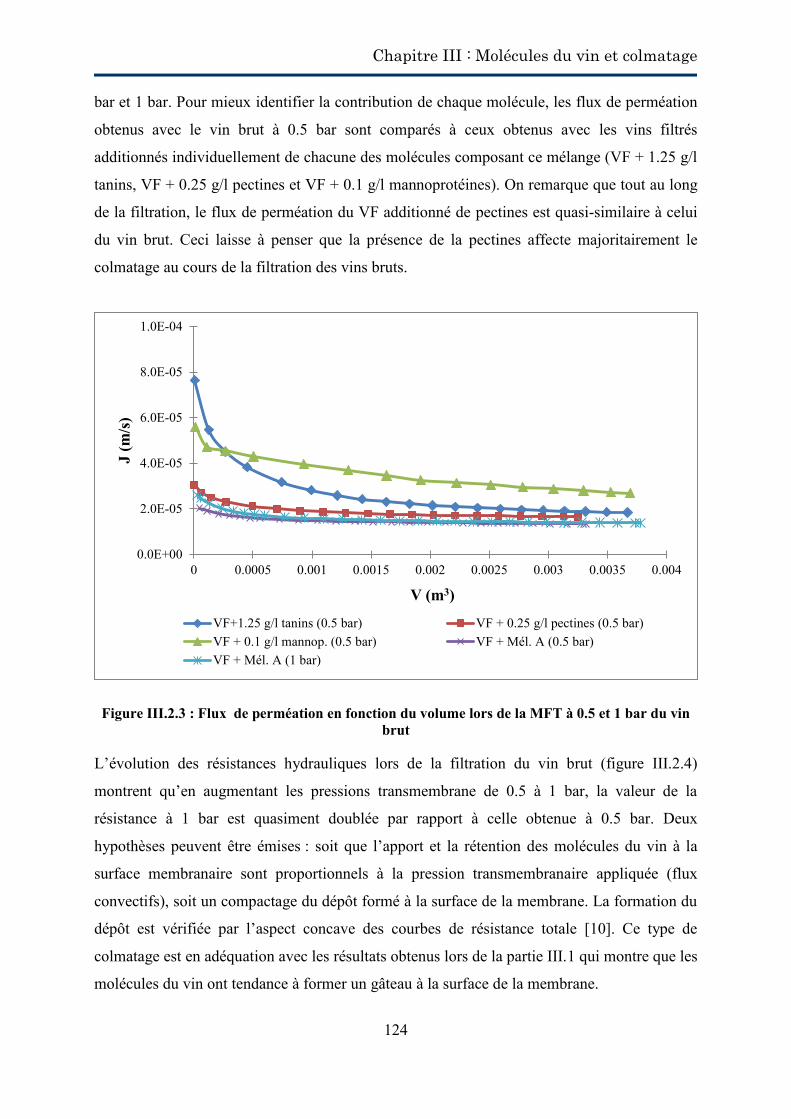
Chapitre III : Molécules du vin et colmatage
124
bar et 1 bar. Pour mieux identifier la contribution de chaque molécule, les flux de perméation
obtenus avec le vin brut à 0.5 bar sont comparés à ceux obtenus avec les vins filtrés
additionnés individuellement de chacune des molécules composant ce mélange (VF + 1.25 g/l
tanins, VF + 0.25 g/l pectines et VF + 0.1 g/l mannoprotéines). On remarque que tout au long
de la filtration, le flux de perméation du VF additionné de pectines est quasi-similaire à celui
du vin brut. Ceci laisse à penser que la présence de la pectines affecte majoritairement le
colmatage au cours de la filtration des vins bruts.
Figure III.2.3 : Flux de perméation en fonction du volume lors de la MFT à 0.5 et 1 bar du vin brut
L’évolution des résistances hydrauliques lors de la filtration du vin brut (figure III.2.4)
montrent qu’en augmentant les pressions transmembrane de 0.5 à 1 bar, la valeur de la
résistance à 1 bar est quasiment doublée par rapport à celle obtenue à 0.5 bar. Deux
hypothèses peuvent être émises : soit que l’apport et la rétention des molécules du vin à la
surface membranaire sont proportionnels à la pression transmembranaire appliquée (flux
convectifs), soit un compactage du dépôt formé à la surface de la membrane. La formation du
dépôt est vérifiée par l’aspect concave des courbes de résistance totale [10]. Ce type de
colmatage est en adéquation avec les résultats obtenus lors de la partie III.1 qui montre que les
molécules du vin ont tendance à former un gâteau à la surface de la membrane.
0.0E+00
2.0E-05
4.0E-05
6.0E-05
8.0E-05
1.0E-04
0 0.0005 0.001 0.0015 0.002 0.0025 0.003 0.0035 0.004
J (m
/s)
V (m3)
VF+1.25 g/l tanins (0.5 bar) VF + 0.25 g/l pectines (0.5 bar)VF + 0.1 g/l mannop. (0.5 bar) VF + Mél. A (0.5 bar)VF + Mél. A (1 bar)
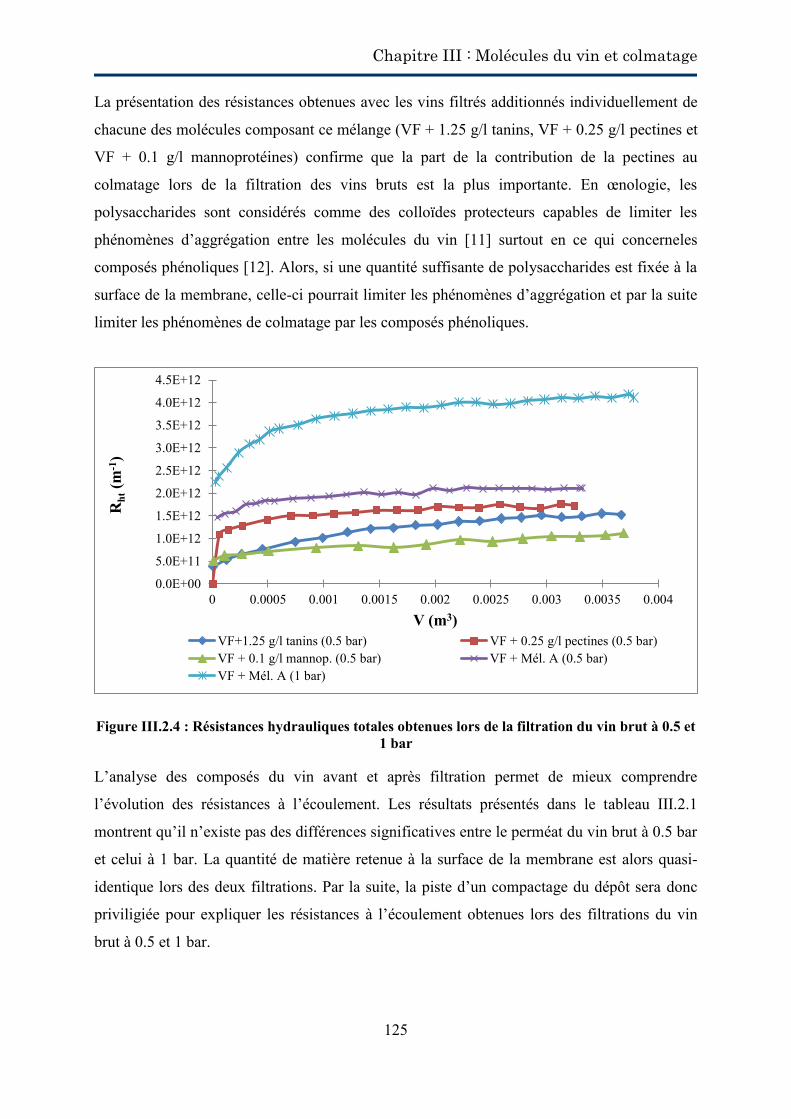
Chapitre III : Molécules du vin et colmatage
125
La présentation des résistances obtenues avec les vins filtrés additionnés individuellement de
chacune des molécules composant ce mélange (VF + 1.25 g/l tanins, VF + 0.25 g/l pectines et
VF + 0.1 g/l mannoprotéines) confirme que la part de la contribution de la pectines au
colmatage lors de la filtration des vins bruts est la plus importante. En œnologie, les
polysaccharides sont considérés comme des colloïdes protecteurs capables de limiter les
phénomènes d’aggrégation entre les molécules du vin [11] surtout en ce qui concerneles
composés phénoliques [12]. Alors, si une quantité suffisante de polysaccharides est fixée à la
surface de la membrane, celle-ci pourrait limiter les phénomènes d’aggrégation et par la suite
limiter les phénomènes de colmatage par les composés phénoliques.
Figure III.2.4 : Résistances hydrauliques totales obtenues lors de la filtration du vin brut à 0.5 et 1 bar
L’analyse des composés du vin avant et après filtration permet de mieux comprendre
l’évolution des résistances à l’écoulement. Les résultats présentés dans le tableau III.2.1
montrent qu’il n’existe pas des différences significatives entre le perméat du vin brut à 0.5 bar
et celui à 1 bar. La quantité de matière retenue à la surface de la membrane est alors quasi-
identique lors des deux filtrations. Par la suite, la piste d’un compactage du dépôt sera donc
priviligiée pour expliquer les résistances à l’écoulement obtenues lors des filtrations du vin
brut à 0.5 et 1 bar.
0.0E+00
5.0E+11
1.0E+12
1.5E+12
2.0E+12
2.5E+12
3.0E+12
3.5E+12
4.0E+12
4.5E+12
0 0.0005 0.001 0.0015 0.002 0.0025 0.003 0.0035 0.004
Rht
(m-1
)
V (m3) VF+1.25 g/l tanins (0.5 bar) VF + 0.25 g/l pectines (0.5 bar)VF + 0.1 g/l mannop. (0.5 bar) VF + Mél. A (0.5 bar)VF + Mél. A (1 bar)
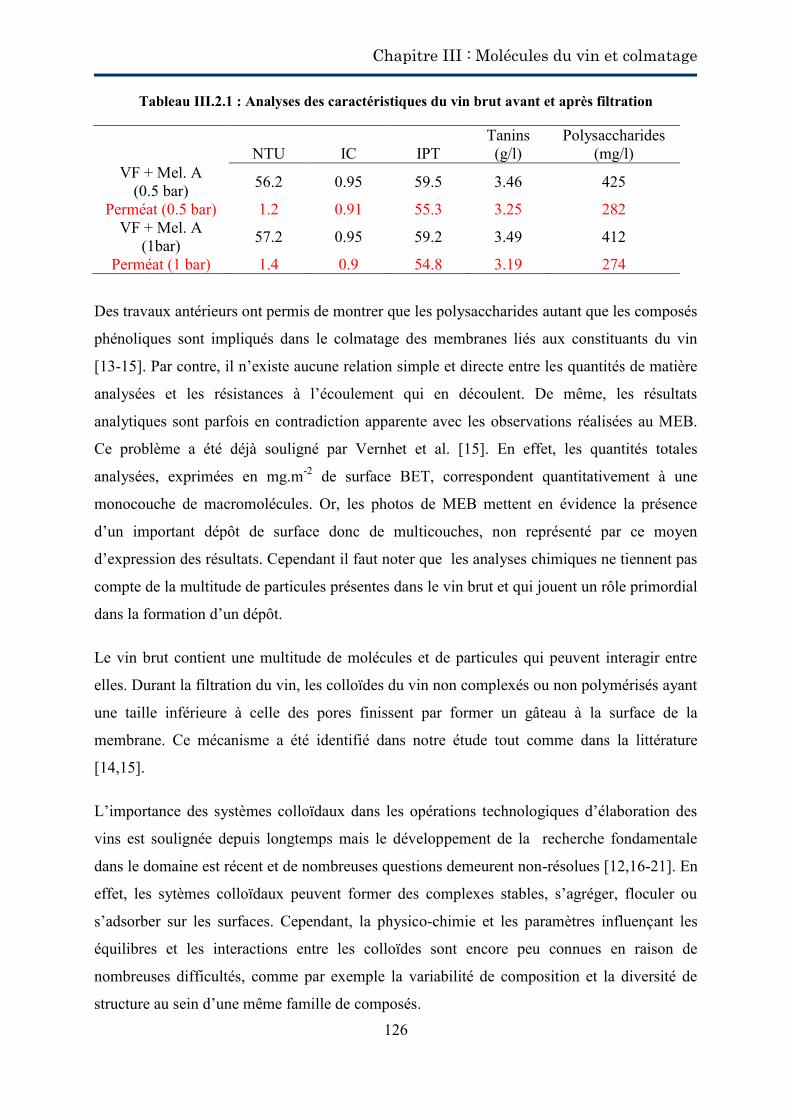
Chapitre III : Molécules du vin et colmatage
126
Tableau III.2.1 : Analyses des caractéristiques du vin brut avant et après filtration
NTU IC IPT Tanins (g/l)
Polysaccharides (mg/l)
VF + Mel. A (0.5 bar) 56.2 0.95 59.5 3.46 425
Perméat (0.5 bar) 1.2 0.91 55.3 3.25 282 VF + Mel. A
(1bar) 57.2 0.95 59.2 3.49 412
Perméat (1 bar) 1.4 0.9 54.8 3.19 274
Des travaux antérieurs ont permis de montrer que les polysaccharides autant que les composés
phénoliques sont impliqués dans le colmatage des membranes liés aux constituants du vin
[13-15]. Par contre, il n’existe aucune relation simple et directe entre les quantités de matière
analysées et les résistances à l’écoulement qui en découlent. De même, les résultats
analytiques sont parfois en contradiction apparente avec les observations réalisées au MEB.
Ce problème a été déjà souligné par Vernhet et al. [15]. En effet, les quantités totales
analysées, exprimées en mg.m-2 de surface BET, correspondent quantitativement à une
monocouche de macromolécules. Or, les photos de MEB mettent en évidence la présence
d’un important dépôt de surface donc de multicouches, non représenté par ce moyen
d’expression des résultats. Cependant il faut noter que les analyses chimiques ne tiennent pas
compte de la multitude de particules présentes dans le vin brut et qui jouent un rôle primordial
dans la formation d’un dépôt.
Le vin brut contient une multitude de molécules et de particules qui peuvent interagir entre
elles. Durant la filtration du vin, les colloïdes du vin non complexés ou non polymérisés ayant
une taille inférieure à celle des pores finissent par former un gâteau à la surface de la
membrane. Ce mécanisme a été identifié dans notre étude tout comme dans la littérature
[14,15].
L’importance des systèmes colloïdaux dans les opérations technologiques d’élaboration des
vins est soulignée depuis longtemps mais le développement de la recherche fondamentale
dans le domaine est récent et de nombreuses questions demeurent non-résolues [12,16-21]. En
effet, les sytèmes colloïdaux peuvent former des complexes stables, s’agréger, floculer ou
s’adsorber sur les surfaces. Cependant, la physico-chimie et les paramètres influençant les
équilibres et les interactions entre les colloïdes sont encore peu connues en raison de
nombreuses difficultés, comme par exemple la variabilité de composition et la diversité de
structure au sein d’une même famille de composés.
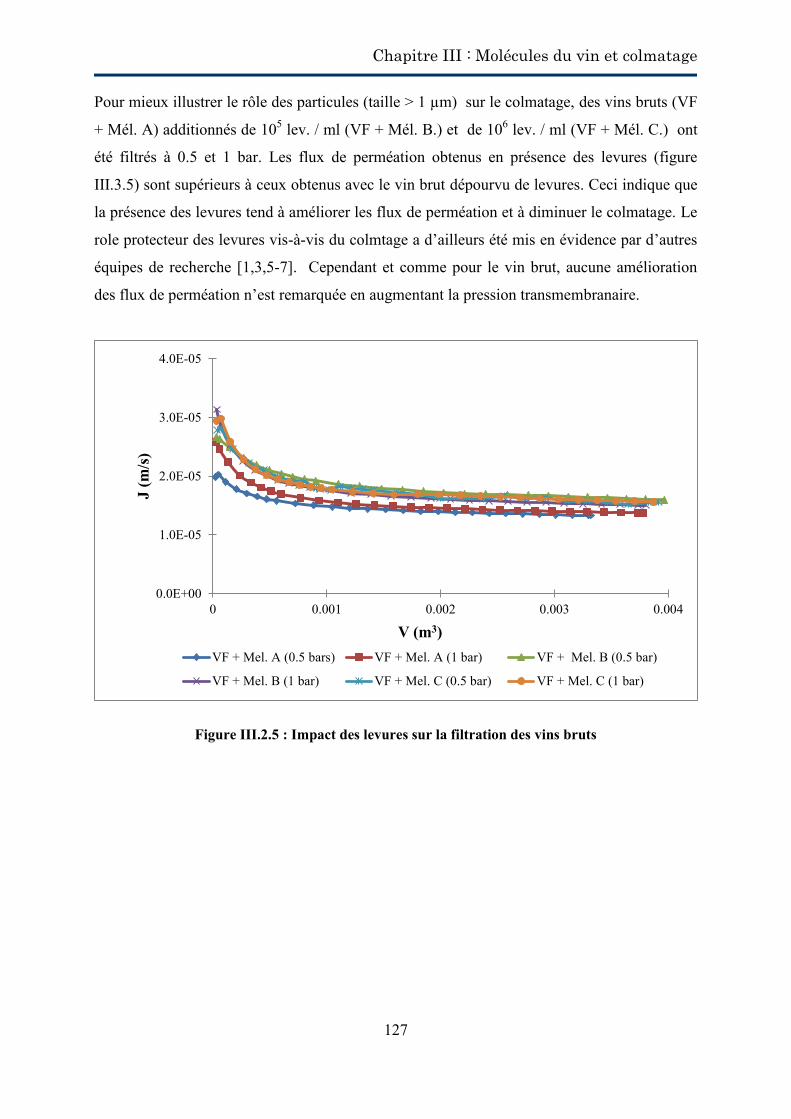
Chapitre III : Molécules du vin et colmatage
127
Pour mieux illustrer le rôle des particules (taille > 1 µm) sur le colmatage, des vins bruts (VF
+ Mél. A) additionnés de 105 lev. / ml (VF + Mél. B.) et de 106 lev. / ml (VF + Mél. C.) ont
été filtrés à 0.5 et 1 bar. Les flux de perméation obtenus en présence des levures (figure
III.3.5) sont supérieurs à ceux obtenus avec le vin brut dépourvu de levures. Ceci indique que
la présence des levures tend à améliorer les flux de perméation et à diminuer le colmatage. Le
role protecteur des levures vis-à-vis du colmtage a d’ailleurs été mis en évidence par d’autres
équipes de recherche [1,3,5-7]. Cependant et comme pour le vin brut, aucune amélioration
des flux de perméation n’est remarquée en augmentant la pression transmembranaire.
Figure III.2.5 : Impact des levures sur la filtration des vins bruts
0.0E+00
1.0E-05
2.0E-05
3.0E-05
4.0E-05
0 0.001 0.002 0.003 0.004
J (m
/s)
V (m3) VF + Mel. A (0.5 bars) VF + Mel. A (1 bar) VF + Mel. B (0.5 bar)
VF + Mel. B (1 bar) VF + Mel. C (0.5 bar) VF + Mel. C (1 bar)
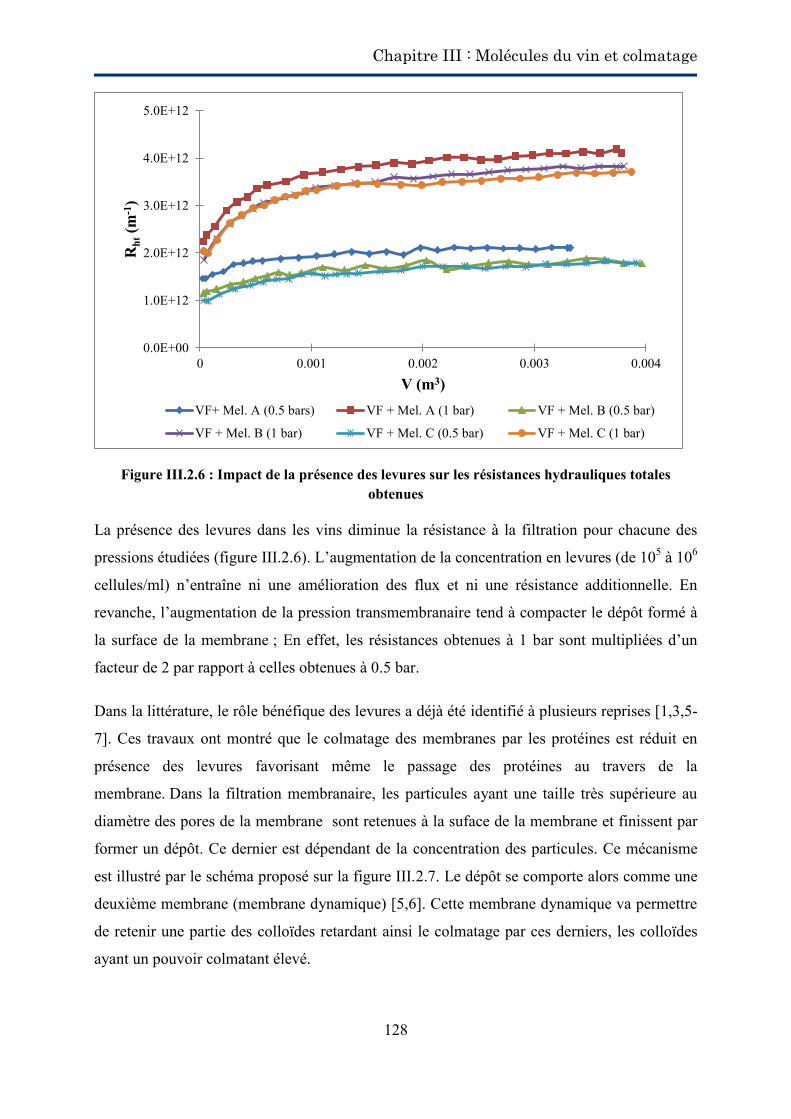
Chapitre III : Molécules du vin et colmatage
128
Figure III.2.6 : Impact de la présence des levures sur les résistances hydrauliques totales obtenues
La présence des levures dans les vins diminue la résistance à la filtration pour chacune des
pressions étudiées (figure III.2.6). L’augmentation de la concentration en levures (de 105 à 106
cellules/ml) n’entraîne ni une amélioration des flux et ni une résistance additionnelle. En
revanche, l’augmentation de la pression transmembranaire tend à compacter le dépôt formé à
la surface de la membrane ; En effet, les résistances obtenues à 1 bar sont multipliées d’un
facteur de 2 par rapport à celles obtenues à 0.5 bar.
Dans la littérature, le rôle bénéfique des levures a déjà été identifié à plusieurs reprises [1,3,5-
7]. Ces travaux ont montré que le colmatage des membranes par les protéines est réduit en
présence des levures favorisant même le passage des protéines au travers de la
membrane. Dans la filtration membranaire, les particules ayant une taille très supérieure au
diamètre des pores de la membrane sont retenues à la suface de la membrane et finissent par
former un dépôt. Ce dernier est dépendant de la concentration des particules. Ce mécanisme
est illustré par le schéma proposé sur la figure III.2.7. Le dépôt se comporte alors comme une
deuxième membrane (membrane dynamique) [5,6]. Cette membrane dynamique va permettre
de retenir une partie des colloïdes retardant ainsi le colmatage par ces derniers, les colloïdes
ayant un pouvoir colmatant élevé.
0.0E+00
1.0E+12
2.0E+12
3.0E+12
4.0E+12
5.0E+12
0 0.001 0.002 0.003 0.004
Rht
(m-1
)
V (m3) VF+ Mel. A (0.5 bars) VF + Mel. A (1 bar) VF + Mel. B (0.5 bar)
VF + Mel. B (1 bar) VF + Mel. C (0.5 bar) VF + Mel. C (1 bar)
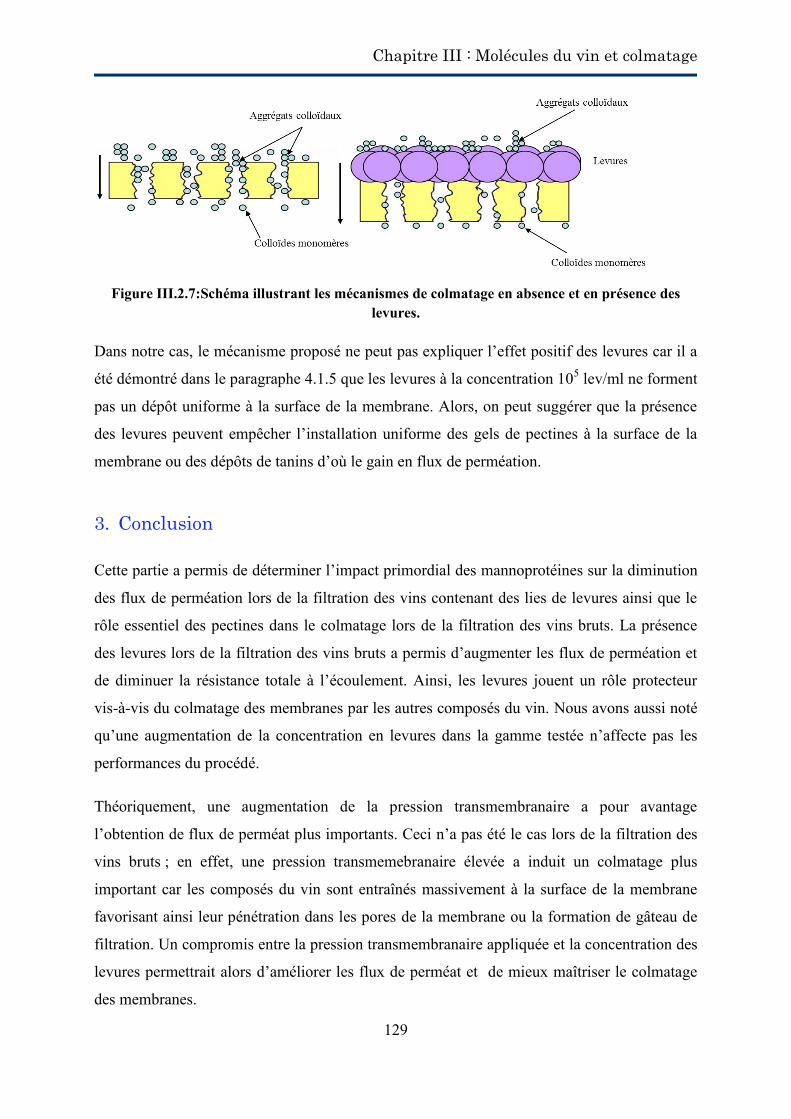
Chapitre III : Molécules du vin et colmatage
129
Figure III.2.7:Schéma illustrant les mécanismes de colmatage en absence et en présence des
levures. Dans notre cas, le mécanisme proposé ne peut pas expliquer l’effet positif des levures car il a
été démontré dans le paragraphe 4.1.5 que les levures à la concentration 105 lev/ml ne forment
pas un dépôt uniforme à la surface de la membrane. Alors, on peut suggérer que la présence
des levures peuvent empêcher l’installation uniforme des gels de pectines à la surface de la
membrane ou des dépôts de tanins d’où le gain en flux de perméation.
3. Conclusion
Cette partie a permis de déterminer l’impact primordial des mannoprotéines sur la diminution
des flux de perméation lors de la filtration des vins contenant des lies de levures ainsi que le
rôle essentiel des pectines dans le colmatage lors de la filtration des vins bruts. La présence
des levures lors de la filtration des vins bruts a permis d’augmenter les flux de perméation et
de diminuer la résistance totale à l’écoulement. Ainsi, les levures jouent un rôle protecteur
vis-à-vis du colmatage des membranes par les autres composés du vin. Nous avons aussi noté
qu’une augmentation de la concentration en levures dans la gamme testée n’affecte pas les
performances du procédé.
Théoriquement, une augmentation de la pression transmembranaire a pour avantage
l’obtention de flux de perméat plus importants. Ceci n’a pas été le cas lors de la filtration des
vins bruts ; en effet, une pression transmemebranaire élevée a induit un colmatage plus
important car les composés du vin sont entraînés massivement à la surface de la membrane
favorisant ainsi leur pénétration dans les pores de la membrane ou la formation de gâteau de
filtration. Un compromis entre la pression transmembranaire appliquée et la concentration des
levures permettrait alors d’améliorer les flux de perméat et de mieux maîtriser le colmatage
des membranes.
Chapitre III : Molécules du vin et colmatage
130
Références
[1] N. Arora, R.H. Davis, Yeast cake layers as secondary membranes in dead-end microfiltration of bovine serum albumin, J. Membr. Sci. 92 (1994) 247-256. [2] R. Jiraratananon, D. Uttapap and C. Tangamornsuksun, Self-forming dynamic membrane for ultrafiltration of pineapple juice, J. Membr. Sci. 129 (1997) 135-143. [3] V.T. Kuberkar, R.H. Davis, Effects of added yeast on protein transmission on flux in cross-flow membrane microfiltration, Biotechnol. Prog. 15 (1999) 472-479. [4] A. Vernhet, P. Pellerin, M.P. Belleville, J. Planque, M. Moutounet, Relative impact of major wine polysaccharides on the performances of an organic microfiltration membrane, Am. J. Enol. Vitic. 50 (1999) 51-56. [5] C. Guell, P. Czekaj, R.H. Davis, Microfiltration of protein mixtures and the effects of yeast on membrane fouling, J. Membr. Sci. 155 (1999) 113-122. [6] V.T. Kuberkar, R.H. Davis, Modeling of fouling reduction by secondary membranes, J. Membr. Sci. 168 (2000) 243-258. [7] V.T. Kuberkar, R.H. Davis, Microfiltration of protein-cell mixtures with corssflushing or backflushing, J. Membr. Sci. 183 (2001) 1-14. [8] B. Boissier, F. Lutin, M. Moutounet, A. Vernhet, Particles deposition during the cross-flow microfiltration of red wines-incidence of the hydrodynamic conditions and of the yeast to fines ratio, Chem. Eng. Process. 47 (2008) 276-286. [9] M. Zator, M. Ferrando, F. Lopez, C. Guell, Microfiltration of protein/dextran/polyphenol solutions: Characterization of fouling and chemical cleaning efficiency using confocal microscopy, J: Membr. Sci. 344 (2009) 82-91. [10] E.M. Tracey, R.H. Davis, (Protein fouling of track-etched polycarbonate microfiltration membranes. J. Colloid Interface Sci., 167 (1994) 104-116. [11] Ribéreau-Gayon, P., Glories, Y., Maujean, A., & Dubourdieu D. (2006). Handbook of enology Volume 2 : The chemistry of wine, stabilization and treatments (2nd ed.). Dunod, Paris. [12] V. Riou, A. Vernhet, T. Doco, M. Moutounet, Aggregation of grape seed tannins in model wine-effect of wine polysaccharides, Food Hydrocolloids, 16 (2002) 17-23. [13] P.J. Cameira Dos Santos, Colmatage en microfiltration tangentielle: mise en evidence d’interactions entre les polysaccharides et les polyphénols d’un vin et des membranes polymériques, Ph. D. Thesis. University of Montpellier II. Ecole Nationale Supérieure Agronomique de Montpellier, 1995. [14] A. Vernhet, D. Cartalade, M. Moutounet, Contribution to the understanding of fouling build-up during microfiltration of wines, J. Membr. Sci. 211 (2003) 357-370. [15] A. Vernhet, M. Moutounet, Fouling of organic microfiltration membranes by wine constituents: importance, relative impact of wine polysaccharides and polyphenols and incidence of membrane properties, J. Membr. Sci. 201 (2002) 103-122. [16] J.M. McRae, J.A. Kennedy, Wine and grape tannin interactions with salivary proteins and their impact on astringency: a review of current research. Molecules 16 (2011) 2348-2364. [17] N.J. Baxter, T.H. Lilley, E. Haslam, M.P. Williamson, Multiple interactions between polyphenols and a salivary proline-rich protein repeat result in complexation and precipitation, Biochemistry 36 (1997) 5566-5577. [18] H. Fulcrand, M. Dueñas, E. Salas, V. Cheynier, Phenolic reactions during winemaking and aging, Am. J. Enol. Vitiv. 57 (2006) 289-297. [19] V. Cheynier, M. Dueñas-Paton, E. Salas, C. Maury, J-M. Souquet, P. Sarni-Manchado, H. Fulcrand, Structure and properties of wine pigments and tannins, Am. J. Enol. Vitic. 57 (2006) 298-305.
Chapitre III : Molécules du vin et colmatage
131
[20] C. Poncet-Legrand, D. Cartalade, J-L. Putaux, V. Cheynier, A. Vernhet, Flavan-3-ol aggregation in model ethanolic solutions : incidence of polyphenol structure, concentration, ethanol content, and ionic strength, Langmiur 19 (2003) 10563-10572. [21] I. Pianet, Y. André, M-A. Ducasse, I. Tarascou, J-C. Lartigue, N. Pinaud, E. Fouquet, E.J. Dufourc, M. Laguerre, Modeling Procyanidin self-association processes and understanding their micellar organization : a study by diffusion NMR and molecular mechanics, Langmiur 24 (2008) 10027-11035.
Chapitre IV:
Conditions critiques de
colmatage
Chapitre IV : Conditions critiques de colmatage
133
Préambule
Les coûts de fonctionnement dans les opérations de microfiltration tangentielle du vin restent
élevés. Or, une grande partie des coûts de fonctionnement de la filtration par membranes est
due au colmatage. Ce coût apparaît de deux façons différentes : une directe due à la
diminution du flux de perméation et une indirecte due au nettoyage des membranes. En
fonction du fluide traité, le nettoyage pourra être soit mécanique (rétro-lavage) soit chimique
ce qui entraîne nécessairement un arrêt du procédé. La diminution de ces coûts par une
meilleure maîtrise du colmatage permettrait donc aux techniques membranaires de mieux
s’installer dans le secteur vinicole.
Il est donc important d’adapter les conditions opératoires de filtration dans le but de réduire le
colmatage. Le flux critique peut être un paramètre clef de ce contrôle étant donné qu’il est à la
fois fonction de l’hydrodynamique (balayage tangentiel) et de la physico-chimie (interactions
membrane soluté). Le flux critique pour l’irréversibilité (Jci) est défini comme le flux de
perméat au-delà duquel un colmatage irréversible apparaît à la surface de la membrane. La
détermination de ce flux permettra de définir deux zones de conditions opératoires : une zone
où le colmatage reste très limité et où les nettoyages sont peu nombreux et une autre zone où
le colmatage conditionne le fonctionnement du procédé.
Les conditions critiques opératoires ont été étudiées au cours de la microfiltration tangentielle
du vin en utilisant une membrane céramique multicanaux. L’objectif est de déterminer les
conditions opératoires critiques afin de limiter le colmatage induit par les colloïdes du vin
(tannins, pectines et mannoprotéines) et d’améliorer les performances du procédé. Pour y
parvenir, la méthode SWB (Square Wave Barovelocimetry) a été utilisée. Elle est basée sur
l’application des échelons de pression avec des variations positives et négatives permettant
ainsi la détermination de la part réversible et irréversible du colmatage.
La suite du chapitre sera présentée sous forme d’un article scientifique resoumis après une
première révision au Journal of Membrane Science
Chapitre IV : Conditions critiques de colmatage
134
Cross-flow microfiltration of wine: Effect of colloids on critical fouling
conditions (Article accepté au Journal of Membrane Science 386 (2011) 177-186)
Abstract
Critical fouling conditions were studied during wine cross-flow microfiltration using a
multichannel ceramic membrane (0.2 µm). The aim was to determine critical operating
conditions in order to limit fouling caused by wine colloids (tannins, pectins and
mannoproteins) and enhance process performances. The method used is a square wave
filtration based on the determination of the reversibility and irreversibility of fouling.
Filtrations were performed with filtered red wine (FW) added with different concentrations of
colloids. Considering FW, critical flux for irreversibility was beyond the studied range of
pressure (≥ 1.4 x 10⁻⁴ m/s). No clear critical flux could be determined for any of the tested
molecules in the studied range of pressure. On other hand, an upper limit of fluxes range has
been identified (below which critical flux could be found). Irreversible fouling always takes
place from the beginning of the filtrations and even at low pressures. For FW containing 0.2
g/l mannoproteins and 0.5 g/l pectins, a loss of average fluxes is observed beyond a given
limit of transmembrane pressure. This fact was attributed to the compaction of a gel layer.
Finally, a criterion (Rif/Rm ≤ 1) has been suggested to determine the so-called “threshold flux”
below it, fouling remains acceptable.
Keywords: cross-flow microfiltration, wine colloids, critical flux, polysaccharides, tannins
Chapitre IV : Conditions critiques de colmatage
135
1. Introduction
After alcoholic and malolactic fermentations, the crude wine is a complex medium presenting
a turbid aspect that is not well accepted by the consumer; therefore, it needs to be clarified. In
order to have a limpid wine, the wine makers implement successive solid-liquid separations
using traditional technologies such as centrifugation, dead-end filtration (filter presses,
filtration on sheets, diatomaceous earth filtration) and the use of exogenic additives.
Nowadays, diatomaceous earth is classified as dangerous substances due to the presence of
crystalline silica [1]. Diatomaceous earth has also a negative impact on environment; after
uses, it cannot be disposed but it must be transported to waste disposal sites to be treated. So,
environmental and health restrictions force the oenology sector to search for alternative
techniques to traditional filtrations. Cross-flow microfiltration could then represent this
alternative. Indeed, this technology can substitute a one-step procedure to the conventional
processes which imply several filtration steps on diatomaceous earth previous to the final
microbial stabilization obtained by dead end filtration on sheets or membranes [2]. In addition
to a great simplification of the wine processing line, cross-flow microfiltration offers a
number of additional advantages such as elimination of earth use and its associated
environmental problems as well as the combination of clarification, stabilization and sterile
filtration in one single continuous operation.
Conventionally, the cross-flow microfiltration development in wine filtration has long been
hampered by significant fouling of the membrane. Poor performances, high costs, and risk of
excessive retention of some components are the main consequences of fouling, leading
sometimes to a loss of some organoleptic characters. Membrane fouling during filtration of
complex fluids such as fermented food products (wine, beer) is the result of interplay of
several mechanisms. These latter could be divided into [3,4]:
- Internal fouling by small particles and colloids as adsorption and pore plugging within
the internal structure of pores;
- External fouling by particles, macromolecules and macromolecules aggregates as pore
blocking and cake formation.
The main drawback in wine filtration lies in the difficulty to understand wine filterability and
the reproducibility of the filtrations. Many advances have been made by researchers especially
in identification of wine components responsible of fouling and in impact of membrane
Chapitre IV : Conditions critiques de colmatage
136
materials [5-10]. But, there still a lack of knowledge of the mechanisms causing fouling. The
influence of the operating conditions on these mechanisms is then non-elucidated and
mastering the process is not easy.
Membrane surface fouling could be characterised with regard to its reversibility. A reversible
accumulation will be removed when the transmembrane pressure is decreased. An irreversible
deposition will be removed only by a physical or chemical cleaning and will remain when the
pressure is released. The limit between reversible and irreversible fouling depends on the flux
value. The threshold value for which the reversible fouling turns into irreversible fouling is
called as “critical flux”.
In food industry, there were many attempts to determine a critical flux. Gésan-Guiziou et al.
[11] showed while cross-flow microfiltration of skimmed milk that a critical ratio of permeate
flux over wall shear stress could be determined (0.95 l/h.m².bar) above it an irreversible
deposition is observed. Youravong et al. [12] evaluated the critical flux in ultrafiltration of
skimmed milk by plotting critical flux versus the ratio of wall shear stress over protein
concentration. They showed a linear relationship between critical and wall shear stress/
protein concentration. De Brujin and Borquez [13] showed that no critical flux was reached
during ultrafiltration of apple juice with their operating conditions. But, their simulations have
showed that no cake formation was observed at a tangential velocity of 7.4 m/s and
transmembrane pressure of 150 kPa (Jcritical = 6.8 x 10⁻⁵ m/s). The filtration conditions used in
these works (very high temperature 50-55°C, very high tangential velocity up to 7 m/s) cannot
be applied to wine filtration because it would have hugely modified wine quality.
The objective of this study is to investigate and search for some critical operating conditions
in wine cross-flow microfiltration. It has been identified that substances like polysaccharides
(pectins and mannoproteins), polyphenols and proteins are involved in membrane fouling [5-
9] but little information concerning the individual impact on fouling and the mechanisms
involved are available. The aim of this study is to limit fouling due to wine colloids (tannins,
pectins and mannoproteins) and enhance process performances. The chosen study protocol
was to evaluate the critical fouling conditions for each of the fouling molecules. This situation
doesn’t represent a real wine but it is a first step towards understanding real wine critical
filtration conditions. The method used was a square wave filtration which allows the
determination of the extent of fouling reversibility during wine cross-flow microfiltration.
Chapitre IV : Conditions critiques de colmatage
137
This method enabled the distinction between reversible and irreversible fouling as well as the
calculation of a more accurate value of the critical flux.
2. Background
The first definitions of the critical flux concept appeared in 1995. The critical flux concept
was defined as “the flux below which no fouling occurs” [14], as “the flux below which a
decline of flux with time does not occur; above it fouling is observed” [15] or as “a flux
below which there is no fouling by colloidal particles” [16].
There are two forms of critical flux: strong and weak forms [15,17]. The strong form is the
flux at which the transmembrane pressure starts to deviate from the pure water line, which is
of course linear. The strong form of critical flux has been developed to discriminate no
fouling conditions. The weak form of critical flux is characterized by a very rapid fouling on
the start-up and the flux-transmembrane pressure relationship is below that of the pure water
line. The weak form of critical flux is the point at which this line becomes non-linear.
In 2006, Bacchin et al. [18] refined the definitions of critical flux and another term has been
added as critical flux for irreversibility Jci. This term was explained by the transition between
concentration polarisation layer to the deposit layer. Figure IV.1, as seen by authors,
illustrates the concept of this critical flux for irreversibility. When filtering at a flux below the
critical flux, the colloidal system is usually stable as the result of repulsive interactions
(interparticle or particle-membrane) overcoming the drag force (induced by the movement of
solvent through the membrane). Beyond a given value of permeate flux (critical flux), when
the repulsive forces are overwhelmed by the drag forces, a deposit appears and creates
hydraulic resistance. This phenomenon of deposit formation is not instantaneous and may take
several minutes to several hours to settle depending on the operating conditions and the type
of particles.
Mathematically, the irreversibility form of critical flux (Jci) can be defined by:
For J < Jci :
(IV.1)
If adsorption takes place:
(IV.2)
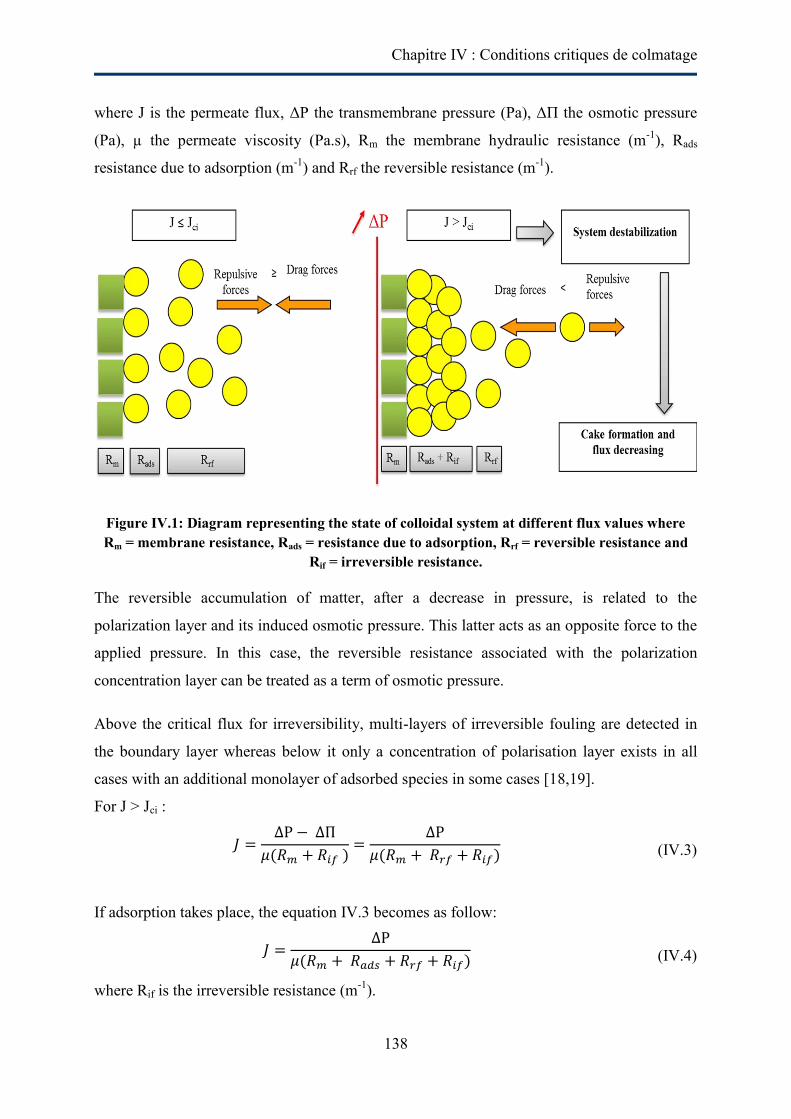
Chapitre IV : Conditions critiques de colmatage
138
where J is the permeate flux, ΔP the transmembrane pressure (Pa), ΔΠ the osmotic pressure
(Pa), µ the permeate viscosity (Pa.s), Rm the membrane hydraulic resistance (m-1), Rads
resistance due to adsorption (m-1) and Rrf the reversible resistance (m-1).
Figure IV.1: Diagram representing the state of colloidal system at different flux values where Rm = membrane resistance, Rads = resistance due to adsorption, Rrf = reversible resistance and
Rif = irreversible resistance.
The reversible accumulation of matter, after a decrease in pressure, is related to the
polarization layer and its induced osmotic pressure. This latter acts as an opposite force to the
applied pressure. In this case, the reversible resistance associated with the polarization
concentration layer can be treated as a term of osmotic pressure.
Above the critical flux for irreversibility, multi-layers of irreversible fouling are detected in
the boundary layer whereas below it only a concentration of polarisation layer exists in all
cases with an additional monolayer of adsorbed species in some cases [18,19].
For J > Jci :
(IV.3)
If adsorption takes place, the equation IV.3 becomes as follow:
(IV.4)
where Rif is the irreversible resistance (m-1).
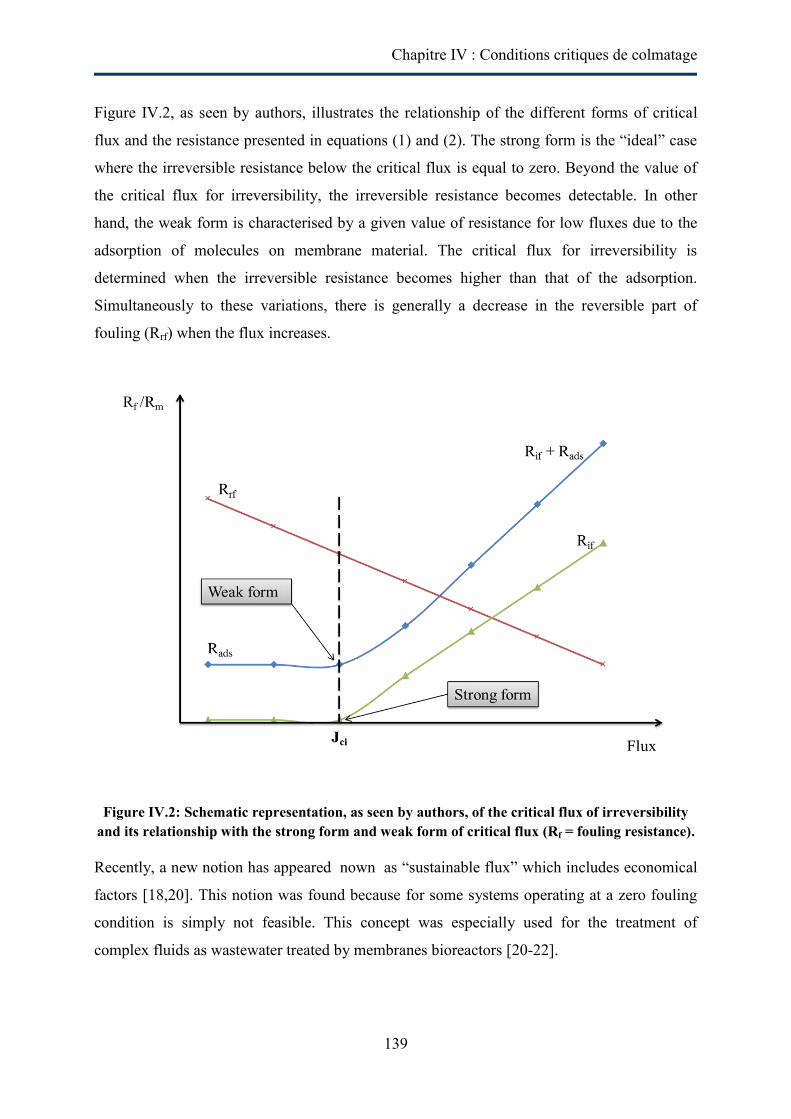
Chapitre IV : Conditions critiques de colmatage
139
Figure IV.2, as seen by authors, illustrates the relationship of the different forms of critical
flux and the resistance presented in equations (1) and (2). The strong form is the “ideal” case
where the irreversible resistance below the critical flux is equal to zero. Beyond the value of
the critical flux for irreversibility, the irreversible resistance becomes detectable. In other
hand, the weak form is characterised by a given value of resistance for low fluxes due to the
adsorption of molecules on membrane material. The critical flux for irreversibility is
determined when the irreversible resistance becomes higher than that of the adsorption.
Simultaneously to these variations, there is generally a decrease in the reversible part of
fouling (Rrf) when the flux increases.
Figure IV.2: Schematic representation, as seen by authors, of the critical flux of irreversibility and its relationship with the strong form and weak form of critical flux (Rf = fouling resistance).
Recently, a new notion has appeared nown as “sustainable flux” which includes economical
factors [18,20]. This notion was found because for some systems operating at a zero fouling
condition is simply not feasible. This concept was especially used for the treatment of
complex fluids as wastewater treated by membranes bioreactors [20-22].
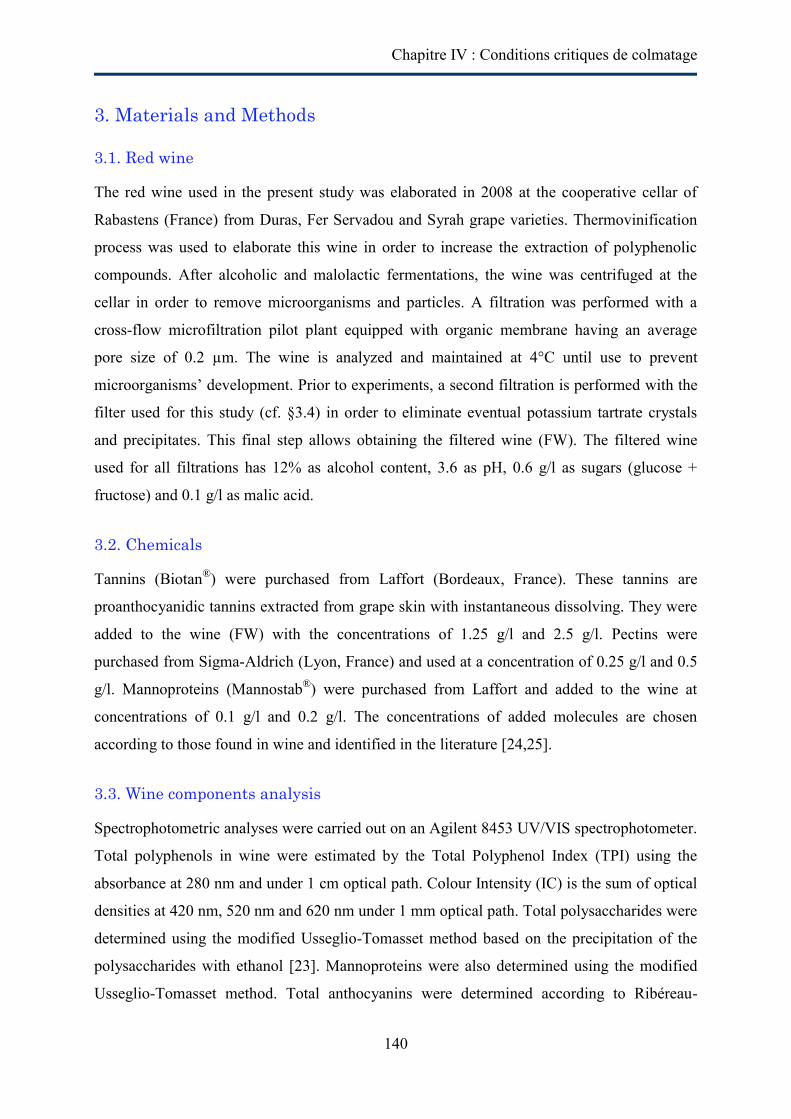
Chapitre IV : Conditions critiques de colmatage
140
3. Materials and Methods
3.1. Red wine
The red wine used in the present study was elaborated in 2008 at the cooperative cellar of
Rabastens (France) from Duras, Fer Servadou and Syrah grape varieties. Thermovinification
process was used to elaborate this wine in order to increase the extraction of polyphenolic
compounds. After alcoholic and malolactic fermentations, the wine was centrifuged at the
cellar in order to remove microorganisms and particles. A filtration was performed with a
cross-flow microfiltration pilot plant equipped with organic membrane having an average
pore size of 0.2 µm. The wine is analyzed and maintained at 4°C until use to prevent
microorganisms’ development. Prior to experiments, a second filtration is performed with the
filter used for this study (cf. §3.4) in order to eliminate eventual potassium tartrate crystals
and precipitates. This final step allows obtaining the filtered wine (FW). The filtered wine
used for all filtrations has 12% as alcohol content, 3.6 as pH, 0.6 g/l as sugars (glucose +
fructose) and 0.1 g/l as malic acid.
3.2. Chemicals
Tannins (Biotan®) were purchased from Laffort (Bordeaux, France). These tannins are
proanthocyanidic tannins extracted from grape skin with instantaneous dissolving. They were
added to the wine (FW) with the concentrations of 1.25 g/l and 2.5 g/l. Pectins were
purchased from Sigma-Aldrich (Lyon, France) and used at a concentration of 0.25 g/l and 0.5
g/l. Mannoproteins (Mannostab®) were purchased from Laffort and added to the wine at
concentrations of 0.1 g/l and 0.2 g/l. The concentrations of added molecules are chosen
according to those found in wine and identified in the literature [24,25].
3.3. Wine components analysis
Spectrophotometric analyses were carried out on an Agilent 8453 UV/VIS spectrophotometer.
Total polyphenols in wine were estimated by the Total Polyphenol Index (TPI) using the
absorbance at 280 nm and under 1 cm optical path. Colour Intensity (IC) is the sum of optical
densities at 420 nm, 520 nm and 620 nm under 1 mm optical path. Total polysaccharides were
determined using the modified Usseglio-Tomasset method based on the precipitation of the
polysaccharides with ethanol [23]. Mannoproteins were also determined using the modified
Usseglio-Tomasset method. Total anthocyanins were determined according to Ribéreau-
Chapitre IV : Conditions critiques de colmatage
141
Gayon method using the sodium bisulphite [24]. Total tannins were also determined
according to Ribéreau-Gayon method by transforming the proanthocyanidins into
anthocyanidins [24]. pH, % of alcohol, malic acid, glucose and fructose concentration were
determined on the wine by FTIR spectroscopy (Fourier Transform Infra-Red spectroscopy).
Wine viscosity is determined with a controlled-stress rheometer (AR-2000 ex). Turbidity
measurements (NTU) were performed with a Eutech TN-100 turbidimeter.
Table IV.1 shows the analytical composition of the wine before adding molecules (FW) and
after adding molecules. A net increase in TPI, IC and turbidity is observed after addition of
tannins. It should be noted that about 80% of total tannins are found after adding tannins
powder. This was explained by the assays conducted on tannins powder which show that it
contains 80% tannins and is free of polysaccharides. The other compounds are organic acids,
sugars, minerals and vitamins which are not involved in membrane fouling during
microfiltration. On the other side, the determination of total polysaccharides in wines FW +
pectins and FW + mannoproteins shows that the amounts of measured polysaccharides are
equivalent to those added [24,25].
Table IV.1: Analytical composition of wine added with tested molecules.
TPI Total
Anthocyanins (mg/l)
Total tannins (g/l)
Total polysaccharides
(mg/l) IC
Turbidity (NTU)
FW 44.9
(± 0.5) 349
(± 3.42) 2.45
(± 0.16) 60
(± 30) 0.88
(± 0.07) 0.1
(± 0.2) FW + 1.25 g/l
tannins 59 355
3.49 (± 0.1)
64 0.93 38.7
FW + 2.5 g/l tannins
73 360 4.45
(± 0.15) 68 0.99 72.5
FW + 0.25 g/l pectins
45.1 n.d. 2.45 320 0.85 12.2
FW + 0.5 g/l pectins
44.7 n.d. 2.4 510 0.85 18
FW + 0.1 g/l mannoproteins
44.8 n.d. 2.46 165 n.d. 4.5
FW + 0.2 g/l mannoproteins
44.5 n.d. 2.45 275 0.84 8.5
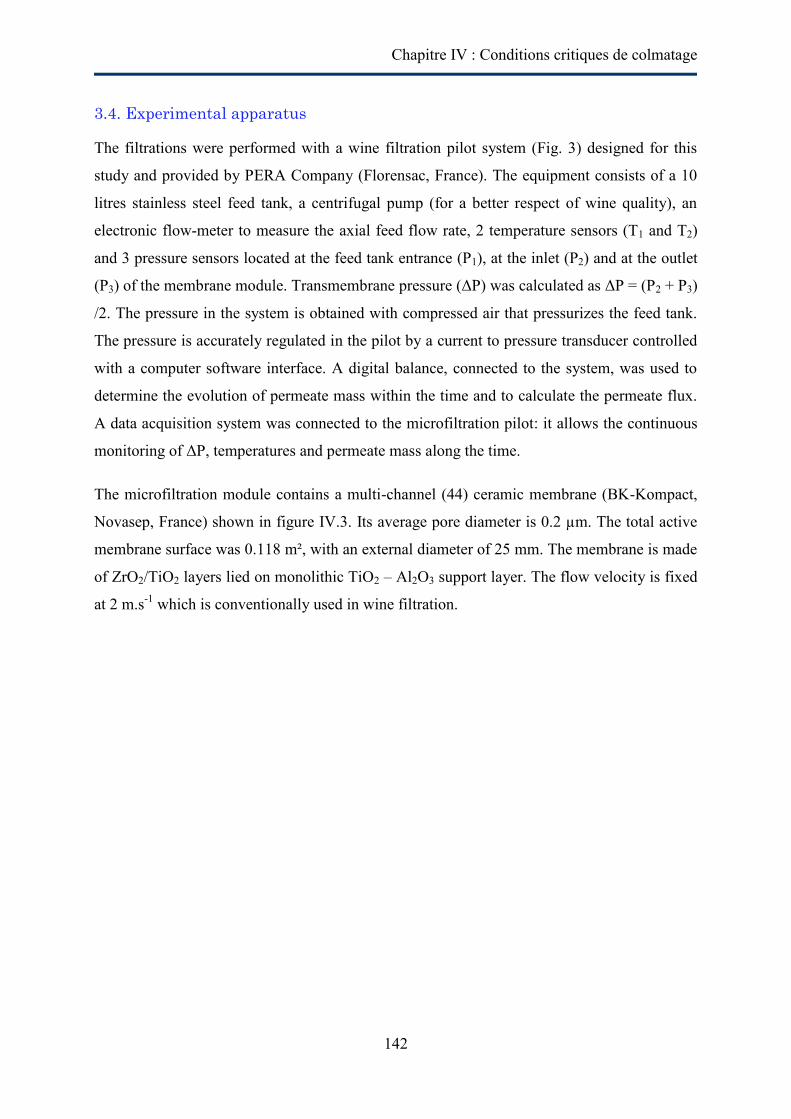
Chapitre IV : Conditions critiques de colmatage
142
3.4. Experimental apparatus
The filtrations were performed with a wine filtration pilot system (Fig. 3) designed for this
study and provided by PERA Company (Florensac, France). The equipment consists of a 10
litres stainless steel feed tank, a centrifugal pump (for a better respect of wine quality), an
electronic flow-meter to measure the axial feed flow rate, 2 temperature sensors (T1 and T2)
and 3 pressure sensors located at the feed tank entrance (P1), at the inlet (P2) and at the outlet
(P3) of the membrane module. Transmembrane pressure (ΔP) was calculated as ΔP = (P2 + P3)
/2. The pressure in the system is obtained with compressed air that pressurizes the feed tank.
The pressure is accurately regulated in the pilot by a current to pressure transducer controlled
with a computer software interface. A digital balance, connected to the system, was used to
determine the evolution of permeate mass within the time and to calculate the permeate flux.
A data acquisition system was connected to the microfiltration pilot: it allows the continuous
monitoring of ΔP, temperatures and permeate mass along the time.
The microfiltration module contains a multi-channel (44) ceramic membrane (BK-Kompact,
Novasep, France) shown in figure IV.3. Its average pore diameter is 0.2 µm. The total active
membrane surface was 0.118 m², with an external diameter of 25 mm. The membrane is made
of ZrO2/TiO2 layers lied on monolithic TiO2 – Al2O3 support layer. The flow velocity is fixed
at 2 m.s-1 which is conventionally used in wine filtration.
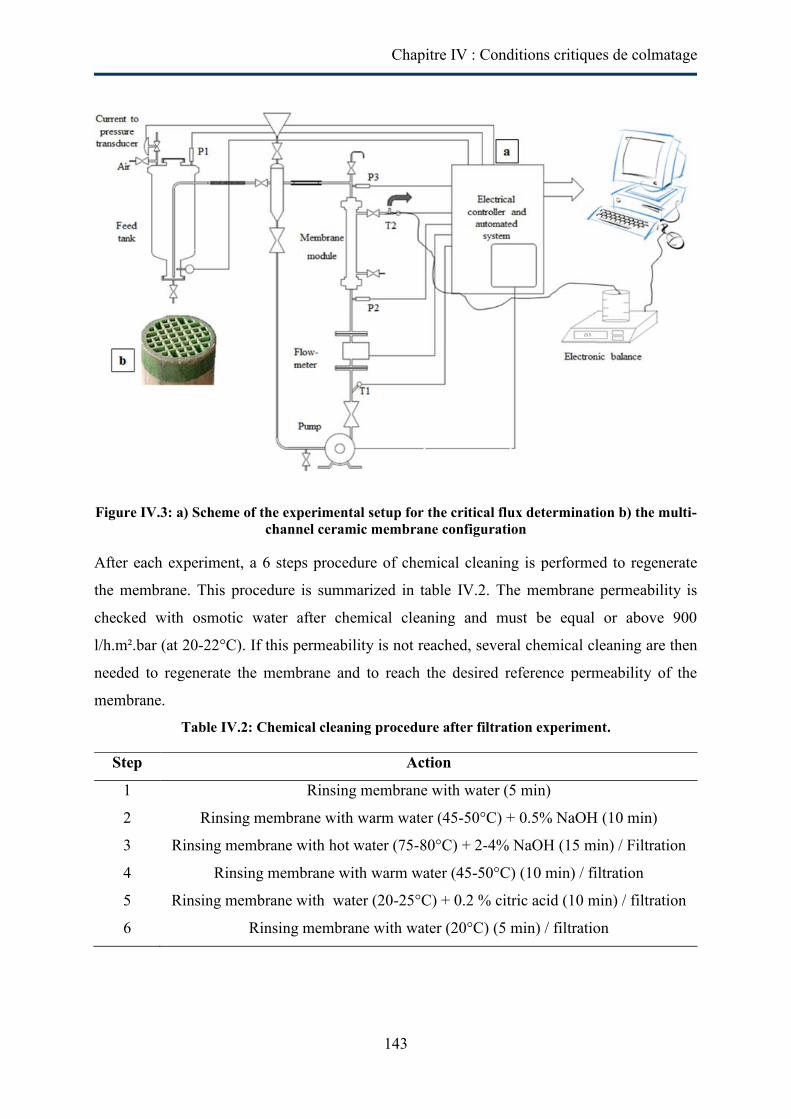
Chapitre IV : Conditions critiques de colmatage
143
Figure IV.3: a) Scheme of the experimental setup for the critical flux determination b) the multi-channel ceramic membrane configuration
After each experiment, a 6 steps procedure of chemical cleaning is performed to regenerate
the membrane. This procedure is summarized in table IV.2. The membrane permeability is
checked with osmotic water after chemical cleaning and must be equal or above 900
l/h.m².bar (at 20-22°C). If this permeability is not reached, several chemical cleaning are then
needed to regenerate the membrane and to reach the desired reference permeability of the
membrane.
Table IV.2: Chemical cleaning procedure after filtration experiment.
Step Action
1 Rinsing membrane with water (5 min)
2 Rinsing membrane with warm water (45-50°C) + 0.5% NaOH (10 min)
3 Rinsing membrane with hot water (75-80°C) + 2-4% NaOH (15 min) / Filtration
4 Rinsing membrane with warm water (45-50°C) (10 min) / filtration
5 Rinsing membrane with water (20-25°C) + 0.2 % citric acid (10 min) / filtration
6 Rinsing membrane with water (20°C) (5 min) / filtration
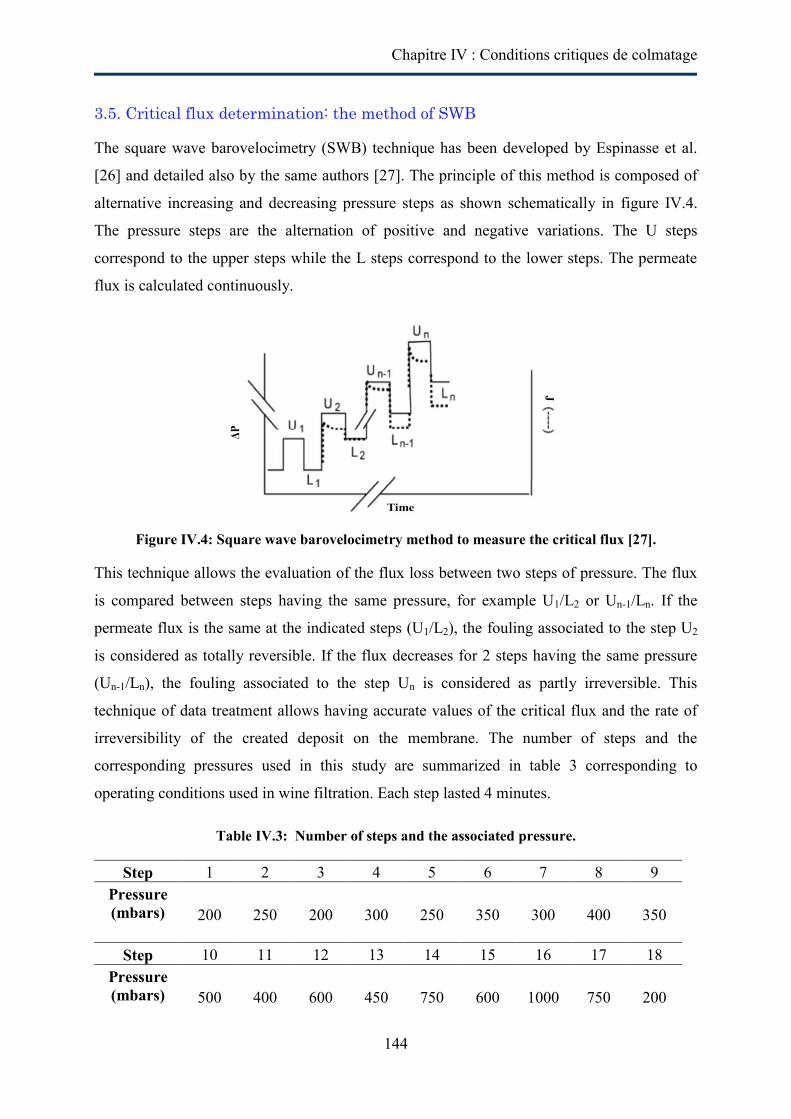
Chapitre IV : Conditions critiques de colmatage
144
3.5. Critical flux determination: the method of SWB
The square wave barovelocimetry (SWB) technique has been developed by Espinasse et al.
[26] and detailed also by the same authors [27]. The principle of this method is composed of
alternative increasing and decreasing pressure steps as shown schematically in figure IV.4.
The pressure steps are the alternation of positive and negative variations. The U steps
correspond to the upper steps while the L steps correspond to the lower steps. The permeate
flux is calculated continuously.
Figure IV.4: Square wave barovelocimetry method to measure the critical flux [27].
This technique allows the evaluation of the flux loss between two steps of pressure. The flux
is compared between steps having the same pressure, for example U1/L2 or Un-1/Ln. If the
permeate flux is the same at the indicated steps (U1/L2), the fouling associated to the step U2
is considered as totally reversible. If the flux decreases for 2 steps having the same pressure
(Un-1/Ln), the fouling associated to the step Un is considered as partly irreversible. This
technique of data treatment allows having accurate values of the critical flux and the rate of
irreversibility of the created deposit on the membrane. The number of steps and the
corresponding pressures used in this study are summarized in table 3 corresponding to
operating conditions used in wine filtration. Each step lasted 4 minutes.
Table IV.3: Number of steps and the associated pressure.
Step 1 2 3 4 5 6 7 8 9 Pressure (mbars) 200 250 200 300 250 350 300 400 350
Step 10 11 12 13 14 15 16 17 18
Pressure (mbars) 500 400 600 450 750 600 1000 750 200
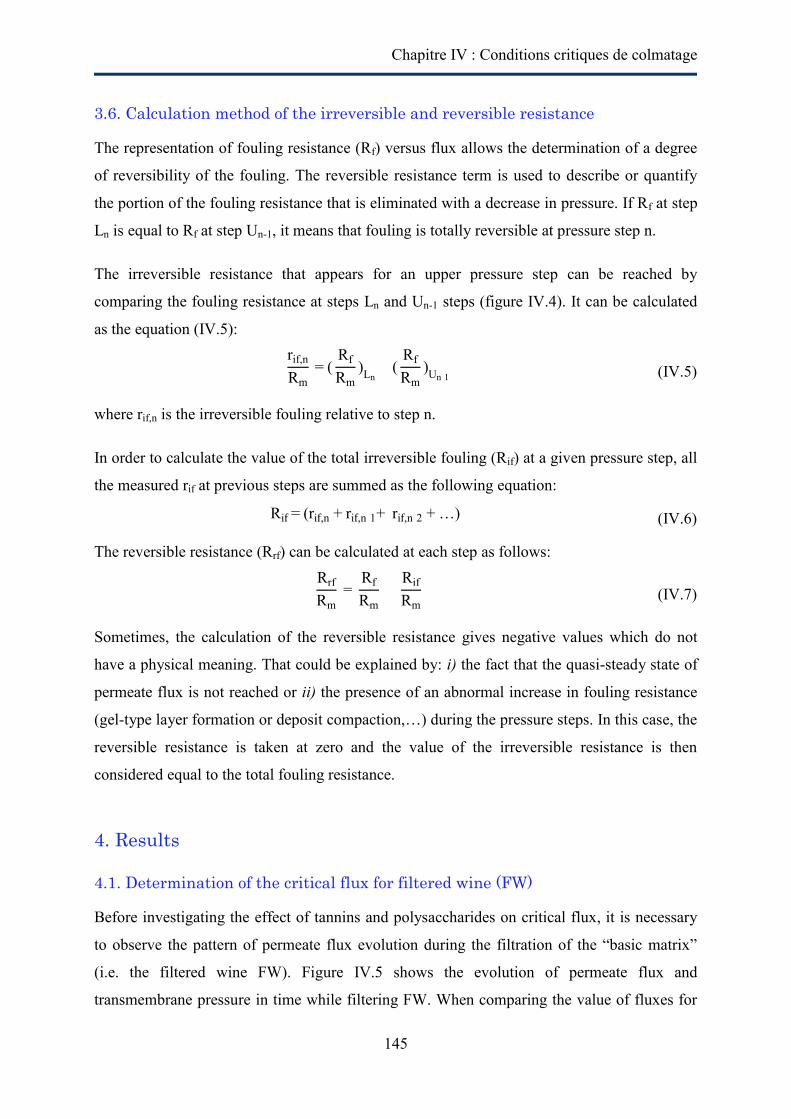
Chapitre IV : Conditions critiques de colmatage
145
3.6. Calculation method of the irreversible and reversible resistance
The representation of fouling resistance (Rf) versus flux allows the determination of a degree
of reversibility of the fouling. The reversible resistance term is used to describe or quantify
the portion of the fouling resistance that is eliminated with a decrease in pressure. If Rf at step
Ln is equal to Rf at step Un-1, it means that fouling is totally reversible at pressure step n.
The irreversible resistance that appears for an upper pressure step can be reached by
comparing the fouling resistance at steps Ln and Un-1 steps (figure IV.4). It can be calculated
as the equation (IV.5): rif,n
Rm = (
Rf
Rm)Ln
(Rf
Rm)Un 1
(IV.5)
where rif,n is the irreversible fouling relative to step n.
In order to calculate the value of the total irreversible fouling (Rif) at a given pressure step, all
the measured rif at previous steps are summed as the following equation:
Ri = (ri ,n + ri ,n 1+ ri ,n 2 + …) (IV.6)
The reversible resistance (Rrf) can be calculated at each step as follows: Rrf
Rm =
Rf
Rm
Rif
Rm (IV.7)
Sometimes, the calculation of the reversible resistance gives negative values which do not
have a physical meaning. That could be explained by: i) the fact that the quasi-steady state of
permeate flux is not reached or ii) the presence of an abnormal increase in fouling resistance
(gel-type layer formation or deposit compaction,…) during the pressure steps. In this case, the
reversible resistance is taken at zero and the value of the irreversible resistance is then
considered equal to the total fouling resistance.
4. Results
4.1. Determination of the critical flux for filtered wine (FW)
Before investigating the effect of tannins and polysaccharides on critical flux, it is necessary
to observe the pattern of permeate flux evolution during the filtration of the “basic matrix”
(i.e. the filtered wine FW). Figure IV.5 shows the evolution of permeate flux and
transmembrane pressure in time while filtering FW. When comparing the value of fluxes for
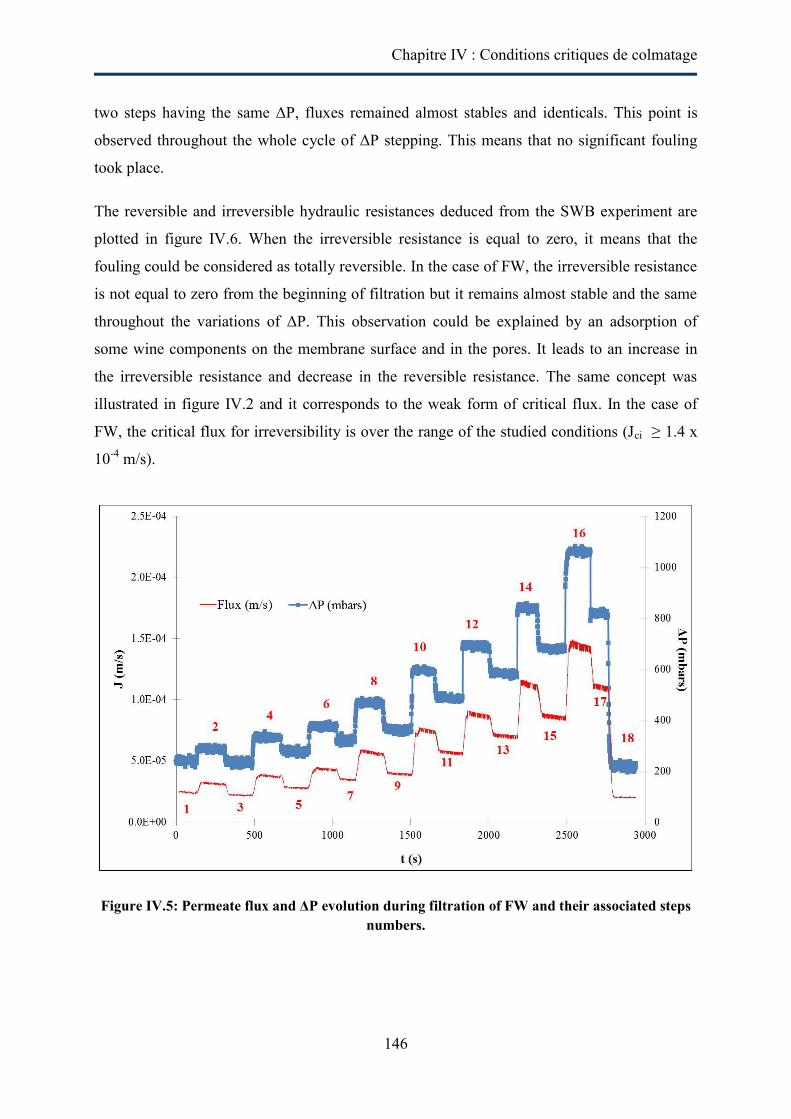
Chapitre IV : Conditions critiques de colmatage
146
two steps having the same ΔP, fluxes remained almost stables and identicals. This point is
observed throughout the whole cycle of ΔP stepping. This means that no significant fouling
took place.
The reversible and irreversible hydraulic resistances deduced from the SWB experiment are
plotted in figure IV.6. When the irreversible resistance is equal to zero, it means that the
fouling could be considered as totally reversible. In the case of FW, the irreversible resistance
is not equal to zero from the beginning of filtration but it remains almost stable and the same
throughout the variations of ΔP. This observation could be explained by an adsorption of
some wine components on the membrane surface and in the pores. It leads to an increase in
the irreversible resistance and decrease in the reversible resistance. The same concept was
illustrated in figure IV.2 and it corresponds to the weak form of critical flux. In the case of
FW, the critical flux for irreversibility is over the range of the studied conditions (Jci ≥ 1.4 x
10-4 m/s).
Figure IV.5: Permeate flux and ΔP evolution during filtration of FW and their associated steps numbers.
Chapitre IV : Conditions critiques de colmatage
147
Figure IV.6: Evolution of reversible Rrf and irreversible Rif fouling resistance during filtration of FW and the associated transmembrane pressure (mbars).
4.2. Effect of the added molecules
4.2.1. Impact of tannins on the evolution of the critical flux.
Tannins impact on critical flux was studied by adding to FW two different concentrations of
tannins: 1.25 g/l and 2.5 g/l. Results of the effect of ΔP stepping on permeate flux are reported
in figure IV.7. A net incidence of tannins on permeate fluxes is observed from the beginning
of the experiment. The fouling occurs within the first minute of filtration for the two tested
concentrations of tannins. The fluxes decrease for the steps having the same ΔP (in example
steps 2 and 5). This means that the fouling is partially irreversible. The obtained permeate
fluxes are higher for the concentration of 1.25 g/l of tannins (average 2.5 x 10⁻⁵ m/s at 1000
mbars (step 16)) than 2.5 g/l (average 1.9 x 10⁻⁵ m/s at 1000 mbars). The fluxes are 5 to 6
times lower than those obtained with FW (1.4 x 10⁻⁴ m/s) at 1000 mbars.
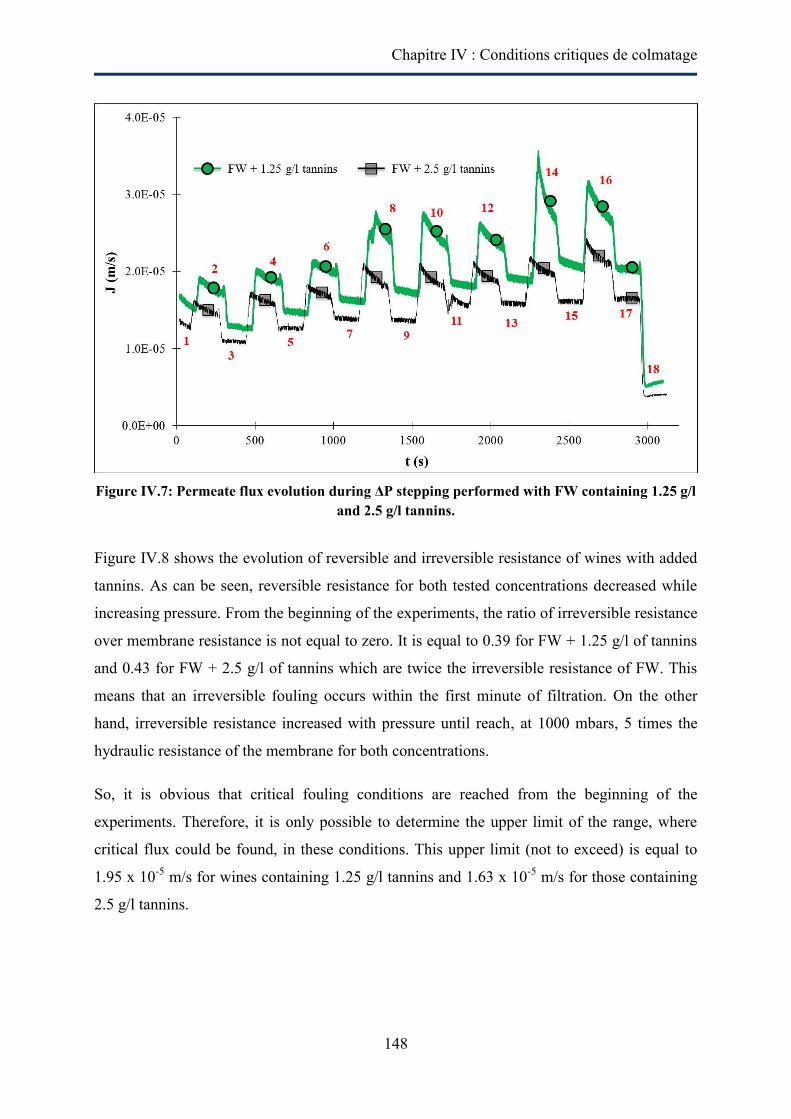
Chapitre IV : Conditions critiques de colmatage
148
Figure IV.7: Permeate flux evolution during ΔP stepping performed with FW containing 1.25 g/l
and 2.5 g/l tannins.
Figure IV.8 shows the evolution of reversible and irreversible resistance of wines with added
tannins. As can be seen, reversible resistance for both tested concentrations decreased while
increasing pressure. From the beginning of the experiments, the ratio of irreversible resistance
over membrane resistance is not equal to zero. It is equal to 0.39 for FW + 1.25 g/l of tannins
and 0.43 for FW + 2.5 g/l of tannins which are twice the irreversible resistance of FW. This
means that an irreversible fouling occurs within the first minute of filtration. On the other
hand, irreversible resistance increased with pressure until reach, at 1000 mbars, 5 times the
hydraulic resistance of the membrane for both concentrations.
So, it is obvious that critical fouling conditions are reached from the beginning of the
experiments. Therefore, it is only possible to determine the upper limit of the range, where
critical flux could be found, in these conditions. This upper limit (not to exceed) is equal to
1.95 x 10⁻⁵ m/s for wines containing 1.25 g/l tannins and 1.63 x 10⁻⁵ m/s for those containing
2.5 g/l tannins.
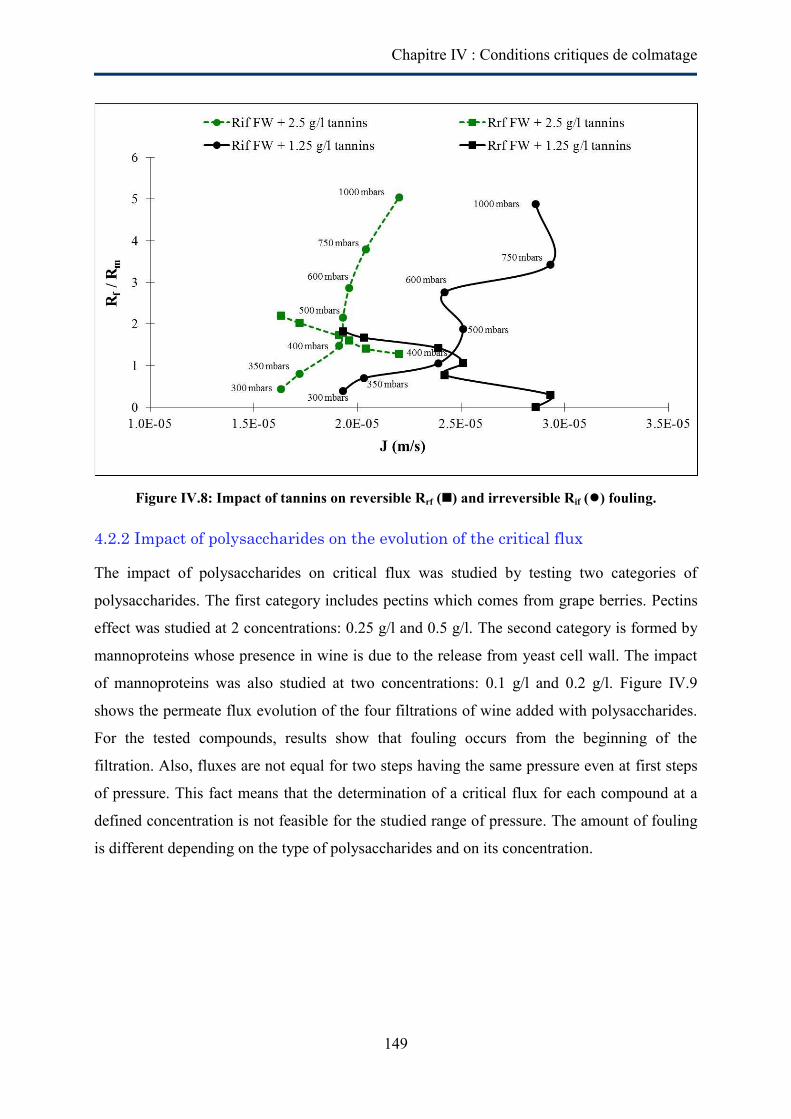
Chapitre IV : Conditions critiques de colmatage
149
Figure IV.8: Impact of tannins on reversible Rrf () and irreversible Rif () fouling.
4.2.2 Impact of polysaccharides on the evolution of the critical flux
The impact of polysaccharides on critical flux was studied by testing two categories of
polysaccharides. The first category includes pectins which comes from grape berries. Pectins
effect was studied at 2 concentrations: 0.25 g/l and 0.5 g/l. The second category is formed by
mannoproteins whose presence in wine is due to the release from yeast cell wall. The impact
of mannoproteins was also studied at two concentrations: 0.1 g/l and 0.2 g/l. Figure IV.9
shows the permeate flux evolution of the four filtrations of wine added with polysaccharides.
For the tested compounds, results show that fouling occurs from the beginning of the
filtration. Also, fluxes are not equal for two steps having the same pressure even at first steps
of pressure. This fact means that the determination of a critical flux for each compound at a
defined concentration is not feasible for the studied range of pressure. The amount of fouling
is different depending on the type of polysaccharides and on its concentration.
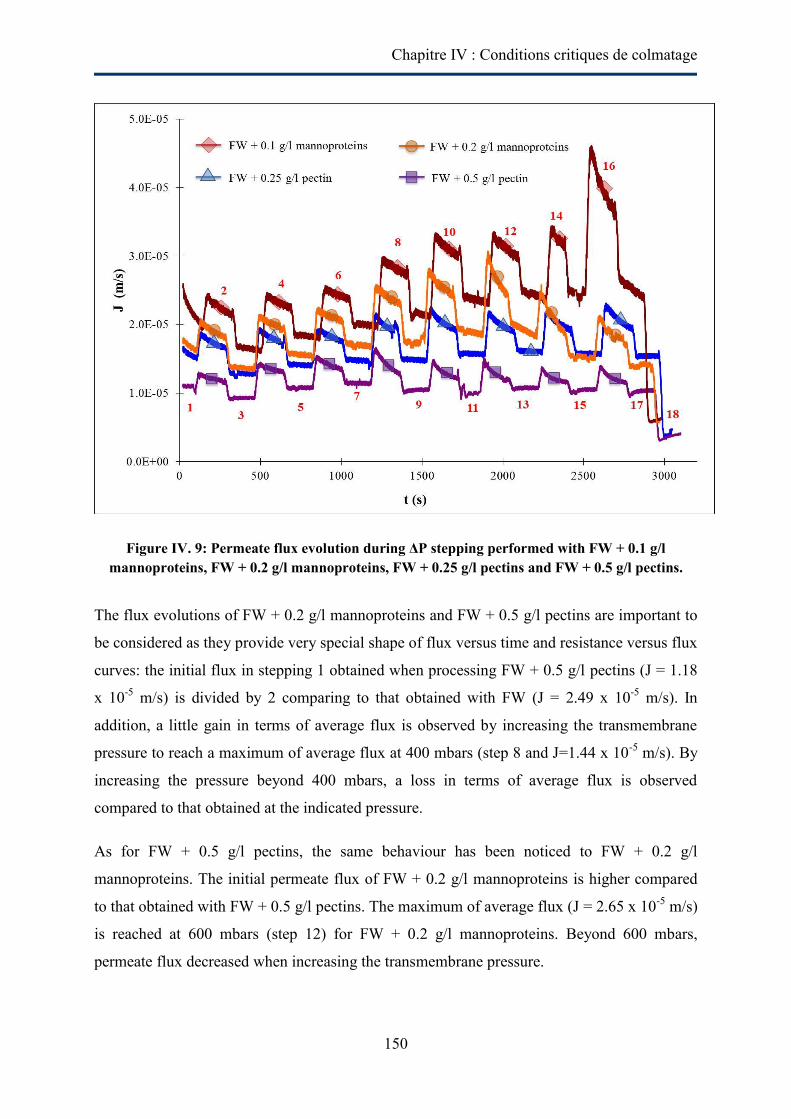
Chapitre IV : Conditions critiques de colmatage
150
Figure IV. 9: Permeate flux evolution during ΔP stepping performed with FW + 0.1 g/l mannoproteins, FW + 0.2 g/l mannoproteins, FW + 0.25 g/l pectins and FW + 0.5 g/l pectins.
The flux evolutions of FW + 0.2 g/l mannoproteins and FW + 0.5 g/l pectins are important to
be considered as they provide very special shape of flux versus time and resistance versus flux
curves: the initial flux in stepping 1 obtained when processing FW + 0.5 g/l pectins (J = 1.18
x 10-5 m/s) is divided by 2 comparing to that obtained with FW (J = 2.49 x 10⁻⁵ m/s). In
addition, a little gain in terms of average flux is observed by increasing the transmembrane
pressure to reach a maximum of average flux at 400 mbars (step 8 and J=1.44 x 10⁻⁵ m/s). By
increasing the pressure beyond 400 mbars, a loss in terms of average flux is observed
compared to that obtained at the indicated pressure.
As for FW + 0.5 g/l pectins, the same behaviour has been noticed to FW + 0.2 g/l
mannoproteins. The initial permeate flux of FW + 0.2 g/l mannoproteins is higher compared
to that obtained with FW + 0.5 g/l pectins. The maximum of average flux (J = 2.65 x 10⁻⁵ m/s)
is reached at 600 mbars (step 12) for FW + 0.2 g/l mannoproteins. Beyond 600 mbars,
permeate flux decreased when increasing the transmembrane pressure.
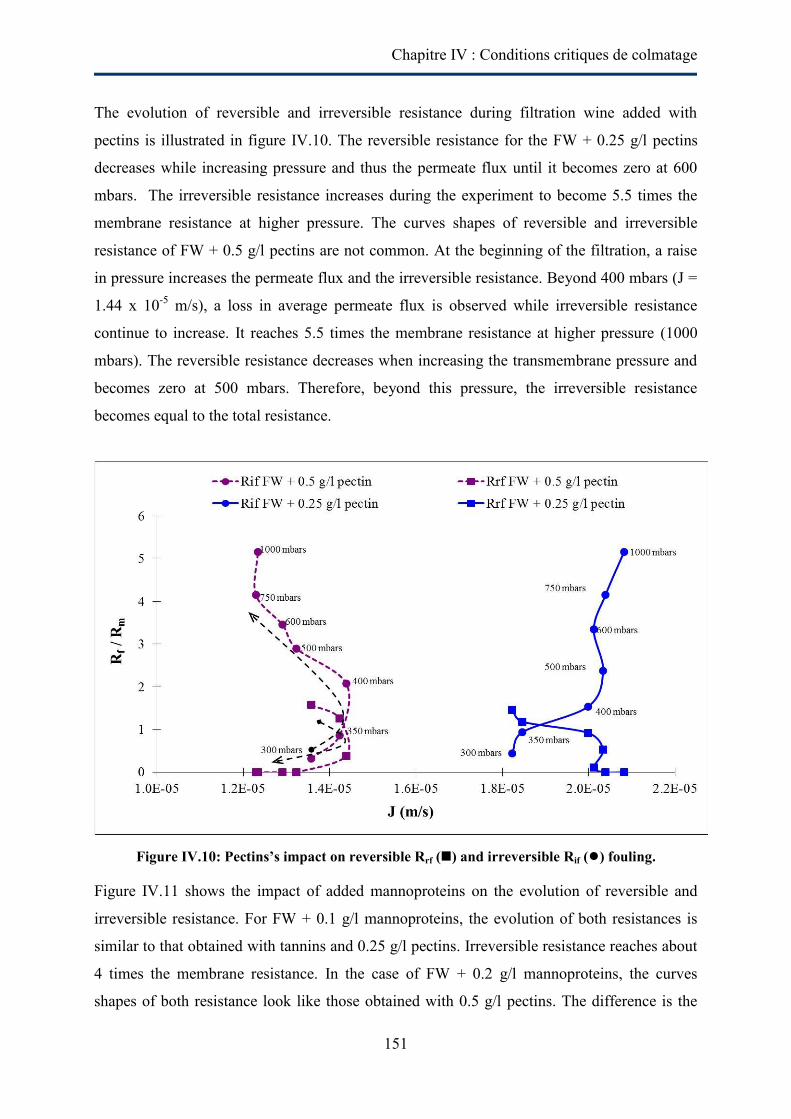
Chapitre IV : Conditions critiques de colmatage
151
The evolution of reversible and irreversible resistance during filtration wine added with
pectins is illustrated in figure IV.10. The reversible resistance for the FW + 0.25 g/l pectins
decreases while increasing pressure and thus the permeate flux until it becomes zero at 600
mbars. The irreversible resistance increases during the experiment to become 5.5 times the
membrane resistance at higher pressure. The curves shapes of reversible and irreversible
resistance of FW + 0.5 g/l pectins are not common. At the beginning of the filtration, a raise
in pressure increases the permeate flux and the irreversible resistance. Beyond 400 mbars (J =
1.44 x 10⁻⁵ m/s), a loss in average permeate flux is observed while irreversible resistance
continue to increase. It reaches 5.5 times the membrane resistance at higher pressure (1000
mbars). The reversible resistance decreases when increasing the transmembrane pressure and
becomes zero at 500 mbars. Therefore, beyond this pressure, the irreversible resistance
becomes equal to the total resistance.
Figure IV.10: Pectins’s impact on reversible Rrf () and irreversible Rif () fouling.
Figure IV.11 shows the impact of added mannoproteins on the evolution of reversible and
irreversible resistance. For FW + 0.1 g/l mannoproteins, the evolution of both resistances is
similar to that obtained with tannins and 0.25 g/l pectins. Irreversible resistance reaches about
4 times the membrane resistance. In the case of FW + 0.2 g/l mannoproteins, the curves
shapes of both resistance look like those obtained with 0.5 g/l pectins. The difference is the
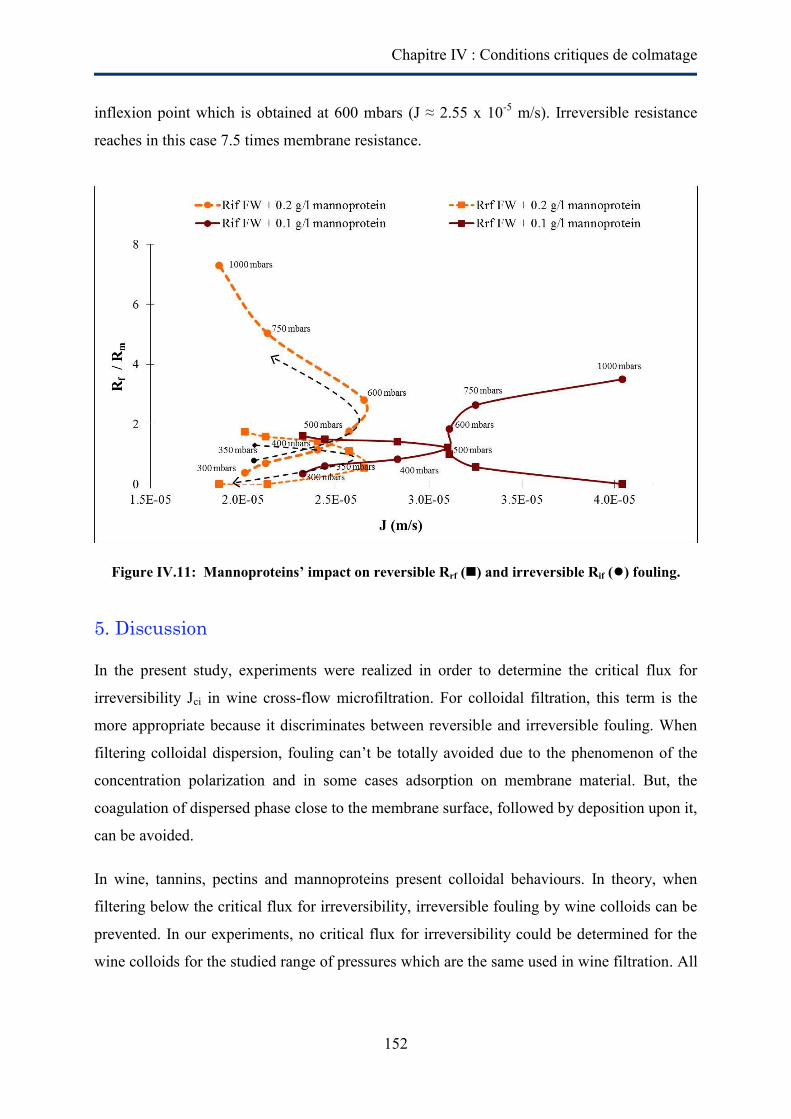
Chapitre IV : Conditions critiques de colmatage
152
inflexion point which is obtained at 600 mbars (J ≈ 2.55 x 10⁻⁵ m/s). Irreversible resistance
reaches in this case 7.5 times membrane resistance.
Figure IV.11: Mannoproteins’ impact on reversible Rrf () and irreversible Rif () fouling.
5. Discussion
In the present study, experiments were realized in order to determine the critical flux for
irreversibility Jci in wine cross-flow microfiltration. For colloidal filtration, this term is the
more appropriate because it discriminates between reversible and irreversible fouling. When
filtering colloidal dispersion, fouling can’t be totally avoided due to the phenomenon of the
concentration polarization and in some cases adsorption on membrane material. But, the
coagulation of dispersed phase close to the membrane surface, followed by deposition upon it,
can be avoided.
In wine, tannins, pectins and mannoproteins present colloidal behaviours. In theory, when
filtering below the critical flux for irreversibility, irreversible fouling by wine colloids can be
prevented. In our experiments, no critical flux for irreversibility could be determined for the
wine colloids for the studied range of pressures which are the same used in wine filtration. All
Chapitre IV : Conditions critiques de colmatage
153
tested molecules, whatever the concentration, exhibit irreversible fouling even at very low
pressures.
For wine tannins, it was demonstrated that their adsorption on membrane surface occurs in
static conditions [9,10]. Under dynamic conditions, tannins tend to accumulate at the pore
entrance on the membrane feed side [9]. It seems also, according to figure IV.8, that the rate
of fouling and its type is strongly influenced by the transmembrane pressure. The increase in
irreversible fouling can be explained by the transition between the state of dispersed
molecules to aggregates. This fact is promoted by the increase of the transmembrane pressure
which forces the molecules to be near the membrane surface and promotes membrane/tannins
and tannins/ tannins interactions.
Wine polysaccharides have been identified to play a major role in membrane fouling during
cross-flow microfiltration of wine [4-10]. According to the results presented in paragraph
4.2.2, fouling by polysaccharides can’t be avoided. It was shown that under static conditions
polysaccharides adsorption is negligible [7]. In dynamic conditions, polysaccharides
adsorption tends to be governed by the hydrophobic / hydrophilic character of the membrane
[10] as well as by membrane polarity [7]. In most fruit juices, pectins (a well-known gelling
agent) forms a gel-layer on the membrane surface [28-31]. The formation of this layer is
enhanced by the process. Kirk et al. [32] as well as Szaniawski and spencer [33] showed a bell
shaped profile when plotting permeate flux versus TMP during the filtration of solutions rich
in pectins. These observations were explained as following: an increase in pressure would
cause the macromolecules which are already on the membrane surface to pack more tightly;
At high pressures, the densely packed pectins molecules form a barrier across the membrane
and prevent the flow of permeate flux. This barrier was identified as gel-layer [34]. During
filtration of solutions containing pectins, Rai et al. [35] showed that an increase in pressure
lead to an increase in flux till a limit where a gel-type layer grows rapidly because if the
enhanced forced convection of the solutes toward membrane. Pectins hydrolysis by
pectinsases leads to an improvement of the permeate flux [36].
An unexpected phenomenon occurred when filtering FW + 0.5 g/l pectins and FW + 0.2 g/l
mannoproteins (cf. figure IV.9). After a given level of pressure, the average permeate flux
begin to decrease with increasing pressure. In fact, Kirk et al. [32] showed that pectins forms
an elastic pectic gel layer which is evidenced by the partial restoration of permeate flux upon
gradual release of the transmembrane pressure. This highlights that the pectic gel could be
Chapitre IV : Conditions critiques de colmatage
154
compressible. In our study, the following explanation can be proposed. The gel layer was
compressible till a limit of pressure. Beyond this limit, hydrogen bond bridges, that transform
the pectic chains into gel aggregates (figure IV.12-A), collapse leading to the closure of
interstitial spaces between the chains (figure IV.12-B). The gel layer can also be unstructured
under pressure and fill partially the pores leading to an additional fouling increase (figure
IV.12-C). So, the compacted pectic gel layer acts as a second membrane and may retain other
solutes. This explains the results obtained with FW + 0.5 g/l pectins.
Mannoproteins impact on membrane fouling was little studied in the literature. It was shown
that mannoproteins may cause the strongest decrease in wine filterability [8]. Mannoproteins
are not a gelling agent and do not form a gel-like structure over the membrane.
Mannoproteins seem to form a deposit at the membrane surface. The results obtained when
filtering FW + 0.2 g/l mannoproteins could be also explained by a compressible cake where
the spaces between molecules are reduced with the pressure increase.
These results highlight that the critical flux concept is inappropriate to be industrially applied
to wine cross-flow microfiltration within the classical range of operation. Therefore, other
concepts should be ta e n into consideration li e “threshold flux” term. It is defined as the flux
at or below which membrane system will generate a low rate of fouling and fluxes remain
acceptable but above which the rate of fouling increases markedly [22]. This definition was
used firstly for “sustainable flux” but the concept of the latter is modified and includes
economic factors. So, this concept is useful to define regions of low and high fouling. The
criteria and aspects to define this threshold flux may vary depending on what the researchers
are seeking. The criterion defined in this study is based on the ratio between irreversible
resistance and the hydraulic membrane resistance and it is defined as: “the flux at which the
ratio Rif/Rm is inferior to 1”.
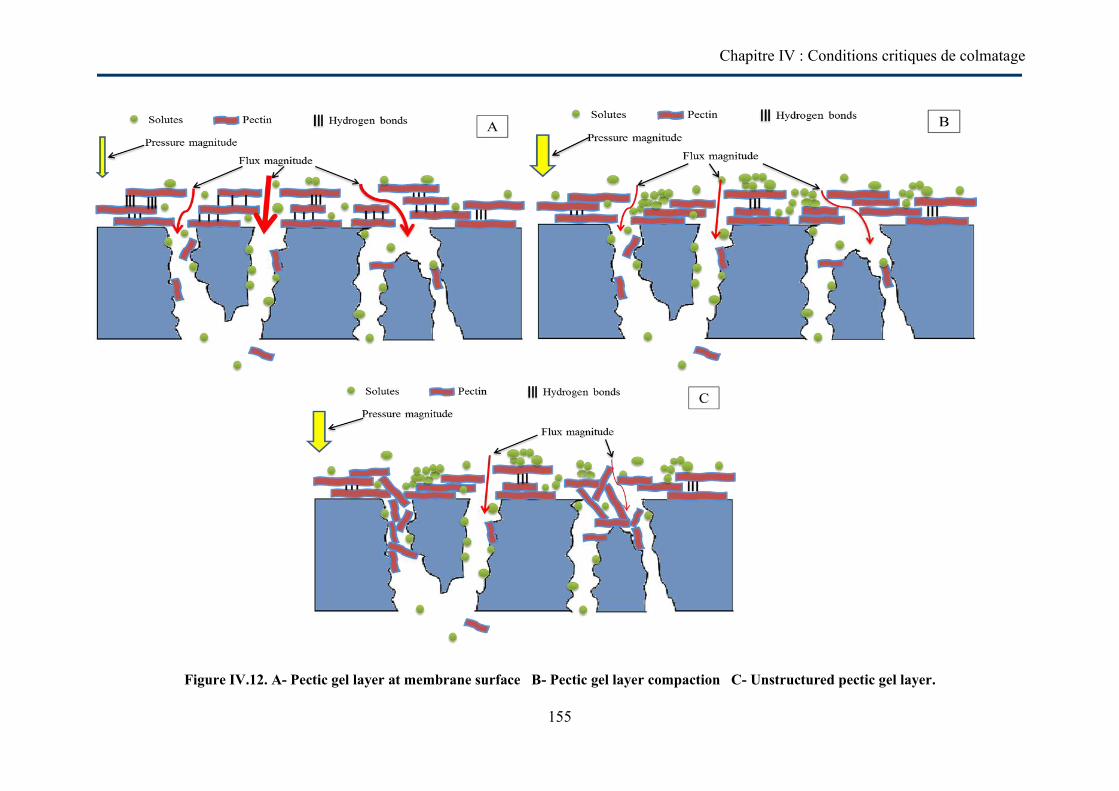
Chapitre IV : Conditions critiques de colmatage
155
Figure IV.12. A- Pectic gel layer at membrane surface B- Pectic gel layer compaction C- Unstructured pectic gel layer.
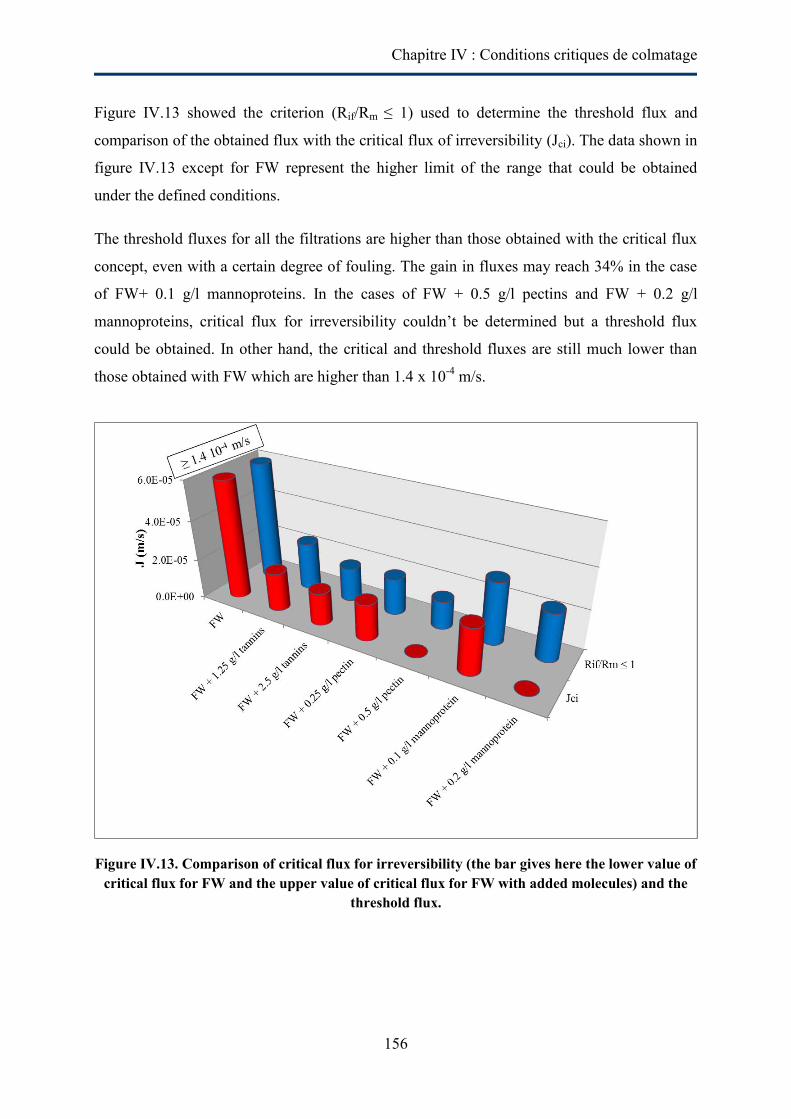
Chapitre IV : Conditions critiques de colmatage
156
Figure IV.13 showed the criterion (Rif/Rm ≤ 1) used to determine the threshold flux and
comparison of the obtained flux with the critical flux of irreversibility (Jci). The data shown in
figure IV.13 except for FW represent the higher limit of the range that could be obtained
under the defined conditions.
The threshold fluxes for all the filtrations are higher than those obtained with the critical flux
concept, even with a certain degree of fouling. The gain in fluxes may reach 34% in the case
of FW+ 0.1 g/l mannoproteins. In the cases of FW + 0.5 g/l pectins and FW + 0.2 g/l
mannoproteins, critical flux for irreversibility couldn’t be determined but a threshold flux
could be obtained. In other hand, the critical and threshold fluxes are still much lower than
those obtained with FW which are higher than 1.4 x 10⁻⁴ m/s.
Figure IV.13. Comparison of critical flux for irreversibility (the bar gives here the lower value of critical flux for FW and the upper value of critical flux for FW with added molecules) and the
threshold flux.
Chapitre IV : Conditions critiques de colmatage
157
6. Conclusion
In this study, critical operating conditions during wine cross-flow microfiltration were
studied. The square wave barovelocimetry (SWB) was used to assess the evolution of
reversible and irreversible resistance with permeate flux. It allows the determination of critical
flux for irreversibility (Jci). For all tested macromolecules (tannins, pectins and
mannoproteins) and associate concentrations, no clear critical flux for irreversibility can be
really determined in the range of tested pressures: this study determines then the upper value
of the critical flux. In fact, membrane fouling in presence of these wine molecules occurs
from the first minute of filtration. This work shows the importance of tannins, pectins and
mannoproteins on the membrane fouling for concentration ranges classically found in wine.
The main fouling mechanisms is adsorption on membrane material as showed with FW
solution and formation of deposit layer as proposed for FW + 0.2 g/l mannoproteins. A gel
layer compaction or deformation under high pressures is proposed to explain the phenomenon
observed with FW + 0.5 g/l pectins. New criteria were used in order to determine a “threshold
flux” where a certain degree of fouling is acceptable. It leads to a convenient set of operating
conditions compatible with industrial constraints.
References
[1] A.G. Cook, P. Weinstein, J.A. Centeno, Health effects of natural dusts: role of trace elements and compounds, Biol. Trace Elem. Res. 103 (2005) 1-15. [2] A. Lüdemann, Wine clarification with a cross-flow microfiltration system, Am. J. Enol. Vitic. 38 (1987) 228-235. [3] G. Belfort, R.H. Davis, A.L. Zydney, The behaviour of suspensions and macromolecules solutions in cross-flow microfiltration, J. Membr. Sci. 96 (1994) 1-58. [4] Q. Gan, R.W. Field, M.R. Bird, R. England, J.A. Howell, M.T. McKechnie, C.L. Oshaughnessy, Beer clarification by cross-flow microfiltration: Fouling mechanisms and flux enhancement. Chem. Eng. Res. Des. 75 (1997) 3-8. [5] M.P. Belleville, J.M. Brillouet, B.T. Delafuente, M. Moutounet, Fouling colloids during microporous alumina membrane filtration of wine, J.Food Sci. 57 (1992) 396-400. [6] P.J. Cameira Dos Santos, Colmatage en microfiltration tangentielle: mise en evidence d’interactions entre les polysaccharides et les polyphénols d’un vin et des membranes polymériques, Ph. D. Thesis. University of Montpellier II. Ecole Nationale Supérieure Agronomique de Montpellier, 1995. [7] Vernhet, M.N. BellonFontaine, J.M. Brillouet, E. Roesink, M. Moutounet, Wetting properties of microfiltration membrane: Determination by means of the capillary rise technique and incidence on the adsorption of wine polysaccharide and tannins, J. Membr. Sci. 128 (1997) 163-174.
Chapitre IV : Conditions critiques de colmatage
158
[8] A. Vernhet, P. Pellerin, M.P. Belleville, J. Planque, M. Moutounet, Relative impact of major wine polysaccharides on the performances of an organic microfiltration membrane, Am. J. Enol. Vitic. 50 (1999) 51-56. [9] Vernhet, M. Moutounet, Fouling of organic microfiltration membranes by wine constituents: importance, relative impact of wine polysccharides and polyphenols and incidence of membrane properties, J. Membr. Sci. 201 (2002) 103-122. [10] M. Ulbricht, W. Ansorge, I. Danielzik, M. Konig, O. Schuster, Fouling in microfiltration of wine: The influence of the membrane polymer on adsorption of polyphenols and polysaccharides. Sep. Purif. Technol. 68 (2009) 335-342. [11] G. Gésan-Guiziou, E. Boyaval, G. Daufin, Critical stability conditions in cross-flux microfiltration of skimmed milk: transition to irreversible deposition, J. Membr. Sci. 158 (1999) 211-222. [12] W. Youravong, M.J., Lewis, A.S. Grandison, Critical flux in ultrafiltration of skimmed milk, Food Bioprod. Process. 81 (2003) 303-308. [13] J. De Bruijin, R. Borquez, Analysis of the fouling mechanisms during cross-flow ultrafiltration of apple juice, LWT, 39 (2006)861-871. [14] P. Bacchin, P. Aimar, V. Sanchez, Model for colloidal fouling of membranes, AIChE J. 41 (1995) 368–377. [15] R.W. Field, D. Wu, J.A. Howell, B.B. Gupta, Critical flux concept for microfiltration fouling, J. Membr. Sci. 100 (1995) 259-272. [16] J.A. Howell, Sub-critical flux operation in microfiltration, J. Membr. Sci. 107 (1995) 165-171. [17] D.X. Wu, J.A. Howell, R.W. Field, Critical flux measurement for model colloids, J. Membr. Sci. 152 (1999) 89–98. [18] P. Bacchin, P. Aimar, R.W. Field, Critical and sustainable fluxes: Theory, experiments and applications. J. Membr. Sci. 281 (2006) 42-69. [19] L. Defrance, M.Y. Jaffrin, Comparison between filtrations at fixed transmembrane pressure and fixed permeate flux: application to a membrane bioreactor used for wastewater treatment, J. Membr. Sci. 152 (1999) 203–210. [20] A.G. Fane, Sustainability and membrane processing of wastewater for reuse, Desalination, 202 (2007) 53-58. [21] P. Le-Clech, V. Chen, T. Fane, Fouling in membrane bioreactors used in wastewater treatment, J. Membr. Sci. 284 (2006) 17-53. [22] R.W. Field, G.K. Pearce, Critical, sustainable and threshold fluxes for membrane filtration with water industry applications, Adv. Colloid Interface Sci., 164 (2011) 38-44. [23] L. Usseglio-Tomasset, Les colloïdes glucidiques solubles des moûts et des vins. Connaissance de la vigne et du vin, 10 (1976) 193-226. [24] P. Ribéreau-Gayon, Y. Glories, A. Maujean, D. dubourdieu., Handbook of enology Volume 2 : The chemistry of wine, stabilization and treatments, 2nd ed., Dunod, Paris, 2006. [25] C. Flanzy, Œnologie : fondements scientifiques et technologiques, Lavoisier TEC&DOC, Paris, 1998. [26] B. Espinasse, P. Bacchin, P. Aimar, On an experimental method to measure critical flux in ultrafiltration, Desalination, 146 (2002) 91-96. [27] B. Espinasse, P. Bacchin, P. Aimar, Filtration method characterizing the reversibility of colloidal fouling layers at a membrane surface: Analysis through critical flux and osmotic pressure, J. Colloid Interface Sci. 320 (2008) 483-490. [28] M.Z. Sulaiman, N.M. Sulaiman, L.Y. Shih, Limiting permeate flux in the clarification of untreated starfruit juice by membrane ultrafiltration, J. Chem. Eng. 68 (1998) 145-148.
Chapitre IV : Conditions critiques de colmatage
159
[29] M.Z. Sulaiman, N.M. Sulaiman, M. Shamel, Ultrafiltration studies on solutions of pectins, glucose and their mixtures in a pilot scale crossflow membrane unit, J. Chem. Eng. 84 (2001) 557-563. [30] P. Rai, G.C. Majumdar, S. Dasgupta, S. De, Modeling of sucrose permeation though a pectins gel during ultrafiltration of depectinsized mosambi [Citrus sinensis (L.) Osbeck] juice, J. Food Sci. 71 (2006) 87-94. [31] P. Rai, G.C. Majumdar, S. Dasgupta, S. De, Modeling of permeate flux of synthetic fruit juice and mosambi juice (Citrus sinensis (L.) Osbeck) in stirred continuous ultrafiltration, LWT 40 (2007) 1765 -1773. [32] D.E. Kirk, M.W. Montgomery, M.G. Kortekaas, Clarification of pear juice by hollow fiber ultrafiltration, J. Food Sci., 48 (1983) 1663-1667. [33] AR Szaniawski and HG Spencer, Microfiltrtaion of pectins solutions by a titanium dioxide membrane, Key Eng. Mater. 61/62 (1991), 243–248. [34] R. Jiraratananon, A. Chanachai, A study of fouling in the ultrafiltration of passion fruit juice, J. Membr. Sci. 111 (1996) 39-48. [35] P. Rai, G.C. Majumdar, S. Dasgupta, S. De, Understanding ultrafiltration performance with mosambi juice in an unstirred batch cell, J. Food Process Eng. 28 (2005) 166-180. [36] F. Vaillant, P. Millan, G. O’Brien, M. Dornier, M. Decloux, M. Reynes, Cross flow microfiltration of passion fruit juice after partial enzymatic liquefaction, J. Food Eng. 42 (1999) 215-224.
Chapitre IV : Conditions critiques de colmatage
160
Conclusion du chapitre
L’objectif de cette étude était la recherche des conditions opératoires critiques pour limiter le
colmatage par les colloïdes du vin (tanins, mannoprotéines et pectines) et améliorer les
performances du procédé. La méthode utilisée (SWB) est basée sur l’application des échelons
de pression avec des variations positives et négatives permettant de déterminer la part
réversible et irréversible du colmatage. Cette méthode permet de déterminer le flux critique
pour l’irréversibilité défini comme le flux au-delà duquel un colmatage irréversible est
observé à la surface de la membrane. Les filtrations ont été réalisées sur le pilote détaillé au
chapitre II et équipé d’une membrane céramique multicanaux ; la solution à filtrer est un vin
rouge filtré préalablement sur le pilote (FW) auquel on additionne séparemment les colloïdes
du vin.
La valeur du flux critique (Jci ≥ 1.4 x 10⁻⁴ m/s) pour le vin filtré se situe au delà de la gamme
de pressions testées (0.2 -1 bar). Pour les vins additionnés des colloïdes, aucun flux n’a pu
être déterminé puisque le colmatage apparaît dès les faibles pressions. Par contre, on a pu
déterminer la valeur supérieure de l’intervalle où se situe le flux critique pour chacune des
solutions testées
Ce travail montre le rôle important des tanins, pectines et mannoprotéines dans le colmatage
de la membrane pour les gammes de concentration classiques trouvées dans le vin. Les
principaux mécanismes de colmatage sont i) l'adsorption sur le matériau membranaire comme
l'a montré la filtration de la solution FW et ii) la formation d’un dépôt comme nous l'avons
proposé lors de la filtration de FW + 0,2 g /l de mannoprotéines. Un compactage de la couche
de gel ou de déformation sous haute pression est proposé pour expliquer le phénomène
observé lors de la filtration du vin additionné de 0.5 g/l de pectines (FW + 0,5 g / l pectines).
Le colmatage est inévitable en présence des molécules du vin. Pour cela, un nouveau critère a
été proposé remplaçant le flux critique pour l’irréversibilité pour opérer avec un degré de
colmatage acceptable. Ce critère a été choisi de telle sorte que la résistance hydraulique totale
soit inférieure ou égale au double de la résistance hydraulique de la membrane (Rif/Rm ≤ 1).
Chapitre V:
Filtration Dynamique
Chapitre V : Filtration dynamique
162
1. Introduction
Pour la clarification des fluides complexes (vin, bière,…), la sélection d’une technique
membranaire n’est pas toujours simple. En effet, l’offre technologique est extrêmement
diversifiée et toujours croissante, que ce soit par : i) les techniques de filtration (frontale,
tangentielle, dynamique), ii) la géométrie des modules (plan, filtre-presse, tubulaire, spirale,
fibre creuse), iii) la nature chimique et la structure des matériaux (organique, minérale,
métallique), iv) le mode de fonctionnement (batch, continu) ou v) les techniques de limitation
de l'encrassement (mode co-courant, retro-filtration, back-shock, back-flush, etc.).
Pour lutter contre le phénomène de colmatage, facteur limitant de toutes les opérations de
séparations par membrane, plusieurs méthodes physiques sont disponibles : la rétrofiltration
(bac f lush, bac puls e), les ultrasons, l’utilisation des champs électriques, les écoulements
tourbillonnaires (vortex de Dean, inserts hélicoïdaux) et la filtration dynamique [1-12].
Le principe de la filtration dynamique repose sur la génération de perturbations
hydrodynamiques et se présente comme une alternative aux filtrations frontale et tangentielle.
La filtration dynamique offre l'avantage de générer un cisaillement pariétal élevé et/ou
instationnaire sans induire de perte de charge linéique (découplage entre cisaillement et
écoulement du rétentat) [9]. Elle permet donc également de travailler avec de faibles pressions
transmembranaires. La figure V.1 montre les principales différences entre la filtration
frontale, la filtration tangentielle et la filtration dynamique. En filtration frontale, l’état
continuellement transitoire dû à l’accumulation de la matière à la surface de la membrane
nécessite une mise en œuvre séquentielle (successions de filtration – actions de nettoyage). Le
choix des conditions opératoires adaptées s’avère parmi les seuls moyens pour limiter le
colmatage. En filtration tangentielle, une vitesse de circulation élevée est nécessaire pour
limiter la croissance d’un dépôt à la surface des membranes ; ce mode de filtration nécessite
donc une consommation d’énergie élevée et génère des pertes de charge linéiques
importantes. En conséquence, une augmentation de la pression transmembranaire sur tout le
module membranaire sera observée qui peut engendrer un colmatage plus important dû à la
compression du dépôt à la surface membranaire.
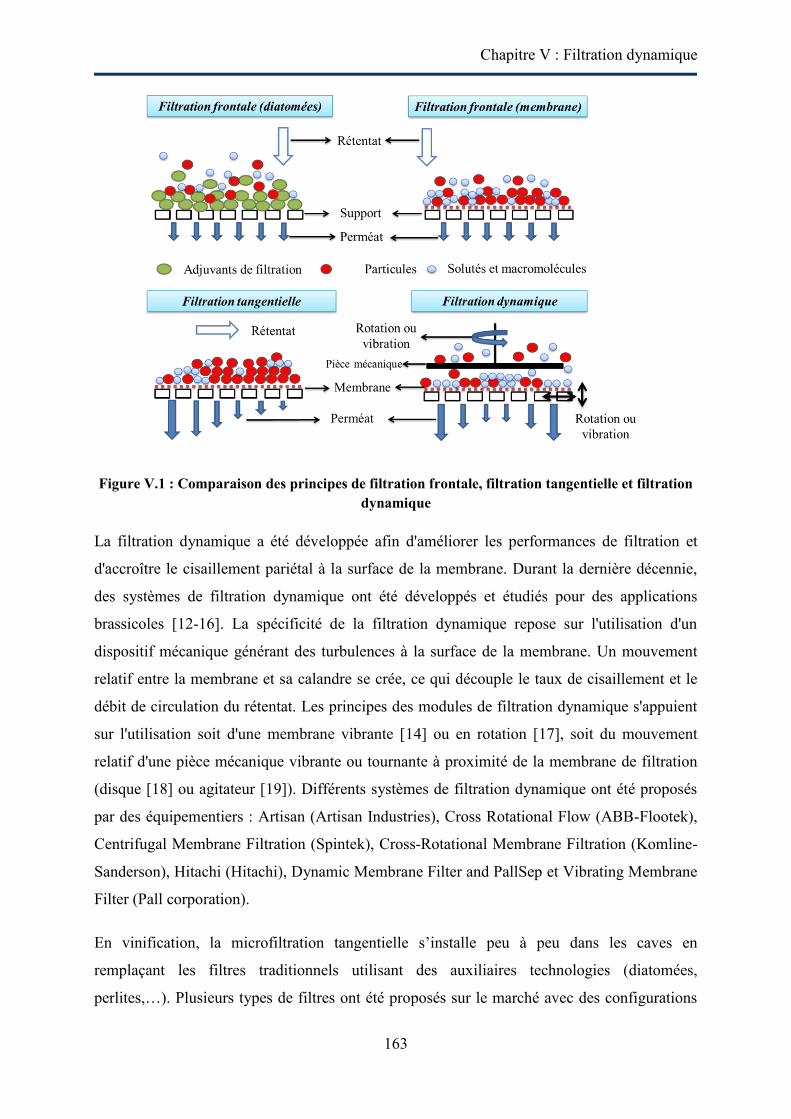
Chapitre V : Filtration dynamique
163
Figure V.1 : Comparaison des principes de filtration frontale, filtration tangentielle et filtration dynamique
La filtration dynamique a été développée afin d'améliorer les performances de filtration et
d'accroître le cisaillement pariétal à la surface de la membrane. Durant la dernière décennie,
des systèmes de filtration dynamique ont été développés et étudiés pour des applications
brassicoles [12-16]. La spécificité de la filtration dynamique repose sur l'utilisation d'un
dispositif mécanique générant des turbulences à la surface de la membrane. Un mouvement
relatif entre la membrane et sa calandre se crée, ce qui découple le taux de cisaillement et le
débit de circulation du rétentat. Les principes des modules de filtration dynamique s'appuient
sur l'utilisation soit d'une membrane vibrante [14] ou en rotation [17], soit du mouvement
relatif d'une pièce mécanique vibrante ou tournante à proximité de la membrane de filtration
(disque [18] ou agitateur [19]). Différents systèmes de filtration dynamique ont été proposés
par des équipementiers : Artisan (Artisan Industries), Cross Rotational Flow (ABB-Flootek),
Centrifugal Membrane Filtration (Spintek), Cross-Rotational Membrane Filtration (Komline-
Sanderson), Hitachi (Hitachi), Dynamic Membrane Filter and PallSep et Vibrating Membrane
Filter (Pall corporation).
En vinification, la microfiltration tangentielle s’installe peu à peu dans les caves en
remplaçant les filtres traditionnels utilisant des auxiliaires technologies (diatomées,
perlites,…). Plusieurs types de filtres ont été proposés sur le marché avec des configurations
Chapitre V : Filtration dynamique
164
et des membranes différentes. Cependant, ces filtres semblent atteindre leurs limites de
progrès ; ils n’ont surtout pas résolu tous les problèmes de filtration dans le secteur
œnologique (ex : faibles flux de perméation, filtration des moûts,…).
Dans ce contexte, nos objectifs scientifiques sont d’investiguer et d’analyser les performances
d’une technique de filtration dynamique originale dénommée Rotating and Vibrating
Filtration, (Appareil, système et procédé de séparation des liquides, brevet n°FR-97-14825,
26.11.1997, Jitariouk N.) ; Ce filtre a été conçu pour le traitement de fluides complexes de
type biologique et alimentaire, ce qui correspond bien à la filtration des vins au cours de
vinification. Nos travaux de recherche seront axés sur l’étude de l’impact des conditions
opératoires (vitesse de rotation et la pression) sur les performances de filtration ; Les
comportements de deux types de membranes organiques (hydrophile (PES) et hydrophobe
(PTFE)) vis-à-vis du colmatage seront aussi étudiés lors de la clarification de vins modèles.
Cette approche permettra d’évaluer d’une part les affinités physico-chimiques entre les
composés du vin et les membranes étudiées (à noter que le matériau PTFE est testé pour la
première fois pour la filtration du vin) et d’autre part la contribution de l’hydrodynamique sur
les mécanismes de colmatage. Ces performances quantitatives seront ensuite analysées et
discutées à la lumière des données présentes dans la littérature.
2. Matériel et Méthodes
2.1. Pilote de filtration dynamique [20]
Le dispositif expérimental de filtration dynamique (figure V.2) est constitué d’une cuve d’une
capacité de 20 litres (Chemap-Fermenter, Chemap, AG, CH-860l Vol e tswil), d’une pompe
de circulation et d’une boucle de dérivation entièrement instrumentée contenant le module de
filtration dynamique.
La circulation des fluides est assurée par la pompe volumétrique et par la pression
transmembranaire appliquée dans le module à l’aide d’une vanne de contre-pression (Vanne à
membrane, SED, type S02, Pmax 10 bar). La configuration étudiée correspond à un mode de
fonctionnement semi-batch (concentration de l’alimentation et extraction en continu du
perméat) dans lequel le perméat peut être retourné vers le bac d’alimentation pour maintenir
une concentration et un volume constants. Un facteur de réduction volumique, FRV égal à 1
est maintenu lors de nos essais.
Chapitre V : Filtration dynamique
165
La cuve cylindrique transparente (h = 480 mm, d = 250 mm) est équipée de quatre turbines
Rushton (à quatre lames). Une boucle de régulation permet de contrôler la température du
liquide à filtrer (20°C). Des mesures expérimentales le long de la boucle de dérivation
permettent de vérifier les pressions relatives et différentielles, le débit massique, la masse du
perméat, la densité spécifique, le pH, l’oxygène dissous et la conductivité électrique.
La pression relative (BOURBON-HAENNI E913 33 B22 n°6008, 0.2 % pleine échelle) est
mesurée en sortie de pompe. Un débitmètre à effet Coriolis (KROHNE, type MFS-7050-S06)
placé à la sortie de la pompe de circulation permet de mesurer le débit massique (précision ±
0.1% pour un liquide), la température (± 1°C) et la densité spécifique du liquide à filtrer (± 2
kg/m3). La mesure de pression différentielle (HONEYWELL - STD 120 n°0630–
C2856562001001, précision ± 0.003 % pour 105 Pa) est utilisée pour déterminer la pression
transmembranaire. L’oxygène dissous et le pH sont déterminés à partir de deux sondes
spécifiques (pH : Easyferm plus VP/120-238 633 ; O2 Oxyferm FDA/120-237 450). Enfin, la
conductivité électrique et la température sont contrôlées respectivement à l’aide d’un
conductimètre électrique (KEMOTRON - type 9147) et d’une sonde à résistances de platine
(Pt 1000 Ω – IEC 751 – Classe A). Le flux de perméat est mesuré à l’aide une balance digitale
(Sartorius, CPA5201, max5200g, ± 0.1 g).
Tous les signaux électriques des capteurs ont été conditionnés à l’aide d’un système
d’acquisition de données (Agilent Technologies, Loveland, Etats-Unis, 34901A) y compris un
module d’acquisition multiplexeur (34091A) et une carte de commande (34907A) via une RS-
liaison. Une commande spécifique de la pompe a été développée sous le logiciel LabVIEW
pour contrôler le débit dans la boucle de dérivation.
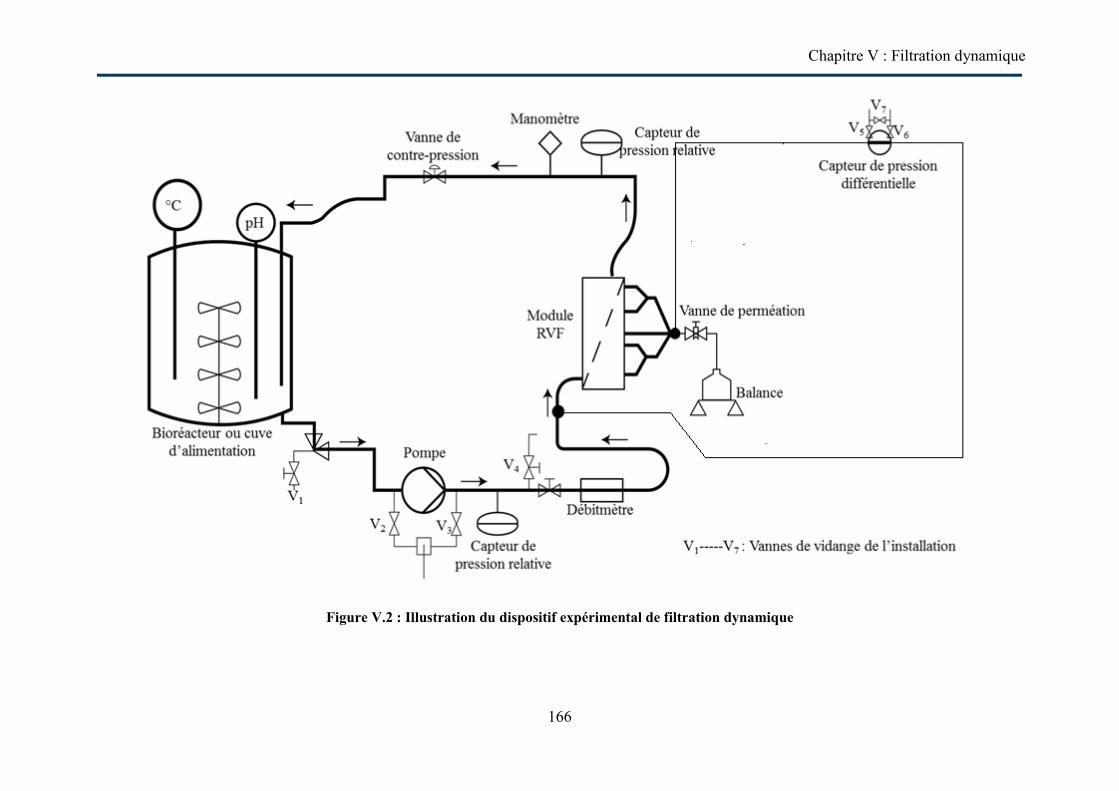
Chapitre V : Filtration dynamique
166
Figure V.2 : Illustration du dispositif expérimental de filtration dynamique
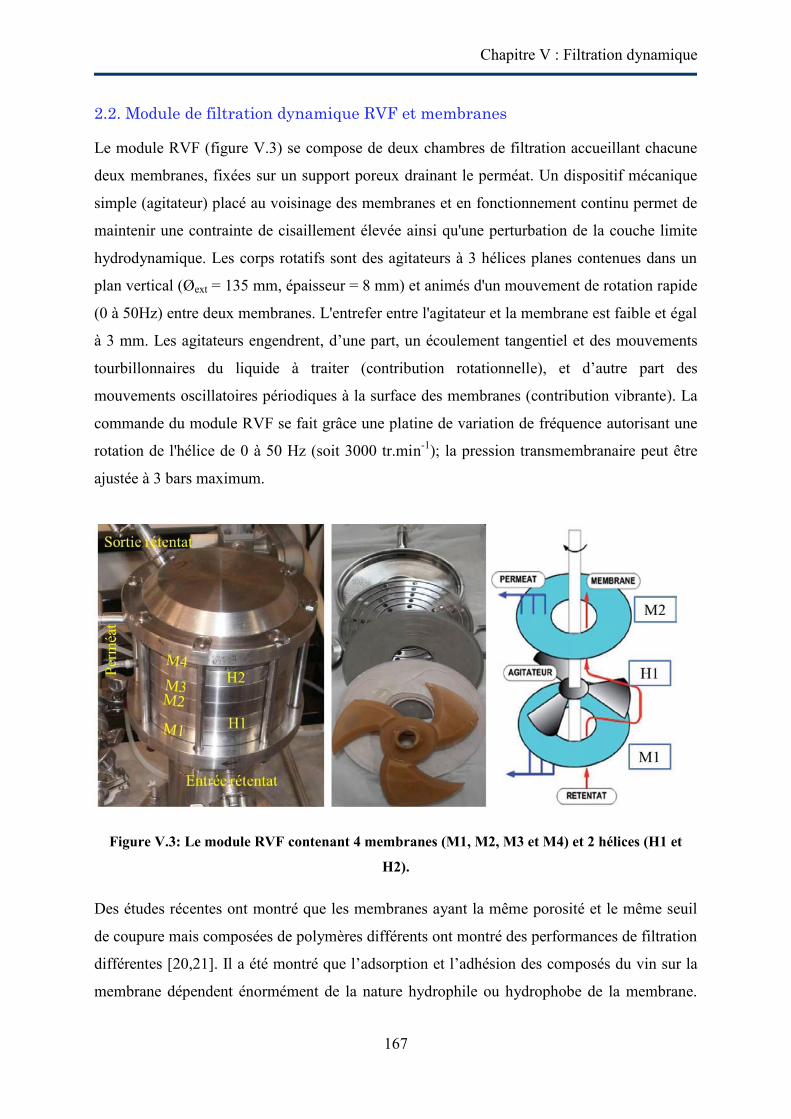
Chapitre V : Filtration dynamique
167
2.2. Module de filtration dynamique RVF et membranes
Le module RVF (figure V.3) se compose de deux chambres de filtration accueillant chacune
deux membranes, fixées sur un support poreux drainant le perméat. Un dispositif mécanique
simple (agitateur) placé au voisinage des membranes et en fonctionnement continu permet de
maintenir une contrainte de cisaillement élevée ainsi qu'une perturbation de la couche limite
hydrodynamique. Les corps rotatifs sont des agitateurs à 3 hélices planes contenues dans un
plan vertical (Øext = 135 mm, épaisseur = 8 mm) et animés d'un mouvement de rotation rapide
(0 à 50Hz) entre deux membranes. L'entrefer entre l'agitateur et la membrane est faible et égal
à 3 mm. Les agitateurs engendrent, d’une part, un écoulement tangentiel et des mouvements
tourbillonnaires du liquide à traiter (contribution rotationnelle), et d’autre part des
mouvements oscillatoires périodiques à la surface des membranes (contribution vibrante). La
commande du module RVF se fait grâce une platine de variation de fréquence autorisant une
rotation de l'hélice de 0 à 50 Hz (soit 3000 tr.min-1); la pression transmembranaire peut être
ajustée à 3 bars maximum.
Figure V.3: Le module RVF contenant 4 membranes (M1, M2, M3 et M4) et 2 hélices (H1 et
H2).
Des études récentes ont montré que les membranes ayant la même porosité et le même seuil
de coupure mais composées de polymères différents ont montré des performances de filtration
différentes [20,21]. Il a été montré que l’adsorption et l’adhésion des composés du vin sur la
membrane dépendent énormément de la nature hydrophile ou hydrophobe de la membrane.
Chapitre V : Filtration dynamique
168
Ainsi, les composés du vin ont moins d’affinité pour les membranes hydrophobes que les
membranes hydrophiles [21]. Dans ce cadre, deux matériaux membranaires sont utilisés dans
cette étude (seuil de coupure de 0.2 µm): le Polyéthersulfone (PES) (Pall, supor®-200-6654)
et le Polytétrafluoroéthylène (PTFE) (Pall, TF-66145). La membrane PES présente un
caractère hydrophile, une perméabilité à l’eau de 4.3 x 10⁻³ m3/s.m2 et un point de bulle à 3.5
bar (données constructeur). La membrane PTFE est une membrane hydrophobe reposant sur
un support en polypropylène et présentant un point minimum de bullage à 1 bar (données
constructeur). Aucune référence bibliographique ne mentionne l’utilisation des membranes
PTFE dans le cas de filtration du vin, d’où le choix de ce matériau. Puisque le PTFE est
hydrophobe, ces membranes sont trempées pendant 24 heures dans une solution hydro-
alcoolique à 95% éthanol afin de mouiller la membrane et de la rendre plus perméable à l’eau
à faibles pressions.
Les membranes se présentent sous la forme de disque plan de 142 mm de diamètre extérieur
et d'une épaisseur de 139 µm. La surface unitaire filtrante d'une membrane est de 0,012 m2
(surface filtrante totale = 0,048 m2) et forme une couronne avec un diamètre intérieur,
Øint=62,25 mm, et extérieur, Øext=135,5 mm (intégrant les corrections dues aux joints
d'étanchéité).
2.3. Fluides filtrés et protocoles expérimentaux
Les fluides utilisés sont soit de l’eau osmosée pour la détermination de la perméabilité initiale
des membranes, soit du vin filtré tangentiellement sur une membrane céramique (0.2 µm)
(VF), soit VF additionné d’un mélange A (VF + Mél. A) simulant le vin brut (VF + 1.25 g/l
tanins + 0.25 g/l pectines + 0.1 g/l mannoprotéines). Les caractéristiques du vin sont fournies
au chapitre II.2. La température a été maintenue constante (20°C) à l’aide d’un cryostat.
Deux campagnes d’expériences ont été menées, chacune pour un type de matériau
membranaire. Le déroulement de ces 2 campagnes est résumé dans le tableau V.1. Par la suite
les résultats seront présentés pour chaque étape et pour les 2 matériaux membranaires en
parallèle.
Chapitre V : Filtration dynamique
169
Tableau V.1 : Déroulement des campagnes de filtration dynamique (TMPmoy. = pression transmembranaire moyenne (cf.V.3.1) et N = fréquence de rotation).
Campagne PES Campagne PTFE
Quantification des pertes de charge linéiques (côté rétentat)
Quantification des pertes de charge linéiques (côté rétentat)
Perméabilité à l’eau Perméabilité à l’eau (après mouillage à l’éthanol)
Filtration du vin filtré (VF) conditions opératoires : TMP, fréquence de
rotation (10 et 20 Hz)
Filtration du vin filtré (VF) conditions opératoires : TMP, fréquence de
rotation (10, 20 et 40 Hz) Rinçage de l’installation à l’eau Rinçage de l’installation à l’eau
Perméabilité à l’eau Perméabilité à l’eau Filtration du VF + Mél. A
J vs N (10, 20, 30 et 40 Hz) à TMP constant J vs TMP à N constant (40 Hz)
Filtration du VF + Mél. A en testant l’impact de la rotation (10, 20, 30 et 40 Hz)
3. Résultats et discussion
Contrairement aux opérations de microfiltration tangentielle précédentes effectuées à pression
constante, les filtrations dynamiques sont réalisées à différentes pressions dépendantes de la
fréquence de rotation appliquée lors de la filtration. Nous présenterons donc nos résultats sous
forme de perméabilité (l/h.m².bar) afin de nous affranchir de l’impact de la variation des
conditions opératoires au cours des deux campagnes de filtration.
3.1. Pertes de charge linéiques et pressions transmembranaires imposées, locales
et moyennes
La première partie de ces deux campagnes (PES et PTFE) est consacrée à la détermination de
la perte de charge en fonction des débits massiques. En effet, ces valeurs de perte de charge
seront utilisées pour corriger les valeurs de la pression transmembranaire mesurée à un débit
donné. La correction permet de calculer les valeurs réelles du flux de perméation ou de
perméabilité. Les résultats présentés sur la figure V.4 ont été obtenus en faisant circuler de
l’eau dans l’installation à différents débits, sans perméation ni rotation (N = 0 Hz).
Pour les deux campagnes, les résultats montrent qu’une augmentation des débits massiques
entraîne une augmentation de la perte de charge. Cependant, l’évolution de la perte de charge
est très différente entre les deux campagnes. La campagne PES montre des pertes de charge
plus élevées que celles obtenues lors de la campagne PTFE. Plusieurs facteurs peuvent
expliquer cette différence. En effet, les 2 campagnes sont séparées par un intervalle de temps
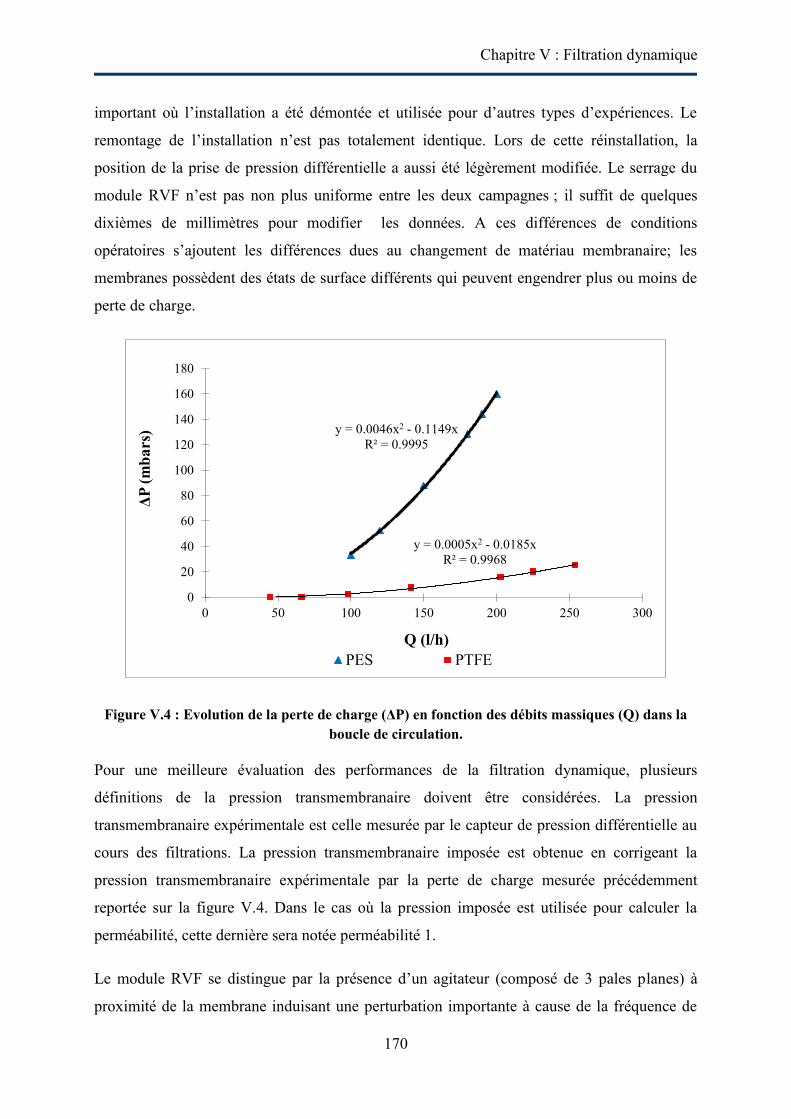
Chapitre V : Filtration dynamique
170
important où l’installation a été démontée et utilisée pour d’autres types d’expériences. Le
remontage de l’installation n’est pas totalement identique. Lors de cette réinstallation, la
position de la prise de pression différentielle a aussi été légèrement modifiée. Le serrage du
module RVF n’est pas non plus uniforme entre les deux campagnes ; il suffit de quelques
dixièmes de millimètres pour modifier les données. A ces différences de conditions
opératoires s’ajoutent les différences dues au changement de matériau membranaire; les
membranes possèdent des états de surface différents qui peuvent engendrer plus ou moins de
perte de charge.
Figure V.4 : Evolution de la perte de charge (ΔP) en fonction des débits massiques (Q) dans la boucle de circulation.
Pour une meilleure évaluation des performances de la filtration dynamique, plusieurs
définitions de la pression transmembranaire doivent être considérées. La pression
transmembranaire expérimentale est celle mesurée par le capteur de pression différentielle au
cours des filtrations. La pression transmembranaire imposée est obtenue en corrigeant la
pression transmembranaire expérimentale par la perte de charge mesurée précédemment
reportée sur la figure V.4. Dans le cas où la pression imposée est utilisée pour calculer la
perméabilité, cette dernière sera notée perméabilité 1.
Le module RVF se distingue par la présence d’un agitateur (composé de 3 pales planes) à
proximité de la membrane induisant une perturbation importante à cause de la fréquence de
y = 0.0046x2 - 0.1149x R² = 0.9995
y = 0.0005x2 - 0.0185x R² = 0.9968
0
20
40
60
80
100
120
140
160
180
0 50 100 150 200 250 300
ΔP (m
bars
)
Q (l/h) PES PTFE
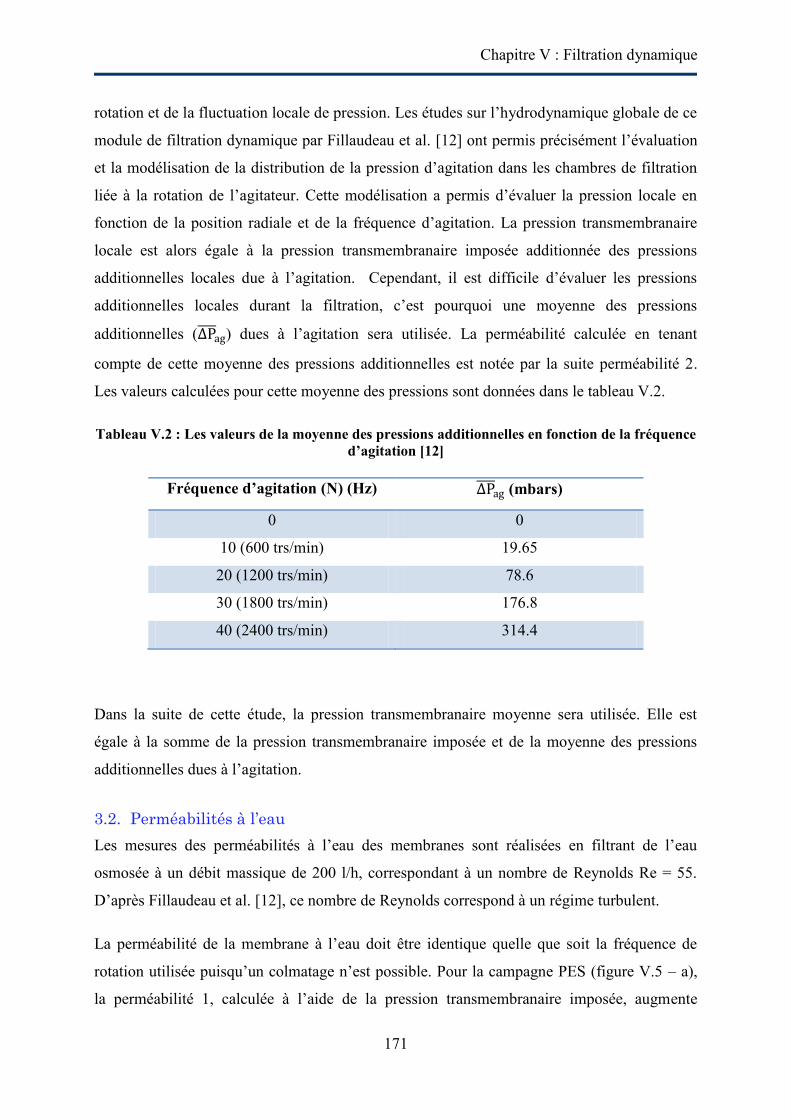
Chapitre V : Filtration dynamique
171
rotation et de la fluctuation locale de pression. Les études sur l’hydrodynamique globale de ce
module de filtration dynamique par Fillaudeau et al. [12] ont permis précisément l’évaluation
et la modélisation de la distribution de la pression d’agitation dans les chambres de filtration
liée à la rotation de l’agitateur. Cette modélisation a permis d’évaluer la pression locale en
fonction de la position radiale et de la fréquence d’agitation. La pression transmembranaire
locale est alors égale à la pression transmembranaire imposée additionnée des pressions
additionnelles locales due à l’agitation. Cependant, il est difficile d’évaluer les pressions
additionnelles locales durant la filtration, c’est pourquoi une moyenne des pressions
additionnelles ( ) dues à l’agitation sera utilisée. La perméabilité calculée en tenant
compte de cette moyenne des pressions additionnelles est notée par la suite perméabilité 2.
Les valeurs calculées pour cette moyenne des pressions sont données dans le tableau V.2.
Tableau V.2 : Les valeurs de la moyenne des pressions additionnelles en fonction de la fréquence d’agitation [12]
Fréquence d’agitation (N) (Hz) (mbars)
0 0
10 (600 trs/min) 19.65
20 (1200 trs/min) 78.6
30 (1800 trs/min) 176.8
40 (2400 trs/min) 314.4
Dans la suite de cette étude, la pression transmembranaire moyenne sera utilisée. Elle est
égale à la somme de la pression transmembranaire imposée et de la moyenne des pressions
additionnelles dues à l’agitation.
3.2. Perméabilités à l’eau
Les mesures des perméabilités à l’eau des membranes sont réalisées en filtrant de l’eau
osmosée à un débit massique de 200 l/h, correspondant à un nombre de Reynolds Re = 55.
D’après Fillaudeau et al. [12], ce nombre de Reynolds correspond à un régime turbulent.
La perméabilité de la membrane à l’eau doit être identique quelle que soit la fréquence de
rotation utilisée puisqu’un colmatage n’est possible. Pour la campagne PES (figure V.5 – a),
la perméabilité 1, calculée à l’aide de la pression transmembranaire imposée, augmente
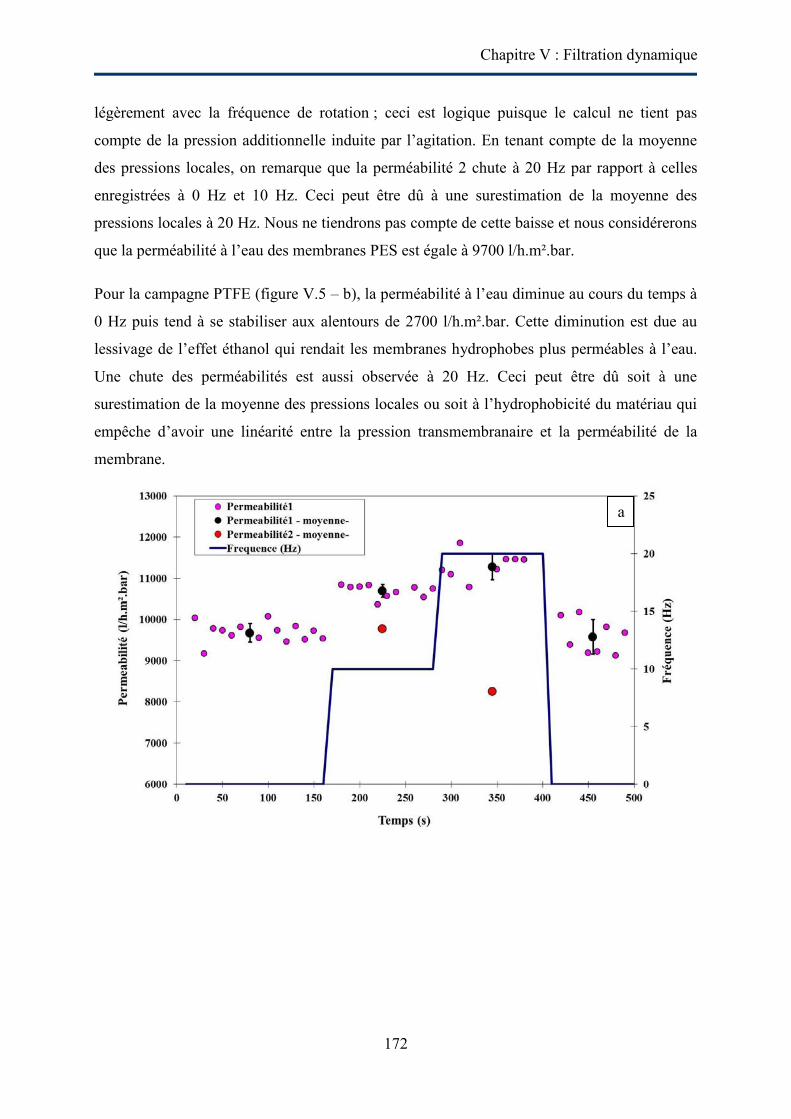
Chapitre V : Filtration dynamique
172
légèrement avec la fréquence de rotation ; ceci est logique puisque le calcul ne tient pas
compte de la pression additionnelle induite par l’agitation. En tenant compte de la moyenne
des pressions locales, on remarque que la perméabilité 2 chute à 20 Hz par rapport à celles
enregistrées à 0 Hz et 10 Hz. Ceci peut être dû à une surestimation de la moyenne des
pressions locales à 20 Hz. Nous ne tiendrons pas compte de cette baisse et nous considérerons
que la perméabilité à l’eau des membranes PES est égale à 9700 l/h.m².bar.
Pour la campagne PTFE (figure V.5 – b), la perméabilité à l’eau diminue au cours du temps à
0 Hz puis tend à se stabiliser aux alentours de 2700 l/h.m².bar. Cette diminution est due au
lessivage de l’effet éthanol qui rendait les membranes hydrophobes plus perméables à l’eau.
Une chute des perméabilités est aussi observée à 20 Hz. Ceci peut être dû soit à une
surestimation de la moyenne des pressions locales ou soit à l’hydrophobicité du matériau qui
empêche d’avoir une linéarité entre la pression transmembranaire et la perméabilité de la
membrane.
a
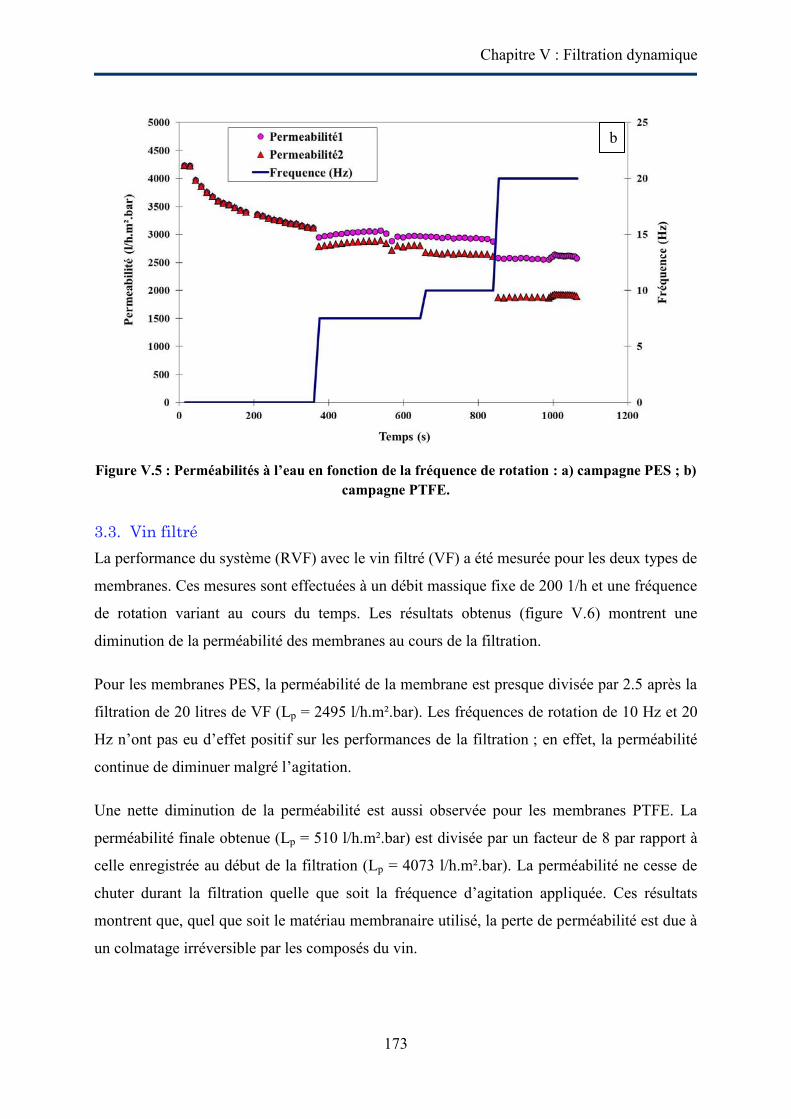
Chapitre V : Filtration dynamique
173
Figure V.5 : Perméabilités à l’eau en fonction de la fréquence de rotation : a) campagne PES ; b)
campagne PTFE.
3.3. Vin filtré
La performance du système (RVF) avec le vin filtré (VF) a été mesurée pour les deux types de
membranes. Ces mesures sont effectuées à un débit massique fixe de 200 1/h et une fréquence
de rotation variant au cours du temps. Les résultats obtenus (figure V.6) montrent une
diminution de la perméabilité des membranes au cours de la filtration.
Pour les membranes PES, la perméabilité de la membrane est presque divisée par 2.5 après la
filtration de 20 litres de VF (Lp = 2495 l/h.m².bar). Les fréquences de rotation de 10 Hz et 20
Hz n’ont pas eu d’effet positif sur les performances de la filtration ; en effet, la perméabilité
continue de diminuer malgré l’agitation.
Une nette diminution de la perméabilité est aussi observée pour les membranes PTFE. La
perméabilité finale obtenue (Lp = 510 l/h.m².bar) est divisée par un facteur de 8 par rapport à
celle enregistrée au début de la filtration (Lp = 4073 l/h.m².bar). La perméabilité ne cesse de
chuter durant la filtration quelle que soit la fréquence d’agitation appliquée. Ces résultats
montrent que, quel que soit le matériau membranaire utilisé, la perte de perméabilité est due à
un colmatage irréversible par les composés du vin.
b
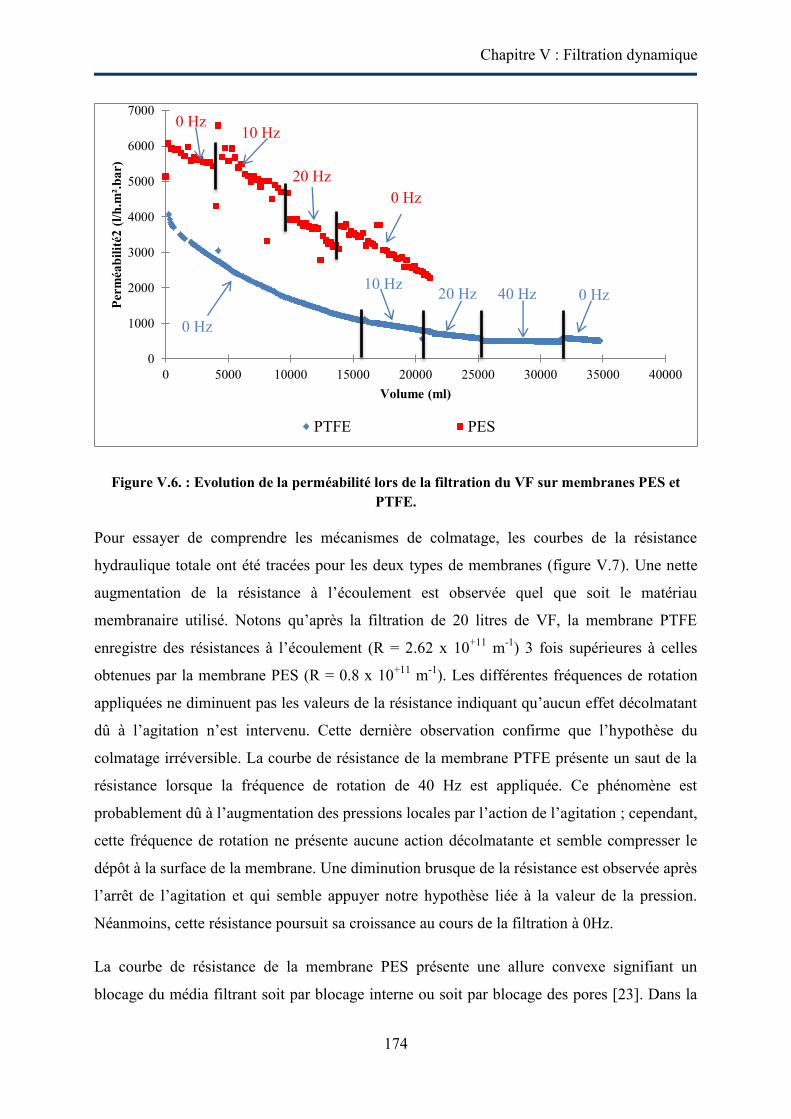
Chapitre V : Filtration dynamique
174
Figure V.6. : Evolution de la perméabilité lors de la filtration du VF sur membranes PES et PTFE.
Pour essayer de comprendre les mécanismes de colmatage, les courbes de la résistance
hydraulique totale ont été tracées pour les deux types de membranes (figure V.7). Une nette
augmentation de la résistance à l’écoulement est observée quel que soit le matériau
membranaire utilisé. Notons qu’après la filtration de 20 litres de VF, la membrane PTFE
enregistre des résistances à l’écoulement (R = 2.62 x 10+11 m-1) 3 fois supérieures à celles
obtenues par la membrane PES (R = 0.8 x 10+11 m-1). Les différentes fréquences de rotation
appliquées ne diminuent pas les valeurs de la résistance indiquant qu’aucun effet décolmatant
dû à l’agitation n’est intervenu. Cette dernière observation confirme que l’hypothèse du
colmatage irréversible. La courbe de résistance de la membrane PTFE présente un saut de la
résistance lorsque la fréquence de rotation de 40 Hz est appliquée. Ce phénomène est
probablement dû à l’augmentation des pressions locales par l’action de l’agitation ; cependant,
cette fréquence de rotation ne présente aucune action décolmatante et semble compresser le
dépôt à la surface de la membrane. Une diminution brusque de la résistance est observée après
l’arrêt de l’agitation et qui semble appuyer notre hypothèse liée à la valeur de la pression.
Néanmoins, cette résistance poursuit sa croissance au cours de la filtration à 0Hz.
La courbe de résistance de la membrane PES présente une allure convexe signifiant un
blocage du média filtrant soit par blocage interne ou soit par blocage des pores [23]. Dans la
0
1000
2000
3000
4000
5000
6000
7000
0 5000 10000 15000 20000 25000 30000 35000 40000
Perm
éabi
lité2
(l/h
.m².b
ar)
Volume (ml)
PTFE PES
0 Hz 10 Hz
20 Hz 0 Hz
0 Hz
10 Hz 20 Hz 40 Hz 0 Hz
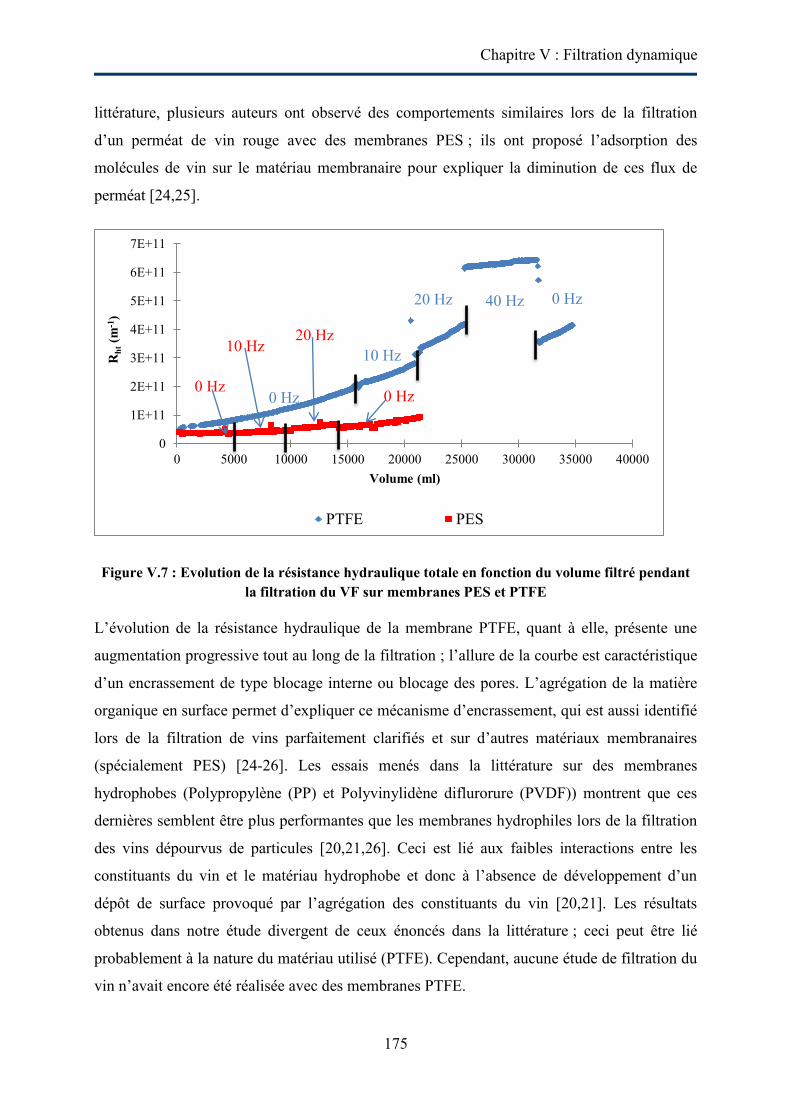
Chapitre V : Filtration dynamique
175
littérature, plusieurs auteurs ont observé des comportements similaires lors de la filtration
d’un perméat de vin rouge avec des membranes PES ; ils ont proposé l’adsorption des
molécules de vin sur le matériau membranaire pour expliquer la diminution de ces flux de
perméat [24,25].
Figure V.7 : Evolution de la résistance hydraulique totale en fonction du volume filtré pendant la filtration du VF sur membranes PES et PTFE
L’évolution de la résistance hydraulique de la membrane PTFE, quant à elle, présente une
augmentation progressive tout au long de la filtration ; l’allure de la courbe est caractéristique
d’un encrassement de type blocage interne ou blocage des pores. L’agrégation de la matière
organique en surface permet d’expliquer ce mécanisme d’encrassement, qui est aussi identifié
lors de la filtration de vins parfaitement clarifiés et sur d’autres matériaux membranaires
(spécialement PES) [24-26]. Les essais menés dans la littérature sur des membranes
hydrophobes (Polypropylène (PP) et Polyvinylidène diflurorure (PVDF)) montrent que ces
dernières semblent être plus performantes que les membranes hydrophiles lors de la filtration
des vins dépourvus de particules [20,21,26]. Ceci est lié aux faibles interactions entre les
constituants du vin et le matériau hydrophobe et donc à l’absence de développement d’un
dépôt de surface provoqué par l’agrégation des constituants du vin [20,21]. Les résultats
obtenus dans notre étude divergent de ceux énoncés dans la littérature ; ceci peut être lié
probablement à la nature du matériau utilisé (PTFE). Cependant, aucune étude de filtration du
vin n’avait encore été réalisée avec des membranes PTFE.
0
1E+11
2E+11
3E+11
4E+11
5E+11
6E+11
7E+11
0 5000 10000 15000 20000 25000 30000 35000 40000
Rht
(m-1
)
Volume (ml)
PTFE PES
40 Hz
0 Hz
10 Hz
20 Hz 0 Hz
20 Hz
0 Hz 0 Hz
10 Hz
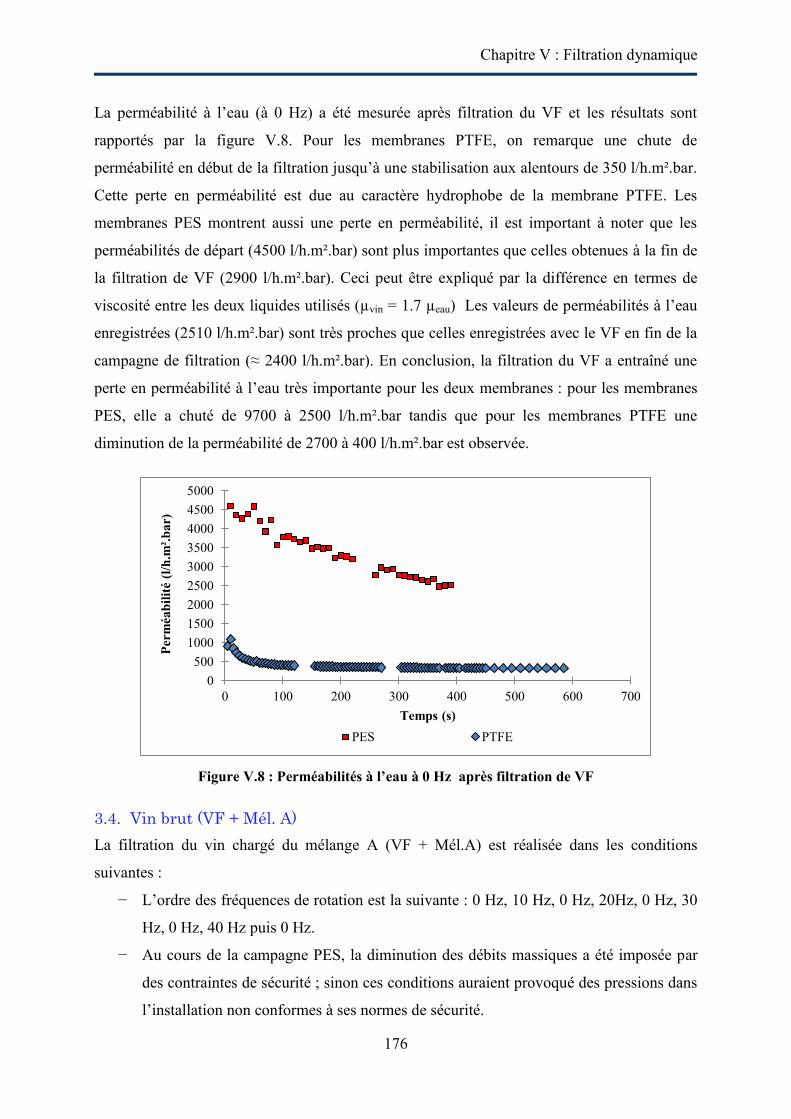
Chapitre V : Filtration dynamique
176
La perméabilité à l’eau (à 0 Hz) a été mesurée après filtration du VF et les résultats sont
rapportés par la figure V.8. Pour les membranes PTFE, on remarque une chute de
perméabilité en début de la filtration jusqu’à une stabilisation aux alentours de 350 l/h.m².bar.
Cette perte en perméabilité est due au caractère hydrophobe de la membrane PTFE. Les
membranes PES montrent aussi une perte en perméabilité, il est important à noter que les
perméabilités de départ (4500 l/h.m².bar) sont plus importantes que celles obtenues à la fin de
la filtration de VF (2900 l/h.m².bar). Ceci peut être expliqué par la différence en termes de
viscosité entre les deux liquides utilisés (µvin = 1.7 µeau) Les valeurs de perméabilités à l’eau
enregistrées (2510 l/h.m².bar) sont très proches que celles enregistrées avec le VF en fin de la
campagne de filtration (≈ 2400 l/h.m².bar). En conclusion, la filtration du VF a entraîné une
perte en perméabilité à l’eau très importante pour les deux membranes : pour les membranes
PES, elle a chuté de 9700 à 2500 l/h.m².bar tandis que pour les membranes PTFE une
diminution de la perméabilité de 2700 à 400 l/h.m².bar est observée.
Figure V.8 : Perméabilités à l’eau à 0 Hz après filtration de VF
3.4. Vin brut (VF + Mél. A)
La filtration du vin chargé du mélange A (VF + Mél.A) est réalisée dans les conditions
suivantes :
− L’ordre des fréquences de rotation est la suivante : 0 Hz, 10 Hz, 0 Hz, 20Hz, 0 Hz, 30
Hz, 0 Hz, 40 Hz puis 0 Hz.
− Au cours de la campagne PES, la diminution des débits massiques a été imposée par
des contraintes de sécurité ; sinon ces conditions auraient provoqué des pressions dans
l’installation non conformes à ses normes de sécurité.
0500
100015002000250030003500400045005000
0 100 200 300 400 500 600 700
Perm
éabi
lité
(l/h.
m².b
ar)
Temps (s) PES PTFE
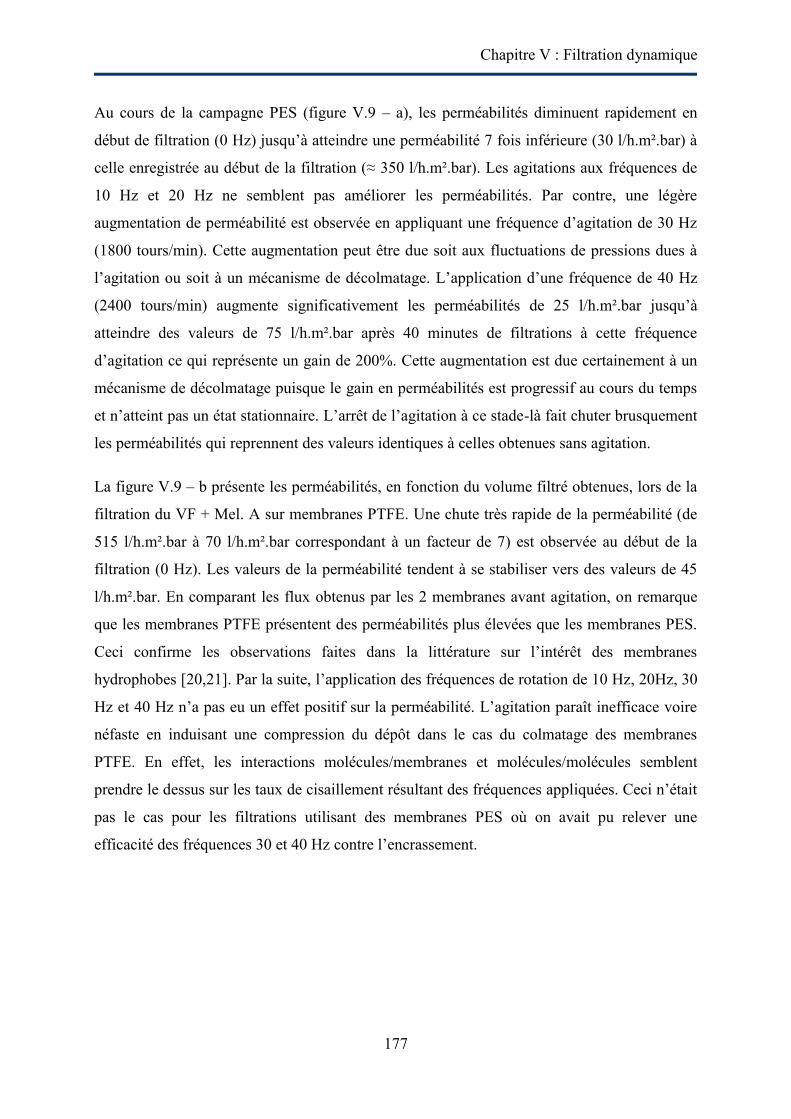
Chapitre V : Filtration dynamique
177
Au cours de la campagne PES (figure V.9 – a), les perméabilités diminuent rapidement en
début de filtration (0 Hz) jusqu’à atteindre une perméabilité 7 fois inférieure (30 l/h.m².bar) à
celle enregistrée au début de la filtration (≈ 350 l/h.m².bar). Les agitations aux fréquences de
10 Hz et 20 Hz ne semblent pas améliorer les perméabilités. Par contre, une légère
augmentation de perméabilité est observée en appliquant une fréquence d’agitation de 30 Hz
(1800 tours/min). Cette augmentation peut être due soit aux fluctuations de pressions dues à
l’agitation ou soit à un mécanisme de décolmatage. L’application d’une fréquence de 40 Hz
(2400 tours/min) augmente significativement les perméabilités de 25 l/h.m².bar jusqu’à
atteindre des valeurs de 75 l/h.m².bar après 40 minutes de filtrations à cette fréquence
d’agitation ce qui représente un gain de 200%. Cette augmentation est due certainement à un
mécanisme de décolmatage puisque le gain en perméabilités est progressif au cours du temps
et n’atteint pas un état stationnaire. L’arrêt de l’agitation à ce stade-là fait chuter brusquement
les perméabilités qui reprennent des valeurs identiques à celles obtenues sans agitation.
La figure V.9 – b présente les perméabilités, en fonction du volume filtré obtenues, lors de la
filtration du VF + Mel. A sur membranes PTFE. Une chute très rapide de la perméabilité (de
515 l/h.m².bar à 70 l/h.m².bar correspondant à un facteur de 7) est observée au début de la
filtration (0 Hz). Les valeurs de la perméabilité tendent à se stabiliser vers des valeurs de 45
l/h.m².bar. En comparant les flux obtenus par les 2 membranes avant agitation, on remarque
que les membranes PTFE présentent des perméabilités plus élevées que les membranes PES.
Ceci confirme les observations faites dans la littérature sur l’intérêt des membranes
hydrophobes [20,21]. Par la suite, l’application des fréquences de rotation de 10 Hz, 20Hz, 30
Hz et 40 Hz n’a pas eu un effet positif sur la perméabilité. L’agitation paraît inefficace voire
néfaste en induisant une compression du dépôt dans le cas du colmatage des membranes
PTFE. En effet, les interactions molécules/membranes et molécules/molécules semblent
prendre le dessus sur les taux de cisaillement résultant des fréquences appliquées. Ceci n’était
pas le cas pour les filtrations utilisant des membranes PES où on avait pu relever une
efficacité des fréquences 30 et 40 Hz contre l’encrassement.
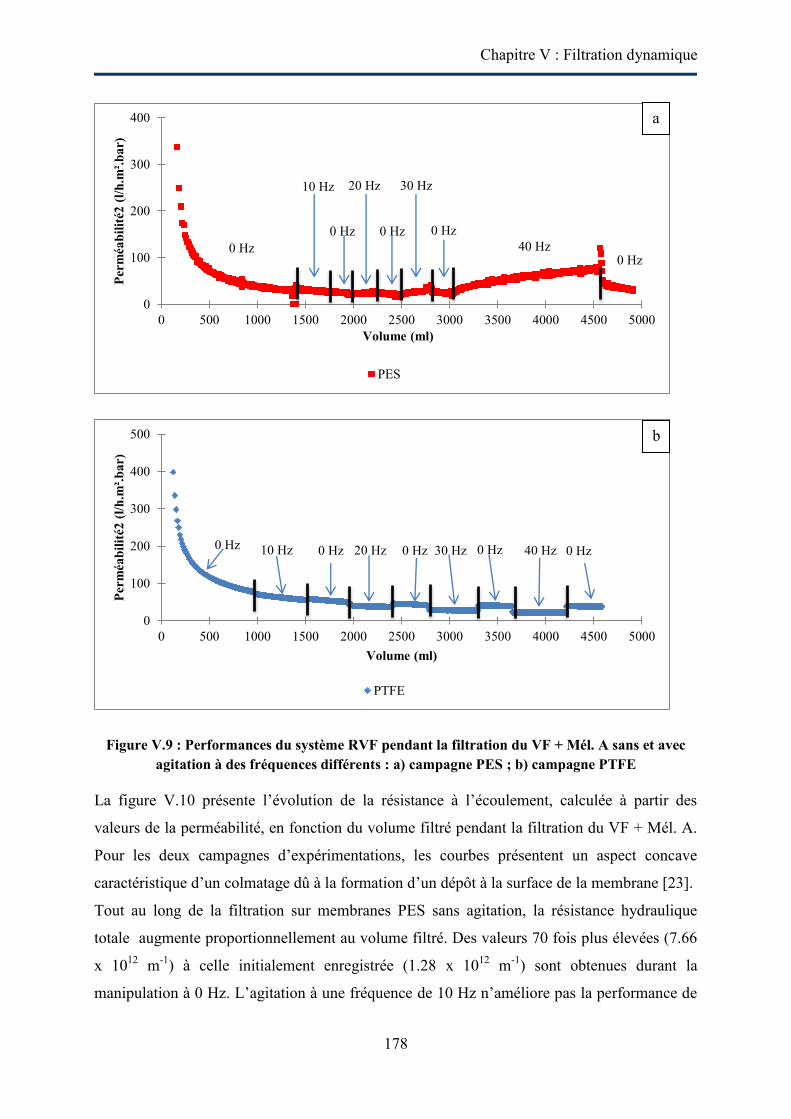
Chapitre V : Filtration dynamique
178
Figure V.9 : Performances du système RVF pendant la filtration du VF + Mél. A sans et avec agitation à des fréquences différents : a) campagne PES ; b) campagne PTFE
La figure V.10 présente l’évolution de la résistance à l’écoulement, calculée à partir des
valeurs de la perméabilité, en fonction du volume filtré pendant la filtration du VF + Mél. A.
Pour les deux campagnes d’expérimentations, les courbes présentent un aspect concave
caractéristique d’un colmatage dû à la formation d’un dépôt à la surface de la membrane [23].
Tout au long de la filtration sur membranes PES sans agitation, la résistance hydraulique
totale augmente proportionnellement au volume filtré. Des valeurs 70 fois plus élevées (7.66
x 1012 m-1) à celle initialement enregistrée (1.28 x 10¹² m-1) sont obtenues durant la
manipulation à 0 Hz. L’agitation à une fréquence de 10 Hz n’améliore pas la performance de
0
100
200
300
400
0 500 1000 1500 2000 2500 3000 3500 4000 4500 5000
Perm
éabi
lité2
(l/h
.m².b
ar)
Volume (ml)
PES
0
100
200
300
400
500
0 500 1000 1500 2000 2500 3000 3500 4000 4500 5000
Perm
éabi
lité2
(l/h
.m².b
ar)
Volume (ml)
PTFE
0 Hz 0 Hz 0 Hz 0 Hz 0 Hz 10 Hz 20 Hz 30 Hz 40 Hz
40 Hz 0 Hz
0 Hz
10 Hz 20 Hz 30 Hz
0 Hz 0 Hz 0 Hz
a
b
Chapitre V : Filtration dynamique
179
la filtration car la pente de la courbe de la résistance totale en fonction du volume filtré reste
inchangée. Par contre, la rotation de l’agitateur à une fréquence de 20 Hz entraîne une
diminution de la résistance totale. L’arrêt de l’agitation entraîne à nouveau une augmentation
de la résistance indiquant un colmatage de la membrane par les molécules du vin
L’application des fréquences de rotation de 30 Hz et 40 Hz diminuent significativement les
résistances totales jusqu’à atteindre des valeurs à 40 Hz 3 fois inférieures (2.85 x 10+12 m-1) à
celles enregistrées avant agitation (9.02 x 10+12 m-1). Ces observations peuvent s’expliquer par
l’action mécanique de l’agitateur qui engendre des forces de cisaillement très élevées à 30 Hz
et 40 Hz rendant la nature du dépôt réversible. Ce dispositif mécanique simple (géométrie et
nombre de pales, entrefer faible), appliqué en continu, permet de maintenir une contrainte
élevée ainsi qu’une perturbation de la couche limite hydrodynamique.
Figure V.10 : Evolution de la résistance hydraulique totale durant la filtration du VF+ Mél.A sur membranes PES et PTFE.
L’évolution de la résistance hydraulique lors de la campagne PTFE montre que ces
membranes présentent des valeurs de résistance hydraulique totale nettement inférieures à
celles obtenues avec les membranes PES. Ceci montre que l’adsorption et le dépôt des
molécules de vin sont favorisés par le caractère hydrophile plus que par le caractère
hydrophobe de la membrane. Ces résultats sont en adéquation avec ceux obtenus dans la
0
2E+12
4E+12
6E+12
8E+12
1E+13
1.2E+13
1.4E+13
0 1000 2000 3000 4000 5000 6000
Rht
(m-1
)
Volume (ml) PTFE PES
0 Hz
10 Hz 0 Hz
20 Hz 0 Hz
0 Hz 0 Hz
30 Hz
40 Hz
0 Hz
0 Hz
20 Hz
0 Hz
30 Hz
0 Hz
10 Hz
40 Hz 0 Hz
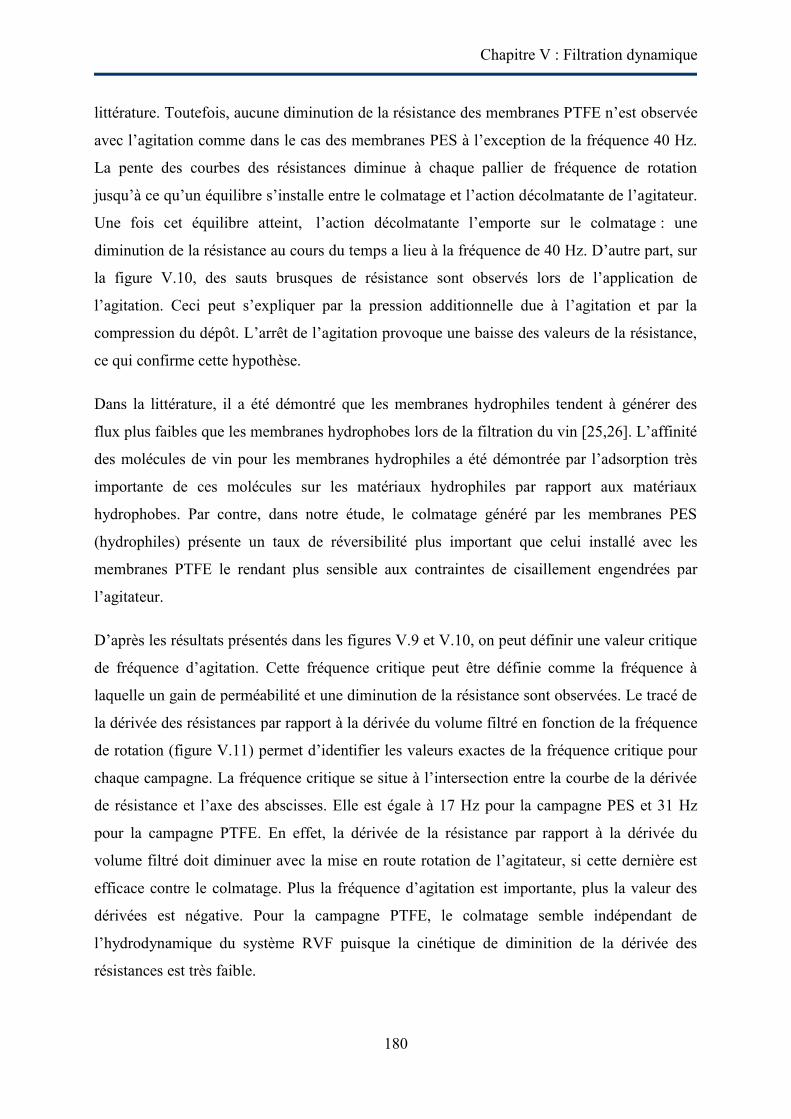
Chapitre V : Filtration dynamique
180
littérature. Toutefois, aucune diminution de la résistance des membranes PTFE n’est observée
avec l’agitation comme dans le cas des membranes PES à l’exception de la fréquence 40 Hz.
La pente des courbes des résistances diminue à chaque pallier de fréquence de rotation
jusqu’à ce qu’un équilibre s’installe entre le colmatage et l’action décolmatante de l’agitateur.
Une fois cet équilibre atteint, l’action décolmatante l’emporte sur le colmatage : une
diminution de la résistance au cours du temps a lieu à la fréquence de 40 Hz. D’autre part, sur
la figure V.10, des sauts brusques de résistance sont observés lors de l’application de
l’agitation. Ceci peut s’expliquer par la pression additionnelle due à l’agitation et par la
compression du dépôt. L’arrêt de l’agitation provoque une baisse des valeurs de la résistance,
ce qui confirme cette hypothèse.
Dans la littérature, il a été démontré que les membranes hydrophiles tendent à générer des
flux plus faibles que les membranes hydrophobes lors de la filtration du vin [25,26]. L’affinité
des molécules de vin pour les membranes hydrophiles a été démontrée par l’adsorption très
importante de ces molécules sur les matériaux hydrophiles par rapport aux matériaux
hydrophobes. Par contre, dans notre étude, le colmatage généré par les membranes PES
(hydrophiles) présente un taux de réversibilité plus important que celui installé avec les
membranes PTFE le rendant plus sensible aux contraintes de cisaillement engendrées par
l’agitateur.
D’après les résultats présentés dans les figures V.9 et V.10, on peut définir une valeur critique
de fréquence d’agitation. Cette fréquence critique peut être définie comme la fréquence à
laquelle un gain de perméabilité et une diminution de la résistance sont observées. Le tracé de
la dérivée des résistances par rapport à la dérivée du volume filtré en fonction de la fréquence
de rotation (figure V.11) permet d’identifier les valeurs exactes de la fréquence critique pour
chaque campagne. La fréquence critique se situe à l’intersection entre la courbe de la dérivée
de résistance et l’axe des abscisses. Elle est égale à 17 Hz pour la campagne PES et 31 Hz
pour la campagne PTFE. En effet, la dérivée de la résistance par rapport à la dérivée du
volume filtré doit diminuer avec la mise en route rotation de l’agitateur, si cette dernière est
efficace contre le colmatage. Plus la fréquence d’agitation est importante, plus la valeur des
dérivées est négative. Pour la campagne PTFE, le colmatage semble indépendant de
l’hydrodynamique du système RVF puisque la cinétique de diminition de la dérivée des
résistances est très faible.

Chapitre V : Filtration dynamique
181
Figure V.11 : Représentation graphique de la dérivée de la résistance par rapport à la dérivée du volume filtré en fonction de la fréquence de rotation
La campagne PES a été prolongée en filtrant VF + Mel. A à 40 Hz tout en diminuant la
pression transmembranaire imposée. Les résultats présentés sur la figure V.12 montrent que la
perméabilité continue à augmenter jusqu’à atteindre 6 fois (116 l.h.m².bar) la perméabilité
enregistrée au début de la filtration (19.8 l/h.m².bar). Cette augmentation est valable même en
diminuant les pressions transmembranaires imposées par un facteur deux. La rupture des
membranes PES est observée en diminuant la pression transmembranaire imposée en dessous
de 360 mbars. Deux conclusions peuvent être tirées de cette expérience :
- L’augmentation de la perméabilité est due à l’action de la rotation de l’agitateur à la
surface des membranes.
- L’effet décolmatant de l’agitateur masque l’effet négatif de la diminution de la
pression transmembranaire moyenne d’où la capacité de travailler pour la suite à des
faibles pressions transmembranaires et faibles débits de circulation.
-1.E+10
-1.E+10
-8.E+09
-6.E+09
-4.E+09
-2.E+09
0.E+00
2.E+09
4.E+09
6.E+09
8.E+09
1.E+10
0 2 4 6 8 10 12 14 16 18 20 22 24 26 28 30 32 34 36 38 40 42
dR/d
V
Fréquence de rotation (Hz)
PTFE PES
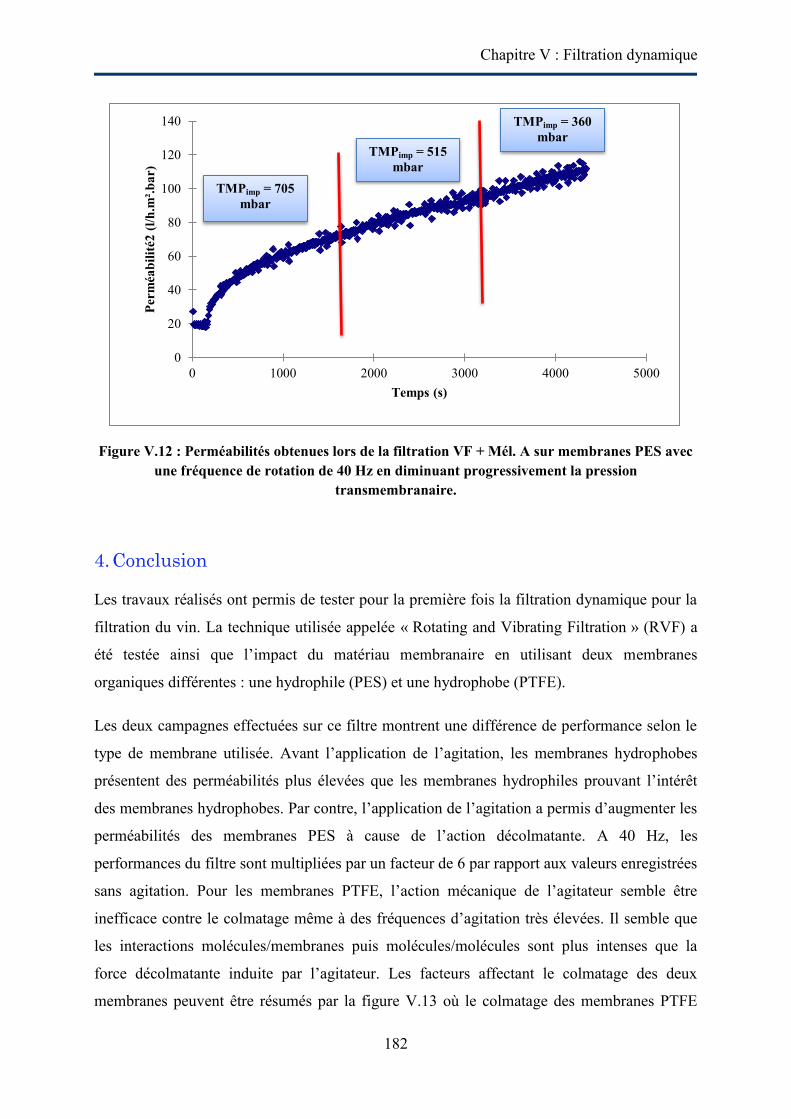
Chapitre V : Filtration dynamique
182
Figure V.12 : Perméabilités obtenues lors de la filtration VF + Mél. A sur membranes PES avec une fréquence de rotation de 40 Hz en diminuant progressivement la pression
transmembranaire.
4. Conclusion
Les travaux réalisés ont permis de tester pour la première fois la filtration dynamique pour la
filtration du vin. La technique utilisée appelée « Rotating and Vibrating Filtration » (RVF) a
été testée ainsi que l’impact du matériau membranaire en utilisant deux membranes
organiques différentes : une hydrophile (PES) et une hydrophobe (PTFE).
Les deux campagnes effectuées sur ce filtre montrent une différence de performance selon le
type de membrane utilisée. Avant l’application de l’agitation, les membranes hydrophobes
présentent des perméabilités plus élevées que les membranes hydrophiles prouvant l’intérêt
des membranes hydrophobes. Par contre, l’application de l’agitation a permis d’augmenter les
perméabilités des membranes PES à cause de l’action décolmatante. A 40 Hz, les
performances du filtre sont multipliées par un facteur de 6 par rapport aux valeurs enregistrées
sans agitation. Pour les membranes PTFE, l’action mécanique de l’agitateur semble être
inefficace contre le colmatage même à des fréquences d’agitation très élevées. Il semble que
les interactions molécules/membranes puis molécules/molécules sont plus intenses que la
force décolmatante induite par l’agitateur. Les facteurs affectant le colmatage des deux
membranes peuvent être résumés par la figure V.13 où le colmatage des membranes PTFE
0
20
40
60
80
100
120
140
0 1000 2000 3000 4000 5000
Perm
éabi
lité2
(l/h
.m².b
ar)
Temps (s)
TMPimp = 705 mbar
TMPimp = 515 mbar
TMPimp = 360 mbar
Chapitre V : Filtration dynamique
183
semble être affecté énormément par les interactions molécules/membrane et celui des
membranes PES plutôt affecté par un équilibre entre l’hydrodynamique du système et la
matière déposée.
Figure V.13 : Facteurs affectant le colmatage des membranes PTFE et PES.
Dans cette étude aussi, on a pu déterminer une fréquence critique d’agitation définie comme
la fréquence à laquelle un gain de perméabilité et une diminution de la résistance totale sont
observées. Cette fréquence critique est égale à 17 Hz pour les membranes PES, tandis qu’elle
est aux alentours de 31 Hz pour les membranes PTFE.
Cette technique RVF s’avère particulièrement intéressante pour la filtration du vin car c’est la
première fois qu’on dispose d’un procédé décolmatant sans avoir recours à l’inversion du
perméat. Cette technologie permet aussi de travailler avec des faibles pressions
transmembranaires ainsi que des faibles débits de circulation.
Références
[1] S.G. Redkar, R.H. Davis, Cross-flow microfiltration with high-frequency reverse filtration, Aiche J. 41 (1995) 501-508. [2] V. Kuberkar, P. Czekaj, R. Davis, Flux enhancement for membrane filtration of bacterial suspensions using high-frequency backpulsing, Biotechnol. Bioeng. 60 (1998) 77-87. [3] R.J. Wakeman, E.S. Tarleton, An experimental-study of electroacoustic cross-flow microfiltration, Chem. Eng. Res. Des. 69 (1991) 386-397. [4] D. Chen, L.K. Weavers, H.W. Walker, J.J. Lenhart, Ultrasonic control of ceramic membrane fouling caused by natural organic matter and silica particles, J. Membr. Sci. 276 (2006) 135-144. [5] R.J. Wakeman, C.J. Williams, Additional techniques to improve microfiltration, Sep. Purif. Technol. 26 (2002) 3-18. [6] Z.F. Cui, K.I.T. Wright, Flux enhancements with gas sparging in downwards crossflow ultrafiltration: Performance and mechanism, J. Membr. Sci. 117 (1996) 109-116.
Chapitre V : Filtration dynamique
184
[7] T.Y. Chiu, A.E. James, Effects of axial baffles in non-circular multi-channel ceramic membranes using organic feed, Sep. Purif. Technol. 51 (2006) 233-239. [8] B.B. Gupta, A. Chaibi, M.Y. Jaffrin, Ultrafiltration of albumin ethanol solutions on mineral membranes, Sep. Sci. Technol. 30 (1995) 53-71. [9] M.Y. Jaffrin, Dynamic shear-enhanced membrane filtration: A review of rotating disks, rotating membranes and vibrating systems, J. Membr. Sci. 324 (2008) 7-25. [10] J.A. Howell, R.W. Field, D.X. Wu, Yeast-cell microfiltration – Flux enhancement and pulsatile flow systems, J. Membr. Sci. 80 (1993) 59-71. [11] H.R. Millward, B.J. Bellhouse, I.J. Sobey, R.W.H. Lewis, Enhancement of plasma filtration using the concept of the vortex wave, J. Membr. Sci. 100 (1995) 121-129. [12] L. Fillaudeau, B. Boissier, S. Ermolaev, N. Jitariouk, A. Gourdon, Etude hydrodynamique d’un module de filtration dynamique pour fluides alimentaires, Ind. Alim. Agr. 124 (2007) 8-16. [13] J. Snyder, H. Haughney, Use of vibrating membrane filter for the recovery of beer from surplus yeast, MBAA TQ 36 (1999) 191-193. [14] J. Schneider, M. Krottenthaler, W. Back, H. Weisser, Vibrating membrane filtration of mash for the beer production, 28th congress of the European brewery convention, Budapest (Hungary), May 2001. [15] J. Pratt, Non-fouling membrane filter to recover beer from surplus yeast, Brewing and Distilling Int. 32 (2001) 13-14. [16] M. Bock, F. Rögener, Beer recovery from spent yeast with Keraflux membranes, Brewing and Beverage Ind. 3 (2002) 8-10. [17] C.A. Serra, M.R. Wiesner, J.M. Lainé, Rotating membrane disk filters, design evaluation using computational fluid dynamics, Chem. Eng. J. 72 (1999) 191-193. [18] R. Bouzerar, L. Ding, M.Y. Jaffrin, Local permeate flux-shear-pressure relationships in a rotating disk microfiltration module: implications for global performances, J. Membr. Sci. 170 (2000) 127-141. [19] L. Fillaudeau, B. Boissier, A. Moreau, P. Blanpain-avet, S. Ermolaev, N. Jitariouk, A. Gourdon, Investigation of rotating and vibrating filtration for clarification of rough beer, J. Food Eng. 80 (2007) 206-217. [20] A. Urkiaga, L. De las Fuentes, M. Acilu, J. Uriarte, Membrane comparison for wine clarification by microfiltration, Desalination 148 (2002) 115-120. [21] M. Ulbricht, W. Ansorge, I. Danielzik, M. Konig, O. Schuster, Fouling in microfiltration of wine: The influence of the membrane polymer on adsorption of polyphenols and polysaccharides. Sep. Purif. Technol. 68 (2009) 335-342. [22] Y. Mannon, D. Anne-Archard, J.-L. Uribelarrea, C. Molina-Jouve, L. Fillaudeau, Physical and biological study of cell cultures in a bioreactor: on-line and off-line rheological analyses, Applied Rheology 21 (2011) In press. [23] E.M. Tracey, R.H. Davis, Protein fouling of track-etched polycarbonate microfiltration membranes, J. Colloid Interface Sci. 167 (1994) 104-116. [24] A. Vernhet, M. Moutounet, Fouling of organic microfiltration membranes by wine constituents: importance, relative impact of wine polysccharides and polyphenols and incidence of membrane properties, J. Membr. Sci. 201 (2002) 103-122. [25] A. Vernhet, D. Cartalade, M. Moutounet, Contribution to the understanding of fouling build-up during microfiltration of wines, J. Membr. Sci. 211 (2003) 357-370. [26] B. Boissier, F. Lutin, M. Moutounet, A. Vernhet, Particles deposition during the cross-flow microfiltration of red wines-incidence of the hydrodynamic conditions and of the yeast to fines ratio, Chem. Eng. Process. 47 (2008) 276-286.
Conclusions générales
et perspectives
Conclusion générale
186
En dépit de ses avantages, la microfiltration tangentielle a eu du mal à s’implanter dans la
filière œnologique à cause des flux de perméation incompatibles avec la rentabilité
économique. Malgré les avancées technologiques surtout par l’introduction des rétro-
filtrations, ce procédé souffre toujours des flux faibles provoqués par le colmatage des
membranes par les molécules du vin.
Dans le cadre de cette thèse, l’amélioration des performances des filtres tangentiels a été
visée. Cette étude s’insère dans le cadre d’une collaboration entre le Laboratoire de Génie
Chimique, l’équipe de génie des procédés de la faculté d’œnologie de Bordeaux et la société
« PERA », afin d’associer au mieux les compétences nécessaires à la fois à la prise en
comptes des règles élémentaires du Génie des Procédés, à la connaissance approfondie de la
chimie et de la physicochimie du vin, cela dans un contexte compatible avec la réalité du
secteur viticole.
L’étude bibliographique (chapitre I), a permis de mettre en évidence la nécessité de mieux
comprendre et définir les mécanismes impliqués dans le colmatage des membranes par les
molécules du vin afin d’améliorer les performances de filtration. L’état de l’art a montré qu’il
existe très peu de connaissances et d’études académiques concernant les mécanismes de
colmatage par les molécules du vin ainsi que la contribution individuelle de chacune des
molécules. Ainsi, les objectifs de cette étude ont pu être orientés vers :
- l’évaluation de la contribution individuelle de chacune des molécules de vin identifiée
comme colmatante.
- La compréhension et la modélisation des mécanismes de colmatage induits par les
molécules étudiées
- La recherche des conditions opératoires critiques dans le but de limiter le colmatage et
améliorer les performances
- La recherche d’un nouveau procédé ou une nouvelle membrane pouvant créer une
rupture technologique puisque les filtres conventionnels ont presque atteint les limites
du progrès.
Toutes les expériences (sauf pour le dernier objectif) ont été réalisées à l’aide d’un pilote
conçu spécialement pour l’étude, équipé d’une membrane céramique multicanaux (seuil de
coupure 0.2 µm). Un vin rouge filtré et stabilisé a été utilisé comme matrice de base auquel
les molécules modèles étudiées (tannins, pectines, mannoprotéines et levures) sont ajoutées.
Conclusion générale
187
Les principales conclusions des expérimentations menées durant cette thèse sont détaillées ci-
après :
Dans un premier temps, la contribution individuelle des composés du vin (tannins, pectines,
mannoprotéines et levures) au colmatage des membranes de microfiltration a été évaluée ainsi
que les mécanismes de colmatage ont été analysés en utilisant une approche fondamentale. Il
est ressorti de ces expériences que :
- Le vin filtré (matrice de base) seul induit très peu de colmatage. Une adsorption des
molécules en solution en est la cause provoquant une perte de perméabilité de la
membrane inférieure à 10%.
- Pour les vins chargés de tanins, et en fin des filtrations (35 l/m²), les flux de
perméation sont presque identiques et quasi-stables indépendamment des conditions
opératoires (variation de la pression transmembranaire 0.5 ou 1 bar). Ceci montre que
la filtration dans ce cas est gouvernée par la contrainte de cisaillement induite par le
flux tangentiel plutôt que par la pression transmembranaire. La formation de gâteau est
le mécanisme identifié au cours de ces filtrations. D’après les modélisations menées et
l’analyse de la littérature, le mécanisme le plus probable comprend une interaction très
rapide entre les tanins et la membrane suivie par des interactions tanins-tanins menant
à l’agrégation de ces molécules à la surface de la membrane aboutissant à la formation
d’un dépôt
- Les filtrations menées avec des vins chargés de pectines présentent les flux de
perméation les plus faibles. Ces résultats sont indépendants de la concentration en
pectines (0.25 g/l ou 0.5 g/l) même si cette dernière est divisée par un facteur 5 ou 10
(0.05 g/l). La formation d’un gel à la surface de la membrane est identifiée comme le
mécanisme de colmatage. Pour une concentration donnée en pectines, l’augmentation
de la pression transmembranaire entraîne une augmentation de la résistance à
l’écoulement induite par le transfert élevé des pectines vers la surface de la membrane
rendant le gel plus épais et plus dense. L’addition d’enzymes, pratique courante dans
les caves, aux vins chargés en pectines améliore d’une façon significative (jusqu’à
200%) les flux de perméation.
- La filtration des vins additionnés de mannoprotéines montre qu’un plateau des valeurs
de flux de perméation est obtenu en dépassant une concentration limite de
Conclusion générale
188
mannoprotéines inférieure à 100mg/l. Plusieurs mécanismes de colmatage ont été
identifiés lors de ces filtrations dépendant de la pression transmembranaire (colmatage
par gâteau à 0.5 bar, transitions de mécanismes à 1 bar, blocage complet /intermédiaire
/dépôt).
- L’addition des levures (105 lev./ml) au vin filtré entraîne la plus faible résistance
hydraulique comparé aux trois autres composés testés. Par contre, en cas de mélange
avec des molécules, leur présence tend à améliorer les flux de filtration par formation
d’une membrane dynamique qui va permettre de retenir une partie des colloïdes
retardant le colmatage par ces derniers (au pouvoir colmatant élevé).
- En vérifiant l’impact de la microfiltration tangentielle sur la composition des filtrats, il
a été observé que: i) la turbidité est toujours inférieure à 2 NTU, ii) 6 à 8% des tanins
sont retenus par la membrane, iii) les filtrats montrent une baisse de 32 à 40% en
polysaccharides (mannoprotéines et pectines), iv) l’addition des levures ne modifie pas
la qualité du vin, v) les paramètres qualitatifs (IC et IPT) pour tous les vins sont peu
affectés par la filtration.
- Cette étude a permis aussi de montrer que la turbidité ne peut pas être un outil de
prédiction des performances dans le cas de microfiltration tangentielle du vin. En
effet, aucune relation directe n’a pu être établie en comparant les flux obtenus sous
une pression donnée et la turbidité initiale des vins.
Dans un deuxième temps, les conditions opératoires critiques ont été recherchées. La méthode
utilisée (SWB) consiste en des variations successives d’échelons de pressions positives et
négatives permettant de connaître le degré de réversibilité du colmatage lorsque la pression
s’élève. Cette méthode, utilisée pour la première fois dans le domaine alimentaire, s’est
montrée fiable pour la détermination des flux critiques pour l’irréversibilité (flux de perméat
au-delà duquel un colmatage irréversible apparaît à la surface de la membrane).
Pour les molécules testées (tannins, pectines et mannoprotéines), aucun flux critique pour
l’irréversibilité (sauf pour le vin filtré seul, Jci > 1.4 x 10⁻⁴ m/s) n’a pu être déterminé dans la
gamme de pressions choisies (0.2 – 1 bar). En effet, le colmatage par ces molécules se produit
dès les premières minutes même aux faibles pressions transmembranaires. Par contre, on a pu
déterminer la valeur supérieure de l’intervalle où se situe le flux critique pour chaque solution
filtrée. Au delà d’une valeur de pression transmembranaire, une diminution inattendue des
Conclusion générale
189
flux est observée pour des vins chargés de 0.5 g/l de pectines (pression > 0.4 bar) et 0.2 g/l de
mannoprotéines (pression > 0.6 bar). Ce phénomène a été attribué à la compression des dépôts
formés par ces molécules.
Comme le colmatage est inévitable avec les molécules du vin, nous avons proposé un
nouveau critère qui devrait permettre d’opérer avec un degré de colmatage acceptable. Ce
critère a été choisi de telle sorte que la résistance hydraulique totale soit inférieure ou égale au
double de la résistance de la membrane (Rif/Rm ≤ 1).
La dernière partie de ce travail a été consacrée à une campagne d’essais sur un nouveau
procédé pouvant éventuellement d’aboutir à une rupture technologique. Nous avons testé la
filtration dynamique équipée par la technologie « Rotating and Vibrating Filtration (RVF)»
avec deux membranes organiques différentes : hydrophile (PES) et hydrophobe (PTFE). Ce
travail est l’une des premières contributions sur l’application de la filtration dynamique pour
la clarification des vins bruts.
Cette technologie s’est avérée particulièrement intéressante avec les membranes PES. En
effet, l’application de l’agitation a permis d’augmenter les perméabilités des membranes PES
lors de la filtration du vin simulant le vin brut à cause de son action décolmatante
(spécialement à 40 Hz = 2400 tours/min). Par contre, l’action de l’agitateur semble être
inefficace dans le cas des membranes hydrophobes (PTFE) et tend au contraire à compresser
le dépôt formé à la surface de la membrane. Ces observations ont permis de mettre en
évidence que le colmatage des membranes PTFE est énormément affecté par les interactions
molécules/membrane tandis que celui des membranes PES est plutôt affecté par un équilibre
entre l’hydrodynamique du système et la matière déposée.
Finalement, les résultats obtenus ont permis de déterminer une fréquence critique d’agitation
définie comme la fréquence à laquelle un gain de perméabilité et une diminution de la
résistance totale sont observées. Cette fréquence critique est égale à 17 Hz pour les
membranes PES, tandis qu’elle est aux alentours de 31 Hz pour les membranes PTFE. Ces
derniers résultats confirment qu’il peut exister des conditions opératoires critiques limitant le
colmatage dans la filtration du vin. Il est possible dans le futur d’associer le principe du flux
critique pour l’irréversibilité (étudié dans le chapitre IV) avec des contraintes de cisaillement
élevées qui peuvent être engendrées par une action mécanique autre que le flux tangentiel.
Conclusion générale
190
L’éfficacité de cette association sera dépendante de la nature de la membrane utilisée, de la
composition chimique du vin ainsi que de l’action mécanique choisie.
Les perspectives qui se dégagent de ces travaux pourraient être orientées de la façon suivante :
Le développement des travaux de recherche fondamentaux sur les propriétés physico-
chimiques des colloïdes du vin, pour mieux appréhender leur impact sur le colmatage,
et les conséquences technologiques que cela pourrait avoir, (agrégation et formation
de dépôt, structure de ces dépôts, protocoles de filtration-nettoyage, facteurs
environnementaux influençant, etc…).
Il serait opportun de mettre à la disposition des œnologues un test simple et prédictif
des comportements des flux pendant les opérations de microfiltration tangentielle pour
optimiser les performances par une adaptation des conditions opératoires, qui reste
aisée dans le cas des procédés baromembranaires.
Tester plusieurs vitesses tangentielles et leurs taux de cisaillement associés qui
peuvent influencer les valeurs des flux critiques, évaluer la pertinence du critère
choisi.
Poursuivre les études sur le filtre dynamique RVF en testant plusieurs matériaux
membranaires pour choisir le plus adéquat. Comparer, si possible, les performances de
cette technologie avec d’autres types de filtres dynamiques (membrane vibrante ou en
rotation, etc). Puis valider les résultats obtenus avec des vins bruts réels.
191
REFERENCES
A – B – C P. Aimar, P. Bacchin and A. Maurel, Filtration membranaire (OI, NF, UF, MFT) Aspects théoriques: perméabilité et sélectivité. Techniques de l’ingénieur J2790 (2010) v2-1 – v2-20. N. Arora, R.H. Davis, Yeast cake layers as secondary membranes in dead-end microfiltration of bovine serum albumin, J. Membr. Sci. 92 (1994) 247-256.
J.P. Arriagada-Carrazana, C. Saez-Navarrete, R. Brodeu, Membrane filtration effects on aromatic and phenolic quality of Cabernet Sauvignon wines, J. Food Eng. 68 (2005) 363-368.
P. Bacchin, D. Si-Hassen, V. Starov, M.J. Clifton, P. Aimar, A unifying model for concentration polarization, gel-layer formation and particle deposition in cross-flow membrane filtration of colloidal suspensions, Chem. Eng. Sci. 57 (2002) 77-91.
P. Bacchin, P. Aimar, Critical fouling conditions induced by colloidal surface interaction: from causes to consequences, Desalination. 175 (2005) 21-27.
P. Bacchin, P. Aimar, R.W. Field, Critical and sustainable fluxes: Theory, experiments and applications. J. Membr. Sci. 281 (2006) 42-69.
P. Bacchin, P. Aimar, V. Sanchez, Model for colloidal fouling of membranes, AIChE J. 41 (1995) 368.
N.J. Baxter, T.H. Lilley, E. Haslam, M.P. Williamson, Multiple interactions between polyphenols and a salivary proline-rich protein repeat result in complexation and precipitation, Biochemistry 36 (1997) 5566-5577.
G. Belfort, R.H. Davis, A.L. Zydney, The behaviour of suspensions and macromolecules solutions in cross-flow microfiltration, J. Membr. Sci. 96 (1994) 1-58.
M.P. Belleville, J.M. Brillouet, B.T. Delafuente, M. Moutounet, Fouling colloids during microporous alumina membrane filtration of wine, J.Food Sci. 57 (1992) 396-400.
M.P. Belleville, J.M. Brillouet, B.T. Delafuente, M. Moutounet, Polysaccharide effects on cross-flow microfiltration of 2 red wines with a microporous alumina membrane, J.Food Sci. 55 (1990) 1598-1602.
M. Blain, Clarification des moûts de chauffage de la vendange par filtration tangentielle: Expérimentations complémentaires sur les moûts et les vins, pour démontrer la polyvalence du même matériel, Revue des oenologues et des techniques vitivinicoles et œnologiques, 93S (1999) 41-43.
M. Bock, F. Rögener, Beer recovery from spent yeast with Keraflux membranes, Brewing and Beverage Ind. 3 (2002) 8-10.
B. Boissier, F. Lutin, M. Moutounet, A. Vernhet, Particles deposition during the cross-flow microfiltration of red wines-incidence of the hydrodynamic conditions and of the yeast to fines ratio, Chem. Eng. Process. 47 (2008) 276-286.
192
C. Bonnet-Gonnet, L. Belloni, B. Cabane, Osmotic pressure of latex dispersions, Langmiur 10 (1994) 4012-4021.
A. Bouchoux, P.E. Cayemitte, J. Jardin, G. Gésan-Guiziou, B. Cabane, Casein micelle dispersions under osmotic pressure, Biophysic. J. 96 (2009) 693-706.
R. Boulton, The copigmentation of anthocyanins and its role in the color of red wine: A critical review, Am. J. Enol. Vitic. 52 (2001) 67-87.
R. Bouzerar, L. Ding, M.Y. Jaffrin, Local permeate flux-shear-pressure relationships in a rotating disk microfiltration module: implications for global performances, J. Membr. Sci. 170 (2000) 127-141.
W.R. Bowen, F. Jenner, Theoretical descriptions of membrane filtration of colloids and fine particles: An assessment and review, Adv. Colloid Interface Sci. 56 (1995) 141-200.
Broeckmann, J. Busch, T. Wintgens, W. Marquardt, Modeling of pore blocking and cake layer formation in membrane filtration for wastewater treatment, Desalination 189 (2006) 97-109.
P.J. Cameira Dos Santos, Colmatage en microfiltration tangentielle: mise en evidence d’interactions entre les polysaccharides et les polyphénols d’un vin et des membranes polymériques, Ph. D. Thesis. University of Montpellier II. Ecole Nationale Supérieure Agronomique de Montpellier, 1995.
R.M. Canal-Llaubères, G. Reynou-Gravier, A. Embeita, Intérêt économique d’une pectinsase purifiée pour l’extraction et le débourbage : Synthèse d’essais industriels en blanc et rosé, Revue des œnologues 137 (2010) 12-14.
Cassano, A. Mecchia, E. Drioli, Analyses of hydrodynamic resistances and operating parameters in the ultrafiltration of grape must, J. Food Eng. 89 (2008) 171-177.
I.S. Chang, K.H. Choo, C.H. Lee, U.H. Pek, U.C. Koh, S.W. Kim, J.H. Koh, Application of ceramic membrane as a pretreatment in anaerobic-digestion of alcohol-distillery, J. Membr. Sci. 90 (1994) 131-139
D. Chen, L.K. Weavers, H.W. Walker, J.J. Lenhart, Ultrasonic control of ceramic membrane fouling caused by natural organic matter and silica particles, J. Membr. Sci. 276 (2006) 135-144.
V. Cheynier, M. Dueñas-Paton, E. Salas, C. Maury, J-M. Souquet, P. Sarni-Manchado, H. Fulcrand, Structure and properties of wine pigments and tannins, Am. J. Enol. Vitic. 57 (2006) 298-305. T.Y. Chiu, A.E. James, Effects of axial baffles in non-circular multi-channel ceramic membranes using organic feed, Sep. Purif. Technol. 51 (2006) 233-239.
J.W. Cho, G. Amy, J. Pellegrino, Membrane filtration of natural organic matter: Initial comparison of rejection and flux decline characteristics with ultrafiltration and nanofiltration membranes, Water Res. 33 (1999) 2517-2526.
K. Chira, J.-H. Su, C. Saucier, P.-L. Teissèdre, Les polyphénols du raisin, Phytothérapie 6 (2008) 75-82.
193
M. Cinta Vincent Vela, S. Alvarez Blanco, J. Lora Garcia and E. Bergantinos Rodreiguez, Analysis of membrane pore blocking models applied to the ultrafiltration of PEG, Sep. Pur. Technol. 62 (2008) 489-498. A.G. Cook, P. Weinstein, J.A. Centeno, Health effects of natural dusts: role of trace elements and compounds, Biol. Trace Elem. Res. 103 (2005) 1-15.
Z.F. Cui, K.I.T. Wright, Flux enhancements with gas sparging in downwards crossflow ultrafiltration: Performance and mechanism, J. Membr. Sci. 117 (1996) 109-116.
P. Czekaj, F. Lopez, C. Guell, Membrane fouling by turbidity constituents of beer and wine: characterization and prevention by means of infrasonic pulsing, J. Food Eng. 49 (2001) 25-36.
P. Czekaj, F. Lopez, C. Guell, Membrane fouling during microfiltration of fermented beverages, J. Membr. Sci. 166 (2000) 199-212.
D – E – F G. Daufin, J.L. Escudier, H. Carrere, S. Berot, L. Fillaudeau, M. Decloux, Recent and emerging applications of membrane processes in the food and dairy industry, Food Bioprod. Process. 79 (2001) 89-102.
H. Dawes, S. Boyes, J. Keene and D. Heatherbell, Protein instability of wines: Influence of protein isoelectric point, Am. J. Enol. Vitic. 45 (1994) 319–326.
J. De Bruijin, R. Borquez, Analysis of the fouling mechanisms during cross-flow ultrafiltration of apple juice, LWT, 39 (2006)861-871.
L. Defrance, M.Y. Jaffrin, Comparison between filtrations at fixed transmembrane pressure and fixed permeate flux: application to a membrane bioreactor used for wastewater treatment, J. Membr. Sci. 152 (1999) 203–210.
F. Delagarza, R. Boulton, The modelling of wine filtrations, Am. J. Enol. Vitic. 35 (1984) 189-195.
J.-M. Desseigne, Microfiltration tangentielle : mises en œuvre en œnologie, Itinéraires de l’Institut Français de la Vigne et du Vin, 19 (2008) 32 pages.
Y. El Rayess, C. Albasi, P. Bacchin, P. Taillandier, J. Raynal, M. Mietton-Peuchot, A. Devatine, Cross-flow microfiltration applied to oenology: A review, J. Membr. Sci. 382 (2011) 1-19.
Y. El Rayess, C. Albasi, P. Bacchin, P. Taillandier, J. Raynal, M. Mietton-Peuchot, A. Devatine, Impact of the physico-chemistry of the wine on membrane filtration performance, GPE-EPIC, Congress Venise, June 2009.
B. Espinasse, P. Bacchin, P. Aimar, On an experimental method to measure critical flux in ultrafiltration, Desalintaion 146 (2002) 91-96.
B. Espinasse, P. Bacchin, P. Aimar, Filtration method characterizing the reversibility of colloidal fouling layers at a membrane surface: Analysis through critical flux and osmotic pressure, J. Colloid Interface Sci. 320 (2008) 483-490.
194
A.G. Fane, Sustainability and membrane processing of wastewater for reuse, Desalination, 202 (2007) 53-58.
H.H.P. Fang, X.L. Shi, Pore fouling of microfiltration membranes by activated sludge, J. Membr. Sci. 264 (2005) 161-166.
R.B. Ferreira, M.A. Piçarra-Pereira, S. Monteiro, V.B. Loureiro and A.R. Teixeira, The wine proteins, Trends Food Sci. & Technol. 12 (2002) 230–239.
R.B. Ferreira, S. Monteiro, M.A. Piçarra-Pereira, M.C. Tanganho, V.B. Loureiro and A.R. Teixeira, Characterization of the proteins from grapes and wines by immunological methods, Am. J. Enol. Vitic. 51 (2000) 2–28.
R.W. Field, G.K. Pearce, Critical, sustainable and threshold fluxes for membrane filtration with water industry applications, Adv. Colloid Interface Sci., 164 (2011) 38-44.
R.W. Field, D. Wu, J.A. Howell, B.B. Gupta, Critical flux concept for microfiltration fouling, J. Membr. Sci. 100 (1995) 259-272.
L. Fillaudeau, B. Boissier, S. Ermolaev, N. Jitariouk, A. Gourdon, Etude hydrodynamique d’un module de filtration dynamique pour fluides alimentaires, Ind. Alim. Agr. 124 (2007) 8-16.
L. Fillaudeau, B. Boissier, A. Moreau, P. Blanpain-avet, S. Ermolaev, N. Jitariouk, A. Gourdon, Investigation of rotating and vibrating filtration for clarification of rough beer, J. Food Eng. 80 (2007) 206-217.
L. Fillaudeau, H. Carrere, Yeast cells, beer composition and mean pore diameter impacts on fouling and retention during cross-flow filtration of beer with ceramic membranes. J. Membr. Sci. 196 (2002) 39-57.
C. Flanzy, Œnologie : fondements scientifiques et technologiques, Lavoisier TEC&DOC, Paris, 1998.
H. Fulcrand, M. Dueñas, E. Salas, V. Cheynier, Phenolic reactions during winemaking and aging, Am. J. Enol. Vitiv. 57 (2006) 289-297.
G – H – I
Q. Gan, R.W. Field, M.R. Bird, R. England, J.A. Howell, M.T. McKechnie, C.L. Oshaughnessy, Beer clarification by cross-flow microfiltration: Fouling mechanisms and flux enhancement. Chem. Eng. Res. Des. 75 (1997) 3-8.
B. Gautier, Une nouvelle approche révolutionnaire et performante de la filtration tangentielle des vins, Revue des oenologues et des techniques vitivinicoles et oenologiques 109 (2003) 27-30.
R. Gawel, Red wine astringency: a review, Aust. J. Grape Wine R., 4 (1998) 74-95.
Y. Glories, La couleur des vins rouges, Connaiss. Vigne Vin 18 (1984) 195−217.

195
G. Gésan-Guiziou, E. Boyaval, G. Daufin, Critical stability conditions in cross-flux microfiltration of skimmed milk: transition to irreversible deposition, J. Membr. Sci. 158 (1999) 211-222.
R. Ghidossi, Memnbranes céramiques: optimization de la géométrie par simulation numérique et application industrielle, Ph.D. Thesis, Université de Provence d’Aix-Marseille I (2006).
B.B. Gupta, A. Chaibi, M.Y. Jaffrin, Ultrafiltration of albumin ethanol solutions on mineral membranes, Sep. Sci. Technol. 30 (1995) 53-71.
A. Grenier, M. Meireles, P. Aimar and P. Carvin, Analysing flux decline in dead-end filtration, Chem. Eng. Res. Des. 8 (2008) 1281-1293.
C. Guell, P. Czekaj, R.H. Davis, Microfiltration of protein mixtures and the effects of yeast on membrane fouling, J. Membr. Sci. 155 (1999) 113-122.
J.G. Handique, J.B. Baruah, Polyphenolic compounds: an overview, React. Funct. Polym. 52 (3) (2002) 163-188.
E. Haslam, Vegetable tannins-lessons of a phytochemical lifetime, Phytochemistry 68 (2007) 2713-2721.
P.H. Hermans and H.L. Bredee, Principles of the mathematical treatment of constant pressure filtration, J. Soc. Chem. Ind. 55T (1936), p. 1-11
J. Hermia, Constant pressure blocking filtration laws-application to power-law non-Newtonian fluids, Trans IchemE 60 (1982) 183-187.
C.C. Ho, A.L. Zydney, A combined pore blockage and cake filtration model for protein fouling during microfiltration, J. Colloid Interface Sci. 232 (2000) 389-399.
C.C. Ho, A.L. Zydney, Theoretical analysis of the effect of membrane morphology on fouling during microfiltration, Sep. Sci. Technol. 34 (1999) 2461-2483.
J.A. Howell, Sub-critical flux operation in microfiltration, J. Membr. Sci. 107 (1995) 165-171.
J.A. Howell, R.W. Field, D.X. Wu, Yeast-cell microfiltration – Flux enhancement and pulsatile flow systems, J. Membr. Sci. 80 (1993) 59-71.
A. Humbert-Goffard, C. Saucier, V. Moine-Ledoux, R.M. Canal-Llaubères, D. Dubourdieu, Y. Glories, An essay for glucanase activity in wine, Enzyme Microb. Technol. 34 (2004) 537-543.
E. Iritani, Y. Mukai, Y.Tanaka and T. Murase, Flux decline behavior in dead-end microfiltration of protein solutions, J. Membr. Sci. 103 (1995) 181-191.
R. Irrmann, Microfiltration tangentielle : Application en œnologie, Rev. Fr. Oenol. 137 (1992) 17-19.
196
J – K – L
M.Y. Jaffrin, B.B. Gupta, A. Chaibi, Effect of physical parameters on the microfiltration of wine on a flat polymeric membrane, Chem. Eng. Process. 32 (1993) 379-387.
M.Y. Jaffrin, Dynamic shear-enhanced membrane filtration: A review of rotating disks, rotating membranes and vibrating systems, J. Membr. Sci. 324 (2008) 7-25.
R. Jiraratananon, A. Chanachai, A study of fouling in the ultrafiltration of passion fruit juice, J. Membr. Sci. 111 (1996) 39-48.
R.Jiraratananon, D. Uttapap, C. Tangamornuskun, Self-forming dynamic membrane for ultrafiltration of pineapple juice, J. Membr. Sci. 129 (1997) 135-143.
S.T. Kelly, A.L. Zydney, Protein fouling during microfiltration: Comparative behavior of different model proteins, Biotechnol. Bioeng. 55 (1997) 91-100.
B. Keskinler, G. Akay, B.K. Bayhan, E. Erhan, Effect of ionic environment on the cross-flow microfiltration behavior of yeast suspensions, J. Membr. Sci. 206 (2002) 351-360.
B. Keskinler, E. Yildiz, E. Erhan, M. Dogru, B.K. Bayhan, G. Akay, Cross-flow microfiltration of low concentration-nonliving yeast suspension, J. Membr. Sci. 223 (2004) 56-69.
D.E. Kirk, M.W. Montgomery and M.G. Kortekaas, Clarification of pear juice by hollow fiber ultrafiltration, J. Food Sci. 48 (1983) 1663-1667.
J. Kochan, T. Wintgens, R. Hochstrat, T. Melin, Impact of wetting agents on the filtration performance of polymeric ultrafiltration membranes, Desalination 241 (2009) 34-42.
H. König, G. Unden, J. Fröhlich, Biology of microorganisms on grapes, in must and in wine, Springer science, New York, 2009.
V. Kuberkar, P. Czekaj, R. Davis, Flux enhancement for membrane filtration of bacterial suspensions using high-frequency backpulsing, Biotechnol. Bioeng. 60 (1998) 77-87.
V.T. Kuberkar, R.H. Davis, Effects of added yeast on protein transmission on flux in cross-flow membrane microfiltration, Biotechnol. Prog. 15 (1999) 472-479.
V.T. Kuberkar, R.H. Davis, Microfiltration of protein-cell mixtures with corssflushing or backflushing, J. Membr. Sci. 183 (2001) 1-14.
V.T. Kuberkar, R.H. Davis, Modeling of fouling reduction by secondary membranes, J. Membr. Sci. 168 (2000) 243-258.
S. Kuiper, C. Van Rijn, W. Nijdam, O. Raspe, H. Van Wolferen, G. Krijnen, M. Elwenspoek, Filtration of lager beer with microsieves: flux, permeate haze and in-line microscope observations, J. Membr. Sci. 196 (2002) 159-170.
P. Le-Clech, V. Chen, T. Fane, Fouling in membrane bioreactors used in wastewater treatment, J. Membr. Sci. 284 (2006) 17-53.
197
V. Ledoux, L. Dulau, D. Dubourdieu, Interprétation de l’amélioration de la stabilité protéique des vins au cours de l’élevage sur lies, J. Int. Sci. Vigne Vin 26 (1992) 239-251.
H. Li, A.G. Fane, H.G.L. Coster, S. Vigneswaran, An assessment of depolarisation models of cross-flow microfiltration by direct observation through the membrane, J. Membr. Sci. 172 (2000) 135
H. Li, A.G. Fane, H.G.L. Coster, S. Vigneswaran, Direct observation of particle deposition on the membrane surface during crossflow microfiltration, J. Membr. Sci. 149 (1998) 83-97.
R.M. Llauberes, D. Dubourdieu, J.C. Villettaz, Exocellular polysaccharides from Saccharomyces in wine, J. Sci. Food Agric. 41 (1987) 277-286.
A. Lonvaud-Funel, V. Renouf, P. Strehaiano, Microbiologie du vin : bases fondamentales et applications, Lavoisier, Cachan, 2010.
S. Lubbers, B. Leger, C. Charpentier, M. Feuillat, Effet colloïde-protecteur d’extraits de parois de levures sur la stabilité tartrique d’une solution hydro-alcoolique modèle, J. Int. Sci. Vigne Vin 27 (1993) 13-22.
A. Lüdemann, Wine clarification with a cross-flow microfiltration system, Am. J. Enol. Vitic. 38 (1987) 228-235.
M – N – O - P
Y. Mannon, D. Anne-Archard, J.-L. Uribelarrea, C. Molina-Jouve, L. Fillaudeau, Physical and biological study of cell cultures in a bioreactor: on-line and off-line rheological analyses, Applied Rheology 21 (2011) In press.
R. Marchal, P. Jeandet, Use of enological additives for colloids and tartrate salt stabilization in white wines and for improvement of sparkling wine foaming properties, in: M. Victoria Moreno-Arribas, M. Carmen Polo, Wine chemistry and biochemistry, Springer science, New york, 2009, pp. 127-158.
J.M. McRae, J.A. Kennedy, Wine and grape tannin interactions with salivary proteins and their impact on astringency: a review of current research. Molecules 16 (2011) 2348-2364M. Meireles, C. Molle, J.M. Clifton, P. Aimar, The origin of high hydraulic resistance for filter cakes of deformable particles: cell-bed deformation or surface layer effect?, Chem. Eng. Sci. 59 (2004) 5819-5829.
M. Meireles, P. Aimar, V. Sanchez, Albumin denaturation during ultrafiltration: Effects of operating conditions and consequences on membrane fouling, Biotechnol. Bioeng. 38 (1991) 528-534.
M. Mietton-Peuchot, V. Milisic, R. Ben Aim, Microfiltration tangentielle des boissons. Influence des caractéristiques hydrodynamiques, Lait 64 (1984) 121-128.
H.R. Millward, B.J. Bellhouse, I.J. Sobey, R.W.H. Lewis, Enhancement of plasma filtration using the concept of the vortex wave, J. Membr. Sci. 100 (1995) 121-129.
198
B.K.Nandi, R. Uppaluri and M.K. Purkait, Identification of optimal membrane morphological parameters during microfiltration of mosambi juice using low cost ceramic membranes, LWT 44 (2011) 214-223.
B.K. Nandi, B. Das, R. Uppaluri and M.K. Purkait, Microfiltration of mosambi juice using low cost ceramic membrane, J. Food Eng. 95 (2009) 597-605.
N. Nehme, F. Mathieu, P. Taillandier, Impact of the co-culture of Saccharomyces cerevisiae–Oenococcus oeni on malolactic fermentation and partial characterization of a yeast-derived inhibitory peptidic fraction. Food Microbiology, 27 (2010) 150-157.
S.P. Palecek, A.L. Zydney, Intermolecular electrostatic interactions and their effect on flux and proteins deposition during protein filtration, Biotechnol. Progr. 10 (1994) 207-213.
Y.G. Park, Effect of hydraulic pressure and electric field on electro-microfiltration in the wine-brewery industry, Desalination 191 (2006) 411-416.
P. Pellerin, T. Doco, S. Vidal, P. Williams, J.M. Brillouet, M.A. Oneill, Structural characterization of red wine rhamnogalacturonan II. Carbohyd. Res. 290 (1996) 183-197.
P. Pellerin, S. Vidal, P. Williams, J.M. Brillouet, Characterization of 5 type-II arabinogalactan-protein fractions from red wine of increasing uronic-acid content, Carbohyd. Res. 277 (1995) 135-143.
C. Peri, M. Riva, P. Decio, Crossflow membrane filtration of wines: comparison of permformance of ultrafiltration, microfiltration and intermediate cut-off membranes, Am. J. Enol. Vitic. 39 (1988) 162-168.
I. Pianet, Y. André, M-A. Ducasse, I. Tarascou, J-C. Lartigue, N. Pinaud, E. Fouquet, E.J. Dufourc, M. Laguerre, Modeling Procyanidin self-association processes and understanding their micellar organization : a study by diffusion NMR and molecular mechanics, Langmiur 24 (2008) 10027-11035.
D. Poirier, M. Bennasar, B. Tarodo de la Fuente, J. Gillot, D. Garcera, Clarification et stabilisations des vins par ultrafiltration tangentielle sur membranes minérales, Lait 64 (1984) 141-142.
C. Poncet-Legrand, D. Cartalade, J.-L. Putaux, V. Cheynier and A. Vernhet, Flavan-3-ol aggregation in model ethanolic solutions: incidence of polyphenol structure, concentration, ethanol content and ionic strength, Langmuir 19 (2003) 10563-10572.
J. Pratt, Non-fouling membrane filter to recover beer from surplus yeast, Brewing and Distilling Int. 32 (2001) 13-14.
S. Preys, J.M. Souquet, E. Meudec, C. Morel-Salmi, V. Cheynier, Development of a rapid quantative method to analyse proanthocyanidins in red wines, XXII International Conference on Polyphenols, Helsinki (Finland), August (2004).
C. Prieur, J. Rigaud, V. Cheynier, M. Moutounet, Oligomeric and polymeric procyanidins from grape seeds, Phytochemistry 36 (1994) 781-784.
199
Q – R – S
P. Rai, G. C. Majumdar, S. DasGupta and S. De, Modeling of permeate flux of synthetic fruit juice and mosambi juice (Citrus sinensis (L.) Osbeck) in stirred continuous ultrafiltration, LWT 40 (2007) 1765-1773.
P. Rai, G. C. Majumdar, S. DasGupta and S. De, Modeling of sucrose permeation through a pectins gel during ultrafiltration of depectinsized mosambi [Citrus sinensis (L.) Osbeck] juice, J. Food Sci. 71 (2006) 87-94.
P. Rai, G.C. Majumdar, S. Dasgupta, S. De, Understanding ultrafiltration performance with mosambi juice in an unstirred batch cell, J. Food Process Eng. 28 (2005) 166-180.
S.G. Redkar, R.H. Davis, Cross-flow microfiltration with high-frequency reverse filtration, Aiche J. 41 (1995) 501-508.
F. René, M. Lalande, Momentum and mass transfer during ultrafiltration of dextran with tubular mineral membranes in turbulent flow regime, J. Membr. Sci. 56 (1991) 29-48.
V. Renouf, Description et caractérisation de la diversité microbienne durant l'élaboration du vin : Interactions et équilibres – Relation avec la qualité du vin, Ph.D. Thesis, Institut National Polytechnique de Toulouse, 2006.
P. Ribéreau-Gayon, Y. Glories, A. Maujean, D. dubourdieu., Handbook of enology Volume 2 : The chemistry of wine, stabilization and treatments, 2nd ed., Dunod, Paris, 2006.
P. Ribéreau-Gayon, E. Stonestreet, Le dosage des anthocyanes dans les vins rouges, Bulletin de la société de chimie 9 (1965) 2649-2652.
P. Ribéreau-Gayon, E. Stonestreet, Le dosage des tanins du vin rouge et détermination de leur structure, Chimie Analytique 48 (1966) 188-192.
K. Riedl, B. Girard, R.W. Lencki, Influence of membrane structure on fouling layer morphology during apple juice clarification, J. Membr. Sci. 139 (1998) 155-166.
V. Riou, A. Vernhet, T. Doco and M. Moutounet, Aggregation of grape seed tannins in model wine – effect of wine polysaccharides, Food Hydrocolloids 16 (2002) 17-23.
H. Romat, G. Reynou, Notion de rhéologie en œnologie : Application à l’influence de la température sur la viscosité et des conséquences sur quelques pratiques œnologiques et sur la filtrabilité des vins, Revue des œnologues et des techniques vitivinicoles et œnologiques, 138 (2010) 15-17.
H. Romat, G. Reynou, Proposition de critères de filtration en application de coefficient de colmatage (partie 2/2), Revue des œnologues 124 (2007) 36-38.
A.C.K. Sato, P.R. Oliveira and R.L. Cunha, Rheology of mixed pectins solutions, Food Biophysics 3 (2008) 100-109.
F.N. Salazar, J.P.F. de Bruijn, L. Seminario, C. Guell, F. Lopez, Improvement of wine crossflow microfiltration by a new hybrid process, J. Food Eng. 79 (2007) 1329-1336.
200
J. Schneider, M. Krottenthaler, W. Back, H. Weisser, Vibrating membrane filtration of mash for the beer production, 28th congress of the European brewery convention, Budapest (Hungary), May 2001.
J. Senee, B. Robillard, M. Vignes-Adler, The zeta potential of the endogenous particles of a wine of Champagne in a relation to the foaming behaviour, Colloid Surface B, 21 (2001) 59-67.
C.A. Serra, M.R. Wiesner, J.M. Lainé, Rotating membrane disk filters, design evaluation using computational fluid dynamics, Chem. Eng. J. 72 (1999) 191-193.
M. Serrano, B. Pontens, P. Ribéreau-Gayon, Etude de différentes membranes de microfiltration tangentielle: comparaison avec la filtration sur précouche de diatomées, J. Int. Sci. Vigne Vin, 26 (2) (1992) 97-116.
G. Singh, L.F. Song, Experimental correlations of pH and ionic strength effects on the colloidal fouling of silica nanoparticles in crossflow ultrafiltration, J. Membr. Sci. 303 (2007) 112-118.
J. Snyder, H. Haughney, Use of vibrating membrane filter for the recovery of beer from surplus yeast, MBAA TQ 36 (1999) 191-193.
L.F. Song, Flux decline in crossflow microfiltration and ultrafiltration: mechanisms and modeling of membrane fouling, J. Membr. Sci. 139 (1998) 183-200.
L.F. Song, M. Elimelech, Theory of concentration polarization in cross-flow filtration, J. Chem. Soc., Faraday Trans. 91 (1995) 3389-3398.
P. Sudraud, Interprétation des courbes d’adsorption des vins rouges, Ann. Technol. Agric. 7 (1958) 203-208.
M.Z. Sulaiman, N.M. Sulaiman, M. Shamel, Ultrafiltration studies on solutions of pectins, glucose and their mixtures in a pilot scale crossflow membrane unit, J. Chem. Eng. 84 (2001) 557-563.
M.Z. Sulaiman, N.M. Sulaiman, L.Y. Shih, Limiting permeate flux in the clarification of untreated starfruit juice by membrane ultrafiltration, J. Chem. Eng. 68 (1998) 145-148.
H. Susanto, Y. Feng, M. Ulbricht, Fouling behavior of aqueous solutions of polyphenolic compounds during ultrafiltration, J. Food Eng. 91 (2009) 333-340.
AR Szaniawski and HG Spencer, Microfiltrtaion of pectins solutions by a titanium dioxide membrane, Key Eng. Mater. 61/62 (1991), 243–248.
T– U – V
E.S. Tarleton, R.J. Wakeman, Understanding flux decline in cross-flow microfiltration. 2. Effects of process parameters, Chem. Eng. Res. Des. 72 (1994a) 431-440.
201
G. Thoukis, Chemistry of wine stabilization: a review, in: A. Dinsmoor Webb, chemistry of wine making, American Chemical society, Washington, 1974.
E.M. Tracey, R.H. Davis, Protein fouling of track-etched polycarbonate microfiltration membranes, J. Colloid Interface Sci. 167 (1994) 104-116.
A. Urkiaga, L. De las Fuentes, M. Acilu, J. Uriarte, Membrane comparison for wine clarification by microfiltration, Desalination 148 (2002) 115-120.
M. Ulbricht, W. Ansorge, I. Danielzik, M. Konig, O. Schuster, Fouling in microfiltration of wine: The influence of the membrane polymer on adsorption of polyphenols and polysaccharides. Sep. Purif. Technol. 68 (2009) 335-342.
L. Usseglio-Tomasset, Les colloïdes glucidiques solubles des moûts et des vins, Connaiss. Vigne Vin 10 (1976) 193-226.
F. Vaillant, P. Millan, G. O’Brien, M. Dornier, M. Decloux, M. Reynes, Cross flow microfiltration of passion fruit juice after partial enzymatic liquefaction, J. Food Eng. 42 (1999) 215-224.
F.Vaillant, A.M. Perez, O. Acosta, M. Dornier, Turbidity of pulpy fruit juice: A key factor for predicting cross-flow microfiltration performance, J. Membr. Sci. 325 (2008) 404-412.
A. Vernhet, D. Cartalade, M. Moutounet, Contribution to the understanding of fouling build-up during microfiltration of wines, J. Membr. Sci. 211 (2003) 357-370.
A. Vernhet, M.N. BellonFontaine, J.M. Brillouet, E. Roesink, M. Moutounet, Wetting properties of microfiltration membrane: Determination by means of the capillary rise technique and incidence on the adsorption of wine polysaccharide and tannins, J. Membr. Sci. 128 (1997) 163-174.
A. Vernhet, A. Grangeon, Innovations dans la microfiltration des vins: membranes et procédés, Revue des oenologues et des techniques vitivinicoles et oenologiques, 113 (2004) 37-40.
A. Vernhet, A. Grangeon, Innovations dans la microfiltration des vins : membranes et procédés, Revue des œnologues 113 (2004) 37-40.
A. Vernhet, M. Moutounet, Fouling of organic microfiltration membranes by wine constituents: importance, relative impact of wine polysaccharides and polyphenols and incidence of membrane properties, J. Membr. Sci. 201 (2002) 103-122.
A. Vernhet, P. Pellerin, M.P. Belleville, J. Planque, M. Moutounet, Relative impact of major wine polysaccharides on the performances of an organic microfiltration membrane, Am. J. Enol. Vitic. 50 (1999) 51-56
R. Veyre, Carbosep ultrafiltration inorganic membranes in the food-industry, Lait 64 (1984) 261-275.
J.C. Villetaz, Les colloïdes colmatants et la filtration des vins, Rev. Fr. Oenol. 122 (1990) 59-64.
202
S. Vidal, P. Williams, M.A. O'Neill, P. Pellerin, Polysaccharides from grape berry cell walls. Part I: tissue distribution and structural characterization of the pectic polysaccharides. Carbohyd.Polym. 45 (2001) 315-323.
S. Vidal, P. Williams, T. Doco, M. Moutounet, P. Pellerin, The polysaccharides of red wine: total fractionation and characterization. Carbohyd. Polym. 54 (2003) 439-447.
G. T. Vladisavljevic, P. Vukosavljevic and B. Bukvic, Permeate flux and fouling resistance in ultrafiltration of depectinsized apple juice using ceramic membranes, J. Food Eng. 60 (2003) 241-247.
W – X – Y - Z
W.W. Wai, A.F.M. AlKarkhi and A. Mat Easa, Comparing biosorbent ability of modified citrus and durian rind pectins, Carbohydr. Polymer. 79 (2010) 584-589.
R.J. Wakeman, C.J. Williams, Additional techniques to improve microfiltration, Sep. Purif. Technol. 26 (2002) 3-18.
R.J. Wakeman, E.S. Tarleton, An experimental-study of electroacoustic cross-flow microfiltration, Chem. Eng. Res. Des. 69 (1991) 386-397.
E.J. Waters, W. Wallace and P.J. Williams, Heat haze characteristics of fractionated wine proteins, Am. J. Enol. Vitic. 42 (1991) 123–127.
I.G. Wenten, Mechanisms and control of fouling in cross-flow microfiltration, Filtr. Separat. 32 (1995) 252-253.
J.G. Wijmans, S. Nakao, C.A. Smolders, Flux limitation in ultrafiltration: osmotic pressure model and gel layer model, J. Membr. Sci. 20 (1984) 115-124.
(2002) 39-57.
D.X. Wu, J.A. Howell, R.W. Field, Critical flux measurement for model colloids, J. Membr. Sci. 152 (1999) 89–98.
Y. Ye, P. Le Clech, V. Chen, A.G. Fane and B. Jefferson, Fouling mechanisms of alginate solutions as model extracellular polymeric substances, Desalination 175 (2005) 7-20.
W. Youravong, M.J., Lewis, A.S. Grandison, Critical flux in ultrafiltration of skimmed milk, Food Bioprod. Process. 81 (2003) 303-308.
M. Zator, M. Ferrando, F. Lopez, C. Guell, Microfiltration of protein/dextran/polyphenol solutions: Characterization of fouling and chemical cleaning efficiency using confocal microscopy, J: Membr. Sci. 344 (2009) 82-91.
A.L. Zydney, C.H. Colton, A concentration polarization model for the filtrate flux in cross-flow microfiltration of particulate suspensions, Chem. Eng. Commun. 47 (1986) 1-21.
203
ANNEXE I : Compression osmotique et filtration
I- Pression osmotique La pression osmotique est une propriété thermodynamique caractérisant les solutions de sels
ou de molécules. L’utilisation de la mesure de pression osmotique pour les dispersions
colloïdales fait toujours l’objet de nombreuses études afin de la relier aux interactions de
surface et de caractériser la complexité des dispersions concentrées dans les transitions de
phases de la matière solide -dissoute. Cette mesure sera appliquée ici pour étudier la stabilité
des suspensions colloïdales qui est reliée à sa filtrabilité potentielle. La méthode consiste en
une concentration des particules (compression) par dialyse jusqu’à l’obtention de la transition
liquide/solide.
I.1 – Définition de l’osmose
Le phénomène d’osmose traduit un transfert de solvant à travers une paroi poreuse (dans notre
cas membrane) sous l’action d’un gradient de concentration. Considérons un système à deux
compartiments séparés par une membrane semi-perméable ne laissant passer que le solvant.
Le phénomène d’osmose va se traduire par un flux d’eau dirigé de la solution diluée vers la
solution concentrée (figure 1). Si on applique une pression sur la solution concentrée pour
empêcher le flux d’eau, la quantité d’eau transférée par osmose va diminuer jusqu’à être
annulée. Cette pression d’équilibre est appelée pression osmotique et est notée Π.
Figure A.I.1 : phénomène d’osmose et pression osmotique
204
I.2 – La pression osmotique La pression osmotique est une grandeur thermodynamique directement mesurable dont la
valeur présente des intérêts multiples permettant de déterminer à la fois :
- La réduction du flux du solvant : En filtration, le flux de perméation est décrit en
fonction de la pression transmembranaire. Il est nécessaire de définir les différentes
résistances opposées au flux : )( cm RR
PJ
où ΔP est la pression
transmembranaire appliquée et ΔΠ est la pression osmotique opposée à la pression,
est la viscosité du perméat, Rm et Rc sont respectivement les résistances de la
membrane et du colmatage.
- L’accumulation de matière à la membrane : le coefficient de diffusion est
théoriquement relié à la dérivée de la pression osmotique par rapport à la fraction
volumique. Pour une dispersion colloïdale, la diffusion collective des particules dans
un gradient de concentration peut être déduite de la loi de Stokes-Einstein reliant la
diffusion au coefficient hydrodynamique, K, et à la pression osmotique Π :
*)()( dKd
DD
b
avec
TkV
B
p* où Ф est la fraction volumique, kB est la
constante de Boltzman, T est la température et Vp est la vitesse particulaire.
- La transition entre une concentration de polarisation réversible et une concentration de
polarisation irréversible (dépôt).
De façon générale, la pression osmotique traduit la résistance à la concentration et à la
compression d’une suspension et apparaît aussi comme le seul moyen de mesurer de façon
directe l’effet de la diffusion et des interactions inter-particulaires qui relatent la stabilité des
suspensions.
II. Mesure de pression osmotique Les mesures de pressions osmotiques sont effectuées suivant une méthode de compression
chimique développée par C. Bonnet Gonnet (1994). Ces mesures consistent à plonger des sacs
de dialyse (12000 – 14000 Da) semi-perméable remplis du vin dans une solution de
polymères de pression osmotique connue (PEG, dit polymère « stresseur »). Le seuil de
coupure est choisi pour être du même ordre que celui de la membrane de microfiltration
205
utilisée. La membrane choisie pour cette étude est un sac de dialyse de seuil de coupure de 12
à 14 Da qui laisse passer l’eau, les sels et les petites molécules mais ni les particules, ni le
polymère « stresseur ». Le diamètre du sac est de 32 mm, et la longueur effective utilisée de
200 mm. Le sac peut ainsi contenir 30 ml de dispersion.
Un flux de solvant apparaît sous le gradient de potentiel chimique jusqu’à l’équilibre de
pressions dans chaque compartiment. Lorsque l’équilibre est atteint, la pression osmotique est
la même à l’intérieur du sac et à l’extérieur. Il est possible de tracer des courbes pressions
osmotiques en fonction de l’extrait sec.
Le polymère stresseur sert à fixer la pression osmotique appliquée sur les dispersions . Il alors
doit avoir les propriétés suivantes :
- neutre : il ne doit pas réagir lors de l’ajout de sel, d’acide, de base et donc résister à
une gamme de pH de 1 à 12.
- Non thermosensible
- De taille supérieure au seuil de coupure de la membrane pour qu’il ne traverse pas la
membrane et pour qu’il ne se retrouve pas dans la dispersion à concentrer.
- Hydrosoluble car les dispersions préparées sont en milieu aqueux.
- De masse molaire monodisperse, pour éviter les erreurs de dosage
- Facilement dosable (par exemple : COT (Carbone Organique Total)).
Dans cette étude, le PolyEthylèneGlycol (PEG) est un polymère répondant à ces critères. Il a
une masse molaire de 35000 g.mol-1. La pression osmotique (Π en Pa) de ce polymère,
déterminée expérimentalement (Bouchoux, 2009), est donnée par l’équation 1 en fonction de
sa concentration (%w) : logΠ = a + b (%w)c où a = 0.49, b = 2.5 et c = 0.29.
Pendant la compression osmotique, il y a également un processus de lavage de la dispersion
dû au transfert d’ions à travers la membrane. Il faut s’assurer d’avoir la même concentration
en ions pour chaque espèce en solution de part et d’autre de la membrane. Les sacs de dialyse
sont fermés d’un côté par une pince à dialyse ensuite remplis avec le vin puis l’autre extrémité
est à son tour fermée avec une autre pince. La quantité du vin introduite dans les sacs est
fonction de la solution de PEG; s’ils sont amenés à se gonfler, ceux-ci sont peu remplis, et
inversement, s’ils sont amenés à se dégonfler, ceux-ci sont bien remplis. Ils sont ensuite
placés dans les béchers de PEG fermés hermétiquement pour éviter toute pollution
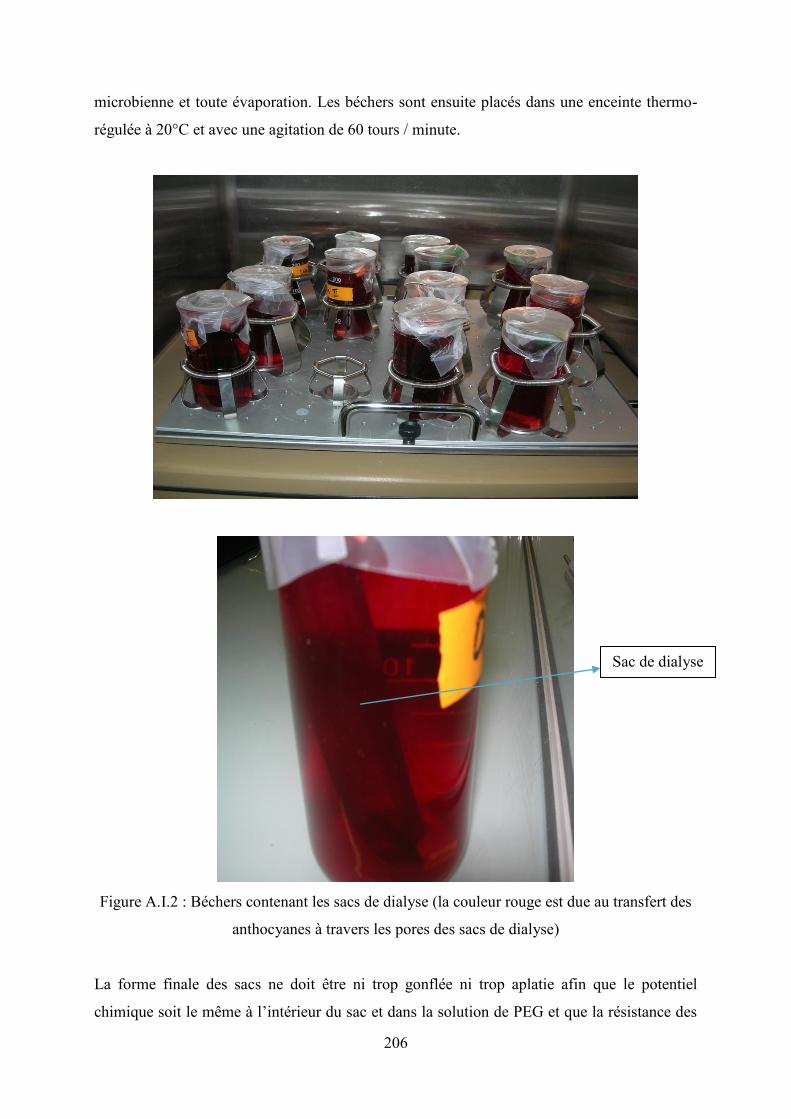
206
microbienne et toute évaporation. Les béchers sont ensuite placés dans une enceinte thermo-
régulée à 20°C et avec une agitation de 60 tours / minute.
Figure A.I.2 : Béchers contenant les sacs de dialyse (la couleur rouge est due au transfert des
anthocyanes à travers les pores des sacs de dialyse)
La forme finale des sacs ne doit être ni trop gonflée ni trop aplatie afin que le potentiel
chimique soit le même à l’intérieur du sac et dans la solution de PEG et que la résistance des
Sac de dialyse
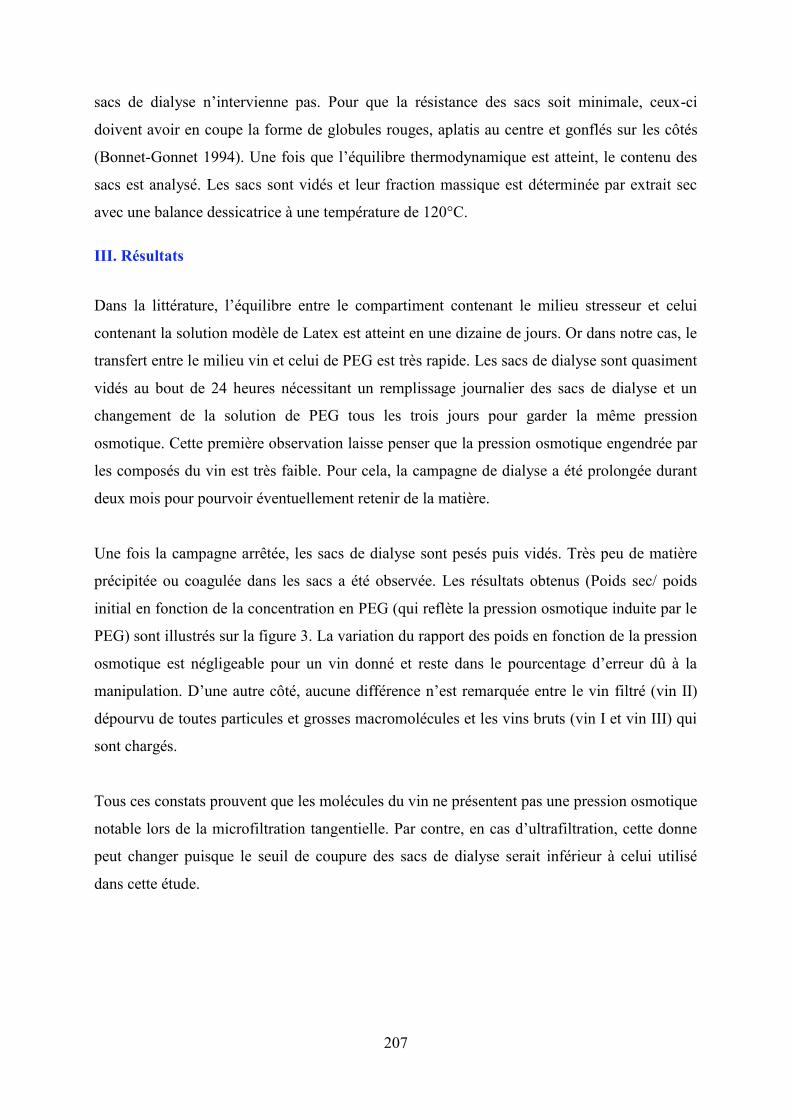
207
sacs de dialyse n’intervienne pas. Pour que la résistance des sacs soit minimale, ceux-ci
doivent avoir en coupe la forme de globules rouges, aplatis au centre et gonflés sur les côtés
(Bonnet-Gonnet 1994). Une fois que l’équilibre thermodynamique est atteint, le contenu des
sacs est analysé. Les sacs sont vidés et leur fraction massique est déterminée par extrait sec
avec une balance dessicatrice à une température de 120°C.
III. Résultats
Dans la littérature, l’équilibre entre le compartiment contenant le milieu stresseur et celui
contenant la solution modèle de Latex est atteint en une dizaine de jours. Or dans notre cas, le
transfert entre le milieu vin et celui de PEG est très rapide. Les sacs de dialyse sont quasiment
vidés au bout de 24 heures nécessitant un remplissage journalier des sacs de dialyse et un
changement de la solution de PEG tous les trois jours pour garder la même pression
osmotique. Cette première observation laisse penser que la pression osmotique engendrée par
les composés du vin est très faible. Pour cela, la campagne de dialyse a été prolongée durant
deux mois pour pourvoir éventuellement retenir de la matière.
Une fois la campagne arrêtée, les sacs de dialyse sont pesés puis vidés. Très peu de matière
précipitée ou coagulée dans les sacs a été observée. Les résultats obtenus (Poids sec/ poids
initial en fonction de la concentration en PEG (qui reflète la pression osmotique induite par le
PEG) sont illustrés sur la figure 3. La variation du rapport des poids en fonction de la pression
osmotique est négligeable pour un vin donné et reste dans le pourcentage d’erreur dû à la
manipulation. D’une autre côté, aucune différence n’est remarquée entre le vin filtré (vin II)
dépourvu de toutes particules et grosses macromolécules et les vins bruts (vin I et vin III) qui
sont chargés.
Tous ces constats prouvent que les molécules du vin ne présentent pas une pression osmotique
notable lors de la microfiltration tangentielle. Par contre, en cas d’ultrafiltration, cette donne
peut changer puisque le seuil de coupure des sacs de dialyse serait inférieur à celui utilisé
dans cette étude.
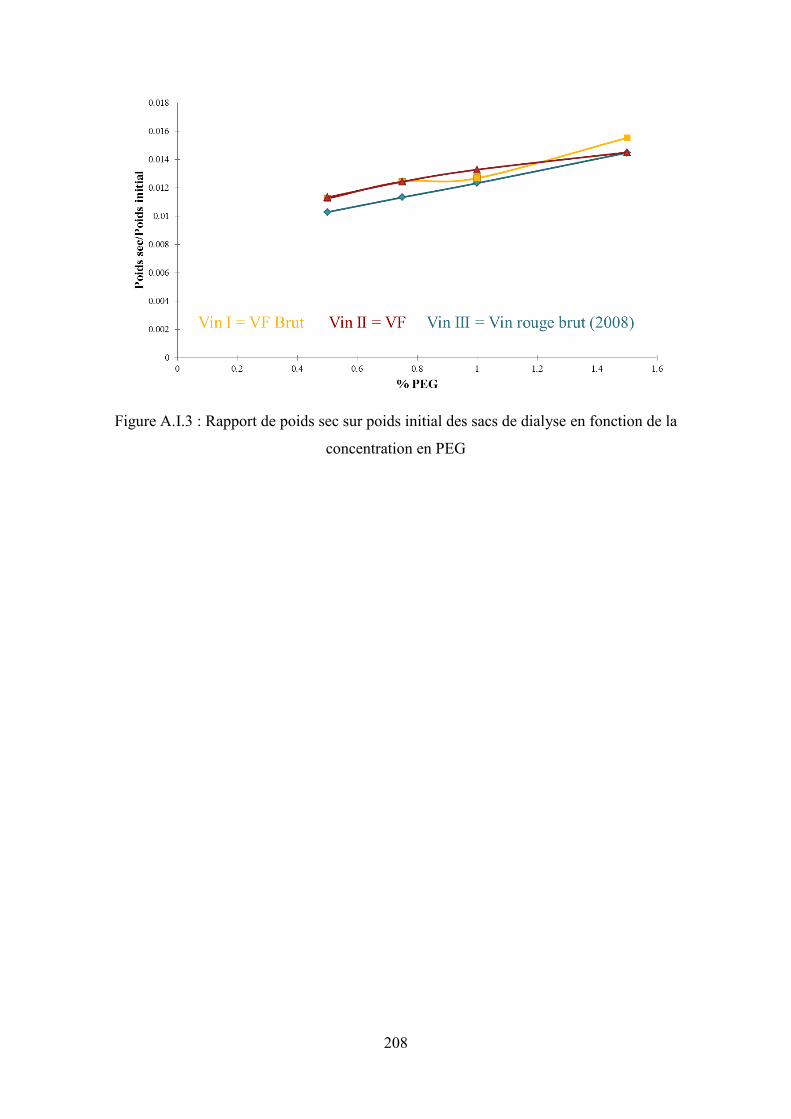
208
Figure A.I.3 : Rapport de poids sec sur poids initial des sacs de dialyse en fonction de la
concentration en PEG
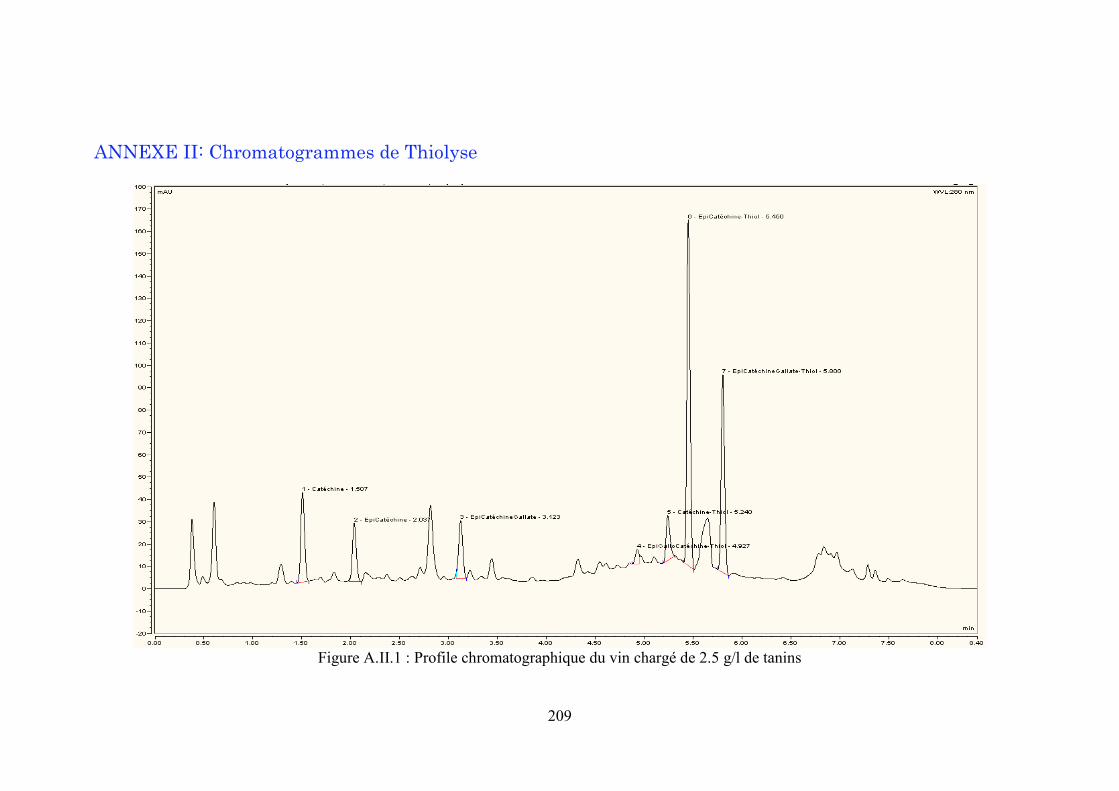
209
ANNEXE II: Chromatogrammes de Thiolyse
Figure A.II.1 : Profile chromatographique du vin chargé de 2.5 g/l de tanins
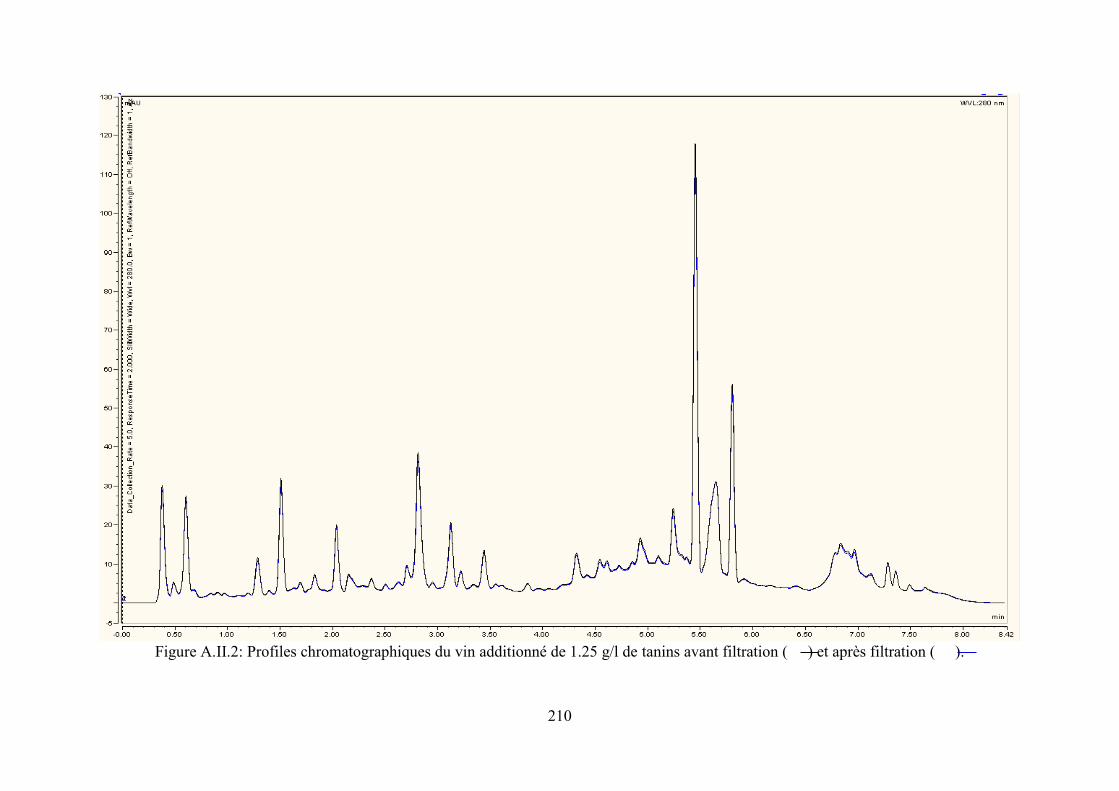
210
Figure A.II.2: Profiles chromatographiques du vin additionné de 1.25 g/l de tanins avant filtration ( ) et après filtration ( ).
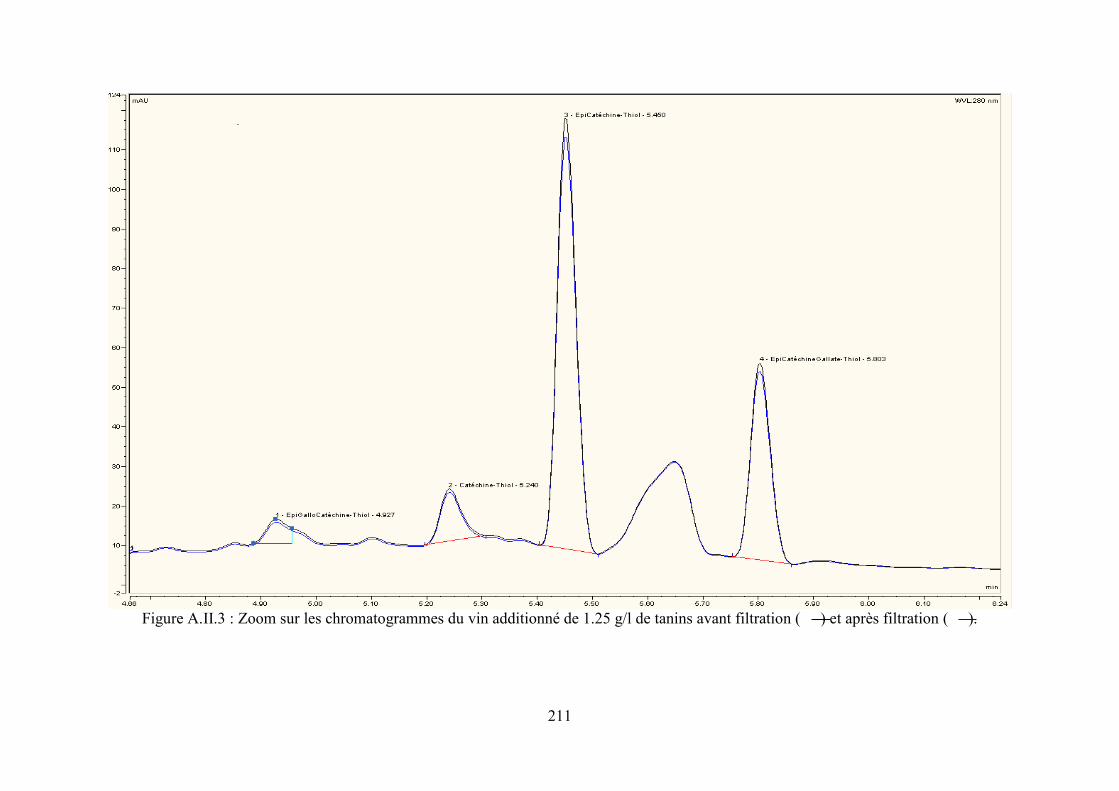
211
Figure A.II.3 : Zoom sur les chromatogrammes du vin additionné de 1.25 g/l de tanins avant filtration ( ) et après filtration ( ).
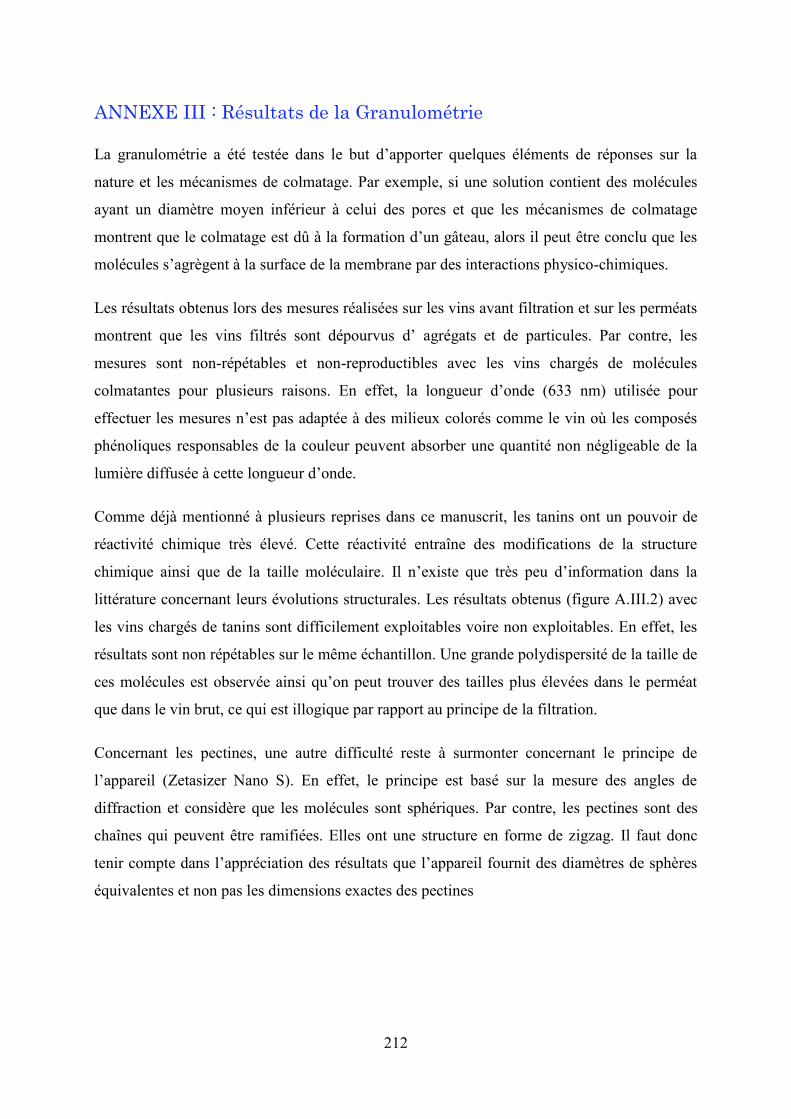
212
ANNEXE III : Résultats de la Granulométrie
La granulométrie a été testée dans le but d’apporter quelques éléments de réponses sur la
nature et les mécanismes de colmatage. Par exemple, si une solution contient des molécules
ayant un diamètre moyen inférieur à celui des pores et que les mécanismes de colmatage
montrent que le colmatage est dû à la formation d’un gâteau, alors il peut être conclu que les
molécules s’agrègent à la surface de la membrane par des interactions physico-chimiques.
Les résultats obtenus lors des mesures réalisées sur les vins avant filtration et sur les perméats
montrent que les vins filtrés sont dépourvus d’ agrégats et de particules. Par contre, les
mesures sont non-répétables et non-reproductibles avec les vins chargés de molécules
colmatantes pour plusieurs raisons. En effet, la longueur d’onde (633 nm) utilisée pour
effectuer les mesures n’est pas adaptée à des milieux colorés comme le vin où les composés
phénoliques responsables de la couleur peuvent absorber une quantité non négligeable de la
lumière diffusée à cette longueur d’onde.
Comme déjà mentionné à plusieurs reprises dans ce manuscrit, les tanins ont un pouvoir de
réactivité chimique très élevé. Cette réactivité entraîne des modifications de la structure
chimique ainsi que de la taille moléculaire. Il n’existe que très peu d’information dans la
littérature concernant leurs évolutions structurales. Les résultats obtenus (figure A.III.2) avec
les vins chargés de tanins sont difficilement exploitables voire non exploitables. En effet, les
résultats sont non répétables sur le même échantillon. Une grande polydispersité de la taille de
ces molécules est observée ainsi qu’on peut trouver des tailles plus élevées dans le perméat
que dans le vin brut, ce qui est illogique par rapport au principe de la filtration.
Concernant les pectines, une autre difficulté reste à surmonter concernant le principe de
l’appareil (Zetasizer Nano S). En effet, le principe est basé sur la mesure des angles de
diffraction et considère que les molécules sont sphériques. Par contre, les pectines sont des
chaînes qui peuvent être ramifiées. Elles ont une structure en forme de zigzag. Il faut donc
tenir compte dans l’appréciation des résultats que l’appareil fournit des diamètres de sphères
équivalentes et non pas les dimensions exactes des pectines
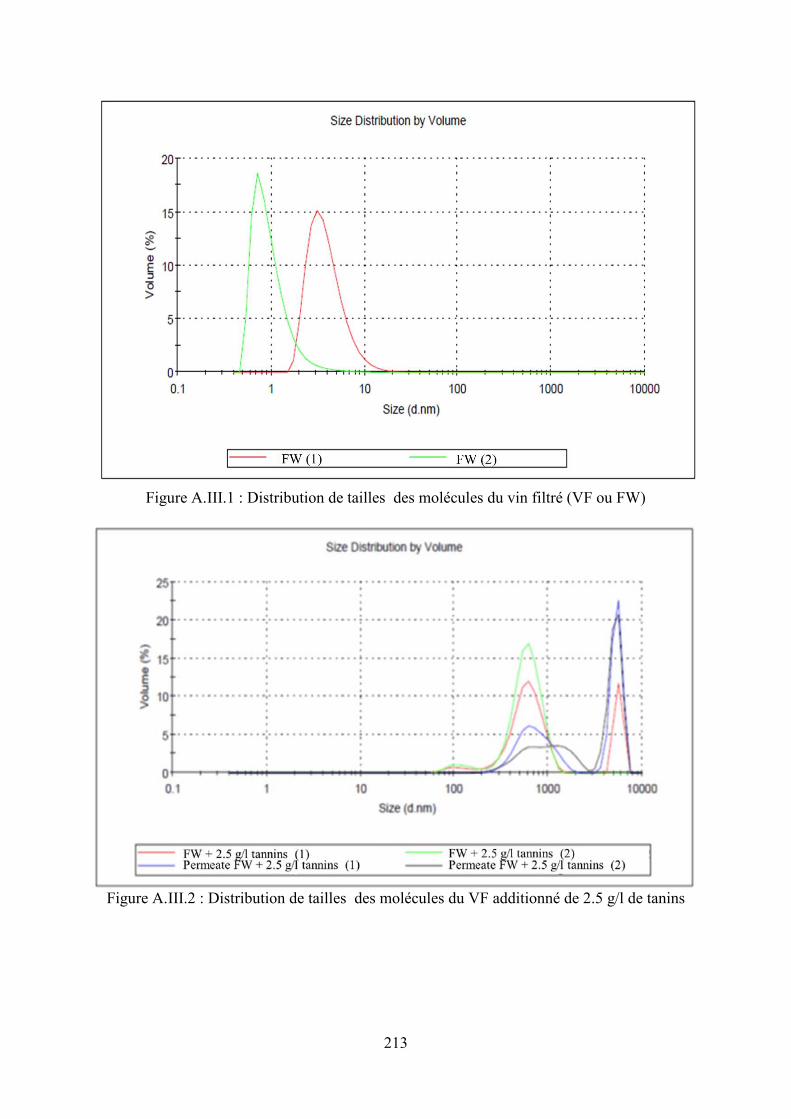
213
Figure A.III.1 : Distribution de tailles des molécules du vin filtré (VF ou FW)
Figure A.III.2 : Distribution de tailles des molécules du VF additionné de 2.5 g/l de tanins
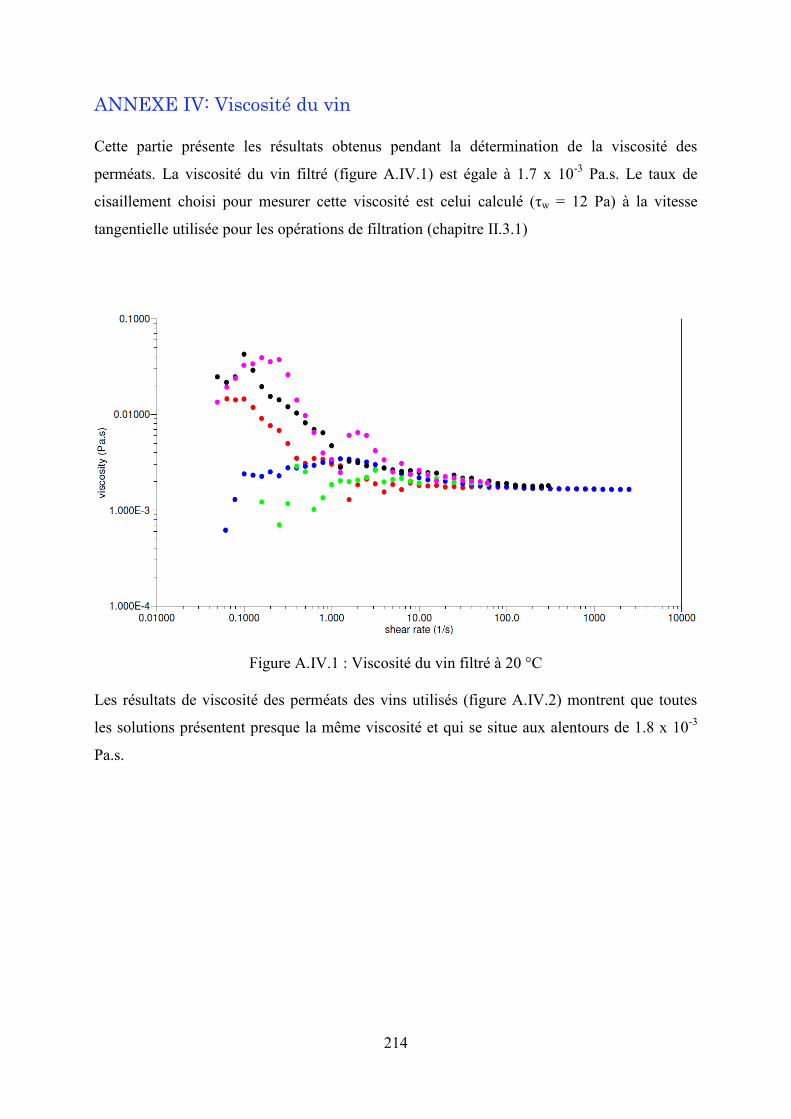
214
ANNEXE IV: Viscosité du vin
Cette partie présente les résultats obtenus pendant la détermination de la viscosité des
perméats. La viscosité du vin filtré (figure A.IV.1) est égale à 1.7 x 10⁻³ Pa.s. Le taux de
cisaillement choisi pour mesurer cette viscosité est celui calculé (τw = 12 Pa) à la vitesse
tangentielle utilisée pour les opérations de filtration (chapitre II.3.1)
Figure A.IV.1 : Viscosité du vin filtré à 20 °C
Les résultats de viscosité des perméats des vins utilisés (figure A.IV.2) montrent que toutes
les solutions présentent presque la même viscosité et qui se situe aux alentours de 1.8 x 10⁻³
Pa.s.
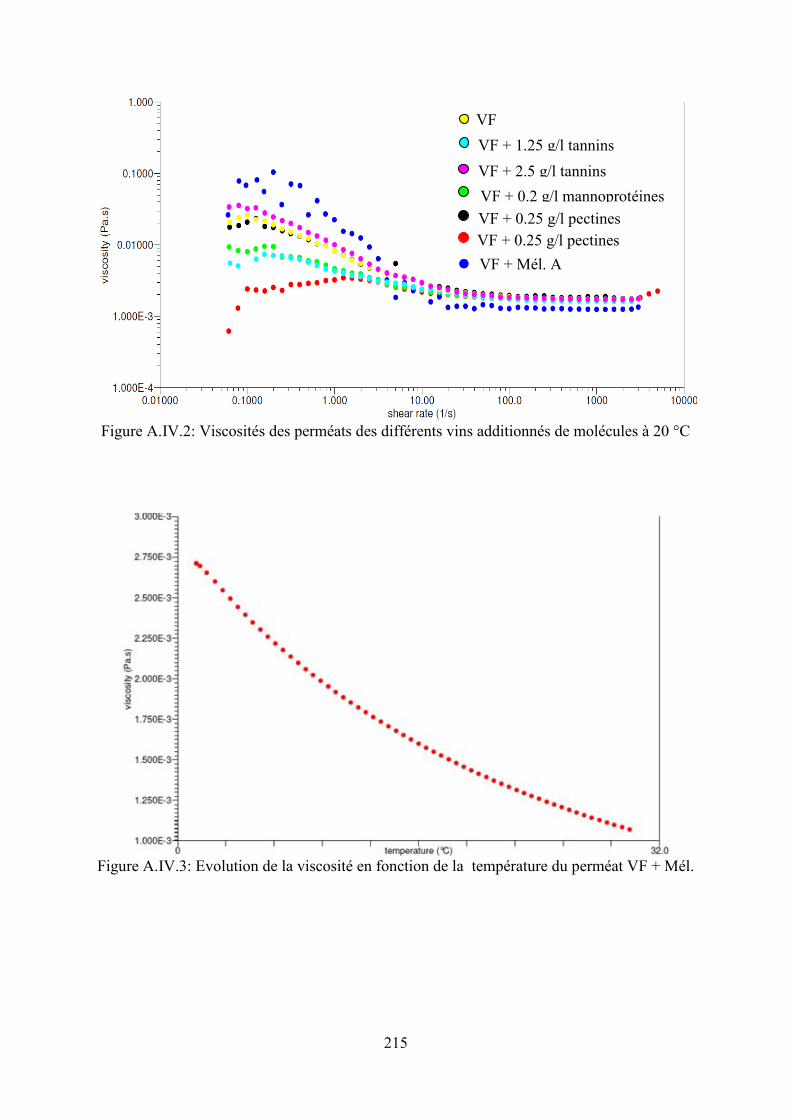
215
Figure A.IV.2: Viscosités des perméats des différents vins additionnés de molécules à 20 °C
Figure A.IV.3: Evolution de la viscosité en fonction de la température du perméat VF + Mél.
VF
VF + Mél. A
VF + 1.25 g/l tannins VF + 2.5 g/l tannins
VF + 0.2 g/l mannoprotéines VF + 0.25 g/l pectines VF + 0.25 g/l pectines