Mesure des débits en réseau d9assainissement basée …big · SESSION 2.4 2 1 INTRODUCTION...
10
NOVATECH 2010 1 Flow measurements in sewer systems based on image analysis: automatic flow velocity algorithm Mesure des débits en réseau dassainissement basée sur lanalyse dimage : algorithme automatique de mesures des vitesses deau D. Jeanbourquin, D. Sage*, L. Nguyen, B. Schaeli, S. Kayal, D.A. Barry, L. Rossi Ecole Polytechnique Fédérale de Lausanne (EPFL), Ecological Engineering laboratory (ECOL), ENAC IEE, Station 2, 1015 Lausanne, Switzerland * Ecole Polytechnique Fédérale de Lausanne (EPFL), Biomedical Imaging Laboratory (LIB), STI - IMT, Station 17, 1015 Lausanne, Switzerland ABSTRACT Discharges of combined sewer overflows (CSOs) and stormwater are recognized as an important source of environmental contamination. However, the harsh sewer environment and particular hydraulic conditions during rain events reduce the reliability of traditional flow measurement probes. An in situ system for sewer water flow monitoring based on video images was evaluated. Algorithm to determine water velocities was developed based on image-processing techniques. The image-based water velocity algorithm identifies surface features and measures their positions with respect to real world coordinates. A web-based user interface and a three-tier system architecture enable remote configuration of the cameras and the image-processing algorithms in order to calculate automatically flow velocity on-line. Results of investigations conducted in a CSO were presented. The system was found to measure reliably water velocities, thereby providing the means to understand particular hydraulic behaviors. RÉSUMÉ Les rejets pluviaux urbains (eaux pluviales et déversoirs dorage) représentent une importante source de contamination pour les milieux récepteurs. Néanmoins, les conditions qui règnent dans les réseaux lors dévénements pluviaux et le comportement hydraulique particulier de certaines structures réduisent la qualité des mesures à laide de sondes classiques. Dans ce travail, un système de mesure des débits en réseau dassainissement, basé sur limagerie vidéo, est présenté et évalué dans des conditions réelles. Cette publication se concentre sur la mesure des vitesses basées sur une technique danalyse dimage. Les algorithmes développés identifient des objets flottants à la surface de lécoulement et évaluent leurs positions par rapport à un référentiel réel. Une interface Web, associée à une architecture informatique à 3 niveaux, permet une configuration à distance des caméras et des algorithmes de manière à calculer les débits en ligne de manière entièrement automatique. Les résultats détudes menées dans un déversoir dorage sont présentés. Les séquences vidéos acquises et analysées par le système développé démontrent la capacité du système à mesurer de manière correcte les vitesses découlement et de permettre ainsi une meilleure compréhension des structures hydrauliques. KEYWORDS Combined sewer overflow; flow measurement; homography; image processing; video monitoring; water level measurement Selected for publication in "Water Science & Technology". Reproduced with the permission of IWA Publishing.
-
Upload
hoangduong -
Category
Documents
-
view
217 -
download
0
Transcript of Mesure des débits en réseau d9assainissement basée …big · SESSION 2.4 2 1 INTRODUCTION...
NOVATECH 2010
1
Flow measurements in sewer systems based on image analysis: automatic flow velocity algorithm Mesure des débits en réseau d�’assainissement basée sur l�’analyse d�’image : algorithme automatique de mesures des vitesses d�’eau D. Jeanbourquin, D. Sage*, L. Nguyen, B. Schaeli, S. Kayal, D.A. Barry, L. Rossi Ecole Polytechnique Fédérale de Lausanne (EPFL), Ecological Engineering laboratory (ECOL), ENAC �– IEE, Station 2, 1015 Lausanne, Switzerland * Ecole Polytechnique Fédérale de Lausanne (EPFL), Biomedical Imaging Laboratory (LIB), STI - IMT, Station 17, 1015 Lausanne, Switzerland
ABSTRACT Discharges of combined sewer overflows (CSOs) and stormwater are recognized as an important source of environmental contamination. However, the harsh sewer environment and particular hydraulic conditions during rain events reduce the reliability of traditional flow measurement probes. An in situ system for sewer water flow monitoring based on video images was evaluated. Algorithm to determine water velocities was developed based on image-processing techniques. The image-based water velocity algorithm identifies surface features and measures their positions with respect to real world coordinates. A web-based user interface and a three-tier system architecture enable remote configuration of the cameras and the image-processing algorithms in order to calculate automatically flow velocity on-line. Results of investigations conducted in a CSO were presented. The system was found to measure reliably water velocities, thereby providing the means to understand particular hydraulic behaviors. RÉSUMÉ Les rejets pluviaux urbains (eaux pluviales et déversoirs d�’orage) représentent une importante source de contamination pour les milieux récepteurs. Néanmoins, les conditions qui règnent dans les réseaux lors d�’événements pluviaux et le comportement hydraulique particulier de certaines structures réduisent la qualité des mesures à l�’aide de sondes classiques. Dans ce travail, un système de mesure des débits en réseau d�’assainissement, basé sur l�’imagerie vidéo, est présenté et évalué dans des conditions réelles. Cette publication se concentre sur la mesure des vitesses basées sur une technique d�’analyse d�’image. Les algorithmes développés identifient des objets flottants à la surface de l�’écoulement et évaluent leurs positions par rapport à un référentiel réel. Une interface Web, associée à une architecture informatique à 3 niveaux, permet une configuration à distance des caméras et des algorithmes de manière à calculer les débits en ligne de manière entièrement automatique. Les résultats d�’études menées dans un déversoir d�’orage sont présentés. Les séquences vidéos acquises et analysées par le système développé démontrent la capacité du système à mesurer de manière correcte les vitesses d�’écoulement et de permettre ainsi une meilleure compréhension des structures hydrauliques.
KEYWORDS Combined sewer overflow; flow measurement; homography; image processing; video monitoring; water level measurement
Selected for publication in "Water Science & Technology". Reproduced with the permission of IWA Publishing.
SESSION 2.4
2
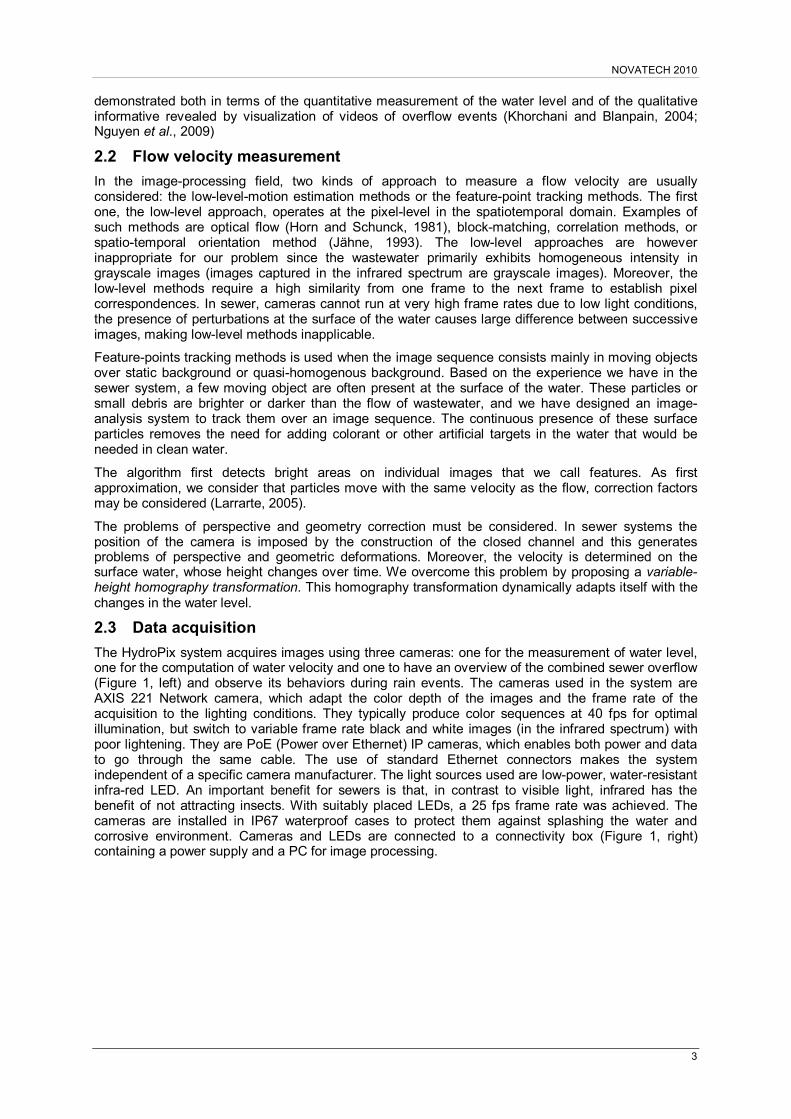
1 INTRODUCTION Long-term measurement of sewer flows is a difficult task. The sewer environment is harsh, with humidity of 100% and possibly corrosive gases. Flow measurement devices in contact with wastewater are at risk of being destroyed, especially by the rapid increases in water elevation and flow rate due to storms. Access entails risk for individuals charged with replacing or maintaining equipment.
The most common means to measure flow is the Doppler meter based on two data, the height of the water (measured by pressure difference) and the flow velocity measured by the Doppler shift principle (Jensen, 2004). Such meters must be placed inside dirty water and hence are not reliable for long-term measurements. An alternative solution avoiding water contact involves measurement of the water height (e.g., using an ultrasonic probe), from which the flow velocity is determined using a rating curve. However, the rating curve, being a global hydraulic model-based curve, is incapable of capturing local hydraulic effects and hence in general cannot provide accurate results.
Here, we propose an alternative to measure the surface water velocity using video analysis. The video clips are acquired by a camera mounted in a waterproof case; illumination is provided by an infrared illumination device positioned above the sewer channel. None of the hardware comes in contact with the water. Image-processing algorithms are presented for calculating the water flow rate. This is the first video-based implementation of an automatic flow measurement system. LSPIV techniques (Large Scale Particle Image Velocimetry) have been applied to open channels and rivers (Jodeau et al., 2008), but the conditions are rather different. The addition of tracer particles is not necessary in sewers due to floating waste. Moreover, measurements in rivers with cameras were performed for a very limited duration only and were not designed for extended periods. In the open, the illumination change between day and night is difficult to control. In a closed environment, such as a sewer, the light conditions are constant.
These developments are part of a complete sewer monitoring system called HydroPix Monitoring (Nguyen et al., 2009). The HydroPix Monitoring system is a robust vision-based package that integrates several modules and features: visual analysis of hydraulic behavior, on-line water level measurements, wastewater velocity measurements, automatic alarm system for particular events (overflows, flood risks, etc.), database management (images, events, measurements, etc.), remote configuration and data visualization. The system was developed considering the accessibility and difficult conditions within sewers, and is able to take measurements autonomously for long periods with minimum maintenance. Previously, Nguyen et al. (2009) focused on water level measurement. Here, velocity measurements are considered in detail.
2 METHODOLOGY The flow rate D [m3/s] is given by the product of P(h) and V where V is the velocity in m/s of the water flow, and P(h) describes the water channel geometry profile [m2] as a function of the water level h [m]. P(h) is completely defined and known from the construction plans.
VP(h)D Eq. 1
Since P(h) is completely defined and known from the construction plans, the computation of D is achieved by the measure of h and V. In our system, both, the water level h and the flow measure V, can be obtained from image-analysis. The procedure developed for estimating the flow rate is presented in the following chapters.
2.1 Water level measurement Devices able to determine the water level in a channel either measure pressure variation or rely on ultrasonic reflections. Pressure transducers are widely used and are placed on the base of the sewer channel. The water level is inferred from pressure measurements (Jensen, 2004). While their application in clean water has been demonstrated, their use in sewers is still problematic as they become quickly clogged by the solid material contained in the flow and thereby require frequent maintenance. During significant flows, such probes can be torn away. Ultrasonic probes are placed outside of the flow which is more appropriate for the sewer tube. However, they only provide the water level for a single point of the channel and their measurements are therefore sensitive to complex hydraulic behaviors such as backwater effects.
Since we have camera and infrared-light, we choose to measure the water level by analyzing an image showing the interface water-air. The advantages of this vision-based system were
NOVATECH 2010
3
demonstrated both in terms of the quantitative measurement of the water level and of the qualitative informative revealed by visualization of videos of overflow events (Khorchani and Blanpain, 2004; Nguyen et al., 2009)
2.2 Flow velocity measurement In the image-processing field, two kinds of approach to measure a flow velocity are usually considered: the low-level-motion estimation methods or the feature-point tracking methods. The first one, the low-level approach, operates at the pixel-level in the spatiotemporal domain. Examples of such methods are optical flow (Horn and Schunck, 1981), block-matching, correlation methods, or spatio-temporal orientation method (Jähne, 1993). The low-level approaches are however inappropriate for our problem since the wastewater primarily exhibits homogeneous intensity in grayscale images (images captured in the infrared spectrum are grayscale images). Moreover, the low-level methods require a high similarity from one frame to the next frame to establish pixel correspondences. In sewer, cameras cannot run at very high frame rates due to low light conditions, the presence of perturbations at the surface of the water causes large difference between successive images, making low-level methods inapplicable.
Feature-points tracking methods is used when the image sequence consists mainly in moving objects over static background or quasi-homogenous background. Based on the experience we have in the sewer system, a few moving object are often present at the surface of the water. These particles or small debris are brighter or darker than the flow of wastewater, and we have designed an image-analysis system to track them over an image sequence. The continuous presence of these surface particles removes the need for adding colorant or other artificial targets in the water that would be needed in clean water.
The algorithm first detects bright areas on individual images that we call features. As first approximation, we consider that particles move with the same velocity as the flow, correction factors may be considered (Larrarte, 2005).
The problems of perspective and geometry correction must be considered. In sewer systems the position of the camera is imposed by the construction of the closed channel and this generates problems of perspective and geometric deformations. Moreover, the velocity is determined on the surface water, whose height changes over time. We overcome this problem by proposing a variable-height homography transformation. This homography transformation dynamically adapts itself with the changes in the water level.
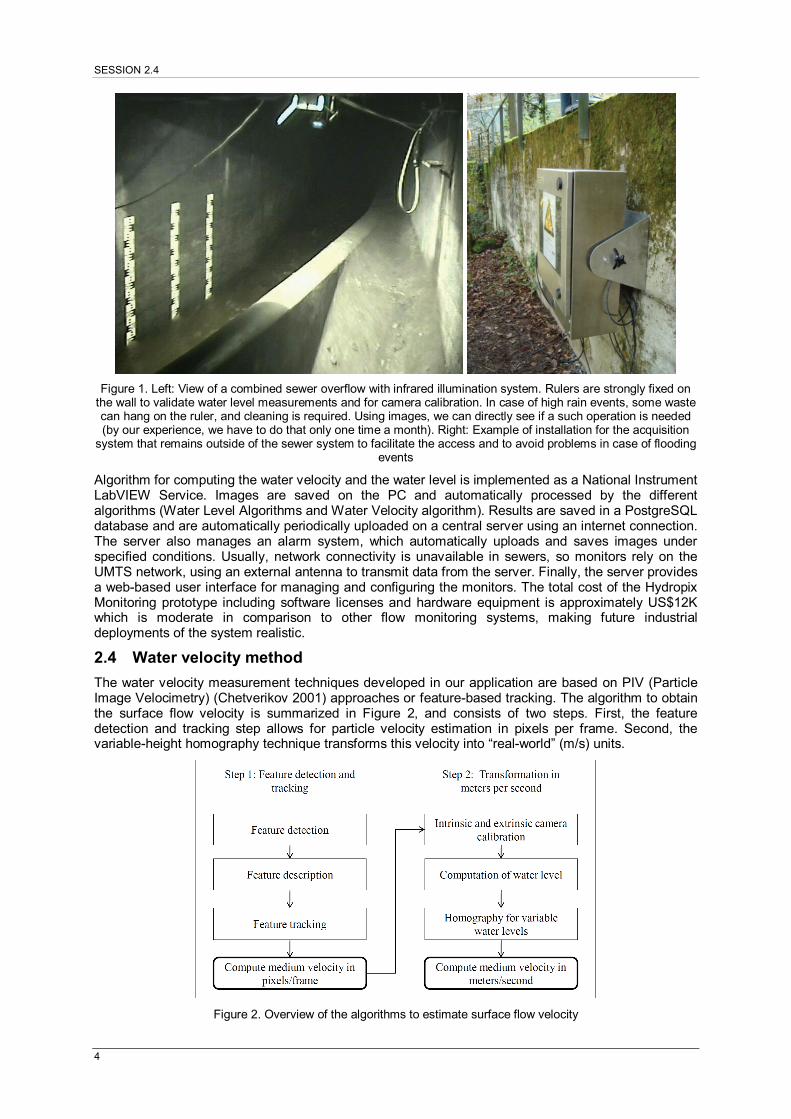
2.3 Data acquisition The HydroPix system acquires images using three cameras: one for the measurement of water level, one for the computation of water velocity and one to have an overview of the combined sewer overflow (Figure 1, left) and observe its behaviors during rain events. The cameras used in the system are AXIS 221 Network camera, which adapt the color depth of the images and the frame rate of the acquisition to the lighting conditions. They typically produce color sequences at 40 fps for optimal illumination, but switch to variable frame rate black and white images (in the infrared spectrum) with poor lightening. They are PoE (Power over Ethernet) IP cameras, which enables both power and data to go through the same cable. The use of standard Ethernet connectors makes the system independent of a specific camera manufacturer. The light sources used are low-power, water-resistant infra-red LED. An important benefit for sewers is that, in contrast to visible light, infrared has the benefit of not attracting insects. With suitably placed LEDs, a 25 fps frame rate was achieved. The cameras are installed in IP67 waterproof cases to protect them against splashing the water and corrosive environment. Cameras and LEDs are connected to a connectivity box (Figure 1, right) containing a power supply and a PC for image processing.
SESSION 2.4
4
Figure 1. Left: View of a combined sewer overflow with infrared illumination system. Rulers are strongly fixed on
the wall to validate water level measurements and for camera calibration. In case of high rain events, some waste can hang on the ruler, and cleaning is required. Using images, we can directly see if a such operation is needed (by our experience, we have to do that only one time a month). Right: Example of installation for the acquisition
system that remains outside of the sewer system to facilitate the access and to avoid problems in case of flooding events
Algorithm for computing the water velocity and the water level is implemented as a National Instrument LabVIEW Service. Images are saved on the PC and automatically processed by the different algorithms (Water Level Algorithms and Water Velocity algorithm). Results are saved in a PostgreSQL database and are automatically periodically uploaded on a central server using an internet connection. The server also manages an alarm system, which automatically uploads and saves images under specified conditions. Usually, network connectivity is unavailable in sewers, so monitors rely on the UMTS network, using an external antenna to transmit data from the server. Finally, the server provides a web-based user interface for managing and configuring the monitors. The total cost of the Hydropix Monitoring prototype including software licenses and hardware equipment is approximately US$12K which is moderate in comparison to other flow monitoring systems, making future industrial deployments of the system realistic.
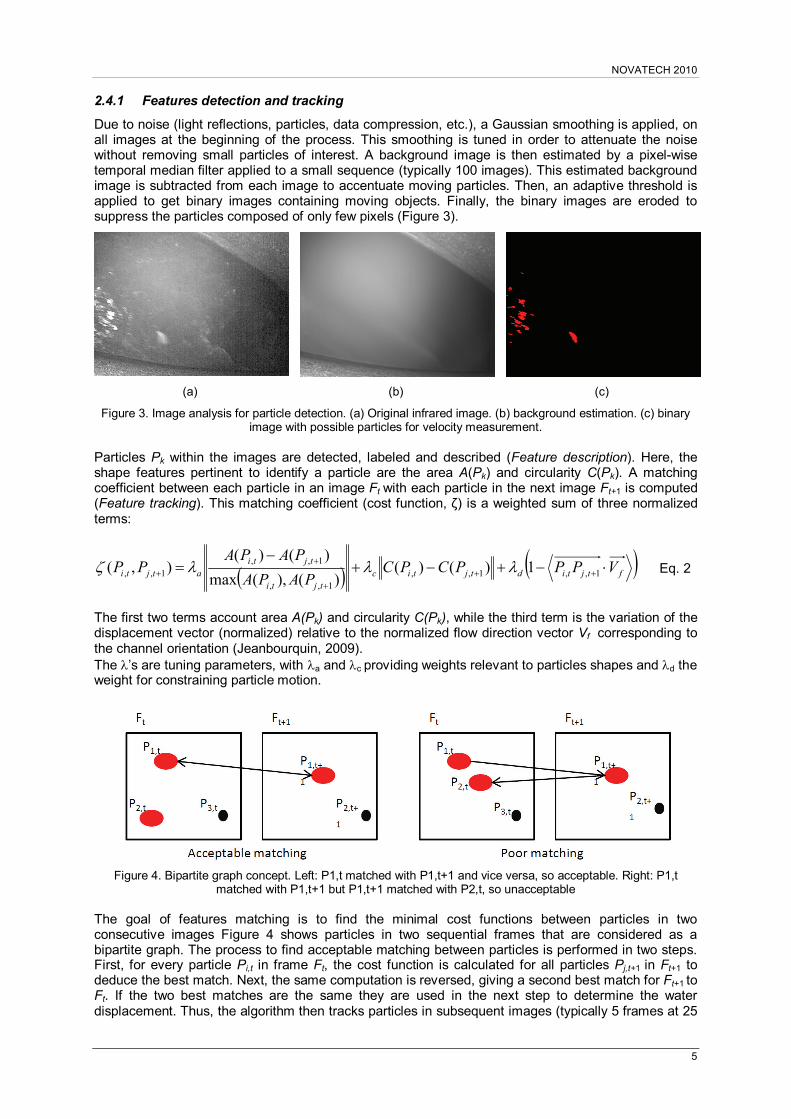
2.4 Water velocity method The water velocity measurement techniques developed in our application are based on PIV (Particle Image Velocimetry) (Chetverikov 2001) approaches or feature-based tracking. The algorithm to obtain the surface flow velocity is summarized in Figure 2, and consists of two steps. First, the feature detection and tracking step allows for particle velocity estimation in pixels per frame. Second, the variable-height homography technique transforms this velocity into �“real-world�” (m/s) units.
Figure 2. Overview of the algorithms to estimate surface flow velocity
NOVATECH 2010
5
2.4.1 Features detection and tracking
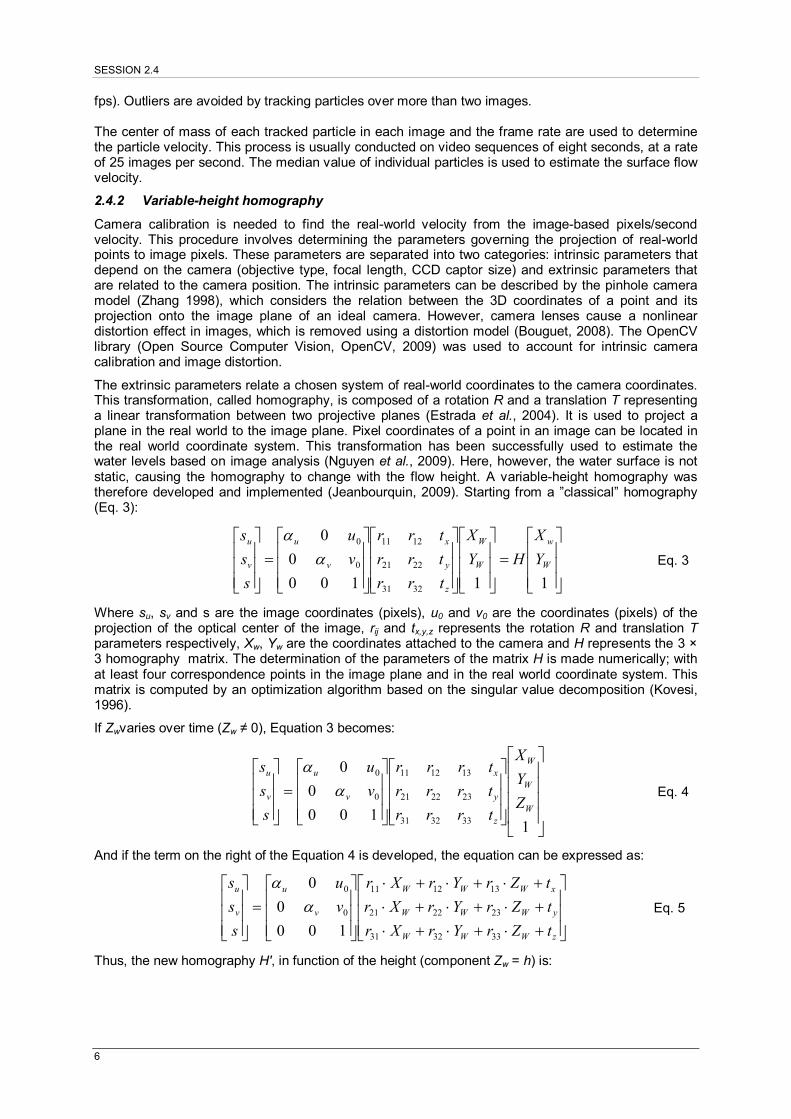
Due to noise (light reflections, particles, data compression, etc.), a Gaussian smoothing is applied, on all images at the beginning of the process. This smoothing is tuned in order to attenuate the noise without removing small particles of interest. A background image is then estimated by a pixel-wise temporal median filter applied to a small sequence (typically 100 images). This estimated background image is subtracted from each image to accentuate moving particles. Then, an adaptive threshold is applied to get binary images containing moving objects. Finally, the binary images are eroded to suppress the particles composed of only few pixels (Figure 3).
(a) (b) (c)
Figure 3. Image analysis for particle detection. (a) Original infrared image. (b) background estimation. (c) binary image with possible particles for velocity measurement.
Particles Pk within the images are detected, labeled and described (Feature description). Here, the shape features pertinent to identify a particle are the area A(Pk) and circularity C(Pk). A matching coefficient between each particle in an image Ft with each particle in the next image Ft+1 is computed (Feature tracking). This matching coefficient (cost function, ) is a weighted sum of three normalized terms:
ftjtidtjtictjti
tjtiatjti VPPPCPC
PAPAPAPA
PP 1,,1,,1,,
1,,1,, 1)()(
)(),(max)()(
),( Eq. 2
The first two terms account area A(Pk) and circularity C(Pk), while the third term is the variation of the displacement vector (normalized) relative to the normalized flow direction vector Vf corresponding to the channel orientation (Jeanbourquin, 2009). The �’s are tuning parameters, with a and c providing weights relevant to particles shapes and d the weight for constraining particle motion.
Figure 4. Bipartite graph concept. Left: P1,t matched with P1,t+1 and vice versa, so acceptable. Right: P1,t
matched with P1,t+1 but P1,t+1 matched with P2,t, so unacceptable The goal of features matching is to find the minimal cost functions between particles in two consecutive images Figure 4 shows particles in two sequential frames that are considered as a bipartite graph. The process to find acceptable matching between particles is performed in two steps. First, for every particle Pi,t in frame Ft, the cost function is calculated for all particles Pj,t+1 in Ft+1 to deduce the best match. Next, the same computation is reversed, giving a second best match for Ft+1 to Ft. If the two best matches are the same they are used in the next step to determine the water displacement. Thus, the algorithm then tracks particles in subsequent images (typically 5 frames at 25
SESSION 2.4
6
fps). Outliers are avoided by tracking particles over more than two images. The center of mass of each tracked particle in each image and the frame rate are used to determine the particle velocity. This process is usually conducted on video sequences of eight seconds, at a rate of 25 images per second. The median value of individual particles is used to estimate the surface flow velocity.
2.4.2 Variable-height homography
Camera calibration is needed to find the real-world velocity from the image-based pixels/second velocity. This procedure involves determining the parameters governing the projection of real-world points to image pixels. These parameters are separated into two categories: intrinsic parameters that depend on the camera (objective type, focal length, CCD captor size) and extrinsic parameters that are related to the camera position. The intrinsic parameters can be described by the pinhole camera model (Zhang 1998), which considers the relation between the 3D coordinates of a point and its projection onto the image plane of an ideal camera. However, camera lenses cause a nonlinear distortion effect in images, which is removed using a distortion model (Bouguet, 2008). The OpenCV library (Open Source Computer Vision, OpenCV, 2009) was used to account for intrinsic camera calibration and image distortion.
The extrinsic parameters relate a chosen system of real-world coordinates to the camera coordinates. This transformation, called homography, is composed of a rotation R and a translation T representing a linear transformation between two projective planes (Estrada et al., 2004). It is used to project a plane in the real world to the image plane. Pixel coordinates of a point in an image can be located in the real world coordinate system. This transformation has been successfully used to estimate the water levels based on image analysis (Nguyen et al., 2009). Here, however, the water surface is not static, causing the homography to change with the flow height. A variable-height homography was therefore developed and implemented (Jeanbourquin, 2009). Starting from a �”classical�” homography (Eq. 3):
111000
0
3231
2221
1211
0
0
W
w
W
W
z
y
x
v
u
v
u
YX
HYX
trrtrrtrr
vu
sss
Eq. 3
Where su, sv and s are the image coordinates (pixels), u0 and v0 are the coordinates (pixels) of the projection of the optical center of the image, rij and tx,y,z represents the rotation R and translation T parameters respectively, Xw, Yw are the coordinates attached to the camera and H represents the 3 × 3 homography matrix. The determination of the parameters of the matrix H is made numerically; with at least four correspondence points in the image plane and in the real world coordinate system. This matrix is computed by an optimization algorithm based on the singular value decomposition (Kovesi, 1996).
If Zwvaries over time (Zw 0), Equation 3 becomes:
1100
00
333231
232221
131211
0
0
W
W
W
z
y
x
v
u
v
u
ZYX
trrrtrrrtrrr
vu
sss
Eq. 4
And if the term on the right of the Equation 4 is developed, the equation can be expressed as:
zWWW
yWWW
xWWW
v
u
v
u
tZrYrXrtZrYrXrtZrYrXr
vu
sss
333231
232221
131211
0
0
1000
0 Eq. 5
Thus, the new homography H', in function of the height (component Zw = h) is:
NOVATECH 2010
7
z
y
x
v
u
thrrrthrrrthrrr
vu
H
333231
232221
131211
0
0
1000
0' Eq. 6
Finally, the real world coordinates of points in the image given in pixels are given by:
sss
HYX
v
u
W
w1'
1 Eq. 7
The intrinsic and extrinsic parameters were calibrated by measuring the size and deformation of a chessboard texture plane at different positions and angles. This chessboard is first used in the laboratory for intrinsic calibration. It is then used once the cameras are fixed in the sewer, to determine the extrinsic parameters. The calibration process is conducted using a dedicated function in the web-based user interface.
Finally, note that the precision of the velocity estimate depends on that of the water level height. This height can be measured using an ultrasonic probe or, preferably, within HydroPix using the existing water level algorithm. (Nguyen et al., 2009). Thus, the precision of the velocity estimation will directly depend on the precision of the water level measurement.
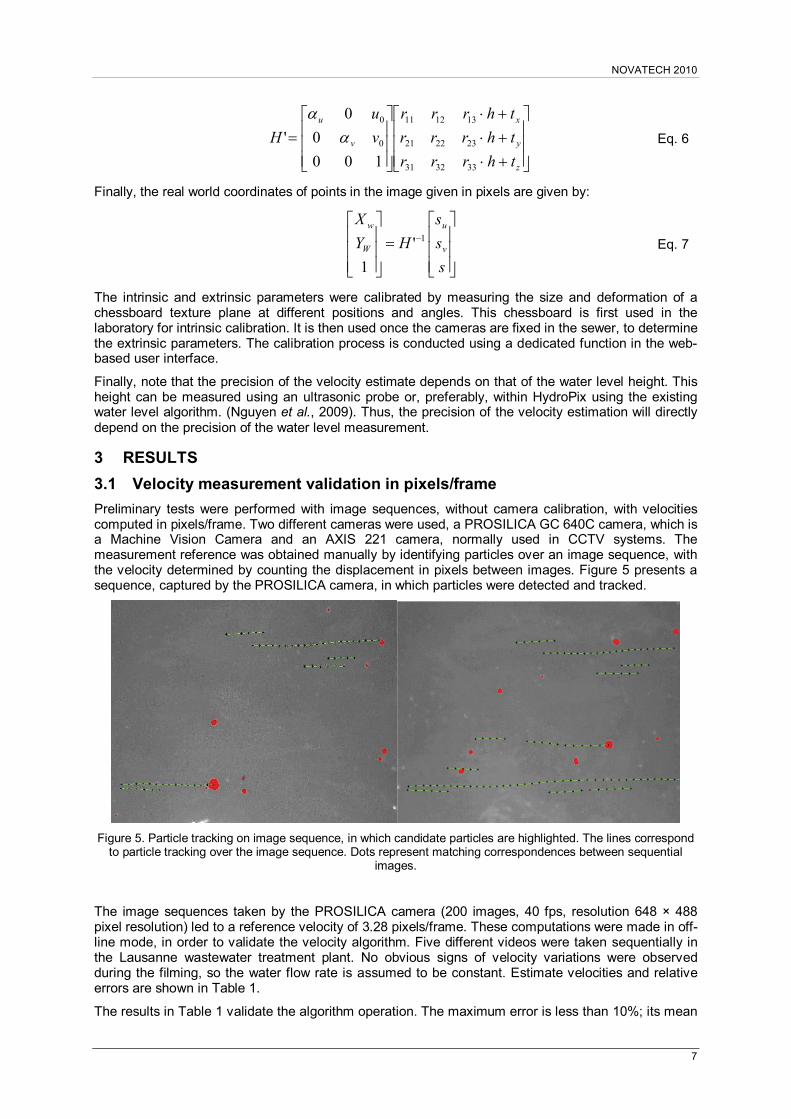
3 RESULTS 3.1 Velocity measurement validation in pixels/frame Preliminary tests were performed with image sequences, without camera calibration, with velocities computed in pixels/frame. Two different cameras were used, a PROSILICA GC 640C camera, which is a Machine Vision Camera and an AXIS 221 camera, normally used in CCTV systems. The measurement reference was obtained manually by identifying particles over an image sequence, with the velocity determined by counting the displacement in pixels between images. Figure 5 presents a sequence, captured by the PROSILICA camera, in which particles were detected and tracked.
Figure 5. Particle tracking on image sequence, in which candidate particles are highlighted. The lines correspond
to particle tracking over the image sequence. Dots represent matching correspondences between sequential images.
The image sequences taken by the PROSILICA camera (200 images, 40 fps, resolution 648 × 488 pixel resolution) led to a reference velocity of 3.28 pixels/frame. These computations were made in off-line mode, in order to validate the velocity algorithm. Five different videos were taken sequentially in the Lausanne wastewater treatment plant. No obvious signs of velocity variations were observed during the filming, so the water flow rate is assumed to be constant. Estimate velocities and relative errors are shown in Table 1.
The results in Table 1 validate the algorithm operation. The maximum error is less than 10%; its mean
SESSION 2.4
8
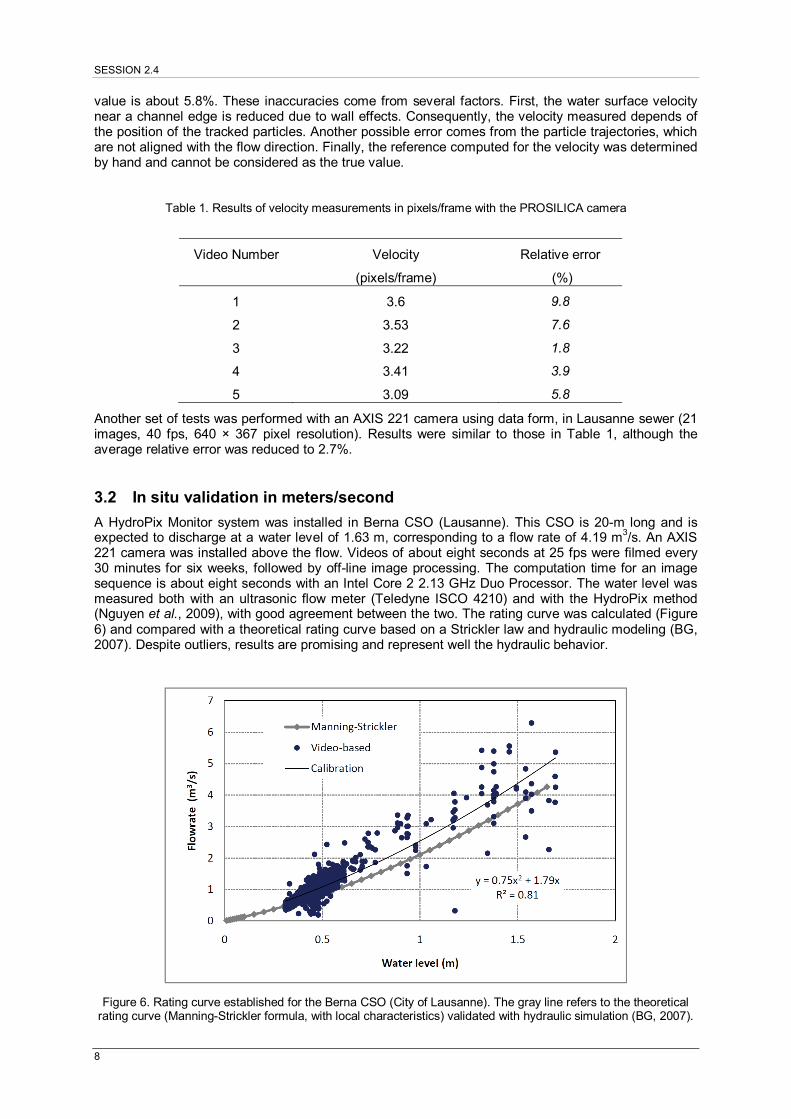
value is about 5.8%. These inaccuracies come from several factors. First, the water surface velocity near a channel edge is reduced due to wall effects. Consequently, the velocity measured depends of the position of the tracked particles. Another possible error comes from the particle trajectories, which are not aligned with the flow direction. Finally, the reference computed for the velocity was determined by hand and cannot be considered as the true value.
Table 1. Results of velocity measurements in pixels/frame with the PROSILICA camera
Video Number Velocity
(pixels/frame)
Relative error
(%)
1 3.6 9.8
2 3.53 7.6
3 3.22 1.8
4 3.41 3.9
5 3.09 5.8
Another set of tests was performed with an AXIS 221 camera using data form, in Lausanne sewer (21 images, 40 fps, 640 × 367 pixel resolution). Results were similar to those in Table 1, although the average relative error was reduced to 2.7%.
3.2 In situ validation in meters/second A HydroPix Monitor system was installed in Berna CSO (Lausanne). This CSO is 20-m long and is expected to discharge at a water level of 1.63 m, corresponding to a flow rate of 4.19 m3/s. An AXIS 221 camera was installed above the flow. Videos of about eight seconds at 25 fps were filmed every 30 minutes for six weeks, followed by off-line image processing. The computation time for an image sequence is about eight seconds with an Intel Core 2 2.13 GHz Duo Processor. The water level was measured both with an ultrasonic flow meter (Teledyne ISCO 4210) and with the HydroPix method (Nguyen et al., 2009), with good agreement between the two. The rating curve was calculated (Figure 6) and compared with a theoretical rating curve based on a Strickler law and hydraulic modeling (BG, 2007). Despite outliers, results are promising and represent well the hydraulic behavior.
Figure 6. Rating curve established for the Berna CSO (City of Lausanne). The gray line refers to the theoretical
rating curve (Manning-Strickler formula, with local characteristics) validated with hydraulic simulation (BG, 2007).
NOVATECH 2010
9
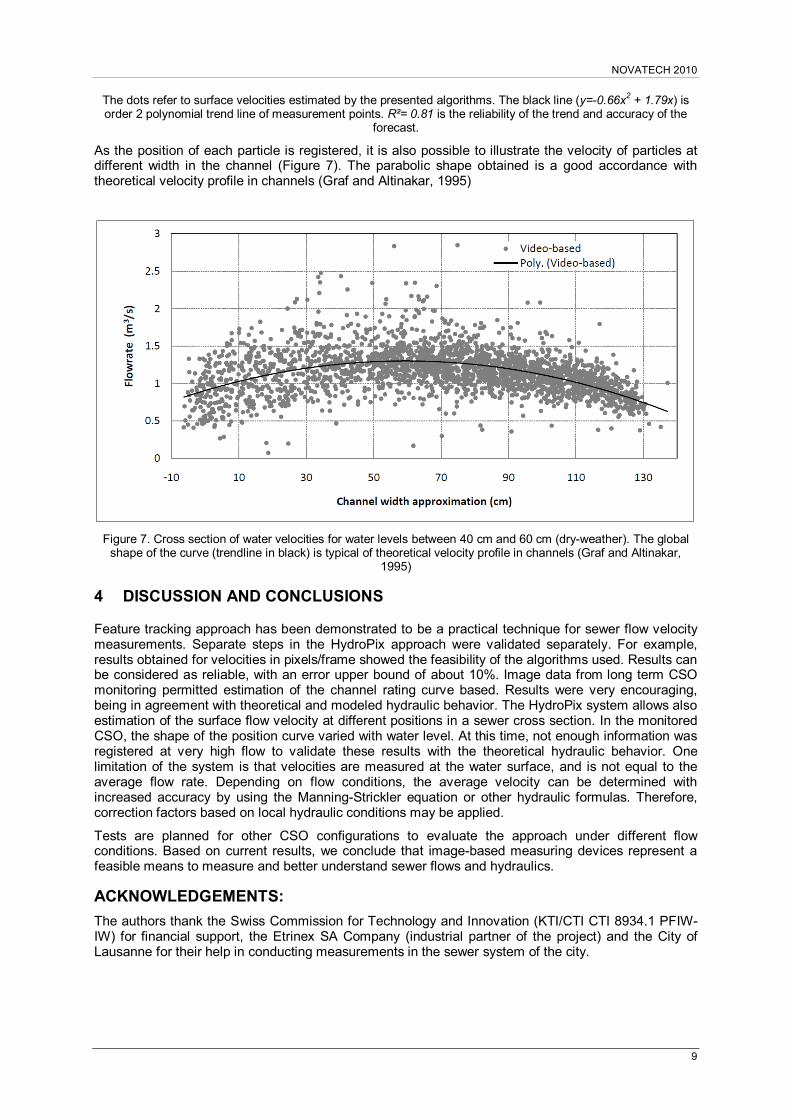
The dots refer to surface velocities estimated by the presented algorithms. The black line (y=-0.66x2 + 1.79x) is order 2 polynomial trend line of measurement points. R²= 0.81 is the reliability of the trend and accuracy of the
forecast.
As the position of each particle is registered, it is also possible to illustrate the velocity of particles at different width in the channel (Figure 7). The parabolic shape obtained is a good accordance with theoretical velocity profile in channels (Graf and Altinakar, 1995)
Figure 7. Cross section of water velocities for water levels between 40 cm and 60 cm (dry-weather). The global
shape of the curve (trendline in black) is typical of theoretical velocity profile in channels (Graf and Altinakar, 1995)
4 DISCUSSION AND CONCLUSIONS
Feature tracking approach has been demonstrated to be a practical technique for sewer flow velocity measurements. Separate steps in the HydroPix approach were validated separately. For example, results obtained for velocities in pixels/frame showed the feasibility of the algorithms used. Results can be considered as reliable, with an error upper bound of about 10%. Image data from long term CSO monitoring permitted estimation of the channel rating curve based. Results were very encouraging, being in agreement with theoretical and modeled hydraulic behavior. The HydroPix system allows also estimation of the surface flow velocity at different positions in a sewer cross section. In the monitored CSO, the shape of the position curve varied with water level. At this time, not enough information was registered at very high flow to validate these results with the theoretical hydraulic behavior. One limitation of the system is that velocities are measured at the water surface, and is not equal to the average flow rate. Depending on flow conditions, the average velocity can be determined with increased accuracy by using the Manning-Strickler equation or other hydraulic formulas. Therefore, correction factors based on local hydraulic conditions may be applied.
Tests are planned for other CSO configurations to evaluate the approach under different flow conditions. Based on current results, we conclude that image-based measuring devices represent a feasible means to measure and better understand sewer flows and hydraulics.
ACKNOWLEDGEMENTS: The authors thank the Swiss Commission for Technology and Innovation (KTI/CTI CTI 8934.1 PFIW-IW) for financial support, the Etrinex SA Company (industrial partner of the project) and the City of Lausanne for their help in conducting measurements in the sewer system of the city.
SESSION 2.4
10
LIST OF REFERENCES
BG (2007). (In French). Ville de Lausanne, Service d'Assainissement : Calculs Hydrauliques des Déversoirs d�’Orage. Report of BG, Consulting Engineers, ref. 6505.01-RN011b/Esd/Mob/Swr, Lausanne, Switzerland.
Bouguet J.Y. (2008). Camera Calibration Toolbox for Matlab. http://www.vision.caltech.edu/bouguetj/calib_doc/ (accessed 2009-10-01).
Chetverikov D. (2001). Particle Image Velocimetry by Feature Tracking. Computer Analysis of Images and Patterns. Vol. 2124/2001. Springer Verlag, Berlin / Heidelberg
Estrada F.J., Jepson A.D., Fleet D. (2004). Planar Homographies. Lecture notes, http://www.cs.utoronto.ca/~strider/vis-notes/tutHomography04.pdf (accessed 2009-05-19).
Graf W.H., Altinakar M.S. (1995). Hydrodynamique : une introduction. Traité de génie civil, volume n°14, PPUR eds (Presse Polytechnique et Universitaires Romandes), Lausanne, Switzerland.
Horn B.K.P. and Schunck B.G. (1981). Determining Optical Flow. Artificial Intelligence 17: pp. 185-203.
Jähne B. (1993). Spatio-Temporal Image Processing, Lectures Notes in Computer Science, Vol. 751, Springer Berlin, Germany
Jeanbourquin D. (2009). Implementation of an image-based surface water velocity measurement algorithm. Master Thesis EPFL, ENAC, Laboratory of ecological engineering (ECOL), Lausanne, Switzerland.
Jensen K.D. (2004). Flow Measurements. Journal of the Brazilian Society of Mechanical Sciences and Engineering, Vol. 26(4), 400-419
Jodeau M, Hauet A, Paquier A, Le Coz J, Dramais G (2008). Application and evaluation of LS-PIV technique for the monitoring of river surface velocities in high flow conditions. Flow Measurement and Instrumentation 19:2, pp 117 �– 127.
Khorchani M and Blanpain O (2004). Free surface measurement of flow over side weirs using the video monitoring concept. Flow Measurement and Instrumentation 15:2, pp 111-117
Kovesi P.D. (1996) MATLAB and Octave Functions for Computer Vision and Image Processing. School of Computer Science & Software Engineering, The University of Western Australia. Available from: http://www.csse.uwa.edu.au/~pk/research/matlabfns/. (accesses 2009-10-01)
Kovesi P.D (2009). MATLAB and Octave Functions for Computer Vision and Image Processing. School of Computer Science & Software Engineering, The University of Western Australia. http://www.csse.uwa.edu.au/~pk/research/matlabfns/. (accessed 1 October 2009).
Larrarte F. (2006). Velocity Fields within Sewers: an Experimental Study. Flow Measurement and Instrumentation, Vol. 17, 282�–290.
Nguyen L, Schaeli B, Sage D, Kayal S, Jeanbourquin D, Barry DA, Rossi L (2009). Vision-based system for the control and measurement of wastewater flow rate in sewer systems. Water Science and Technology 60.9: 2281-2289. doi: 10.2166/wst.2009.659.OpenCV (2009). OpenCV Library official site: http://opencv.willowgarage.com/wiki/Welcome (accesses 2009-10-01)
Zhang Z. (2000). A Flexible New Technique for Camera Calibration. IEEE Transactions on Pattern Analysis and Machine Intelligence. . Vol 22(11) pp. 1330-1334.