
Alignment of the Measurement Scale Mark during Immersion ...

Measurement-Based Model of Structural Sound Transmission in a ConcreteSpecimen
Reemt Hinrichs, M. Sc. *E-mail: [email protected]
Dipl.-Ing. Thomas Krause *E-mail: [email protected]
Dipl.-Ing. Max Käding **E-mail: [email protected]
Univ.-Prof. Dr.-Ing. Jörn Ostermann *E-mail: [email protected]
Univ.-Prof. Dr.-Ing. Steffen Marx **E-mail: [email protected]
* Institut für Informationsverarbeitung (TNT)Leibniz Universität Hannover
Appelstraße 9A30167 Hannover
Tel. +49 (0)511 762 – 5316
** Institut für MassivbauLeibniz Universität Hannover
Appelstraße 9A30167 Hannover
Tel. +49 (0)511 762 – 3352
AbstractIn the field of Non-Destructive Testing and Structural Health Monitoring the propagation of sound in solids is used in methods like acoustic emission, ultrasonic testing and vibration based approaches. The acoustic path in the material has a major influence on the measured sensor signal and therefore has to be taken into account. Important parameters are the position of the source and the sensor. From the signal processing point of view the behaviour of the acoustic channel can be described by position dependent transfer functions. A typical way to predict suchfunctions is by simulation which requires a lot of prior knowledge like material properties and the shape of the specimen. In this paper a different approach based on real world measurements is presented. The sound transmission in a concrete specimen (dimensions 1451 x 105 x 100 mm) between an actuator and an acceleration sensor was investigated in the frequency domain of 200 to 9,900 Hz. In total 195 measurements were made alongside the axis of the specimen in a 5mm grid. Based on these measurements a model of the acoustic channel was designed and evaluated which describes the system behaviour in terms of absolute amplitude frequency responses alongside one dimension of the specimen. The response at one frequency bin over the position is modelled by an absolute sine function with an amplitude modulation term. The position based periodicity is modelled assuming only one speed of sound. The parameters of the model were derived by a genetic optimization algorithm. Except for positions very close to the source and close to the end of the specimen, the model predicts the absolute amplitude frequency response alongside the specimen with good accuracy, achieving a
1
normalized mean square error below 0.01 per sample at frequencies with sufficient signal-to-noise ratio.
1. IntroductionConcrete structures such as bridges are of great importance to the infrastructure of manycountries. For example concrete bridges make up the majority of motorways’ and trunk roads' bridge stock in the United Kingdom. Especially older structures such as a large part of the bridge stock in the U.S. need verification of their structural integrity to guarantee safety of passage. Acoustics and more specifically acoustic emission (AE) can be of great practical use to monitor the health of structures. For example (1) showedthat determination of the speed of sound in concrete can be used to evaluate its crack growth. Krause et al. used airborne sound in (2) to detect fatigue damage of rotor blades. The field of acoustic damage detection is usually divided into parametric and waveform approaches. The former extracts certain characteristics out of complex AE data to characterize AE events using a small set of parameters. The latter typically uses complete information recorded due to an AE event to deduce more precise information about the structure under test such as the mechanisms at the source (3, 4, 5).
For waveform analysis it is common to use system theory to model the structure under test. This yields
H AE=H t H m H s (1)
with the sound channel function H AE , sensor transfer function H t (including its coupling to the surface), the material transfer function H m and the acoustic source function H s . The information of interest lies in the source function H s which characterizes the source of the acoustic emission e.g. a new material crack. If the other system functions are known, the source function can be obtained in frequency domain by division and in time domain by inverse Fourier transform followed by inverse convolution. This method was initiated by Breckenridge et al.. For few specimen the source function was determined under special conditions (i.e. special geometries, crack orientation and strong source events) (6).
Wadley et al. were able to find the volume-time relation of cracks in mild steel using Green's function for a half-space as H m . Michaels et al. used Green's function of an infinite plate for source characterization (7, 8). Using a seismic moment tensor and theoretical material function H m Landis was able to calculate slip angles of microcracks occurring during bending tests of girders made of mortar and cement (9). The key problem in this approach is obtaining a suitable material transfer function
H m . Only for a few geometries (e.g. full-space, half-space) theoretical solutions exist. However these do not take into account non-ideal material properties (10, 11). A possible alternative is determining H m , also known as Green's function in elastomechanics, using experimental means.
Michaels showed in (8) that their empirically found material functions at a single position agreed well with the theoretical approximation. Masaki et al. successfully obtained the Green's function of an aluminium cylinder experimentally at a single position using an artificial laser source (11). However research regarding this approach is scarce and such a method has not been used for concrete to the best knowledge of the authors. Generally a way to determine or approximate H m is of great interest due to the insight it allows.
2
Calculating H m could be made possible if a model for H AE is given. If H AE can be calculated for arbitrary positions it could be used to estimate H m given a known source function H s and sensor transfer function H t including its coupling. Additionally H AE gives insight into proper sensor placements for structural health monitoring using acoustic emission.
The idea of this paper is therefore to develop a model of for H AE out of the observed position dependency of the transfer function of the channel. This would allow to take into account the real structure geometries and material properties. Using an empirical model for H AE could allow to use Eq. (1) to calculate H m in future work and subsequently make acquiring the source function H s of acoustic emissions eventspossible robustly and thus allow for better characterization of an acoustic event.
Section 2 gives a brief overview over the devices and materials used. The following section 3 outlines the procedure used to yield our results. Section 4 presents these results and discusses them. Section 5 gives a short summary of this paper and outlines possible further research.
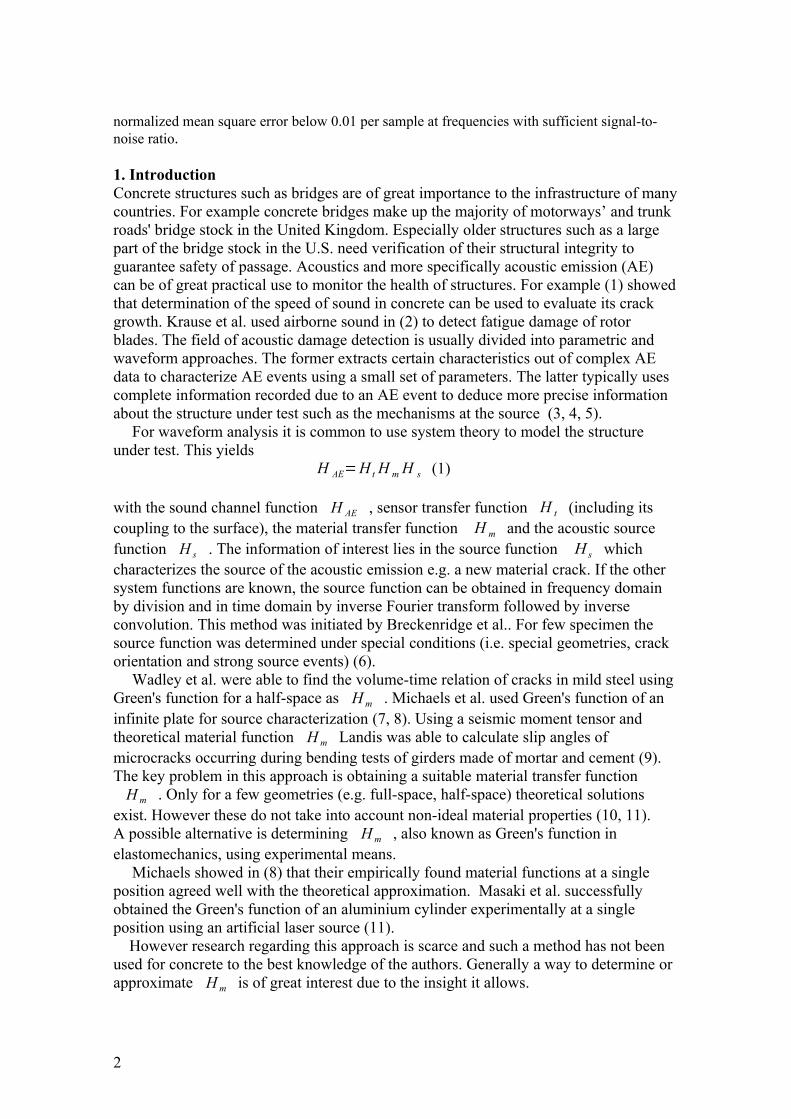
2. Method and materialsFigure 1 shows the concrete girder used for the experiments. Its dimensions are 1451 x 105 x 100 mm (l x h x w). Large arrows mark the positions of the beginning and end edges which later figures refer to. The concrete mixture used had a strength class of C25/30. The girder was decoupled from its environment using a foam material base. Audio signals were generated by a notebook which were passed through a conventional audio amplifier and then applied to the girder's surface. Piezoelectric sensor signals were then routed through a signal conditioner, that serves as a current source for the sensors, and passed through an audio-interface back to the notebook.
As a structure-borne sound source actuators of the series EX 30 S by Visaton were used. Conventional double-sided adhesive tape was used as mounting. For all measurements piezoelectric sensors of type 355B04 by PCB Piezotronics were used. The sensors were fixed on the surface of the girder using a wax mount. Resonance frequency of this mounting type is upwards of 10000 Hz excitement frequency according to the manufacturer's specifications. For prompt frequency response (FR) calculations the software Audio Real Time Analysis (ARTA) developed by I. Mateljan was used.
3. Procedure First the linearity of the system came under scrutiny. This was necessary to guarantee that linear system theory applies. Subsequently the FR was measured on the girder's surface for 195 positions in 5 mm intervals ranging from close to the source at 475 mm to one of the edges of the girder at 1445 mm. For the observed FR-position dependency a simple model was developed and its four parameters fitted to the measurements using Matlab's genetic algorithm (GA) (see Section 3.2). The results of the optimizations werethen used to investigate possible functional relationships between the relevant dimensions. In all cases only the amplitude response was considered. The phase response was ignored which was observed to be not well reproducible.
3
3.1 LinearityLinearity of a system denoted by H is given if and only if H is additive and homogeneous. Additivity is defined as
H (x [n]+ y [n])=H ( x [n])+ H ( y [n]) (2) for arbitrary discrete input signals x[n] and y[n]. Homogeneity is defined as
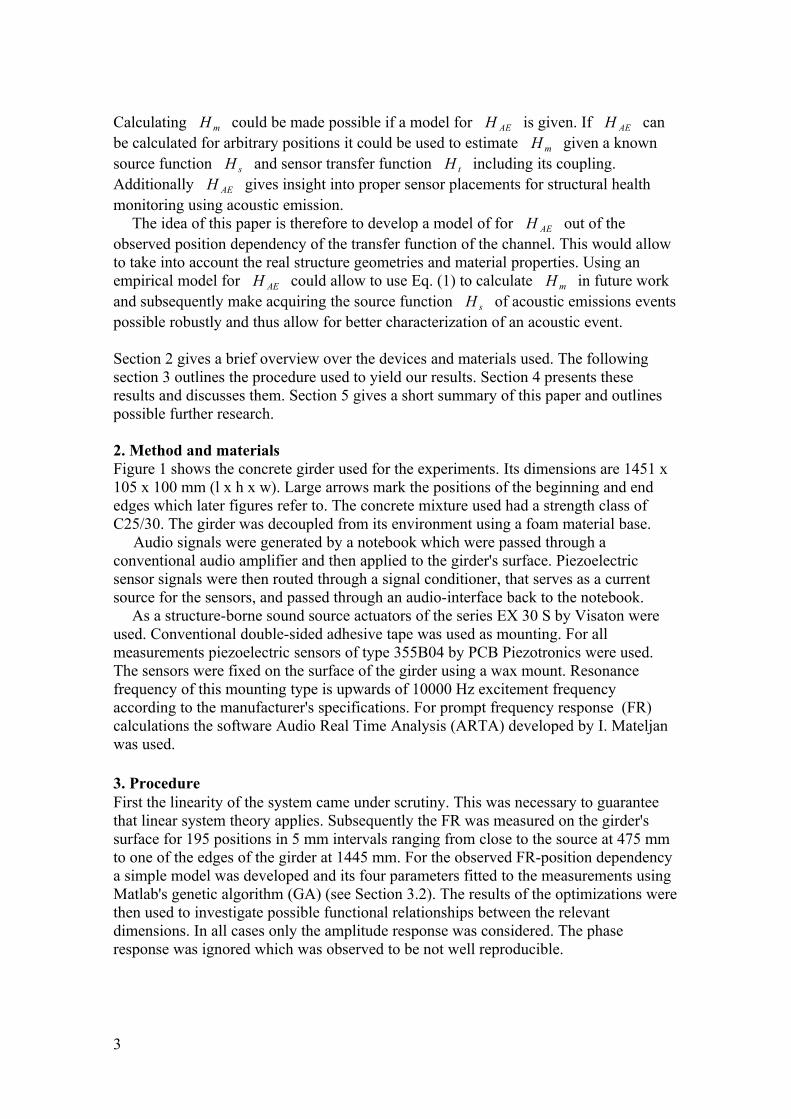
H (c⋅x [n ])=c⋅H (x [n]) (3) for an arbitrary constant c∈ℝ and discrete input signal x[n]. To investigate these properties single sine and mixed sine signals of different amplitudes and frequencies were applied to the girder's surface and the girder's response was recorded at four different positions. Additionally the total harmonic distortion (THD) was calculated. The results are shown in Figure 2. Good agreement with Eq. (2) and (3) for most frequencies can be observed. Frequencies for which greater discrepancies from linear behaviour are observed such as at 7800 Hz were all those of low signal-to-noise ratio (SNR). At these frequencies only noise was present in the recorded data. We assume this occurs due measuring near a zero of a standing wave. To investigate the non linear distortions the THD was calculated and is shown in Fig. 2 (c). The big peaks such as at 1115 Hz and 7790 Hz all fell into frequency regions of very low SNR where the signal vanished. The results of the homogeneity and additivity analysis backed by the THD measurements of below 1 % for most of the region put under test lead us to assume linear system behaviour for the chosen equipment and parameters.
4
Figure 1: (a) Concrete Girder with applied sound actuators. Signal conditioner on top of theaudio-interface are seen in the bottom left. (b) Sketch of the procedure. One fixed actuatorand one piezoelectric sensor were used to measure the girder's FR for equally spacedpositions. After each measurement the sensor was moved alongside the girder's surface.
3.2 Measurement and modelFor measurement a sensor was applied at the initial position 475 mm, the frequency response at its position measured and then the sensor moved in linear direction by 5 mmand the process was repeated. This was done 195 times yielding 195 points on the concrete girder for which the FR was calculated. Now the change of the FR at a fixed frequency over the length of the girder was investigated.
For most signal frequencies a clear periodicity was observed. The frequency of this periodicity increases with increasing signal frequency of excitation. At frequencies for which this was not the case mostly noise was present in the data due to very low SNR. Furthermore a frequency dependent damping was observed. Except for positions close to either the edge of the girder or close to the exciter at about 430 mm all divergences from the apparent harmonic course were considered to be due to noise. Combining theseobservations the model
y f =∣ H AE ( x , f )∣=A ( f )⋅e (−k ( f )⋅x )∣sin( 2⋅πλ( f )
x+ 2⋅π⋅ϕ ( f ))∣ (4)
was used for the sensor output signal with four frequency dependent parameters A, k,λ and ϕ , which represent amplitude, damping, position-period and phase
respectively.The latter was introduced to conveniently fit the model to the start of the measured data and has no physical meaning. The parameters of the model were optimized for each frequency using Matlab's GA. As error function E to be minimized
E f ( A ,k ,λ ,ϕ)=∑i=1
N
∣ y i , f − y f (A ,k ,λ ,ϕ ; x i)∣2
(5)
was chosen with measuring points yi , representing the amplitude response at signal frequency f and sensor position xi , along the girder and model predictions
y f (A ,k ,λ ,ϕ ; x i) according to Eq. (4). Initial values for the optimization were obtained for parameters A and λ by calculating the discrete Fourier coefficients andthe Fourier series of the absolute sine function. Comparison of coefficients lead to reasonable starting values.
5
Figure 2: (a) Homogeneity analysis results for 200 Hz to 9900 Hz , (b) Additivity analysis results for200 Hz to 3300 Hz and (c) Total harmonic distortion for 200 Hz to 9900 Hz . Additivity analysis was
done by applying a signal of the form x(t)=∑n=1
3
an sin (2π n f ) and comparing it to the sum of the
individual system responses at the frequencies under test.
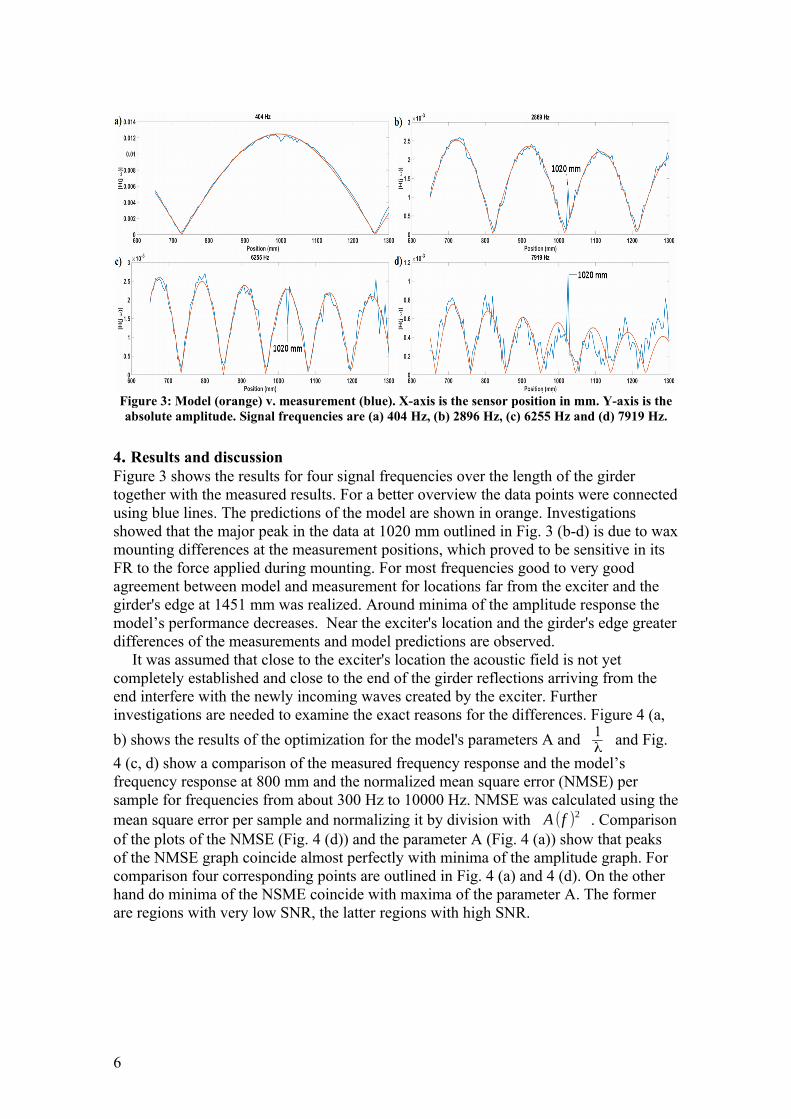
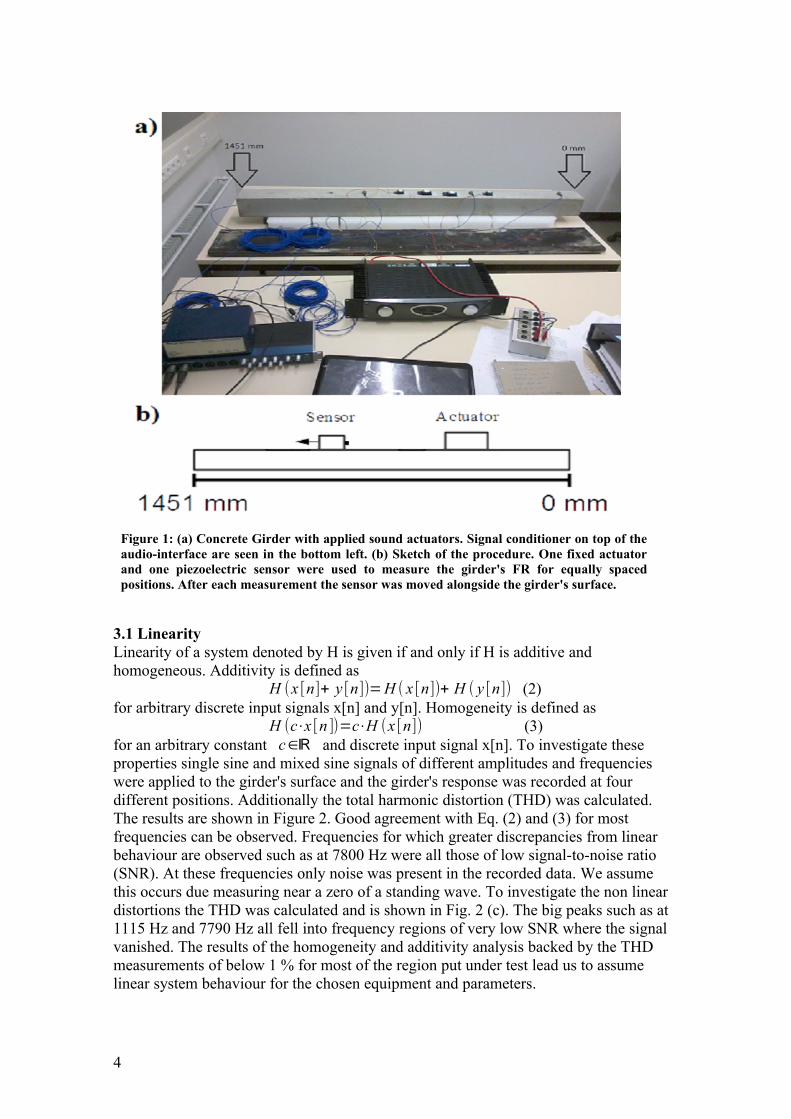
4. Results and discussionFigure 3 shows the results for four signal frequencies over the length of the girder together with the measured results. For a better overview the data points were connectedusing blue lines. The predictions of the model are shown in orange. Investigations showed that the major peak in the data at 1020 mm outlined in Fig. 3 (b-d) is due to waxmounting differences at the measurement positions, which proved to be sensitive in its FR to the force applied during mounting. For most frequencies good to very good agreement between model and measurement for locations far from the exciter and the girder's edge at 1451 mm was realized. Around minima of the amplitude response the model’s performance decreases. Near the exciter's location and the girder's edge greaterdifferences of the measurements and model predictions are observed.
It was assumed that close to the exciter's location the acoustic field is not yet completely established and close to the end of the girder reflections arriving from the end interfere with the newly incoming waves created by the exciter. Further investigations are needed to examine the exact reasons for the differences. Figure 4 (a,
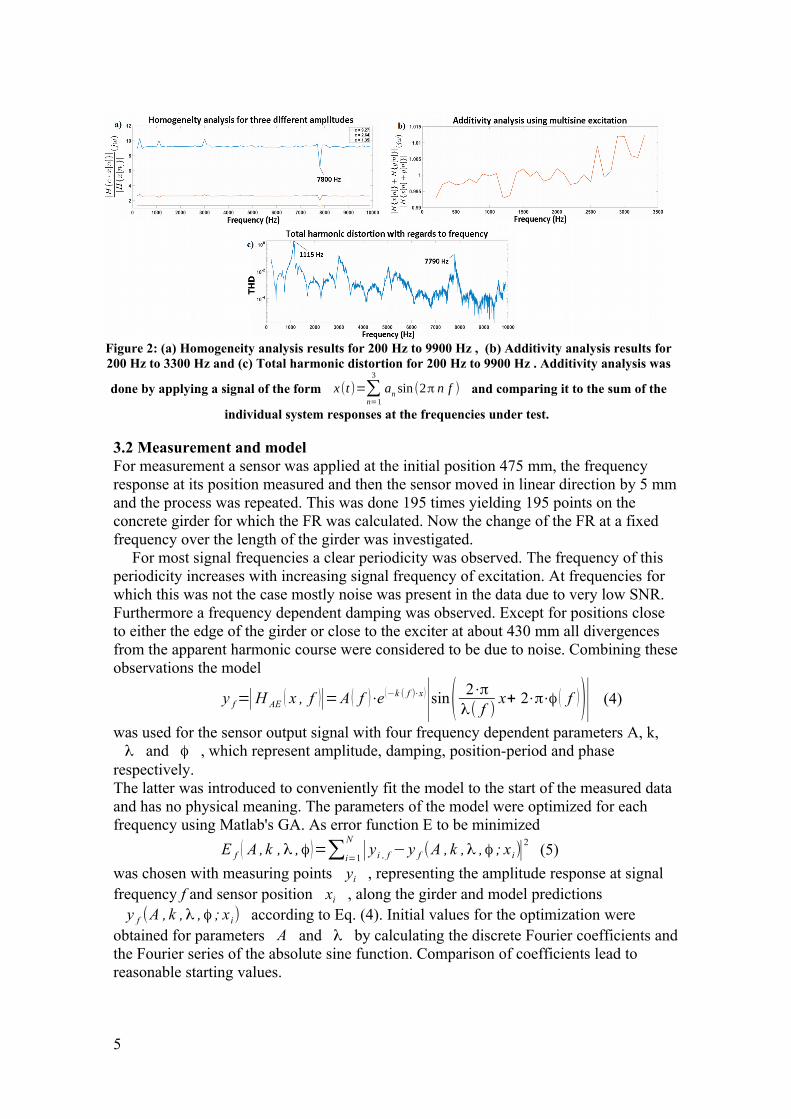
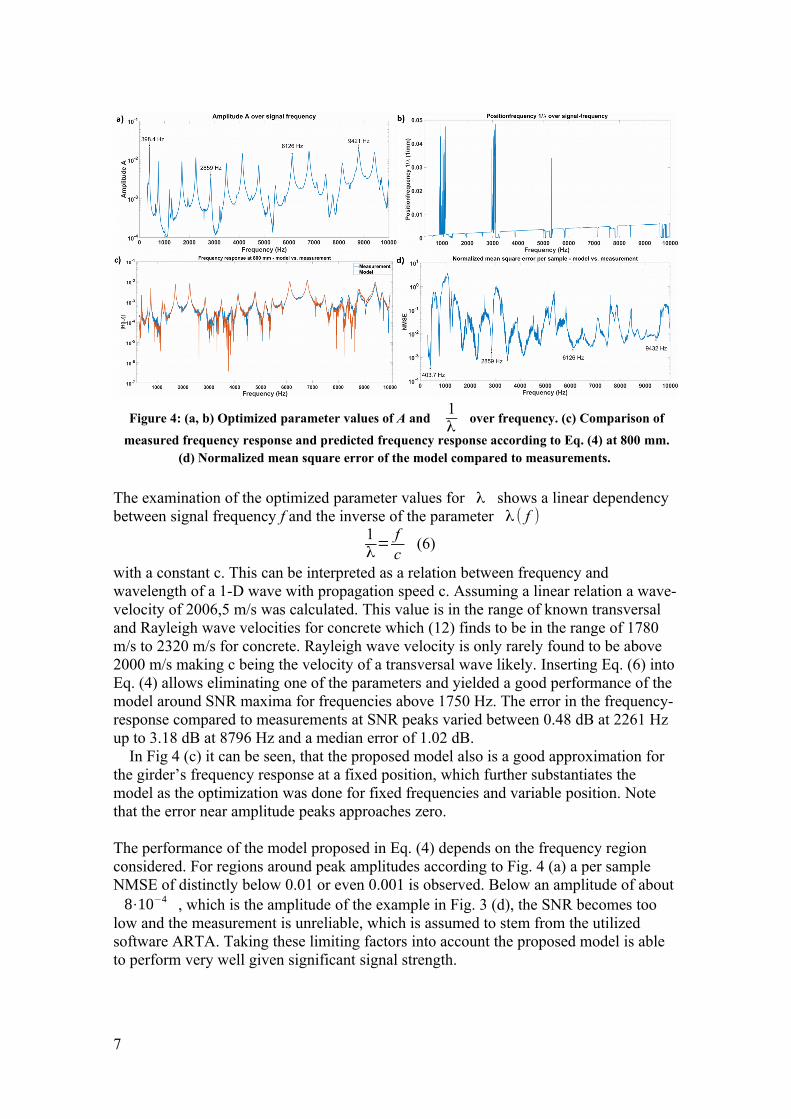
b) shows the results of the optimization for the model's parameters A and 1λ
and Fig.
4 (c, d) show a comparison of the measured frequency response and the model’s frequency response at 800 mm and the normalized mean square error (NMSE) per sample for frequencies from about 300 Hz to 10000 Hz. NMSE was calculated using themean square error per sample and normalizing it by division with A (f )2 . Comparisonof the plots of the NMSE (Fig. 4 (d)) and the parameter A (Fig. 4 (a)) show that peaks of the NMSE graph coincide almost perfectly with minima of the amplitude graph. For comparison four corresponding points are outlined in Fig. 4 (a) and 4 (d). On the other hand do minima of the NSME coincide with maxima of the parameter A. The former are regions with very low SNR, the latter regions with high SNR.
6
Figure 3: Model (orange) v. measurement (blue). X-axis is the sensor position in mm. Y-axis is theabsolute amplitude. Signal frequencies are (a) 404 Hz, (b) 2896 Hz, (c) 6255 Hz and (d) 7919 Hz.
The examination of the optimized parameter values for λ shows a linear dependency between signal frequency f and the inverse of the parameter λ ( f )
1λ=
fc
(6)
with a constant c. This can be interpreted as a relation between frequency and wavelength of a 1-D wave with propagation speed c. Assuming a linear relation a wave-velocity of 2006,5 m/s was calculated. This value is in the range of known transversal and Rayleigh wave velocities for concrete which (12) finds to be in the range of 1780 m/s to 2320 m/s for concrete. Rayleigh wave velocity is only rarely found to be above 2000 m/s making c being the velocity of a transversal wave likely. Inserting Eq. (6) intoEq. (4) allows eliminating one of the parameters and yielded a good performance of the model around SNR maxima for frequencies above 1750 Hz. The error in the frequency-response compared to measurements at SNR peaks varied between 0.48 dB at 2261 Hz up to 3.18 dB at 8796 Hz and a median error of 1.02 dB. In Fig 4 (c) it can be seen, that the proposed model also is a good approximation for the girder’s frequency response at a fixed position, which further substantiates the model as the optimization was done for fixed frequencies and variable position. Note that the error near amplitude peaks approaches zero.
The performance of the model proposed in Eq. (4) depends on the frequency region considered. For regions around peak amplitudes according to Fig. 4 (a) a per sample NMSE of distinctly below 0.01 or even 0.001 is observed. Below an amplitude of about8⋅10−4 , which is the amplitude of the example in Fig. 3 (d), the SNR becomes too
low and the measurement is unreliable, which is assumed to stem from the utilized software ARTA. Taking these limiting factors into account the proposed model is able to perform very well given significant signal strength.
7
Figure 4: (a, b) Optimized parameter values of A and 1λ
over frequency. (c) Comparison of
measured frequency response and predicted frequency response according to Eq. (4) at 800 mm.(d) Normalized mean square error of the model compared to measurements.

5. ConclusionIn this paper it was shown that the sound channel’s absolute frequency response alongside a concrete girder can be modelled using measurements only. The proposed model consists of a dampened absolute sine function with four parameters. Additionallyit was shown that one of the parameters can be determined if the wave-velocity c is known without losing a great degree of accuracy for frequencies above 1750 Hz. Further research is needed to investigate how the proposed model depends on the geometry of the girder. The frequency response of the mounting types used has to be determined to progress further. The sensor’s coupling needs to be modelled to calculate the, for application and research essential, material function Hm .
6. References1. C. von der Haar and S. Marx, “Untersuchungen zur Steifigkeit und
Ultraschallgeschwindigkeit dynamisch beanspruchter Betonproben”, Beton- und Stahlbetonbau Vol. 111, Issue 3, p. 141-148, 2016
2. T. Krause, S. Preihs and J. Ostermann, “Acoustic Emission Damage Detection for Wind Turbine Rotor Blades Using Airborne Sound”, Proceedings of 10th International Workshop on Structural Health Monitoring (IWSHM), Sep. 2015
3. I. S. Colombo, I.G. Main and M. C. Forde, “Assessing Damage of Reinforced Concrete Beam Using b -value Analysis of Acoustic Emission Signals”, Journal of Materials in Civil Engineering, June 2003
4. C. U. Grosse and M. Ohtsu, “Acoustic Emission Testing”, Springer 20085. A. Behnia, H. Kian Chai and T. Shiotani, “Advanced structural health monitoring of
concrete structures with the aid of acoustic emission”, Construction and Building Materials, Volume 65, pp. 282-302, 2014
6. F. R. Breckenridge, C. E. Tschiegg and M. Greenspan, “Acoustic emission: some applications of Lamb’s problems”, The Journal of the Acoustical Society of America,Vol. 57, Issue 3, 1975
7. H. N. G. Wadley, C. R. Scruby and G. Shrimpton, “Quantitative Acoustic Emission Source Characterisation During Low Temperature Cleavage And Intergranular Fracture“, Acta Metallurgica, Vol. 29, pp. 399-414, 1981
8. J.E. Michaels, T. E. Michaels and W. Sachse, “Applications of Deconvolution to Acoustic Emission Signal Analysis”, Materials Evaluation, Vol. 39, No. 11, pp. 1032-1036, 1981
9. E. Landis, “Micro-macro fracture relationships and acoustic emissions in concrete”, Construction and Building Materials 13, pp. 65-72, 1999
10. K. Ono, “Current understanding of mechanisms of acoustic emission”, The Journal of Strain Analysis for Engineering Design, Vol. 40, Issue 1, pp. 1 – 15, 2005
11. R. Masaki, M. Takemoto and K. Ono, “A Fast Source For Quantitative Acoustic Emission and Its Application”, AIP Conference Proceedings 497, pp. 3-8 (1999)
12. B. J. Lee, S.-H. Kee, T. Oh and Y.-Y. Kim, “The Measurement of P-, S-, and R-Wave Velocities to Evaluate the Condition of Reinforced and Prestressed Concrete Slabs”, Advances in Materials Science and Engineering, Vol. 2017, pp. 1–13
8