MaXLinker: proteome-wide cross-link identifications with...
28
1 MaXLinker: proteome-wide cross-link identifications with high specificity and sensitivity Kumar Yugandhar 1,2,5 , Ting-Yi Wang 1,2,5 , Alden King-Yung Leung 1,2 , Michael Charles Lanz 2,3 , Ievgen Motorykin 4 , Jin Liang 1,2 , Elnur Elyar Shayhidin 1,2 , Marcus Bustamante Smolka 2,3 , Sheng Zhang 4 , Haiyuan Yu 1,2,* 1 Department of Biological Statistics and Computational Biology, Cornell University, Ithaca, New York,14853, USA 2 Weill Institute for Cell and Molecular Biology, Cornell University, Ithaca, New York, 14853, USA 3 Department of Molecular Biology and Genetics, Cornell University, Ithaca, New York 14853, USA 4 Mass Spectrometry and Proteomics Facility, Institute of Biotechnology, Cornell University, Ithaca, New York,14853, USA 5 The authors wish it to be known that, in their opinion, the first two authors should be regarded as joint First Authors. * To whom correspondence should be addressed. Tel: 607-255-0259; Fax: 607-255-5961; Email:[email protected] . CC-BY-NC-ND 4.0 International license It is made available under a (which was not peer-reviewed) is the author/funder, who has granted bioRxiv a license to display the preprint in perpetuity. The copyright holder for this preprint . http://dx.doi.org/10.1101/526897 doi: bioRxiv preprint first posted online Jan. 23, 2019;
Transcript of MaXLinker: proteome-wide cross-link identifications with...

1
MaXLinker: proteome-wide cross-link identifications with high specificity
and sensitivity
Kumar Yugandhar1,2,5, Ting-Yi Wang1,2,5, Alden King-Yung Leung1,2, Michael Charles Lanz2,3,
Ievgen Motorykin4, Jin Liang1,2, Elnur Elyar Shayhidin1,2, Marcus Bustamante Smolka2,3, Sheng
Zhang4, Haiyuan Yu1,2,*
1Department of Biological Statistics and Computational Biology, Cornell University,
Ithaca, New York,14853, USA
2Weill Institute for Cell and Molecular Biology, Cornell University, Ithaca, New York, 14853,
USA
3Department of Molecular Biology and Genetics, Cornell University, Ithaca, New York 14853,
USA
4Mass Spectrometry and Proteomics Facility, Institute of Biotechnology, Cornell University,
Ithaca, New York,14853, USA
5The authors wish it to be known that, in their opinion, the first two authors should be regarded
as joint First Authors.
*To whom correspondence should be addressed. Tel: 607-255-0259; Fax: 607-255-5961;
Email:[email protected]
.CC-BY-NC-ND 4.0 International licenseIt is made available under a (which was not peer-reviewed) is the author/funder, who has granted bioRxiv a license to display the preprint in perpetuity.
The copyright holder for this preprint. http://dx.doi.org/10.1101/526897doi: bioRxiv preprint first posted online Jan. 23, 2019;

2
ABSTRACT
Protein-protein interactions play a vital role in nearly all cellular functions. Hence, understanding
their interaction patterns and three-dimensional structural conformations can provide crucial
insights about various biological processes and underlying molecular mechanisms for many
disease phenotypes. Cross-linking mass spectrometry has the unique capability to detect protein-
protein interactions at a large scale along with spatial constraints between interaction partners.
However, the current cross-link search algorithms follow an “MS2-centric” approach and, as a
result, suffer from a high rate of mis-identified cross-links (~15%). We address this urgent
problem, by designing a novel “MS3-centric” approach for cross-link identification and
implemented it as a search engine called MaXLinker. MaXLinker significantly outperforms the
current state of the art search engine with up to 18-fold lower false positive rate. Additionally,
MaXLinker results in up to 31% more cross-links, demonstrating its superior sensitivity and
specificity. Moreover, we performed proteome-wide cross-linking mass spectrometry using K562
cells. Employing MaXLinker, we unveiled the most comprehensive set of 9,319 unique cross-links
at 1% false discovery rate, comprising 8,051 intraprotein and 1,268 interprotein cross-links.
Finally, we experimentally validated the quality of a large number of novel interactions identified
in our study, providing a conclusive evidence for MaXLinker’s robust performance.
.CC-BY-NC-ND 4.0 International licenseIt is made available under a (which was not peer-reviewed) is the author/funder, who has granted bioRxiv a license to display the preprint in perpetuity.
The copyright holder for this preprint. http://dx.doi.org/10.1101/526897doi: bioRxiv preprint first posted online Jan. 23, 2019;

3
INTRODUCTION
In the post-genomic era, one of the main goals of systems biology is to determine the functions of
all the proteins of various organisms. In the cell, most proteins function through interacting with
other proteins. Therefore, generating interactome network models with high quality and coverage
is a necessary step in the process of developing predictive models for protein functions at the scale
of the whole cell1. Furthermore, structural information for protein-protein interactions can serve
as a crucial prerequisite for understanding the mechanism of protein function2.
Rapid advancements in the respective fields of cross-linking and mass spectrometry lead to
the development of a powerful technique known as cross-linking mass spectrometry (XL-MS)3, 4.
XL-MS has been demonstrated to be an efficient technology to capture distance constraints,
thereby providing crucial information to decipher the interaction partners and dynamics of protein-
protein interactions5. Development of efficient MS-cleavable chemical cross-linkers such as
disuccinimidyl sulfoxide (DSSO)6 expanded the applications of XL-MS ranging from studying
individual functional complexes7 to discovering proteome-wide interactions by drastically
minimizing the database search space. Recently, Liu et al8 demonstrated the high-throughput
capability of XL-MS approach with the first-ever proteome-wide XL-MS study on HeLa cell
lysate. They utilized CID-ETD toggle approach and identified a set of 1822 cross-links at 1%FDR
employing XlinkX, a state-of-the-art search engine for XL-MS. The traditional ‘target-decoy’
approach for estimating false discovery rate (FDR) in peptide spectrum matches (PSMs) was
adapted to estimate quality of the identified cross-links (each individual cross-link identification
is also known as a Cross-link Spectrum Match (CSM)). Since then, rapid advancements in terms
of technical capability have been reported by utilizing and combining multiple levels and types of
fragmentation methods.
Most recently, Liu et al9 compared multiple fragmentation schemes, including CID-MS2, CID-
MS2-ETD-MS2, CID-MS2-MS3 and CID-MS2-MS3-ETD-MS2 (a combination of CID-MS2-
ETD-MS2 and CID-MS2-MS3 approaches) utilizing an updated version of XlinkX (XlinkX v2.0).
Apart from CID-MS2, all other approaches combine spectra from multiple MS levels (MS2 and
MS3) or from different types of energy fragmentations (CID and ETD) or both. Their analysis
revealed that, the ensemble approach (i.e., CID-MS2-MS3-ETD-MS2) resulted in the highest
number of cross-links, followed by CID-MS2-MS3, CID-MS2-ETD-MS2 and CID-MS2.
Moreover, utilizing sequence information only from MS3 spectra (a subset of CID-MS2-MS3) for
.CC-BY-NC-ND 4.0 International licenseIt is made available under a (which was not peer-reviewed) is the author/funder, who has granted bioRxiv a license to display the preprint in perpetuity.
The copyright holder for this preprint. http://dx.doi.org/10.1101/526897doi: bioRxiv preprint first posted online Jan. 23, 2019;

4
cross-link identification (‘MS3-Only’) resulted in the least number of crosslinks among all the
approaches. Hence the study concluded CID-MS2-MS3-ETD-MS2 and MS3-Only approaches to
be the most and least informative approaches, respectively. However, the study did not assess
quality of different approaches at the given FDR cut-off using a rigorous comparative analysis.
In this study, we perform systematic and rigorous quality assessment across different XL-
MS acquisition strategies, inspired by approaches widely-used in machine learning1, 10. Based on
these analyses, we noted that XlinkX results in high number of mis-identifications. Therefore, we
developed and validated a novel search algorithm named MaXLinker, which is based on an
innovative “MS3-centric” approach, designed to efficiently eliminate incorrect cross-link
candidates. At a 1% FDR, MaXLinker has an 18-fold lower rate of mis-identifications than
XlinkX. With MaXLinker in hand, we performed a large-scale proteome-wide XL-MS study on
K562 cell lysate, yielding the largest XL-MS data set to date. We further validated the cross-links
using available three-dimensional structures and through a systematic experimental validation of
novel interactions identified in our study.
RESULTS
Current MS2-centric cross-link search algorithms are limited in their sensitivity and
specificity
When compared to traditional PSM searches, the identification of CSMs from a proteome-wide
study is markedly more complex. This fact motivated us to thoroughly examine the MS2-centric
algorithms9, 11 for processing proteome-wide XL-MS data sets. XlinkX is currently the most
widely-used MS2-centric software (it is available as a node within Proteome Discoverer9). Thus,
we performed a systematic quality comparison of cross-links generated by XlinkX using data from
multiple XL-MS acquisition strategies described in Liu et al9. First, we obtained corresponding
raw files for the three fragmentation schemes CID-MS2-ETD-MS2, CID-MS2-MS3 and CID-
MS2-MS3-ETD-MS2 (through email request to Dr. Fan Liu). Then we performed cross-link
search using XlinkX software (implemented in Proteome Discoverer 2.2) at 1% FDR with a
concatenated database containing sequences from E. coli proteome (true search space) and S.
cerevisiae (false search space). It is important to note that XlinkX by default, generates a reversed
version of the input database and uses it as a decoy database to estimate FDR. As a next step, we
compared the three fragmentation approaches in terms of the number of incorrect unique CSMs
.CC-BY-NC-ND 4.0 International licenseIt is made available under a (which was not peer-reviewed) is the author/funder, who has granted bioRxiv a license to display the preprint in perpetuity.
The copyright holder for this preprint. http://dx.doi.org/10.1101/526897doi: bioRxiv preprint first posted online Jan. 23, 2019;

5
(CSMs with at least one peptide from the S. cerevisiae search space, i.e., mis-identifications). The
aim of this search is to re-assess the quality of cross-links at 1% FDR, with expected fraction of
incorrect CSMs involving unambiguous peptides from S. cerevisiae to be less than 1%.
Surprisingly, the fraction of incorrect CSMs range from 14.8% to as high as 26.9% across the three
acquisition strategies (Fig. 1a). Upon closer examination, we observed that among the three
approaches, CID-MS2-MS3 showed significantly lower proportion of incorrect CSMs (14.8%)
followed by CID-MS2-ETD-MS2 (25.1%), and CID-MS2-MS3-ETD-MS2 (26.9%) approaches.
This analysis clearly indicates that the methodology implemented in XlinkX does not adequately
evaluate the quality of the identified CSMs. Therefore, utilizing only the number of identifications
for comparative evaluations9 might not yield accurate conclusions about the capability of different
acquisition strategies. As the FDR filtering is typically performed at the redundant CSM level by
the conventional cross-link search algorithms (i.e., before the processing step that results in a
unique list of CSMs), we repeated the analysis at redundant CSM level and observed results
consistent with what was found at the unique CSM level (Supplementary Figure 1).
The most reliable sequence information for cross-linked peptides comes from the MS3-level
We also evaluated quality of identifications from CID-MS2-MS3 approach, with sequence
information obtained exclusively from MS3 spectra (‘MS3-only’) (Fig.1a). Strikingly, we
observed a drastically lower fraction of incorrect CSMs for ‘MS3-Only’ (3.3%), which is a subset
of CID-MS2-MS3 (with 14.8% mis-identifications). This result clearly demonstrates that MS3,
the most advanced MS level, provides higher quality sequence information in comparison to MS2-
level. To improve the quality of XlinkX-identified CSMs, XlinkX allows the use of ‘ XlinkX
score’ to further filter the CSMs. As a next step, we filtered the CSMs using five different ‘
XlinkX score’ cutoffs and re-assessed their quality across different approaches. We observed that,
overall, increasing the stringency based on ‘ XlinkX score’ significantly reduced the number of
incorrect CSMs for all three acquisition approaches (Supplementary Figure 2). However, even
after filtering by ‘ XlinkX score’, the trend across the different methods was similar to what was
observed before the filtering (Fig.1a and Supplementary Figure 2), with data from the MS3-
level yielding the highest fraction of reliable CSMs.
.CC-BY-NC-ND 4.0 International licenseIt is made available under a (which was not peer-reviewed) is the author/funder, who has granted bioRxiv a license to display the preprint in perpetuity.
The copyright holder for this preprint. http://dx.doi.org/10.1101/526897doi: bioRxiv preprint first posted online Jan. 23, 2019;
6
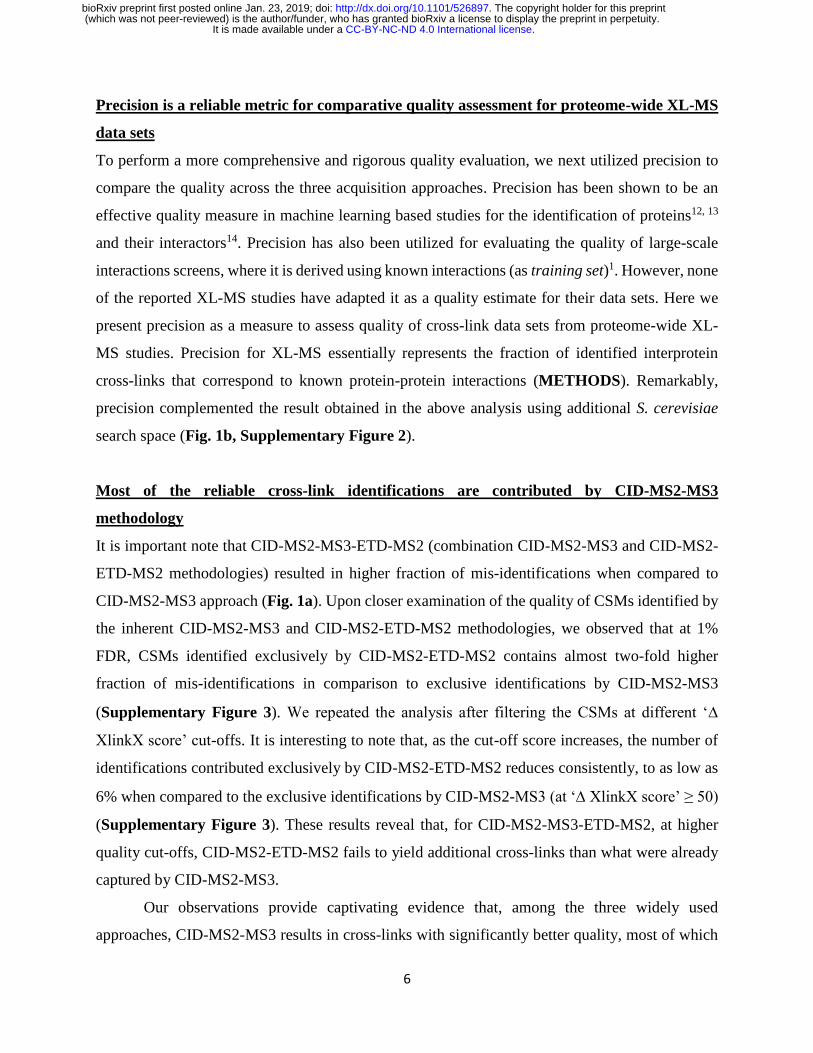
Precision is a reliable metric for comparative quality assessment for proteome-wide XL-MS
data sets
To perform a more comprehensive and rigorous quality evaluation, we next utilized precision to
compare the quality across the three acquisition approaches. Precision has been shown to be an
effective quality measure in machine learning based studies for the identification of proteins12, 13
and their interactors14. Precision has also been utilized for evaluating the quality of large-scale
interactions screens, where it is derived using known interactions (as training set)1. However, none
of the reported XL-MS studies have adapted it as a quality estimate for their data sets. Here we
present precision as a measure to assess quality of cross-link data sets from proteome-wide XL-
MS studies. Precision for XL-MS essentially represents the fraction of identified interprotein
cross-links that correspond to known protein-protein interactions (METHODS). Remarkably,
precision complemented the result obtained in the above analysis using additional S. cerevisiae
search space (Fig. 1b, Supplementary Figure 2).
Most of the reliable cross-link identifications are contributed by CID-MS2-MS3
methodology
It is important note that CID-MS2-MS3-ETD-MS2 (combination CID-MS2-MS3 and CID-MS2-
ETD-MS2 methodologies) resulted in higher fraction of mis-identifications when compared to
CID-MS2-MS3 approach (Fig. 1a). Upon closer examination of the quality of CSMs identified by
the inherent CID-MS2-MS3 and CID-MS2-ETD-MS2 methodologies, we observed that at 1%
FDR, CSMs identified exclusively by CID-MS2-ETD-MS2 contains almost two-fold higher
fraction of mis-identifications in comparison to exclusive identifications by CID-MS2-MS3
(Supplementary Figure 3). We repeated the analysis after filtering the CSMs at different ‘
XlinkX score’ cut-offs. It is interesting to note that, as the cut-off score increases, the number of
identifications contributed exclusively by CID-MS2-ETD-MS2 reduces consistently, to as low as
6% when compared to the exclusive identifications by CID-MS2-MS3 (at ‘ XlinkX score’ ≥ 50)
(Supplementary Figure 3). These results reveal that, for CID-MS2-MS3-ETD-MS2, at higher
quality cut-offs, CID-MS2-ETD-MS2 fails to yield additional cross-links than what were already
captured by CID-MS2-MS3.
Our observations provide captivating evidence that, among the three widely used
approaches, CID-MS2-MS3 results in cross-links with significantly better quality, most of which
.CC-BY-NC-ND 4.0 International licenseIt is made available under a (which was not peer-reviewed) is the author/funder, who has granted bioRxiv a license to display the preprint in perpetuity.
The copyright holder for this preprint. http://dx.doi.org/10.1101/526897doi: bioRxiv preprint first posted online Jan. 23, 2019;

7
rely on MS3 spectra for sequence information. However, the high number of incorrect
identifications for CID-MS2-MS3 approach at 1% FDR by XlinkX (the current state-of-the-art
search engine) strongly demonstrates the need for an improved search algorithm that can
efficiently eliminate false positives while maintaining a minimum number of false negatives.
MaXLinker: a novel “MS3-centric” approach for cross-link identification
To address the limitations faced by the conventional “MS2-centric” algorithms such as XlinkX for
reliable cross-link identifications from MS2-MS3 fragmentation, we designed a novel “MS3-
centric” approach (Fig. 2). The XlinkX starts the search at MS2-level and attempts to identify
CSMs exclusively from the MS2 spectrum, for cases with no available sequence information from
MS3-level. However, our analyses revealed that such “MS2-centric” approach could lead up to
14.8% false identifications (Fig. 1a). On the contrary, our approach starts the search from MS3-
level, which is confirmed through our analyses to be most informative level for the sequences of
cross-linked peptides (Fig. 1). Additionally, our approach fully utilizes MS2-level to rescue
candidate CSMs (‘MS2 Rescue node’) if one of the two cross-linked peptides could be reliably
identified from the MS3 spectra (Fig.2 Node C). Finally, we require all cross-links to match the
precursor mass in MS1 (Fig. 2 Node D ) and perform correction for mis-assigned monoisotopic
MS1 precursor masses (Fig.2 Node B). This novel design, where we start with MS3-level
information but fully integrate information from both MS2 and MS1 levels, fundamentally enables
MaXLinker’s rigorous cross-link identification and validation work-flow.
The general experimental methodology for MS2-MS3 strategy involves precursor selection
at multiple stages of mass spectrometry. First, ions above certain threshold charge state (typically
≥ +3 or +4) will be selected for fragmentation at MS2 stage to yield signature ions with predefined
mass difference (m = 31.97 for DSSO). Further, an iterative search known as ‘targeted inclusion’
is performed by mass spectrometer on-the-fly to select ion pairs with signature m, following
certain prioritization criteria to perform fragmentation at MS3-level to yield two MS3 spectra per
peptide in an ideal scenario. MaXLinker accepts ‘.mgf’ files consisting different levels of MS
spectra exported using Proteome discover (PD), along with PSM annotations from PD as input
(METHODS). MaXLinker initiates the search from the MS3-level by performing the mandatory
precursor-based mass validation (Fig. 2 Node ‘A’). Initiating the search from MS3, the most
informative level in terms of the peptide sequence information, provides a key advantage to
.CC-BY-NC-ND 4.0 International licenseIt is made available under a (which was not peer-reviewed) is the author/funder, who has granted bioRxiv a license to display the preprint in perpetuity.
The copyright holder for this preprint. http://dx.doi.org/10.1101/526897doi: bioRxiv preprint first posted online Jan. 23, 2019;

8
MaXLinker in eliminating potential false positives. If a set of MS3 spectra representing a potential
cross-link pass the precursor-based mass validation step (Fig. 2 Node ‘A’) (Case 1 in Fig. 2), it is
verified through multiple validation filters (Fig. 2 Node ‘D’). It is important to note that typically
larger size of crosslinked peptides can often result in the mis-assignment of the monoisotopic MS1
precursor mass15, thus for cases that fail to pass through the precursor mass-based filter (Fig. 2
Node ‘A’), MaXLinker inspects the corresponding MS1 spectrum to verify mis-assignment of the
monoisotopic MS1 precursor mass (Fig. 2 Node “B”). Such cases are systematically examined and
passed on to the next filter if they satisfy the mass validation step with the adjusted precursor mass.
The remaining failed candidates are sent to the ‘MS2 Rescue Module (Fig. 2 Node ‘C’).
MS2 Rescue Module is another important and unique feature of MaXLinker. As mentioned
earlier, this module is triggered if the candidate spectra failed to pass the precursor-based mass
validation step (Fig. 2 Node ‘A’) and could not be validated through precursor mass re-assignment.
We found that failure to pass these filters often coincided with poor or “uninformative” MS3
spectral data for one of the cross-linked peptides (case 2 in Fig. 2). In this case, considering a
scenario where the mass spectrometer picked an incorrect m pair from the MS2-level having the
signature just by chance, MaXLinker attempts to obtain sequence information for the peptide by
utilizing fragment ions from the corresponding MS2 spectrum (Fig. 2 Node C). First, precursor
masses for the peptide with poor MS3 spectra are derived using MS2 precursor mass and MS3
precursor masses of the “informative” MS3 spectra (with account for the linker long and short arm
modifications) (Supplementary Figure 5). An additional validation search is performed on the
ions of the corresponding MS2 spectrum to confirm presence of the derived MS3 precursor masses.
Subsequently, a PSM search is performed on the deconvoluted MS2 spectrum with the derived
masses (both long and short) as the precursor mass. If the search returns at least one reliable PSM,
the cross-link candidate (along with sequence information for the ‘rescued’ peptide) is directed to
the general validation pipeline for further evaluation (Fig. 2 Node D). Additionally, the MS2
Rescue module also accounts for cases where the mass spectrometer selects two pairs with
signature m for MS3, however both pairs represent different charge states of one of the two cross-
linked peptides (Supplementary Figure 6). Upon completion of the search, a unique list of cross-
links is obtained by merging the redundant CSM entries, and a confidence score is assigned to
each identification (equation 2 in METHODS). Finally, a target-decoy strategy is employed to
establish the FDR.
.CC-BY-NC-ND 4.0 International licenseIt is made available under a (which was not peer-reviewed) is the author/funder, who has granted bioRxiv a license to display the preprint in perpetuity.
The copyright holder for this preprint. http://dx.doi.org/10.1101/526897doi: bioRxiv preprint first posted online Jan. 23, 2019;

9
MaXLinker significantly outperforms XlinkX in both specificity and sensitivity
We evaluated the performance of MaXLinker utilizing MS2-MS3 XL-MS raw files for six E. coli
fractions from Liu et al9 . First, we utilized the strategy employed in Fig. 1a and performed the
search using MaXLinker at 1% FDR. We noted that the fraction of mis-identifications was less
than 1% (Supplementary Table 1), and for majority of the identifications (~82%), the peptide
sequence information was derived from MS3 spectra (Supplementary Table 2), which agrees
with MaXLinker’s fundamental algorithmic design. Next, we compared the results with CSMs
identified using XlinkX at 1% FDR on the same set of raw files (Fig. 3a). Our analysis showed
that MaXLinker evidently outperforms XlinkX, indicated by the extremely significant difference
(18-fold lower) in the fraction of mis-identifications (i.e. non-E. coli CSMs). We then examined
the overlap between identifications from the two search engines (Fig. 3b). It clearly reveals that
the overlapping fraction from XlinkX has only 0.6% mis-identifications, whereas the non-
overlapping CSMs which were identified exclusively by XlinkX contained a large fraction (33.1%)
of mis-identifications. Further, using precision as a complementary quality metric, we observed
similar results (Fig. 3d, 3e). When we repeated the quality analyses by filtering the identifications
from XlinkX at different ‘ XlinkX score’ cutoffs, we observed that MaXLinker consistently finds
13-31% more cross-links than XlinkX at comparable quality (Supplementary Figure 4).
Importantly, the CSMs identified exclusively by MaXLinker are of three-fold higher quality than
the exclusive identifications by XlinkX, even at the highly stringent cutoff ‘ XlinkX score’ ≥ 50
(Fig. 3c, 3f). All these results demonstrate that MaXLinker outperforms XlinkX for CSM
identifications in both specificity and sensitivity.
Next, we cross-linked commercially available Bovine Glutamate Dehydrogenase 1
(GLUD1) using DSSO and performed a CID-MS2-HCD-MS3 experiment in our own lab
(METHODS). We employed MaXLinker to perform two individual CSM searches, search1:
using Bovine GLUD1 sequence as the search database yielding 43 unique CSMs, and search2:
with a concatenated database with Bovine GLUD1 and a full proteome of Saccharomyces
cerevisiae, yielding 36 unique CSMs. We then examined the overlap between CSMs from search1
and search2 to inspect MaXLinker’s ability to find true CSMs from single protein in a plethora of
false search space. Strikingly, we observed that 33 of 36 (92%) CSMs from search2 were
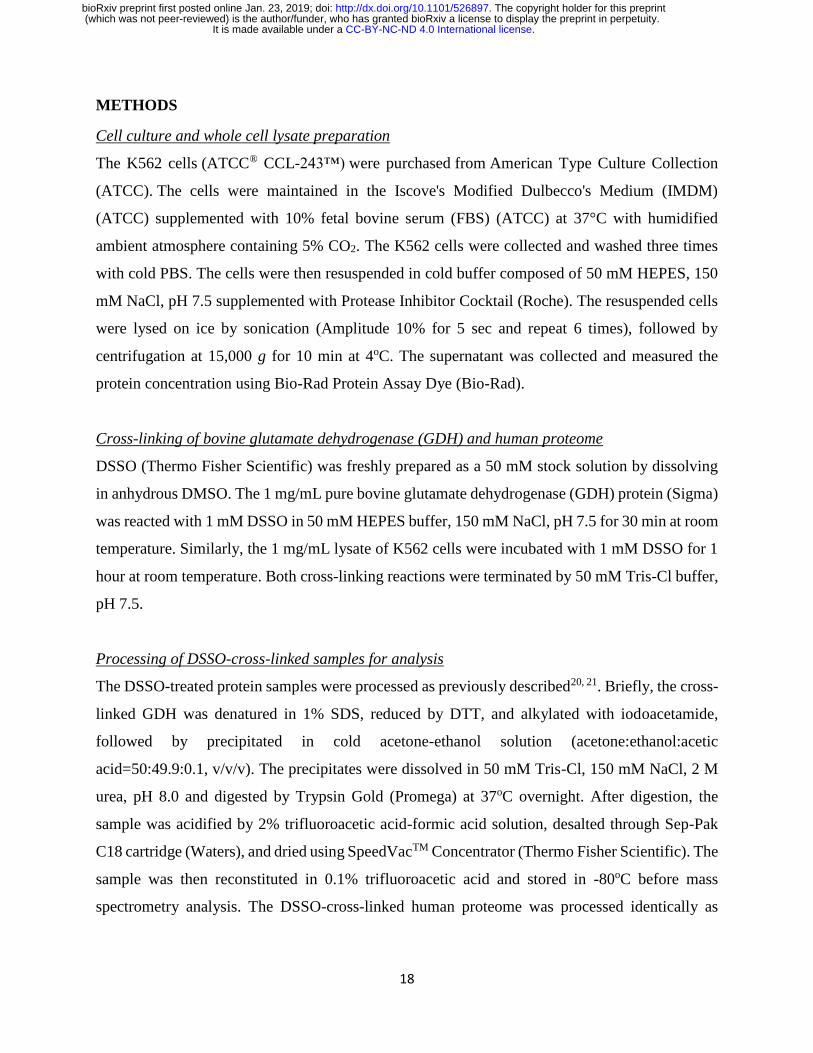
overlapping with the ones from search1 (Fig. 4a). Out of the remaining 3 CSMs, 2 were mis-
identifications, having one of the peptides in the pair from S. cerevisiae proteome (false search
.CC-BY-NC-ND 4.0 International licenseIt is made available under a (which was not peer-reviewed) is the author/funder, who has granted bioRxiv a license to display the preprint in perpetuity.
The copyright holder for this preprint. http://dx.doi.org/10.1101/526897doi: bioRxiv preprint first posted online Jan. 23, 2019;

10
space). Of note, 10 CSMs were identified exclusively in search1. Upon close examination, we
noted that MaXLinker rejected those 10 CSM candidates due to either (i) its stringent validation
filters or (ii) lower confidence in their PSM assignments, attributable to the drastic increase in the
number of competing candidate peptides for individual spectra. On the other hand, when we
performed similar analysis using XlinkX, search1 and search2 yielded 35 and 140 unique CSMs,
respectively. Out of the 140 CSMs from search2, 30 were overlapping with search1 and the
remaining 110 had at least one of the peptides from S. cerevisiae proteome (mis-identifications)
(Fig. 4b). We examined the overlap between search2 identifications from MaXLinker and XlinkX
and observed that most of the mis-identifications from XlinkX (109 of 110) were not found by
MaXLinker (Fig. 4c). Further, we filtered CSMs from XlinkX using ‘ XlinkX score’ ≥ 50 and re-
inspected the overlap with MaXLinker’s identifications. This filtering step resulted in drastic
elimination of false positives (Fig. 4d). However, all the non-overlapping CSMs from XlinkX
were observed to be mis-identifications. On the other hand, MaXLinker identified 12 CSMs
(containing 11 true CSMs) that were missed by XlinkX. For further validation of MaXLinker’s
identifications, we mapped CSMs from search1 on to a three-dimensional structure (Fig. 4e) of
Bovine GLUD1. We observed that 15 of the 18 mapped CSMs were within the theoretical distance
constraint (30Å), and the remaining three CSMs were within 38Å, validating reliable quality of
our identifications. This analysis serves as a revealing case study for MaXLinker’s unique ability
to identify cross-links with high sensitivity and specificity.
Our proteome-wide K562 XL-MS study unveils the largest single set of cross-links
Having established the MaXLinker software and optimized the experimental pipeline in our lab,
we carried out a comprehensive proteome-wide XL-MS study on human K562 cell lysates, using
the CID-MS2-HCD-MS3 strategy. Previous proteome-wide XL-MS studies implemented the
strong cation exchange chromatography (SCX) for pre-fractionation of crosslinked proteome
samples. Here, to capture a more comprehensive set of cross-links, we employed both SCX and
hydrophilic interaction chromatography (HILIC) for our proteome-wide XL-MS study. We then
employed MaXLinker for cross-link identification. Our study yielded 9,319 unique cross-links
(8,051 intraprotein and 1,268 interprotein with 74.2% precision) at 1% FDR (Supplementary
Table 3), ~ 3-fold more number of cross-links than that of the latest human proteome XL-MS
.CC-BY-NC-ND 4.0 International licenseIt is made available under a (which was not peer-reviewed) is the author/funder, who has granted bioRxiv a license to display the preprint in perpetuity.
The copyright holder for this preprint. http://dx.doi.org/10.1101/526897doi: bioRxiv preprint first posted online Jan. 23, 2019;

11
study9. To validate the identified cross-links utilizing available three-dimensional structures, we
mapped cross-links from 26S proteasome, which is a large biological complex, on to its three-
dimensional structure (Fig. 5a, 5b). Out of the 100 cross-links mapped to the structure, 90 were
within the theoretical constraint i.e., 30Å. Additionally, we could validate one cross-link that was
exceeding 30Å, utilizing a different structure (Fig. 5c), suggesting potential conformational
changes in the corresponding subunits. Six out of the remaining nine cross-links were within 35Å,
and all the others were within 50Å, demonstrating high quality of our identifications. Additionally,
interprotein cross-links identified at 1% FDR in our study represent 160 unambiguous novel
interactions (Fig. 5d and Supplementary Table 4).
Systematic experimental validation of novel interactions from our proteome-wide XL-MS
study
Furthermore, in order to validate those novel interactions using an orthogonal experimental
methodology, a representative subset of them (49 randomly-chosen interactions) was tested
individually using a Protein Complementation Assay (PCA). The fraction of PCA-positive
interactions among the novel interactions identified in our XL-MS study is statistically
indistinguishable (P = 0.325) from that of the positive reference set containing well-established
interactions in the literature, but significantly higher (P = 1.8 x 10⁻⁵) than that of a negative
reference set containing random protein pairs (Fig. 5e)16. This large set of experimental results
demonstrate the high quality of the novel cross-links and corresponding interactions identified in
our proteome-wide XL-MS study, and further confirm the reliability and accuracy of MaXLinker.
DISCUSSION
Machine learning approaches have been an integral part of conventional mass spectrometry-based
methods13. Here, we extended their applications for comparative quality assessment among
multiple proteome-wide XL-MS data sets. In addition to using a false search space from an un-
related organism, we demonstrated precision as an effective additional metric for comparative
quality assessments. It should be noted that, because a large fraction of true protein interactions is
yet to be discovered, precision should not be used as an absolute measure for data quality.
Nevertheless, it is an orthogonal and reliable quality metric for comparative assessments of
proteome-wide XL-MS studies.
.CC-BY-NC-ND 4.0 International licenseIt is made available under a (which was not peer-reviewed) is the author/funder, who has granted bioRxiv a license to display the preprint in perpetuity.
The copyright holder for this preprint. http://dx.doi.org/10.1101/526897doi: bioRxiv preprint first posted online Jan. 23, 2019;

12
Our systematic analyses revealed for the first time, the limitations of current quality
assessment strategies and the drawbacks of the conventional “MS2-centric” cross-link
identification approach resulting in high false positive rates (~15%). Our analyses also revealed
that for MS2-MS3 strategy, the MS3-level provides sequence information with significantly higher
quality when compared to that of the MS2-level, and identification of cross-links exclusively from
MS2-level could result in alarmingly high false positive rate. To address these issues, we designed
and implemented a novel “MS3-centric” approach (MaXLinker) (Fig. 2). The conventional “MS2-
centric” methods such as XlinkX start the search from the MS2-level and attempts cross-link
identifications without any information from MS3-level, resulting in high fraction of false
positives. On the contrary, MaXLinker starts the search from MS3-level and discards any cross-
link candidate without reliable sequence information from MS3-level for at least one of the two
cross-linked peptides. Furthermore, the “MS2-Rescue” module, along with other novel features
such as the correction for mis-assigned MS1 monoisotopic mass (Fig. 2), play a crucial role in
MaXLinker’s superior sensitivity over the conventional approach, without compromising on the
specificity. Overall, MaXLinker significantly outperformed XlinkX with 18-fold lower false
positive rate and up to 31% higher number of identifications.
Having MaXLinker in hand, we reported the largest single data set from proteome-wide
XL-MS consisting 9,319 cross-links at 1% FDR, representing 160 unambiguous novel
interactions. Moreover, to our knowledge, this is the first study that performed a large-scale
orthogonal experimental validation of novel interactions identified from a proteome-wide XL-MS
study.
With the constant technical advancements in XL-MS methodologies, reliable search
algorithms such as MaXLinker will play a highly significant role in the success of future cross-
linking studies. Moreover, the expanding size of cross-link datasets would allow researchers to
investigate interaction networks in many disease phenotypes more thoroughly, thereby enabling
us to better understand the underlying molecular mechanisms.
.CC-BY-NC-ND 4.0 International licenseIt is made available under a (which was not peer-reviewed) is the author/funder, who has granted bioRxiv a license to display the preprint in perpetuity.
The copyright holder for this preprint. http://dx.doi.org/10.1101/526897doi: bioRxiv preprint first posted online Jan. 23, 2019;
13
Figure Legends
Figure 1. Comparative quality assessment between various acquisition methods for Cross-linking
Mass-Spectrometry on six E. coli fractions from Liu et al9 (a) Comparison between different
acquisition methods based on mis-identifications. (The search was performed using a database
consisting amino acid sequences of E. coli and S. cerevisiae proteomes. Any CSM with either of
the peptides exclusively from S. cerevisiae proteome was considered as a mis-identification). (b)
Quality comparison across multiple acquisition methods using precision. A separate search was
performed for panel ‘b’ using only the E. coli database in order to avoid underestimation of
precision. (Significance was determined by a two-sided Z-test; The error bars represent the
estimated standard error of mean)
Figure 2. Overview of MaXLinker’s strategy for identification of cross-links from XL-MS
Figure 3. Comparison of MaXLinker’s performance on proteome-wide XL-MS with that of
XlinkX. (a) Comparison of the fraction of mis-identifications from MaXLinker and XlinkX at 1%
FDR using six E. coli MS2-MS3 XL-MS fractions from Liu et al9. (b) Overlap between CSMs
from MaXLinker and XlinkX at 1% FDR showing the respective fraction of mis-identifications in
the parentheses. (c) Overlap between CSMs at 1% FDR from MaXLinker and additional filtering
on 1% FDR with ‘XlinkX score’ ≥ 50 for XlinkX, showing the respective fraction of mis-
identifications in the parentheses. (d) Comparison between MaXLinker and XlinkX in terms of
precision using six E. coli MS2-MS3 XL-MS fractions from Liu et al9. (e) Overlap between
interprotein CSMs from MaXLinker and XlinkX at 1% FDR showing the respective precision
values in the parentheses. (f) Overlap between interprotein CSMs at 1%FDR from MaXLinker and
additional filtering on 1% FDR with ‘XlinkX score’ ≥ 50 for XlinkX, showing the respective
precision values in the parentheses. (Significance was determined by a two-sided Z-test; The error
bars represent the estimated standard error of mean).
Figure 4. Validation and Comparison of MaXLinker’s performance with that of XlinkX using
bovine GLUD1 XL-MS. Search1 was performed using sequence of only GLUD1 protein as the
search database and Search2 was performed using a concatenated database consisting sequence
for GLUD1 along with the entire S. cerevisiae proteome. (a) Overlap between MaXLinker’s
identifications from Search1 and Search2 at 1% FDR. (b) Overlap between identifications from
XlinkX from Search1 and Search2 at 1% FDR. (c) Overlap of Search2 identifications at 1% FDR
from MaXLinker and XlinkX. (d) Overlap of Search2 identifications from MaXLinker at 1% FDR
and with additional filtering (‘XlinkX Score’ ≥ 50) at 1% FDR from XlinkX. (e) Validation of
cross-links from GLUD1 identified using MaXLinker, by mapping them onto its three-
dimensional structure (PDB: 5K12). Cross-links exceeding theoretical distance constraint for
DSSO (30Å) is shown in red. The histogram shows distance distribution for all the cross-links
mapped on to the structure (cross-links with distance >30Å shown in red). The structure mappings
were performed using Xlink Analyzer17 implemented in UCSF Chimera18.
.CC-BY-NC-ND 4.0 International licenseIt is made available under a (which was not peer-reviewed) is the author/funder, who has granted bioRxiv a license to display the preprint in perpetuity.
The copyright holder for this preprint. http://dx.doi.org/10.1101/526897doi: bioRxiv preprint first posted online Jan. 23, 2019;

14
Figure 5. Validation of cross-links and novel interactions identified in the proteome-wide human
K562 XL-MS study at 1% FDR. (a) Mapping cross-links from 26S proteasome complex on to a
recently published structure (PDB: 5GJQ; cross-links exceeding maximum theoretical constraint
30Å are shown in red). (b) A circular plot showing interprotein cross-links between various
subunits from 26S proteasomal complex.(cross-links exceeding maximum theoretical constraint
30Å are shown in red; the plot was generated using Circos19.) (c) Validation of a cross-link from
26S proteasome that violate distance constraints (>30Å) in one structure (PDB: 5GJQ) and obey
in a different structure (PDB: 5T0J), suggesting potential conformational changes. (d) Network
map showing protein-protein interactions identified in the current study. (known interactions are
shown in green and novel interactions are shown in orange). (e) Experimental validation of a
representative set of 49 novel interactions identified in the current study using Protein-fragment
complementation assay (PCA) (mean fraction positive: 0.130) (PRS: Positive Reference Set (45
interactions; mean fraction positive: 0.133); RRS: Random Reference Set (45 interactions; mean
fraction positive: 0.029); The error bars represent the standard deviation; Significance was
determined by a one-sided Welch Two Sample t-test; 95% confidence interval; t-statistic 0.53 for
“PRS - This Study”, and 164.75 for “RRS - This Study”; 2 degrees of freedom).
.CC-BY-NC-ND 4.0 International licenseIt is made available under a (which was not peer-reviewed) is the author/funder, who has granted bioRxiv a license to display the preprint in perpetuity.
The copyright holder for this preprint. http://dx.doi.org/10.1101/526897doi: bioRxiv preprint first posted online Jan. 23, 2019;

15
REFERENCES
1. Yu, H. et al. High Quality Binary Protein Interaction Map of the Yeast Interactome
Network. Science 322, 104-110 (2008).
2. Wang, X. et al. Three-dimensional reconstruction of protein networks provides insight
into human genetic disease. Nature Biotechnology 30, 159 (2012).
3. Rappsilber, J. The beginning of a beautiful friendship: Cross-linking/mass spectrometry
and modelling of proteins and multi-protein complexes. Journal of Structural Biology
173, 530-540 (2011).
4. Leitner, A., Faini, M., Stengel, F. & Aebersold, R. Crosslinking and Mass Spectrometry:
An Integrated Technology to Understand the Structure and Function of Molecular
Machines. Trends in Biochemical Sciences 41, 20-32 (2016).
5. Sinz, A. Chemical cross‐linking and mass spectrometry to map three‐dimensional protein
structures and protein–protein interactions. Mass spectrometry reviews 25, 663-682
(2006).
6. Kao, A. et al. Development of a novel cross-linking strategy for fast and accurate
identification of cross-linked peptides of protein complexes. Mol Cell Proteomics 10,
M110 002212 (2011).
7. Kao, A. et al. Mapping the Structural Topology of the Yeast 19S Proteasomal Regulatory
Particle Using Chemical Cross-linking and Probabilistic Modeling. Molecular & Cellular
Proteomics 11, 1566-1577 (2012).
8. Liu, F., Rijkers, D.T.S., Post, H. & Heck, A.J.R. Proteome-wide profiling of protein
assemblies by cross-linking mass spectrometry. Nature Methods 12, 1179 (2015).
9. Liu, F., Lössl, P., Scheltema, R., Viner, R. & Heck, A.J.R. Optimized fragmentation
schemes and data analysis strategies for proteome-wide cross-link identification. Nature
Communications 8, 15473 (2017).
10. Meyer, M.J. et al. Interactome INSIDER: a structural interactome browser for genomic
studies. Nature Methods 15, 107 (2018).
11. Mohr, J.P., Perumalla, P., Chavez, J.D., Eng, J.K. & Bruce, J.E. Mango: A General Tool
for Collision Induced Dissociation-Cleavable Cross-Linked Peptide Identification. Anal
Chem 90, 6028-6034 (2018).
12. Elias, J.E., Gibbons, F.D., King, O.D., Roth, F.P. & Gygi, S.P. Intensity-based protein
identification by machine learning from a library of tandem mass spectra. Nature
Biotechnology 22, 214 (2004).
13. Elias, J.E. & Gygi, S.P. Target-decoy search strategy for increased confidence in large-
scale protein identifications by mass spectrometry. Nature Methods 4, 207 (2007).
14. Krogan, N.J. et al. Global landscape of protein complexes in the yeast Saccharomyces
cerevisiae. Nature 440, 637 (2006).
15. Lenz, S., Giese, S.H., Fischer, L. & Rappsilber, J. In-Search Assignment of Monoisotopic
Peaks Improves the Identification of Cross-Linked Peptides. Journal of Proteome
Research (2018).
16. Yu, H. et al. Next-generation sequencing to generate interactome datasets. Nature
Methods 8, 478 (2011).
17. Kosinski, J. et al. Xlink Analyzer: Software for analysis and visualization of cross-linking
data in the context of three-dimensional structures. Journal of Structural Biology 189,
177-183 (2015).
.CC-BY-NC-ND 4.0 International licenseIt is made available under a (which was not peer-reviewed) is the author/funder, who has granted bioRxiv a license to display the preprint in perpetuity.
The copyright holder for this preprint. http://dx.doi.org/10.1101/526897doi: bioRxiv preprint first posted online Jan. 23, 2019;

16
18. Pettersen, E.F. et al. UCSF Chimera--a visualization system for exploratory research and
analysis. J Comput Chem 25, 1605-1612 (2004).
19. Krzywinski, M. et al. Circos: an information aesthetic for comparative genomics.
Genome Res 19, 1639-1645 (2009).
20. Bastos de Oliveira, Francisco M. et al. Phosphoproteomics Reveals Distinct Modes of
Mec1/ATR Signaling during DNA Replication. Molecular Cell 57, 1124-1132 (2015).
21. Bastos de Oliveira, F.M., Kim, D., Lanz, M. & Smolka, M.B. in Genome Instability:
Methods and Protocols. (eds. M. Muzi-Falconi & G.W. Brown) 645-660 (Springer New
York, New York, NY; 2018).
22. Yang, X. et al. A public genome-scale lentiviral expression library of human ORFs.
Nature Methods 8, 659 (2011).
23. Braun, P. et al. An experimentally derived confidence score for binary protein-protein
interactions. Nature Methods 6, 91 (2008).
24. Venkatesan, K. et al. An empirical framework for binary interactome mapping. Nature
Methods 6, 83 (2008).
25. Orchard, S. et al. Protein interaction data curation: the International Molecular Exchange
(IMEx) consortium. Nature Methods 9, 345 (2012).
26. Kerrien, S. et al. The IntAct molecular interaction database in 2012. Nucleic Acids
Research 40, D841-D846 (2012).
27. Licata, L. et al. MINT, the molecular interaction database: 2012 update. Nucleic Acids
Research 40, D857-D861 (2012).
28. Salwinski, L. et al. The Database of Interacting Proteins: 2004 update. Nucleic Acids
Research 32, D449-D451 (2004).
29. Chatr-aryamontri, A. et al. The BioGRID interaction database: 2015 update. Nucleic
Acids Research 43, D470-D478 (2015).
30. Keshava Prasad, T.S. et al. Human Protein Reference Database—2009 update. Nucleic
Acids Research 37, D767-D772 (2009).
31. Pagel, P. et al. The MIPS mammalian protein–protein interaction database.
Bioinformatics 21, 832-834 (2005).
32. Turner, B. et al. iRefWeb: interactive analysis of consolidated protein interaction data
and their supporting evidence. Database 2010, baq023-baq023 (2010).
33. Ruepp, A. et al. CORUM: the comprehensive resource of mammalian protein
complexes—2009. Nucleic Acids Research 38, D497-D501 (2010).
34. Alfarano, C. et al. The Biomolecular Interaction Network Database and related tools
2005 update. Nucleic Acids Research 33, D418-D424 (2005).
35. Brown, K.R. & Jurisica, I. Online Predicted Human Interaction Database. Bioinformatics
21, 2076-2082 (2005).
36. The UniProt Consortium UniProt: the universal protein knowledgebase. Nucleic Acids
Research 45, D158-D169 (2017).
.CC-BY-NC-ND 4.0 International licenseIt is made available under a (which was not peer-reviewed) is the author/funder, who has granted bioRxiv a license to display the preprint in perpetuity.
The copyright holder for this preprint. http://dx.doi.org/10.1101/526897doi: bioRxiv preprint first posted online Jan. 23, 2019;

17
ACKNOWLEDGEMENTS
We thank Rosa Viner for support in data processing with XlinkX work-flow in Proteome Discoverer and
Shayne Wierbowski for helpful suggestions regarding data representation. We thank Robert Fragoza for
the assistance with PCA experiments. We thank Elizabeth Anderson and Robert Sherwood for their
technical support in sample preparation.
AUTHOR CONTRIBUTIONS
H.Y. conceived and oversaw all aspects of the study. K.Y. and H. Y. designed and implemented MaXLinker
algorithm with assistance from IM and MCL. A.K.L. developed the user interface for MaXLinker. K.Y.
performed the computational analyses. T.W., J.L., and E.S. performed laboratory experiments. K.Y. wrote
the manuscript with inputs from T.W., M.C.L., M.B.S., S.Z., and H.Y.
COMPETING FINANCIAL INTERESTS
The authors declare no competing financial interests.
.CC-BY-NC-ND 4.0 International licenseIt is made available under a (which was not peer-reviewed) is the author/funder, who has granted bioRxiv a license to display the preprint in perpetuity.
The copyright holder for this preprint. http://dx.doi.org/10.1101/526897doi: bioRxiv preprint first posted online Jan. 23, 2019;
18
METHODS
Cell culture and whole cell lysate preparation
The K562 cells (ATCC® CCL-243™) were purchased from American Type Culture Collection
(ATCC). The cells were maintained in the Iscove's Modified Dulbecco's Medium (IMDM)
(ATCC) supplemented with 10% fetal bovine serum (FBS) (ATCC) at 37°C with humidified
ambient atmosphere containing 5% CO2. The K562 cells were collected and washed three times
with cold PBS. The cells were then resuspended in cold buffer composed of 50 mM HEPES, 150
mM NaCl, pH 7.5 supplemented with Protease Inhibitor Cocktail (Roche). The resuspended cells
were lysed on ice by sonication (Amplitude 10% for 5 sec and repeat 6 times), followed by
centrifugation at 15,000 g for 10 min at 4oC. The supernatant was collected and measured the
protein concentration using Bio-Rad Protein Assay Dye (Bio-Rad).
Cross-linking of bovine glutamate dehydrogenase (GDH) and human proteome
DSSO (Thermo Fisher Scientific) was freshly prepared as a 50 mM stock solution by dissolving
in anhydrous DMSO. The 1 mg/mL pure bovine glutamate dehydrogenase (GDH) protein (Sigma)
was reacted with 1 mM DSSO in 50 mM HEPES buffer, 150 mM NaCl, pH 7.5 for 30 min at room
temperature. Similarly, the 1 mg/mL lysate of K562 cells were incubated with 1 mM DSSO for 1
hour at room temperature. Both cross-linking reactions were terminated by 50 mM Tris-Cl buffer,
pH 7.5.
Processing of DSSO-cross-linked samples for analysis
The DSSO-treated protein samples were processed as previously described20, 21. Briefly, the cross-
linked GDH was denatured in 1% SDS, reduced by DTT, and alkylated with iodoacetamide,
followed by precipitated in cold acetone-ethanol solution (acetone:ethanol:acetic
acid=50:49.9:0.1, v/v/v). The precipitates were dissolved in 50 mM Tris-Cl, 150 mM NaCl, 2 M
urea, pH 8.0 and digested by Trypsin Gold (Promega) at 37oC overnight. After digestion, the
sample was acidified by 2% trifluoroacetic acid-formic acid solution, desalted through Sep-Pak
C18 cartridge (Waters), and dried using SpeedVacTM Concentrator (Thermo Fisher Scientific). The
sample was then reconstituted in 0.1% trifluoroacetic acid and stored in -80oC before mass
spectrometry analysis. The DSSO-cross-linked human proteome was processed identically as
.CC-BY-NC-ND 4.0 International licenseIt is made available under a (which was not peer-reviewed) is the author/funder, who has granted bioRxiv a license to display the preprint in perpetuity.
The copyright holder for this preprint. http://dx.doi.org/10.1101/526897doi: bioRxiv preprint first posted online Jan. 23, 2019;

19
described above except that the TPCK-treated trypsin was used for digestion and the sample was
stored after drying.
Fractionation by Strong Cation Exchange (SCX)
The SCX fractionation was performed on a Dionex UltiMate 3000 Series instrument (Thermo
Fisher Scientific) using a PolySULFOETHYL A column (5 µm, 200 Å, 2.1 x 200 mm; PolyLC)
with 10 mM potassium phosphate monobasic in 25% acetonitrile, pH 3.0 as Buffer A and 10 mM
potassium phosphate monobasic/500 mM potassium chloride in 25% acetonitrile, pH 3.0 as Buffer
B. All eluents were filtered through a 0.22 µm Durapore membrane (EMD Millipore Corporation)
and stored at 4oC until use. Prior to injection, the 1 mg of trypsin-digested sample was reconstituted
in 25% acetonitrile/0.1% formic acid (v/v) and filtered through a Spin-X centrifuge tube filters
(cellulose acetate membrane, 0.22 µm; Corning) by following manufacturer’s recommended
protocol. The fractionation was performed at a flow rate of 200 µL/min using a linear gradient
from 5-60% of Buffer B in 40 min and 60-100% of Buffer B in an additional 10 min. A total of 60
fractions were collected using a 96-well plate at 1-min intervals monitored by the absorbance at
220 nm and 280 nm. The fractions collected from 23 to 60 min were desalted using SOLA HRP
SPE cartridges (Thermo Scientific). The eluted peptides were dried by speed vacuum and stored
at -20oC until LC-MS analysis.
Fractionation of cross-linked peptides by hydrophilic interaction liquid chromatography (HILIC)
The DSSO-cross-linked human peptides in 70% acetonitrile and 1% formic acid were fractionated
and enriched by hydrophilic interaction liquid chromatography (HILIC). The HILIC fractionation
was performed on a Dionex UltiMate 3000 Series instrument (Thermo Fisher Scientific) equipped
with a TSKgel Amide-80 column (3 µm, 4.6 mm x 15 cm; Tosoh). The three following solvents
were used: 90% acetonitrile (solvent A), 80% acetonitrile and 0.005% trifluoroacetic acid (solvent
B), 0.025% trifluoroacetic acid (solvent C). All the runs were performed at a flow rate of 600
µl/min using the following gradients: 0-5 min (0-98% B and 0-2% C); 5-55 min (98-75% B and
2-25% C); and 55-60 min (75-5% B and 25-95% C). The fractions were collected per 30 seconds.
Each fraction was dried and stored at -80oC for further analysis.
.CC-BY-NC-ND 4.0 International licenseIt is made available under a (which was not peer-reviewed) is the author/funder, who has granted bioRxiv a license to display the preprint in perpetuity.
The copyright holder for this preprint. http://dx.doi.org/10.1101/526897doi: bioRxiv preprint first posted online Jan. 23, 2019;

20
LC-MSn analysis
The HILIC fractions were reconstituted in 0.1% trifluoroacetic acid. The samples were analyzed
using an EASY-nLC 1200 system (Thermo Fisher Scientific) equipped with an 125-µm x 25-cm
capillary column in-house packed with 3-µm C18 resin (Michrom BioResources) and coupled
online to an Orbitrap Fusion Lumos Tribrid mass spectrometer (Thermo Fisher Scientific). The
LC analysis were performed using the linear gradients of solvent A composed of 0.1% formic acid
and solvent B composed of 80% acetonitrile and 0.1% formic acid with a total run time of 180 min
at a flow rate of 300 nl/min. For MSn data acquisition, the CID-MS2-HCD-MS3 method was used.
Briefly, the MS1 precursors were detected in Orbitrap mass analyzer (375-1500 m/z, resolution of
60,000). The precursor ions with the charge of 4+ to 8+ were selected for MS2 analysis in Orbitrap
mass analyzer (resolution of 30,000) with the collision energy of collision-induced dissociation
(CID) at 25%. The peaks with a mass difference of 31.9721 Da, which is a signature of cleaved
DSSO-cross-linked peptides, in CID-MS2 spectra were selected for further MS3 analysis. The
selected ions were fragmented in IonTrap using higher-energy collisional dissociation (HCD) with
the collision energy at 35%.
Validation of newly identified protein-protein interactions by protein complementation assay
(PCA)
The ORFs of a total of 49 protein pairs in pDONR223 plasmid were picked from hORFeome v8.1
library22. The bait and prey protein of each protein pair was cloned into the expression plasmids
containing the complementation fragments of a fluorescent protein Venus using Gateway LR
reactions. The success of the LR reactions with desired ORF was confirmed by PCR using the
plasmid-specific primers. To perform PCA, HEK293T cells were cultured in Dulbecco’s Modified
Eagle Medium (DMEM) supplemented with 10% fetal bovine serum (FBS) (ATCC) in black 96-
well flat-bottom plates (Costar) with 5% CO2 at 37°C. At 60-70% confluency, the cells were co-
transfected with the plasmids containing the bait and prey ORF (100 ng for each) pre-mixed with
polyethylenimine (PEI) (Polysciences Inc.) and OptiMEM (Gibco). A total of 49 bait and prey
ORF pairs along with previously published 45 positive reference pairs and 45 negative reference
pairs were examined and distributed across different plates23, 24. After 68 hours, the fluorescence
of the transfected cells was measured using Infinite M1000 microplate reader (Tecan) (excitation
= 514 ± 5 nm / emission = 527 ± 5 nm). The PCA experiments were performed and analyzed in
triplicate. The p-values were calculated using a paired one-tailed t-test.
.CC-BY-NC-ND 4.0 International licenseIt is made available under a (which was not peer-reviewed) is the author/funder, who has granted bioRxiv a license to display the preprint in perpetuity.
The copyright holder for this preprint. http://dx.doi.org/10.1101/526897doi: bioRxiv preprint first posted online Jan. 23, 2019;

21
Precision
Precision for proteome-wide XL-MS studies can be defined as the fraction of the identified
interprotein cross-links from previously known protein-protein interactions. It can be derived using
the following equation:
Precision (%) =Number of true positives
Total number of postives 𝑋 100 (1)
where, ‘positives’ include all the identified interprotein cross-links, and ‘true positives’ refer to
cross-links from known protein-protein interactions. We compiled the known protein-protein
interactions for E. coli and H. sapiens from seven primary interaction databases. These databases
include IMEx25 partners IntAct26, MINT27, and DIP28; IMEx observer BioGRID29; and additional
sources HPRD30, MIPS31, and iRefWeb32. Furthermore, iRefWeb combines interaction data from
CORUM33, BIND34, MPPI31 and OPHID35.
Data processing
The raw data files were converted, and the spectra were exported as ‘.mgf’ (MS1 spectra as ‘.dta’)
files using Proteome Discoverer 2.1 software (PD 2.1). SEQUEST searches were performed using
PD 2.1 with the following settings: precursor mass tolerance: 20ppm (10 ppm for MS2 rescue
module); MS3 fragment ion mass tolerance: 0.6 Da (0.05 Da for MS2 rescue module); fixed
modification: Cys carbamidomethylation; variable modifications: Met oxidation, Long arm of
DSSO, Short arm of DSSO; max. equal modification per peptide: 3; max. missed cleavages: 3,
minimum peptide length: 5. Concatenated target-decoy databases are used for various PSM
searches performed during the study. Target sequences were downloaded from uniport database36
(with filter ‘reviewed’) and a corresponding decoy database was generated by randomizing the
sequences using an in-house python script. ((i) Escherichia coli: 5268 sequences; downloaded on
28th October 2017, (ii) Saccharomyces cerevisiae: 7904 sequences; downloaded on 28th September
2017, and (iii) Homo Sapiens: 42202 sequences; downloaded on 23rd June 2017).
For XlinkX searches, all the raw files were processed using XlinkX v2.0 implemented in
Proteome Discoverer software version 2.2 (PD 2.2). PD templates for different XlinkX search
methodologies were obtained from Rosa Viner (Thermo fisher Scientific). All the searches were
performed at 1% FDR cut-off and the CSMs were exported (after applying filter “Is Decoy:
False”). For “MS3-Only” category, results from “CID-MS2-MS3” were reprocessed with option
“Reprocess: Last Consensus Step” with “Ignore reporter scan: True” in “Xlinkx Crosslink
.CC-BY-NC-ND 4.0 International licenseIt is made available under a (which was not peer-reviewed) is the author/funder, who has granted bioRxiv a license to display the preprint in perpetuity.
The copyright holder for this preprint. http://dx.doi.org/10.1101/526897doi: bioRxiv preprint first posted online Jan. 23, 2019;

22
Grouping” node. This set contained a list of all CSMs (includes multiple identifications
representing a cross-linked peptide pair). This set of data was used for comparisons shown in
Supplementary Fig. 1. Next, Those CSMs for were further processed to obtain a list of unique
CSMs (In case of multiple CSMs with different cross-link positions, only one of them was retained
to avoid potential biases due to over-representation of certain peptide pairs). The resulting set of
CSMs were used for comparisons shown in Fig. 1, Fig. 3a, 3b, 3c, 3d, 3e, 3f, Supplementary Figure
2, Supplementary Figure 3, Supplementary Figure 4. Same procedure was followed to obtain the
unique CSMs for GLUD1 analysis shown in Fig. 4b, 4c, and 4d.
Description of MaXLinker
MaXLinker runs in two steps: (i) pre-processing generates a ‘.MS2_rescue.mgf’ file, which is
needed for the PSM search in PD 2.1 to be eventually used in the main search. (ii) cross-link search
accepts .mgf files with different levels of MS spectra(MS1, MS2 and MS3), and two files
containing the list of PSMs from PD2.1 SEQUEST search on MS3 spectra and ‘MS2_rescue’
spectra. After the Main MaXLinker search, confidence score is assigned to each cross-link and it
is derived using the following equation:
MaXLinker Score = (Σqrescaled * WXL) + N (2)
where, qrescaled = Rescaled Percolator q-value
WXL = Weight for cross-link PSM confidence
N = No. of recurrences
Moreover, MaXLinker utilizes the target-decoy strategy to establish the FDR. A concatenated
database consisting target and decoy (random) sequences is used for the PSM search and the FDR
is calculated using the equation:
FDR = FP/FP+TP (3)
where, FP denote false positive hits and TP denote true positive hits. For cross-link identification,
TP represent the number of cross-links with both linked peptides from the target database and FP
represent the number of cross-links with at least one of the linked peptides from decoy database.
The identified cross-links were annotated as ‘interprotein’ if neither of the linked peptides were
derived from a common protein (with the exception where, both the linked peptides from a
common protein, were identical or one of them was a complete subset of the other and the peptide
.CC-BY-NC-ND 4.0 International licenseIt is made available under a (which was not peer-reviewed) is the author/funder, who has granted bioRxiv a license to display the preprint in perpetuity.
The copyright holder for this preprint. http://dx.doi.org/10.1101/526897doi: bioRxiv preprint first posted online Jan. 23, 2019;

23
occurs only once in the protein sequence). Cross-links that did not satisfy the aforementioned
criteria were annotated as ‘intraprotein’.
Statistics
Statistical analyses were performed using a two-sided Z test or a one-sided Welch Two Sample t-
test, as indicated in the figure captions. Exact P values are provided for all compared groups.
Data availability
All cross-links are reported in the Supplementary information. Additional data that support the
findings of this study are available from the corresponding author upon request
.CC-BY-NC-ND 4.0 International licenseIt is made available under a (which was not peer-reviewed) is the author/funder, who has granted bioRxiv a license to display the preprint in perpetuity.
The copyright holder for this preprint. http://dx.doi.org/10.1101/526897doi: bioRxiv preprint first posted online Jan. 23, 2019;

a b
P = 5.9 x 10⁻⁴
P = 0.02 P = 0.03
Precision (%)
Uni
que
CSM
s
MS3
-Onl
y
CID-
MS2
-ETD
-MS2
CID-
MS2
-MS3
CID-
MS2
-MS3
-ETD
-MS2
200
0
400
600
25
50
75
0
P = 1.8 x 10⁻⁸
P = 2.0 x 10⁻⁵ P = 2.3 x 10⁻⁷
Uni
que
CSM
s
Fraction of m
is-identifications(%)
MS3
-Onl
y
CID-
MS2
-ETD
-MS2
CID-
MS2
-MS3
CID-
MS2
-MS3
-ETD
-MS2
200
0
400
600
800
10
20
40
30
0
Figure 1
.CC-BY-NC-ND 4.0 International licenseIt is made available under a (which was not peer-reviewed) is the author/funder, who has granted bioRxiv a license to display the preprint in perpetuity.
The copyright holder for this preprint. http://dx.doi.org/10.1101/526897doi: bioRxiv preprint first posted online Jan. 23, 2019;

Ashort+Blong+H2O = Precursor?ALong+Bshort+H2O = Precursor?
Derived Bshort = Precursor - (Along+H2O)Derived Blong = Precursor - (Ashort+H2O)
Does MS2 contain derived precursor masses?
Derived Bshort Derived Blong
PSM search on MS2 spectrum
No
Yes
Yes
MS2 Rescue Module
Search MS2 spectrum for signature ions
Look for identical sequences in case of 2 PSMs per peptide
Deduce absolute masses for both peptides and virtually reconstruct cross-link
Calculate MaXLinker Score
MS3 Spectra
Yes
Yes
Has good MS3 for atleast
one peptide?
Case 1
Case 2
Informative MS3 spectra for both peptide A and Peptide B
Informative MS3 spectra for Peptide A and Uninformative MS3 spectra for Peptide B
Ashort Along Bshort Blong
Rescued PSMs
MS1
MS2
MS3
Δm
Δm
Data acquisition
Data export and PSM search
Identi�cation of cross-links using MaXLinker
Adjust precursor for mis-assigned
monoisotopic mass in MS1
Mass validated
?
A
B
CD
Figure 2
No
.CC-BY-NC-ND 4.0 International licenseIt is made available under a (which was not peer-reviewed) is the author/funder, who has granted bioRxiv a license to display the preprint in perpetuity.
The copyright holder for this preprint. http://dx.doi.org/10.1101/526897doi: bioRxiv preprint first posted online Jan. 23, 2019;

e
b
MaXLinker(0.8%)
XlinkX(14.8%)
242(33.1%)
314(0.6%)
79(1.3%)
MaXLinker(0.8%)
XlinkX(1.5%)
275(0.4%)
118(1.7%)
66(6.1%)
MaXLinker(66.7%)
XlinkX(33.3%)
35(51.4%)
40(80.0%)
80(10.0%)
c
MaXLinker(66.7%)
34(85.3%)
41(51.2%)
20(25.0%)
XlinkX(63.0%)
f
0
MaXLinker XlinkX
200
0
400
600
5
10
15
20
Fraction of m
is-identifications(%)
P = 1.1 x 10⁻¹³
a
MS3
-Onl
y
CID-
MS2
-MS3
MS3
-Onl
y
CID-
MS2
-MS3
Uni
que
CSM
s
d600
0 Precision (%)
25
50
75
100
0
200
400
Uni
que
CSM
s
MaXLinker XlinkX
P = 5.6 x 10⁻⁶
MS3
-Onl
y
CID-
MS2
-MS3
MS3
-Onl
y
CID-
MS2
-MS3
Figure 3
.CC-BY-NC-ND 4.0 International licenseIt is made available under a (which was not peer-reviewed) is the author/funder, who has granted bioRxiv a license to display the preprint in perpetuity.
The copyright holder for this preprint. http://dx.doi.org/10.1101/526897doi: bioRxiv preprint first posted online Jan. 23, 2019;
a
GLUD1+
S. cerevisiae proteomedatabase
Only GLUD1database
33 3(2)
10
Search1 Search2
110(110)
305
GLUD1+
S. cerevisiae proteomedatabaseSearch2
Only GLUD1database
Search1
> 30Å ≤ 30Å
Uni
que
CSM
s
Euclidean Cα pair distance [Å]3 6 9 12 15 18 21 24 27 30 33 36 39
1
2
3
0
MaXLinker XlinkX
110(109)
30(1)
6(1)
[1% FDR][1% FDR] MaXLinker XlinkX
9(9)
24(1)
12(1)
[∆XlinkX score ≥50 at 1% FDR]
[1% FDR]
b
c d
e
Figure 4
.CC-BY-NC-ND 4.0 International licenseIt is made available under a (which was not peer-reviewed) is the author/funder, who has granted bioRxiv a license to display the preprint in perpetuity.
The copyright holder for this preprint. http://dx.doi.org/10.1101/526897doi: bioRxiv preprint first posted online Jan. 23, 2019;

d
a b
22.8Å
30.5Å
c
e
D11 D12D14
A7D3
C3B
1
A1A2
A3
A4
A5
B4B5
C2C4D8
B2D7
D4
A6C1
C5
C6D6
B7
D1D13
> 30Å ≤ 30Å
KnownNovel
Figure 5
P = 0.325
P = 1.8 x 10⁻⁵
PRS
This Stu
dyRRS
0.00
0.05
0.10
0.15
0.20Fr
actio
n po
sitiv
e by
PC
A
.CC-BY-NC-ND 4.0 International licenseIt is made available under a (which was not peer-reviewed) is the author/funder, who has granted bioRxiv a license to display the preprint in perpetuity.
The copyright holder for this preprint. http://dx.doi.org/10.1101/526897doi: bioRxiv preprint first posted online Jan. 23, 2019;


![Estimating Numerical Distributions under Local ... · trusted third party. LDP techniques have been deployed by companies like Apple [29], Google [11], and Microso› [8]. Most existing](https://static.fdocuments.fr/doc/165x107/5fbdaedf5d81837a664791da/estimating-numerical-distributions-under-local-trusted-third-party-ldp-techniques.jpg)