
Master Plan Confins
53
AUGUST 2009 Capacity of T1 + T2 + Fully Completed Terminal 3 at 37.0 mppa T TA AN NC CR RE ED DO O N NE EV VE ES S I IN NT TE ER RN NA AT TI I O ON NA AL L A AI I R RP PO OR RT T B BE EL LO O H HO OR RI IZ ZO ON NT TE E, , B BR RA AZ ZI IL L A AI I R RP PO OR RT T S ST TR RA AT TE EG GY Y R RE EP PO OR RT T Sub-Consultancy Agreement for Strategic Analysis, Master Plan, Operations and Com m ercial Strat egy for th e Developmen t of Tancredo Neves International Airport (AITN) in Belo Horizonte Metropolitan Region, Minas Gerais, Brazil VOLUME I
Transcript of Master Plan Confins
7/29/2019 Master Plan Confins
http://slidepdf.com/reader/full/master-plan-confins 1/53
AUGUST 2009
Capacity of T1 + T2+ Fully Completed Terminal 3 at
37.0 mppa TTAANNCCRREEDDOO NNEEVVEESS IINNTTEERRNNAATTIIOONNAALL AAIIRRPPOORRTT
BBEELLOO HHOORRIIZZOONNTTEE,, BBRRAAZZIILL
AAIIRRPPOORRTT SSTTRRAATTEEGGYY RREEPPOORRTT
Sub-Consultancy Agreement for Strategic Analysis, Master Plan,Operations and Commercial Strategy for the Development of TancredoNeves International Airport (AITN) in Belo Horizonte Metropolitan Region,Minas Gerais, Brazil
VOLUME I
7/29/2019 Master Plan Confins
http://slidepdf.com/reader/full/master-plan-confins 2/53
Airport Cons ul tancy Report for Tancredo Neves International Airport (AITN)
© Changi Airpor t Consult ants (Company Registration No. 200507762K). All right s reserved.
Important Message to Any Person Not Authorised to Have Access to ThisReport
Unless otherwise agreed to by Changi Airport Consultants Pte Ltd. (“CAC”),any person who is not an addressee of this report is not authorised to have
access to this report.
Should any unauthorised person obtain access to and read this report, byreading this report, such person accepts and agrees to the following terms :-
1. The reader of this report understands that the work performed by CACwas performed in accordance with instructions provided by the addresseeand was performed exclusively for our addressee’s sole benefit and use.
2. The reader of this report acknowledges that this report was prepared atthe direction of our addressee and may not include all procedures deemednecessary for the purposes of the reader.
3. The reader agrees that CAC, its employees and agents neither owenor accept any duty or responsibility to it, whether in contract or in tort(including without limitation, negligence and breach of duty), and shall notbe liable in respect of any loss, damage or expense of whatsoever naturewhich is caused by any use the reader may choose to make this report, orwhich is otherwise consequent upon the gaining of access to the report bythe reader. Further, the reader agrees that this report is not to be referredto or quoted, in whole or in part, in any document and not to distributewithout CAC’s prior written consent.
7/29/2019 Master Plan Confins
http://slidepdf.com/reader/full/master-plan-confins 3/53
Airpor t Consultancy Report fo r Tancred o Neves Internat ional Air port (AITN)
© Changi Airpor t Consult ants (Company Registratio n No. 200507762K). All right s reserved.
Table of Contents
1. INTRODUCTION ..................................................................................................1 1.1. VISION OF BHMR MULTIMODAL CORRIDOR HUB............................................1 1.2. ROLES AND GOAL OF T ANCREDO NEVES INTERNATIONAL AIRPORT ................1
2. OPERATING ENVIRONMENT ASSESSMENT...................................................5 2.1. ANALYSIS FRAMEWORK ................................................................................5
2.1.1. Global Aviation Outlook ................................................................6 2.1.2. Historical Performance of AITN....................................................7
2.2 COUNTRY .....................................................................................................7 2.2.1. Socio-Economic Prospects of Brazil and Minas Gerais ............8 2.2.2. Tourism Potential .........................................................................10 2.2.3. International Trade .......................................................................13
2.3. COMPETITION .............................................................................................15 2.3.1. Country-level Compet it ion ..........................................................15 2.3.2. State-level Competit ion ...............................................................18 2.3.3. Airpor t-level Compet it ion ............................................................20
2.4. AIRLINES....................................................................................................25 2.5. REGULATORY ENVIRONMENT.......................................................................28 2.6. C APACITY...................................................................................................29 2.7. SWOT ANALYSIS .......................................................................................30
2.7.1. Strengths.......................................................................................30 2.7.2. Weaknesses..................................................................................31 2.7.3. Opportuni ties................................................................................31 2.7.4. Threats ..........................................................................................32
3. AIRPORT POSITIONING...................................................................................32 3.1. FRAMEWORK ..............................................................................................32 3.2. POSITIONING OF AITN ................................................................................34 3.3. KEY STRATEGIC INITIATIVES FOR AITN........................................................36
4. RECOMMENDATIONS FOR PAMPULHA AIRPORT .......................................36 5. RECOMMENDATIONS FOR CARLOS PRATES AIRPORT.............................38

7/29/2019 Master Plan Confins
http://slidepdf.com/reader/full/master-plan-confins 4/53
Airpor t Consultancy Report fo r Tancred o Neves Internat ional Air port (AITN)
© Changi Airpor t Consult ants (Company Registratio n No. 200507762K). All right s reserved.
6. TRAFFIC FORECAST........................................................................................40 6.1. P ASSENGER TRAFFIC FORECASTS...............................................................40
6.1.1 Domestic Passenger Traffic Forecasts .....................................40 6.1.2. International Passenger Traffic Forecasts ................................41 6.1.3. Total Passenger Traff ic Forecasts .............................................42
6.2. C ARGO VOLUME FORECASTS ......................................................................43 6.2.1. Domestic Cargo Volume Forecasts ...........................................43 6.2.2. International Cargo Volume Forecasts ......................................44 6.2.3. Total Cargo Volume Forecasts ...................................................45
7. MASTER PLAN ..................................................................................................46
7/29/2019 Master Plan Confins
http://slidepdf.com/reader/full/master-plan-confins 5/53
Airpor t Consultancy Report fo r Tancred o Neves Internat ional Air port (AITN)
© Changi Airpor t Consult ants (Company Registratio n No. 200507762K). All right s reserved.
LIST OF TABLES
Table 1: Ten Largest Brazilian States...........................................................................4 Table 2: Short-Term Air Traffic Projections...................................................................6 Table 3: Long-Term Air Traffic Projections ...................................................................7 Table 4: International Tourist Arrivals by Region........................................................11 Table 5: UNESCO World Heritage sites.....................................................................11 Table 6: Exchange Rates Changes of Major Currencies, 2009 - 15..........................13 Table 7: Share of International Passengers at Selected Brazilian Airports, 2008......23 Table 8: Share of International Cargo at Selected Brazilian Airports, 2008...............23 Table 9: Comparison of Brazilian Carriers with Major Foreign Carriers .....................27 Table 10: Passenger Airport Tax Rates (per Passenger)...........................................28 Table 11: Landing and Parking Charges ....................................................................29 Table 12: Radio and Visual Aid-in Charges................................................................29 Table 13: Projected CAGR of Domestic Passenger Traffic at AITN...........................41 Table 14: Projected CAGR for International Passenger Traffic at AITN.....................42 Table 15: Projected CAGR for Total Passenger Traffic at AITN ................................43 Table 16: Projected CAGR for Domestic Cargo and Mail Volume at AITN................44 Table 17: Projected CAGR for International Cargo Volume at AITN..........................45 Table 18: Projected CAGR for Total Cargo Volume at AITN......................................46
7/29/2019 Master Plan Confins
http://slidepdf.com/reader/full/master-plan-confins 6/53
Airpor t Consultancy Report fo r Tancred o Neves Internat ional Air port (AITN)
© Changi Airpor t Consult ants (Company Registratio n No. 200507762K). All right s reserved.
LIST OF FIGURES
Figure 1: Top 10 Brazilian Airports (by Passenger Traffic), 2008.................................2 Figure 2: Top 10 Brazilian Airports (by Cargo Volume), 2008......................................3 Figure 3: Main Exporting States in Brazil......................................................................4 Figure 4: Operating Environment Assessment Framework..........................................6 Figure 5: Brazil’s Real per capita GDP (US$ PPP), 1991 - 2030.................................9 Figure 6: Comparison of Real per capita GDP Growth, 2009 - 15.............................10 Figure 7: Minas Gerais’ Total Trade (bil USD), 1991 - 2008......................................14 Figure 8: Ranking by Condé Nast Magazine..............................................................16 Figure 9: Travel and Tourism Competitiveness Index, 2009......................................17 Figure 10: Global Competitiveness Index, 2009.........................................................18 Figure 11: Top 10 Leisure Destinations in Brazil ........................................................19 Figure 12: Top 10 Business Destinations in Brazil .....................................................20 Figure 13: Catchment Areas of GRU, GIG and AITN.................................................21 Figure 14: IATA Connectivity Index of Main Brazilian Airports ...................................22 Figure 15: Leakages of Traffic to GRU and GIG from AITN, 2008.............................24 Figure 16: Leakages of Cargo from AITN, 2008.........................................................25 Figure 17: Share of Passenger Traffic by Airlines, 2008............................................26 Figure 18: Airport Positioning Framework...................................................................33 Figure 19: Current and Proposed Positioning of AITN ...............................................35 Figure 20: Passenger Traffic at PLU (MPPA), 2003 - 2008........................................37 Figure 21: ATM at PLU, 2003 - 2008..........................................................................38 Figure 22: Passenger Traffic at Carlos Prates Airport, 2003 - 2008...........................39 Figure 23: ATM at Carlos Prates Airport, 2003 - 2008...............................................39 Figure 24: Domestic Passenger Traffic Forecasts, 2009 – 2039 ...............................40 Figure 25: International Passenger Traffic Forecasts, 2009 – 2039...........................41 Figure 26: Total Passenger Traffic Forecasts, 2009 – 2039......................................42 Figure 27: Domestic Cargo Volume Forecasts, 2009 – 2039.....................................43 Figure 28: International Cargo Volume Forecasts, 2009 – 2039................................44 Figure 29: Total Cargo Volume Forecasts, 2009 – 2039............................................45 Figure 30: Phase 4 Development Plan for AITN.........................................................47
7/29/2019 Master Plan Confins
http://slidepdf.com/reader/full/master-plan-confins 7/53
Airpor t Consultancy Report fo r Tancred o Neves Internat ional Air port (AITN)
© Changi Airpor t Consult ants (Company Registratio n No. 200507762K). All right s reserved. Page 1
1. INTRODUCTION1.1. Vision of BHMR Multimodal Corridor Hub
The Minas Gerais State Government is developing a 670 km2 site linking Belo
Horizonte Airport City and Granbel FTZ/Inland Port into a dynamic multimodalcorridor hub. There are five strategic objectives that the Belo Horizonte MetropolitanRegion (BHMR) Multimodal Corridor Hub aimed to achieve and they are listed below.
1. To reduce the dependence of the economy on traditional industries2. To foster the State’s research and development (R&D) capability3. To enhance the productivity of the industries4. To leverage airport as a driver for growth5. To connect production centers with demand centers
To achieve these five objectives, the State Secretariat for Economic Development(SEDE) of the Minas Gerais State Government has engaged J urong Consultant todevelop the Master Plan for the BHMR Multimodal Corridor Hub. Frost and Sullivan,as part of the consortium, has identified seven industrial clusters for the BHMRMultimodal Corridor Hub. They are:
1. Aerospace and Defense2. Distribution Logistics & Wholesale Trading3. Education4. Electronic Components5. Info-Tech6. Life Sciences7. Tourism
As a result of the development, the population of the BHMR is expected to increasefrom the current 5.1 million to 6.7 million in 2030. If achieved, the seven sectors arealso expected to generate more than 117,000 jobs in 2020 and 423,000 jobs in 2030respectively. The contribution of these industries to the Minas Gerais’ economy willamount to more than US$25.7 billion in 2020 and to more than US$134.7 billion in2030.
1.2. Roles and Goal of Tancredo Neves International Airport
The airport plays an integral role in achieving the objectives and vision of the BHMRmultimodal Corridor Hub. The relationship between an airport and the economy of a
country is symbiotic. On the one hand, the growth of the country’s economy will leadto a greater demand for air services, both passenger and cargo. This will translateinto the growth of the airport in terms of its throughputs. On the other hand, anairport acts as a catalyst for the country’s economic growth by facilitating the growthof trade, tourism and international investment. An airport is also itself a generator of employment. In addition, airport through its role as a facilitator of economic growthalso create jobs in other industries. Therefore, it is important to correctly position anairport so as to maximise the growth potential of the economy of the regionsurrounding the airport.
7/29/2019 Master Plan Confins
http://slidepdf.com/reader/full/master-plan-confins 8/53
Airpor t Consultancy Report fo r Tancred o Neves Internat ional Air port (AITN)
© Changi Airpor t Consult ants (Company Registratio n No. 200507762K). All right s reserved. Page 2
Like any basic physical infrastructure, airports are regarded as a type of complementary capital. They require the existence of productive capital, either in theform of human or physical capital, in order to realise the countries’ economic growthpotential. Thus, it should be borne in mind that infrastructure investment on its own
could not create economic potential, only develop it where appropriate conditionsexist. However, inadequate supply of infrastructure or unreliability in services mayinhibit the investment of productive capital leading to a restriction or reduction inoutput.
Since Tancredo Neves International Airport (AITN) is the only international airport inMinas Gerais and that there is no plan in the foreseeable future to commissionanother airport in Minas Gerais to become an international airport, the role andresponsibilities of AITN are enormous.
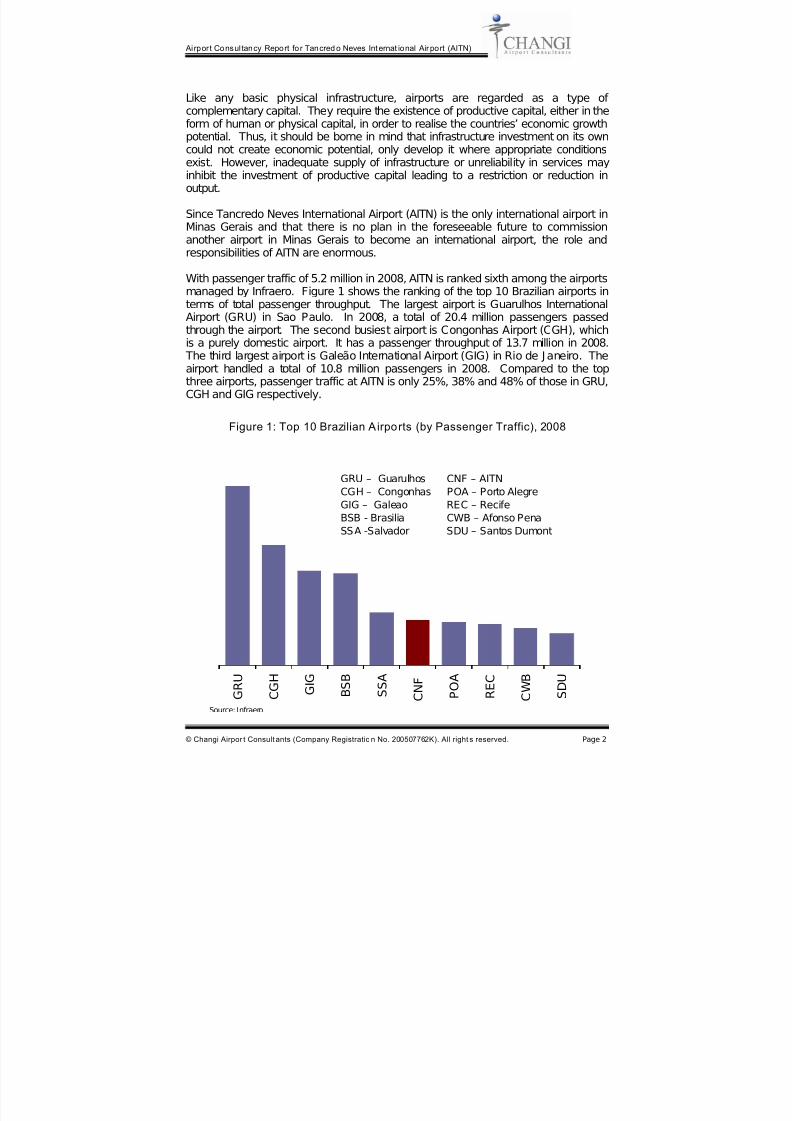
With passenger traffic of 5.2 million in 2008, AITN is ranked sixth among the airportsmanaged by Infraero. Figure 1 shows the ranking of the top 10 Brazilian airports in
terms of total passenger throughput. The largest airport is Guarulhos InternationalAirport (GRU) in Sao Paulo. In 2008, a total of 20.4 million passengers passedthrough the airport. The second busiest airport is Congonhas Airport (CGH), whichis a purely domestic airport. It has a passenger throughput of 13.7 million in 2008. The third largest airport is Galeão International Airport (GIG) in Rio de J aneiro. Theairport handled a total of 10.8 million passengers in 2008. Compared to the topthree airports, passenger traffic at AITN is only 25%, 38% and 48% of those in GRU,CGH and GIG respectively.
Figure 1: Top 10 Brazilian Airports (by Passenger Traffic), 2008
G R U
C G H
G I G
B S B
S S A
C N F
P O A
R E C
C W B
S D U
Source: Infraero
GRU – Guarulhos CNF – AITN
CGH – Congonhas POA – Porto Alegre
GIG – Galeao REC – Recife
BSB - Brasilia CWB – Afonso Pena
SSA -Salvador SDU – Santos Dumont
7/29/2019 Master Plan Confins
http://slidepdf.com/reader/full/master-plan-confins 9/53
Airpor t Consultancy Report fo r Tancred o Neves Internat ional Air port (AITN)
© Changi Airpor t Consult ants (Company Registratio n No. 200507762K). All right s reserved. Page 3
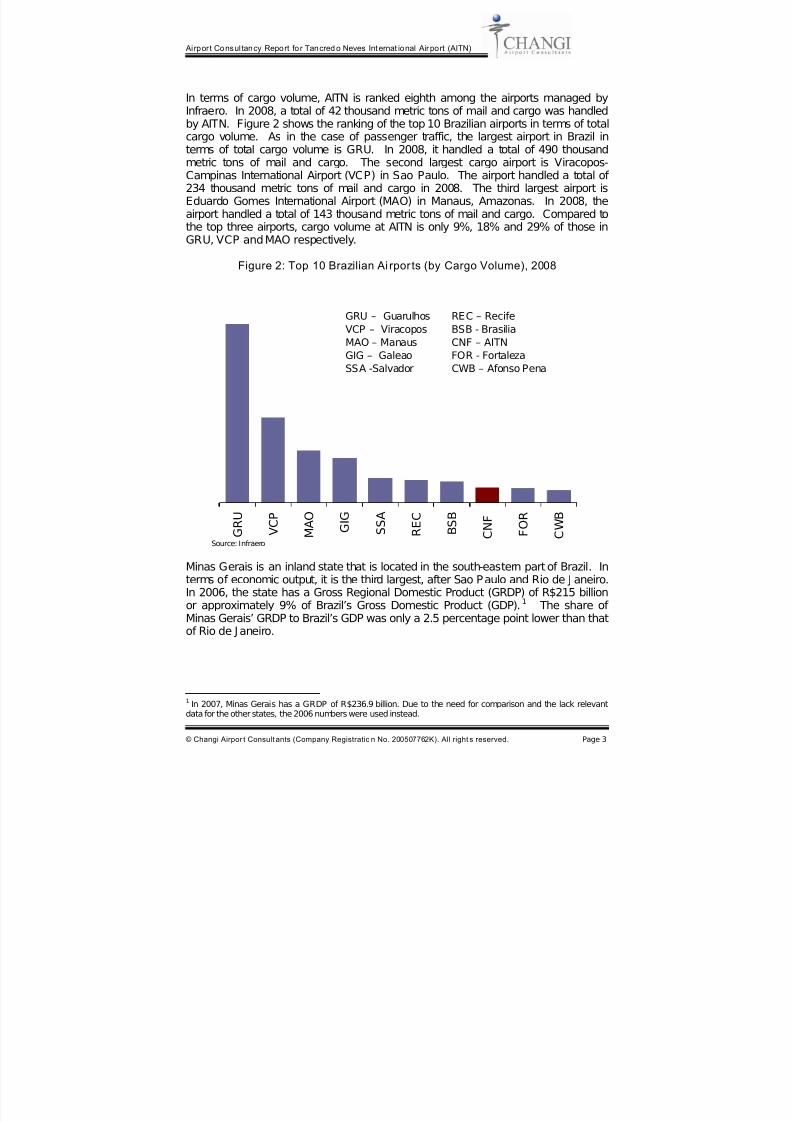
In terms of cargo volume, AITN is ranked eighth among the airports managed byInfraero. In 2008, a total of 42 thousand metric tons of mail and cargo was handledby AITN. Figure 2 shows the ranking of the top 10 Brazilian airports in terms of totalcargo volume. As in the case of passenger traffic, the largest airport in Brazil in
terms of total cargo volume is GRU. In 2008, it handled a total of 490 thousandmetric tons of mail and cargo. The second largest cargo airport is Viracopos-Campinas International Airport (VCP) in Sao Paulo. The airport handled a total of 234 thousand metric tons of mail and cargo in 2008. The third largest airport isEduardo Gomes International Airport (MAO) in Manaus, Amazonas. In 2008, theairport handled a total of 143 thousand metric tons of mail and cargo. Compared tothe top three airports, cargo volume at AITN is only 9%, 18% and 29% of those inGRU, VCP and MAO respectively.
Figure 2: Top 10 Brazilian Ai rpor ts (by Cargo Volume), 2008
Minas Gerais is an inland state that is located in the south-eastern part of Brazil. Interms of economic output, it is the third largest, after Sao Paulo and Rio de J aneiro.In 2006, the state has a Gross Regional Domestic Product (GRDP) of R$215 billion
or approximately 9% of Brazil’s Gross Domestic Product (GDP).1
The share of Minas Gerais’ GRDP to Brazil’s GDP was only a 2.5 percentage point lower than thatof Rio de J aneiro.
1 In 2007, Minas Gerais has a GRDP of R$236.9 billion. Due to the need for comparison and the lack relevantdata for the other states, the 2006 numbers were used instead.
G R U
V C P
M A O
G I G
S S A
R E C
B S B
C N F
F O R
C W B
Source: Infraero
GRU – Guarulhos REC – Recife
VCP – Viracopos BSB - Brasilia
MAO – Manaus CNF – AITN
GIG – Galeao FOR - Fortaleza
SSA -Salvador CWB – Afonso Pena
7/29/2019 Master Plan Confins
http://slidepdf.com/reader/full/master-plan-confins 10/53
Airpor t Consultancy Report fo r Tancred o Neves Internat ional Air port (AITN)
© Changi Airpor t Consult ants (Company Registratio n No. 200507762K). All right s reserved. Page 4
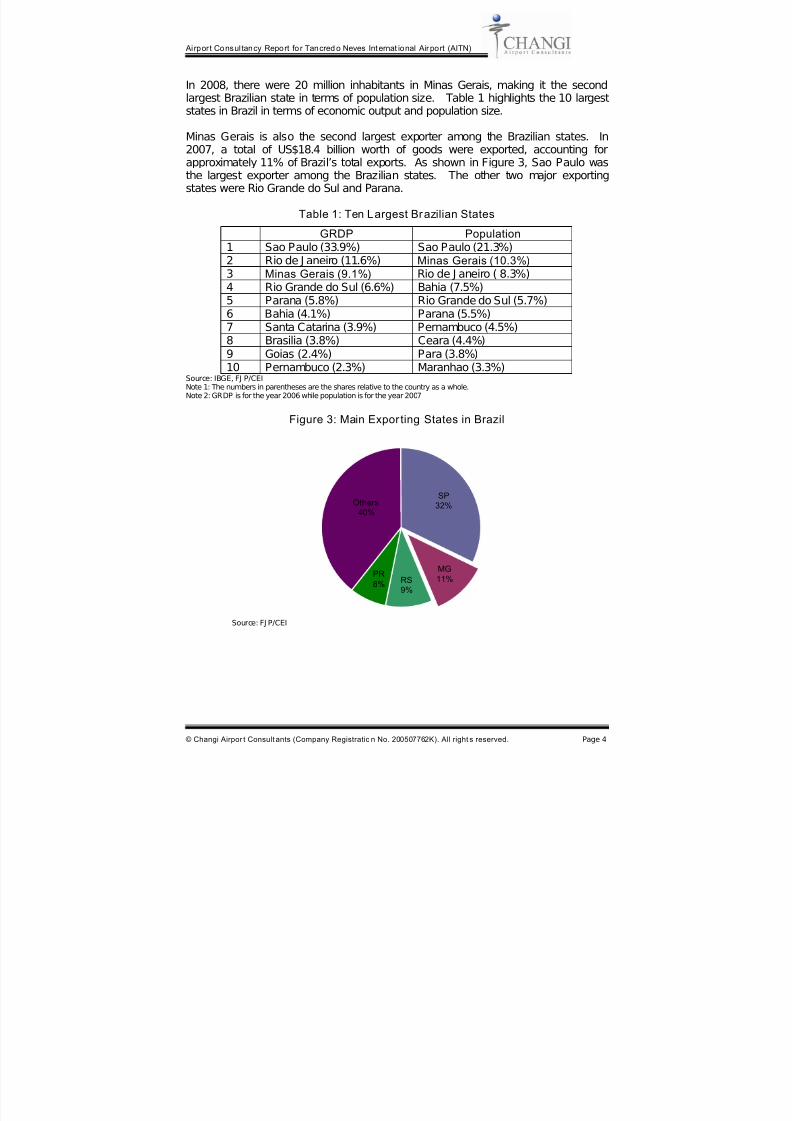
In 2008, there were 20 million inhabitants in Minas Gerais, making it the secondlargest Brazilian state in terms of population size. Table 1 highlights the 10 largeststates in Brazil in terms of economic output and population size.
Minas Gerais is also the second largest exporter among the Brazilian states. In
2007, a total of US$18.4 billion worth of goods were exported, accounting forapproximately 11% of Brazil’s total exports. As shown in Figure 3, Sao Paulo wasthe largest exporter among the Brazilian states. The other two major exportingstates were Rio Grande do Sul and Parana.
Table 1: Ten Largest Brazilian States
GRDP Population1 Sao Paulo (33.9%) Sao Paulo (21.3%)2 Rio de J aneiro (11.6%) Minas Gerais (10.3%)3 Minas Gerais (9.1%) Rio de J aneiro ( 8.3%)4 Rio Grande do Sul (6.6%) Bahia (7.5%)
5 Parana (5.8%) Rio Grande do Sul (5.7%)6 Bahia (4.1%) Parana (5.5%)7 Santa Catarina (3.9%) Pernambuco (4.5%)8 Brasilia (3.8%) Ceara (4.4%)9 Goias (2.4%) Para (3.8%)10 Pernambuco (2.3%) Maranhao (3.3%)
Source: IBGE, FJ P/CEINote 1: The numbers in parentheses are the shares relative to the country as a whole.Note 2: GRDP is for the year 2006 while population is for the year 2007
Figure 3: Main Expor ting States in Brazil
Others40%
PR8% RS
9%
MG11%
SP32%
Source: FJ P/CEI
7/29/2019 Master Plan Confins
http://slidepdf.com/reader/full/master-plan-confins 11/53
Airpor t Consultancy Report fo r Tancred o Neves Internat ional Air port (AITN)
© Changi Airpor t Consult ants (Company Registratio n No. 200507762K). All right s reserved. Page 5
Using the state’s economic and demographic indicators as a basis of comparison,the current ranking of AITN as the sixth and eighth largest Brazilian airport in termsof passenger traffic and cargo volume respectively seems a bit low. In addition, theimplementation of the strategic growth plan for the BHMR multimodal corridor hubtogether with the other economic development initiatives would place the state on a
sustainable economic development growth path. This will have positive impact onthe growth of AITN. In view of all these positive economic development in MinasGerais, there is a great potential for AITN to assume a more important position in theaviation sector in Brazil. Thus, AITN should set its vision to become the third largestairport in terms of passenger throughput and the second largest airport in terms of cargo volume.
In the remaining sections, the report will, through its analysis, identify the factors thathave been holding back the development of AITN and some recommendations toovercome these impediments. The strategic initiatives for AITN to achieve its visionare presented. The focus of the analysis and recommendations is on AITN.However, at the request of SEDE, the strategic positioning of Pampulha Airport (PLU)
and Carlos Prates Airport will also be reviewed.
2. OPERATING ENVIRONMENT ASSESSMENT
Air travel is a derived demand. Although there are many reasons why people travel,the purpose of travelling can be broadly classified into three categories namelyleisure, business and visiting friends and relatives (VFR). Regardless of the purposeof travel, the environment the airport is operating in has an influence on the growth of the airport.
Through the analysis of the operating environment, one is able to pin-point thestrengths and weaknesses of the airport and at the same time identify theopportunities and threats that the airport faces. With a good understanding of theoperating environment, a strategy can be devised to capitalise on the strengths andto rectify the weaknesses of the airport. Furthermore, the devised strategy shouldalso allow the airport to seize opportunities and to deflect potential threats it is facing.
2.1. Analysis Framework
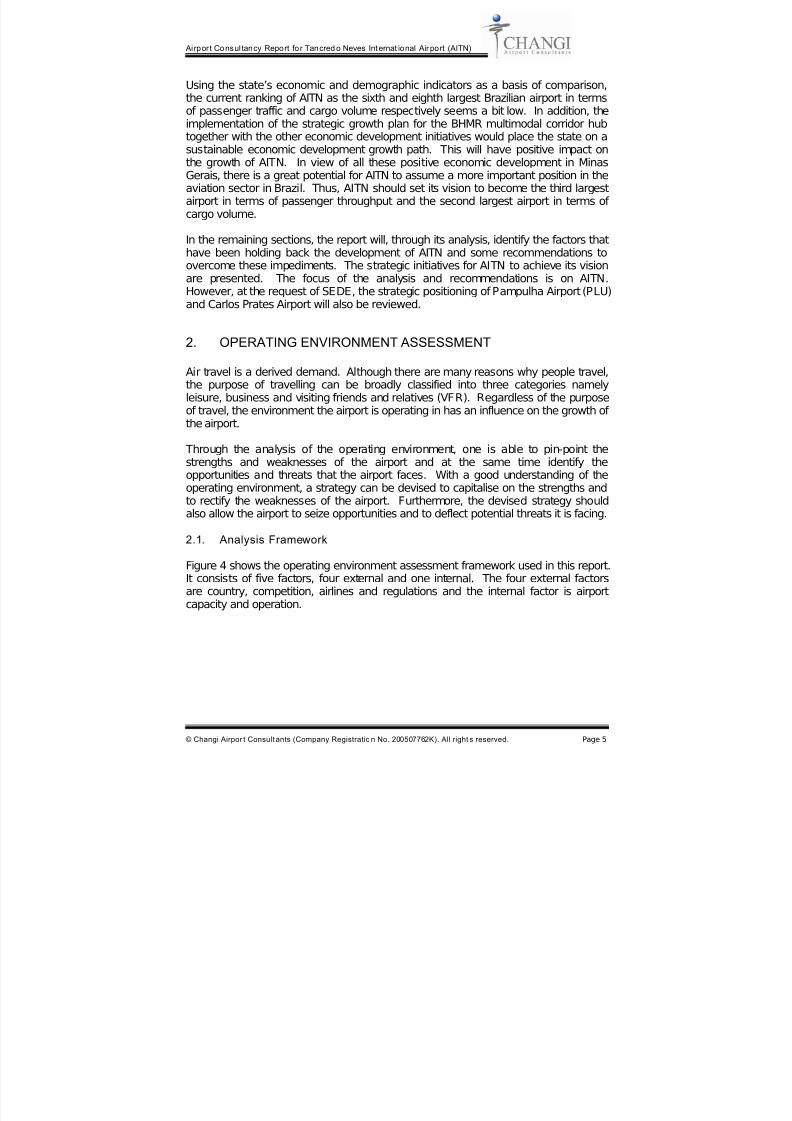
Figure 4 shows the operating environment assessment framework used in this report.It consists of five factors, four external and one internal. The four external factorsare country, competition, airlines and regulations and the internal factor is airport
capacity and operation.
7/29/2019 Master Plan Confins
http://slidepdf.com/reader/full/master-plan-confins 12/53
Airpor t Consultancy Report fo r Tancred o Neves Internat ional Air port (AITN)
© Changi Airpor t Consult ants (Company Registratio n No. 200507762K). All right s reserved. Page 6
Figure 4: Operating Environment Assessment Framework
AirportCapacity
and
Operation
A i r l i n
e
F a c t o
rR e g u l a t i o n s
C o
m p e t i t i o n C o u
n t r y
F a c t o r
AirportCapacity
and
Operation
A i r l i n
e
F a c t o
rR e g u l a t i o n s
C o
m p e t i t i o n C o u
n t r y
F a c t o r
2.1.1. Global Aviation Outlook
With the world still suffering from the aftermath of the economic crisis that originatedfrom the United States (USA), growth of the global economy is expected to remainsluggish for the coming years. According to EIU, real GDP of USA and WesternEurope are forecast to grow at a Compound Annual Growth Rate (CAGR) of 1.3%and 0.9% respectively between 2009 and 2013. This will have a negative impact onthe demand for air services in the country.
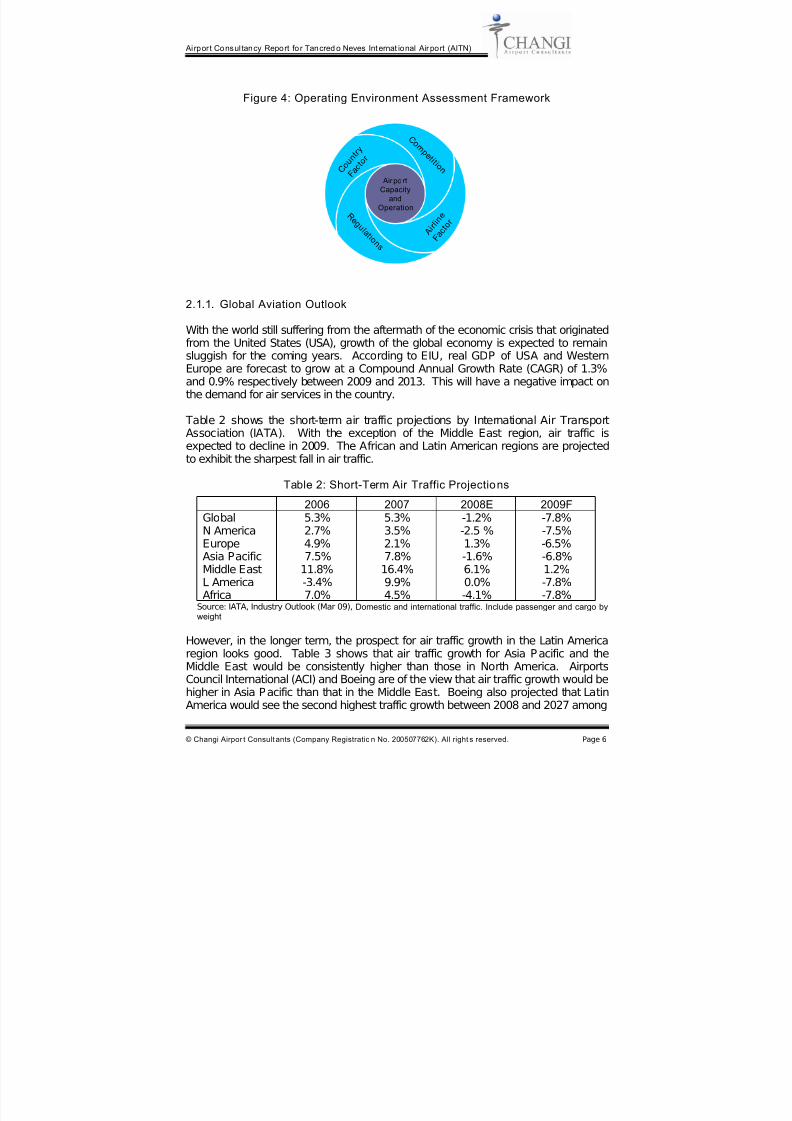
Table 2 shows the short-term air traffic projections by International Air TransportAssociation (IATA). With the exception of the Middle East region, air traffic isexpected to decline in 2009. The African and Latin American regions are projectedto exhibit the sharpest fall in air traffic.
Table 2: Short-Term Air Traffic Projections
2006 2007 2008E 2009FGlobal 5.3% 5.3% -1.2% -7.8%N America 2.7% 3.5% -2.5 % -7.5%Europe 4.9% 2.1% 1.3% -6.5%Asia Pacific 7.5% 7.8% -1.6% -6.8%Middle East 11.8% 16.4% 6.1% 1.2%L America -3.4% 9.9% 0.0% -7.8%Africa 7.0% 4.5% -4.1% -7.8%
Source: IATA, Industry Outlook (Mar 09), Domestic and international traffic. Include passenger and cargo byweight
However, in the longer term, the prospect for air traffic growth in the Latin Americaregion looks good. Table 3 shows that air traffic growth for Asia Pacific and theMiddle East would be consistently higher than those in North America. AirportsCouncil International (ACI) and Boeing are of the view that air traffic growth would behigher in Asia Pacific than that in the Middle East. Boeing also projected that LatinAmerica would see the second highest traffic growth between 2008 and 2027 among
7/29/2019 Master Plan Confins
http://slidepdf.com/reader/full/master-plan-confins 13/53
Airpor t Consultancy Report fo r Tancred o Neves Internat ional Air port (AITN)
© Changi Airpor t Consult ants (Company Registratio n No. 200507762K). All right s reserved. Page 7
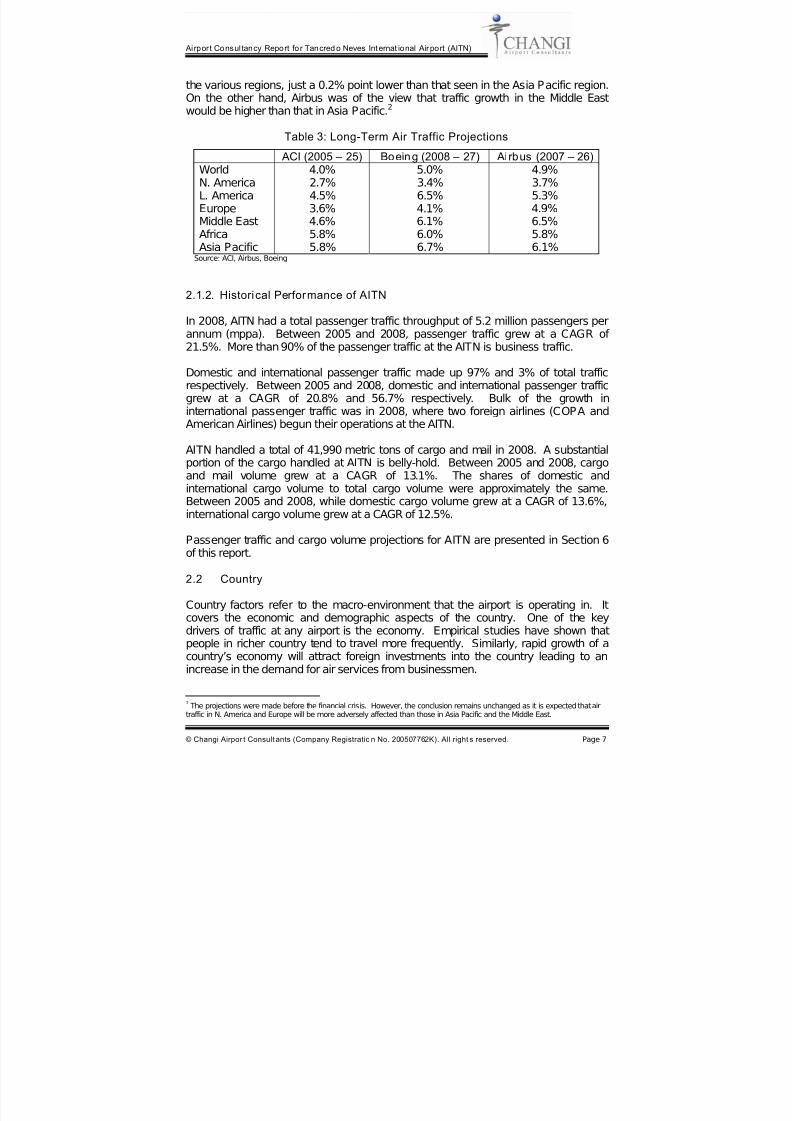
the various regions, just a 0.2% point lower than that seen in the Asia Pacific region.On the other hand, Airbus was of the view that traffic growth in the Middle Eastwould be higher than that in Asia Pacific.2
Table 3: Long-Term Air Traffic Projections
ACI (2005 – 25) Boeing (2008 – 27) Ai rbus (2007 – 26)World 4.0% 5.0% 4.9%N. America 2.7% 3.4% 3.7%L. America 4.5% 6.5% 5.3%Europe 3.6% 4.1% 4.9%Middle East 4.6% 6.1% 6.5%Africa 5.8% 6.0% 5.8%Asia Pacific 5.8% 6.7% 6.1%
Source: ACI, Airbus, Boeing
2.1.2. Historical Performance of AITN
In 2008, AITN had a total passenger traffic throughput of 5.2 million passengers perannum (mppa). Between 2005 and 2008, passenger traffic grew at a CAGR of 21.5%. More than 90% of the passenger traffic at the AITN is business traffic.
Domestic and international passenger traffic made up 97% and 3% of total trafficrespectively. Between 2005 and 2008, domestic and international passenger trafficgrew at a CAGR of 20.8% and 56.7% respectively. Bulk of the growth ininternational passenger traffic was in 2008, where two foreign airlines (COPA andAmerican Airlines) begun their operations at the AITN.
AITN handled a total of 41,990 metric tons of cargo and mail in 2008. A substantialportion of the cargo handled at AITN is belly-hold. Between 2005 and 2008, cargoand mail volume grew at a CAGR of 13.1%. The shares of domestic andinternational cargo volume to total cargo volume were approximately the same.Between 2005 and 2008, while domestic cargo volume grew at a CAGR of 13.6%,international cargo volume grew at a CAGR of 12.5%.
Passenger traffic and cargo volume projections for AITN are presented in Section 6of this report.
2.2 Country
Country factors refer to the macro-environment that the airport is operating in. Itcovers the economic and demographic aspects of the country. One of the keydrivers of traffic at any airport is the economy. Empirical studies have shown thatpeople in richer country tend to travel more frequently. Similarly, rapid growth of acountry’s economy will attract foreign investments into the country leading to anincrease in the demand for air services from businessmen.
2 The projections were made before the financial crisis. However, the conclusion remains unchanged as it is expected that airtraffic in N. America and Europe will be more adversely affected than those in Asia Pacific and the Middle East.
7/29/2019 Master Plan Confins
http://slidepdf.com/reader/full/master-plan-confins 14/53
Airpor t Consultancy Report fo r Tancred o Neves Internat ional Air port (AITN)
© Changi Airpor t Consult ants (Company Registratio n No. 200507762K). All right s reserved. Page 8
Besides passenger traffic, the state of the economy will also have an influence onthe volume of air cargo handled by the airports. On the one hand, the demand forforeign goods will increase due to the increase in the level of income of the people.On the other, overseas demand for goods produced in the country is also expectedto increase. Furthermore, as the country develops, the goods that are manufactured
will have a higher skills component. This could tilt in the favour of air cargo sincethese types of products are more likely to be air freighted than shipped.
The economic performance of the country is only one side of the coin. How theglobal economy performs will also have an impact on the country’s air traffic growth.With a stronger global economy, people are more willing to travel for leisure. Theamount of business travel will also be higher.
The population size of the country can also affect the traffic growth of the airport. The growth of the population will translate into bigger catchment area for that region.However, a bigger catchment area is only part of the equation. If the averageincome level of the people in that region is still relatively low, then a bigger
catchment area may not necessarily translate into higher demand for air services.
Another important factor is the attractiveness of the country as a tourist destination,both for leisure and business. If the country has plenty to offer to its tourists, thedemand for air services will also increase in tandem. The cost of travel to thecountry and within the country is another factor to be considered.
2.2.1. Socio-Economic Prospects of Brazil and Minas Gerais
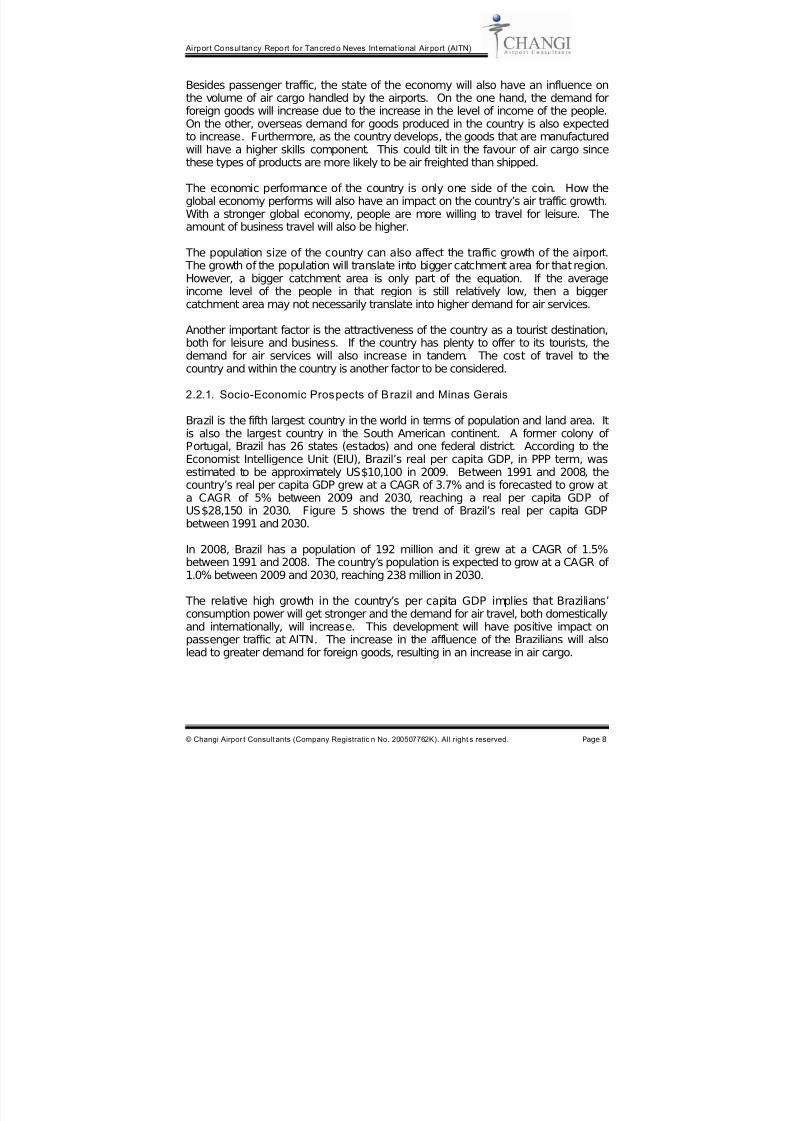
Brazil is the fifth largest country in the world in terms of population and land area. Itis also the largest country in the South American continent. A former colony of Portugal, Brazil has 26 states (estados) and one federal district. According to theEconomist Intelligence Unit (EIU), Brazil’s real per capita GDP, in PPP term, wasestimated to be approximately US$10,100 in 2009. Between 1991 and 2008, thecountry’s real per capita GDP grew at a CAGR of 3.7% and is forecasted to grow ata CAGR of 5% between 2009 and 2030, reaching a real per capita GDP of US$28,150 in 2030. Figure 5 shows the trend of Brazil’s real per capita GDPbetween 1991 and 2030.
In 2008, Brazil has a population of 192 million and it grew at a CAGR of 1.5%between 1991 and 2008. The country’s population is expected to grow at a CAGR of 1.0% between 2009 and 2030, reaching 238 million in 2030.
The relative high growth in the country’s per capita GDP implies that Brazilians’consumption power will get stronger and the demand for air travel, both domesticallyand internationally, will increase. This development will have positive impact onpassenger traffic at AITN. The increase in the affluence of the Brazilians will alsolead to greater demand for foreign goods, resulting in an increase in air cargo.
7/29/2019 Master Plan Confins
http://slidepdf.com/reader/full/master-plan-confins 15/53
Airpor t Consultancy Report fo r Tancred o Neves Internat ional Air port (AITN)
© Changi Airpor t Consult ants (Company Registratio n No. 200507762K). All right s reserved. Page 9
Figure 5: Brazil’s Real per capita GDP (US$ PPP), 1991 - 2030
1 9 9 1
1 9 9 3
1 9 9 5
1 9 9 7
1 9 9 9
2 0 0 1
2 0 0 3
2 0 0 5
2 0 0 7
2 0 0 9
2 0 1 1
2 0 1 3
2 0 1 5
2 0 1 7
2 0 1 9
2 0 2 1
2 0 2 3
2 0 2 5
2 0 2 7
2 0 2 9
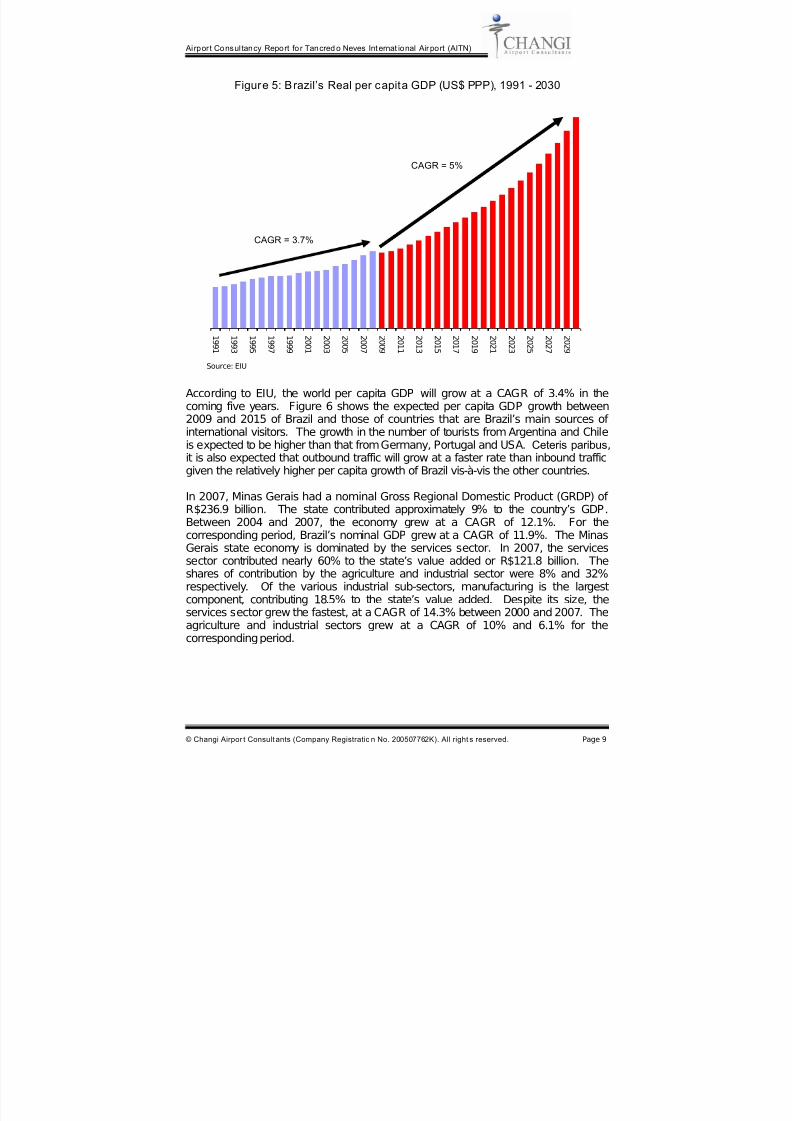
According to EIU, the world per capita GDP will grow at a CAGR of 3.4% in thecoming five years. Figure 6 shows the expected per capita GDP growth between2009 and 2015 of Brazil and those of countries that are Brazil’s main sources of international visitors. The growth in the number of tourists from Argentina and Chileis expected to be higher than that from Germany, Portugal and USA. Ceteris paribus,
it is also expected that outbound traffic will grow at a faster rate than inbound trafficgiven the relatively higher per capita growth of Brazil vis-à-vis the other countries.
In 2007, Minas Gerais had a nominal Gross Regional Domestic Product (GRDP) of R$236.9 billion. The state contributed approximately 9% to the country’s GDP.Between 2004 and 2007, the economy grew at a CAGR of 12.1%. For thecorresponding period, Brazil’s nominal GDP grew at a CAGR of 11.9%. The MinasGerais state economy is dominated by the services sector. In 2007, the servicessector contributed nearly 60% to the state’s value added or R$121.8 billion. Theshares of contribution by the agriculture and industrial sector were 8% and 32%respectively. Of the various industrial sub-sectors, manufacturing is the largestcomponent, contributing 18.5% to the state’s value added. Despite its size, theservices sector grew the fastest, at a CAGR of 14.3% between 2000 and 2007. Theagriculture and industrial sectors grew at a CAGR of 10% and 6.1% for thecorresponding period.
Source: EIU
CAGR = 3.7%
CAGR = 5%
7/29/2019 Master Plan Confins
http://slidepdf.com/reader/full/master-plan-confins 16/53
Airpor t Consultancy Report fo r Tancred o Neves Internat ional Air port (AITN)
© Changi Airpor t Consult ants (Company Registratio n No. 200507762K). All right s reserved. Page 10
Figure 6: Comparison of Real per capita GDP Growth, 2009 - 15
4.1
3.93.8
2.6
2.4 2.4
Brazil Chile Argentina Germany Portugal USA
Between 2000 and 2007, the state’s population grew at a CAGR of 1.4%, which wasslightly below the country’s average of 1.6%. The nominal GRDP per capita wasR$11,985 and it grew at a CAGR of 8.7% between 2004 and 2007. For thecorresponding period, Brazil nominal per capita GDP grew at a CAGR of 8.7% and
was R$13,720 in 2007. Assuming that the per capita GRDP of Minas Geraiscontinues to grow at the same rate as that of the country’s as a whole. It’s projectedCAGR between 2009 and 2020 is approximately 6.3%. However, this is aconservative view. The various economic development initiatives will boost thegrowth of the economy and thus the income level of the people in Minas Gerais. These include the J aiba Project, Technology Park and Industrial Airport and theBHMR Multimodal Corridor Hub. As most of the industrial clusters are highly skilledindustries, the wages earned by the inhabitants in the BHMR Multimodal CorridorHub are expected to be higher than those in other parts of Minas Gerais.
2.2.2. Tourism Potential
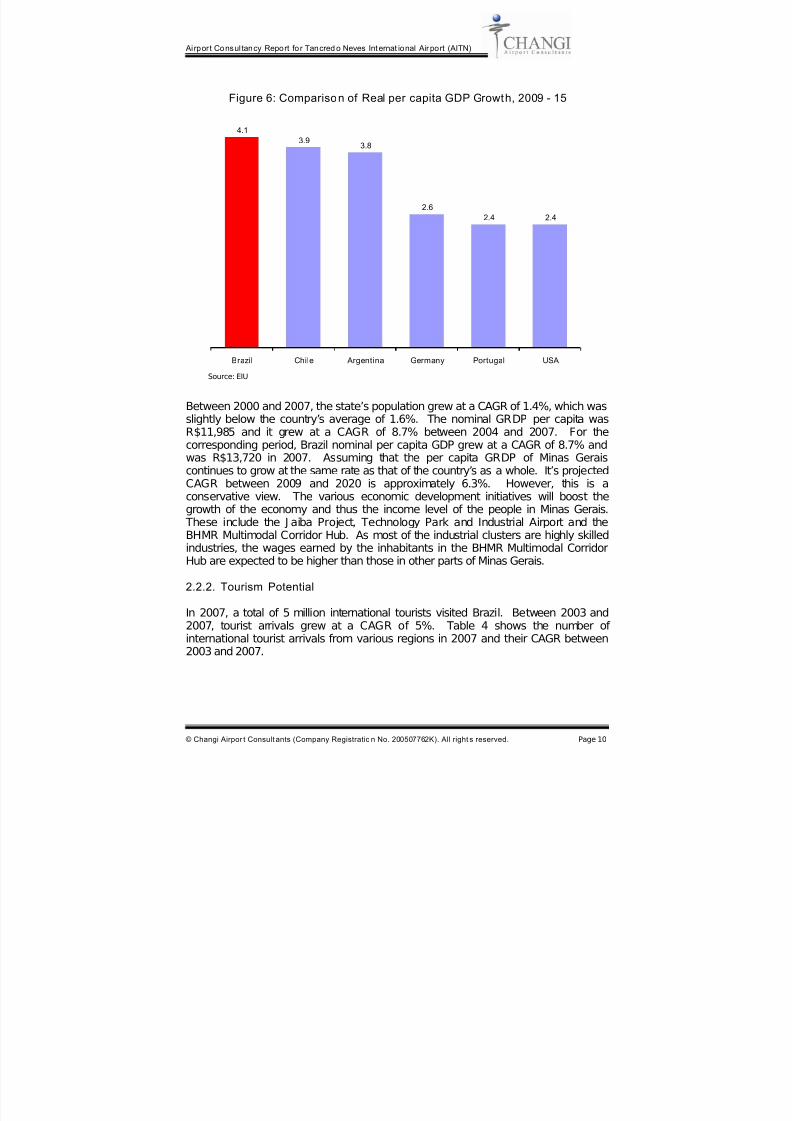
In 2007, a total of 5 million international tourists visited Brazil. Between 2003 and2007, tourist arrivals grew at a CAGR of 5%. Table 4 shows the number of international tourist arrivals from various regions in 2007 and their CAGR between2003 and 2007.
Source: EIU
7/29/2019 Master Plan Confins
http://slidepdf.com/reader/full/master-plan-confins 17/53
Airpor t Consultancy Report fo r Tancred o Neves Internat ional Air port (AITN)
© Changi Airpor t Consult ants (Company Registratio n No. 200507762K). All right s reserved. Page 11
The two main sources of tourist arrivals were South America and Europe. Eachcontributed 38% to total tourist arrivals in Brazil. Among the South Americancountries, Argentina was the main source of tourist arrivals into Brazil, accounting fornearly 50% of tourist arrivals from South America. The next largest source of tourists was Chile, which accounted for 14% of the South American tourists. On the
other hand, the origins of international tourist arrivals from Europe are morediversified. The top five sources were Portugal (14.7% of European tourists), Italy(14.1%), Germany (13.5%), France (13.3%), and Spain (11.4%).
Table 4: International Tourist Arrivals by Region
Source: Brazil’s Ministry of Tourism, numbers in parenthesis are share of tourist arrivals
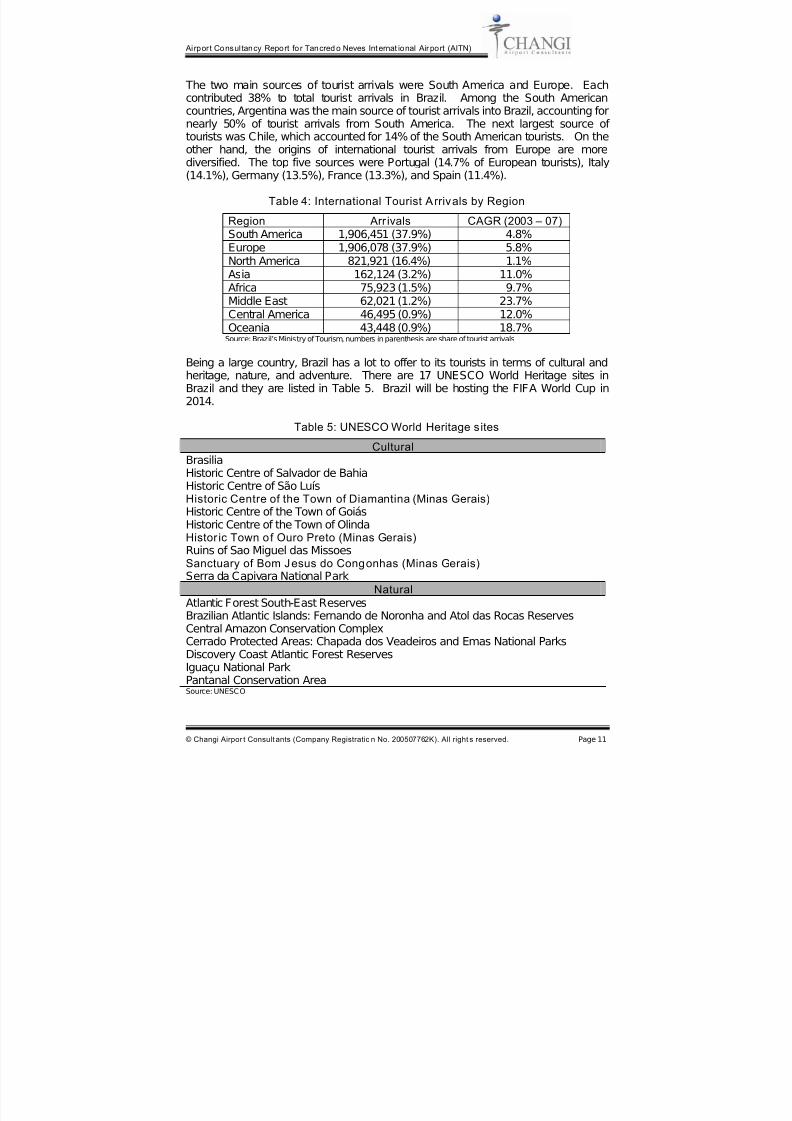
Being a large country, Brazil has a lot to offer to its tourists in terms of cultural andheritage, nature, and adventure. There are 17 UNESCO World Heritage sites inBrazil and they are listed in Table 5. Brazil will be hosting the FIFA World Cup in2014.
Table 5: UNESCO World Heritage sites
CulturalBrasiliaHistoric Centre of Salvador de BahiaHistoric Centre of São LuísHistoric Centre of the Town of Diamantina (Minas Gerais) Historic Centre of the Town of GoiásHistoric Centre of the Town of OlindaHistor ic Town of Ouro Preto (Minas Gerais)Ruins of Sao Miguel das MissoesSanctuary of Bom Jesus do Congonhas (Minas Gerais)Serra da Capivara National Park
Natural
Atlantic Forest South-East ReservesBrazilian Atlantic Islands: Fernando de Noronha and Atol das Rocas ReservesCentral Amazon Conservation ComplexCerrado Protected Areas: Chapada dos Veadeiros and Emas National ParksDiscovery Coast Atlantic Forest ReservesIguaçu National ParkPantanal Conservation AreaSource: UNESCO
Region Arr ivals CAGR (2003 – 07)South America 1,906,451 (37.9%) 4.8%Europe 1,906,078 (37.9%) 5.8%North America 821,921 (16.4%) 1.1%Asia 162,124 (3.2%) 11.0%Africa 75,923 (1.5%) 9.7%
Middle East 62,021 (1.2%) 23.7%Central America 46,495 (0.9%) 12.0%Oceania 43,448 (0.9%) 18.7%
7/29/2019 Master Plan Confins
http://slidepdf.com/reader/full/master-plan-confins 18/53
Airpor t Consultancy Report fo r Tancred o Neves Internat ional Air port (AITN)
© Changi Airpor t Consult ants (Company Registratio n No. 200507762K). All right s reserved. Page 12
The two main tourism themes of Minas Gerais are nature and historic sites. Thestate has more than 10 nature reserves that could be used to promote eco-tourism.Minas Gerais also has one of the largest numbers of UNESCO-registered WorldHeritage sites in Brazil. Of the 17 sites, three are in Minas Gerais.
One of the most popular activities among the European tourists is to trace the “RoyalRoad” (Estrada Real). Formed by the routes of the first trails blazed by colonizerstowards the end of the 17th century, the “Royal Road” passes through various touristcircuits, especially the Gold Circuit which runs through the main historic cities linkedto the extraction of minerals and precious stones in the 18th century, like Ouro Preto,Mariana, and Diamantina.
Business tourism is also being promoted in Minas Gerais. According to the officialsfrom the State Secretariat for Tourism, there were 45 venues for exhibitions andconventions. In 2006, the Inter-American Development Bank held its annual meetingin Belo Horizonte. Minas Gerais is one of the hosting states for the FIFA World Cupin 2014.
The tourism sector in Minas Gerais will be given a boost as it is one of the sevenchosen industrial clusters in the BHMR Multimodal Corridor Hub. Specifically, threefocus areas: business, leisure and medical tourism are identified. Besides,contributing to the growth of the Minas Gerais’ economy, this sector will also be amajor contributor to the passenger traffic at AITN. However, the success of thissector is also dependent on AITN. Poor connectivity and inefficient operation atAITN will act as barriers for potential tourists to visit Minas Gerais. Even withfantastic tourist offerings, they would not be translated into actual tourist numbersand receipts when the tourists are not able to reach Minas Gerais due to poorconnectivity at the airport or unwilling to use the airport due to its poor service.
The other industrial cluster that is expected to have an impact on the passengertraffic is the education sector. With the setting up of a full-fledged university andother educational institutes in the BHMR Multimodal Corridor Hub, there will bestudents from other Brazilian states or even from other countries in the SouthAmerican continent. This will positively affect the traffic at AITN.
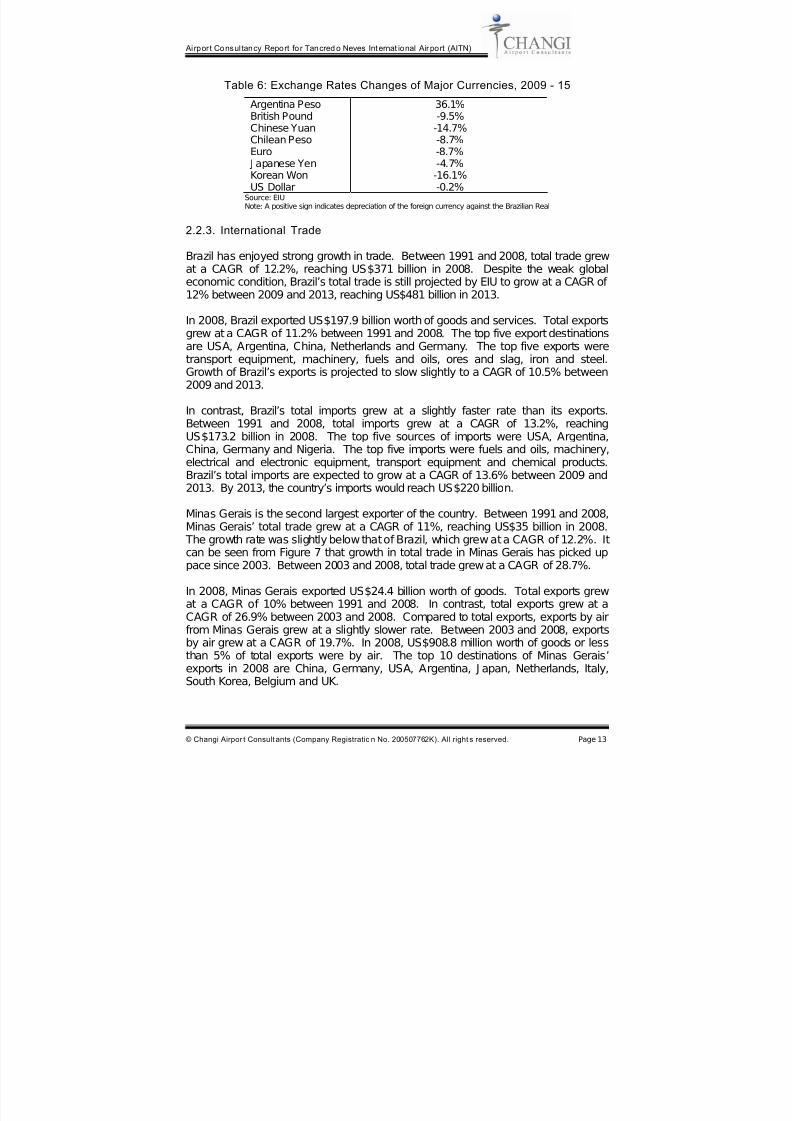
The strength of the currency will to a certain extent affect the number of touristsgoing in and out of the country, thus the passenger traffic at the airports. Table 6shows the exchange rate changes of the Brazilian Real against major currencies. The Argentine Peso is expected to depreciate against the Brazilian Real making atrip to Brazil for Argentineans comparatively more costly. On the other hand, the
strengthening of the other currencies such as Chinese Yuan, Korean Won and theEuro will make visiting Brazil a more attractive option for the citizens of thosecountries.
7/29/2019 Master Plan Confins
http://slidepdf.com/reader/full/master-plan-confins 19/53
Airpor t Consultancy Report fo r Tancred o Neves Internat ional Air port (AITN)
© Changi Airpor t Consult ants (Company Registratio n No. 200507762K). All right s reserved. Page 13
Table 6: Exchange Rates Changes of Major Currencies, 2009 - 15
Argentina Peso 36.1%British Pound -9.5%Chinese Yuan -14.7%Chilean Peso -8.7%
Euro -8.7% J apanese Yen -4.7%Korean Won -16.1%US Dollar -0.2%
Source: EIUNote: A positive sign indicates depreciation of the foreign currency against the Brazilian Real
2.2.3. International Trade
Brazil has enjoyed strong growth in trade. Between 1991 and 2008, total trade grewat a CAGR of 12.2%, reaching US$371 billion in 2008. Despite the weak globaleconomic condition, Brazil’s total trade is still projected by EIU to grow at a CAGR of 12% between 2009 and 2013, reaching US$481 billion in 2013.
In 2008, Brazil exported US$197.9 billion worth of goods and services. Total exportsgrew at a CAGR of 11.2% between 1991 and 2008. The top five export destinationsare USA, Argentina, China, Netherlands and Germany. The top five exports weretransport equipment, machinery, fuels and oils, ores and slag, iron and steel.Growth of Brazil’s exports is projected to slow slightly to a CAGR of 10.5% between2009 and 2013.
In contrast, Brazil’s total imports grew at a slightly faster rate than its exports.Between 1991 and 2008, total imports grew at a CAGR of 13.2%, reachingUS$173.2 billion in 2008. The top five sources of imports were USA, Argentina,
China, Germany and Nigeria. The top five imports were fuels and oils, machinery,electrical and electronic equipment, transport equipment and chemical products.Brazil’s total imports are expected to grow at a CAGR of 13.6% between 2009 and2013. By 2013, the country’s imports would reach US$220 billion.
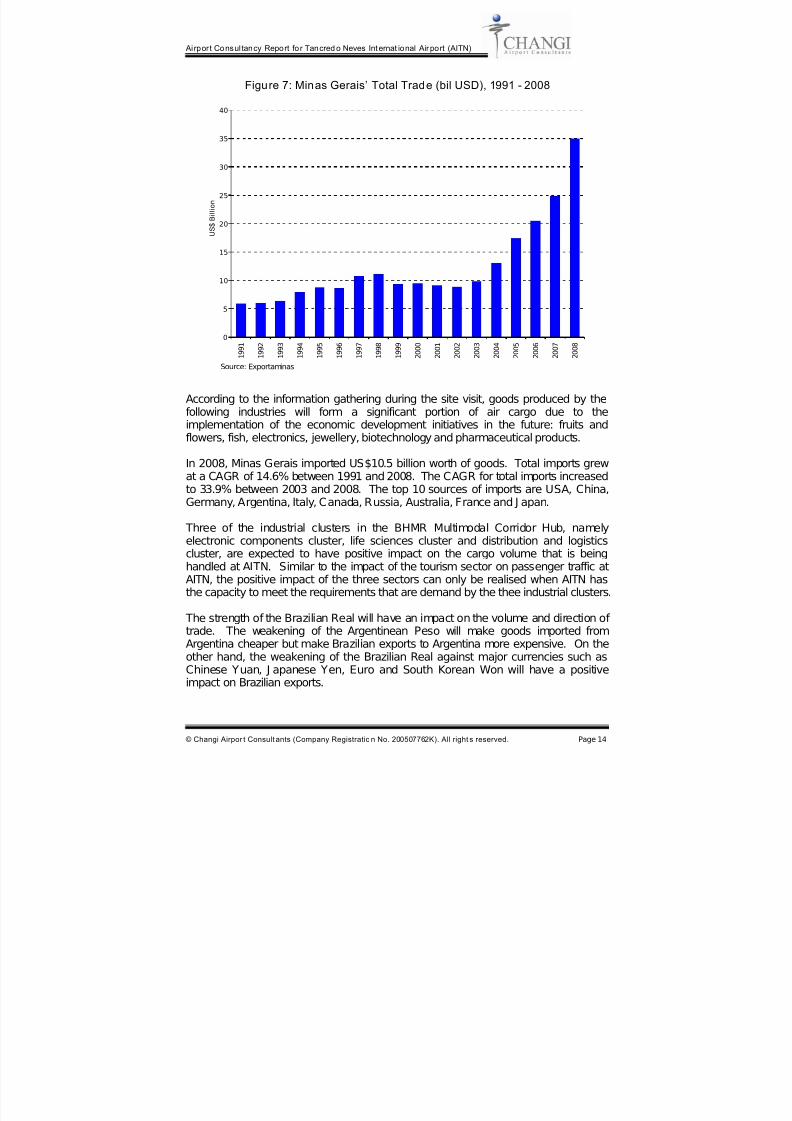
Minas Gerais is the second largest exporter of the country. Between 1991 and 2008,Minas Gerais’ total trade grew at a CAGR of 11%, reaching US$35 billion in 2008. The growth rate was slightly below that of Brazil, which grew at a CAGR of 12.2%. Itcan be seen from Figure 7 that growth in total trade in Minas Gerais has picked uppace since 2003. Between 2003 and 2008, total trade grew at a CAGR of 28.7%.
In 2008, Minas Gerais exported US$24.4 billion worth of goods. Total exports grew
at a CAGR of 10% between 1991 and 2008. In contrast, total exports grew at aCAGR of 26.9% between 2003 and 2008. Compared to total exports, exports by airfrom Minas Gerais grew at a slightly slower rate. Between 2003 and 2008, exportsby air grew at a CAGR of 19.7%. In 2008, US$908.8 million worth of goods or lessthan 5% of total exports were by air. The top 10 destinations of Minas Gerais’exports in 2008 are China, Germany, USA, Argentina, J apan, Netherlands, Italy,South Korea, Belgium and UK.
7/29/2019 Master Plan Confins
http://slidepdf.com/reader/full/master-plan-confins 20/53
Airpor t Consultancy Report fo r Tancred o Neves Internat ional Air port (AITN)
© Changi Airpor t Consult ants (Company Registratio n No. 200507762K). All right s reserved. Page 14
Figure 7: Minas Gerais’ Total Trade (bil USD), 1991 - 2008
0
5
10
15
20
25
30
35
40
1 9 9 1
1 9 9 2
1 9 9 3
1 9 9 4
1 9 9 5
1 9 9 6
1 9 9 7
1 9 9 8
1 9 9 9
2 0 0 0
2 0 0 1
2 0 0 2
2 0 0 3
2 0 0 4
2 0 0 5
2 0 0 6
2 0 0 7
2 0 0 8
U S $ B i l l i o n
According to the information gathering during the site visit, goods produced by thefollowing industries will form a significant portion of air cargo due to theimplementation of the economic development initiatives in the future: fruits andflowers, fish, electronics, jewellery, biotechnology and pharmaceutical products.
In 2008, Minas Gerais imported US$10.5 billion worth of goods. Total imports grewat a CAGR of 14.6% between 1991 and 2008. The CAGR for total imports increasedto 33.9% between 2003 and 2008. The top 10 sources of imports are USA, China,Germany, Argentina, Italy, Canada, Russia, Australia, France and J apan.
Three of the industrial clusters in the BHMR Multimodal Corridor Hub, namelyelectronic components cluster, life sciences cluster and distribution and logisticscluster, are expected to have positive impact on the cargo volume that is beinghandled at AITN. Similar to the impact of the tourism sector on passenger traffic atAITN, the positive impact of the three sectors can only be realised when AITN hasthe capacity to meet the requirements that are demand by the thee industrial clusters.
The strength of the Brazilian Real will have an impact on the volume and direction of trade. The weakening of the Argentinean Peso will make goods imported fromArgentina cheaper but make Brazilian exports to Argentina more expensive. On theother hand, the weakening of the Brazilian Real against major currencies such asChinese Yuan, J apanese Yen, Euro and South Korean Won will have a positiveimpact on Brazilian exports.
Source: Exportaminas
7/29/2019 Master Plan Confins
http://slidepdf.com/reader/full/master-plan-confins 21/53
Airpor t Consultancy Report fo r Tancred o Neves Internat ional Air port (AITN)
© Changi Airpor t Consult ants (Company Registratio n No. 200507762K). All right s reserved. Page 15
2.3. Competition
Competition is another important factor to be considered when evaluating theoperating environment of the airport. There are three levels of competition.Competition can be at the country level, at the state level and at the airport level. At
the country level, countries compete for foreign investments and tourists. Theattractiveness of the country as a Foreign Direct Investment (FDI) and touristdestination will influence the number of tourists (business and leisure) and cargohandled by the airports in the country.
This kind of competition can also be seen among different states of the same country. This is especially true for the competition for FDI and business tourists. On the otherhand, the case for leisure tourists is not that clear cut. States could compete orcooperate with each other to sell their destinations to visitors.
Lastly, there is competition between airports for traffic. The closer the two airportsare to each other, the keener the competition. Furthermore, if the country is well-
connected by land transport, the effect of competition between two airports will bemagnified. For example, if the land transport between AITN and GIG is welldeveloped, then foreign tourists that fly into GIG will just take the land transport toget to Belo Horizonte. This is to the detriment of AITN. On the other hand, it will beto the detriment of GIG if foreign tourists choose to fly into AITN and take the landtransport to go to Rio de J aneiro. Given that the connectivity at GIG is better thanthat at AITN, the former scenario is more likely to occur.
Conversely, foreign tourists that fly into GIG will have to take a domestic flight to goto Belo Horizonte if the land transport between the two cities is not well developed.In such a scenario, the total number of passengers will remain the same. However,there will be a difference in the classification of passengers, i.e. from internationalpassengers to domestic passengers. This change in the mix of passengers will havean impact on the revenue earned by AITN.
2.3.1. Country-level Competit ion
Countries compete for tourists and foreign investments. There are many factors thatinfluence the decision of an individual to visit a country. These include the coststaying in the country and the time and cost of travelling to the country, the numberand type of tourist offerings the country has vis-à-vis another country and the safetylevel of the country.
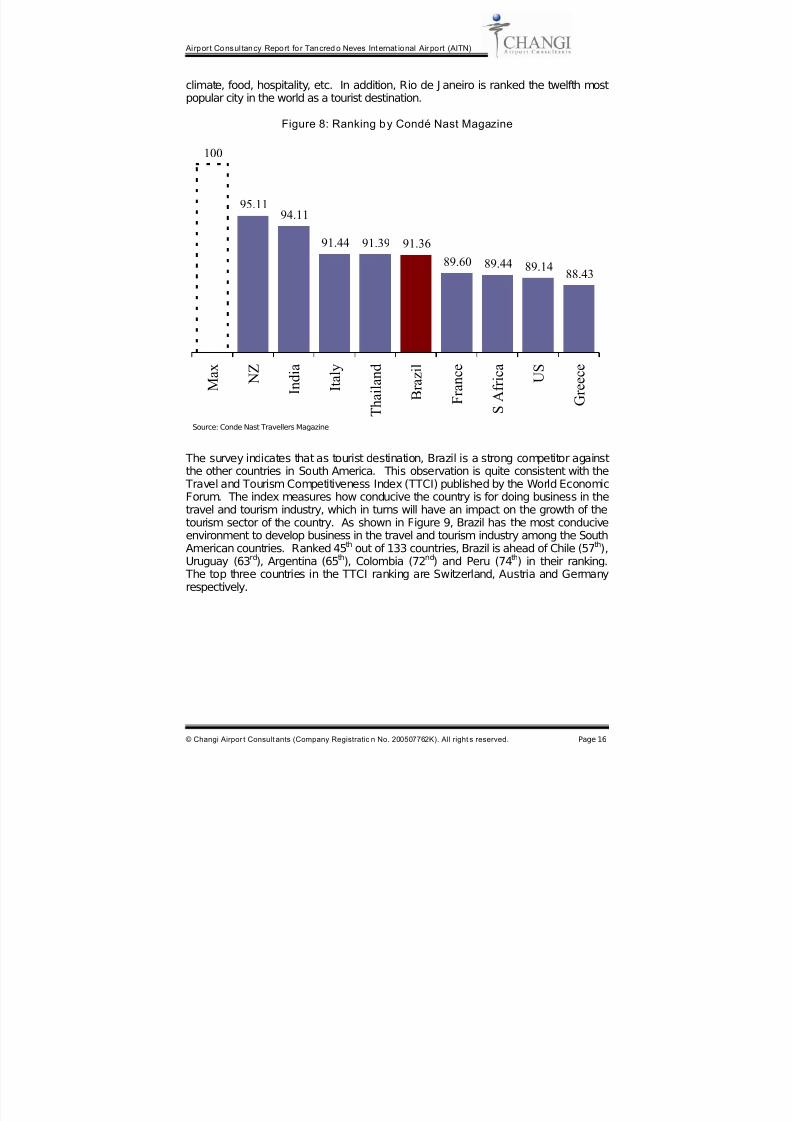
According to the World Tourism Organisation, Brazil is the main tourist destinationamong the South American countries and is the second largest destination afterMexico in the Latin American region. Figure 8 shows the ranking of top touristdestinations by travellers’ magazine Condé Nast. In the survey, Brazil is ranked thefifth most popular tourist destination, behind New Zealand, India, Italy and Thailand.None of the other South American countries is on the top 10 list. The indexmeasures how satisfied tourists are with the country’s travel facilities and services.Several criteria were used. These include value for money, cultural offerings,
7/29/2019 Master Plan Confins
http://slidepdf.com/reader/full/master-plan-confins 22/53
Airpor t Consultancy Report fo r Tancred o Neves Internat ional Air port (AITN)
© Changi Airpor t Consult ants (Company Registratio n No. 200507762K). All right s reserved. Page 16
climate, food, hospitality, etc. In addition, Rio de J aneiro is ranked the twelfth mostpopular city in the world as a tourist destination.
Figure 8: Ranking by Condé Nast Magazine
95.1194.11
91.44 91.39 91.36
89.60 89.44 89.1488.43
100
M a x
N Z
I n d i a
I t a l y
T h a i l a n d
B r a z i l
F r a n c e
S A f r i c a
U S
G r e e c e
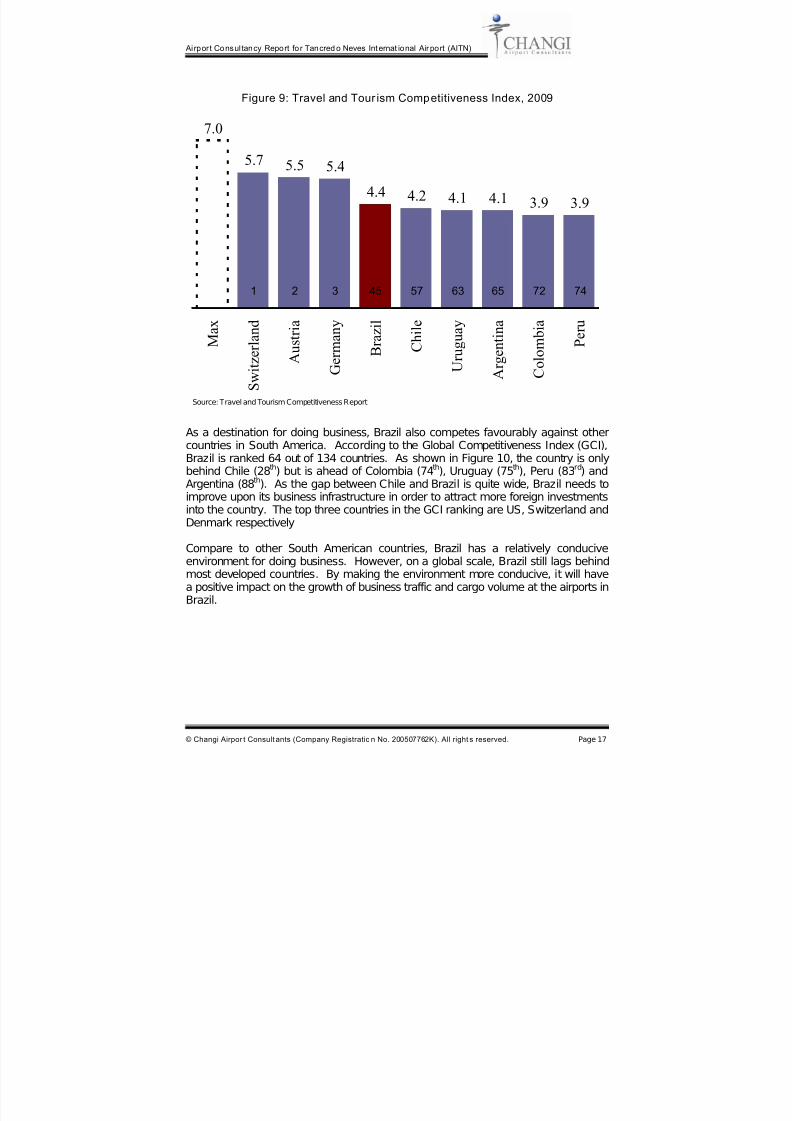
The survey indicates that as tourist destination, Brazil is a strong competitor againstthe other countries in South America. This observation is quite consistent with the Travel and Tourism Competitiveness Index (TTCI) published by the World EconomicForum. The index measures how conducive the country is for doing business in thetravel and tourism industry, which in turns will have an impact on the growth of thetourism sector of the country. As shown in Figure 9, Brazil has the most conduciveenvironment to develop business in the travel and tourism industry among the SouthAmerican countries. Ranked 45th out of 133 countries, Brazil is ahead of Chile (57th),Uruguay (63rd), Argentina (65th), Colombia (72nd) and Peru (74th) in their ranking. The top three countries in the TTCI ranking are Switzerland, Austria and Germanyrespectively.
Source: Conde Nast Travellers Magazine
7/29/2019 Master Plan Confins
http://slidepdf.com/reader/full/master-plan-confins 23/53
Airpor t Consultancy Report fo r Tancred o Neves Internat ional Air port (AITN)
© Changi Airpor t Consult ants (Company Registratio n No. 200507762K). All right s reserved. Page 17
Figure 9: Travel and Tour ism Competitiveness Index, 2009
7.0
5.75.5 5.4
4.4 4.2 4.1 4.1 3.9 3.9
M a x
S w i t z e r l a n d
A u s t r i a
G e r m a n y
B r a z i l
C h i l e
U r u g u a y
A r g e n t i n a
C o l o m b i a
P e r u
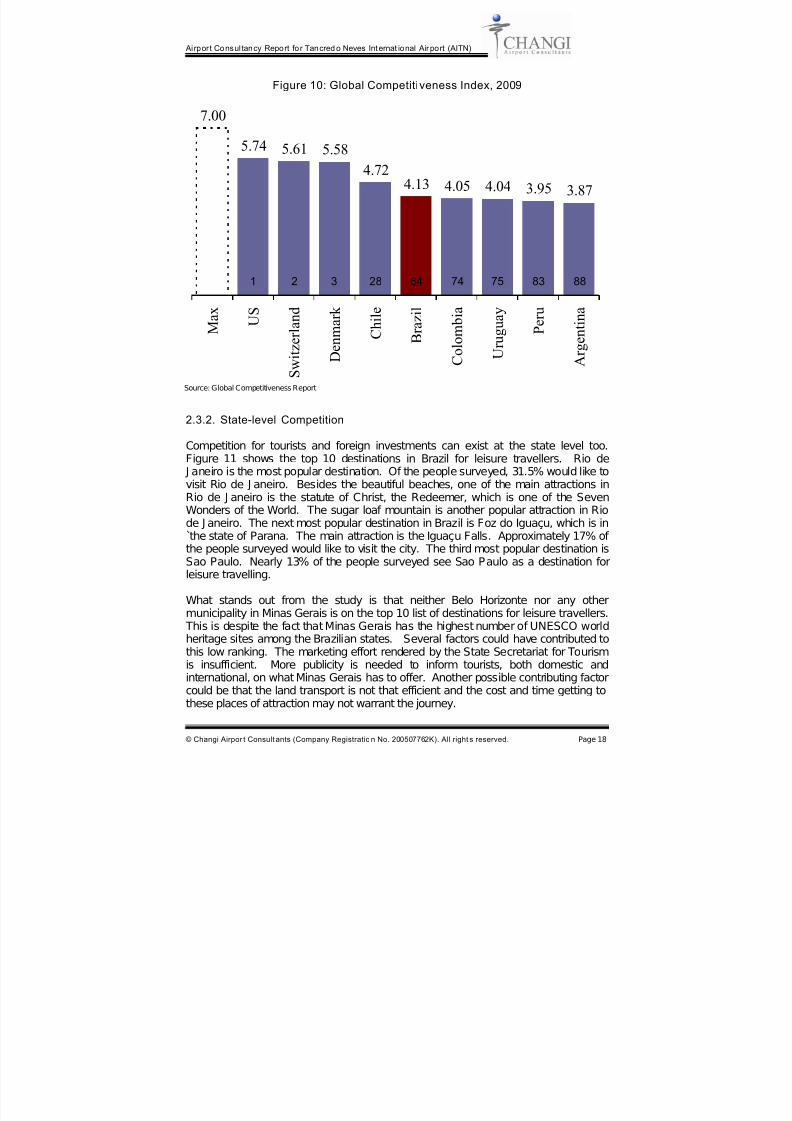
As a destination for doing business, Brazil also competes favourably against othercountries in South America. According to the Global Competitiveness Index (GCI),
Brazil is ranked 64 out of 134 countries. As shown in Figure 10, the country is onlybehind Chile (28th) but is ahead of Colombia (74th), Uruguay (75th), Peru (83rd) andArgentina (88th). As the gap between Chile and Brazil is quite wide, Brazil needs toimprove upon its business infrastructure in order to attract more foreign investmentsinto the country. The top three countries in the GCI ranking are US, Switzerland andDenmark respectively
Compare to other South American countries, Brazil has a relatively conduciveenvironment for doing business. However, on a global scale, Brazil still lags behindmost developed countries. By making the environment more conducive, it will havea positive impact on the growth of business traffic and cargo volume at the airports inBrazil.
Source: Travel and Tourism Competitiveness Report
1 2 3 45 57 72 746563
7/29/2019 Master Plan Confins
http://slidepdf.com/reader/full/master-plan-confins 24/53
Airpor t Consultancy Report fo r Tancred o Neves Internat ional Air port (AITN)
© Changi Airpor t Consult ants (Company Registratio n No. 200507762K). All right s reserved. Page 18
Figure 10: Global Competitiveness Index, 2009
7.00
5.745.61 5.58
4.72
4.13 4.05 4.04 3.95 3.87
M a x
U S
S w i t z e r l a n d
D e n m a r k
C h i l e
B r a z i l
C o l o m b i a
U r u g u a y
P e r u
A r g e n t i n a
2.3.2. State-level Competition
Competition for tourists and foreign investments can exist at the state level too.
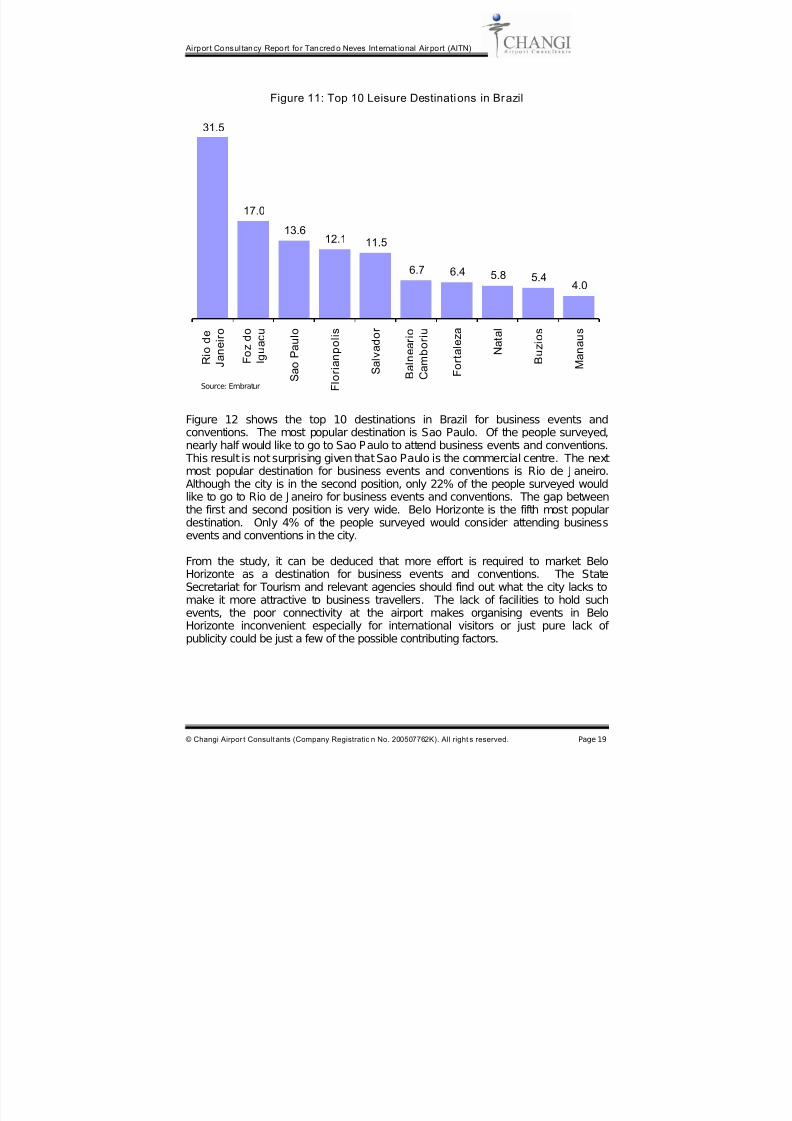
Figure 11 shows the top 10 destinations in Brazil for leisure travellers. Rio de J aneiro is the most popular destination. Of the people surveyed, 31.5% would like tovisit Rio de J aneiro. Besides the beautiful beaches, one of the main attractions inRio de J aneiro is the statute of Christ, the Redeemer, which is one of the SevenWonders of the World. The sugar loaf mountain is another popular attraction in Riode J aneiro. The next most popular destination in Brazil is Foz do Iguaçu, which is int̀he state of Parana. The main attraction is the Iguaçu Falls. Approximately 17% of
the people surveyed would like to visit the city. The third most popular destination isSao Paulo. Nearly 13% of the people surveyed see Sao Paulo as a destination forleisure travelling.
What stands out from the study is that neither Belo Horizonte nor any othermunicipality in Minas Gerais is on the top 10 list of destinations for leisure travellers. This is despite the fact that Minas Gerais has the highest number of UNESCO worldheritage sites among the Brazilian states. Several factors could have contributed tothis low ranking. The marketing effort rendered by the State Secretariat for Tourismis insufficient. More publicity is needed to inform tourists, both domestic andinternational, on what Minas Gerais has to offer. Another possible contributing factorcould be that the land transport is not that efficient and the cost and time getting tothese places of attraction may not warrant the journey.
Source: Global Competitiveness Report
1 2 3 28 64 83 887574
7/29/2019 Master Plan Confins
http://slidepdf.com/reader/full/master-plan-confins 25/53
Airpor t Consultancy Report fo r Tancred o Neves Internat ional Air port (AITN)
© Changi Airpor t Consult ants (Company Registratio n No. 200507762K). All right s reserved. Page 19
Figure 11: Top 10 Leisure Destinations in Brazil
31.5
17.0
13.612.1 11.5
6.7 6.4 5.8 5.44.0
R i o d e
J a n e i r o
F o z d o
I g u a c u
S a o P a u l o
F l o r i a n p o l i s
S a l v a d o r
B a l n e a r i o
C a m b o r i u
F o r t a l e z a
N a t a l
B u z i o s
M a n a u s
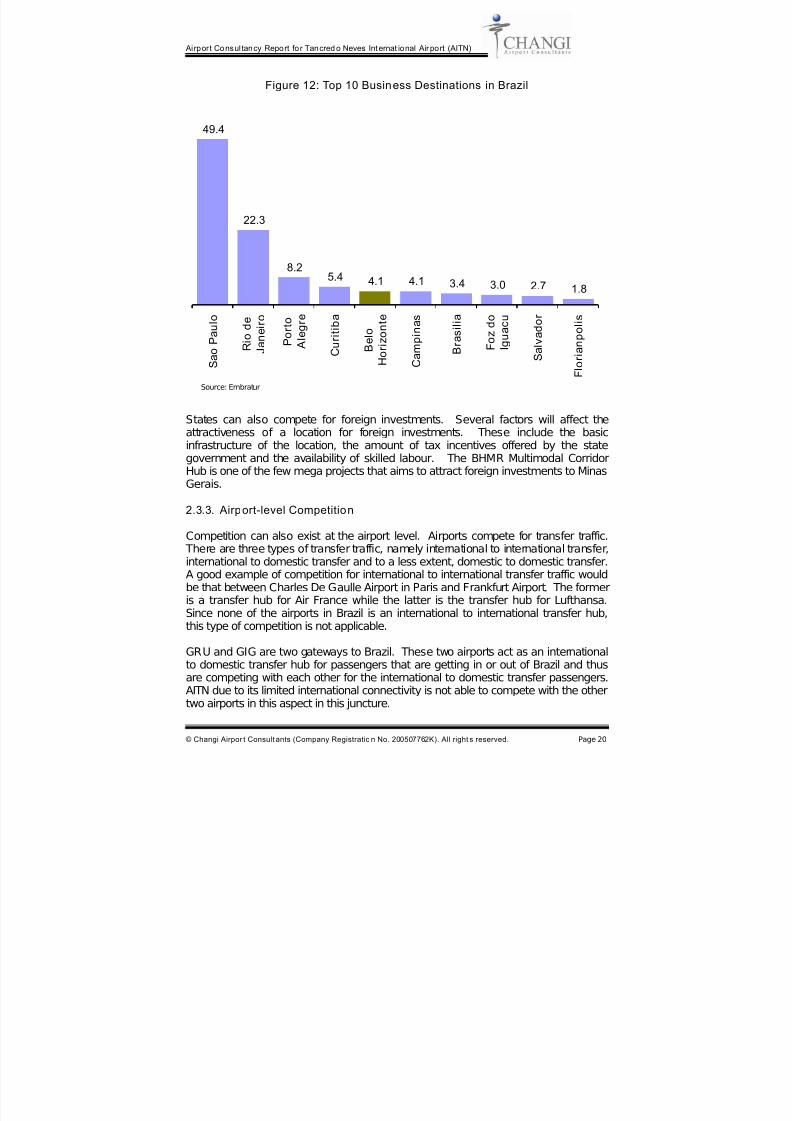
Figure 12 shows the top 10 destinations in Brazil for business events andconventions. The most popular destination is Sao Paulo. Of the people surveyed,nearly half would like to go to Sao Paulo to attend business events and conventions.
This result is not surprising given that Sao Paulo is the commercial centre. The nextmost popular destination for business events and conventions is Rio de J aneiro.Although the city is in the second position, only 22% of the people surveyed wouldlike to go to Rio de J aneiro for business events and conventions. The gap betweenthe first and second position is very wide. Belo Horizonte is the fifth most populardestination. Only 4% of the people surveyed would consider attending businessevents and conventions in the city.
From the study, it can be deduced that more effort is required to market BeloHorizonte as a destination for business events and conventions. The StateSecretariat for Tourism and relevant agencies should find out what the city lacks tomake it more attractive to business travellers. The lack of facilities to hold suchevents, the poor connectivity at the airport makes organising events in BeloHorizonte inconvenient especially for international visitors or just pure lack of publicity could be just a few of the possible contributing factors.
Source: Embratur
7/29/2019 Master Plan Confins
http://slidepdf.com/reader/full/master-plan-confins 26/53
Airpor t Consultancy Report fo r Tancred o Neves Internat ional Air port (AITN)
© Changi Airpor t Consult ants (Company Registratio n No. 200507762K). All right s reserved. Page 20
Figure 12: Top 10 Business Destinations in Brazil
49.4
22.3
8.25.4 4.1 4.1 3.4 3.0 2.7 1.8
S a o P a u l o
R i o d e
J a n e i r o
P o r t o
A l e g r e
C u r i t i b a
B e l o
H o r i z o n t e
C a m p i n a s
B r a s i l i a
F o z d o
I g u a c u
S a l v a d o r
F l o r i a n p o l i s
States can also compete for foreign investments. Several factors will affect theattractiveness of a location for foreign investments. These include the basicinfrastructure of the location, the amount of tax incentives offered by the state
government and the availability of skilled labour. The BHMR Multimodal CorridorHub is one of the few mega projects that aims to attract foreign investments to MinasGerais.
2.3.3. Airport-level Competition
Competition can also exist at the airport level. Airports compete for transfer traffic. There are three types of transfer traffic, namely international to international transfer,international to domestic transfer and to a less extent, domestic to domestic transfer.A good example of competition for international to international transfer traffic wouldbe that between Charles De Gaulle Airport in Paris and Frankfurt Airport. The formeris a transfer hub for Air France while the latter is the transfer hub for Lufthansa.Since none of the airports in Brazil is an international to international transfer hub,this type of competition is not applicable.
GRU and GIG are two gateways to Brazil. These two airports act as an internationalto domestic transfer hub for passengers that are getting in or out of Brazil and thusare competing with each other for the international to domestic transfer passengers.AITN due to its limited international connectivity is not able to compete with the othertwo airports in this aspect in this juncture.
Source: Embratur
7/29/2019 Master Plan Confins
http://slidepdf.com/reader/full/master-plan-confins 27/53
Airpor t Consultancy Report fo r Tancred o Neves Internat ional Air port (AITN)
© Changi Airpor t Consult ants (Company Registratio n No. 200507762K). All right s reserved. Page 21
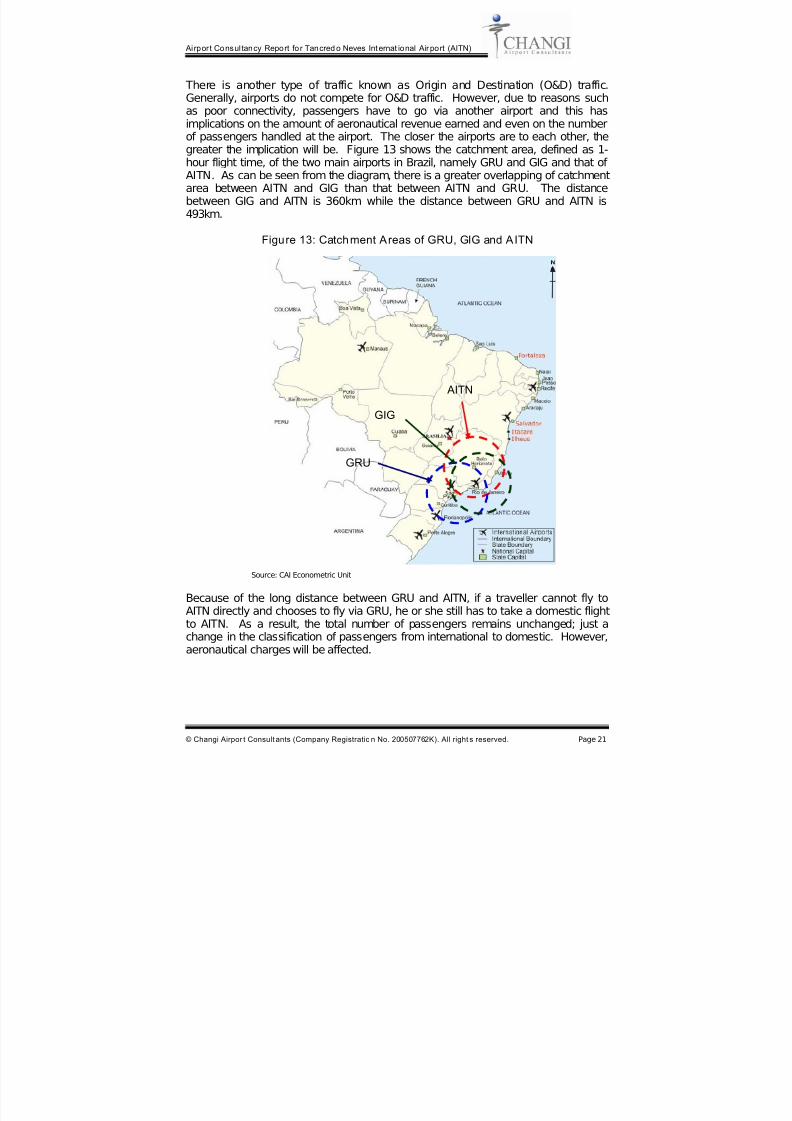
There is another type of traffic known as Origin and Destination (O&D) traffic.Generally, airports do not compete for O&D traffic. However, due to reasons suchas poor connectivity, passengers have to go via another airport and this hasimplications on the amount of aeronautical revenue earned and even on the numberof passengers handled at the airport. The closer the airports are to each other, the
greater the implication will be. Figure 13 shows the catchment area, defined as 1-hour flight time, of the two main airports in Brazil, namely GRU and GIG and that of AITN. As can be seen from the diagram, there is a greater overlapping of catchmentarea between AITN and GIG than that between AITN and GRU. The distancebetween GIG and AITN is 360km while the distance between GRU and AITN is493km.
Figure 13: Catchment Areas of GRU, GIG and AITN
Because of the long distance between GRU and AITN, if a traveller cannot fly toAITN directly and chooses to fly via GRU, he or she still has to take a domestic flightto AITN. As a result, the total number of passengers remains unchanged; just achange in the classification of passengers from international to domestic. However,aeronautical charges will be affected.
GIG
AITN
GRU
Source: CAI Econometric Unit
7/29/2019 Master Plan Confins
http://slidepdf.com/reader/full/master-plan-confins 28/53
Airpor t Consultancy Report fo r Tancred o Neves Internat ional Air port (AITN)
© Changi Airpor t Consult ants (Company Registratio n No. 200507762K). All right s reserved. Page 22
On the other hand, the distance between AITN and GIG is relatively shorter. Atraveller going to Belo Horizonte but is unable to fly directly to AITN and he choosesto fly to GIG, he or she can either choose to fly subsequently to AITN on a domesticflight or take a land transport to reach Belo Horizonte. The former scenario is similarto that described earlier between AITN and GRU. In the latter scenario, AITN will
lose the passenger totally. This not only affects the aeronautical revenue earned byAITN, but it also affects the number of passengers handled at AITN. Thus, in thisaspect, AITN faces competition from other modes of transport. It was made knownduring one of the site visits that leisure travellers prefer to drive to Rio de J aneirofrom Belo Horizonte while business travellers prefer to fly to Rio de J aneiro fromBelo Horizonte.
The amount of competition that was introduced due to the proximity between twoairports seems to be applicable to passenger traffic only. As will be shown shortly,the competition for cargo is quite independent of the distance between the twoairports.
Thus through this analysis, the impact of competition on AITN posed by GRU is notas great as those posed by GIG.
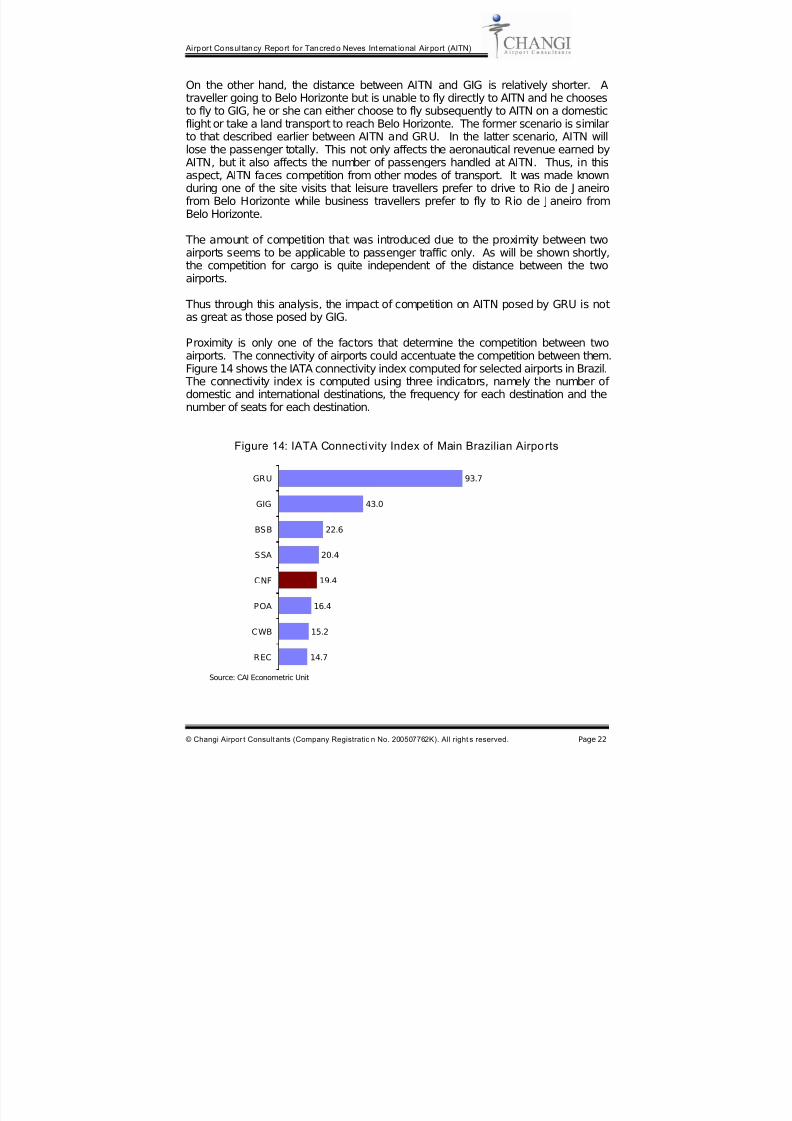
Proximity is only one of the factors that determine the competition between twoairports. The connectivity of airports could accentuate the competition between them.Figure 14 shows the IATA connectivity index computed for selected airports in Brazil. The connectivity index is computed using three indicators, namely the number of domestic and international destinations, the frequency for each destination and thenumber of seats for each destination.
Figure 14: IATA Connectivity Index of Main Brazilian Airports
14.7
15.2
16.4
19.4
20.4
22.6
43.0
93.7
REC
CWB
POA
CNF
SSA
BSB
GIG
GRU
Source: CAI Econometric Unit
7/29/2019 Master Plan Confins
http://slidepdf.com/reader/full/master-plan-confins 29/53
Airpor t Consultancy Report fo r Tancred o Neves Internat ional Air port (AITN)
© Changi Airpor t Consult ants (Company Registratio n No. 200507762K). All right s reserved. Page 23
Not surprising, being the main point of entry into Brazil, GRU is the most connectedairport. This is followed by GIG. Although AITN is ranked fifth in terms of connectivity among the major airports in Brazil, its connectivity index is way belowthose of GRU and GIG. More specifically, AITN loses out to the two main airports interms of number of destinations and frequency.
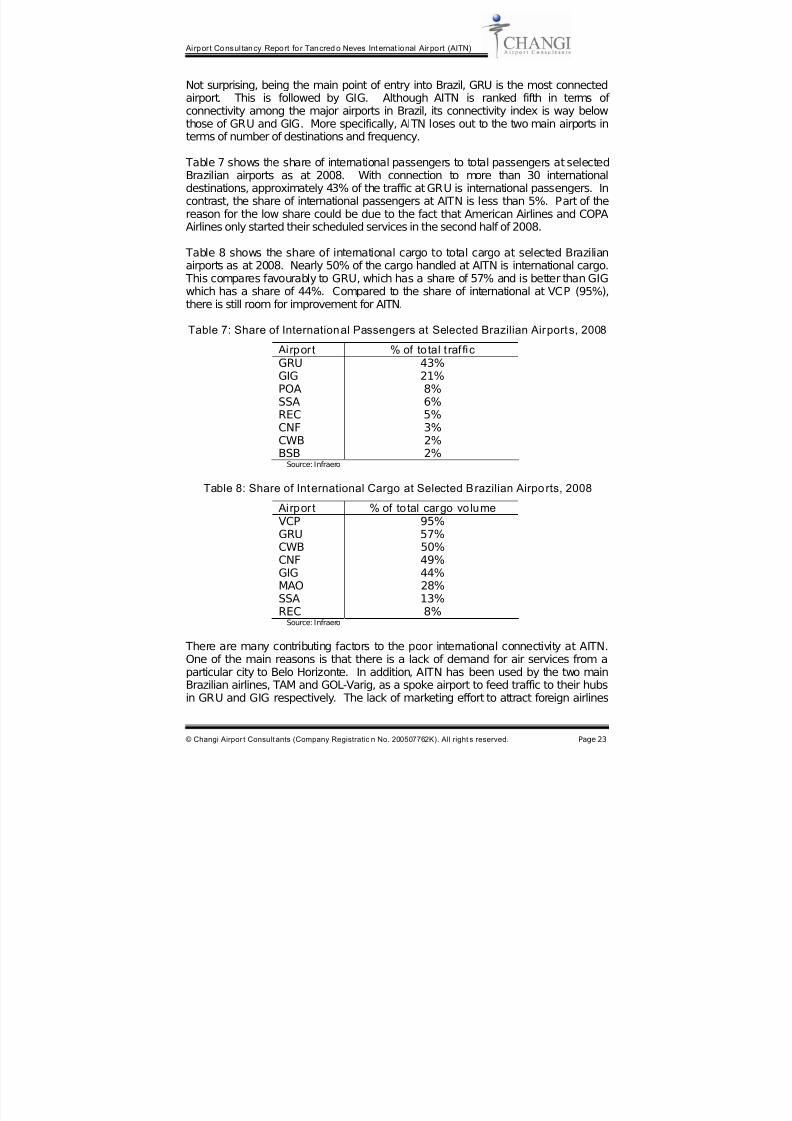
Table 7 shows the share of international passengers to total passengers at selectedBrazilian airports as at 2008. With connection to more than 30 internationaldestinations, approximately 43% of the traffic at GRU is international passengers. Incontrast, the share of international passengers at AITN is less than 5%. Part of thereason for the low share could be due to the fact that American Airlines and COPAAirlines only started their scheduled services in the second half of 2008.
Table 8 shows the share of international cargo to total cargo at selected Brazilianairports as at 2008. Nearly 50% of the cargo handled at AITN is international cargo. This compares favourably to GRU, which has a share of 57% and is better than GIGwhich has a share of 44%. Compared to the share of international at VCP (95%),
there is still room for improvement for AITN.
Table 7: Share of International Passengers at Selected Brazilian Airports, 2008
Airpor t % of total t raf ficGRU 43%GIG 21%POA 8%SSA 6%REC 5%CNF 3%CWB 2%
BSB 2%Source: Infraero
Table 8: Share of International Cargo at Selected Brazilian Airports, 2008
Airpor t % of total cargo volumeVCP 95%GRU 57%CWB 50%CNF 49%GIG 44%MAO 28%SSA 13%REC 8%
Source: Infraero
There are many contributing factors to the poor international connectivity at AITN.One of the main reasons is that there is a lack of demand for air services from aparticular city to Belo Horizonte. In addition, AITN has been used by the two mainBrazilian airlines, TAM and GOL-Varig, as a spoke airport to feed traffic to their hubsin GRU and GIG respectively. The lack of marketing effort to attract foreign airlines
7/29/2019 Master Plan Confins
http://slidepdf.com/reader/full/master-plan-confins 30/53
Airpor t Consultancy Report fo r Tancred o Neves Internat ional Air port (AITN)
© Changi Airpor t Consult ants (Company Registratio n No. 200507762K). All right s reserved. Page 24
and the inability to use financial incentives to sway airlines to move to AITN are alsopossible reasons.
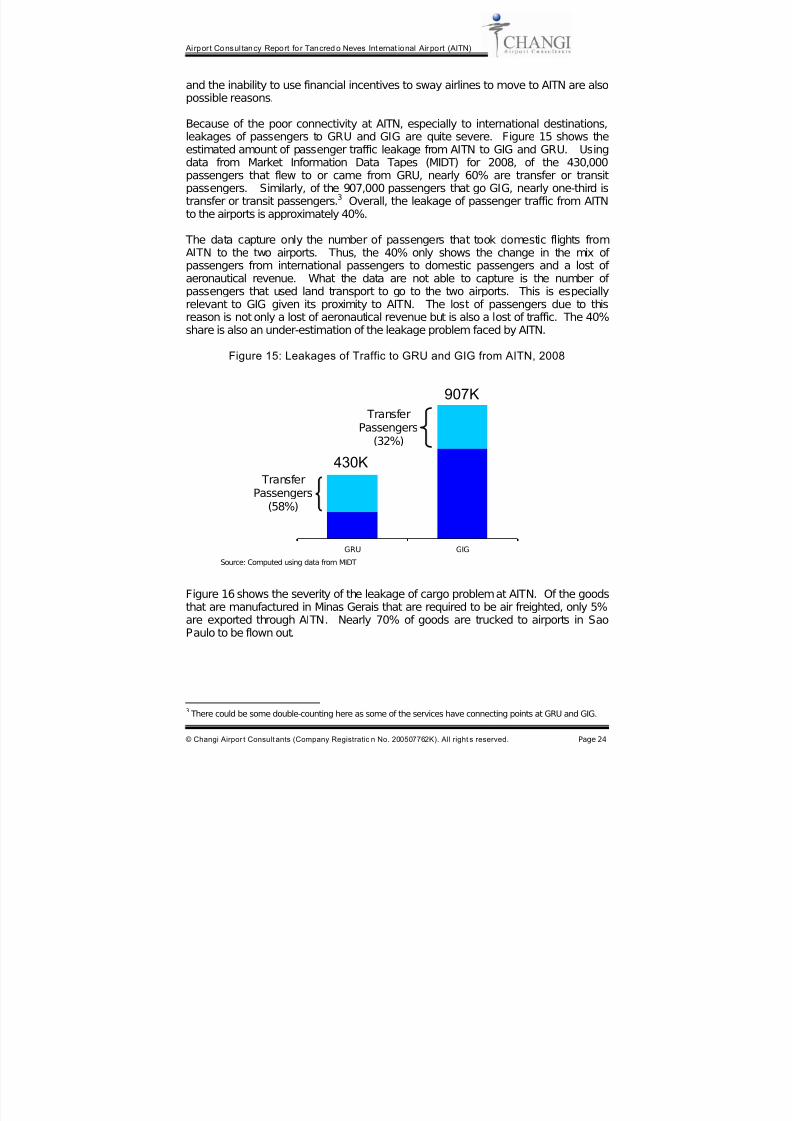
Because of the poor connectivity at AITN, especially to international destinations,leakages of passengers to GRU and GIG are quite severe. Figure 15 shows the
estimated amount of passenger traffic leakage from AITN to GIG and GRU. Usingdata from Market Information Data Tapes (MIDT) for 2008, of the 430,000passengers that flew to or came from GRU, nearly 60% are transfer or transitpassengers. Similarly, of the 907,000 passengers that go GIG, nearly one-third istransfer or transit passengers.3 Overall, the leakage of passenger traffic from AITNto the airports is approximately 40%.
The data capture only the number of passengers that took domestic flights fromAITN to the two airports. Thus, the 40% only shows the change in the mix of passengers from international passengers to domestic passengers and a lost of aeronautical revenue. What the data are not able to capture is the number of passengers that used land transport to go to the two airports. This is especially
relevant to GIG given its proximity to AITN. The lost of passengers due to thisreason is not only a lost of aeronautical revenue but is also a lost of traffic. The 40%share is also an under-estimation of the leakage problem faced by AITN.
Figure 15: Leakages of Traffic to GRU and GIG from AITN, 2008
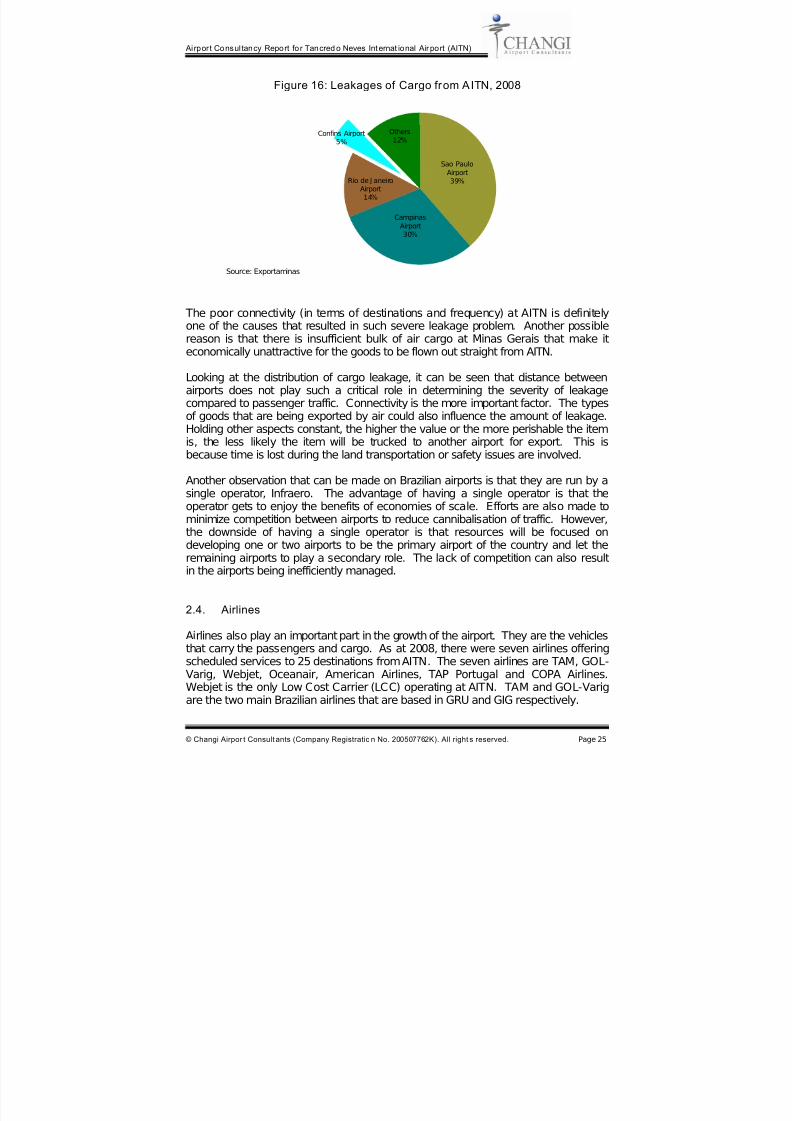
Figure 16 shows the severity of the leakage of cargo problem at AITN. Of the goods
that are manufactured in Minas Gerais that are required to be air freighted, only 5%are exported through AITN. Nearly 70% of goods are trucked to airports in SaoPaulo to be flown out.
3 There could be some double-counting here as some of the services have connecting points at GRU and GIG.
GRU GIG
TransferPassengers
(58%)
430K
907K
TransferPassengers
(32%)
Source: Computed using data from MIDT
7/29/2019 Master Plan Confins
http://slidepdf.com/reader/full/master-plan-confins 31/53
Airpor t Consultancy Report fo r Tancred o Neves Internat ional Air port (AITN)
© Changi Airpor t Consult ants (Company Registratio n No. 200507762K). All right s reserved. Page 25
Figure 16: Leakages of Cargo from AITN, 2008
The poor connectivity (in terms of destinations and frequency) at AITN is definitelyone of the causes that resulted in such severe leakage problem. Another possiblereason is that there is insufficient bulk of air cargo at Minas Gerais that make iteconomically unattractive for the goods to be flown out straight from AITN.
Looking at the distribution of cargo leakage, it can be seen that distance betweenairports does not play such a critical role in determining the severity of leakagecompared to passenger traffic. Connectivity is the more important factor. The typesof goods that are being exported by air could also influence the amount of leakage.Holding other aspects constant, the higher the value or the more perishable the itemis, the less likely the item will be trucked to another airport for export. This is
because time is lost during the land transportation or safety issues are involved.
Another observation that can be made on Brazilian airports is that they are run by asingle operator, Infraero. The advantage of having a single operator is that theoperator gets to enjoy the benefits of economies of scale. Efforts are also made tominimize competition between airports to reduce cannibalisation of traffic. However,the downside of having a single operator is that resources will be focused ondeveloping one or two airports to be the primary airport of the country and let theremaining airports to play a secondary role. The lack of competition can also resultin the airports being inefficiently managed.
2.4. Airlines
Airlines also play an important part in the growth of the airport. They are the vehiclesthat carry the passengers and cargo. As at 2008, there were seven airlines offeringscheduled services to 25 destinations from AITN. The seven airlines are TAM, GOL-Varig, Webjet, Oceanair, American Airlines, TAP Portugal and COPA Airlines.Webjet is the only Low Cost Carrier (LCC) operating at AITN. TAM and GOL-Varigare the two main Brazilian airlines that are based in GRU and GIG respectively.
Sao PauloAirport39%
CampinasAirport30%
Rio de J aneiroAirport14%
Confins Airport5%
Others12%
Source: Exportaminas
7/29/2019 Master Plan Confins
http://slidepdf.com/reader/full/master-plan-confins 32/53
Airpor t Consultancy Report fo r Tancred o Neves Internat ional Air port (AITN)
© Changi Airpor t Consult ants (Company Registratio n No. 200507762K). All right s reserved. Page 26
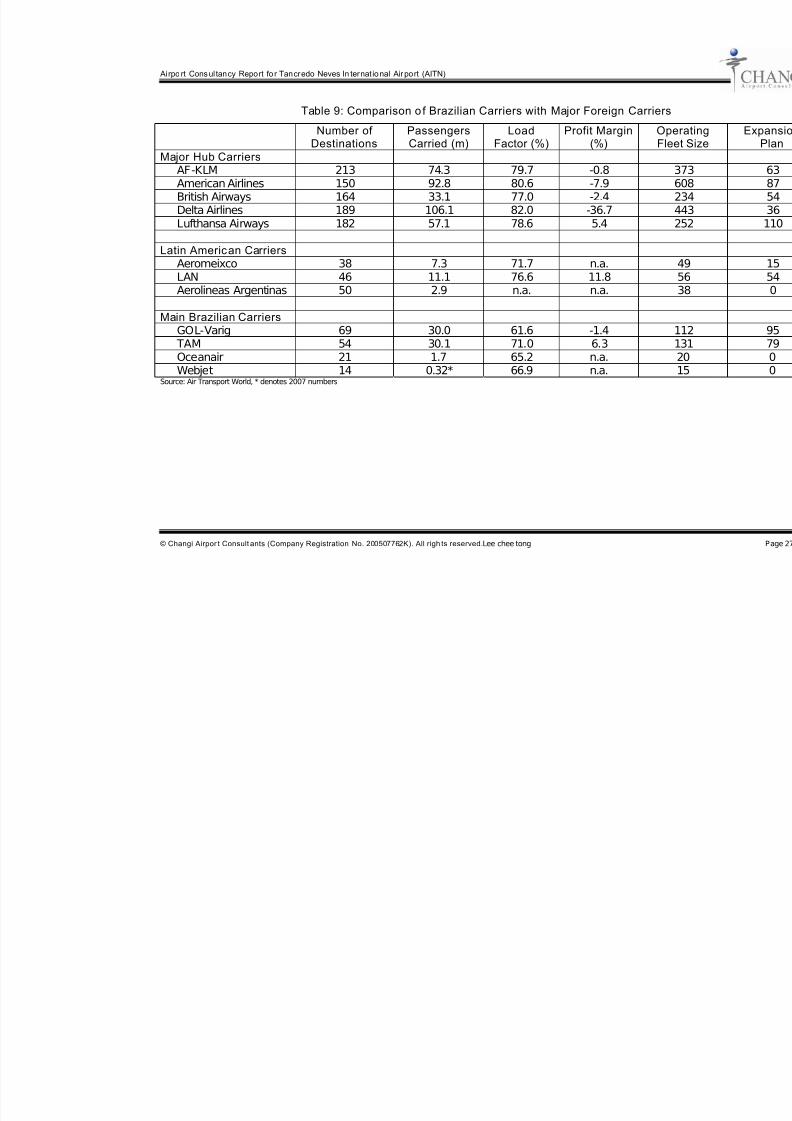
Table 9 compares the key operating and financial indicators of major hub carriersand Latin American airlines with those of the Brazilian airlines for 2008. The twomain Brazilian airlines are stronger compared to the other Latin American airlines. They fly to more destinations, carried more passengers, have a larger operating fleetsize and have a more ambitious expansion plan. However, the average load factors
for the two Brazilian airlines are lower than their Latin American counterparts.Compared to the major hub carriers, there is room for further improvement for TAMand GOL-Varig in terms of the number of destinations, load factor and operating fleetsize.
Notwithstanding the fact that the two main Brazilian airlines are still in the stage of growing their network and fleet size, the two airlines have no intention to make AITNtheir primary base. It was brought up during the meeting with the management of TAM that Sao Paulo and Rio de J aneiro will always be the top two cities when itcomes to the airline’s operations. Furthermore, GOL-Varig has no plan in the nearfuture to operate direct international flight services from AITN
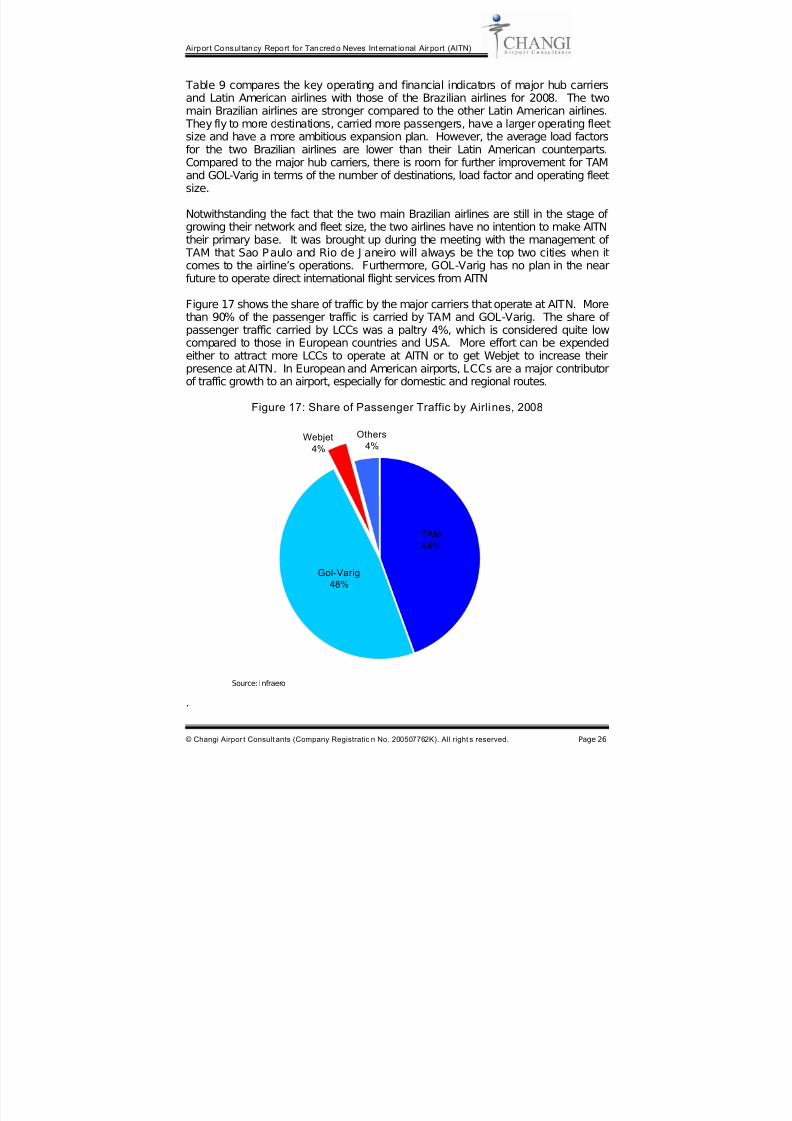
Figure 17 shows the share of traffic by the major carriers that operate at AITN. Morethan 90% of the passenger traffic is carried by TAM and GOL-Varig. The share of passenger traffic carried by LCCs was a paltry 4%, which is considered quite lowcompared to those in European countries and USA. More effort can be expendedeither to attract more LCCs to operate at AITN or to get Webjet to increase theirpresence at AITN. In European and American airports, LCCs are a major contributorof traffic growth to an airport, especially for domestic and regional routes.
Figure 17: Share of Passenger Traffic by Airlines, 2008
Webjet4%
Others4%
Gol-Varig48%
TAM44%
.
Source: Infraero
7/29/2019 Master Plan Confins
http://slidepdf.com/reader/full/master-plan-confins 33/53
Airpo rt Cons ultancy Report fo r Tancredo Neves In ternat ional Air port (AITN)
© Changi Airpor t Consult ants (Company Registration No. 200507762K). All righ ts reserved.Lee chee tong
Table 9: Comparison o f Brazilian Carriers with Major Foreign Carrier
Number of Destinations
PassengersCarried (m)
LoadFactor (%)
Profit Margin(%)
OF
Major Hub CarriersAF-KLM 213 74.3 79.7 -0.8 American Airlines 150 92.8 80.6 -7.9 British Airways 164 33.1 77.0 -2.4 Delta Airlines 189 106.1 82.0 -36.7 Lufthansa Airways 182 57.1 78.6 5.4
Latin American CarriersAeromeixco 38 7.3 71.7 n.a. LAN 46 11.1 76.6 11.8 Aerolineas Argentinas 50 2.9 n.a. n.a.
Main Brazilian CarriersGOL-Varig 69 30.0 61.6 -1.4 TAM 54 30.1 71.0 6.3 Oceanair 21 1.7 65.2 n.a. Webjet 14 0.32* 66.9 n.a.
Source: Air Transport World, * denotes 2007 numbers
7/29/2019 Master Plan Confins
http://slidepdf.com/reader/full/master-plan-confins 34/53
Airpor t Consultancy Report fo r Tancred o Neves Internat ional Air port (AITN)
© Changi Airpor t Consult ants (Company Registratio n No. 200507762K). All right s reserved. Page 28
2.5. Regulatory Environment
The growth of an airport will be stifled if the aviation sector is heavily regulated. There are two main aspects of the regulatory environment, namely those of air rightsand airport charges. The issue on air rights have been discussed in greater details
in the route development chapter of the Operations Report. In this report, only theissue of airport charges will be discussed.
Airport charges in Brazil are set by Agência Nacional de Aviação Civil (ANAC), theequivalence of the Civil Aviation Authority in most countries. For passengers, theyhave to pay what is commonly known as the airport tax. For airlines, besides payingfor landing and parking, they have to pay for the radio and visual aid-in services too.
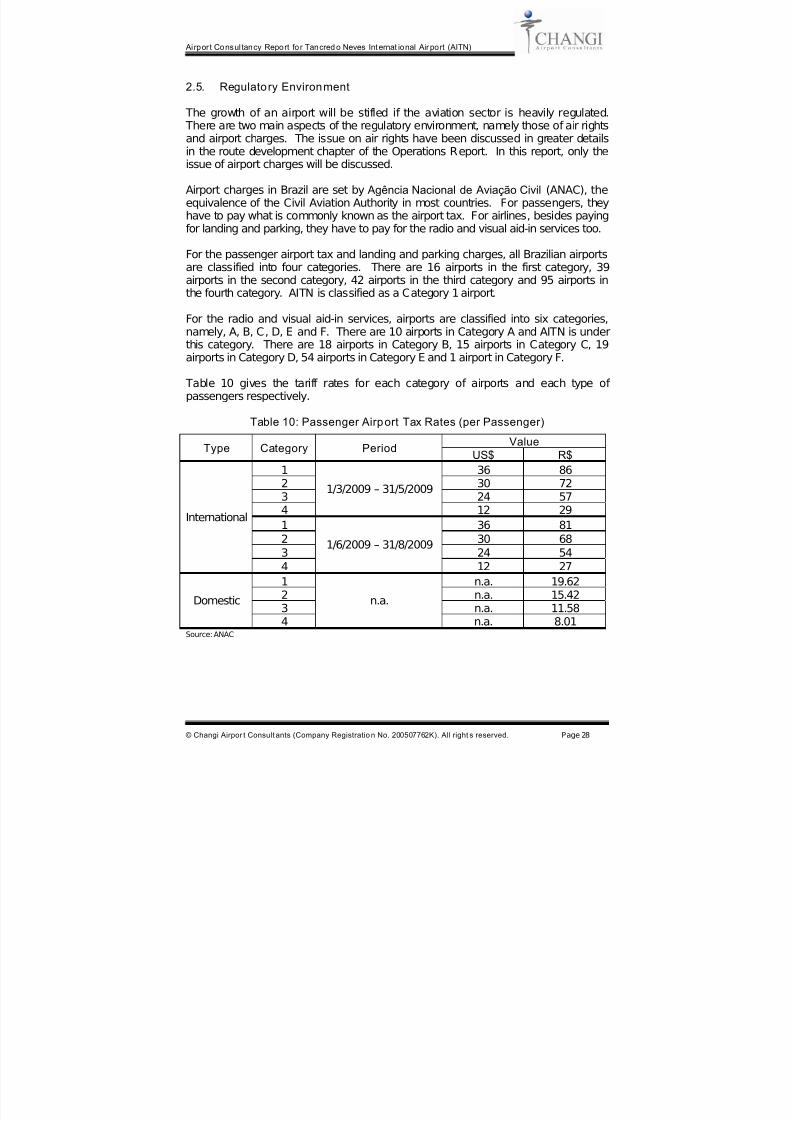
For the passenger airport tax and landing and parking charges, all Brazilian airportsare classified into four categories. There are 16 airports in the first category, 39airports in the second category, 42 airports in the third category and 95 airports inthe fourth category. AITN is classified as a Category 1 airport.
For the radio and visual aid-in services, airports are classified into six categories,namely, A, B, C, D, E and F. There are 10 airports in Category A and AITN is underthis category. There are 18 airports in Category B, 15 airports in Category C, 19airports in Category D, 54 airports in Category E and 1 airport in Category F.
Table 10 gives the tariff rates for each category of airports and each type of passengers respectively.
Table 10: Passenger Airport Tax Rates (per Passenger)
ValueType Category Period
US$ R$1 36 862 30 723 24 574
1/3/2009 – 31/5/2009
12 29
1 36 812 30 683 24 54
International
4
1/6/2009 – 31/8/2009
12 27
1 n.a. 19.622 n.a. 15.42
3 n.a. 11.58Domestic4
n.a.n.a. 8.01
Source: ANAC

7/29/2019 Master Plan Confins
http://slidepdf.com/reader/full/master-plan-confins 35/53
Airpor t Consultancy Report fo r Tancred o Neves Internat ional Air port (AITN)
© Changi Airpor t Consult ants (Company Registratio n No. 200507762K). All right s reserved. Page 29
Table 11: Landing and Parking Charges
Parking (ton hour)Type Category
Landing(per ton) Patio Manobras Area of Stay
1 5.66 1.13 0.23
2 5.14 1.03 0.213 4.41 0.88 0.18
International
4 2.20 0.44 0.09
1 1.67 0.33 0.072 1.47 0.29 0.063 0.96 0.19 0.04
Domestic
4 0.45 0.09 0.02Source: ANAC
Table 12: Radio and Visual Aid-in Charges
Type Category Flight (by Operation)
A US$112.70B US$90.18C US$63.12 D US$44.18 E US$30.92
International
F US$21.64 A R$100.36B R$80.28C R$56.22 D R$39.34 E R$27.54
Domestic
F R$11.02 Source: ANAC
Airport charges are levied according to the category the airport is being classified.Such inflexibility has two implications. First, airports cannot adjust the tariff rates toinfluence demand due to idiosyncratic reasons. In addition, they are not able toadjust the charges to suit their marketing effort and thus are unable to compete forpassengers and airlines in this area.
2.6. Capacity
The capacity and operation efficiency of airport will, to a certain extent, influence thetraffic growth of the airport. For example, if the airspace and runway are toocongested, airlines would be hesitant to operate at the airport due to safety concerns.Similarly, if the terminal is over-crowded, the service quality will drop. This couldresult in passengers flying off from another nearby airport that is less crowded.
As the issues of capacity and operation efficiency will be discussed at length in theMaster Planning and Operation Review Modules, this section briefly summarises thekey points.
7/29/2019 Master Plan Confins
http://slidepdf.com/reader/full/master-plan-confins 36/53
Airpor t Consultancy Report fo r Tancred o Neves Internat ional Air port (AITN)
© Changi Airpor t Consult ants (Company Registratio n No. 200507762K). All right s reserved. Page 30
The terminal capacity of AITN is estimated to be around 4.5 mppa and currentlyhandling 5.2 mppa. Although the airport is operating slightly its capacity, thecongestion of the terminal can be quite serious during peak hours. Queues thatstretched to the kerbside were spotted during peak hours. Figure 18 shows the
capacity of the growth in passenger traffic between 2008 and 2030 and the growth interminal capacity for the corresponding period.
Although the terminal capacity has been reached, this is not so for the runway.According to estimation done by the CAC’s Master Planning team, the only runwayat AITN is only 50% utilised. Thus there is ample room for further growth. Thiscompares favourably to the utilisation rate of the runways at GRU and GIG. A roughestimation indicates that the runways at GRU are operating at 87.5% of its capacitywhile those in the GIG are operating at 67.5% of its capacity. Furthermore, there issufficient land surrounding the airport for further expansion. In this aspect, AITN hasa competitive advantage over the other two airports.
2.7. SWOT Analysis
2.7.1. Strengths
a) Strong Traffic Growth
AITN has seen strong traffic growth for the period between 2005 and 2008.Passenger traffic and cargo volume grew at a CAGR of 21.5% and 13.1%respectively. This is higher than the traffic growth for all the airports operatedby Infraero. Passenger traffic and cargo volume for all the 66 airports grew ata CAGR of 5.6% and -1.6% respectively. With the implementation of theBHMR Multimodal Corridor Hub, traffic growth especially international trafficgrowth is expected to remain robust for the coming years. The tourism sectorwill be a major contributor to this growth in passenger traffic. Similarly, theelectronics components cluster, life sciences cluster and distribution andlogistics cluster are expected to give the cargo volume at AITN a boost,
b) Sufficient Runway Capacity
The utilisation rate of the only runway at AITN is estimated to be around 50%.Compared with the estimated runway utilisation rates of 87.5% and 67.5% atGRU and GIG respectively, the runway at AITN can accommodate moreflights. Airlines would be hesitant to add more flight services and could even
divert some flights to AITN for safety reason.
c) Ample Land for Further Expansion
There is sufficient land surrounding AITN for the construction of more terminalbuildings and runways. This is not the case for the airports in Sao Paulo andRio de J aneiro. The master plan for three terminal buildings thataccommodate up to 37 mppa and for two runways has been developed byCAC. The availability of land for future expansion is a critical factor for the
7/29/2019 Master Plan Confins
http://slidepdf.com/reader/full/master-plan-confins 37/53
Airpor t Consultancy Report fo r Tancred o Neves Internat ional Air port (AITN)
© Changi Airpor t Consult ants (Company Registratio n No. 200507762K). All right s reserved. Page 31
growth and development of an airport. This is especially so for AITN giventhat demand for air services is expected to increase significantly due toimplementation of the BHMR Multimodal Corridor Hub.
2.7.2. Weaknesses
a) Terminal Capacity Constraint
The current terminal capacity of AITN is 4.5 mppa but the current passengerthroughput is 5.2 mppa. The airport is operating above its capacity. Longqueues at check-in counters can be seen during peak hours. The level of service is thus being reduced and this could have an influence on passengersflying out from other nearby airports.
b) Poor International Connectiv ity
Currently, AITN has only five international destinations, namely Buenos Aires,
Lisbon, Miami, Paris and Panama City. This is low compared to GRU whichhas about 30 international destinations. Developing international traffic willnot only mitigate the leakage problem faced by AITN, the airport will also earnhigher aeronautical charges. In addition, the successful of the severalclusters in the BHMR Multimodal Corridor Hub are also dependent on AITNhaving very good international connectivity.
c) Lack of Home Base Carrier
AITN has been used by the two main Brazilian airlines as a spoke airport tofeed traffic to GRU and GIG. There is no plan in the near future for the twoairlines to make AITN their base. GOL-Varig also does not have the intentionto start direct international flight services at AITN. The reason given for theirhesitancy is that there is insufficient load at AITN to make it economicallyfeasible to start a direct international service. The lack of a home base carrierwill make developing AITN into a transfer hub difficult.
2.7.3. Opportunities
a) Tourism Potential
Minas Gerais has the largest number of UNESCO World Heritage sites
among the Brazilian states. The state is rich in mineral resources and mininghas been going on since colonial time. This resulted in the state having a richmining heritage. Belo Horizonte is also the top five destinations for businessevents and conventions. Minas Gerais is one of the hosting states for theFIFA World Cup in 2014. The tourism sector will be given a boost in MinasGerais as it is one of the focus clusters identified for the BHMR MultimodalCorridor Hub growth plan.
7/29/2019 Master Plan Confins
http://slidepdf.com/reader/full/master-plan-confins 38/53
Airpor t Consultancy Report fo r Tancred o Neves Internat ional Air port (AITN)
© Changi Airpor t Consult ants (Company Registratio n No. 200507762K). All right s reserved. Page 32
b) Large Catchment
With a population of approximately 20 million, Minas Gerias is the secondlargest Brazilian state. Belo Horizonte has a population of 5 million people.
This relatively large catchment size bodes well for the growth of AITN.Furthermore, the income level of people in Minas Gerais has been growing atthe same rate as that for the country as a whole. The BHMR MultimodalCorridor Hub is expected to boost the population from the current 5.1 millionto 6.7 million in 2030. In addition, the average income level of the people inthe Multimodal Corridor Hub is expected to be higher than those in other partsof Minas Gerais. This has positive implications for traffic growth at AITN.
c) LCC Potent ial
The traffic at AITN is being dominated by TAM and GOL-Varig. Currently,LCC traffic only accounted for 4% of total traffic at AITN. This is quite low
compared to the airports in Europe and US. Data from countries with asignificant volume LCC traffic shows that LCC is a major contributor to thegrowth of an airport, especially for domestic and regional traffic.
2.7.4. Threats
a) Proximity to Key Airports
AITN is only 360km from GIG and 493km from GRU. The proximity hasresulted in the leakage of passengers and cargo to these two airports. Theproblem caused by GIG is especially severe. In total, the leakage of passenger traffic from AITN to the two airports is approximately 40%.
b) Inflexible Airport Charges
Airport charges in Brazil are governed by ANAC and airports are classifiedinto categories and have to charge according to the category they are in. Thisinflexibility has two implications. If the traffic at AITN suffered for someidiosyncratic reasons, the airport is not able to influence demand through thedownward adjustment of the airport tariffs. Furthermore, AITN is not able toadjust the charges to suit their airline marketing effort.
3. AIRPORT POSITIONING
3.1. Framework
As shown in Figure 18, airports can be categorised into four different groupsdepending on the environment and the home carrier. They can be regional airports,international O&D airports, secondary hub airports and main hub airports. Thedifferent types of airports can be differentiated in the following way.
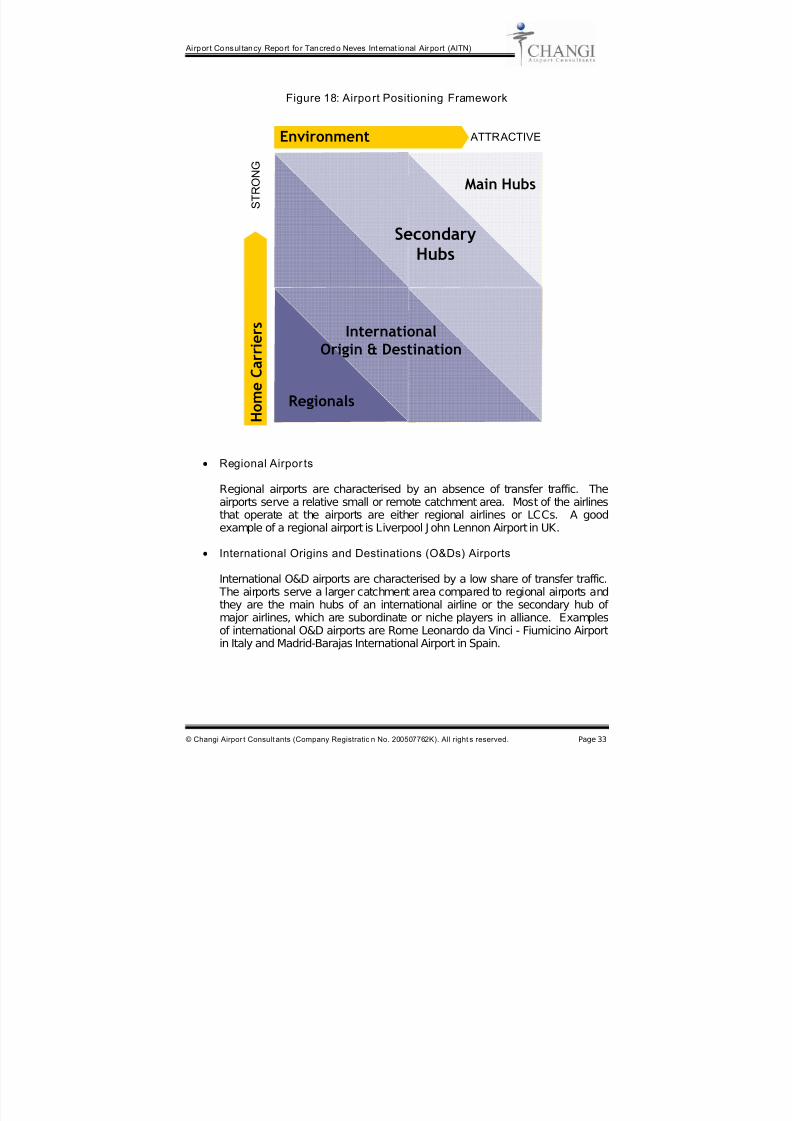
7/29/2019 Master Plan Confins
http://slidepdf.com/reader/full/master-plan-confins 39/53
Airpor t Consultancy Report fo r Tancred o Neves Internat ional Air port (AITN)
© Changi Airpor t Consult ants (Company Registratio n No. 200507762K). All right s reserved. Page 33
Figure 18: Airport Positioning Framework
Main Hubs
Secondary
Hubs
International
Origin & Destination
Regionals
Environment
H o m e C a r r i e r s
ATTRACTIVE
S T R O N G
• Regional Airpor ts
Regional airports are characterised by an absence of transfer traffic. Theairports serve a relative small or remote catchment area. Most of the airlinesthat operate at the airports are either regional airlines or LCCs. A goodexample of a regional airport is Liverpool J ohn Lennon Airport in UK.
• International Origins and Destinations (O&Ds) Airports
International O&D airports are characterised by a low share of transfer traffic. The airports serve a larger catchment area compared to regional airports and
they are the main hubs of an international airline or the secondary hub of major airlines, which are subordinate or niche players in alliance. Examplesof international O&D airports are Rome Leonardo da Vinci - Fiumicino Airportin Italy and Madrid-Barajas International Airport in Spain.
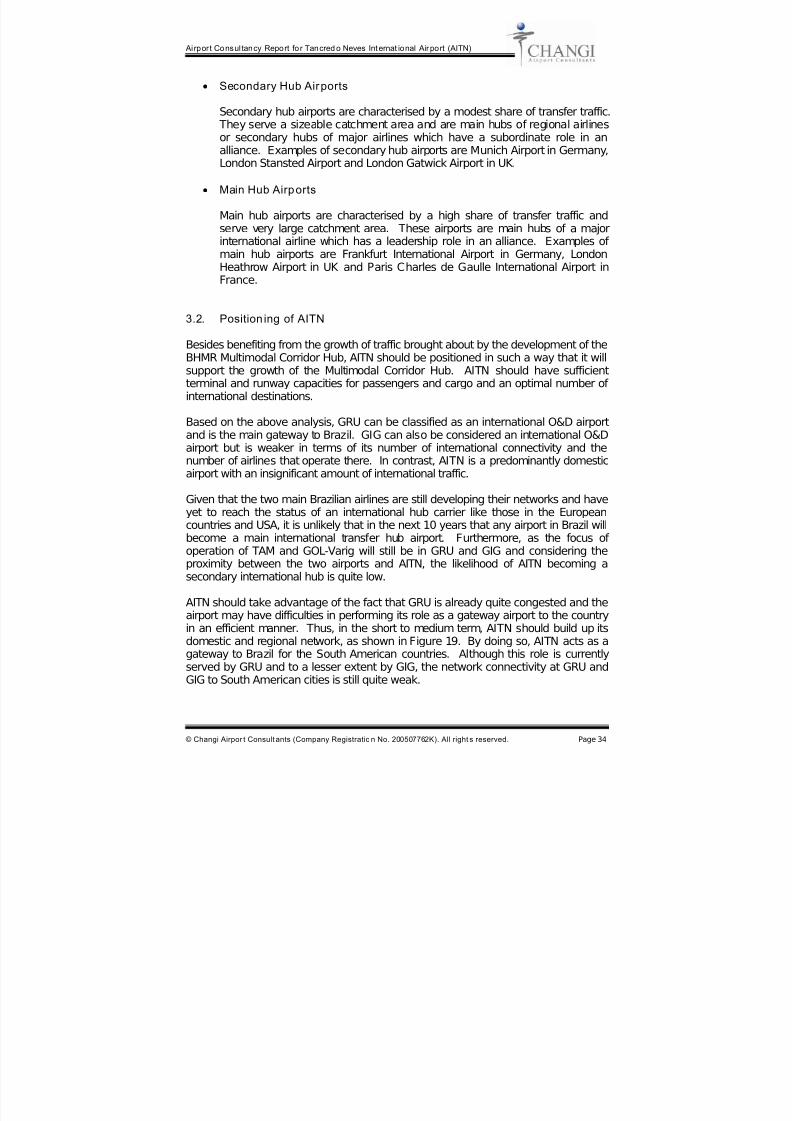
7/29/2019 Master Plan Confins
http://slidepdf.com/reader/full/master-plan-confins 40/53
Airpor t Consultancy Report fo r Tancred o Neves Internat ional Air port (AITN)
© Changi Airpor t Consult ants (Company Registratio n No. 200507762K). All right s reserved. Page 34
• Secondary Hub Airports
Secondary hub airports are characterised by a modest share of transfer traffic. They serve a sizeable catchment area and are main hubs of regional airlinesor secondary hubs of major airlines which have a subordinate role in an
alliance. Examples of secondary hub airports are Munich Airport in Germany,London Stansted Airport and London Gatwick Airport in UK.
• Main Hub Airports
Main hub airports are characterised by a high share of transfer traffic andserve very large catchment area. These airports are main hubs of a majorinternational airline which has a leadership role in an alliance. Examples of main hub airports are Frankfurt International Airport in Germany, LondonHeathrow Airport in UK and Paris Charles de Gaulle International Airport inFrance.
3.2. Position ing of AITN
Besides benefiting from the growth of traffic brought about by the development of theBHMR Multimodal Corridor Hub, AITN should be positioned in such a way that it willsupport the growth of the Multimodal Corridor Hub. AITN should have sufficientterminal and runway capacities for passengers and cargo and an optimal number of international destinations.
Based on the above analysis, GRU can be classified as an international O&D airportand is the main gateway to Brazil. GIG can also be considered an international O&Dairport but is weaker in terms of its number of international connectivity and thenumber of airlines that operate there. In contrast, AITN is a predominantly domesticairport with an insignificant amount of international traffic.
Given that the two main Brazilian airlines are still developing their networks and haveyet to reach the status of an international hub carrier like those in the Europeancountries and USA, it is unlikely that in the next 10 years that any airport in Brazil willbecome a main international transfer hub airport. Furthermore, as the focus of operation of TAM and GOL-Varig will still be in GRU and GIG and considering theproximity between the two airports and AITN, the likelihood of AITN becoming asecondary international hub is quite low.
AITN should take advantage of the fact that GRU is already quite congested and theairport may have difficulties in performing its role as a gateway airport to the countryin an efficient manner. Thus, in the short to medium term, AITN should build up itsdomestic and regional network, as shown in Figure 19. By doing so, AITN acts as agateway to Brazil for the South American countries. Although this role is currentlyserved by GRU and to a lesser extent by GIG, the network connectivity at GRU andGIG to South American cities is still quite weak.
7/29/2019 Master Plan Confins
http://slidepdf.com/reader/full/master-plan-confins 41/53
Airpor t Consultancy Report fo r Tancred o Neves Internat ional Air port (AITN)
© Changi Airpor t Consult ants (Company Registratio n No. 200507762K). All right s reserved. Page 35
In the short to medium term, Minas Gerais, even with the development of the BHMRMultimodal Corridor Hub, may not have the sufficient load to warrant an airline tomount new domestic services. Thus the reason for developing the regional networkconcurrently is to add to traffic to the domestic network and vice versa.
Figure 19: Current and Proposed Positioning of AITN
Main Hubs
Secondary
Hubs
International
Origin & Destination
Regionals
Environment
H o m e C a r r i e r s
ATTRACTIVE
S T R O N G
In the long run, as the BHMR Multimodal Corridor Hub project becomes moresubstantial, there is a need for more international connectivity. AITN should aim tobecome an international O&D airport by increasing its international connectivity. This can be achieved by attracting more foreign hub airlines to operate at AITN tocomplement the network provided by the Brazilian airlines. Not only will this bring inO&D traffic, but it will also bring in passengers that use the hub airports as theirtransfer point. As AITN is not allowed to compete on pricing and it is not allowed tooffer financial incentives to airlines to draw them to operate at AITN, the domestic
and regional network that has been built up earlier will act as a plus point to swayforeign airlines to operate at AITN. This is because without the traffic from otherSouth American countries and other Brazilian states, there could be insufficientpassenger load to make it economically viable to operate international services atAITN. By doing so, not only can passengers use AITN as an alternative gateway toBrazil, they can also use it as a gateway to the South American countries.
GRU
GIG
AITN
AITN
(2030)
GRU
(2030)
7/29/2019 Master Plan Confins
http://slidepdf.com/reader/full/master-plan-confins 42/53
Airpor t Consultancy Report fo r Tancred o Neves Internat ional Air port (AITN)
© Changi Airpor t Consult ants (Company Registratio n No. 200507762K). All right s reserved. Page 36
3.3. Key Strategic Initiatives for AITN
• S-O Strategies pursue opportunities that are a good fit to AITN’s strengths.Develop AITN as a gateway to Brazil for South American countries in theshort to medium term and position AITN as an international O&D airport in the
long term. The focus of this strategy will be on ensuring that AITN hassufficient capacity (terminal and runway) and land to meet the increasingneeds due to the growth in the catchment size brought about by thedevelopment of the BHMR Multimodal Corridor Hub.
• W-O Strategies overcome weaknesses to pursue opportunities. The focus of this strategy will be on route development, consistently working with airlines todevelop new routes as it is critical to long-term traffic growth. AITN shouldaim to attract more foreign airlines to operate at the airport to complement thelimited the international network provided by the two main Brazilian airlines.In the short to medium term, besides attracting full service carriers such asIAN Airlines and Aerolineas Argentinas, AITN should attract LCC such as
Webjet and EasyFly (Colombia) to operate at the airport. In the long term,AITN should target attracting major hub carriers from Europe and USA.
• S-T Strategies identify ways that AITN can use its strengths to reduce itsvulnerability to external threats. Compared the runway utilisation rate at AITNto GRU and GIG, AITN’s runway can still accommodate more flights. AITNshould make use of this strength to shift the intra-state flights from PLU toAITN and to attract some international-domestic traffic from GRU and GIG.
• W-T Strategies establish a defensive plan to prevent AITN’s weaknessesfrom making it highly susceptible to external threats. The poor international
connectivity at AITN has led to the leakage of passengers and cargo fromAITN. The proximity of two major airports has accentuated the magnitude of leakage. Route development effort must be expended to attract major foreignairlines and LCC to operate international and regional routes respectively. Bybuilding up the domestic, regional and international connectivity progressively,not only will it prevent the further worsening of the leakage problem, it couldeven reverse it.
4. RECOMMENDATIONS FOR PAMPULHA AIRPORT
PLU is located in the city and has been used as a regional and executive airport in
Belo Horizonte. The airport serves mainly destinations that are within 1,000 kmradius of the airport. Most of its flights were intra-state, but the airport also has someinter-state service to destinations such as those in Rio de J aneiro and Campinas.
The airport has a single runway that is 2,540 m long and has a terminal capacity of 2mppa. The three main airlines operating at PLU are TRIP, Air Minas and Passaredo.Besides regular flights, TAM and Lider also provide air taxi service. There is also anair medical service provided by helimed. The airport has 26 executive aviationhangars. PLU also has significant amount of general aviation (GA) maintenance.
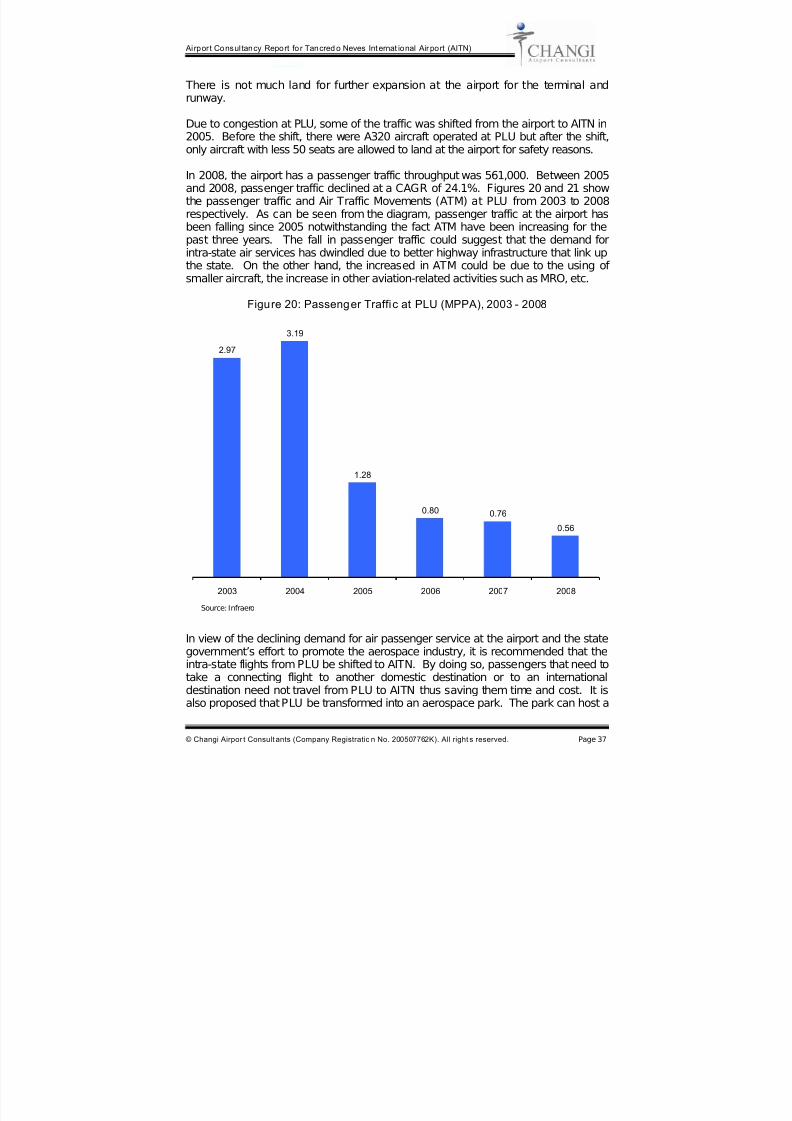
7/29/2019 Master Plan Confins
http://slidepdf.com/reader/full/master-plan-confins 43/53
Airpor t Consultancy Report fo r Tancred o Neves Internat ional Air port (AITN)
© Changi Airpor t Consult ants (Company Registratio n No. 200507762K). All right s reserved. Page 37
There is not much land for further expansion at the airport for the terminal andrunway.
Due to congestion at PLU, some of the traffic was shifted from the airport to AITN in2005. Before the shift, there were A320 aircraft operated at PLU but after the shift,
only aircraft with less 50 seats are allowed to land at the airport for safety reasons.
In 2008, the airport has a passenger traffic throughput was 561,000. Between 2005and 2008, passenger traffic declined at a CAGR of 24.1%. Figures 20 and 21 showthe passenger traffic and Air Traffic Movements (ATM) at PLU from 2003 to 2008respectively. As can be seen from the diagram, passenger traffic at the airport hasbeen falling since 2005 notwithstanding the fact ATM have been increasing for thepast three years. The fall in passenger traffic could suggest that the demand forintra-state air services has dwindled due to better highway infrastructure that link upthe state. On the other hand, the increased in ATM could be due to the using of smaller aircraft, the increase in other aviation-related activities such as MRO, etc.
Figure 20: Passenger Traffic at PLU (MPPA), 2003 - 2008
2.97
3.19
1.28
0.80 0.76
0.56
2003 2004 2005 2006 2007 2008
In view of the declining demand for air passenger service at the airport and the stategovernment’s effort to promote the aerospace industry, it is recommended that theintra-state flights from PLU be shifted to AITN. By doing so, passengers that need totake a connecting flight to another domestic destination or to an internationaldestination need not travel from PLU to AITN thus saving them time and cost. It isalso proposed that PLU be transformed into an aerospace park. The park can host a
Source: Infraero
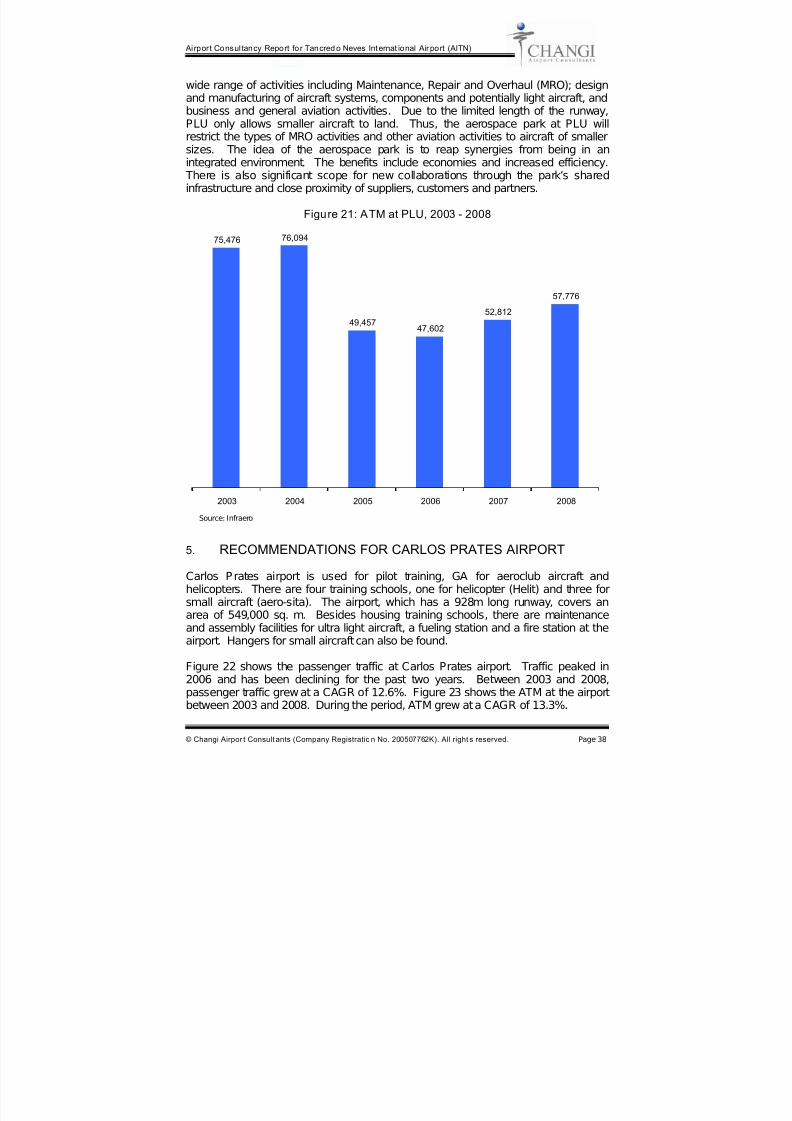
7/29/2019 Master Plan Confins
http://slidepdf.com/reader/full/master-plan-confins 44/53
Airpor t Consultancy Report fo r Tancred o Neves Internat ional Air port (AITN)
© Changi Airpor t Consult ants (Company Registratio n No. 200507762K). All right s reserved. Page 38
wide range of activities including Maintenance, Repair and Overhaul (MRO); designand manufacturing of aircraft systems, components and potentially light aircraft, andbusiness and general aviation activities. Due to the limited length of the runway,PLU only allows smaller aircraft to land. Thus, the aerospace park at PLU willrestrict the types of MRO activities and other aviation activities to aircraft of smaller
sizes. The idea of the aerospace park is to reap synergies from being in anintegrated environment. The benefits include economies and increased efficiency. There is also significant scope for new collaborations through the park’s sharedinfrastructure and close proximity of suppliers, customers and partners.
Figure 21: ATM at PLU, 2003 - 2008
75,476 76,094
49,45747,602
52,812
57,776
2003 2004 2005 2006 2007 2008
5. RECOMMENDATIONS FOR CARLOS PRATES AIRPORT
Carlos Prates airport is used for pilot training, GA for aeroclub aircraft andhelicopters. There are four training schools, one for helicopter (Helit) and three for
small aircraft (aero-sita). The airport, which has a 928m long runway, covers anarea of 549,000 sq. m. Besides housing training schools, there are maintenanceand assembly facilities for ultra light aircraft, a fueling station and a fire station at theairport. Hangers for small aircraft can also be found.
Figure 22 shows the passenger traffic at Carlos Prates airport. Traffic peaked in2006 and has been declining for the past two years. Between 2003 and 2008,passenger traffic grew at a CAGR of 12.6%. Figure 23 shows the ATM at the airportbetween 2003 and 2008. During the period, ATM grew at a CAGR of 13.3%.
Source: Infraero
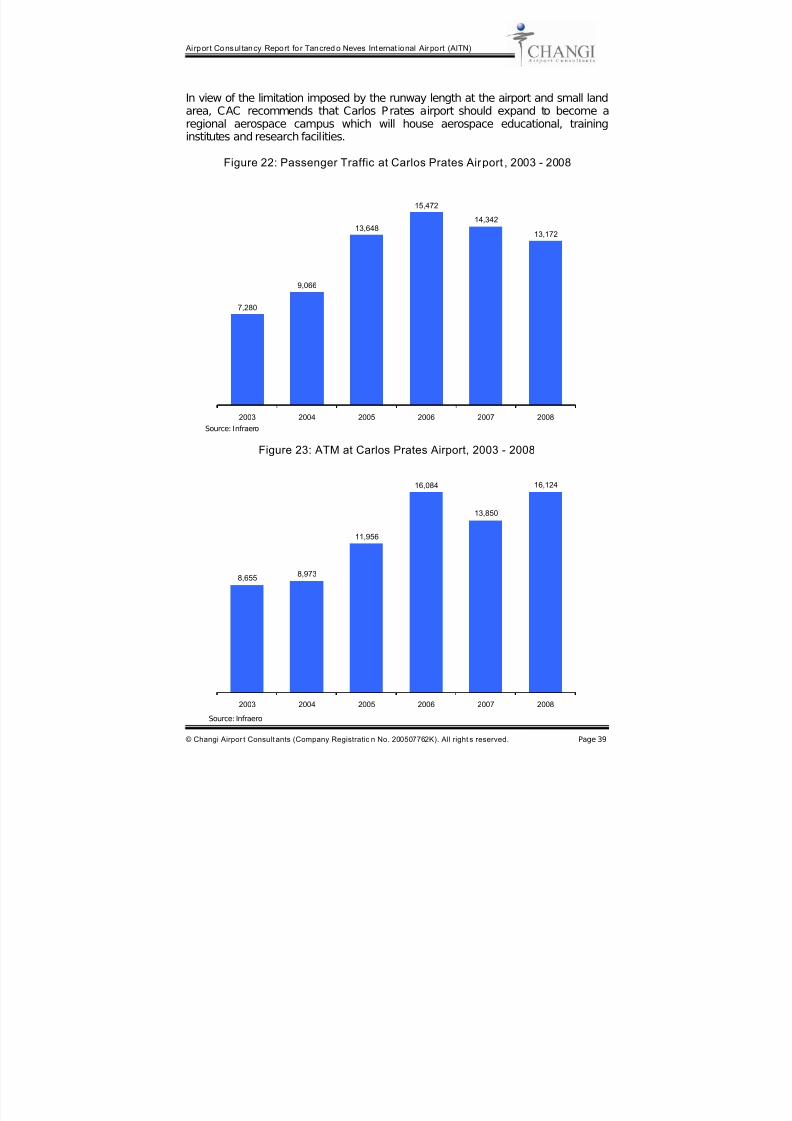
7/29/2019 Master Plan Confins
http://slidepdf.com/reader/full/master-plan-confins 45/53
Airpor t Consultancy Report fo r Tancred o Neves Internat ional Air port (AITN)
© Changi Airpor t Consult ants (Company Registratio n No. 200507762K). All right s reserved. Page 39
In view of the limitation imposed by the runway length at the airport and small landarea, CAC recommends that Carlos Prates airport should expand to become aregional aerospace campus which will house aerospace educational, traininginstitutes and research facilities.
Figure 22: Passenger Traffic at Carlos Prates Airport , 2003 - 2008
7,280
9,066
13,648
15,472
14,342
13,172
2003 2004 2005 2006 2007 2008
Figure 23: ATM at Carlos Prates Airport, 2003 - 2008
8,6558,973
11,956
16,084
13,850
16,124
2003 2004 2005 2006 2007 2008
Source: Infraero
Source: Infraero
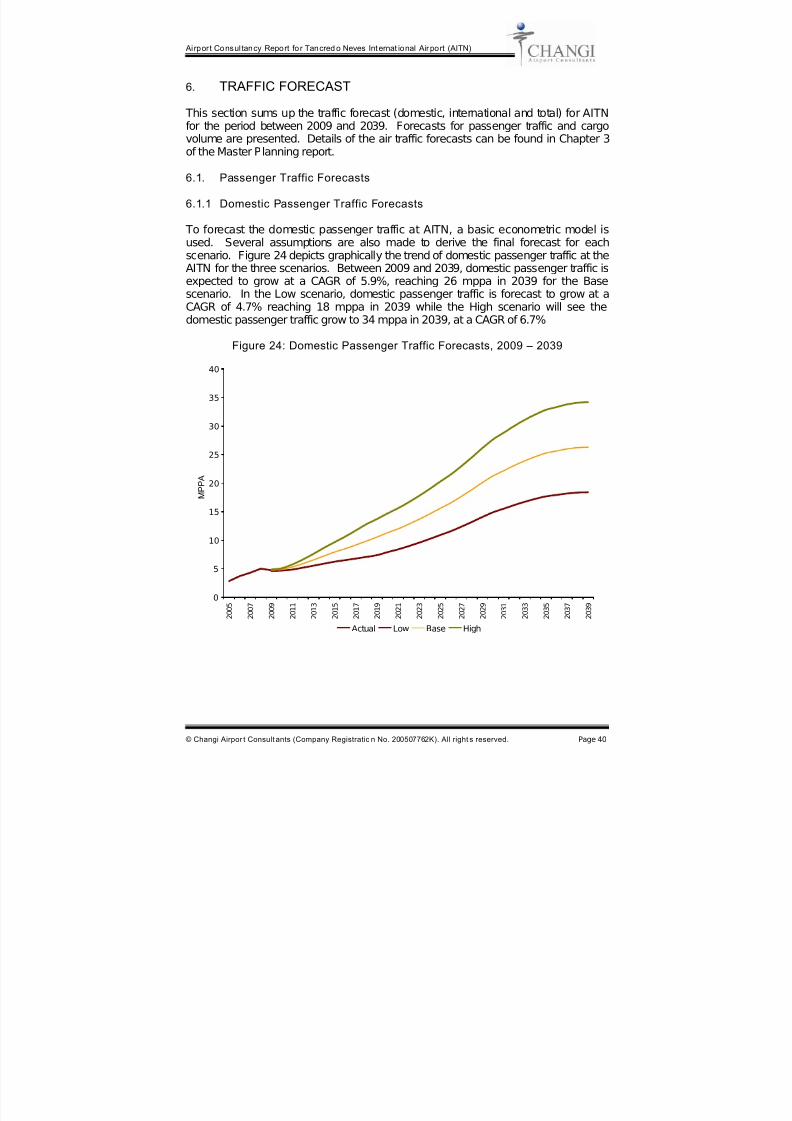
7/29/2019 Master Plan Confins
http://slidepdf.com/reader/full/master-plan-confins 46/53
Airpor t Consultancy Report fo r Tancred o Neves Internat ional Air port (AITN)
© Changi Airpor t Consult ants (Company Registratio n No. 200507762K). All right s reserved. Page 40
6. TRAFFIC FORECAST
This section sums up the traffic forecast (domestic, international and total) for AITNfor the period between 2009 and 2039. Forecasts for passenger traffic and cargovolume are presented. Details of the air traffic forecasts can be found in Chapter 3
of the Master Planning report.
6.1. Passenger Traffic Forecasts
6.1.1 Domestic Passenger Traffic Forecasts
To forecast the domestic passenger traffic at AITN, a basic econometric model isused. Several assumptions are also made to derive the final forecast for eachscenario. Figure 24 depicts graphically the trend of domestic passenger traffic at theAITN for the three scenarios. Between 2009 and 2039, domestic passenger traffic isexpected to grow at a CAGR of 5.9%, reaching 26 mppa in 2039 for the Basescenario. In the Low scenario, domestic passenger traffic is forecast to grow at a
CAGR of 4.7% reaching 18 mppa in 2039 while the High scenario will see thedomestic passenger traffic grow to 34 mppa in 2039, at a CAGR of 6.7%
Figure 24: Domestic Passenger Traffic Forecasts, 2009 – 2039
0
5
10
15
20
25
30
35
40
2 0 0 5
2 0 0 7
2 0 0 9
2 0 1 1
2 0 1 3
2 0 1 5
2 0 1 7
2 0 1 9
2 0 2 1
2 0 2 3
2 0 2 5
2 0 2 7
2 0 2 9
2 0 3 1
2 0 3 3
2 0 3 5
2 0 3 7
2 0 3 9
M P P A
Actual Low Base High
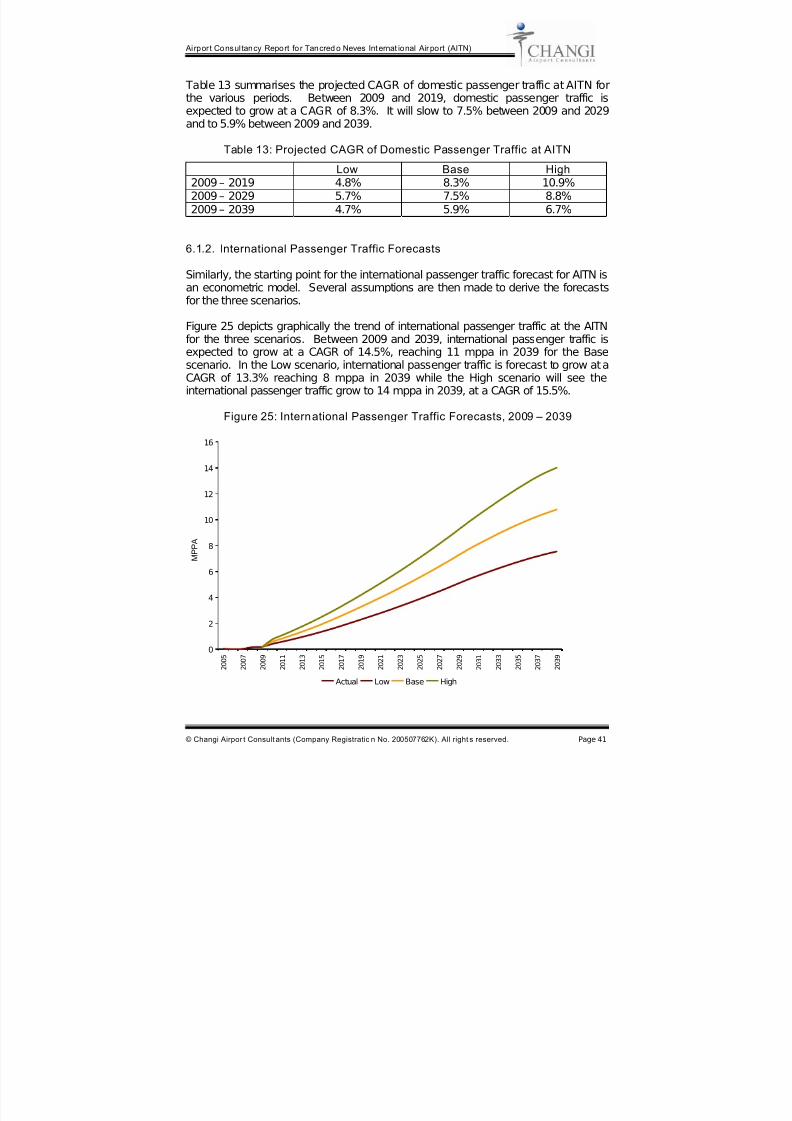
7/29/2019 Master Plan Confins
http://slidepdf.com/reader/full/master-plan-confins 47/53
Airpor t Consultancy Report fo r Tancred o Neves Internat ional Air port (AITN)
© Changi Airpor t Consult ants (Company Registratio n No. 200507762K). All right s reserved. Page 41
Table 13 summarises the projected CAGR of domestic passenger traffic at AITN forthe various periods. Between 2009 and 2019, domestic passenger traffic isexpected to grow at a CAGR of 8.3%. It will slow to 7.5% between 2009 and 2029and to 5.9% between 2009 and 2039.
Table 13: Projected CAGR of Domestic Passenger Traffic at AITN Low Base High
2009 – 2019 4.8% 8.3% 10.9%2009 – 2029 5.7% 7.5% 8.8%2009 – 2039 4.7% 5.9% 6.7%
6.1.2. International Passenger Traffic Forecasts
Similarly, the starting point for the international passenger traffic forecast for AITN isan econometric model. Several assumptions are then made to derive the forecasts
for the three scenarios.
Figure 25 depicts graphically the trend of international passenger traffic at the AITNfor the three scenarios. Between 2009 and 2039, international passenger traffic isexpected to grow at a CAGR of 14.5%, reaching 11 mppa in 2039 for the Basescenario. In the Low scenario, international passenger traffic is forecast to grow at aCAGR of 13.3% reaching 8 mppa in 2039 while the High scenario will see theinternational passenger traffic grow to 14 mppa in 2039, at a CAGR of 15.5%.
Figure 25: International Passenger Traffic Forecasts, 2009 – 2039
0
2
4
6
8
10
12
14
16
2 0 0 5
2 0 0 7
2 0 0 9
2 0 1 1
2 0 1 3
2 0 1 5
2 0 1 7
2 0 1 9
2 0 2 1
2 0 2 3
2 0 2 5
2 0 2 7
2 0 2 9
2 0 3 1
2 0 3 3
2 0 3 5
2 0 3 7
2 0 3 9
M P P A
Actual Low Base High
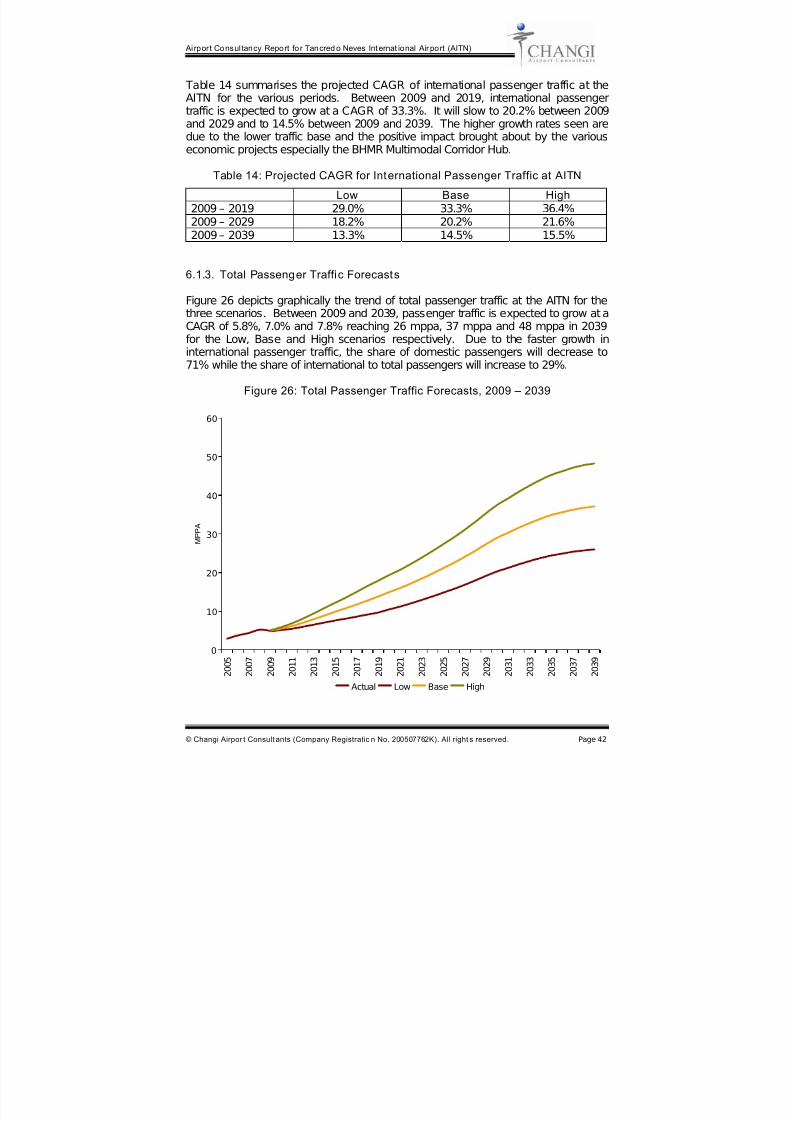
7/29/2019 Master Plan Confins
http://slidepdf.com/reader/full/master-plan-confins 48/53
Airpor t Consultancy Report fo r Tancred o Neves Internat ional Air port (AITN)
© Changi Airpor t Consult ants (Company Registratio n No. 200507762K). All right s reserved. Page 42
Table 14 summarises the projected CAGR of international passenger traffic at theAITN for the various periods. Between 2009 and 2019, international passengertraffic is expected to grow at a CAGR of 33.3%. It will slow to 20.2% between 2009and 2029 and to 14.5% between 2009 and 2039. The higher growth rates seen aredue to the lower traffic base and the positive impact brought about by the various
economic projects especially the BHMR Multimodal Corridor Hub.
Table 14: Projected CAGR for International Passenger Traffic at AITN
Low Base High2009 – 2019 29.0% 33.3% 36.4%2009 – 2029 18.2% 20.2% 21.6%2009 – 2039 13.3% 14.5% 15.5%
6.1.3. Total Passenger Traffic Forecasts
Figure 26 depicts graphically the trend of total passenger traffic at the AITN for thethree scenarios. Between 2009 and 2039, passenger traffic is expected to grow at aCAGR of 5.8%, 7.0% and 7.8% reaching 26 mppa, 37 mppa and 48 mppa in 2039for the Low, Base and High scenarios respectively. Due to the faster growth ininternational passenger traffic, the share of domestic passengers will decrease to71% while the share of international to total passengers will increase to 29%.
Figure 26: Total Passenger Traffic Forecasts, 2009 – 2039
0
10
20
30
40
50
60
2 0 0 5
2 0 0 7
2 0 0 9
2 0 1 1
2 0 1 3
2 0 1 5
2 0 1 7
2 0 1 9
2 0 2 1
2 0 2 3
2 0 2 5
2 0 2 7
2 0 2 9
2 0 3 1
2 0 3 3
2 0 3 5
2 0 3 7
2 0 3 9
M P P A
Actual Low Base High

7/29/2019 Master Plan Confins
http://slidepdf.com/reader/full/master-plan-confins 49/53
Airpor t Consultancy Report fo r Tancred o Neves Internat ional Air port (AITN)
© Changi Airpor t Consult ants (Company Registratio n No. 200507762K). All right s reserved. Page 43
Table 15 summarises the CAGR of total passenger traffic at AITN for the variousperiods. Between 2009 and 2019, international passenger traffic is expected to growat a CAGR of 10.9%. It slows to 9% between 2009 and 2029 and to 7% between2009 and 2039.
Table 15: Projected CAGR for Total Passenger Traffic at AITN Low Base High
2009 – 2019 7.3% 10.9% 13.5%2009 – 2029 7.2% 9.0% 10.2%2009 – 2039 5.8% 7.0% 7.8%
6.2. Cargo Volume Forecasts
6.2.1. Domestic Cargo Volume Forecasts
To forecast the domestic cargo and mail volume at the AITN, a base econometric
model is first specified. The results are adjusted by making further assumptions. Three scenarios are developed, namely Low, Base and High.
Figure 27 depicts graphically the trend of domestic cargo and mail volume at theAITN for the three scenarios. Between 2009 and 2039, domestic cargo and mailvolume is expected to grow at a CAGR of 7.3%, reaching 173,000 tonnes in 2039 forthe Base scenario. In the Low scenario, domestic cargo and mail volume is forecastto grow at a CAGR of 6.1% reaching 121,000 tonnes in 2039 while the High scenariowill see the domestic cargo and mail volume grow to 224,000 tonnes in 2039, at aCAGR of 8.1%.
Figure 27: Domest ic Cargo Volume Forecasts, 2009 – 2039
0
50
100
150
200
250
2 0 0 5
2 0 0 7
2 0 0 9
2 0 1 1
2 0 1 3
2 0 1 5
2 0 1 7
2 0 1 9
2 0 2 1
2 0 2 3
2 0 2 5
2 0 2 7
2 0 2 9
2 0 3 1
2 0 3 3
2 0 3 5
2 0 3 7
2 0 3 9
T h o u s a n d t o n s
Actual Low Base High
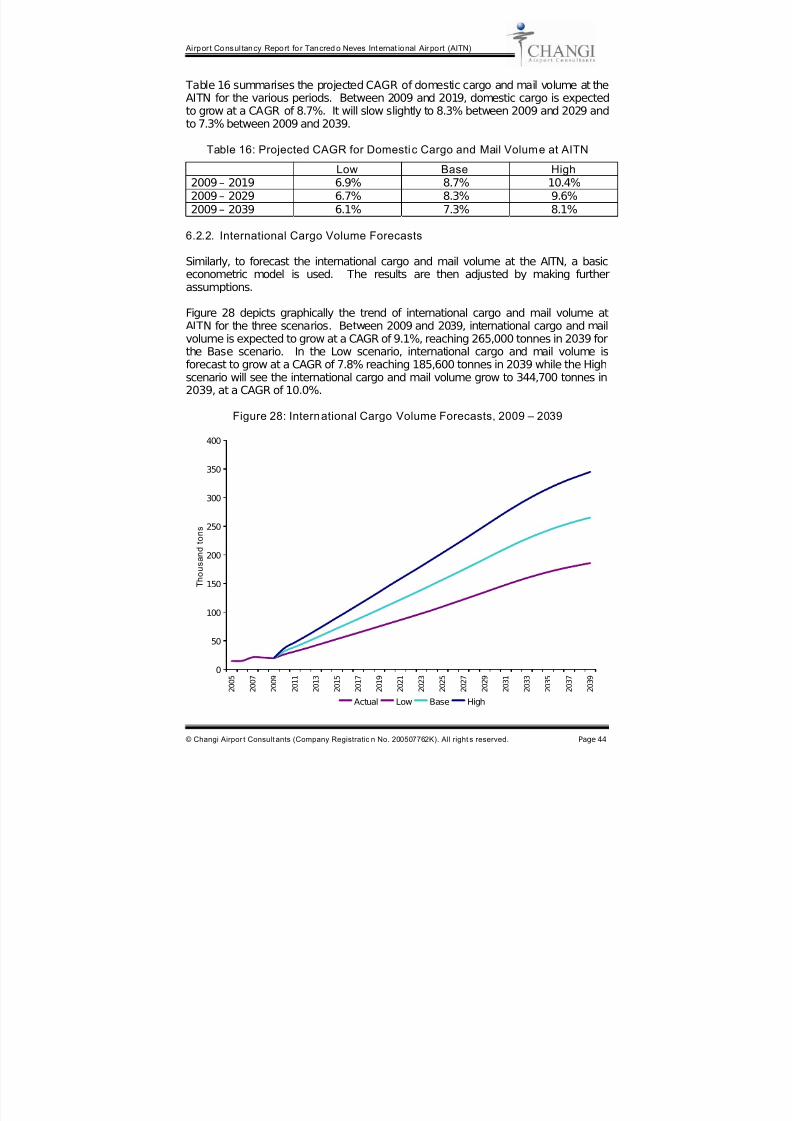
7/29/2019 Master Plan Confins
http://slidepdf.com/reader/full/master-plan-confins 50/53
Airpor t Consultancy Report fo r Tancred o Neves Internat ional Air port (AITN)
© Changi Airpor t Consult ants (Company Registratio n No. 200507762K). All right s reserved. Page 44
Table 16 summarises the projected CAGR of domestic cargo and mail volume at theAITN for the various periods. Between 2009 and 2019, domestic cargo is expectedto grow at a CAGR of 8.7%. It will slow slightly to 8.3% between 2009 and 2029 andto 7.3% between 2009 and 2039.
Table 16: Projected CAGR for Domestic Cargo and Mail Volume at AITN Low Base High
2009 – 2019 6.9% 8.7% 10.4%2009 – 2029 6.7% 8.3% 9.6%2009 – 2039 6.1% 7.3% 8.1%
6.2.2. International Cargo Volume Forecasts
Similarly, to forecast the international cargo and mail volume at the AITN, a basiceconometric model is used. The results are then adjusted by making furtherassumptions.
Figure 28 depicts graphically the trend of international cargo and mail volume atAITN for the three scenarios. Between 2009 and 2039, international cargo and mailvolume is expected to grow at a CAGR of 9.1%, reaching 265,000 tonnes in 2039 forthe Base scenario. In the Low scenario, international cargo and mail volume isforecast to grow at a CAGR of 7.8% reaching 185,600 tonnes in 2039 while the Highscenario will see the international cargo and mail volume grow to 344,700 tonnes in2039, at a CAGR of 10.0%.
Figure 28: International Cargo Volume Forecasts, 2009 – 2039
0
50
100
150
200
250
300
350
400
2 0 0 5
2 0 0 7
2 0 0 9
2 0 1 1
2 0 1 3
2 0 1 5
2 0 1 7
2 0 1 9
2 0 2 1
2 0 2 3
2 0 2 5
2 0 2 7
2 0 2 9
2 0 3 1
2 0 3 3
2 0 3 5
2 0 3 7
2 0 3 9
T h o u s a n d t o n s
Actual Low Base High
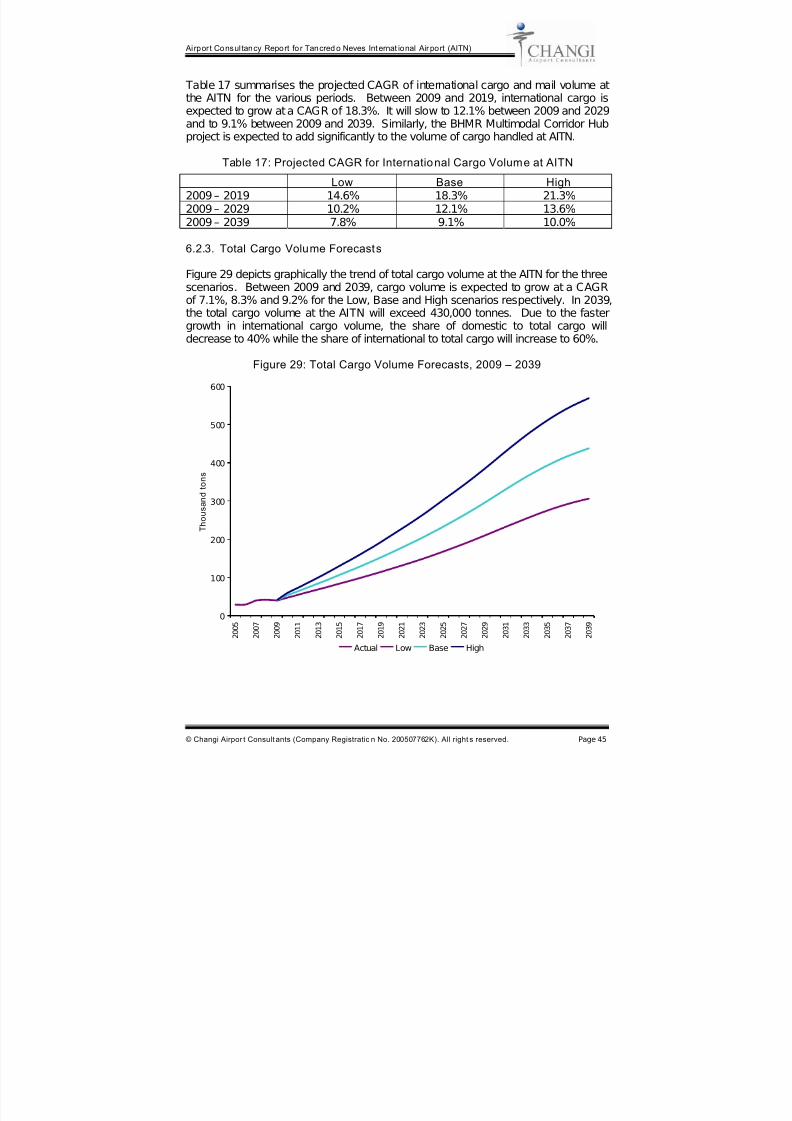
7/29/2019 Master Plan Confins
http://slidepdf.com/reader/full/master-plan-confins 51/53
Airpor t Consultancy Report fo r Tancred o Neves Internat ional Air port (AITN)
© Changi Airpor t Consult ants (Company Registratio n No. 200507762K). All right s reserved. Page 45
Table 17 summarises the projected CAGR of international cargo and mail volume atthe AITN for the various periods. Between 2009 and 2019, international cargo isexpected to grow at a CAGR of 18.3%. It will slow to 12.1% between 2009 and 2029and to 9.1% between 2009 and 2039. Similarly, the BHMR Multimodal Corridor Hubproject is expected to add significantly to the volume of cargo handled at AITN.
Table 17: Projected CAGR for International Cargo Volume at AITN
Low Base High2009 – 2019 14.6% 18.3% 21.3%2009 – 2029 10.2% 12.1% 13.6%2009 – 2039 7.8% 9.1% 10.0%
6.2.3. Total Cargo Volume Forecasts
Figure 29 depicts graphically the trend of total cargo volume at the AITN for the threescenarios. Between 2009 and 2039, cargo volume is expected to grow at a CAGR
of 7.1%, 8.3% and 9.2% for the Low, Base and High scenarios respectively. In 2039,the total cargo volume at the AITN will exceed 430,000 tonnes. Due to the fastergrowth in international cargo volume, the share of domestic to total cargo willdecrease to 40% while the share of international to total cargo will increase to 60%.
Figure 29: Total Cargo Volume Forecasts, 2009 – 2039
0
100
200
300
400
500
600
2 0 0 5
2 0 0 7
2 0 0 9
2 0 1 1
2 0 1 3
2 0 1 5
2 0 1 7
2 0 1 9
2 0 2 1
2 0 2 3
2 0 2 5
2 0 2 7
2 0 2 9
2 0 3 1
2 0 3 3
2 0 3 5
2 0 3 7
2 0 3 9
T h o u s a n d t o n s
Actual Low Base High
7/29/2019 Master Plan Confins
http://slidepdf.com/reader/full/master-plan-confins 52/53
Airpor t Consultancy Report fo r Tancred o Neves Internat ional Air port (AITN)
© Changi Airpor t Consult ants (Company Registratio n No. 200507762K). All right s reserved. Page 46
Table 18 shows the CAGR of total cargo and mail volume at the AITN for the variousperiods. Between 2009 and 2019, total cargo is expected to grow at a CAGR of 14.2%. It will slow to 10.5% between 2009 and 2029 and to 8.3% between 2009 and2039.
Table 18: Projected CAGR for Total Cargo Volume at AITN Low Base High
2009 – 2019 11.2% 14.2% 16.7%2009 – 2029 8.7% 10.5% 11.8%2009 – 2039 7.1% 8.3% 9.2%
7. MASTER PLAN
From the air traffic forecast, a Master Plan for the expansion of AITN is developed.
Details of the Master Plan can be found in the Master Planning report. In short, fourphases of development are planned for the period between 2009 and 2039. Figure30 shows the development plan for AITN at Phase 4.
Phase 1, with the completion of the first phase of Terminal 2, which is expected to becompleted by 2013, will increase the capacity of AITN from 7 mppa to 12 mppa. This increase in terminal capacity should be able to cater to the increase in the needfor terminal space for the FIFA World Cup in 2014.
By 2017, the second phase of the development plan would have been kicked in. Inthis phase, it would see the completion of the second phase of Terminal 2 which willincrease terminal capacity from 12 mppa to 17 mppa.
Phase 3 will see the implementation of the first phase of development plan for Terminal 3, which will increase the terminal capacity from 17 mppa to 27 mppa. Thisphase of development is expected to be completed by 2022.
By 2029, the second phase of Terminal 3 expansion plan will be implemented andthis phase will see the terminal capacity increasing from 27 mppa to 37 mppa.
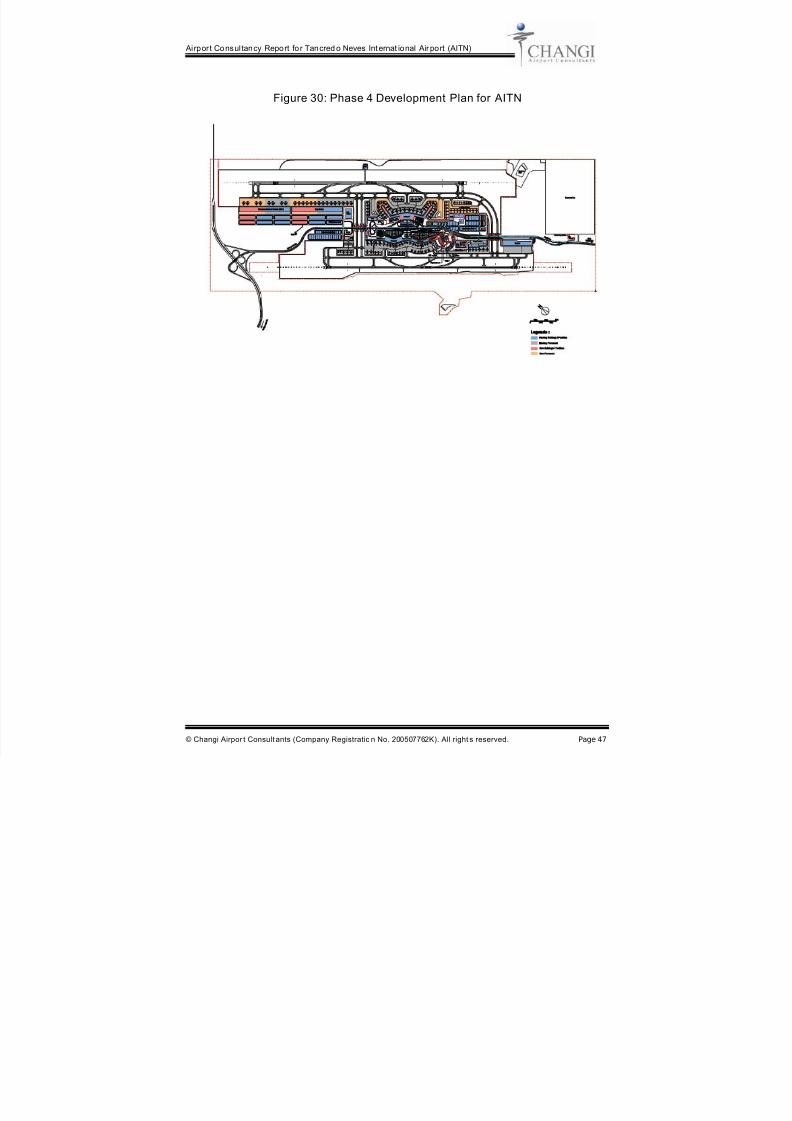
7/29/2019 Master Plan Confins
http://slidepdf.com/reader/full/master-plan-confins 53/53
Airpor t Consultancy Report fo r Tancred o Neves Internat ional Air port (AITN)
Figure 30: Phase 4 Development Plan for AITN