Strategic Financial Planning for Water Supply and Sanitation
Jurnal Agripet Vol 20 (2): 216-231, Oktober 2020 p-ISSN: 1411-4623 | e-ISSN: 2460-4534 Accredited: 28/E/KPT/2019 available online at http://jurnal.unsyiah.ac.id/agripet
216
Mapping Strategic and Sustainable Relevant Actors of Poultry Production
and Business Using Stakeholder Network Analysis
(Pemetaan Pemangku Produksi dan Bisnis Unggas Strategis dan Berkelanjutan Dengan Aplikasi
Analisis Jaringan Stakeholder)
Desni Triana Ruly Saragih1, Meky Sagrim2, Hendrik Fatem3, Stepanus Pakage1,
Yosina Waromi2, Daniel Seseray1, Aisyah Bauw4, Hendrik Arwam5, Miksen Sangkek6, Deny Iyai1* 1Faculty of Animal Husbandry, Papua University, Papua Barat, Indonesia
2Faculty of Agriculture, Papua University, Manokwari, Papua Barat, Indonesia 3Dinas Peternakan dan Kesehatan Hewan, Papua Barat, Indonesia
4Faculty of Economic and Business, Papua University, Manokwari, Papua Barat, Indonesia 5Faculty of Letter and Culture, Papua University, Manokwari, Papua Barat, Indonesia
6Polbangtan Manokwari, Reremi-Fanindi, Manokwari, Papua Barat, Indonesia
ABSTRACT. Stakeholders and their network place top rank of value chain business and ruled prominent roles in the livestock
development sector particularly poultry commodity. The involvement of many stakeholders and other parties is questionable
because they perform and shape the market and business chain. The study was done in Manokwari using focus group discussion
towards twenty-four various represented individuals, groups and mass organizations. The key queries discussed concerning the
introduced background of the organization, shared resources, inter-connectivity amongst actors, intervention and innovation
preferences and shared by actors. Stakeholder Network Analysis was employed to run the network and relationship between
actors using the Pearson Correlation Coefficient and Hierarchical Clustering Analysis. The finding is that the stakeholders in the
poultry farming systems are dominated by private group actors who are working in groups to manage the farms and its value
chain process and officially have been under laws. These actors commonly act like positive important stakeholders, who ruled the
farms. The threats are real and exist and should be lowering as much as possible to mitigate the turn-back effect. The top five
shared resources are access, spaces, time, policy, knowledge and skills. Those resources will stay longer to sustain the strong
needs of poultry farms. The relationship of actors is dominated by the ranges of correlation are varying in between negative,
neutral to positive. Actors are not delivering the intervention and innovation yet. Actors with low interest and low power should
then be promoted to high interest and high power by using aids, guidance, and services from each actor from its value chain and
cooperation and farming business.
Keywords: intervention and innovation, poultry farming business, shared resources, stakeholder network analyses
ABSTRAK. Pemangku kepentingan dan jaringannya menempati peringkat teratas dalam bisnis rantai nilai dan memegang peran
penting dalam sektor pengembangan peternakan khususnya komoditas unggas. Keterlibatan banyak pemangku kepentingan dan
pihak lain patut dipertanyakan. Penelitian dilakukan di Manokwari dengan menggunakan FGD terhadap dua puluh empat
perwakilan individu, kelompok dan ormas. Pertanyaan utama membahas tentang latar belakang organisasi yang diperkenalkan,
sumber daya bersama, interkoneksi antar aktor, preferensi intervensi dan inovasi dan dibagikan oleh aktor. Analisis Jaringan
Pemangku Kepentingan digunakan untuk menjalankan jaringan dan hubungan dengan menggunakan Koefisien Korelasi Pearson
dan Analisis Pengelompokan Hirarkis. Temuannya adalah bahwa para pemangku kepentingan dalam sistem peternakan unggas
didominasi oleh pelaku kelompok swasta yang bekerja dalam kelompok untuk mengelola peternakan dan proses rantai nilainya
dan secara resmi berada di bawah undang-undang. Aktor ini biasanya bertindak seperti pemangku kepentingan penting yang
positif, yang mengatur pertanian. Ancaman itu nyata dan ada dan harus diturunkan sebanyak mungkin untuk mengurangi efek
balik. Lima sumber daya bersama teratas adalah akses, ruang, waktu, kebijakan, pengetahuan, dan keterampilan. Sumber daya
tersebut akan bertahan lebih lama untuk menopang kebutuhan kuat peternakan unggas. Hubungan antar aktor didominasi oleh
rentang korelasi yang bervariasi antara negatif, netral hingga positif. Para pelaku belum melakukan intervensi dan inovasi. Pelaku
dengan kepentingan rendah dan kekuasaan rendah kemudian harus dipromosikan menjadi kepentingan tinggi dan kekuasaan
tinggi dengan menggunakan bantuan, bimbingan, dan layanan dari masing-masing pelaku dari rantai nilai dan koperasi dan usaha
tani.
Kata kunci: intervensi dan inovasi, usaha peternakan unggas, sumber daya bersama, analisis jaringan stakeholder
INTRODUCTION1
The industrial and business of the poultry
around the world (Devendra and Thomas, 2002),
*Email Korespondensi: [email protected] Diterima: 23 Februari 2020
Direvisi: 29 Juni 2020
Disetujui: 26 September 2020
DOI: https://doi.org/10.17969/agripet.v20i2.16006
for instance, have been developed and it has been
due to the involvement of many stakeholders and
shareholders’ interest and intervention. Each
stakeholder cares and desires not limited to
increasing their business and market-oriented
(Nurfadillah et al., 2018). However, it has a vision
also to providing feeds for the world (Bradford
1999). Stakeholders and shareholders have
Jurnal Agripet, Volume 20, No. 2, Oktober 2020
Mapping Strategic and Sustainable Relevant Actors of Poultry Production and Business Using Stakeholder Network Analysis (Desni Triana Ruly Saragih, et al.,)
217
prominent roles in creating the compact demand
and business of livestock products, particularly
poultry production. Examples are described by
Martindah and Ilham (2019) and Mollenhorst and
de Boer (2010). The looks of poultry products
available on food stores shall attract the interest of
consumers to buy the products.
Many stakeholders play a role in
determining the process and product of livestock
development, particularly the poultry sector
(Priyono and Priyanti, 2018). They shaped and
formed business and value chains officially by the
laws for both international and national levels, i.e.
state (central government) and regional, i.e.
governor and regency (Nurfadillah et al., 2018).
Therefore, we should know what and why are
stakeholders and/or actors themselves. A
stakeholder is defined as individuals, groups, and
institutions that have relations both direct and
indirect effects in changing a certain process
(Freeman, 2015). However, there are stakeholders
as well which are not formed and shaped in their
interaction by the laws. They are real and play a
strategic and prominent role in determining
development. The core is stakeholders, which are
many and vary according to their roles and
responsibilities.
In developing livestock farming systems
specifically poultry sector, many parties are
interlinked and shaped the complex systems of
this agribusiness chain. The complex system of
poultry development is including social, economic
and environment, it has definition and known its
roles. Without knowing the roles of systems, it is
hard to drive the parties that play vital roles in
shaping the looks of the poultry development.
Every stage of the poultry development has its
process and been related to parties and/or involved
stakeholders. An example comes from industrial
and business of the livestock sectors, particularly
poultry business.
In many tropical and developing countries,
involvement of stakeholders is undoubted real.
Some play a vital role in controlling the powers,
resources, and access even controlling the threat
such as issue of green house gases (Iyai and
Runtuboi, 2016) and societal perception
(Mollenhorst and de Boer, 2010; Hou et al.,
2018). They are playing vital roles and sharing
important relationship. Their relationships are rich
and various in shaping the looks and acceleration
rate of poultry development. It seemed that inside
and outside development aspects of poultry
production should be linearly understandable
developed and clearly mapped (Crossley et al.,
2009; Huang et al., 2020; ; Prado-lorenzo and
Gallego-a, 2011; Nurek, 2020; Borgatti et al.,
2003; Springer, 2011; Mandarano, 2009). Without
mapping and understand this poultry business
circle chain, it is hard and difficult to sustain
poultry development, particularly in Indonesia and
specifically in West New Guinea. So far, the
existing stakeholders do not count yet by farmers,
government, and shareholders. They have no
power to bargain and work out from the limitation
and sources of several sufficiency. Therefore,
mapping and having explicit stakeholder input in
what and how they contribute to the poultry sector
has become the focus of studies. One powerful
analysis of social network relationships beside
Gephi (Bastian et al., 2009) and Netmap (Schiffer,
2007) is Social Network Visualizer beside
SmartPLS (Ringle et al., 2005). The Social
Network Analysis (SAN) is so far an adequate and
appropriate software to compute network and
relationship (Crossley et al., 2009; Huang et al.,
2020; Holman, 2008; Krupa et al., 2017). By
mapping the stakeholders, institutions, which have
no power and interest, would identify and in turn,
will be easy to promote their roles
comprehensively. It is, therefore, defining and
valuing the involvement and relationships of
stakeholders according to poultry business sector
become the priority of this research.
MATERIALS AND METHODS
Research was done in Manokwari, West
Papua. We selected several organizations, groups,
and individuals to collect all relevant data and
information. Using desk study of qualitative
research, we collected information from research
report, policy document, articles, daily
newspapers, and magazines. We considered doing
this by the reasons that bunches of information
and data are spread out and available even each
and cheapest to get. We were concerned about the
roles of stakeholders and shareholders in shaping
and determining the pattern of poultry
development in West Papua, particularly in
Manokwari. Manokwari is the central
development of poultry farming according to local
livestock provincial offices. All stakeholders were
grouped into local community, government,
banks, markets, private transportation, and
university.
During the research, we were composed
information and data related to organizational
function and characteristics of the poultry
business-related stakeholders, i.e. shape of the
Jurnal Agripet, Volume 20, No. 2, Oktober 2020
Mapping Strategic and Sustainable Relevant Actors of Poultry Production and Business Using Stakeholder Network Analysis (Desni Triana Ruly Saragih, et al.,)
218
organizations, status of law, types of organization,
roles, effect and importance of organization. We
also tried to collect data and information about
traits and turn-back effect towards poultry farming
development. Through understanding the positions
and involvement of the stakeholders, we have
documented the organization's sharing resources,
the length of the time, the resource consistency,
the power of resources and the organization's
intervention to date. To order to capture the
intervention discussed by the company, we also
analyze to depth what intervention has been
achieved and the types of progress created by
stakeholders. All data was collectively put into
Excel database and manuscript-filed.
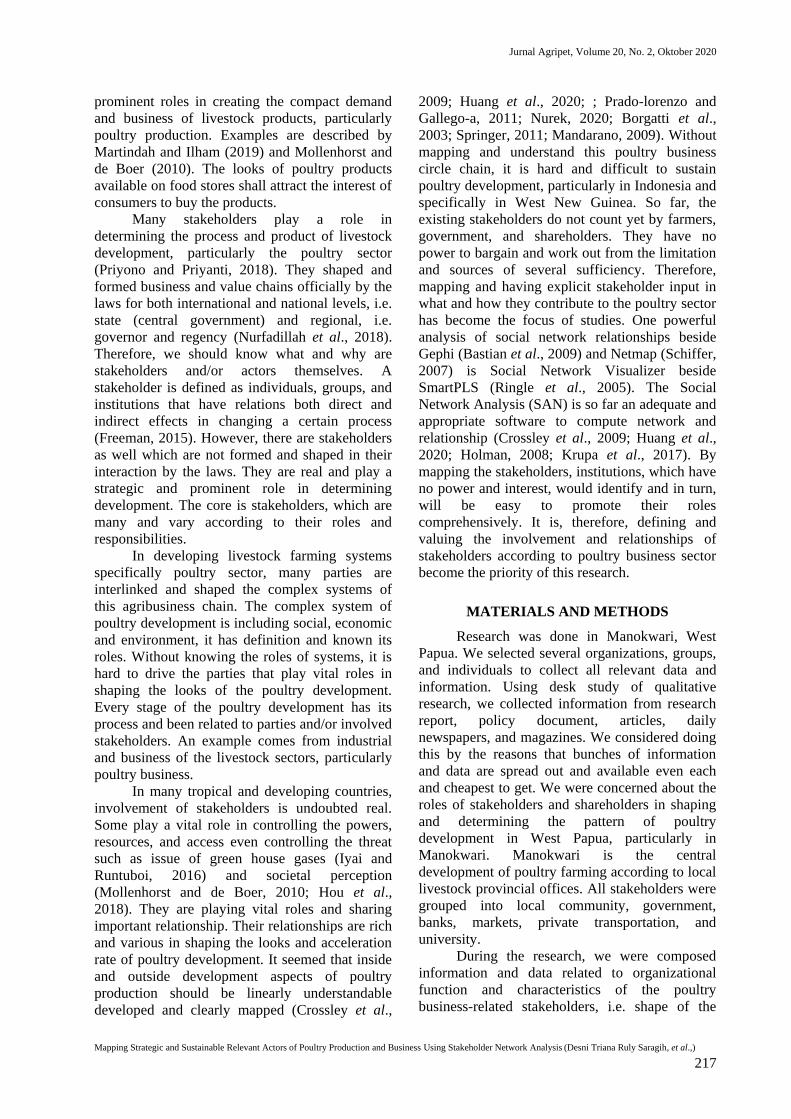
Table 1. Stakeholders and their responsibility and roles under the poultry development sector No Actors Roles and Responsible
1 Poultry farmers Individuals and/or groups who are raising poultry.
2 Breeder Individuals and/or groups who are producing the breed of poultry.
3 Supplier Individuals and/or groups who are providing tools and facilities for
poultry production.
4 Government State institution for both national and local that work to provide policy
and programs and resources with related to poultry production.
5 Extension agent Serving farmers extension services with related to knowledge and skills
of poultry production.
6 Retailer Providing retails for selling poultry production.
7 Inseminator Providing services for animal reproduction.
8 Village cooperation Provide and distribute farmers’ need and production of farmers.
9 Food court/Restaurant Providing animal based product for consumers.
10 Traditional market Provide and distribute sale cuts.
11 Crop farmers Provide feed materials for men, industries and animals.
12 National Shipping Providing shipping facilities for transporting animals.
13 National airplane ZProviding air cargo facilities for transporting animals.
14 Quarantine officer Institution that are working to control transportation of incoming and
out-coming of animals.
15 Police Institution that are working to protect safety of animal transportation,
trading and trafficking.
16 Banks Provide loans and account for the farmers.
17 Consumers Individuals who buy and consume the meat product of poultry.
18 Feeder Provide supply of feed for animals.
19 Retribution officers Provide retribution of taxation for government.
20 Harbor inspector Institution that are working to control transportation of incoming and
out-coming of animals.
21 Airport inspectors Institution that are working to control transportation of incoming and
out-coming of animals.
22 Fishermen Individuals and/or groups of fishermen working to provide fishes and
its products as ingredient for animal feed.
23 Market officers Provide spaces for seller and buyers inside market places.
24 Vehicles agent Individuals who are working to provide transportation in transporting
the animal products and its facilities.
Source: (Manokwari, 2017, 2018, 2019; Papua Barat, 2017, 2018, 2019) (Fapet-UNIPA, 2009; Kabupaten Arfak,
2016; Fapet-UNIPA, 2018)
In analyzing the power and flows of
information amongst stakeholders, we used Social
Network Visualizer (SocNetV). SocNetV is a
cross-platform, light and free of charged social-
stakeholder related software in network analyses
and visualization. To visualize those graphs we
used Pearson Correlation Coefficient (PCC)
matrix, similarity matrix (SM), power centrality
(PC), Hierarchical clustering (HCA), clique
census (CLQs) and information centrality (IC).
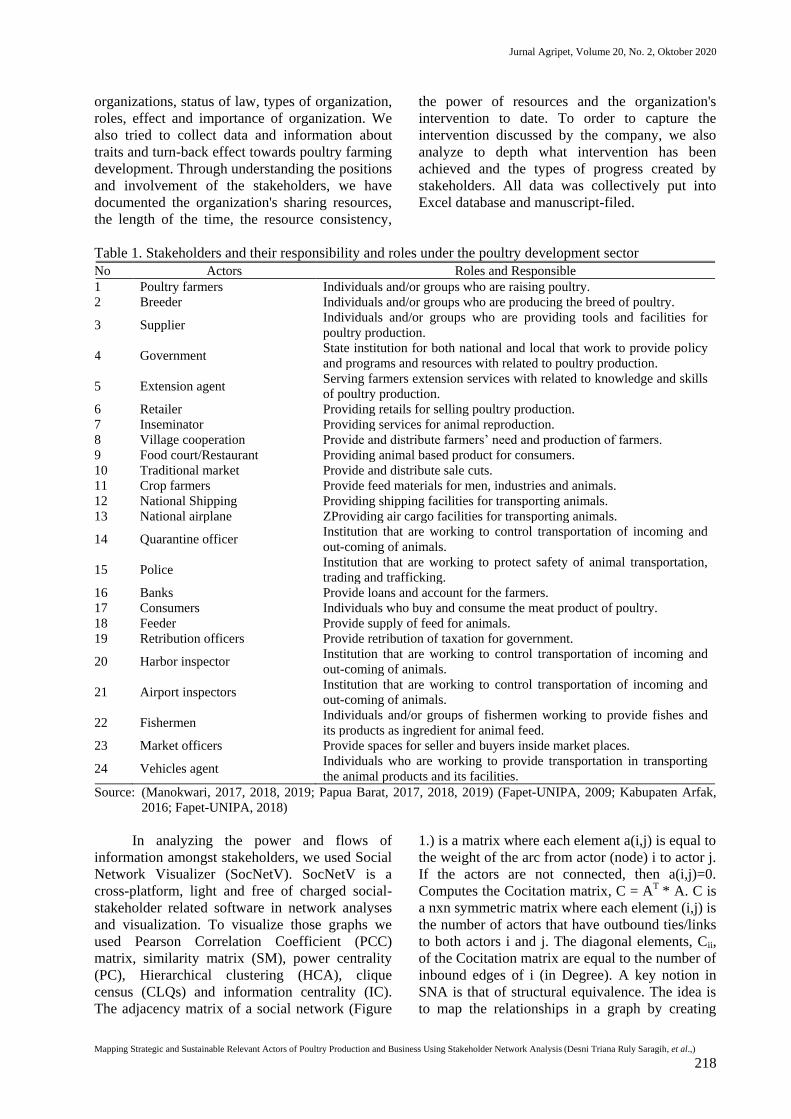
The adjacency matrix of a social network (Figure
1.) is a matrix where each element a(i,j) is equal to
the weight of the arc from actor (node) i to actor j.
If the actors are not connected, then a(i,j)=0.
Computes the Cocitation matrix, C = AT * A. C is
a nxn symmetric matrix where each element (i,j) is
the number of actors that have outbound ties/links
to both actors i and j. The diagonal elements, Cii,
of the Cocitation matrix are equal to the number of
inbound edges of i (in Degree). A key notion in
SNA is that of structural equivalence. The idea is
to map the relationships in a graph by creating
Jurnal Agripet, Volume 20, No. 2, Oktober 2020
Mapping Strategic and Sustainable Relevant Actors of Poultry Production and Business Using Stakeholder Network Analysis (Desni Triana Ruly Saragih, et al.,)
219
classes or groups of actors who are equivalent in
some sense. One way to do that, to identify groups
of actors who are structurally equivalent, is to
examine the relationships between them for
similarity patterns.
There are many methods to measure the
similarity or dissimilarity of actors in a network.
SocNetV supports the following methods:
Similarity by measure and Pearson Correlation
Coefficients. By applying one of these methods,
SocNetV creates a pair-wise actor
similarity/dissimilarity matrix. Computes a pair-
wise actor similarity matrix, where each element
(i,j) is the ratio of tie (or distance) matches of
actors i and j to all other actors. In the case of
Simple Matching, the similarity matrix depicts the
ratios of exact matches of pairs of actors to all
other actors. If the element (i,j) = 0.5, this means
that actors i and j have the same ties present or
absent to other actors 50% of the time. These
measures of similarity are particularly useful when
ties are binary (not valued). Computes a
correlation matrix, where the elements are the
Pearson correlation coefficients between pairs of
actors in terms of their tie profiles or distances (in,
out or both). The Pearson product-moment
correlation coefficient is a measure of the linear
dependence/association between two variables X
and Y. This correlation measure of similarity is
particularly useful when ties are valued/weighted
denoting strength, cost or probability. The Power
Centrality (PC) is a generalized measure of
centrality of degree proposed by Gil and Schmidt.
For each node u, this index sums its degree (with
weight 1), the size of the neighborhood in 2nd
order (with weight 2), and in general, the size of
the neighborhood in kth order (with weight k).
Thus, for each node u the most important other
nodes are its immediate neighbors and then the
nodes of the 2nd-order neighborhood, 3rd-order
neighborhood, etc., are in decreasing importance.
The amounts obtained for each node is defined by
the total node numbers in the same variable minus
1. This index can be computed in both graphs and
digraphs, but is usually better suited
for indirect graph. Hierarchical clustering (or
hierarchical cluster analysis, HCA) is a method of
cluster analysis which builds a hierarchy of
clusters, based on their elements dissimilarity.
In the Stakeholder Network Analysis’s
context, these clusters usually consist of network
actors (Lein, 2004; Hauck et al., 2016; Crossley et
al., 2009; Dempwolf et al., 2012; Nurek, 2020;
Holman, 2008). This method takes the social
network distance matrix as input and uses the
Agglomerative "bottom-up" approach where each
actor starts in its cluster (Level 0). In each
subsequent Level, as we move up the clustering
hierarchy, a pair of clusters are merged into a
larger cluster, until all actors end up in the same
cluster. To decide which clusters should be
combined at each level, a measure of dissimilarity
between sets of observations is required. This
measure consists of a metric for the distance
between actors i.e. manhattan distance) and a
linkage criterion (i.e. single-linkage clustering).
This linkage criterion (essentially a definition of
distance between clusters), differentiates between
the different HCA methods (Crossley et al., 2009;
Blok et al., 2015; Dempwolf et al., 2012). The
result of Hierarchical Cluster Analysis is the
clusters per level and a dendrogram. The concept
of a clique in every life is pretty simple: a clique is
a group of people who interact with each other
much more regularly and intensely than with other
people not belonging in the clique. That is, a
group of people shape a clique if they are all
connected. In formal mathematics, a clique C is
any subset of vertices of an undirected graph G,
such that its induced subgraph is complete. This
means that every two distinct vertices in a clique
are always adjacent. In Social Network Analysis,
the definition of a clique is much more narrow and
precise: A clique is the largest subgroup of actors
in the social network who are all directly
connected In terms of graph theory, this notion is
the same as a maximal complete subgraph of the
equivalent graph of the social network. The word
maximal means that for each clique the group of
its members is expanded to include as many actors
as possible; no other actors can be added to the
clique. Essentially, a clique in Social Network
Analysis consists of several overlapping closed
triads. SocNetV applies the Bron–Kerbosch
algorithm to find all maximal cliques in an
undirected or directed graph. It produces a census
of all MAXIMAL cliques in the network and
reports some useful statistics about these. The
clique census report includes disaggregation by
vertex and co-membership information. The
Information Centrality (IC) is an index proposed
by Stephenson and Zelen (1989) that focuses on
how knowledge might spread over many different
paths. Unlike SC and BC, IC metric uses all the
paths weighted by tie strength and distance
between actors. The score of the IC is the uniform
IC (IC divided by the sumIC) and can be
interpreted as the proportion of the total flow of
information regulated by each actor. Note that
Jurnal Agripet, Volume 20, No. 2, Oktober 2020
Mapping Strategic and Sustainable Relevant Actors of Poultry Production and Business Using Stakeholder Network Analysis (Desni Triana Ruly Saragih, et al.,)
220
standard IC 'values sum to unity, unlike most
other centrality measures.
Since there is no known generalization of
the theory of information centrality to directional
relationships by Stephenson & Zelen, the index
should be calculated only for undirected graphs,
and is more relevant in weighted graphs / network.
Note: In order to calculate this index, SocNetV
drops all isolated nodes and symmetrizes the
adjacency matrix (if necessary), even when the
graph is directed (Wasserman & Faust, p. 196).
Figure 1. Design of actors on a map relationships using SNA under poultry sector.
In order to calculate the IC index of each
actor, we create a N x N matrix A from the
(symmetrized) sociomatrix with: Aii=1+di,
Aij=1 if (i,j)=0, and Aij=1−wij if (i,j)=wij. Next,
we compute the inverse matrix of A, for instance
C, using LU decomposition. Note that we can
always compute C since the matrix A is always a
diagonally strong matrix, hence it is always
invertible. Finally, IC is computed by the formula:
ICi−1Cii+T−2⋅RN, where: T is the trace of matrix
C (the sum of diagonal elements) and R is the sum
of the elements of any row (since all rows of C
have the same sum). IC has a minimum value but
not a maximum. The steps in running this
SocNetV version 2.5 presented Figure 1. To
capture the organization-shared action, we also
look at specifics of what projects are being
performed and the types of creativity that
stakeholders produce. All data collectively entered
into Microsoft Excel worksheet and tabled into
manuscript.
RESULTS
Dynamic Performance of Stakeholders
All stakeholders in the sectors of poultry
farming system (PFS) were grouped into local
community, government, banks, markets, and
private transportation. Local community
organization consisted of poultry farmers,
breeders, suppliers, retailers, village cooperation,
restaurant, crop farmers, consumers, and
fishermen. Government actors consisted of
government, extension servicers, inseminators,
quarantine officers, police, retribution officers,
harbor inspectors, airport inspectors, and market
officers. Private actors are national shipping,
national airplane, and vehicles. Banks consisted of
all financial institution including credit units.
These stakeholders can be grouped based on
working activities, i.e. production up to the
business process. At the level of production,
involved stakeholders are the breeders, feeders,
labors, and crop farmers. At the business process,
stakeholders involved were consumers and harbor
porter. Related- and interlinked-stakeholders
around government are market officers, harbor
officers, inseminator, income office region
(retribution officers), sub-district officer, village
officers, extension services, quarantine officers,
veterinarian, community security, and police
officers. Banks provide credit or loans. The
market provides retailers and food courts. Private
transportation provides shipping and vehicles.
Shapes of the organization as actors in
leading poultry farming systems grouped into
Jurnal Agripet, Volume 20, No. 2, Oktober 2020
Mapping Strategic and Sustainable Relevant Actors of Poultry Production and Business Using Stakeholder Network Analysis (Desni Triana Ruly Saragih, et al.,)
221
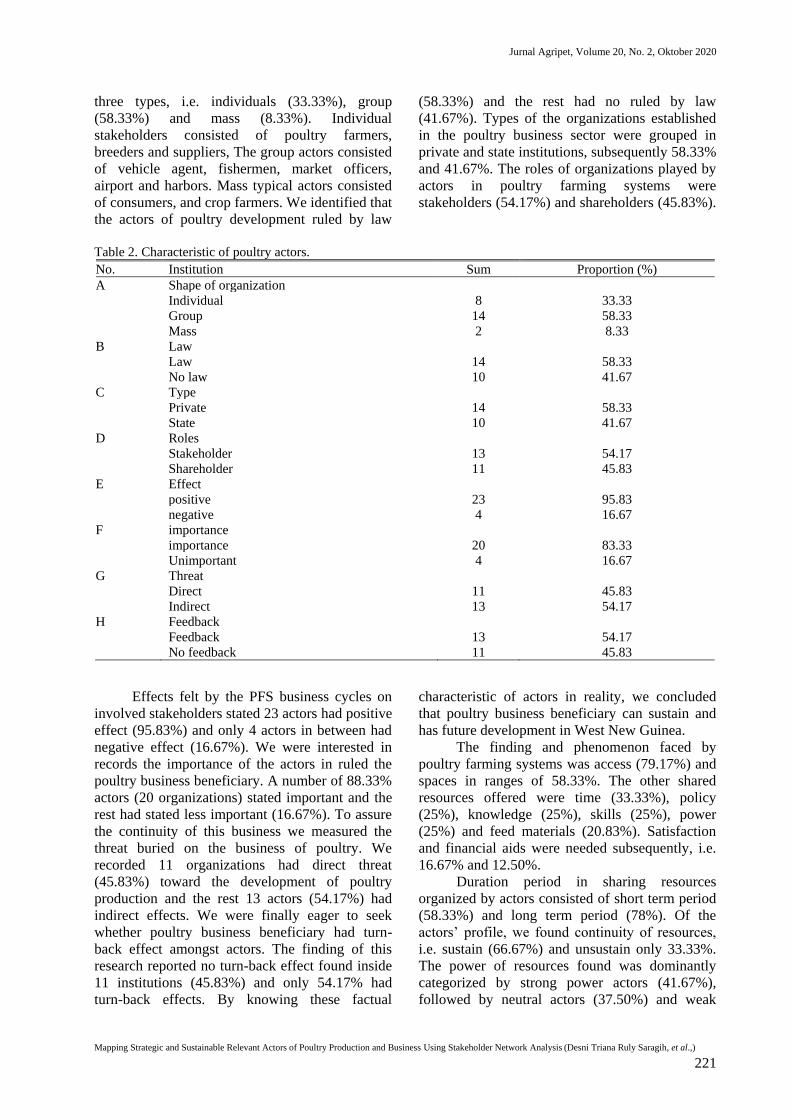
three types, i.e. individuals (33.33%), group
(58.33%) and mass (8.33%). Individual
stakeholders consisted of poultry farmers,
breeders and suppliers, The group actors consisted
of vehicle agent, fishermen, market officers,
airport and harbors. Mass typical actors consisted
of consumers, and crop farmers. We identified that
the actors of poultry development ruled by law
(58.33%) and the rest had no ruled by law
(41.67%). Types of the organizations established
in the poultry business sector were grouped in
private and state institutions, subsequently 58.33%
and 41.67%. The roles of organizations played by
actors in poultry farming systems were
stakeholders (54.17%) and shareholders (45.83%).
Table 2. Characteristic of poultry actors.
No. Institution Sum Proportion (%)
A Shape of organization
Individual 8 33.33
Group 14 58.33
Mass 2 8.33
B Law
Law 14 58.33
No law 10 41.67
C Type
Private 14 58.33
State 10 41.67
D Roles
Stakeholder 13 54.17
Shareholder 11 45.83
E Effect
positive 23 95.83
negative 4 16.67
F importance
importance 20 83.33
Unimportant 4 16.67
G Threat
Direct 11 45.83
Indirect 13 54.17
H Feedback
Feedback 13 54.17
No feedback 11 45.83
Effects felt by the PFS business cycles on
involved stakeholders stated 23 actors had positive
effect (95.83%) and only 4 actors in between had
negative effect (16.67%). We were interested in
records the importance of the actors in ruled the
poultry business beneficiary. A number of 88.33%
actors (20 organizations) stated important and the
rest had stated less important (16.67%). To assure
the continuity of this business we measured the
threat buried on the business of poultry. We
recorded 11 organizations had direct threat
(45.83%) toward the development of poultry
production and the rest 13 actors (54.17%) had
indirect effects. We were finally eager to seek
whether poultry business beneficiary had turn-
back effect amongst actors. The finding of this
research reported no turn-back effect found inside
11 institutions (45.83%) and only 54.17% had
turn-back effects. By knowing these factual
characteristic of actors in reality, we concluded
that poultry business beneficiary can sustain and
has future development in West New Guinea.
The finding and phenomenon faced by
poultry farming systems was access (79.17%) and
spaces in ranges of 58.33%. The other shared
resources offered were time (33.33%), policy
(25%), knowledge (25%), skills (25%), power
(25%) and feed materials (20.83%). Satisfaction
and financial aids were needed subsequently, i.e.
16.67% and 12.50%.
Duration period in sharing resources
organized by actors consisted of short term period
(58.33%) and long term period (78%). Of the
actors’ profile, we found continuity of resources,
i.e. sustain (66.67%) and unsustain only 33.33%.
The power of resources found was dominantly
categorized by strong power actors (41.67%),
followed by neutral actors (37.50%) and weak
Jurnal Agripet, Volume 20, No. 2, Oktober 2020
Mapping Strategic and Sustainable Relevant Actors of Poultry Production and Business Using Stakeholder Network Analysis (Desni Triana Ruly Saragih, et al.,)
222
actors (20.83%). Weak power should be promoted
further intervention and innovation in terms of
resources. Power to market access will enable
income generation reached by farmers. The need
for intervention was found in 12 actors (50%) and
the rest were no need to intervene (50%). Delivery
intervention can be made by using policy, finance,
knowledge, skills and relevant needs (Ventura et
al., 2016; Kodoati et al., 2014). These types of
intervention will further explain in the subsequent
discussions.
Table 3. Resources, power and intervention.
No. Resources Sum Proportion (%)
a. Sharing resources
Policy 6 25
Funds 3 12.5
Space 14 58.33
Time 8 33.33
Access 19 79.17
Satisfaction 4 16.67
Knowledge 6 25
Skills 6 25
Power 6 25
Feed materials 5 20.83
b Duration of period
Short term 14 58.33
Long term 18 75
c Continuity
Sustain 16 66.67
Un Sustain 8 33.33
d Power (Strength)
Strong 10 41.67
Neutral 9 37.5
Weak 5 20.83
e Intervention
Need 12 50
No need 12 50
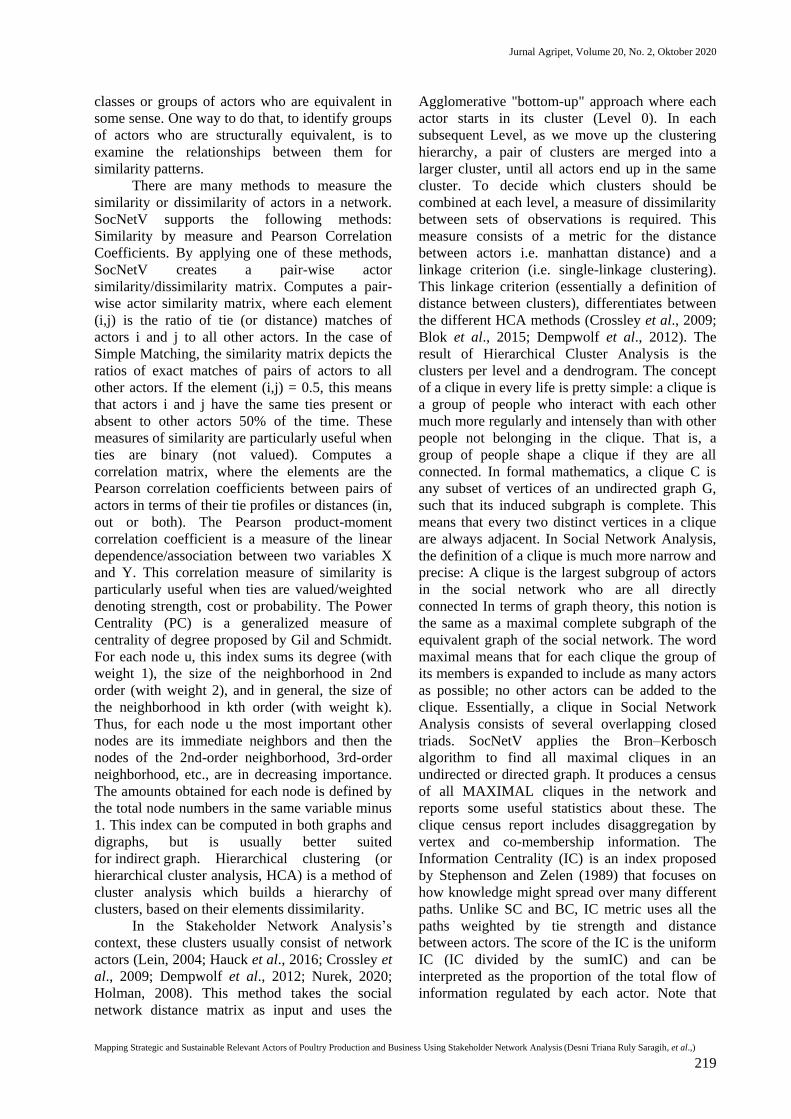
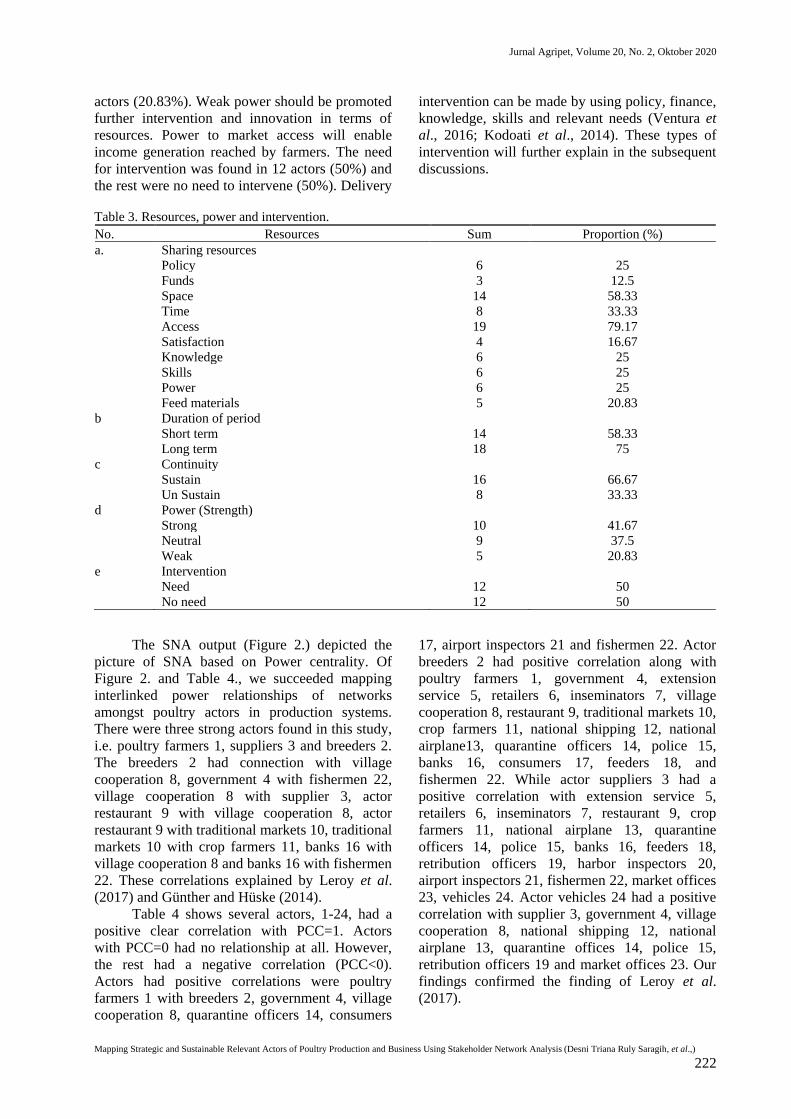
The SNA output (Figure 2.) depicted the
picture of SNA based on Power centrality. Of
Figure 2. and Table 4., we succeeded mapping
interlinked power relationships of networks
amongst poultry actors in production systems.
There were three strong actors found in this study,
i.e. poultry farmers 1, suppliers 3 and breeders 2.
The breeders 2 had connection with village
cooperation 8, government 4 with fishermen 22,
village cooperation 8 with supplier 3, actor
restaurant 9 with village cooperation 8, actor
restaurant 9 with traditional markets 10, traditional
markets 10 with crop farmers 11, banks 16 with
village cooperation 8 and banks 16 with fishermen
22. These correlations explained by Leroy et al.
(2017) and Günther and Hüske (2014).
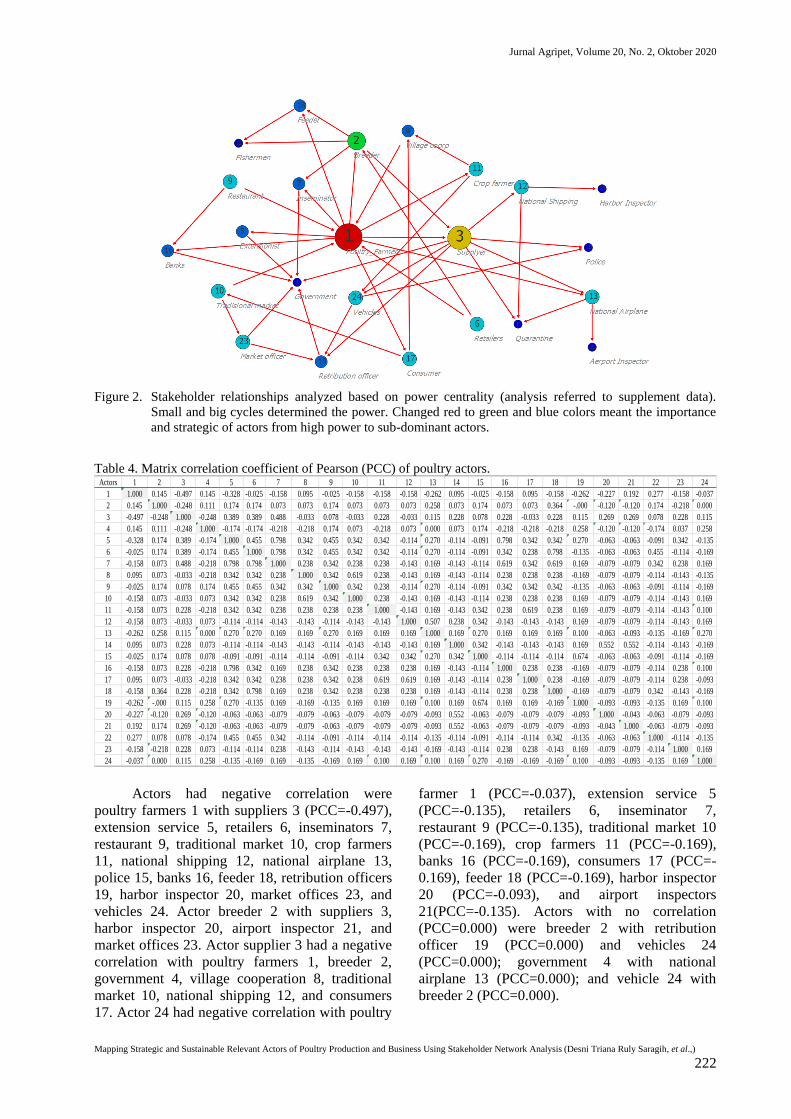
Table 4 shows several actors, 1-24, had a
positive clear correlation with PCC=1. Actors
with PCC=0 had no relationship at all. However,
the rest had a negative correlation (PCC<0).
Actors had positive correlations were poultry
farmers 1 with breeders 2, government 4, village
cooperation 8, quarantine officers 14, consumers
17, airport inspectors 21 and fishermen 22. Actor
breeders 2 had positive correlation along with
poultry farmers 1, government 4, extension
service 5, retailers 6, inseminators 7, village
cooperation 8, restaurant 9, traditional markets 10,
crop farmers 11, national shipping 12, national
airplane13, quarantine officers 14, police 15,
banks 16, consumers 17, feeders 18, and
fishermen 22. While actor suppliers 3 had a
positive correlation with extension service 5,
retailers 6, inseminators 7, restaurant 9, crop
farmers 11, national airplane 13, quarantine
officers 14, police 15, banks 16, feeders 18,
retribution officers 19, harbor inspectors 20,
airport inspectors 21, fishermen 22, market offices
23, vehicles 24. Actor vehicles 24 had a positive
correlation with supplier 3, government 4, village
cooperation 8, national shipping 12, national
airplane 13, quarantine offices 14, police 15,
retribution officers 19 and market offices 23. Our
findings confirmed the finding of Leroy et al.
(2017).

Jurnal Agripet, Volume 20, No. 2, Oktober 2020
Mapping Strategic and Sustainable Relevant Actors of Poultry Production and Business Using Stakeholder Network Analysis (Desni Triana Ruly Saragih, et al.,)
222
Figure 2. Stakeholder relationships analyzed based on power centrality (analysis referred to supplement data).
Small and big cycles determined the power. Changed red to green and blue colors meant the importance
and strategic of actors from high power to sub-dominant actors.
Table 4. Matrix correlation coefficient of Pearson (PCC) of poultry actors. Actors 1 2 3 4 5 6 7 8 9 10 11 12 13 14 15 16 17 18 19 20 21 22 23 24
1 1.000 0.145 -0.497 0.145 -0.328 -0.025 -0.158 0.095 -0.025 -0.158 -0.158 -0.158 -0.262 0.095 -0.025 -0.158 0.095 -0.158 -0.262 -0.227 0.192 0.277 -0.158 -0.037
2 0.145 1.000 -0.248 0.111 0.174 0.174 0.073 0.073 0.174 0.073 0.073 0.073 0.258 0.073 0.174 0.073 0.073 0.364 -.000 -0.120 -0.120 0.174 -0.218 0.000
3 -0.497 -0.248 1.000 -0.248 0.389 0.389 0.488 -0.033 0.078 -0.033 0.228 -0.033 0.115 0.228 0.078 0.228 -0.033 0.228 0.115 0.269 0.269 0.078 0.228 0.115
4 0.145 0.111 -0.248 1.000 -0.174 -0.174 -0.218 -0.218 0.174 0.073 -0.218 0.073 0.000 0.073 0.174 -0.218 -0.218 -0.218 0.258 -0.120 -0.120 -0.174 0.037 0.258
5 -0.328 0.174 0.389 -0.174 1.000 0.455 0.798 0.342 0.455 0.342 0.342 -0.114 0.270 -0.114 -0.091 0.798 0.342 0.342 0.270 -0.063 -0.063 -0.091 0.342 -0.135
6 -0.025 0.174 0.389 -0.174 0.455 1.000 0.798 0.342 0.455 0.342 0.342 -0.114 0.270 -0.114 -0.091 0.342 0.238 0.798 -0.135 -0.063 -0.063 0.455 -0.114 -0.169
7 -0.158 0.073 0.488 -0.218 0.798 0.798 1.000 0.238 0.342 0.238 0.238 -0.143 0.169 -0.143 -0.114 0.619 0.342 0.619 0.169 -0.079 -0.079 0.342 0.238 0.169
8 0.095 0.073 -0.033 -0.218 0.342 0.342 0.238 1.000 0.342 0.619 0.238 -0.143 0.169 -0.143 -0.114 0.238 0.238 0.238 -0.169 -0.079 -0.079 -0.114 -0.143 -0.135
9 -0.025 0.174 0.078 0.174 0.455 0.455 0.342 0.342 1.000 0.342 0.238 -0.114 0.270 -0.114 -0.091 0.342 0.342 0.342 -0.135 -0.063 -0.063 -0.091 -0.114 -0.169
10 -0.158 0.073 -0.033 0.073 0.342 0.342 0.238 0.619 0.342 1.000 0.238 -0.143 0.169 -0.143 -0.114 0.238 0.238 0.238 0.169 -0.079 -0.079 -0.114 -0.143 0.169
11 -0.158 0.073 0.228 -0.218 0.342 0.342 0.238 0.238 0.238 0.238 1.000 -0.143 0.169 -0.143 0.342 0.238 0.619 0.238 0.169 -0.079 -0.079 -0.114 -0.143 0.100
12 -0.158 0.073 -0.033 0.073 -0.114 -0.114 -0.143 -0.143 -0.114 -0.143 -0.143 1.000 0.507 0.238 0.342 -0.143 -0.143 -0.143 0.169 -0.079 -0.079 -0.114 -0.143 0.169
13 -0.262 0.258 0.115 0.000 0.270 0.270 0.169 0.169 0.270 0.169 0.169 0.169 1.000 0.169 0.270 0.169 0.169 0.169 0.100 -0.063 -0.093 -0.135 -0.169 0.270
14 0.095 0.073 0.228 0.073 -0.114 -0.114 -0.143 -0.143 -0.114 -0.143 -0.143 -0.143 0.169 1.000 0.342 -0.143 -0.143 -0.143 0.169 0.552 0.552 -0.114 -0.143 -0.169
15 -0.025 0.174 0.078 0.078 -0.091 -0.091 -0.114 -0.114 -0.091 -0.114 0.342 0.342 0.270 0.342 1.000 -0.114 -0.114 -0.114 0.674 -0.063 -0.063 -0.091 -0.114 -0.169
16 -0.158 0.073 0.228 -0.218 0.798 0.342 0.169 0.238 0.342 0.238 0.238 0.238 0.169 -0.143 -0.114 1.000 0.238 0.238 -0.169 -0.079 -0.079 -0.114 0.238 0.100
17 0.095 0.073 -0.033 -0.218 0.342 0.342 0.238 0.238 0.342 0.238 0.619 0.619 0.169 -0.143 -0.114 0.238 1.000 0.238 -0.169 -0.079 -0.079 -0.114 0.238 -0.093
18 -0.158 0.364 0.228 -0.218 0.342 0.798 0.169 0.238 0.342 0.238 0.238 0.238 0.169 -0.143 -0.114 0.238 0.238 1.000 -0.169 -0.079 -0.079 0.342 -0.143 -0.169
19 -0.262 -.000 0.115 0.258 0.270 -0.135 0.169 -0.169 -0.135 0.169 0.169 0.169 0.100 0.169 0.674 0.169 0.169 -0.169 1.000 -0.093 -0.093 -0.135 0.169 0.100
20 -0.227 -0.120 0.269 -0.120 -0.063 -0.063 -0.079 -0.079 -0.063 -0.079 -0.079 -0.079 -0.093 0.552 -0.063 -0.079 -0.079 -0.079 -0.093 1.000 -0.043 -0.063 -0.079 -0.093
21 0.192 0.174 0.269 -0.120 -0.063 -0.063 -0.079 -0.079 -0.063 -0.079 -0.079 -0.079 -0.093 0.552 -0.063 -0.079 -0.079 -0.079 -0.093 -0.043 1.000 -0.063 -0.079 -0.093
22 0.277 0.078 0.078 -0.174 0.455 0.455 0.342 -0.114 -0.091 -0.114 -0.114 -0.114 -0.135 -0.114 -0.091 -0.114 -0.114 0.342 -0.135 -0.063 -0.063 1.000 -0.114 -0.135
23 -0.158 -0.218 0.228 0.073 -0.114 -0.114 0.238 -0.143 -0.114 -0.143 -0.143 -0.143 -0.169 -0.143 -0.114 0.238 0.238 -0.143 0.169 -0.079 -0.079 -0.114 1.000 0.169
24 -0.037 0.000 0.115 0.258 -0.135 -0.169 0.169 -0.135 -0.169 0.169 0.100 0.169 0.100 0.169 0.270 -0.169 -0.169 -0.169 0.100 -0.093 -0.093 -0.135 0.169 1.000
Actors had negative correlation were
poultry farmers 1 with suppliers 3 (PCC=-0.497),
extension service 5, retailers 6, inseminators 7,
restaurant 9, traditional market 10, crop farmers
11, national shipping 12, national airplane 13,
police 15, banks 16, feeder 18, retribution officers
19, harbor inspector 20, market offices 23, and
vehicles 24. Actor breeder 2 with suppliers 3,
harbor inspector 20, airport inspector 21, and
market offices 23. Actor supplier 3 had a negative
correlation with poultry farmers 1, breeder 2,
government 4, village cooperation 8, traditional
market 10, national shipping 12, and consumers
17. Actor 24 had negative correlation with poultry
farmer 1 (PCC=-0.037), extension service 5
(PCC=-0.135), retailers 6, inseminator 7,
restaurant 9 (PCC=-0.135), traditional market 10
(PCC=-0.169), crop farmers 11 (PCC=-0.169),
banks 16 (PCC=-0.169), consumers 17 (PCC=-
0.169), feeder 18 (PCC=-0.169), harbor inspector
20 (PCC=-0.093), and airport inspectors
21(PCC=-0.135). Actors with no correlation
(PCC=0.000) were breeder 2 with retribution
officer 19 (PCC=0.000) and vehicles 24
(PCC=0.000); government 4 with national
airplane 13 (PCC=0.000); and vehicle 24 with
breeder 2 (PCC=0.000).
Jurnal Agripet, Volume 20, No. 2, Oktober 2020
Mapping Strategic and Sustainable Relevant Actors of Poultry Production and Business Using Stakeholder Network Analysis (Desni Triana Ruly Saragih, et al.,)
224
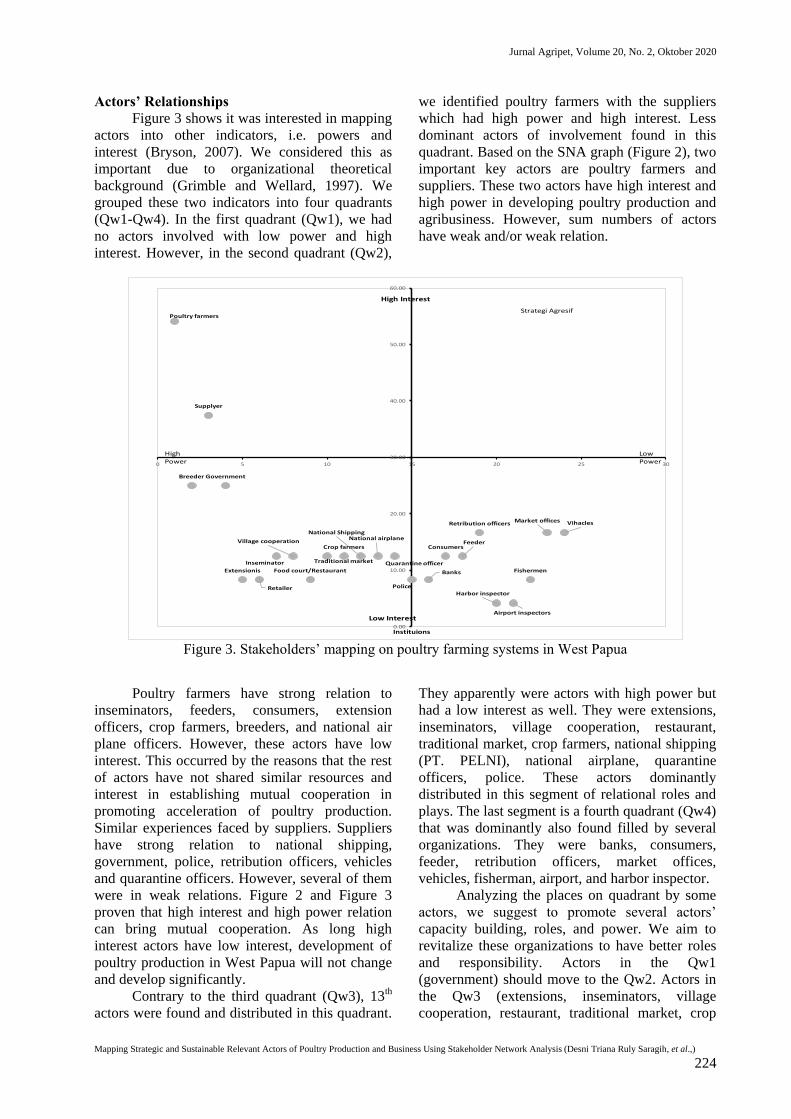
Actors’ Relationships
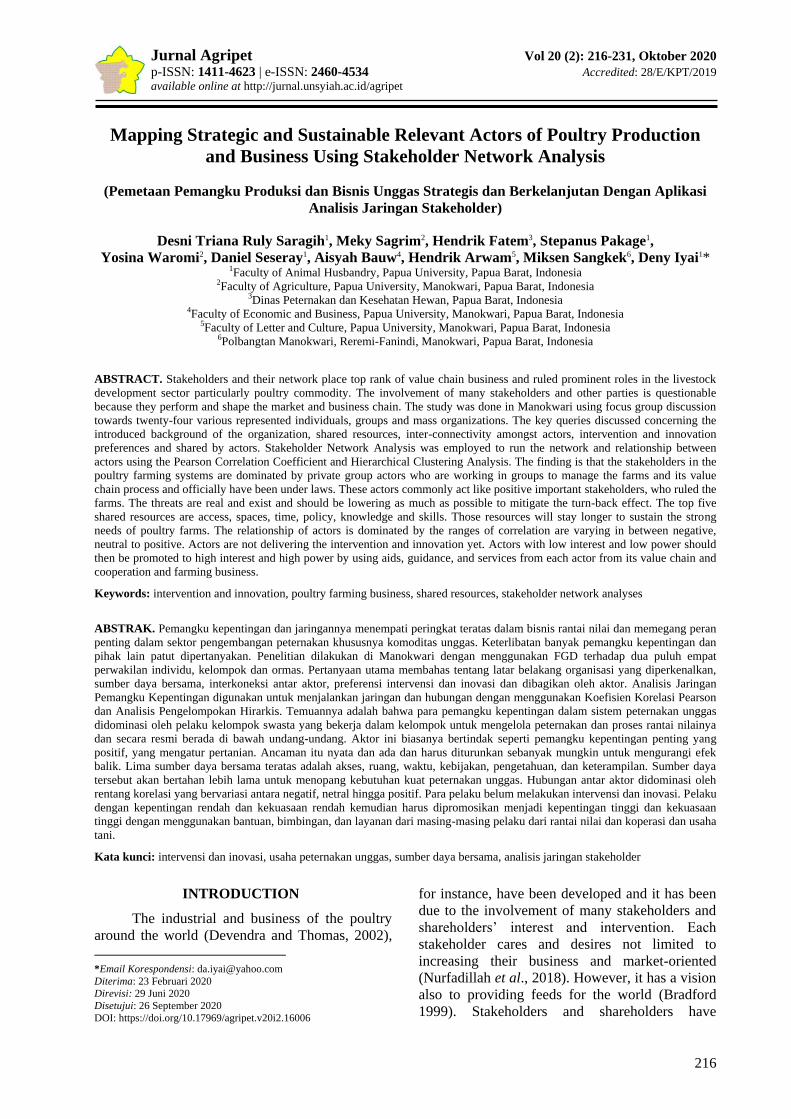
Figure 3 shows it was interested in mapping
actors into other indicators, i.e. powers and
interest (Bryson, 2007). We considered this as
important due to organizational theoretical
background (Grimble and Wellard, 1997). We
grouped these two indicators into four quadrants
(Qw1-Qw4). In the first quadrant (Qw1), we had
no actors involved with low power and high
interest. However, in the second quadrant (Qw2),
we identified poultry farmers with the suppliers
which had high power and high interest. Less
dominant actors of involvement found in this
quadrant. Based on the SNA graph (Figure 2), two
important key actors are poultry farmers and
suppliers. These two actors have high interest and
high power in developing poultry production and
agribusiness. However, sum numbers of actors
have weak and/or weak relation.
Poultry farmers
Breeder
Supplyer
Government
Extensionis
Retailer
Inseminator
Village cooperation
Food court/Restaurant
Traditional market
Crop farmers
National ShippingNational airplane
Quarantine officer
Police
Banks
ConsumersFeeder
Retribution officers
Harbor inspector
Airport inspectors
Fishermen
Market offices Vihacles
0.00
10.00
20.00
30.00
40.00
50.00
60.00
0 5 10 15 20 25 30
Instituions
High Interest
Low Interest
High Power
Low Power
Strategi Agresif
Figure 3. Stakeholders’ mapping on poultry farming systems in West Papua
Poultry farmers have strong relation to
inseminators, feeders, consumers, extension
officers, crop farmers, breeders, and national air
plane officers. However, these actors have low
interest. This occurred by the reasons that the rest
of actors have not shared similar resources and
interest in establishing mutual cooperation in
promoting acceleration of poultry production.
Similar experiences faced by suppliers. Suppliers
have strong relation to national shipping,
government, police, retribution officers, vehicles
and quarantine officers. However, several of them
were in weak relations. Figure 2 and Figure 3
proven that high interest and high power relation
can bring mutual cooperation. As long high
interest actors have low interest, development of
poultry production in West Papua will not change
and develop significantly.
Contrary to the third quadrant (Qw3), 13th
actors were found and distributed in this quadrant.
They apparently were actors with high power but
had a low interest as well. They were extensions,
inseminators, village cooperation, restaurant,
traditional market, crop farmers, national shipping
(PT. PELNI), national airplane, quarantine
officers, police. These actors dominantly
distributed in this segment of relational roles and
plays. The last segment is a fourth quadrant (Qw4)
that was dominantly also found filled by several
organizations. They were banks, consumers,
feeder, retribution officers, market offices,
vehicles, fisherman, airport, and harbor inspector.
Analyzing the places on quadrant by some
actors, we suggest to promote several actors’
capacity building, roles, and power. We aim to
revitalize these organizations to have better roles
and responsibility. Actors in the Qw1
(government) should move to the Qw2. Actors in
the Qw3 (extensions, inseminators, village
cooperation, restaurant, traditional market, crop
Jurnal Agripet, Volume 20, No. 2, Oktober 2020
Mapping Strategic and Sustainable Relevant Actors of Poultry Production and Business Using Stakeholder Network Analysis (Desni Triana Ruly Saragih, et al.,)
225
farmers, national shipping, national airplane,
quarantine officers, and police) should move as
well in the Qw2. And finally, actors in Qw4
(banks, consumers, feeder, retribution officers,
market offices, vehicles, fisherman, airport, and
harbor inspector) shall move to Qw2. This is done
by reasons that actors will have better high interest
and high power.
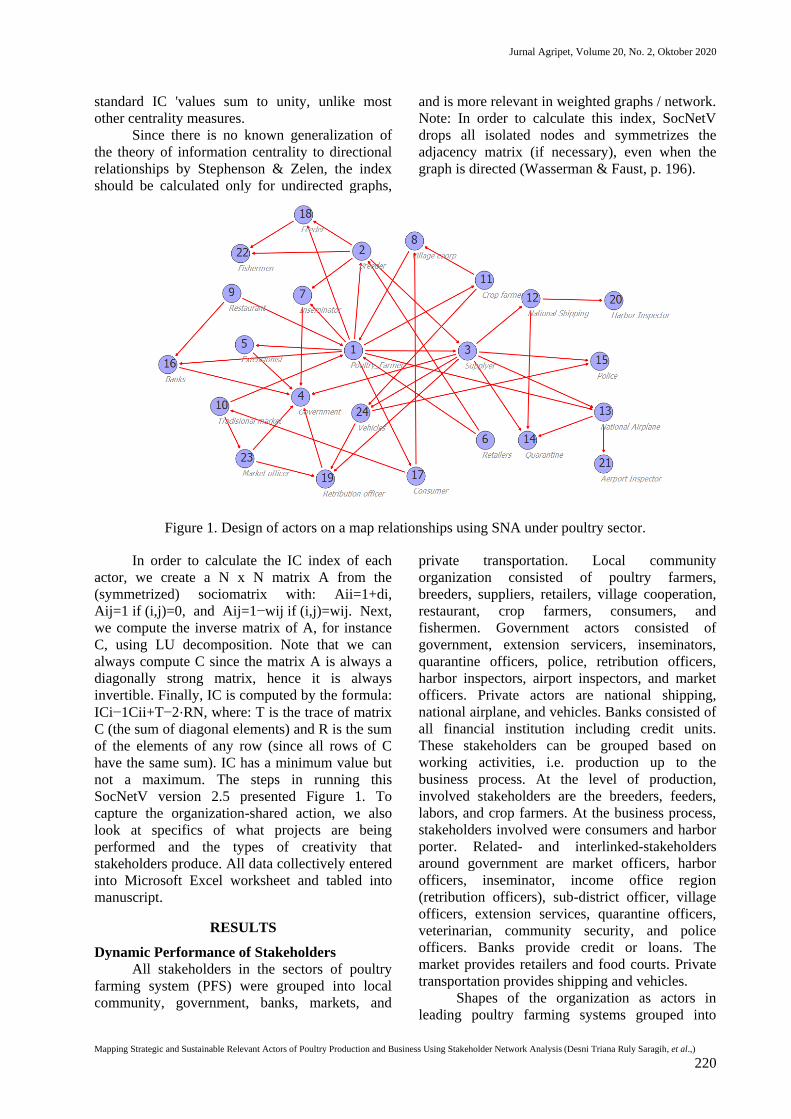
Seeing this importation of actors’ network
analyses (ANA), we pursued it by analyzing
clustering using Hierarchical Cluster Analysis
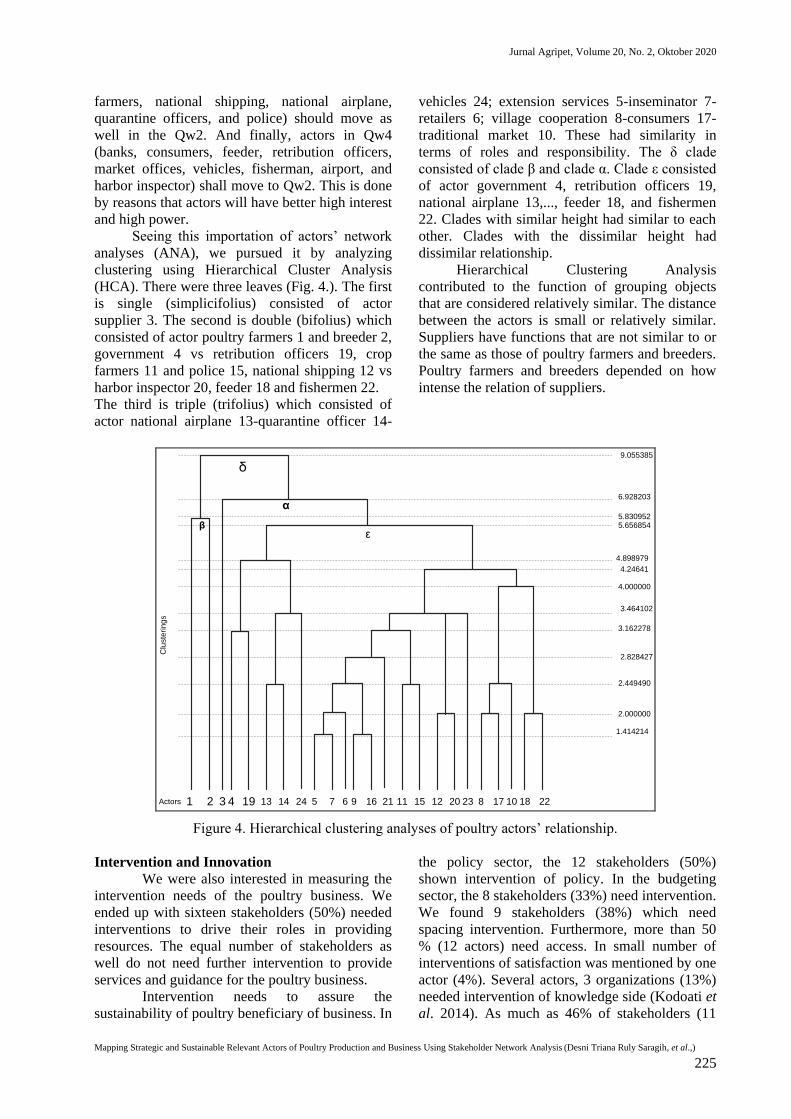
(HCA). There were three leaves (Fig. 4.). The first
is single (simplicifolius) consisted of actor
supplier 3. The second is double (bifolius) which
consisted of actor poultry farmers 1 and breeder 2,
government 4 vs retribution officers 19, crop
farmers 11 and police 15, national shipping 12 vs
harbor inspector 20, feeder 18 and fishermen 22.
The third is triple (trifolius) which consisted of
actor national airplane 13-quarantine officer 14-
vehicles 24; extension services 5-inseminator 7-
retailers 6; village cooperation 8-consumers 17-
traditional market 10. These had similarity in
terms of roles and responsibility. The δ clade
consisted of clade β and clade α. Clade ε consisted
of actor government 4, retribution officers 19,
national airplane 13,..., feeder 18, and fishermen
22. Clades with similar height had similar to each
other. Clades with the dissimilar height had
dissimilar relationship.
Hierarchical Clustering Analysis
contributed to the function of grouping objects
that are considered relatively similar. The distance
between the actors is small or relatively similar.
Suppliers have functions that are not similar to or
the same as those of poultry farmers and breeders.
Poultry farmers and breeders depended on how
intense the relation of suppliers.
1 2 3 4 19 13 14 24 5 7 6 9 16 21 11 15 12 20 23 8 17 10 18 22
9.055385
6.928203
5.8309525.656854
4.898979
4.24641
4.000000
3.464102
3.162278
2.828427
2.449490
2.000000
1.414214
Clu
ste
rin
gs
Actors
δ
β
α
ε
Figure 4. Hierarchical clustering analyses of poultry actors’ relationship.
Intervention and Innovation
We were also interested in measuring the
intervention needs of the poultry business. We
ended up with sixteen stakeholders (50%) needed
interventions to drive their roles in providing
resources. The equal number of stakeholders as
well do not need further intervention to provide
services and guidance for the poultry business.
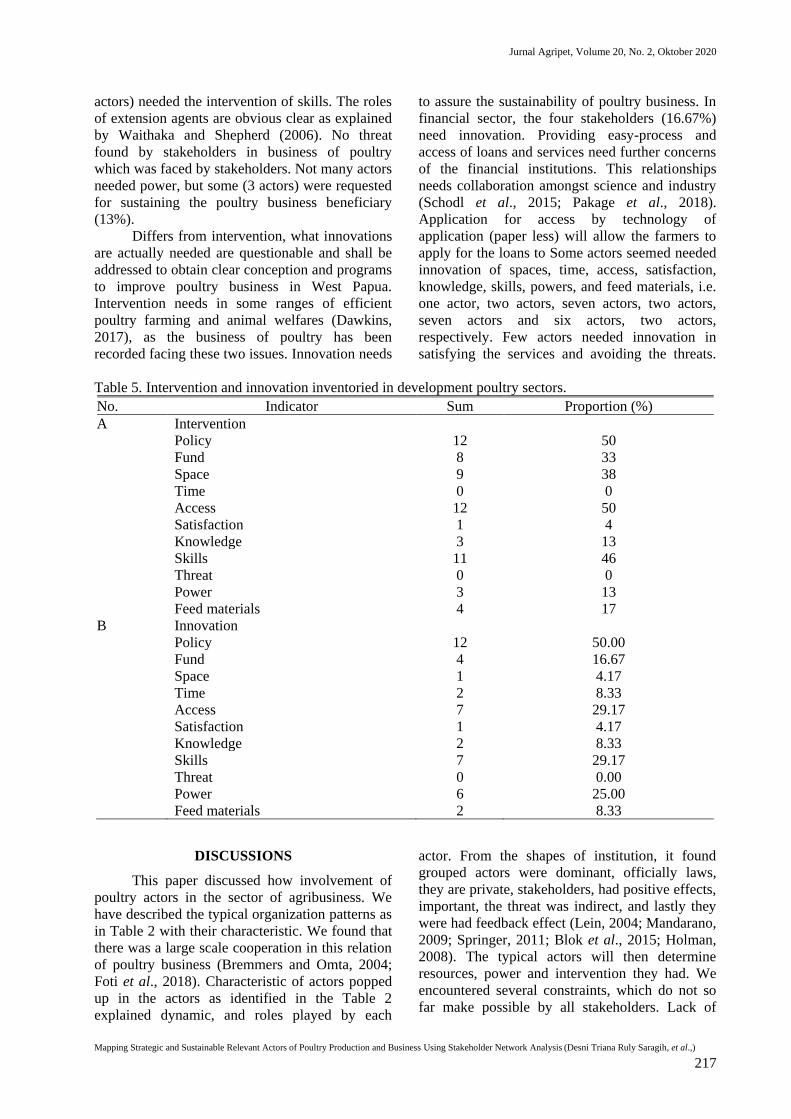
Intervention needs to assure the
sustainability of poultry beneficiary of business. In
the policy sector, the 12 stakeholders (50%)
shown intervention of policy. In the budgeting
sector, the 8 stakeholders (33%) need intervention.
We found 9 stakeholders (38%) which need
spacing intervention. Furthermore, more than 50
% (12 actors) need access. In small number of
interventions of satisfaction was mentioned by one
actor (4%). Several actors, 3 organizations (13%)
needed intervention of knowledge side (Kodoati et
al. 2014). As much as 46% of stakeholders (11
Jurnal Agripet, Volume 20, No. 2, Oktober 2020
Mapping Strategic and Sustainable Relevant Actors of Poultry Production and Business Using Stakeholder Network Analysis (Desni Triana Ruly Saragih, et al.,)
217
actors) needed the intervention of skills. The roles
of extension agents are obvious clear as explained
by Waithaka and Shepherd (2006). No threat
found by stakeholders in business of poultry
which was faced by stakeholders. Not many actors
needed power, but some (3 actors) were requested
for sustaining the poultry business beneficiary
(13%).
Differs from intervention, what innovations
are actually needed are questionable and shall be
addressed to obtain clear conception and programs
to improve poultry business in West Papua.
Intervention needs in some ranges of efficient
poultry farming and animal welfares (Dawkins,
2017), as the business of poultry has been
recorded facing these two issues. Innovation needs
to assure the sustainability of poultry business. In
financial sector, the four stakeholders (16.67%)
need innovation. Providing easy-process and
access of loans and services need further concerns
of the financial institutions. This relationships
needs collaboration amongst science and industry
(Schodl et al., 2015; Pakage et al., 2018).
Application for access by technology of
application (paper less) will allow the farmers to
apply for the loans to Some actors seemed needed
innovation of spaces, time, access, satisfaction,
knowledge, skills, powers, and feed materials, i.e.
one actor, two actors, seven actors, two actors,
seven actors and six actors, two actors,
respectively. Few actors needed innovation in
satisfying the services and avoiding the threats.
Table 5. Intervention and innovation inventoried in development poultry sectors.
No. Indicator Sum Proportion (%)
A Intervention
Policy 12 50
Fund 8 33
Space 9 38
Time 0 0
Access 12 50
Satisfaction 1 4
Knowledge 3 13
Skills 11 46
Threat 0 0
Power 3 13
Feed materials 4 17
B Innovation
Policy 12 50.00
Fund 4 16.67
Space 1 4.17
Time 2 8.33
Access 7 29.17
Satisfaction 1 4.17
Knowledge 2 8.33
Skills 7 29.17
Threat 0 0.00
Power 6 25.00
Feed materials 2 8.33
DISCUSSIONS
This paper discussed how involvement of
poultry actors in the sector of agribusiness. We
have described the typical organization patterns as
in Table 2 with their characteristic. We found that
there was a large scale cooperation in this relation
of poultry business (Bremmers and Omta, 2004;
Foti et al., 2018). Characteristic of actors popped
up in the actors as identified in the Table 2
explained dynamic, and roles played by each
actor. From the shapes of institution, it found
grouped actors were dominant, officially laws,
they are private, stakeholders, had positive effects,
important, the threat was indirect, and lastly they
were had feedback effect (Lein, 2004; Mandarano,
2009; Springer, 2011; Blok et al., 2015; Holman,
2008). The typical actors will then determine
resources, power and intervention they had. We
encountered several constraints, which do not so
far make possible by all stakeholders. Lack of
Jurnal Agripet, Volume 20, No. 2, Oktober 2020
Mapping Strategic and Sustainable Relevant Actors of Poultry Production and Business Using Stakeholder Network Analysis (Desni Triana Ruly Saragih, et al.,)
228
services (Nguthi, 2007), programs (Baltenweck et
al., 2019), budgets (Mayulu and Sutrisno, 2014)
and human resources (Iyai et al., 2016; Asminaya
et al., 2018), i.e. community services, loans,
facilities (slaughtering house, shipping, restaurant,
market, business unit, mini feed meal), rules and
regulations, technical poultry production (breeding
and low production), policy (importation, taxes
and retribution) and safety of business (killed
animals, thief, death). Access played significant
role in driving fluent dynamic and continuity of
the sustainable poultry development(Mollenhorst
and de Boer, 2010; Mutibvu et al., 2012;
Devendra and Sevilla, 2002; Bradford, 1999;
Devendra, 2004). Spaces was in line with land
availability, followed by time and policy. It seems
that the existence of the actors would like be
induced by these four aspects.
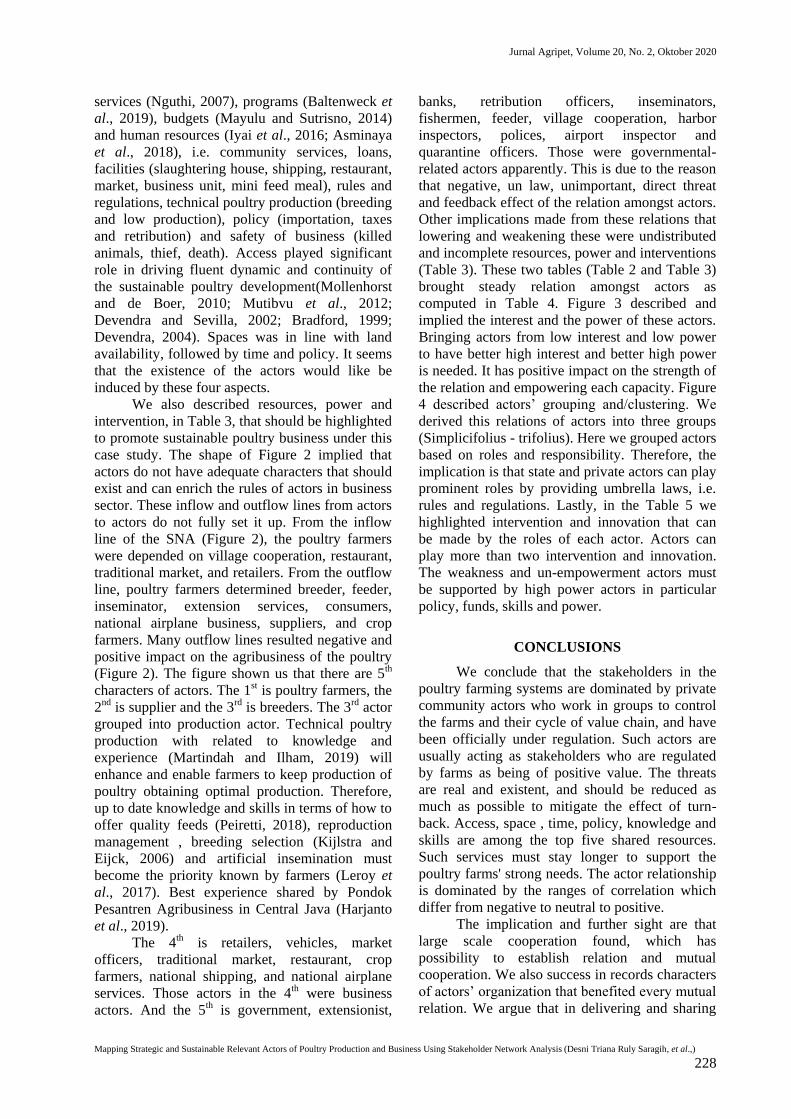
We also described resources, power and
intervention, in Table 3, that should be highlighted
to promote sustainable poultry business under this
case study. The shape of Figure 2 implied that
actors do not have adequate characters that should
exist and can enrich the rules of actors in business
sector. These inflow and outflow lines from actors
to actors do not fully set it up. From the inflow
line of the SNA (Figure 2), the poultry farmers
were depended on village cooperation, restaurant,
traditional market, and retailers. From the outflow
line, poultry farmers determined breeder, feeder,
inseminator, extension services, consumers,
national airplane business, suppliers, and crop
farmers. Many outflow lines resulted negative and
positive impact on the agribusiness of the poultry
(Figure 2). The figure shown us that there are 5th
characters of actors. The 1st is poultry farmers, the
2nd is supplier and the 3rd is breeders. The 3rd actor
grouped into production actor. Technical poultry
production with related to knowledge and
experience (Martindah and Ilham, 2019) will
enhance and enable farmers to keep production of
poultry obtaining optimal production. Therefore,
up to date knowledge and skills in terms of how to
offer quality feeds (Peiretti, 2018), reproduction
management , breeding selection (Kijlstra and
Eijck, 2006) and artificial insemination must
become the priority known by farmers (Leroy et
al., 2017). Best experience shared by Pondok
Pesantren Agribusiness in Central Java (Harjanto
et al., 2019).
The 4th is retailers, vehicles, market
officers, traditional market, restaurant, crop
farmers, national shipping, and national airplane
services. Those actors in the 4th were business
actors. And the 5th is government, extensionist,
banks, retribution officers, inseminators,
fishermen, feeder, village cooperation, harbor
inspectors, polices, airport inspector and
quarantine officers. Those were governmental-
related actors apparently. This is due to the reason
that negative, un law, unimportant, direct threat
and feedback effect of the relation amongst actors.
Other implications made from these relations that
lowering and weakening these were undistributed
and incomplete resources, power and interventions
(Table 3). These two tables (Table 2 and Table 3)
brought steady relation amongst actors as
computed in Table 4. Figure 3 described and
implied the interest and the power of these actors.
Bringing actors from low interest and low power
to have better high interest and better high power
is needed. It has positive impact on the strength of
the relation and empowering each capacity. Figure
4 described actors’ grouping and/clustering. We
derived this relations of actors into three groups
(Simplicifolius - trifolius). Here we grouped actors
based on roles and responsibility. Therefore, the
implication is that state and private actors can play
prominent roles by providing umbrella laws, i.e.
rules and regulations. Lastly, in the Table 5 we
highlighted intervention and innovation that can
be made by the roles of each actor. Actors can
play more than two intervention and innovation.
The weakness and un-empowerment actors must
be supported by high power actors in particular
policy, funds, skills and power.
CONCLUSIONS
We conclude that the stakeholders in the
poultry farming systems are dominated by private
community actors who work in groups to control
the farms and their cycle of value chain, and have
been officially under regulation. Such actors are
usually acting as stakeholders who are regulated
by farms as being of positive value. The threats
are real and existent, and should be reduced as
much as possible to mitigate the effect of turn-
back. Access, space , time, policy, knowledge and
skills are among the top five shared resources.
Such services must stay longer to support the
poultry farms' strong needs. The actor relationship
is dominated by the ranges of correlation which
differ from negative to neutral to positive.
The implication and further sight are that
large scale cooperation found, which has
possibility to establish relation and mutual
cooperation. We also success in records characters
of actors’ organization that benefited every mutual
relation. We argue that in delivering and sharing
Jurnal Agripet, Volume 20, No. 2, Oktober 2020
Mapping Strategic and Sustainable Relevant Actors of Poultry Production and Business Using Stakeholder Network Analysis (Desni Triana Ruly Saragih, et al.,)
229
resources, power and intervention, under these
relationship, each mutual actor can have similar
understanding and trust in promoting better
sustainable poultry development.
This paper presents broad and specific
actors’ relationship particularly in poultry
business. We believe the concept of this actors’
relations can bring new insight in mapping
complexity of organizations and institution
involvement. The concept can be employed for
other cases with related to livestock development
in other world by investigating organization
characteristic of actors, addressing resources,
power and intervention. Further analyses can be
proceeded by computing Correlation Coefficient
of Pearson (PCC) and mapping the interest and
power in two dimensional graph and lastly
inventorying all intervention and innovation that
seems can be achievable.
REFERENCES
Asminaya, N.S., Purwanto, B.P., Nahrowi, N.,
Ridwan, W.A., Atabany, A., 2018.
Ecological Sustainability of smallholder
dairy farm with leisa pattern. J. Indonesian
Trop. Anim. Agric. 43 (60): 412–20.
https://doi.org/10.14710/jitaa.43.4.412-420.
Baltenweck, I., Banerjee, R., Omondi, I., 2019.
Leveraging Development Programs –
Livestock Research. Encyclopedia of Food
Security and Sustainability 3: 401-10.
https://doi.org/10.1016/B978-0-08-100596-
5.21564-3.
Bastian, M., Heymann, S., Jacomy, M., 2009.
Gephi : An Open Source Software for
Exploring and Manipulating Networks
Visualization and Exploration of Large
Graphs. International AAAI Conference on
Weblogs and Social Media, 361–62.
https://doi.org/10.13140/2.1.1341.1520.
Blok, V., Hoffmans, L., Wubben, E.F.M., 2015.
Stakeholder Engagement for Responsible
Innovation in the Private Sector : Critical
Issues and Management Practices. 15(2):
147-64.
https://doi.org/10.3920/JCNS2015.x003.
Borgatti, S.P., Cross, R., 2003. A Relational View
of Information Seeking and Learning in
Social Networks, no. January 2015.
Bradford, G.E., 1999. Contributions of Animal
Agriculture to Meeting Global Human Food
Demand. 59: 95-112.
Bremmers, H., Omta, O., Haverkamp, D.J., 2004.
A Stakeholder View on Sustainable Food
and Agribusiness Chain Development.
Bryson, J.M., 2007. What to Do When
Stakeholders Matter Analysis Techniques.
Public Management Review 9037 (2004):
20-53.
https://doi.org/10.1080/14719030410001675
722.
Busch, P., Richards, D., 2000. Applying social
network analysis to knowledge. 11 (1996):
2109.
Crossley, N., Prell, C., Scott, J., 2009. Social
Network Analysis : Introduction to Special
Edition. 4: 1-5.
Dawkins, M.S., 2017. Animal welfare and
efficient farming: is conflict inevitable?.
Anim. Prod. Sci. 57 (2): 201-8.
https://doi.org/10.1071/AN15383.
Dempwolf, C.S., Lyles, L.W., 2012. The Uses of
Social Network Analysis in Planning : A
Review of the Literature The Uses of Social
Network Analysis. J. Plan. Lit. 3-21.
https://doi.org/10.1177/0885412211411092.
Devendra, C., 2004. Integrated tree crops -
Ruminants Systems Palm. 33(3): 157-66.
Devendra, C., Sevilla, C. C., 2002. Availability
and use of feed resources in crop - Animal
Systems in Asia. 71: 59–73.
Devendra, C., Thomas, D., 2002. Smallholder
Farming Systems in Asia. 71: 17-25.
Fapet-UNIPA., 2009. Monitoring Dan Evaluasi
Pembangunan Peternakan Provinsi Papua
Barat. Manokwari.
Fapet-UNIPA, 2018. Kajian Potensi Dan Prospek
Pengembangan Peternakan Di Kabupaten
Sorong Selatan. Teminabuan.
Foti, V.T., Scuderi, A., Stella, G., Sturiale, L.,
Timpanaro, G., Trovato, M. R., 2018. The
Integration of Agriculture in the Politics of
Social Regeneration of Degraded Urban
Areas. Integrated Evaluation for the
Management of Contemporary Cities, Green
Energy and Technology. 99-111.
https://doi.org/10.1007/978-3-319-78271-3.
Freeman, R.E., 2015. The Stakeholder Approach.
Strategic Management. 5(3): 1-2.
https://doi.org/10.1017/cbo9781139192675.0
03.
Jurnal Agripet, Volume 20, No. 2, Oktober 2020
Mapping Strategic and Sustainable Relevant Actors of Poultry Production and Business Using Stakeholder Network Analysis (Desni Triana Ruly Saragih, et al.,)
230
Grimble, R., Wellard, K., 1997. Stakeholder
Methodologies in Natural Resource
Management : A Review of Principles ,
Contexts , Experiences and Opportunities.
55(2).
Günther, E., Hüske, A. K., 2014. How Stakeholder
Shape Innovation in Controversial
Industries: The Biotechnology Industry in
Germany. Uwf Umwelt WirtschaftsForum 23
(3): 77–86. https://doi.org/10.1007/s00550-
014-0343-2.
Hanneman, R., Riddle, M., 2005. Introduction to
Social Network Methods 1 . Social Network
Data. In Introduction to Social Network
Methods.
Harjanto, J.T., Prasetyo, E., Santoso, S. I., Rianto,
E., 2019. Performance of Islamic boarding
schools in developing the beef cattle
agribusiness partnership network as a
community empowerment institution in
central java. J. Indonesian Trop. Anim.
Agric. 44(60): 114-22.
https://doi.org/10.14710/jitaa.44.1.114-122.
Hauck, J., Schmidt, J., Werner, A., 2016. Using
Social Network Analysis to Identify Key
Stakeholders in Agricultural Biodiversity
Governance and Related Land-Use
Decisions at Regional and Local. 21(2).
Holman, N., 2008. Community Participation :
Using Social Network Analysis to Improve
Developmental Benefits. 26 (2005): 525-44.
https://doi.org/10.1068/c0719p.
Hou, Y, Velthof, G. L., Case, S. D. C., Oelofse,
M., Grignani, C., Balsari, P., Zavattaro, L.,
2018. Stakeholder perceptions of manure
treatment technologies in Denmark, Italy, the
Netherlands and spain. J. Cleaner Prod. 172:
1620-30.
https://doi.org/10.1016/j.jclepro.2016.10.162
Huang, X., Chen, D., Wang, D., Ren, T., 2020.
Identifying Influencers in Social Networks.
https://doi.org/10.3390/e22040450.
Iyai, D.A, Runtuboi, Y.Y., 2016. Sources, sites
and components of greenhouse gases ( ghgs )
from animal agriculture in West Papua
Province , Indonesia. Inter. J. Environ.
Monit Analyses. 4(5): 121-26.
https://doi.org/10.11648/j.ijema.20160405.1
1.
Iyai, D.A., Saragih, D.T.R., Rumbiak, F.P., 2016.
Effect of Traditional cattle farming systems
on farmer knowledge, cattle performances
and agribusiness potential in west new
guinea-papua barat province, Indonesia.
Anim. Vet. Sci. 4 (1): 5-10.
https://doi.org/10.11648/j.avs.20160401.12.
Kabupaten Arfak, Dinas Peternakan dan
Perikanan Darat Pegunungan., 2016.
Penyusunan Master plan Peternakan
Kabupaten Pegunungan Arfak. Anggi.
Kijlstra,A., Eijck, I.A.J.M., 2006. Animal Health
in organic livestock production systems : a
review.” NJAS - Wageningen. J. Life Sci.
54(1): 77-94. https://doi.org/10.1016/S1573-
5214(06)80005-9.
Kodoati, G., Waleleng, P.O.V., Lainawa, J.,
Mokoagouw, D.R., 2014. Analisis Potensi
Sumberdaya alam, tenaga kerja, pertanian
dan perkebunan terhadap pengembangan
peternakan sapi potong di kecamatan eris
kabupaten minahasa. Jurnal Zootek. 34: 15-
26.
Krupa, M., Cenek, M., Powell, J., Trammell, E.J.,
2017. Mapping the stakeholders: Using
social network analysis to increase the
legitimacy and transparency of participatory
scenario planning. Society and Natural
Resources, An International Journal 1920.
https://doi.org/10.1080/08941920.2017.1376
140.
Leroy, G., Baumung, R., Notter, D., Verrier, D.E.,
Wurzinger, M., Scherf, B., 2017.
Stakeholder involvement and the
management of animal genetic resources
across the world. Livestock Sci. 120–28.
https://doi.org/10.1016/j.livsci.2017.02.018.
Mandarano, L.A., 2009. Society & Natural
Resources : An Social Network Analysis of
Social Capital in Collaborative Planning
Social Network Analysis of Social Capital in
Collaborative Planning.” Society and
Natural Resources; An International Journal
22 (November 2014): 245-60.
https://doi.org/10.1080/08941920801922182
Manokwari, BPS., 2017. Kabupaten Manokwari
Dalam Angka. 2017. Manokwari: BPS
Manokwari.
Manokwari, BPS., 2018. Kabupaten Manokwari
Dalam Angka. 2018. Manokwari: BPS
Manokwari.
Manokwari., 2019. Kabupaten Manokwari Dalam
Angka. 2019. Manokwari: BPS Manokwari.
Jurnal Agripet, Volume 20, No. 2, Oktober 2020
Mapping Strategic and Sustainable Relevant Actors of Poultry Production and Business Using Stakeholder Network Analysis (Desni Triana Ruly Saragih, et al.,)
231
Mayulu, H., Sutrisno, C.I., 2014. Kebijakan
Pengembangan Peternakan Sapi Potong Di
Indonesia. Jurnal Litbang Pertanian. 29(1):
34-41.
Menard, C., Klein, P.G., 2004. Organizational
issues in the agrifood sector. Am. J. Agric.
Econ. 86: 750-55.
Mollenhorst, H., Boer, de.I.J.M., 2010. Identifying
Sustainability issues using participatory swot
analysis. Outlook on Agriculture. 33(4): 267-
76.
https://doi.org/10.5367/0000000042664747.
Mutibvu, T., Maburutse, B.E., Mbiriri, D.T.,
Kashangura, M.T., 2012. Constraints and
Opportunities for Increased Livestock
Production in Communal Areas : A Case
Study of Simbe. Zimbabwe. 6: 6781.
Nguthi, F.N., 2007. Adoption of Agricultural
Innovations by Smallholder Farmers in the
Context of HIV/ AIDS : The Case of Tissue-
Cultured Banana in Kenya.
Nurek, M., 2020. Applied Sciences Combining
Machine Learning and Social Network
Analysis to Reveal the Organizational
Structures.
https://doi.org/10.3390/app10051699.
Nurfadillah, S., Rachmina, D., Kusnadi, N., 2018.
Impact of Trade liberalization on indonesian
broiler competitiveness. J. Indonesian Trop.
Anim. Agric. 43(4): 429-37.
https://doi.org/10.14710/jitaa.43.4.429-437.
Pakage, S., Hartono, B., Fanani, B. A., Iyai, D.A.,
2018. Analisis Struktur biaya dan
pendapatan usaha peternakan ayam pedaging
dengan menggunakan closed house system
dan open house system analysis of cost
structure and income of broiler chicken
farming business by using closed house
system and open house system. Jurnal
Peternakan Indonesia. 20(3): 193-200.
Papua Barat, BPS., 2017. Provinsi Papua Barat
Dalam Angka., 2017. Manokwari: BPS
Papua Barat.
Papua Barat. BPS., 2018. Provinsi Papua Barat
Dalam Angka., 2018. Manokwari: BPS
Papua Barat.
Papua Barat. BPS., 2019. Provinsi Papua Barat
Dalam Angka., 2019. Manokwari: BPS
Papua Barat.
Peiretti, P.G., 2018. Amaranth in Animal
Nutrition : A Review” 30 (February): 9808.
Prado-lorenzo, M., Gallego-a, I., 2011. Corporate
social responsibility and innovation : A
Resource-Based Theory. 49(10): 1709-27.
https://doi.org/10.1108/00251741111183843
.
Priyono., Priyanti, A., 2018. Perspektif
Perkembangan ketersediaan produksi sumber
protein asal ternak di Indonesia (perspective
on the production availability of animal
protein source from livestock in indonesia ).
Wartazoa. 28(1): 23-32.
Ringle, C.M., Wende, S., Becker, J.M., 2005.
SmartPLS. Germany: SmartPLS GmbH.
www.smartpls.com/smartpls2.
Schiffer, E., 2007. Net-Map.
http://www.visualcomplexity.com/vc/project
.cfm?id=644.
Schodl, K., Leeb, C., Winckler, C., 2015.
Developing science--industry collaborations
into a transdisciplinary process: a case study
on improving sustainability of pork
production. Sustainability Sci. 10(4): 639-51.
https://doi.org/10.1007/s11625-015-0329-1.
Springer, A.C., Steiguer de, J.E., 2011. Social
Network Analysis: A Tool to improve
understanding of collaborative management
groups. J. Extension. 49(6): 1-8.
Ventura, B.A., Weary, D.M., Giovanetti, A.S.,
Keyserlingk, M.A.G.V., 2016. Veterinary
perspectives on cattle welfare challenges.
Livest. Sci.
https://doi.org/10.1016/j.livsci.2016.10.004.
Waithaka, M.M., Shepherd, K.D., 2006. Bio-
Economic evaluation of farmers ’
perceptions of viable farms in western
kenya. Agric. Systems. 90: 243-71.
https://doi.org/10.1016/j.agsy.2005.12.007.