Luenberger observer with nonlinear structure applied to ...
13
© International Journal of Combinatorial Optimization Problems and Informatics, Vol. 9, No. 1, Jan-April 2018, pp. 68-80. ISSN: 2007-1558. Received Dec 2, 2017 / Accepted Jan 22, 2018 Editorial Académica Dragón Azteca (EDITADA.ORG) Luenberger observer with nonlinear structure applied to diabetes type 1 Onofre Orozco 1 , Carlos Eduardo Castañeda 1 , Agustín Rodríguez-Herrero 2 , Gema García- Saéz 2 , María Elena Hernando 2 Universidad de Guadalajara Centro Universitario de los Lagos México 1 University of Madrid, Biomedical Research Networking Centre in Bioengineering Biomaterials and Nanomedicine (CIBER-BBN), Madrid, Spain 2 [email protected] [email protected] [email protected] {ggarcia,elena}@gbt.tfo.upm.es Abstract. In this work a Luenberger observer (LO) for type 1 diabetes is established using the Hovorka’s model (HM). The HM is linearized around an operating point and the eigenvalues are calculated. The LO is designed relocating the HM eigenvalues through the Ackermann’s methodology for linear observers where the proposed LO keeps the nonlinear structure of the model system. The LO is parameterized and tuned with the mean from six virtual patients of HM. Once the observer performance is reliable estimating the state space variables for HM, the virtual patients are changed by patients of Bergman’s model in order to test the observer behavior under unknown dynamics. These estimated variables constitute the ones corresponding to HM. The variables are estimated by the data computational processing which correspond to the insulin (input) and glucose (output) of the virtual patients. The estimated variables by the LO are very similar for virtual patients generated by both models, where the parameter FIT is used to quantify the performance of the observer. The computational implementation of the LO is useful tool to estimate the unmeasured variables in diabetic patients so they can be used in the artificial pancreas. Keywords: Luenberger observer, state space estimator, diabetes type 1, artificial pancreas. 1 Introduction Diabetes appears when the pancreas does not produce enough insulin or when the body cannot effectively use the insulin it produces. Hyperglycemia, or high blood glucose concentration, is a common effect of uncontrolled diabetes. Diabetes is classified in three different classes: type 1 diabetes (T1DM) characterized by a whole lack of insulin production due β cells are destroyed; type 2 and gestational diabetes are originated by the bodys ineffective use of insulin. Currently, 422 million people worldwide have diabetes, more than 80% of diabetes deaths occur in low and middle income countries. World Health Organization (WHO) estimates that deaths caused by diabetes will double between 2005 and 2030 and will be the 7th leading cause of death in 2030 [1]. At present, it is impossible to regenerate the beta cells and cure this disease. The therapy in patients with T1DM requires exogenous insulin injected subcutaneously 3 or 4 times per day with same number or more of glucose test with glucometers [2]. The glucose measurement consists of finger pricks to get a drop of blood. This treatment is very invasive and painful. A serious complication of a therapy is hypoglycemia which appears when the glucose level is lower than 70 mg/dl, to avoid this situation T1DM patients suministrate less insuline than required. Continuous subcutaneous insulin infusion (CSII) systems, also known as insulin pumps can be used to optimize the patients insulin therapy and to improve lifestyle flexibility. The integration of continuous glucose measurement (CGM) sensor, insulin pumps and a closed-loop control techniques is known as the artificial pancreas (AP) [3]. The AP should keep the blood glucose levels to close normal levels, avoiding hypoglycemia. A lot of work has been proposed trying to achieve the AP. Some of the close loop control techniques applied in diabetes to design the control algorithm include PID approximations, model predictive control, fuzzy control, sliding modes control and robust control [4]. The majority of closed-loop control techniques requires a mathematical model that describes T1DM dynamic for its implementation (or design).
Transcript of Luenberger observer with nonlinear structure applied to ...

© International Journal of Combinatorial Optimization Problems and Informatics, Vol. 9, No. 1, Jan-April
2018, pp. 68-80. ISSN: 2007-1558.
Received Dec 2, 2017 / Accepted Jan 22, 2018
Editorial Académica Dragón Azteca (EDITADA.ORG)
Luenberger observer with nonlinear structure applied to diabetes type 1
Onofre Orozco1, Carlos Eduardo Castañeda1, Agustín Rodríguez-Herrero2, Gema García-
Saéz2, María Elena Hernando2
Universidad de Guadalajara Centro Universitario de los Lagos México1
University of Madrid, Biomedical Research Networking Centre in Bioengineering
Biomaterials and Nanomedicine (CIBER-BBN), Madrid, Spain2
{ggarcia,elena}@gbt.tfo.upm.es
Abstract. In this work a Luenberger observer (LO) for type 1 diabetes is established using the Hovorka’s
model (HM). The HM is linearized around an operating point and the eigenvalues are calculated. The LO
is designed relocating the HM eigenvalues through the Ackermann’s methodology for linear observers
where the proposed LO keeps the nonlinear structure of the model system. The LO is parameterized and
tuned with the mean from six virtual patients of HM. Once the observer performance is reliable estimating
the state space variables for HM, the virtual patients are changed by patients of Bergman’s model in order
to test the observer behavior under unknown dynamics. These estimated variables constitute the ones
corresponding to HM. The variables are estimated by the data computational processing which correspond
to the insulin (input) and glucose (output) of the virtual patients. The estimated variables by the LO are
very similar for virtual patients generated by both models, where the parameter FIT is used to quantify
the performance of the observer. The computational implementation of the LO is useful tool to estimate
the unmeasured variables in diabetic patients so they can be used in the artificial pancreas.
Keywords: Luenberger observer, state space estimator, diabetes type 1, artificial pancreas.
1 Introduction
Diabetes appears when the pancreas does not produce enough insulin or when the body cannot effectively use the insulin it
produces. Hyperglycemia, or high blood glucose concentration, is a common effect of uncontrolled diabetes. Diabetes is
classified in three different classes: type 1 diabetes (T1DM) characterized by a whole lack of insulin production due β cells are
destroyed; type 2 and gestational diabetes are originated by the bodys ineffective use of insulin. Currently,
422 million people worldwide have diabetes, more than 80% of diabetes deaths occur in low and middle income countries.
World Health Organization (WHO) estimates that deaths caused by diabetes will double between 2005 and 2030 and will be the
7th leading cause of death in 2030 [1]. At present, it is impossible to regenerate the beta cells and cure this disease. The therapy
in patients with T1DM requires exogenous insulin injected subcutaneously 3 or 4 times per day with same number or more of
glucose test with glucometers [2]. The glucose measurement consists of finger pricks to get a drop of blood. This treatment is
very invasive and painful. A serious complication of a therapy is hypoglycemia which appears when the glucose level is lower
than 70 mg/dl, to avoid this situation T1DM patients suministrate less insuline than required.
Continuous subcutaneous insulin infusion (CSII) systems, also known as insulin pumps can be used to optimize the patients
insulin therapy and to improve lifestyle flexibility. The integration of continuous glucose measurement (CGM) sensor, insulin
pumps and a closed-loop control techniques is known as the artificial pancreas (AP) [3]. The AP should keep the blood glucose
levels to close normal levels, avoiding hypoglycemia. A lot of work has been proposed trying to achieve the AP. Some of the
close loop control techniques applied in diabetes to design the control algorithm include PID approximations, model predictive
control, fuzzy control, sliding modes control and robust control [4]. The majority of closed-loop control techniques requires a
mathematical model that describes T1DM dynamic for its implementation (or design).

Orozco et al. / Luenberger observer with nonlinear structure applied to diabetes type 1. IJCOPI Vol. 9, No. 1,
Jan-April 2018, pp. 68-80. EDITADA. ISSN: 2007-1558.
69
The availability of a glucose model to simulate the behavior in particular of T1DM patients gives the possibility of designing
and evaluating insulin infusion closed-loop control algorithms. It exists are several compartmental models that describes the
glucose-insulin dynamic on people with T1DM.
The main problem of a closed-loop control technique real implementation is the availability of measurable variables; in T1DM
patients it is posible to measure the glucose concentration and to know the insulin dosis, both substances coincide with the
output and input variables o most mathematical models [5]. But, there are other model variables that it is not possible to measure
in ambulatory enviroment, those variables depends on the model used Hovorka, Bergman, Cobelli, Sorensen [6].
In this paper we propose design a nonlinear Luenberger observer to estimate the unmeasurable variables. In the field of
developing the AP it is important to make available information of T1DM patient that cannot be measure in real time. The linear
Luenberger observer is a well-known methodology in linear control area to estimate unmeasurable variables, as during
linearization the dynamic wealth of a nonlinear model is lost; the linear Luenberger observer the-ory is extended for nonlinear
systems in easy way to design and implement the Luenberger observer shape.
1.1 Hovorka Model
In this work, we consider the continuous HM presented in [7] to design the nonlinear Luenberger observer; because it is one of
the most used and widely accepted models of the glucose-insulin metabolism and represented in states space as follows:
(1)
Where Ċ is intersticial glucose concentration (mg/dl), Q1 represents the mass of glucose in the accessible compartment (mmol);
Q2 is the non-accessible glucose mass compartment (mmol); X1 is the remote effect of insulin on glucose distribution/transport
(1/min); X2 is the remote effect of insulin on glucose disposal (1/min); X3 is the remote effect of insulin on endogenous glucose
production (1/min); I is the plasma insulin concentration (mU/dl); S2 and S1 are two-compartments chain representing absorption
of subcutaneously administered short-acting insulin (mU ); G(t) = x2/VG is the glucose concentration in the plasma (mg/dl); u is
the infusion dose of insulin (mU ). The Glucose absorption is a fundamental process affecting postprandial glucose excursions.
In HM (1), the gut absorption rate UG(t) (mg/min) is represented by:
(2)
where tmax,G is the time-of-maximum appearance rate of glucose in the accessible glucose compartment, DG is the amount (mg) of
CHOs ingested, AG is carbohydrate bioavailability, EGP0 represents the endogenous glucose production extrapolated to a 0
concentration, fR is the renal glucose clearance above the glucose threshold of 9 mmol/l represented as:
(3)
And with f c01 as the total non-insulin-dependent glucose flux corrected by the ambient glucose concentration represented as:

Orozco et al. / Luenberger observer with nonlinear structure applied to diabetes type 1. IJCOPI Vol. 9, No. 1,
Jan-April 2018, pp. 68-80. EDITADA. ISSN: 2007-1558.
70
(4)
Although there exists a wide range of mathematical models where the most of control techniques requires all the state space
variables availables. It is almost impossible to measure all the variables in real time on T1DM patients, so it is necessary the
implementation of some algorithms to make available an estimation of those variables. In the field of estimation unmeasurable
variables Luenberger observers is a spread methodology.
1.2 Linear Luenberger observer
The assumption that all state variables are available for feedback may not hold in practice, because in the case of T1DM
nowadays it is not feasible to measure the plasma insulin in real time, and it is difficult to do measurements for an ambulatory
system on accessible and non-accessible glucose compartments. In order to apply state feedback in future research, we must
design a method, called a state estimator or state observer such that, with the knowledge of the input (insulin) and the output
(glucose) of a patient, it is possible to generate an estimate of the states according to existing compartmental model of T1DM.
For this, let us consider a general structure of an n-dimensional continuous-time, single-input, single-output (SISO), time-
invariant linear system as follows:
(5)
(6)
where , and are the matrix state, input and output vectors, respectively, and the input u
(insulin) and output y (glucose) are available. The state vector , however, is not available for
measurement, the symbol T denotes the transposed vector, and n is the state dimension. The problem is to estimate the state x
through the knowledge of the insulin u and the glucose y. This is done by means of the well-known linear- time observer [9]. It
is important to say that in this paper, the SISO system corresponds to HM (1) in which the input signal u is the insulin, and the
output signal y is the glucose and
The conventional Luenberger observer has been a popular approach to state estimation for linear dynamical systems. On
Luenberger methodology the output of the system y = cx (6) (glucose measurement), is compared with the estimated output by
the observer (estimated glucose). The difference, passing through an n X 1 constant gain vector l is used as correcting term in
order to estimate the state x of system (5) [9]. If the gain l is properly designed, the difference will drive the estimate state to the
actual state. Such estimator is called an asymptotic estimator and is described by the following equation:
(7)
Where is the estimated state vector, and represents the Luenberger gain vector. The idea
of this observer is to compute the constant gain vector l such that all eigenvalues of matrix [A - lc] from equation (7), can be put
arbitrarily in the left-half of s complex plane using Ackermann’s methodology. This can be done if and only if the pair (A, c) of
system (5)-(6) is observable [10]. Such that all eigenvalues of matrix [A- lc] from equation (7), are arbitrarily set to the left of
the eigenvalues of the matrix A in the left-half of the complex plane. The Ackermann’s methodology relocates the eigenvalues
(µ1, µ2, . . . , µn) of A on the desired location (λ1, λ2, . . . , λn) through desired characteristic polynomial φ(A). The applied well
known Ackermann’s methodology [11] stablishes

Orozco et al. / Luenberger observer with nonlinear structure applied to diabetes type 1. IJCOPI Vol. 9, No. 1,
Jan-April 2018, pp. 68-80. EDITADA. ISSN: 2007-1558.
71
(8)
In the present proposal, it is modified the theory of linear Luenberger observer to non-linear Luenberger observer. These
modification results from the linearization of T1DM model on a operating point and implementing nonlinear functions on the
observer. The procedure for this non-linear Luenberger observer is explained below.
2 Nonlinear Luenberger observer
To iniciate the proposed methodology, let us consider a nonlinear SISO perturbed system representing the compartimental HM
as follows:
(9)
(10)
Where f(x) and g(x) are nonlinear functions; d(t) represents the disturbances; h(x) is the output function. For afformentioned HM
(1) u is the insulin infusion dose; the output signal is y = C is the interstitial glucose concentration measured through CGM
sensor.
Then, system (9)-(10) is linearized using the Jacobian to obtain
(11)
Where matrix A and vectors b and c can be arranged as the lineal system (5). The operation point ρ is selected on y = 90mg/dl.
That is, the T1DM patient is in a regimen of normoglycemia. The matrices (11) are evaluated with the values of the operating
point aforementioned to obtain a linear system. Now the Ackermann's methodology (8) is applied in order to compute the
constant gain vector l.
With the aim of adding the dynamic wealth provided by a nonlinear system the linear Luenberger observer is extended to a
nonlinear structure (9)-(10) and including the available information about external and internal perturbations d(t), extending the
linear theory from equation (7) to a nonlinear Luenberger observer as:
(12)
Orozco et al. / Luenberger observer with nonlinear structure applied to diabetes type 1. IJCOPI Vol. 9, No. 1,
Jan-April 2018, pp. 68-80. EDITADA. ISSN: 2007-1558.
72
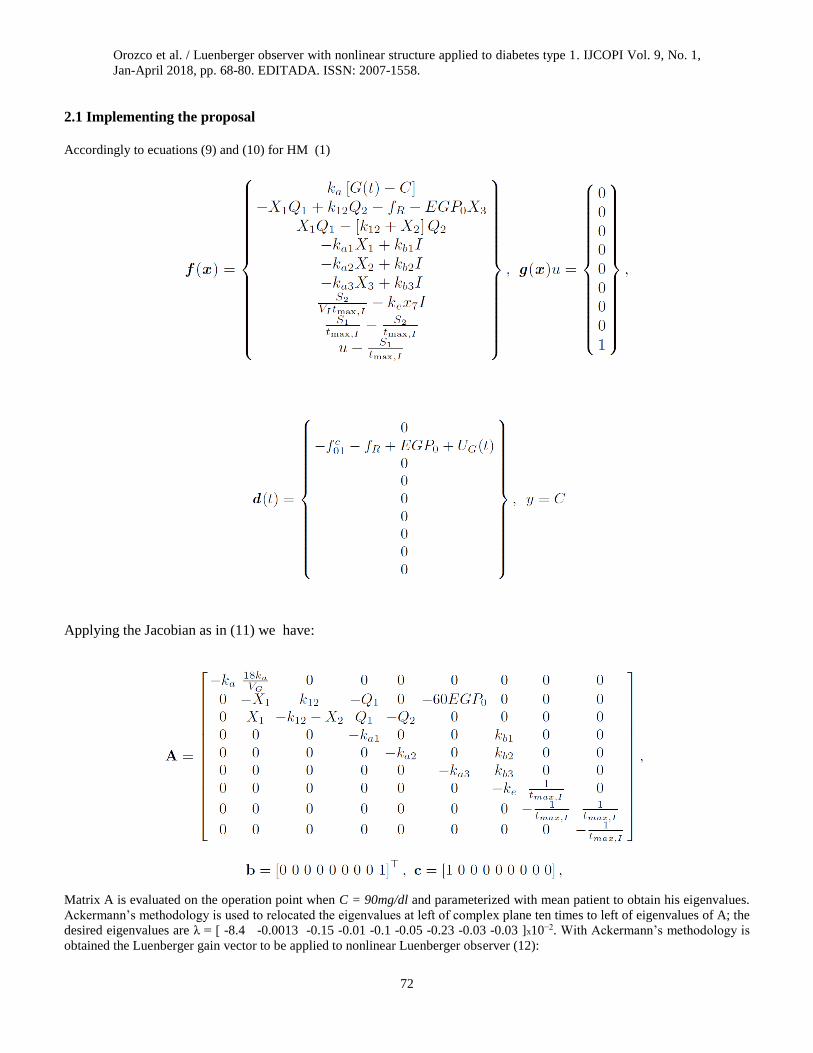
2.1 Implementing the proposal
Accordingly to ecuations (9) and (10) for HM (1)
Applying the Jacobian as in (11) we have:
Matrix A is evaluated on the operation point when C = 90mg/dl and parameterized with mean patient to obtain his eigenvalues.
Ackermann’s methodology is used to relocated the eigenvalues at left of complex plane ten times to left of eigenvalues of A; the
desired eigenvalues are λ = [ -8.4 -0.0013 -0.15 -0.01 -0.1 -0.05 -0.23 -0.03 -0.03 ]x10−2. With Ackermann’s methodology is
obtained the Luenberger gain vector to be applied to nonlinear Luenberger observer (12):

Orozco et al. / Luenberger observer with nonlinear structure applied to diabetes type 1. IJCOPI Vol. 9, No. 1,
Jan-April 2018, pp. 68-80. EDITADA. ISSN: 2007-1558.
73
3 Test protocol
The nonlinear Luenberger observer will be tested with two experiments, the first one to evaluate the deviations when the
observer is tested using VP of the same design model; and the second one to try the observer capability in order to estimate
variables with known structure under different VP dynamics.
3.1 Experiment A
Once the nonlinear Luenberger observer is designed; is parameterized with the mean patient of HM. The nonlinear Luenberger
observer is tested using as VP the six sets of parameters in Table 1 for patients 1 to 6 [8]. With this experiment we are able to
assess the deviations on estimated variables.
3.2 Experiment B
On experiment B the nonlinear Luenberger observer remains parameterized with mean patient of HM and is tested with VP
generates by Bergman model [12]. The Bergman model (13) that it is completely different from HM (1), is used in order to try
the nonlinear Luenberger observer under unknown dynamics. The aim of use in silico patients generated with a different model
is because on a real implementation the T1DM dynamic differs from the dynamic of any mathematical model. The Bergman
models is described as follows:
(13)
Where G(t) is the plasma glucose, X(t) is the insulin effect over glucose elimination and I(t) is the plasma insulin. In Table 2 are
described the parameters for three different T1DM patients, which are going to be used as test VP. With this experiment we
assess how the nonlinear Luenberger observer is able to estimate the states (HM) from other model used to built the VP, that it
has other state variables.

Orozco et al. / Luenberger observer with nonlinear structure applied to diabetes type 1. IJCOPI Vol. 9, No. 1,
Jan-April 2018, pp. 68-80. EDITADA. ISSN: 2007-1558.
74
Table 1. Hovorka model parameters
3.3 Experiment configuration
The simulation is done using MatlabTM and SimulinkTM; the simulation parameters in SimulinkTM are set as: Runge-Kutta solver
with fix step of 1 second. The main disturbance is based on a standard diet therapy for all the VPs composed of the following
amount of CHO’s: 40gr at breakfast (7:30 a.m.), 15gr as snack at 11:00 a.m., 90gr at lunch (1:00 p.m.), 57gr at dinner (7:00
p.m.) and other snack at 11:00 p.m of 15gr [13]. The test period include one simulation day (24 hrs.) with the afformentioned
CHO’s ingestion.
3.4 Evaluation method
To measure the performance of the designed observer is desirable quantify the similitud between VP variable and estimated
variable. For this reason it is used the FIT parameter described in [14] as:
(14)

Orozco et al. / Luenberger observer with nonlinear structure applied to diabetes type 1. IJCOPI Vol. 9, No. 1,
Jan-April 2018, pp. 68-80. EDITADA. ISSN: 2007-1558.
75
Table 2. Bergman model parameters.
4 Results and discussion
In this section are shown some results of the performance of nonlinear Luenberger observer.
4.1 Testing the observer with experiment A
The designed nonlinear Luenberger observer is parameterized with the mean VP parameter and it is tested with the other six VP
of HM described on Table 1. For simplicity, it is show only the estimation of variables for the VP 1.
In Fig. 1 are located the three HM variables used to describe the glucose dynamic as: a) intersticial glucose measurement (C, the
output), in this plot can be seen how the obsever eliminates the estimation error of measurable variable. b)mass of plasma
glucose (Q1) the estimation of this variable is qualitatively similar to VP variable a similar behaviour between VP variable and
its estimated is appreciated in c) non-accessible glucose to measurement (Q2). Cuantification of differences between VP
variables and its estimated is made on Table 3; the similitudes for C is over 99%, Q1 is more than 62% and the worst case of Q2
= 25.63%.
Fig. 1. Estimation of variables related to glucose. a) meassured variable C, b) variable Q1 plasma glucose and c) variable Q2
glucose on non-accessible compartment.

Orozco et al. / Luenberger observer with nonlinear structure applied to diabetes type 1. IJCOPI Vol. 9, No. 1,
Jan-April 2018, pp. 68-80. EDITADA. ISSN: 2007-1558.
76
Fig. 2. Variables estimation of insulin remotes effects over: a) glucose distribution/transport X1, b) glucose disposal X2 and c)
endogenous glucose production X3.
In Fig. 2 are grouped the corresponding variables to remote effects of insulin over the glucose distribution/transport, glucose
disposal and endogenous glucose production. The estimation of these variables is analized in Table 3 where X1 has a FIT over
93%, the similitud on X2 it is bigger than 81% and for X3 is greater than 59%. As it was mentioned the discrepancy is due to the
distinctness parameterization of the nonlinear Luenberger observer and de VP, so the observer should adjust the dynamic of the
unmeasurable variables to eliminate de estimation error of the measurable one. This variables are the most factible to make the
dynamic adjust, because this variables (X1, X2 and X3) correlates the glucose and the insulin.
Fig. 3. Estimation of variables related to insulin concentration. a) plasma insulin I, b) chained compartment of insulin
subcutaneously absortion S1 and c) chained absortion compartment of administered subcutanously insulin S2.
In Fig. 3 are shown the variables used to describe the insulin dynamic. From Fig. 1 the FIT for I is superior to 57% and for S2
and S1 is higher to 98%, due to the fact that in this group of variables is also available other part of information that it is taken
into account by the nonlinear Luenberger observer as is the insulin dosification (the model input). This variable has a strong
relation with the insulin doses so the observer shows a qualitatively performance as VP variables.
In Table 3 are shown the results of quantitative measurement of nonlinear Luenberger observer performance, expressed as
percentage of similarity measured through the parameter FIT. The worst performance is found for variables C, Q1, X3 and I in
patient 1; for Q2 and X1 in patient 4; for X2 in patient 5 and finally for S2 and S1 in patient 6. Although are the worst cases can be
seen from Fig. 1 and Fig. 2 that estimated variables have a dynamical behavior qualitatively similar to the VP variable. As it was
mentioned, the differences between the VP variables and their estimated ones is due to the observer has to adjust

Orozco et al. / Luenberger observer with nonlinear structure applied to diabetes type 1. IJCOPI Vol. 9, No. 1,
Jan-April 2018, pp. 68-80. EDITADA. ISSN: 2007-1558.
77
Table 3. FIT for estimated variables in experiment A
The dynamic on some variables to achieve a FIT of estimation of the measured variable higher than 99%, reducing the
estimation error under 1%.
4.2 Testing the observer with experiment B
Once designed nonlinear Luenberger observer is tested with the HM VP’s. The test VP’s are generated trough a different model
described on (13), this model includes the parameters of three different patients as it is shown in Table 2. As it is known in a real
life implementation, the T1DM patient it is completely different from any used model to design the obsever, for this reason we
use to test the observer an unknown structure model from the period design. Now the observer has to estimate variables with
the HM significance because it was designed with this aim, provide estimated variables with a well known model structure.
Fig. 4. Estimation of measurable variable to three VP’s of Bergman model (unknown VP). a) output estimation of VP 1, b)
output estimation of VP 2 and c) output estimation of VP 3

Orozco et al. / Luenberger observer with nonlinear structure applied to diabetes type 1. IJCOPI Vol. 9, No. 1,
Jan-April 2018, pp. 68-80. EDITADA. ISSN: 2007-1558.
78
Fig. 5. Estimation of ambulatory unmeasurable glucose variables. a) plasma glucose
Q1, b) non-accessible glucose compartment Q2.
In Fig. 4 is shown an efficient estimation of the measurable variable of Bergman VP with the nonlinear Luenberger observer.
For experiment B it is only calculated the FIT parameter for output variable because it is the measurable one. The quantitative
yield for the estimation of the output variables of the Bergman’s VP is: 98.26% for patient 1, 97.47% for patient 2 and 95.37%
for patient 3.
In Fig. 5 are depicted the estimated variables of glucose compartments for the three VP of Bergman. The dynamics of variables
Q1 and Q2 are within the ranges that would be expected to obtain with VP simulated with HM.
Fig. 6. Estimation of insulin effect variables over glucose: a) glucose distribution/transport X1, b) glucose disposal X2 and c)
endogenous glucose production X3
In Fig. 6 are described the dynamics of variables that represent the remote effects of insulin over glucose distribution/transport
X1, glucose disposal X2 and endogenous glucose production X3. Its dynamics are estimated giving only the information of input
and output from VP’s to the nonlinear Luenberger observer.

Orozco et al. / Luenberger observer with nonlinear structure applied to diabetes type 1. IJCOPI Vol. 9, No. 1,
Jan-April 2018, pp. 68-80. EDITADA. ISSN: 2007-1558.
79
Fig. 7. Estimation of variables related to insulin concentration. a) plasma insulin I, b) chained compartment of insulin
subcutaneously absortion S1 and c) chained absortion compartment of administered subcutanously insulin S2.
In Fig. 7 the dynamic of insulin variables as they are I, S2 and S1 is estimated by the nonlinear Luenberger observer accordingly
to the structure and parameters of mean patient fo HM.
5 Conclusion
In the development of the AP it is necessary to estimate the unmeasurable variables; because, most of the control techniques
require all state variables available to its application. The design of the nonlinear Luenberger observer is a simple extension of
the linear Luenberger observer theory, which has a simple and easy to understand methodology; but, with an application of
relevance as it is the estimation of unmeasurable variables in T1DM patients. The nonlinear Luenberger observer designed was
tested with a different model than the one used for its design which is an approximation to a real implementation scenario.
In Experiment A was possible appraise the nonlinear Luenberger observer with VP produced with the HM using only a different
parameterization between the observer and the VP. In this experiment it was possible to appreciate how the observer behaved
with parametric uncertainties, and how to manage those vagueness.
The capability of nonlinear observer to estimate unmeasurable variables was tested with experiment B; because, the measurable
variable delivered to the observer came from a VP generated with a model different from the one used during its design.
Acknowledgments. The authors thanks to CONACYT (México) under scholarship number 284966 and to retention program
120489.
References
1. World Health Organization, http://www.who.int/diabetes/en/
2. Diabetes Control and Complications Trial Research Group: The effect of intensive treatment of diabetes on the development and
progression of long-term complications in insulin-dependent diabetes mellitus. N. Engl. J. Med. 329, 977-986 (1993)
3. Klonoff, D. C.: The artificial pancreas: how sweet engineering will solve bitter problems. Journal of Diabetes Science and
Technology, 1(1), 72-81 (2007)
4. Peyser, T., Dassau, E., Breton, M., & Skyler, J. S.: The artificial pancreas: current status and future prospects in the management of
diabetes. Annals of the New York Academy of Sciences, 1311(1), 102-123 (2014)
5. Kirchsteiger, H., Jrgensen, J. B., Renard, E., & del Re, L.: Prediction Methods for Blood Glucose Concentration. Springer Lecture
Notes in Bioengineering, (2015)
6. Cobelli, C., Dalla Man, C., Sparacino, G., Magni, L., De Nicolao, G., & Kovatchev, B. P.: Diabetes: models, signals, and control.
IEEE reviews in biomedical engineering, 2, 54-96 (2009)
7. Hovorka, R., Canonico, V., Chassin, L. J., Haueter, U., Massi-Benedetti, M., Federici, M. O., Pieber, T. R., Schaller, H. C.,
Schaupp, L., Vering, T., & Wilinska, M. E.: Nonlinear model predictive control of glucose concentration in subjects with type 1
diabetes. Physiological measurement, 25(4), 905 (2004)
8. Hovorka, R., Shojaee-Moradie, F., Carroll, P. V., Chassin, L. J., Gowrie, I. J., Jackson, N. C., Tudor, R. S., Umpleby, A. M., &
Jones, R. H.: Partitioning glucose distribution/transport, disposal, and endogenous production during IVGTT. American Journal of
Physiology-Endocrinology and Metabolism, 282(5), E992-E1007 (2002)

Orozco et al. / Luenberger observer with nonlinear structure applied to diabetes type 1. IJCOPI Vol. 9, No. 1,
Jan-April 2018, pp. 68-80. EDITADA. ISSN: 2007-1558.
80
9. Chen, C. T.: Linear system theory and design. Oxford University Press, Inc. (1995)
10. Ackermann, J.: Der entwurf linearer regelungssysteme im zustandsraum. at- Automatisierungstechnik, 20(1-12), 297-300 (1972)
11. Ogata, K.: Modern control engineering 5th edition. Upper Saddle River, New Jersey 07458 (2009)
12. Kaveh, P., & Shtessel, Y. B.: Blood glucose regulation via double loop higher order sliding mode control and multiple sampling
rate. In Modern Sliding Mode Control Theory. Springer Berlin Heidelberg, pp. 427-445 (2008)
13. Anguita, C., Caixa´s, A., Clap´es, J., Claveria, M., Gallach, I., & Jans`a, M.: Documento de Consenso sobre Recomendaciones
Nutricionales y de Educacio´n Alimentaria en la Diabetes. Barcelona: Associacio´ Catalana de Diabetis (2003)
14. Ljung, L.: System Identication: Theory for the user. Englewood Cliffs (1987)