Long-term changes (1977 Abra alba Melinna palmata
17
Vol. 49: 65-81,1988 I MARINE ECOLOGY - PROGRESS SERIES Mar. Ecol. Prog. Ser. Published November 10 Long-term changes (1977 to 1987) in a muddy fine sand Abra alba - Melinna palmata community from the Western English Channel: multivariate time-series analysis Frederic lbanezl, Jean-Claude Dauvin2 C.E.R.O.V., Station Zoologique, BP 28, F-06230 Villefranche-sur-Mer, France * Station Biologique de Roscoff,CNRS-LP 4601 et Universitk P. & M. Curie (Paris VI), F-29211 Roscoff, France ABSTRACT: Long-term monitoring for 10 yr (1977 to 1987) of the muddy fine sand community of the Bay of Morlaix (N France) has allowed us to determine the principal stages of structural succession following pollution by the hydrocarbons of the 'Amoco Cadiz' (1978).Abundance of 30 main species and biomasses of 30 categories were investigated. Regular series were obtained by averaqng values from each season, resulting in 40 sequential observations. General trends and seasonal variations were extracted by the Eigen-Filtering method whch takes into account the shortness of the annual sampling. Principal component analysis of the covariance matrix of the general trends exlbits 7 successive periods of temporal community changes. T h s succession is a function of changes in duection in gradients within the populations. The community developed through a successional phase following the oil spill, with establishment at first of a community of opportunists, followed by a colonisation of the polychaete Lanice conchilega and finally by reestablishment of the original community pre-Amoco Ca&z. An attempt to classify the species according to their seasonal variations is proposed using a semi- quantitative approach. Results show a concentration of maximal abundances in summer and autumn, and of minimal abundances in winter. The dissimilarity correlograms of the densities and the biomasses were used after rearranging the specles Into 3 trophic groups. The different behaviour of trophc groups is related to recolonization after the oil spill and to organic matter in the sediment. INTRODUCTION In 1977, we started a quantitative survey of 2 infralittoral fine and muddy fine sand communities of the Bay of Morlaix (Brittany, N France). The fine sand Abra alba - Hyalinoecia bilineata community is from 'Pierre Noire', and the muddy fine sand Abra alba - MeLinna palmata community is from the 'Riviere de Morlaix'. At that time the communities were in their natural conditions, characterized by small annual and multi-annual variations in their hydrologic and hydro- dynamic characteristics. One year later, the 'Amoco Cadiz' oil spill (March 1978) introduced a vast, acciden- tal disturbance of the sub-littoral communities in Northern Brittany. The perturbation was more pro- nounced in the fine sediment communities (Cabioch et al. 1978, 1980, 1982, Dauvin 1979, 1982). In the fine sand community at Pierre Noire, there were qualitative and quantitative abrupt, drastic changes after the stress (Cabioch et al. 1978, 1980). The number of species decreased to about 20 %, the density to about 80 O/O and the biomass to about 40 %. In the muddy fine sand community at the 'Riviere de Morlaix' the impact of this pollution was more limited; it was characterized by a decrease in the number of amphipod species. The short-term changes in these 2 fine sediment communities living in unpolluted conditions, from spring 1979 at 'Pierre Noire' and from summer 1980 at 'Riviere de Morlaix', have been well documented (Cabioch et al. 1980, 1982, Dauvin 1982, 1984). How- ever, structural modifications were still perceptible 3 yr after the pollution occurred. Therefore, a continuous survey of these 2 stations has been carried out since 1980 to determine their long-term changes in natural conditions. In a previous paper (Dauvin & Ibanez 1986) we O Inter-Research/Printed in F. R. Germany
Transcript of Long-term changes (1977 Abra alba Melinna palmata

Vol. 49: 65-81, 1988 I MARINE ECOLOGY - PROGRESS SERIES Mar. Ecol. Prog. Ser.
Published November 10
Long-term changes (1977 to 1987) in a muddy fine sand Abra alba - Melinna palmata community
from the Western English Channel: multivariate time-series analysis
Frederic lbanezl, Jean-Claude Dauvin2
C.E.R.O.V., Station Zoologique, BP 28, F-06230 Villefranche-sur-Mer, France * Station Biologique de Roscoff, CNRS-LP 4601 et Universitk P. & M. Curie (Paris VI), F-29211 Roscoff, France
ABSTRACT: Long-term monitoring for 10 yr (1977 to 1987) of the muddy fine sand community of the Bay of Morlaix (N France) has allowed us to determine the principal stages of structural succession following pollution by the hydrocarbons of the 'Amoco Cadiz' (1978). Abundance of 30 main species and biomasses of 30 categories were investigated. Regular series were obtained by averaqng values from each season, resulting in 40 sequential observations. General trends and seasonal variations were extracted by the Eigen-Filtering method whch takes into account the shortness of the annual sampling. Principal component analysis of the covariance matrix of the general trends ex lb i t s 7 successive periods of temporal community changes. T h s succession is a function of changes in duection in gradients within the populations. The community developed through a successional phase following the oil spill, with establishment at first of a community of opportunists, followed by a colonisation of the polychaete Lanice conchilega and finally by reestablishment of the original community pre-Amoco Ca&z. An attempt to classify the species according to their seasonal variations is proposed using a semi- quantitative approach. Results show a concentration of maximal abundances in summer and autumn, and of minimal abundances in winter. The dissimilarity correlograms of the densities and the biomasses were used after rearranging the specles Into 3 trophic groups. The different behaviour of trophc groups is related to recolonization after the oil spill and to organic matter in the sediment.
INTRODUCTION
In 1977, we started a quantitative survey of 2 infralittoral fine and muddy fine sand communities of the Bay of Morlaix (Brittany, N France). The fine sand Abra alba - Hyalinoecia bilineata community is from 'Pierre Noire', and the muddy fine sand Abra alba - MeLinna palmata community is from the 'Riviere de Morlaix'. At that time the communities were in their natural conditions, characterized by small annual and multi-annual variations in their hydrologic and hydro- dynamic characteristics. One year later, the 'Amoco Cadiz' oil spill (March 1978) introduced a vast, acciden- tal disturbance of the sub-littoral communities in Northern Brittany. The perturbation was more pro- nounced in the fine sediment communities (Cabioch et al. 1978, 1980, 1982, Dauvin 1979, 1982). In the fine sand community at Pierre Noire, there were qualitative
and quantitative abrupt, drastic changes after the stress (Cabioch et al. 1978, 1980). The number of species decreased to about 20 %, the density to about 80 O/O and the biomass to about 40 %. In the muddy fine sand community at the 'Riviere de Morlaix' the impact of this pollution was more limited; it was characterized by a decrease in the number of amphipod species.
The short-term changes in these 2 fine sediment communities living in unpolluted conditions, from spring 1979 at 'Pierre Noire' and from summer 1980 at 'Riviere de Morlaix', have been well documented (Cabioch et al. 1980, 1982, Dauvin 1982, 1984). How- ever, structural modifications were still perceptible 3 yr after the pollution occurred. Therefore, a continuous survey of these 2 stations has been carried out since 1980 to determine their long-term changes in natural conditions.
In a previous paper (Dauvin & Ibanez 1986) we
O Inter-Research/Printed in F. R. Germany

66 Mar. Ecol. Prog. Sel
described long-term changes at the first station, the fine sand community at Pierre Noire. Its monitoring for 8 yr (1977 to 1985) allowed us to determine the main stages in its structural succession. The rapid changes in the community during the first 4 yr after the 'Amoco Cadiz' oil spdl showed a period of perturbation followed by the stabilisation of the macrobenthos. This development was a function of changes in the direc- tions of gradients w i t h n the populations, related to the lack of recruitment, biostimulation and proliferation, regression, recolonisation and reconstitution of the populations affected by the oil spill.
This paper presents the results of the 10 yr study (1977 to 1987) of temporal variations at the second station, the muddy fine sand community at 'Riviere d e Morlaix'. In this study, we have used a quarterly samp- ling period which is generally sufficient to show gen- eral trends in the community. Because the number of observations is low, some time-series analysis techni- ques such as spectral analysis cannot be used. There- fore, the data have been analysed by the Eigenvector Filtering method used for planktonic time-series (Col- ebrook 1978). This method, which derives multiannual trends from seasonal and random variations, may be appropriate to series with a limited number of observa- tions. Principal components analysis (PCA) of the covariance matrix of the extracted general trends (first filtering variable, FV) permits identification of 7 princi- pal phases in the long-term changes of the community. ABC (Abundance Biomass Comparison) curves (War- wick 1988) have been used to detect the effects of the oil spill. An attempt to classify species according to their seasonal variations (second FV) is proposed using a semi-quantitative approach. Finally, changes of the species composition of the trophic groups in the time- scale domain are presented using a multivariate exten- sion of a structural function, the distogram.
MATERIALS AND METHODS
Study site. The sampling station ' hv ie re de Morlaiu' (48"3g116N, 3"52'04"W) lies in the middle of the navigational channel at the eastern border of the Mor- laix estuary. The depth is 10 m at low tide. Because the station is located near the mouth of the estuary, the bottom waters show only a very slight dilution during the maximum river discharge in winter and spring (salinity: 33.95 in the bottom layers in March 1982; 32.20 in the bottom layers in June 1984). Salinity ordi- narily ranges from 34.00 in winter to 35.10 at the end of summer. Bottom temperatures range from 8 "C in winter to 16 "C in summer. The difference between the winter and summer extremes of water temperature in the bottom layers usually does not exceed 8 "C; in 1986,
however, it was 10 "C, due to a severe winter (5.8 "C at the bottom layers in March). The sediment at the sampling site is a mixture of fine sand and mud (32 O/O of the sediment consists of particles between 63 and 125 ym). The mean median size is equal to 93 -t 14 pm (20 analyses); the fraction smaller than 45 pm averages 13.5 k 5.7 %. The station is rich in organic matter: particulate organic carbon accounts for 1.39 % of the sediment dry weight (Beslier 1981).
Forty-nine samples were collected during the 10 yr survey (August 1977 to June 1977), i. e . 4 to 6 observa- tions in each annual cycle (from summer to next spring), at 2 to 3 mo intervals. For the samples of August 1977 and August 1978 a Hamon grab was used. It was operated 4 times, covering a surface area of 1.2 m'. For the other 47 samples, a Smith-McIntyre grab was used. This was operated 10 times covering a total surface area of 1 m2. The sampling efficiency of both grabs on the community was similar (Dauvin 1979).
After collection, the sediment was sieved (1 mm circular mesh) and the retained material was fixed with 10 O/O neutral formalin and sorted twice. The second sorting was done after staining with 10 % Rose Bengal. The density of the different species (Nind. and the biomass of the principal species or zoological group (dry weight after decalcification and drying at 110 "C: B gm-') were recorded.
Selection of biological descriptors. The data repre- sent 10 yr of irregular sampling units (49). Regular series were obta~ned by averaging the values from each season, resulting in 40 successive observations. Mathematical treatments were used with the 30 most abundant species. These species represented about 80.3 O/O of the total information (following Legendre & Legendre 1979).
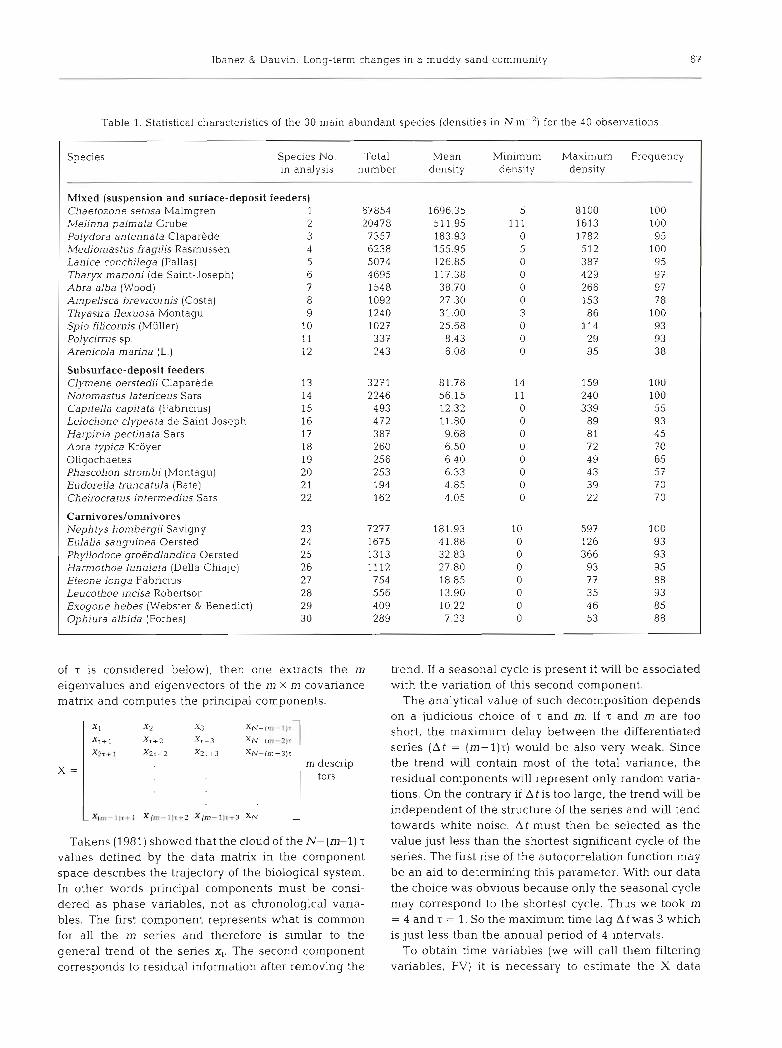
The 30 main species were ranked into 3 trophic groups: M, mixed (suspension feeders and surface- deposit feeders); SSD, subsurface-deposit feeders; C, carnivores/omnivores. Their main characteristics are indicated in Table 1.
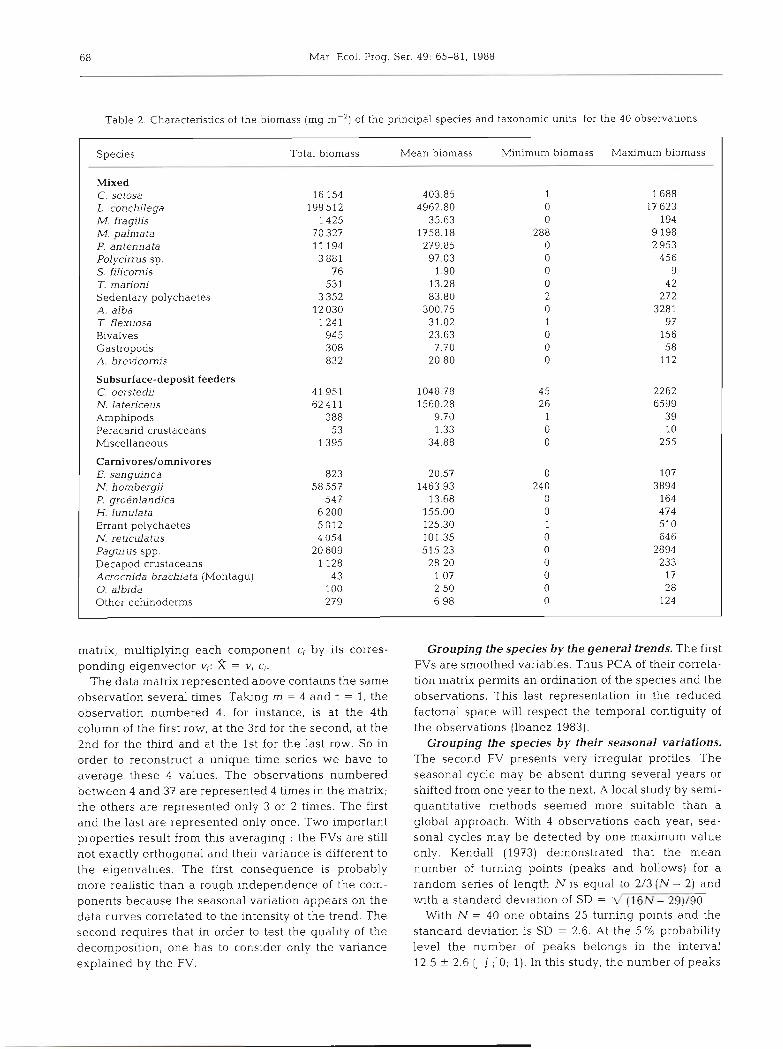
Biomasses were considered after grouping them Into 30 taxonomic units, which ehminated scarce species or species with large individual biomass (Table 2).
Mathematical methods. Mulbannual series are often considered as a mixture of 3 components: the general trend, the seasonal cycle and white noise. Given the paucity of observations per year (only 4 ) , it seemed inadequate to extract the trend by classical polynomial adjustment or by moving averages. We thus used the Eigenvector Filtering method proposed by Colebrook (1978).
Talung a series X,, t varylng between 1 and N, and a shift time interval r, one first constructs a matrix of data X corresponding to m differentiated series (the choice
Ibanez & Dauvin: Long-term changes in a muddy sand community 6.
Table 1. Statistical characteristics of the 30 main abundant species (densities in N m-') for the 40 observations
Species Spec~es No. Total Mean Minlmum Maximum Frequency in analysis number density density density
Mixed (suspension and surface-deposit feeders) Chaetozone setosa Malmgren 1 67854 1696.35 5 8100 100 Melinna palmata Grube 2 20478 511.95 11 1 1613 100 Polydora antennata Claparede 3 7357 183.93 0 1782 95 Mediomastus fragilis Rasmussen 4 6238 155.95 5 512 100 Lanice conchilega (Pallas) 5 5074 126.85 0 387 95 Tharyx marioni (de Saint-Joseph) 6 4695 117.38 0 429 97 Abra alba (Wood) 7 1548 38.70 0 266 97 Ampelisca brevicornis (Costa) 8 1092 27.30 0 153 7 8 Thyasira flexuosa Montagu 9 1240 31.00 3 86 100 Spio filicornis (Miiller) 10 1027 25.68 0 114 93 Polyc~rrus sp. 11 337 8.43 0 29 93 Arenicola marina (L.) 12 243 6.08 0 95 38
Subsurface-deposit feeders Clymene oerstedii Claparede 13 327 1 81.78 14 159 100 Notomastus latericeus Sars 14 2246 56.15 11 240 100 Capitella capitata (Fabricius) 15 493 12.32 0 339 55 Leiochone clypeata de Saint Joseph 16 472 11.80 0 89 93 Harpin~a pectinata Sars 17 387 9.68 0 81 45 Aora typlca Kroyer 18 260 6.50 0 72 70 Oligochaetes 19 256 6.40 0 4 9 65 Phascolion strombi (Montagu) 20 253 6.33 0 4 3 57 Eudorella truncatula (Bate) 2 1 194 4.85 0 39 70 Cheirocratus intermedius Sars 22 162 4.05 0 22 70
Carnivores/omnivores Nephtys hombergii Savigny 23 7277 181.93 10 597 100 Eulalia sanguinea Oersted 24 1675 41.88 0 126 93 Phyllodoce groendlandica Oersted 25 1313 32.83 0 366 93 Harmothoe lunulata (Della Chiaje) 26 1112 27.80 0 93 95 Eteone longa Fabricius 27 754 18.85 0 7 7 88 Leucothoe incisa Robertson 28 556 13.90 0 35 93 Exogone hebes (Webster & Benedict) 29 409 10.22 0 46 85 Ophiura albida (Forbes) 30 289 7.23 0 53 88
of T is considered below), then one extracts the m eigenvalues and eigenvectors of the m X m covariance matrix and computes the principal components.
XN-[m- l l r
X ~ - l r n - 2 ) 1
X ~ - ( r n - 3 ) 1 l m descrip- tors
Takens (1981) showed that the cloud of the N-(m-l) T
values defined by the data matrix in the component space describes the trajectory of the biological system. In other words principal components must be consi- dered as phase variables, not as chronological varia- bles. The first component represents what is common for all the m series and therefore is similar to the general trend of the series X,. The second component corresponds to residual information after removing the
trend. If a seasonal cycle is present it will be associated with the variation of this second component.
The analytical value of such decomposition depends on a judicious choice of t and m. If z and m are too short, the maximum delay between the differentiated series ( A t = (m-1)r) would be also very weak. Since the trend will contain most of the total variance, the residual components will represent only random varia- tions. On the contrary if A t is too large, the trend will be independent of the structure of the series and will tend towards white noise. A t must then be selected as the value just less than the shortest significant cycle of the series. The first rise of the autocorrelation function may be an aid to determining this parameter. With our data the choice was obvious because only the seasonal cycle may correspond to the shortest cycle. Thus we took m = 4 and -c = 1. So the maximum time lag Atwas 3 which is just less than the annual period of 4 intervals.
To obtain time variables (we will call them filtering variables, FV) it is necessary to estimate the X data
68 Mar Ecol. Prog. Ser 49: 65-81, 1988
Table 2. Characteristics of the b~omass (mg m-') of the principal species and taxonomic units, for the 40 observations
Species Total biomass
Mixed C. setosa L conchilega M f raghs M palmata P antennata Polycirrus sp. S. filicornis T. rnarioni Sedentary polychaetes A. alba T flexuosa Bivalves Gastropods A. brevicornis
Subsurface-deposit feeders C. oers tedi N. latericeus Amphipods Peracarld crustaceans Mscellaneous
E. sanguinea N. hombergii P. groenlandica H. lunulata Errant polychaetes N. reticulafus Pagurus spp Decapod crustaceans Acrocnlda brachiata (Montagu) 0. albida Other echinoderms
Mean b~omass P
Mlnimum biomass Maximum biomass
matrix, multiplying each component c, by its corres- ponding eigenvector v,: f( = vi c,.
The data matrix represented above contains the same observation several times. Talung m = 4 and t = 1, the observation numbered 4, for instance, is at the 4th column of the first row, at the 3rd for the second, at the 2nd for the third and at the 1st for the last row. So in order to reconstruct a unique time senes we have to average these 4 values. The observations numbered between 4 and 37 are represented 4 times in the matrix; the others are represented only 3 or 2 times. The first and the last are represented only once. Two important properties result from this averaging : the FVs are still not exactly orthogonal and their variance is different to the eigenvalues. The first consequence is probably more realistic than a rough independence of the com- ponents because the seasonal vanation appears on the data curves correlated to the intensity of the trend. The second requires that in order to test the quahty of the decomposition, one has to conslder only the variance explained by the FV.
Grouping the species b y the general trends. The first FVs are smoothed variables. Thus PCA of their correla- tion matrix permits an ordination of the species and the observations. This last representation in the reduced factorial space will respect the temporal contiguity of the observations (Ibanez 1983).
Grouping the species b y their seasonal variations. The second FV presents very Irregular profiles. The seasonal cycle may be absent during several years or shifted from one year to the next. A local study by semi- quantitative methods seemed more suitable than a global approach. With 4 observations each year, sea- sonal cycles may be detected by one maximum value only. Kendall (1973) demonstrated that the mean number of turning points (peaks and hollows) for a random senes of length N is equal to 2/3 (N - 2) and
- -P -
with a standard deviation of SD = \ ((16.V - 29)/90 With N = 40 one obtains 25 turning po~nts and the
standard deviation is SD = 2.6. At the 5 O/O probabhty level the number of peaks belongs in the interval 12.5 + 2.6 (, 1 ; '0; 1). In this study, the number of peaks
Ibanez & Dauvin: Long-term cha lnges in a muddy sand community 69
corresponding to the annual cycles in our case was theoretically 10. Since this value is close to 12.5, we considered that the above standard deviation repre- sents a criterion to test the regularity of the annual cycle. If a species showed a number of peaks not included between 10 k 2.6 (8 and 12), then it did not present a permanent seasonal cycle.
Also the percentage of explained variance by the second FV is an indication of the importance of the seasonal variations.
The Abundance Biomass Comparison (ABC method of Warwick 1986). Warwick (1986) suggested that the relative position of the cumulative ordered abundances curve compared to that of the cumulative ordered bio- mass (x-axis logarithmic scale, y-axis percentage domi- nance) indicates natural physical and biological dis- turbance as well as pollution-induced disturbance. Undisturbed populations show a cumulative biomass curve lying above the cumulative abundance curve; with moderate disturbance effects the 2 curves coin- cide approximately, whereas the biomass curve lies below the number curve in the case of grossly polluted communities. The ABC method was used in an attempt to quantify the effect of the pollution and the level of maturity of the benthic community.
Structure function: the distogram. The distogram function was first used in plankton ecology by Mackas (1984) and by Ibanez & Boucher (1987) and in benthos by Dauvin & Ibanez (1986). It is a multivariate exten- sion of the vanogram function (Matheron 1974). A variogram gives the variance of a variable at different time (or space) scales ( h ) :
N(h) corresponds to the number of points separated by a distance h. Taking the squared chord length distance a2 between stations at different intervals h , a dissimilarity function called a distogram was defined, giving the importance of scalar changes of the faunistic assemblage in a community (Dauvin & Ibanez 1986):
In this study, the distogram function was used to estimate the community changes among each trophic group during the 10 yr survey.
RESULTS
Composition of the macrobenthic fauna
A total of 276 species were found in the 49 samples collected during the 10 yr chronological series. Eighty- nine species (32 %) were present only on 1 or 2 occa-
sions. Sixty-three species (23 %) had a frequency grea- ter than 50 %. The 3 principal taxonomic groups total- led 92 % of the species number: polychaetes, 4 1.2 %, n~olluscs, 15.3 O/O and crustaceans, 35.6 %. Polychaetes represented more than 97.5 % of the mean density, and 93 % of the mean decalcified dry weight in the com- munity. Molluscs accounted for 1.8% and 2.7 % and crustaceans for 0.35 O/O and 4.0 % of the mean density and the decalcified dry weight, respectively. For the whole sampling period (August 1977 to June 1987), the mean density was 3523 ind. mP2 (varying from 1062 ind. m-2 in March 1985 to 12 223 ind. m-' in August 1982) and the mean decalcified dry weight, not consid- ering the rare species with large individual weights, was 13.6 g mP2 (variations from 1.9 g m-' in June 1986 to 32.7 g m-* in October 1982).
The density and decalcified dry weight of the com- munity showed seasonal variations, with a summer maximum and a winter minimum. Few species sensi- tive to hydrocarbons (amphipods) were represented before the pollution. This resulted in a negligible initial mortality for this community. The principal phenomena after the oil spill (levels of hydrocarbons higher than 100 ppm until summer 1979; 1443 ppm in August 1978) were a significant increase of the detrivorous popula- tions and a proliferation of opportunistic species (Dauvin 1982).
Eigenvector filtering
Table 3 shows for each species the percentages of explained variances. Three categories were recogniz- able:
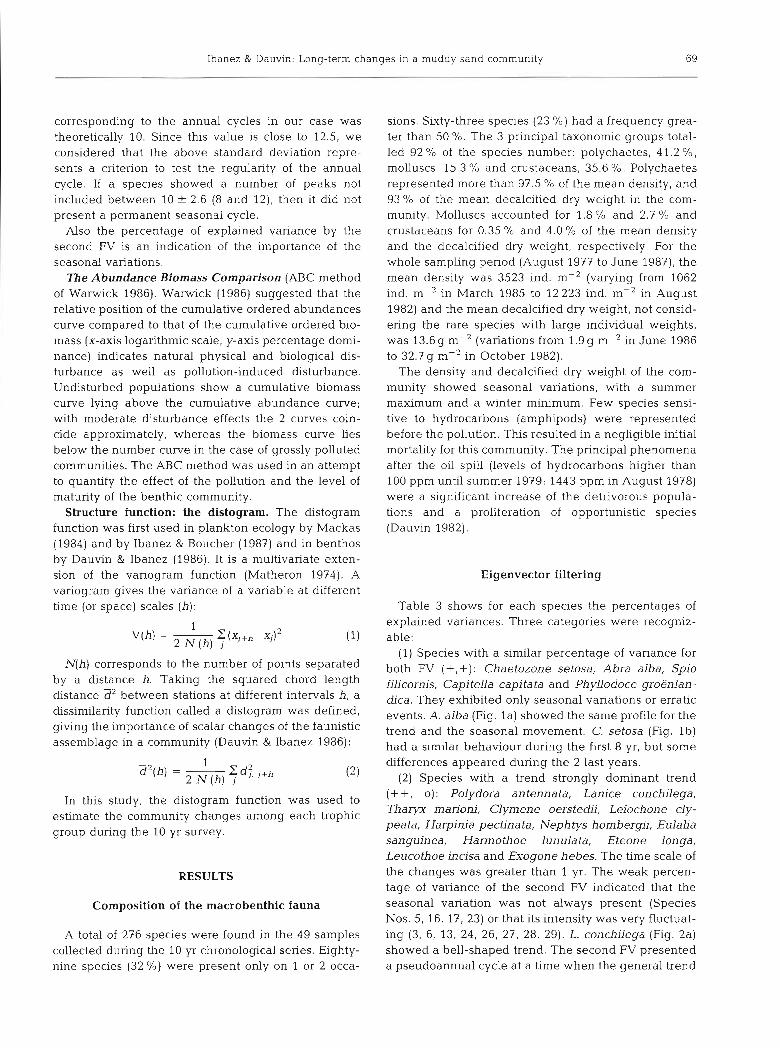
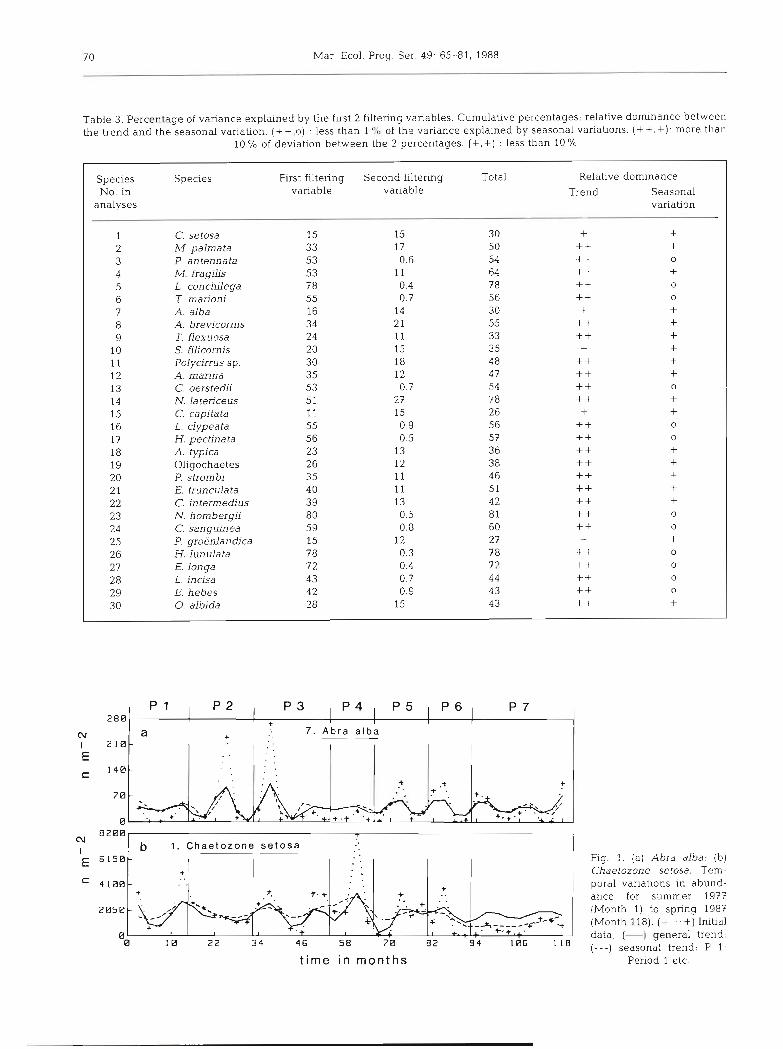
(1) Species with a similar percentage of variance for both FV (+,+): Chaetozone setosa, Abra alba, Spio filicornis, Capitella capitata and Phyllodoce groenlan- dica. They exhibited only seasonal variations or erratic events. A. alba (Fig. l a ) showed the same profile for the trend and the seasonal movement. C. setosa (Fig. l b ) had a similar behaviour during the first 8 yr, but some differences appeared during the 2 last years.
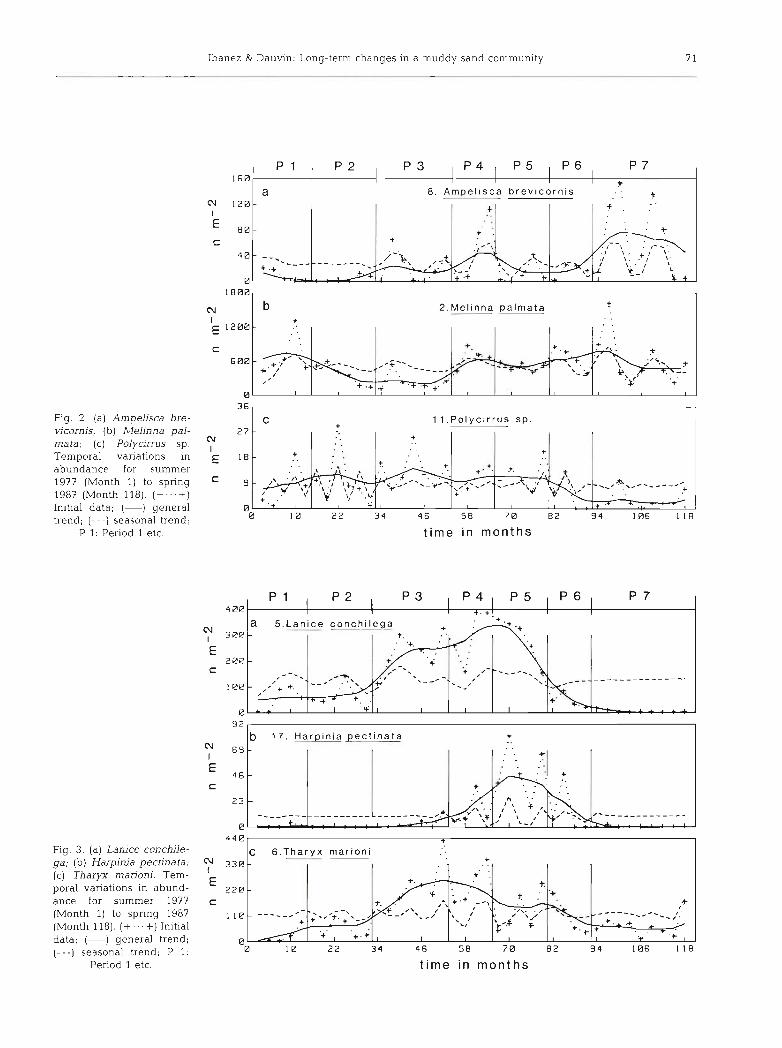
(2) Species with a trend strongly dominant trend (+ +, o) : Polydora antenna ta, Lanice conchilega, Tharyx man'oni, Clymene oerstedii, Leiochone cly- peata, Harpinia pectinata, Nephtys hombergii, Eulalia sanguinea, Harmothoe lunulata, Eteone longa, Leucothoe incisa and Exogone hebes. The time scale of the changes was greater than 1 yr. The weak percen- tage of variance of the second FV indicated that the seasonal variation was not always present (Species Nos. 5, 16, l?, 23) or that its intensity was very fluctuat- ing (3, 6, 13, 24, 26, 27, 28, 29). L. conchilega (Fig. 2a) showed a bell-shaped trend. The second FV presented a pseudoannual cycle at a time when the general trend
7 0 Mar Ecol. Prog. Ser. 49: 65-81, 1988
Table 3. Percentage of variance explained by the first 2 filtering variables. Cumulative percentages; relative dominance between the trend and the seasonal variation. (++,o) : less than l "/o of the variance explained by seasonal variabons. (++.+) more than
10% of deviation between the 2 percentages. (+.+) : less than 10%
Species Species First filtering Second filtering Total Relative dominance No. in variable variable Trend Seasonal
analyses variation
1 C. setosa 15 15 30 + + 2 M, palmata 33 17 50 + + + 3 P, antenna ta 53 0.6 54 + + o 4 M. fragilis 53 11 64 + + -I
5 L. conchdega 78 0.4 78 + + C
6 T marioni 55 0.7 56 + + C
7 A. alba 16 14 30 t + 8 A. brevicornis 34 21 55 + + + 9 T. flexuosa 24 11 33 ++ -1
10 S. filicornis 20 15 35 + + 11 Polycirrus sp. 30 18 48 + + + 12 A. marina 35 12 47 ++ -1
13 C. oerstedii 53 0.7 54 + + 14 N. latericeus 51 2 7 7 8 ++ 15 C. capitata 11 15 26 + 16 L. clypeata 55 0.9 5 6 + + 17 H. pectina ta 56 0.5 57 + + 18 A. typica 23 13 36 + + 19 Oligochaetes 26 12 38 + + 20 P. strombi 35 11 46 + + 21 E. trunculata 4 0 11 51 + + 22 C. intermedius 39 13 42 + + 23 N. hom bergii 80 0.5 8 1 + + 24 C. sanyuinea 59 0.8 60 + + 25 P. grokdandica 15 12 27 + 26 H. lun ula ta 78 0.3 78 + + 27 E. longa 72 0.4 72 + + 28 L. incisa 43 0 7 44 + + 29 E. hebes 4 2 0.9 4 3 t + 3 0 0. albida 28 15 4 3 + +
P 1 P 2 P 3 P 4 P 5 P 6 I P 7
t i m e in months
288
cu 1 2 1 6 - E C 148-
CU 8286 T
b 1. Chaetozone s e t o s a I
Period 1 etc.
I I I
a a ? + 7 . -- Abra a l b a
. . . .
Fig. 1. (a) Abra alba; (b) Chaetozone setosa. Tem- poral variations in abund- ance for summer 1977 (Month 1) to spring 1987 (Month 118). (+ ... +) Initial data; (-1 general trend; (---l seasonal trend: P 1.

72 Mar Ecol. Prog. Ser. 49: 65-81, 1988
was strong. H. pectinata (Fig. 2b) was present during 4 annual cycles only. T. marioni (Fig. 2c) showed a smoothed trend with weak values at the extremities of the series. The seasonal variation was very irregular.
(3) Species with an explained percentage of variance dominant for the first FV, yet with a significant second FV (+ + , +): Melinna palmata, Mediomastus fragilis, ArnpeLisca brevicornis, Thyasira flexuosa, Polycirrus sp., Arenicola marina, Notomastus latericeus, Aora
Fig. 4. Ordination of the 30 species in the plane of the first 2 components with identification of 5 groups by the Lance & Williams (1967) clustering method. 1, 2 . . . : Species Number;
G 1: first group etc.
typica, Oligochaetes, Phascolion strombi, Eudorella truncatula, Cheirocratus in termedius, Ophiura albida. Non-random variations were added to the trend: annual cycle (4 , 8, 12, 14, 18, 20, 21, 22), fluctuations longer than 1 yr (2 , 9, 30) or shorter (11, 19). A. bre- vicornis (Fig. 3a) showed an increasing trend with an oscillation period of about 2 yr. The seasonal cycle was regular except for the first 2 yr. M, palmata (Fig. 3b) presented a large periodic tendency (8 yr) with fluctua- tions of 18 mo. Polycirrus sp. (Fig. 3c) had a trend with an oscillation around 2 yr until it progressively dis- appeared during the last 3 yr. The annual cycle was completely hidden.
Long-term changes in the benthic community
Ordination of species starting from the trends
PCA of the correlation matrix between the first FVs permits an ordination for the species and the observa- tions. The first 2 principal axes represent 58 O/O of the total variance. Fig. 4 shows their correlations with the 3 species. The hierarchical clustering method described by Lance & Williams (1967) (flexible group method on the euclidean distances with fi = -0.3) allowed us to distinguish 5 species groups at the 0.6 level of similar- ity. Starting clockwise from the first group, the gradient of abundance variation tends towards an inversion: Fig. 5 shows a pattern variable for each group repre- senting the average trend of the corresponding species. In order of abundance, the first 4 groups have weak mean abundances whereas Group 5 shows a greater mean abundance.
5 Group 4 : + t +.Group 5:-
+ + '+
P 1 P 2 P 3 l P 4 P 5 P 6 P 7
t ime in m o n t h s
4
Fig. 5. Profiles of the 5 different groups of species defined by the Lance & Williams (1967) hierarchi- cal clustering method. The y-axis gives the cumulative percentage of the trend values divided by the number of species in the considered group ( X 100)
I I
+ + Group 1 : -G*.+. Group 2 :- Group 3: A. +
Ibanez & Dauvin: Long-term changes in a muddy sand community 73
For the first group (12, 14 and 4) the trend was strong during the first 3 yr, but after the 4th year the species progressively vanished, The second group (27, 29, 20, 24, 28 and 11) presented an increasing trend until the 4th year. In this case, the population disappeared after the 8th year. The third group (5, 26, 6, 13, 17, 21, 9, 30 and 19) had an almost symmetrical bell shape. Weak values were limited to the annual cycles at the extremities of the series. The fourth group (23, 8, 22, 16 and 18) showed an almost continously increasing trend until the 8th year; afterwards the abundances pre- sented a much stronger decreasing gradient. The fifth group (1, 2, 3, 7, 10, 15 and 25) was characterised by a merely stationary variation.
Order of observations in factorial space
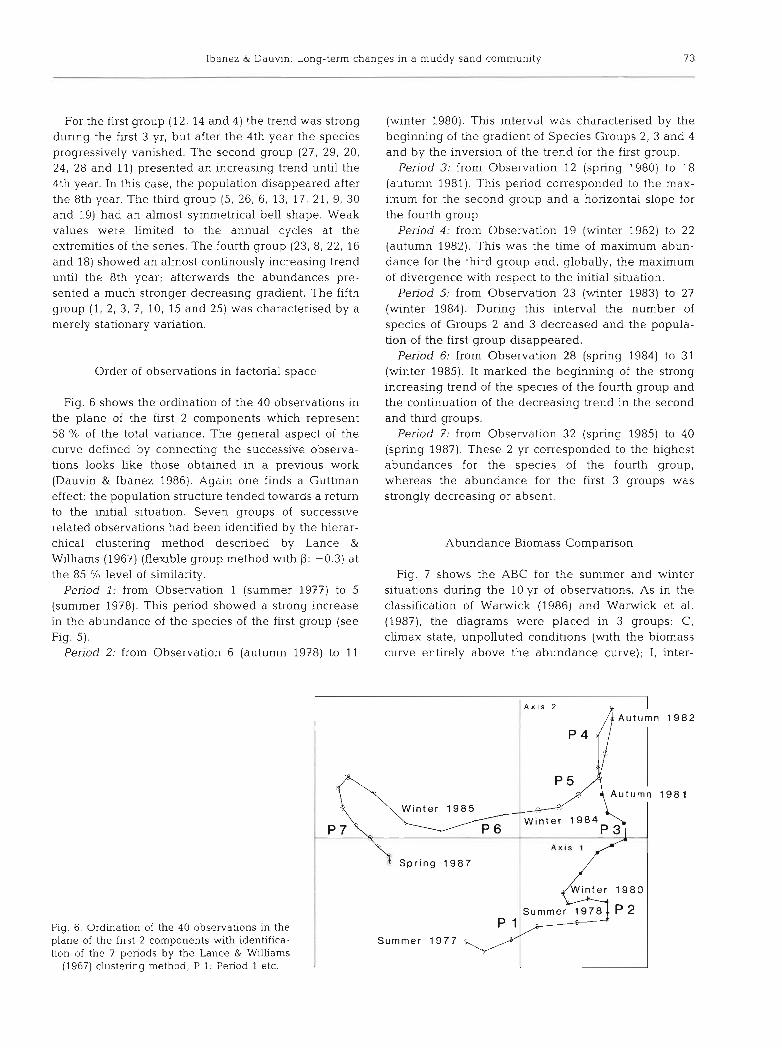
Fig. 6 shows the ordination of the 40 observations in the plane of the first 2 components which represent 58 O/O of the total variance. The general aspect of the curve defined by connecting the successive observa- tions looks like those obtained in a previous work (Dauvin & Ibanez 1986). Again one finds a Guttman effect: the population structure tended towards a return to the initial situation. Seven groups of successive related observations had been identified by the hierar- chical clustering method described by Lance &
Williams (1967) (flexible group method with P: -0.3) at the 85 % level of similarity.
Period 1: from Observation 1 (summer 1977) to 5 (summer 1978). This period showed a strong increase in the abundance of the species of the first group (see Fig. 5).
Penod 2: from Observation 6 (autumn 1978) to 11
(winter 1980). This interval was characterised by the beginning of the gradient of Species Groups 2, 3 and 4 and by the inversion of the trend for the first group.
Period 3: from Observation 12 (spring 1980) to 18 (autumn 1981). This period corresponded to the max- imum for the second group and a horizontal slope for the fourth group
Period 4: from Observation 19 (winter 1982) to 22 (autumn 1982). This was the time of maximum abun- dance for the third group and, globally, the maximum of divergence with respect to the initial situation.
Period 5: from Observation 23 (winter 1983) to 27 (winter 1984). During this interval the number of species of Groups 2 and 3 decreased and the popula- tion of the first group disappeared.
Period 6: from Observation 28 (spring 1984) to 31 (winter 1985). It marked the beginning of the strong increasing trend of the species of the fourth group and the continuation of the decreasing trend in the second and third groups.
Period 7: from Observation 32 (spring 1985) to 40 (spring 1987). These 2 yr corresponded to the highest abundances for the species of the fourth group, whereas the abundance for the first 3 groups was strongly decreasing or absent.
Abundance Biomass Comparison
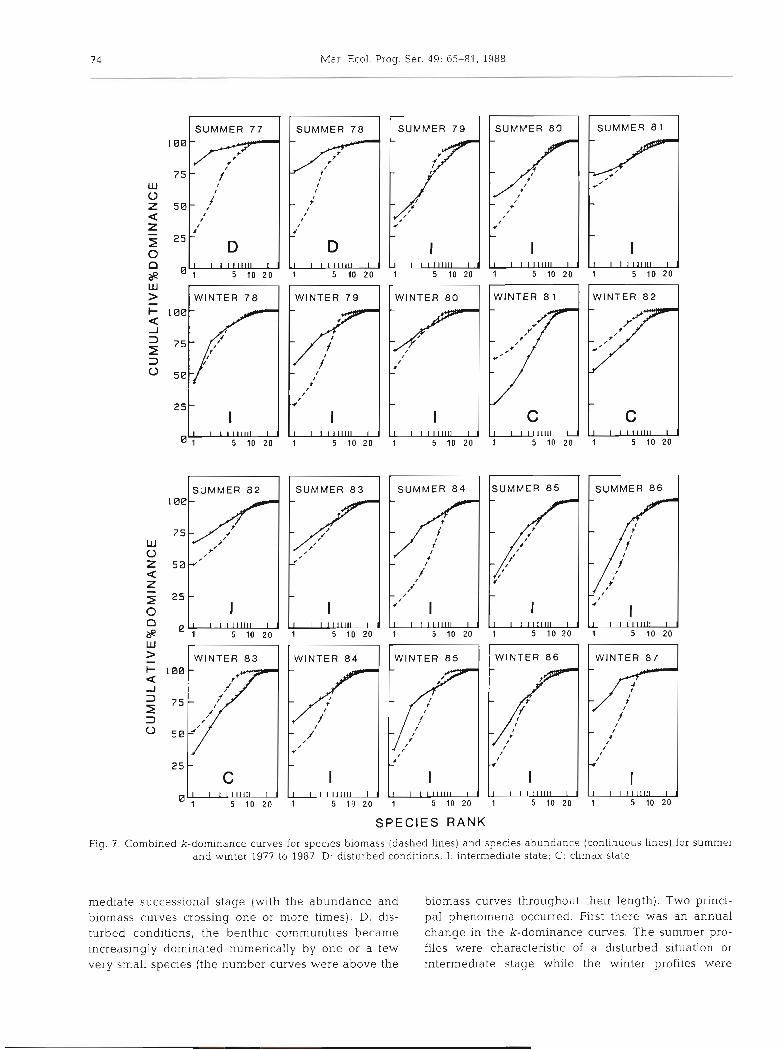
Fig. 7 shows the ABC for the summer and winter situations during the 10 yr of observations. As in the classification of Warwick (1986) and Warwick et al. (1987), the diagrams were placed in 3 groups: C, climax state, unpolluted conditions (with the biomass curve entirely above the abundance curve); I, inter-
I l A x i s 2 *
I h S p r i n g 1 9 8 7
Fig. 6. Ordination of the 40 observations in the plane of the first 2 components with identifica- tion of the 7 periods by the Lance & Williams
(1967) clustering method; P l : Period 1 etc.
74 Mar Ecol. Prog. Ser. 49: 65-81, 1988
SUMMER 7 9 SUMMER 8 0
1 5 10 20
SUMMER 8 1 SUMMER 7 8
. t
1 WINTER 7 8 WINTER 8 0
SUMMER 8 4
4
5 10 20
SUMMER 83
WINTER 8 6
/ /
1 5 10 20
SPECIES R A N K
Fig. 7. Combined k-dominance curves for species biomass (dashed lines) and species abundance (continuous lines) for summer and winter 1977 to 1987 D: disturbed conditions; I: intermediate state; C: climax state
mediate successional stage (with the abundance and biomass curves throughout their length). Two princi- biomass curves crossing one or more times); D, dis- pal phenomena occurred. First there was a n annual turbed conditions, the benthic communities became change in the k-dominance curves. The summer pro- increasingly dominated numerically by one or a few files were characteristic of a disturbed situation or very small species (the number curves were above the intermediate stage while the winter profiles were
Ibanez & Dauvin: Long-term changes in a muddy sand community 75
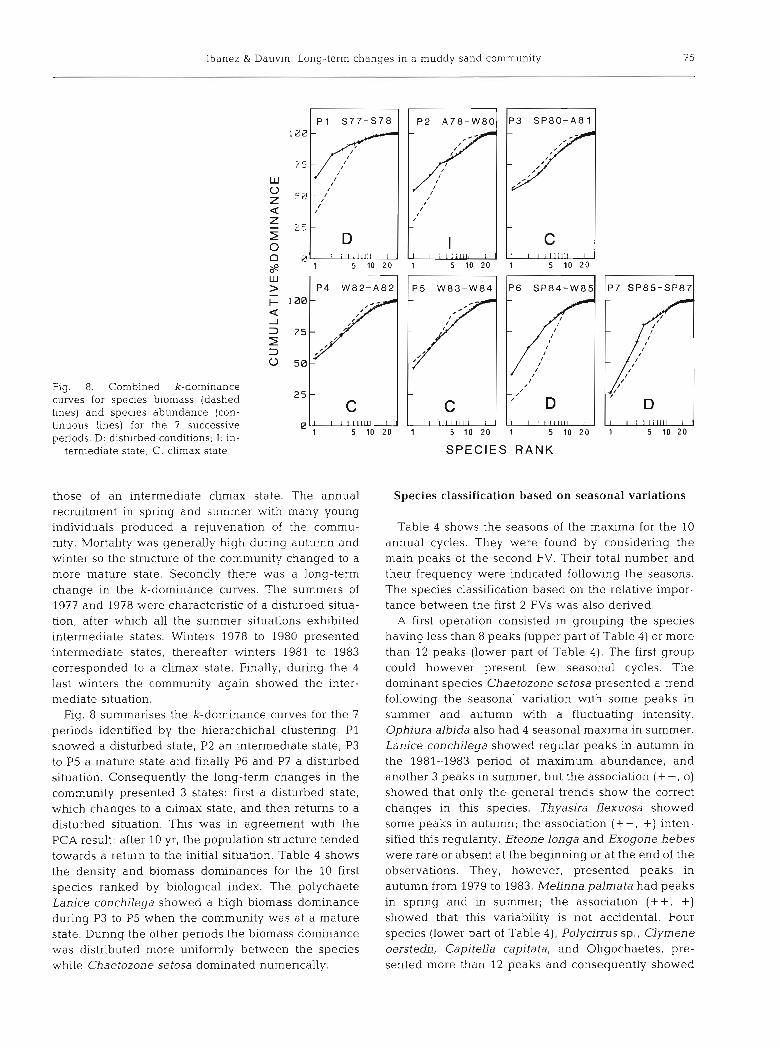
Fig. 8. Combined k-dominance curves for species bion~ass (dashed lines) and species abundance (con- tinuous lines) for the 7 successive periods. D: disturbed conditions; I: in-
termediate state; C: climax state
those of an intermediate climax state. The annual recruitment in spring and summer with many young individuals produced a rejuvenation of the commu- nity. Mortality was generally high during autumn and winter so the structure of the community changed to a more mature state. Secondly there was a long-term change in the k-dominance curves. The summers of 1977 and 1978 were characteristic of a disturbed situa- tion, after which all the summer situations exhibited intermediate states. Winters 1978 to 1980 presented intermediate states, thereafter winters 1981 to 1983 corresponded to a climax state. Finally, during the 4 last winters the community again showed the inter- mediate situation.
Fig. 8 summarises the k-dominance curves for the 7
periods identified by the hierarchichal clustering. P1 showed a disturbed state, P2 an intermediate state, P3 to P5 a mature state and finally P6 and P7 a disturbed situation. Consequently the long-term changes in the community presented 3 states: first a disturbed state, which changes to a climax state, and then returns to a disturbed situation. This was in agreement with the PCA result: after 10 yr, the population structure tended towards a return to the initial situation. Table 4 shows the density and biomass dominances for the 10 first species ranked by biological index. The polychaete Lanice conchilega showed a high biomass dominance during P3 to P5 when the community was at a mature state. During the other periods the biomass dominance was distributed more uniformly between the species while Chaetozone setosa dominated numerically.
SPECIES R A N K
Species classification based on seasonal variations
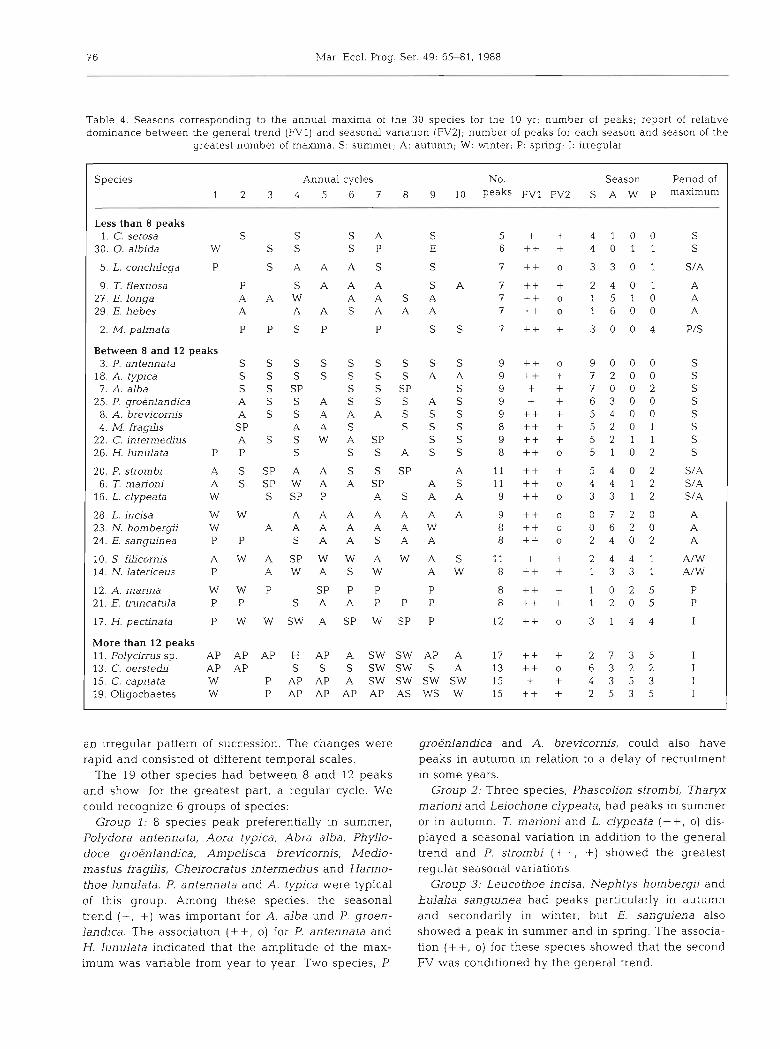
Table 4 shows the seasons of the maxima for the 10 annual cycles. They were found by considering the main peaks of the second FV. Their total number and their frequency were indicated following the seasons. The species classification based on the relative impor- tance between the first 2 FVs was also derived.
A first operation consisted in grouping the species having less than 8 peaks (upper part of Table 4 ) or more than 12 peaks (lower part of Table 4 ) . The first group could however present few seasonal cycles. The dominant species Chaetozone setosa presented a trend following the seasonal variation with some peaks in summer and autumn with a fluctuating intensity. Ophiura albida also had 4 seasonal maxima in summer. Lanice conchilega showed regular peaks in autumn in the 1981-1983 period of maximum abundance, and another 3 peaks in summer, but the association (++, o) showed that only the general trends show the correct changes in this species. Thyasira flexuosa showed some peaks in autumn; the association ( + S , +) inten- sified this regularity. Eteone longa and Exogone hebes were rare or absent at the beginning or at the end of the observations. They, however, presented peaks in autumn from 1979 to 1983. MeLinna palrnata had peaks in spring and in summer; the association (++, +) showed that this variability is not accidental. Four species (lower part of Table 4), Polycirms sp., Clyrnene oerstedii, Capitella capitata, and Oligochaetes, pre- sented more than 12 peaks and consequently showed
7 6 Mar Ecol. Prog. Ser. 49. 65-81, 1988
Table 4. Seasons correspond~ng to the annual maxlma of the 30 species for the 10 yr; number of peaks; report of relahve dominance between the general trend (FV1) and seasonal vanation (FV2); number of peaks for each season and season of the
greatest number of maxima. S. summer, A: autumn; W: wnter; P: spnng; I : irregular
Species Annual cycles No. Season Penod of 1 2 3 4 5 6 7 8 9 10 peaks FV1 FV2 S A W P maximum
Less than 8 peaks 1. C. setosa S S S A S 5 + + 4 1 0 0 S
30. 0. albida W S S S P E 6 + + + 4 0 1 1 S
5. L. conchilega P S A A A S S 7 + + o 3 3 0 1 S/A
9. T. flexuosa P S A A A S A 7 ++ + 2 4 0 1 A 27. E. longa A A W A A S A 7 + + o 1 5 1 0 A 29 E. hebes A A A S A A A 7 ++ o 1 6 0 0 A
2. M. palmata P P S P P S S 7 + + + 3 0 0 4 P/S
Between 8 and 12 peaks 3. P. antennata S S S S S S S S S 9 ++ o 9 0 0 0 S
18. A. typ~ca S S S S S S S A A 9 + + + 7 2 0 0 S 7. A. alba S S SP S S SP S 9 + + 7 0 0 2 S
25. P. groenlandica A S S A S S S A S 9 + + 6 3 0 0 S 8. A. brevicornis A S S A A A S S S 9 + + + 5 4 0 0 S 4. M fragiLis S P A A S S S S 8 + + + 5 2 0 1 S
22. C. intermedius A S S W A S P S S 9 + + + 5 2 1 1 S 26. H. lunulata P P S S S A S S 8 + t o 5 1 0 2 S
20. P. strombi A S S P A A S S S P A 11 ++ + 5 4 0 2 S/A 6. T. marioni A S S P W A A S P A S 11 ++ o 4 4 1 2 S/A
16. L. clypeata W S SP P A S A A 9 ++ o 3 3 1 2 S/A
28. L. incisa W W A A A A A A A 9 ++ o 0 7 2 0 A 2 3 . N . h o m b e r p W A A A A A A W 8 ++ o 0 6 2 0 A 24. E. sanguinea P P S A A S A A 8 ++ o 2 4 0 2 A
10. S. filicornis A W A S P W W A W A S 11 + + 2 4 4 1 A/W
14. N. latericeus P A W A S W A W 8 + + + 1 3 3 1 NW
12. A. manna W W P SP P P P 8 + + + 1 0 2 5 P 21. E. lruncatula P P S A A P P P 8 + + + 1 2 0 5 P
17. H. pectmata P W W S W A SP W SP P 12 + + o 3 1 4 4 I
More than 12 peaks 11.Polycirrussp. AP AP AP H AP A S W S W AP A 17 ++ + 2 7 3 5 I 13. C. oerstedu AP AP S S S S W S W S A 13 ++ o 6 3 2 2 I 15. C. capitata W P AP AP A S W S W S W S W 15 + + 4 3 5 3 I 19. Oligochaetes W P AP AP AP AP AS W S W 15 ++ + 2 5 3 5 I
an irregular pattern of succession. The changes were rapid and consisted of different temporal scales.
The 19 other species had between 8 and 12 peaks and show, for the greatest part, a regular cycle. We could recogmze 6 groups of species:
Group 1: 8 species peak preferentially in summer, Polydora antennata, Aora typica, Abra alba, Phyllo- doce groenlandica, Ampelisca brevicornis, Medio- mastus fragilis, Cheirocratus i n t e r m e d u s and Harmo- thoe lunulata. P. antennata and A . typica were typical of this group. Among these species, the seasonal trend (+, +) was important for A . alba und P. groen- landica. The association (++, o) for P. antennata and H. lunulata indicated that the amplitude of the max- imum was variable from year to year. Two species, P.
groenlandica and A . brevicornis, could also have peaks in autumn in relation to a delay of recruitment in some years.
Group 2: Three species, Phascolion strombi, Tharyx marioni and Leiochone clypeata, had peaks in summer or in autumn. T. manoni and L. clypeata (++, o) dis- played a seasonal variation in addition to the general trend and P. strombi (++, +) showed the greatest regular seasonal variations.
Group 3: Leucothoe incisa, Nephtys hombergi i and Eulalia sanguinea had peaks particularly in autumn and secondarily in winter, but E. sanguiena also showed a peak in summer and in spring. The associa- tion (++, o) for these species showed that the second FV was conditioned by the general trend.

Ibanez & Dauvin: Long-term changes in a muddy sand community 77
Group 4: Spio filicornis and Notomastus latericeus had peaks in autumn or in winter. S. filicornis showed a typical seasonal variation (+, +).
Group 5: Arenicola manna and Eudorella truncatula showed a maximum of peaks in spring; nevertheless the densities of this species were weak and the result must be confirmed.
Group G: Harpinia pectinata (++, o) showed peaks without regular patterns; moreover the species was abundant only from 1981 to 1985.
Among the 25 species having 5 to 11 peaks (Table 4), we totalled 42 % of peaks in summer, 34 % in autumn, 16 % in spring and only 9 O/O in winter. Therefore there was a concentration of maximal abundances in summer and in autumn and inversely a concentration of mini- mal abundances in winter. Ten species are summer species, 6 are autumnal species and 4 summer-autum- nal species.
Distogram of trophic groups
Dissimilarity is calculated for observations separated by 3 to 57 mo with a constant scale of 3 mo (Fig. 9) For nil difference, the dissimilarity (a2) y-axis intercept is above zero; there is a residual variance between inde- pendent temporal replicates (Mackas 1984). Two types of variations can be distinguished.
The first type included the carnivore/omnivore group and the mixed group. They showed an annual change with parallel curves of density and biomass variations. The observations were more consistent among them-
Fig. 9. Distogram for bio- mass and density for the 3 trophic groups. C + 0: car- nivore/omnivore group; M:
selves for an annual time scale (12 mo) than for short scale of 3 or 6 mo. On the other hand, there was an increase in the length of the cycle over the long term. In fact, the observations were more comparable among themselves for an annual scale compared to a longer time scale (24, 36, 48 mo). This result was particularly marked in the case of the abundance of the carnivore/ omnivore group.
The second type corresponded to the subsurface- deposit feeder group. Firstly, the density dissimilarity showed an increasing trend without any annual cycle. The function has a parabolic form near the theoretical dissimilarity correlogram for a variable affected by tur- bulent diffusion (Mackas 1984). Secondly, the biomass dissimilarity was nil: there was neither annual variation nor long-term change.
DISCUSSION
Long-term changes of benthic community
This community is located near the outflow of the Rver Morlaix, and exists in an environment rich in nutrients. Populations of polychaetes are predominant; the dominant species, Chaetozone setosa, was recog- nized as an opportunist species by Hily (1984) in a similar community in the Bay of Brest (W Brittany). Melinna palrnata, Notomastus latericeus, Polydora antennata and Spio filicornis are also tolerant to an excess of organic matter, whereas Nephtys hombergii, Thyasira flexuosa and Albra alba are unaffected by an
/,,;;-.*. . ., '\ \ I 8' 4 * ' ,I :.. . .\ : ,' I . . I I 9. c--*., t," ,'. p-- " . .
I -. . z? +
I . I . . .' .. . + # - . ..Hi -
1 ' '4. ..:v---'
,' . /.-, I , * --.. .,'
-M
mixed group; SSD: subsur- l 2 4 6 B I E ! 2 1 4 1 6 I B 2 0
face-deposit feeder group. D: density; B: biomass t i m e ( q u a r t e r l y )
7 8 Mar. Ecol. Prog. Ser. 49. 65-81, 1988
Table 5. Ten f~rst species In density and in biomass ranking by biological index of Sanders (1960) with indication of their dominance (Err polychaetes errant polychaetes; sed. polychaetes . sedentary polychaetes)
Period 1: summer 1977-summer 1978
Density O/O Biomass Penod 2. autumn 1978-winter 1980
Density % Biomass
C. setosa M palmata L. latenceus M fragilis C. oerstedii N. hombergii S filicornis L. conchilega P. antennata T. marioni
JM palmata N hom bergii N. latenceus C. setosa L. conchilega C. oersted; Pagurus spp. Other decapods N. reticulatus A. alba
C. setosa M. palma ta M. fra gilis N. la tericeus C. oerstedii L. conchilega T marioni T flexuosa E sanguinea E. longa
N. latericeus L, conchllega M palmata N. hombergli C. oersted~i C. setosa Pagurus spp. Err polychaetes M. fragilis A. alba
Penod 3: spring 1980-autumn 1981
Density O/O Biomass - p--- -
Period 4. wnter 1982-autumn 1982
Density O/O B~omass - --
C. setosa M. fragdis L. conchilega T marioni M palmata N. hombergb E. sangulnea C, oersted11 N. latenceus E longa
L. conchilega N. hombergii C. oersteA N. latenceus M. palmata Pagurus spp. C, sefosa Polycjrrus sp. H lunulata N. retlcula tus
C. setosa 1L.l palmata L. conchilega T. marioni M. fragilis N. hom bergii C. oerstedil P. antennata E. sanguinea H. lunulata
L. conchilega N. hombergu M palmata C. oersted11 L. latenceus Pagurus spp. C. setosa H lunulata P. antennata Err. polychaetes
Period 5: winter 1983-winter 1984 Period 6: spring 1984-winter 1985
Density YO Biomass Density YO Biomass
M. palmata L. conchllega C. oerstedii N. hom berglj C. setosa T. manoni M frag111s H, lun ula ta E sanguinea H. pectinata
L. con chilega M. palmata N. h om bergii C. oerstedii N. latericeus H. lunulata N. reticulatus Pagurus spp. Err. polychaetes Polyanus sp.
M. palmata 29.5 N.homberg11 17.4 T. marioni 4.2 C. setosa 25.7 C. oerstedii 4.1 M fragilis 2.3 L. conchilega 1.7 P. antenna ta 4 9 T fle.uuosa 1.1 P. groenlandjca 1.0
L. conchilega M. palmata N. hombergil C. oerstedii Pagurus spp. N. latericeus N. rehculatus Sed. polychaetes P. antennata H. lunulata
- -
Penod 7 spring 1985-spnng 1987
Densitv O/O Biomass
M. palmata N. hombergii C setosa P. antennata T marioni C. oersted5 A brew'cornis T flexuosa M. fragilis N. latenceus
N. hombergu M palma ta N latericeus C. oerstedii Pagurus spp. P. antennata Sed. polychaetes N rehculatus C. setosa L. conchilega
Ibanez & Dauvin: Long-term c h a ~ Iges in a muddy sand cominunity 7 9
excess of organic matter. The 'Amoco Cadiz' oil spill modified this benthic ecosystem by introducing a high level of hydrocarbons in the sediment, from spring 1978 to spring 1980 (Dauvin 1982). After the primary phase had induced heavy mortalities, the second phase of pollution was characterized by an excess of organic matter in the benthic comn~unities (Dauvin 1982, 1984).
The PCA on the general trends of the descriptors shows that the muddy fine-sand community at 'Riviere d e Morlaix' station presents progressive changes over time. The observations of the 2 first periods P1 and P2 (summer 1977 to winter 1980) are close together in the factorial space. During the first annual cycle after the oil spill, some species were found to be very abundant, like the opportunistic polychaete Chaetozone setosa (which was abundant before pollution) and other polychaetes Mediomastus fragilis and Tharyx marioni (which are rare in natural conditions in the Bay of Morlaix). From the third period, P3, the changes increase progressively. The maximum divergence is reached at the 4th period, P4. These 2 periods, P3 and P4, are characterised by the gradual settling out of Lanice conchilega (species of Group 3). P5 corresponds to the regression of the facies of L. conchilega. During the 6th period a decrease of species in Groups 2 and 3 occurred, and the beginning of an increase of species of Group 4. The last period, P?, is a return to the initial situation. The amphipods Ampelisca brevicornis, Aora typica and Cheirocratus intermedius of Group 4 recolonised the community, while Melinna palmata increased progressively.
This succession seems similar to those described by Pearson & Rosenberg (1978) and Hily (1984) in cases of organic pollution. This study shows that recovery took 10 yr; nevertheless the process is not completely revers- ible.
With the ABC method of Warwick (1986) successional phenomena are also recognisable: first a disturbed or intermediate state (P1 and P2), then a mature state during the facies of Lanice conchilega and a return to the disturbed state at the end of the observations (P6 and P?). This method has been also applied to the 'Pierre Noire' data. In natural conditions Ampelisca species were numerically dominant and their populations were destroyed by the 'Amoco Cadiz' oil spill. In these condi- tions the ABC method shows a disturbed state during the dominance by Ampelisca and a mature state after the 'Amoco Cadiz' oil spill. Therefore, the ABC method may be used in certain cases to distinguish successive steps after pollution, but in the 'Pierre Noire' case it was of no use. In this community other synthetic methods such as log-normal diagrams were also ill-adapted to expose perturbations (Dauvin 1984).
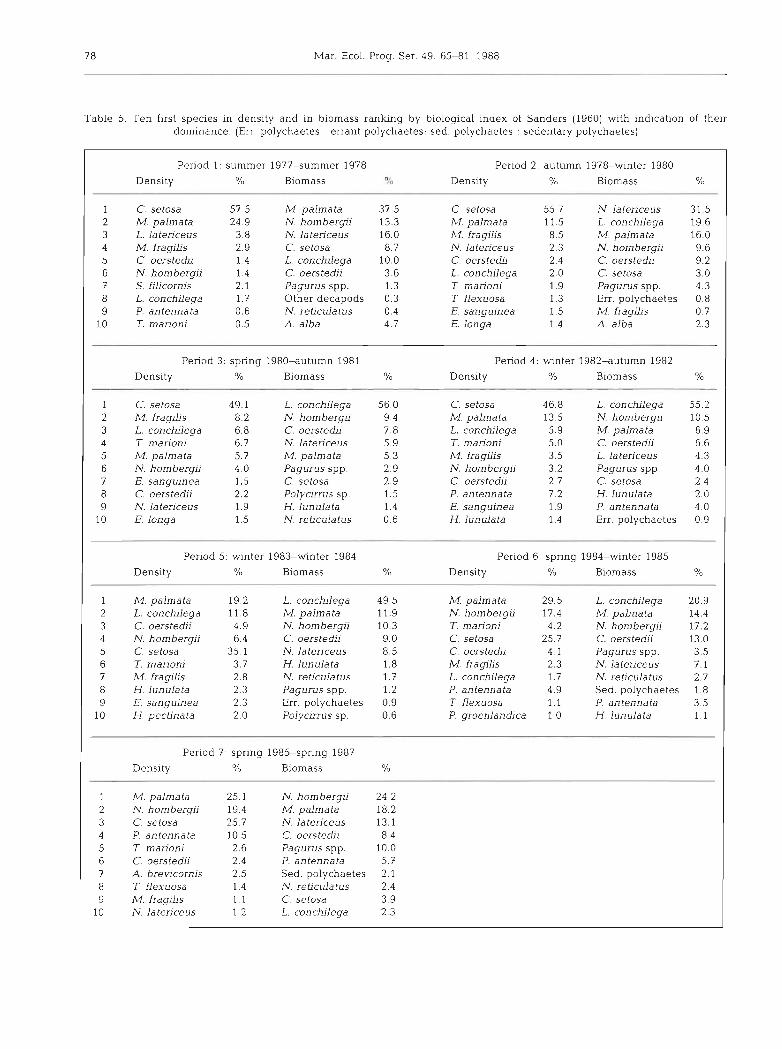
Table 5 lists the first 10 species ranked in decreasing order of density or biomass according to Sanders' index (1960j. It mainly shows the abundance and decalcified
dry weight decrease for Melinna palmata from P2 to P5, the opposite behaviour for Lanice conchilega from P1 to P5 followed by extinction, the numerical increase of Mediomastus fraglljs (opportunist polychaete) during P2 and P3 and the high importance of Nephtys homber- gii during P6 and P?.
The appearance of a facies of Lanice conchilega in spring 1980 is coincident with the period when the degree of pollution first fell below the significant threshold (50 pg g-l).
The unpolluted sediments probably permitted the recruitment of sensitive species such as Clymene oer- stedii, Lanice conchilega and the peracarids (Group 3: Harpinia pectinata, Eudorella trunculata; Group 4: ArnpeLisca brevicornis, Aora typica and Cheirocratus intermedius). However, the degree of pollution of sedi- ments does not account for all the population changes.
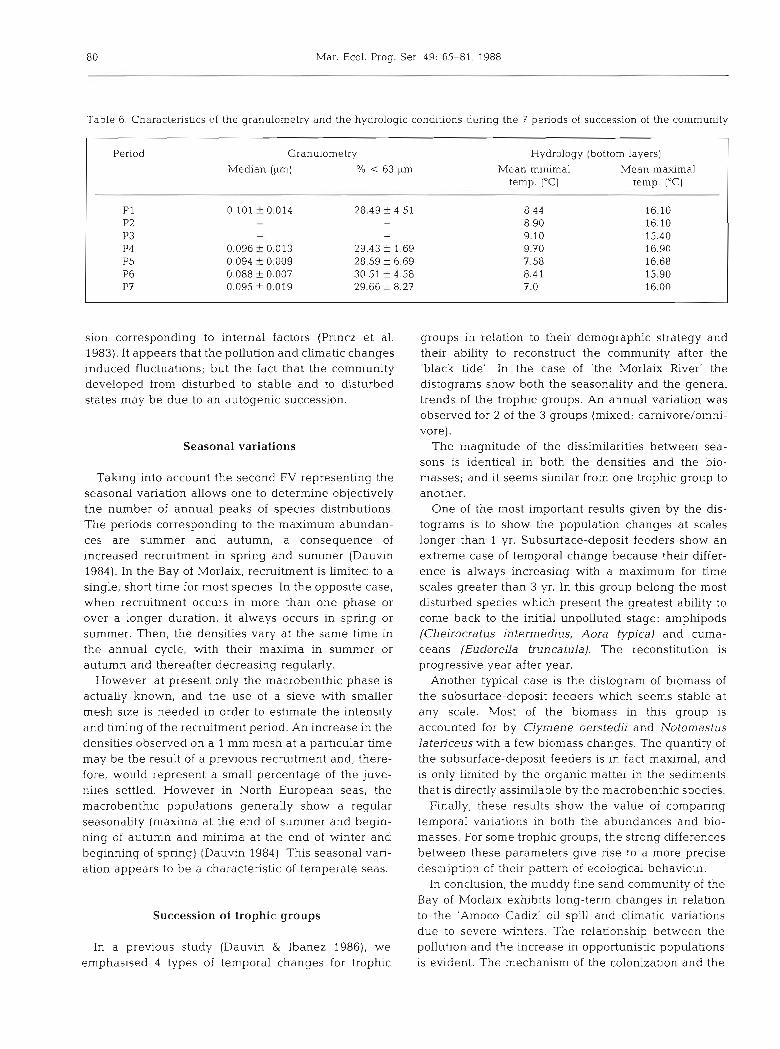
Besides the species abundances and biomasses, we collected data on the sediment granulometry and on hydrological parameters. The median grain size and the percentage of particles smaller than 63 pm did not vary significantly from one period to the next (Table 6) : medians ranged from 0.088 f 0.007 to 0,101 f 0.014 pm and percentages of small particles were between 28.49 i 4.51 and 30.51 f 4.58.
Mean minimal temperatures in winter increased from P1 to P4 (8.44 to 9.70 "C). Then it decreased sharply during the period P5 (7.58 "C), increased in P6 (8.41 "C) and reached a minimum in P7 (hard winter of 1986 : 5.8 "C). The mean of maximal temperatures in summer had its peak during P4 (6.68 "C).
Changes in the population could therefore, be of climatic origin: there were successive mild winters from 1978 to 1982, then severe winters from 1983 to 1987. Several authors (Gray & Christie 1983, Princz et al. 1983, Rees et al. 1983, Buchanan & Moore 1986a, b) have suggested climatic factors as a n explanation for population changes. For instance, considering Lanice conchilega associated with a population of Abra alba in Liverpool Bay, UK, Rees et al. (1983) noticed a cycle of about 6 to 7 yr. This oscillation of the recruitment seemed to be synchronised with similar events occur- ring in a part of the North Sea. In the case of the Bay of Morlaix, observations over a longer time span are needed to test this hypothesis.
In summary, the principal chronological steps of the succession are (1) mortality of a few peracarid species after the initial stress and stimulation of opportunistic polychaetes abundant in the community in natural con- ditions; (2) colonization and disappearance of Lanice conchilega; and (3) re-establishment of the peracarid populations and return of the opportunistic polychaete- dominated community pre 'Amoco Cadiz'. In temporal succession, it is always difficult to distinguish between fluctuations induced by external factors and real succes-
80 Mar. Ecol. Prog. Ser. 49: 65-81, 1988
Table 6. Characteristics of the granulometry and the hydrologic conditions during the 7 periods of succession of the community
Period Granulometry Median (pm) '10 < 63 p
Hydrology (bottom layers) Mean mlnimal Mean maximal
temp. ("C) temp. ("C)
sion corresponding to internal factors (Princz et al. 1983). It appears that the pollution and climatic changes induced fluctuations; but the fact that the community developed from disturbed to stable and to disturbed states may be due to an autogenic succession.
Seasonal variations
Taking into account the second FV representing the seasonal variation allows one to determine objectively the number of annual peaks of species distributions. The periods corresponding to the maximum abundan- ces are summer and autumn, a consequence of increased recruitment in spring and summer (Dauvin 1984). In the Bay of Morlaix, recruitment is limited to a single, short time for most species. In the opposite case, when recruitment occurs in more than one phase or over a longer duration, it always occurs in spring or summer. Then, the densities vary at the same time in the annual cycle, with their maxima in summer or autumn and thereafter decreasing regularly.
However, at present only the macrobenthic phase is actually known, and the use of a sieve with smaller mesh size is needed in order to estimate the intensity and timing of the recruitment period. An increase in the densities observed on a 1 mm mesh at a particular time may be the result of a previous recruitment and, there- fore, would represent a small percentage of the juve- niles settled. However in North European seas, the macrobenthic populations generally show a regular seasonality (maxima at the end of summer and begin- ning of autumn and minima at the end of winter and beginning of spring) (Dauvin 1984). This seasonal vari- ation appears to be a characteristic of temperate seas.
Succession of trophic groups
In a previous study (Dauvin & Ibanez 1986), we emphasised 4 types of temporal changes for trophic
groups in relation to their demographic strategy and their ability to reconstruct the community after the 'black tide'. In the case of 'the Morlaix River' the distograms show both the seasonality and the general trends of the trophic groups. An annual variation was observed for 2 of the 3 groups (mixed; carnivore/omni- vore).
The magnitude of the dissimilarities between sea- sons is identical in both the densities and the bio- masses; and it seems similar from one trophic group to another.
One of the most important results given by the dis- tograms is to show the population changes at scales longer than 1 yr. Subsurface-deposit feeders show an extreme case of temporal change because their differ- ence is always increasing with a maximum for time scales greater than 3 yr. In this group belong the most disturbed species which present the greatest ability to come back to the initial unpolluted stage: amphpods (Cheirocratus intermedius, Aora typica) and cuma- ceans (Eudorella truncatula). The reconstitution is progressive year after year.
Another typical case is the dstogram of biomass of the subsurface-deposit feeders which seems stable at any scale. Most of the biomass in this group is accounted for by Clymene oerstedii and Notomastus latenceus with a few biomass changes. The quantity of the subsurface-deposit feeders is in fact maximal, and is only limited by the organic matter in the sediments that is directly assimilable by the macrobenthic species.
Finally, these results show the value of comparing temporal variations in both the abundances and bio- masses. For some trophic groups, the strong differences between these parameters give rise to a more precise description of their pattern of ecological behaviour.
In conclusion, the muddy fine sand community of the Bay of Morlaix exhibits long-term changes in relation to the 'Amoco Cadiz' oil spill and climatic variations due to severe winters. The relationship between the pollution and the increase in opportunistic populations is evident. The mechanism of the colonization and the

Ibanez & Dauvin: Long-term ch anges in a muddy sand community 8 1
disappearance of Lanice conchilega is more difficult to interpret. The re-establishment of the pre-'Amoco Cadiz' structure takes a long-time and justified a long- term survey of this benthic community after such a stress. Long-term series will permit one to distinguish between variability due to natural fluctuations, and to autogenlc successions.
These data were analyzed by methods seldom used in benthos analysis. The generalization of these methods in benthic studies should allow the compari- son in space and time of the scale of hydrographic factors for the observed phenomena.
Acknowledgements. This study was carried out under the program 'GRECO Manche du CNRS'. It is also a part of the research programs 'Arnoco Cadiz' and 'Veille Ecologique', sponsored by the NOAA-CNEXO, the 'Ministere de 1'Environ- nement et du Cadre de Vie' and the 'Region Bretagne'. The authors thank the crew of NO 'Mysis' for their valuable assist- ance in field work, M. Joncourt for her help in sorting the samples, M. Etienne for her help in information programming, B. Kloareg and J . C. Aldrich for help in correcting the English text and N. Guyard for typlng the manuscript.
LITERATURE CITED
Beslier, A. (1981). Les hydrocarbures de 1'Amoco Cadiz dans les sediments subtidaux au nord de la Bretagne. Distribu- tion et evolution. These Doct. 3eme cycle, Univ. Caen
Buchanan, J . B., Moore, J. J. (1986a). Long-term studes at a benthic station off the coast of Northumberland. Hydro- biologia 142: 121-127
Buchanan, J. B., Moore, J. J. (198613). A broad review of variability and persistence in the Northumberland benthic fauna - 1971-85. J. mar. biol. Ass. U. K. 66: 641-657
Cabioch, L., Dauvin, J.-C., Gentil, F. (1978). Preliminary observations on pollution of the sea bed and disturbance of sub-littoral communities in northern Brittany by oil from the Amoco Cadiz. Mar. Pollut. Bull. 9: 303-307
Cabioch, L., Dauvin, J.-C.. Mora Bermudez, J. , Rodriguez Babio, C. (1980). Effets de la maree noire de 1'Amoco- Cadiz sur le benthos sublittoral du nord de la Bretagne. Helgolander Meeresunters. 33: 192-208
Cabioch, L., Dauvin, J.-C., Retiere, C., kvain, V., Archam- bault, D. (1982). Evolution a long terrne (1978-1981) de peuplements benthiques de fond sedirnentaire de la region de Roscoff, perturbes par les hydrocarbures de 1'Amoco- Cadiz. Neth. J. Sea Res. 16: 491-501
Colebrook. J. M. (1978). Continuous plankton records: zoo- plankton and environment, North-East Atlantic and North Sea 1948-1975. Oceanologica Acta 1: 9-23
Dauvin, J.-C. (1979). Recherches quantitatives sur le peuple- ment des sables fins de la Pierre Noire, baie de Morlaix et sur sa perturbation par les hydrocarbures de 1'Amoco Cadiz. These Doct. 3eme cycle, Univ. P. & M. Curie, Paris
Dauvin, J.-C. (1982). Impact of Amoco Cadiz oil spill on the
muddy fine sand Abra alba and Melinna palrnata com- munity from the bay of Morlaix. Estuar. coast. Shelf Sci. 14- 517-531
Dauvin, J.-C. (1984). Dynamique d'ecosystemes macrobenthi- ques des fonds sedimentaires de la baie de Morlaix et leur perturbation par les hydrocarbures de 1'Amoco Cadiz. These Doct. Etat, Sci. Nat., Univ. P. & M. Curie, Paris
Dauvin, J.-C., Ibanez, F. (1986). Variations a long-terme (1977-1985) du peuplement des sables fins de la Pierre Noire (baie de Morlaix, Manche occidentale): analyse statistique de l'evolution structurale. Hydrobiologia 142: 171-186
Gray, J. S., Christie, H. (1983). Predicting long-term changes in marine benthic communities. Mar. Ecol. Prog. Ser. 13: 87-94
Hily, C. (1984). Variabilite de la macrofaune benthque dans les mil ieu hypertrophiques de la rade de Brest. These Doct. Etat, Sci. Nat, Univ. Brest
Ibanez, F. (1983). Optimisation de la representation des series chronologiques planctoniques multivariables. Rapp. comm. int. Mer Medit. 28: 113-1 15
Ibanez, F., Boucher. J. (1987). Anisotrophie des populations zooplanctoniques dans la zone frontale de la mer Ligure. Oceanologica Acta 10: 205-216
Kendall, M. (1973). Time-series. Griffin, London Lance, G. N., Williams, W. T. (1967). A general theory of
classificatory sorting strategies. I. Hierarchical systems. Computer J. 9: 373-380
Legendre, L., Legendre, P. (1979). Ecologie numerique. 1. Le traitement multiple des donnees ecologiques. Masson, Paris, et les Presses de 1'Universite du Quebec
Mackas, D. L. (1984). Spatial autocorrelation of plankton com- munity composition in a continental shelf ecosystem. Lim- nol. Oceanogr. 20: 451471
Matheron, G . (1974). Application de la theorie des variables regonalisees. Cah. C. M. M. Fontanebleau 5: 1-212
Pearson, T. H., Rosenberg, R. (1978). Macrobenthos succes- sion in relation to organic enrichment and pollution of the marine environment. Oceanogr. mar. Biol. A. Rev. 16: 229-3 11
Princz, D., Menesguen, A., Glemarec, M. (1983). Temporal evolution over ten years in the macrobenthos of muddy sands in the Bay of Concarneau (France). In: Boutler, T. (ed.) Proceedings 17th Eur. Mar. Biol. Symp. Oceanologica Acta (1983) vol. spec., p. 159-163
Rees, E. I. S., Walker, A. J. M. (1983). Annual and spatial variation in the Abra community in Liverpool bay. In: Boutler, T. (ed.) Proceedings 17th Eur. Mar. Biol. Symp. Oceanologica Acta (1983) vol. spec. p. 165-169
Sanders, H. L. (1960). Benthlc studies in Buzzards Bay. 111. The structure of the soft-bottom community. Limnol. Oceanogr. 5: 138-153
Takens, F. (1981). Detecting strange attractors in turbulence. In: Rand, D. A., Young, L. S . , (eds.) Dynamical systems and turbulence. Springer-Verlag, New York, p. 366-381
Warwick, R. M. (1986). A new method for detecting pollution effects on marine macrobenthic communities. Mar. Biol. 92: 557-562
Warwick, R. M, , Pearson, T. H., R u s w a h y u ~ (1987). Detection of pollution effects on marine macrobenthos: further evalu- ation of the species abundancehiomass method. Mar. Biol. 95: 193-200
This art~cle was submitted to the editor; it was accepted for printing on August 5, 1988