
LIENS Code de la Propriété Intellectuelle. articles L 122....
146
AVERTISSEMENT Ce document est le fruit d'un long travail approuvé par le jury de soutenance et mis à disposition de l'ensemble de la communauté universitaire élargie. Il est soumis à la propriété intellectuelle de l'auteur. Ceci implique une obligation de citation et de référencement lors de l’utilisation de ce document. D'autre part, toute contrefaçon, plagiat, reproduction illicite encourt une poursuite pénale. Contact : [email protected] LIENS Code de la Propriété Intellectuelle. articles L 122. 4 Code de la Propriété Intellectuelle. articles L 335.2- L 335.10 http://www.cfcopies.com/V2/leg/leg_droi.php http://www.culture.gouv.fr/culture/infos-pratiques/droits/protection.htm
Transcript of LIENS Code de la Propriété Intellectuelle. articles L 122....

AVERTISSEMENT
Ce document est le fruit d'un long travail approuvé par le jury de soutenance et mis à disposition de l'ensemble de la communauté universitaire élargie. Il est soumis à la propriété intellectuelle de l'auteur. Ceci implique une obligation de citation et de référencement lors de l’utilisation de ce document. D'autre part, toute contrefaçon, plagiat, reproduction illicite encourt une poursuite pénale. Contact : [email protected]
LIENS Code de la Propriété Intellectuelle. articles L 122. 4 Code de la Propriété Intellectuelle. articles L 335.2- L 335.10 http://www.cfcopies.com/V2/leg/leg_droi.php http://www.culture.gouv.fr/culture/infos-pratiques/droits/protection.htm
Ecole doctorale Sciences et Ingénierie Ressources Procédés Produits Environnement RP2E
Thèse Présentée en vue de l’obtention du grade de
Docteur de l’Université de Lorraine en Génie des Procédés et des Produits
par
Roberto Nicolas Olcese
Valorisation des vapeurs de pyrolyse de lignine par hydrodéoxygénation directe catalysées par le fer
Valorization of lignin pyrolysis vapors by iron-catalyzed direct hydrodeoxygenation.
Soutenue publiquement le 31 Octobre 2012 devant la commission d’examen :
Membres du Jury :
Cédric Briens (Pr. U. of Western Ontario, rapporteur) Yves Schuurman (DR CNRS-IRCE-Lyon, rapporteur) Sylvette Brunet (CR CNRS IC2MP-LACCO, U. de Poitiers, examinatrice) Damien Hudebine (IR IFPEN –Solaize, examinateur) Mohammed Bettahar (Pr. Emérite, U. de Lorraine – SRSMC, Vandoeuvre, co-encadrant Thèse, examinateur) Dominique Petitjean (Pr. U. de Lorraine, dir. Thèse, examinateur) Anthony Dufour (CdR CNRS LRGP, co-directeur Thèse, examinateur)
Laboratoire Réactions et Génie des Procédés (LRGP), Equipe Génie des Réactions pour l'Environnement et les Energies Renouvelables (GREENER), CNRS-ENSIC, 1 rue Grandville, Nancy, France.

1

2
Acknowledgements
I express my biggest thankfulness to Roberto, Marisa and Juan Diego Olcese (my father, mother and brother); and to Nathalie Olcese (my wife). I want to thank them on the first place, for being there always I needed.
I want also to thanks to Carlos Parodi and Ester Ocampo from Chemical Engineering Faculty at Santa Fe (FIQ, National University of Litoral), they helped me to study Master in France. I thank also Silvia Clement and Liliana Freire, who taught me French before coming. The National Engineers’ School Chemistry of Clermont-Ferrand (ENSCCF, Blaise Pascal University) is acknowledged.
I express a deep gratitude to Isabel Di Cosimo and Cristian Ferretti from Catalysis and Petro-chemistry Institute (InCaPe – CONICET, Santa Fe), and to the whole GICIC team as well. The formation they gave me allowed a quick start of research activities during my PhD grant.
I express an enormous gratitude to Anthony Dufour and Mohammed Bettahar, both professionally and personally. During these three years of research, working with you has been exceptionally enriching and unforgivably pleasant.
I also want to express my appreciation to the fantastic people that worked with me during those very pleasant three years in University of Lorraine: Dominique Petitjean, Jean-Charles Moise, George Lardier, Laura Tibavizco, Jessica François, Michel Mercy, Bernard Malaman, Franck Giovanella, Christian Blanchard, Jaafar Ghanbaja, Gabriel Wild and Nicolas Brosse. I express thanks also to the whole GREENER team.
Finally, I thank my friends for so many funny times.

3

4
5
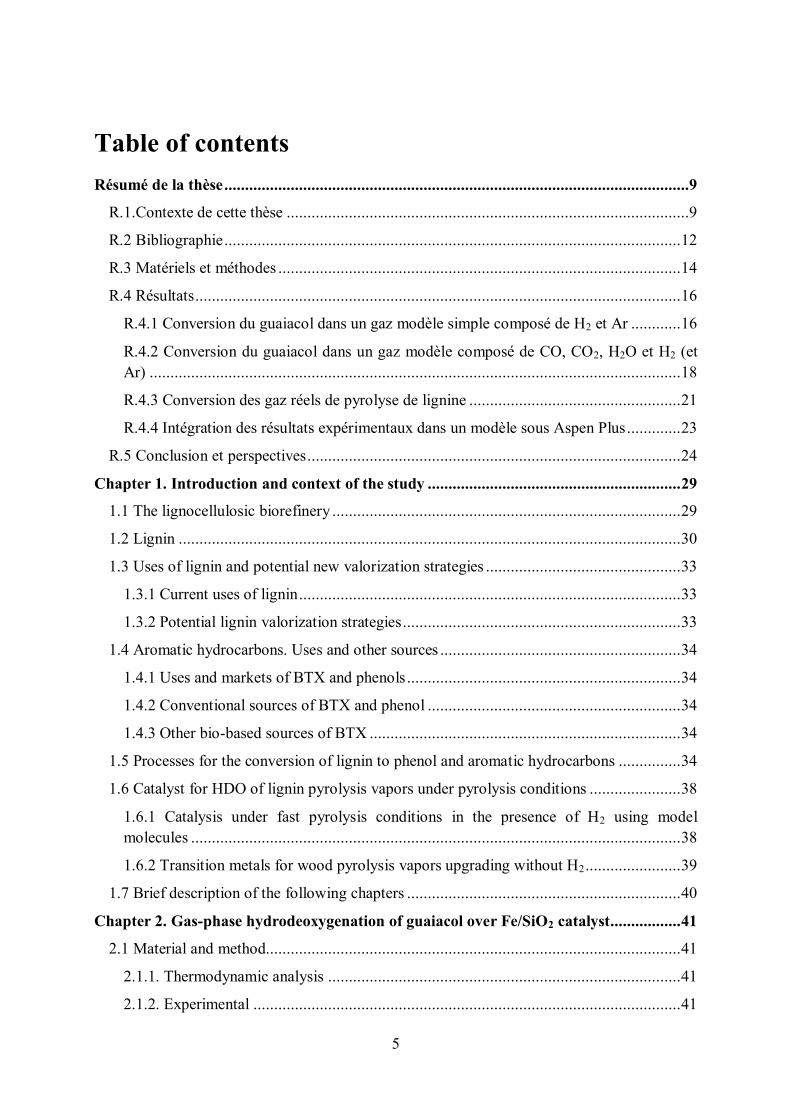
Table of contents Résumé de la thèse ................................................................................................................9
R.1.Contexte de cette thèse .................................................................................................9
R.2 Bibliographie .............................................................................................................. 12
R.3 Matériels et méthodes ................................................................................................. 14
R.4 Résultats ..................................................................................................................... 16
R.4.1 Conversion du guaiacol dans un gaz modèle simple composé de H2 et Ar ............ 16
R.4.2 Conversion du guaiacol dans un gaz modèle composé de CO, CO2, H2O et H2 (et Ar) ................................................................................................................................ 18
R.4.3 Conversion des gaz réels de pyrolyse de lignine ................................................... 21
R.4.4 Intégration des résultats expérimentaux dans un modèle sous Aspen Plus ............. 23
R.5 Conclusion et perspectives .......................................................................................... 24
Chapter 1. Introduction and context of the study ............................................................. 29
1.1 The lignocellulosic biorefinery .................................................................................... 29
1.2 Lignin ......................................................................................................................... 30
1.3 Uses of lignin and potential new valorization strategies ............................................... 33
1.3.1 Current uses of lignin ............................................................................................ 33
1.3.2 Potential lignin valorization strategies ................................................................... 33
1.4 Aromatic hydrocarbons. Uses and other sources .......................................................... 34
1.4.1 Uses and markets of BTX and phenols .................................................................. 34
1.4.2 Conventional sources of BTX and phenol ............................................................. 34
1.4.3 Other bio-based sources of BTX ........................................................................... 34
1.5 Processes for the conversion of lignin to phenol and aromatic hydrocarbons ............... 34
1.6 Catalyst for HDO of lignin pyrolysis vapors under pyrolysis conditions ...................... 38
1.6.1 Catalysis under fast pyrolysis conditions in the presence of H2 using model molecules ...................................................................................................................... 38
1.6.2 Transition metals for wood pyrolysis vapors upgrading without H2 ....................... 39
1.7 Brief description of the following chapters .................................................................. 40
Chapter 2. Gas-phase hydrodeoxygenation of guaiacol over Fe/SiO2 catalyst ................. 41
2.1 Material and method.................................................................................................... 41
2.1.1. Thermodynamic analysis ..................................................................................... 41
2.1.2. Experimental ....................................................................................................... 41

6
2.1.3. Definitions ........................................................................................................... 44
2.2. Results ....................................................................................................................... 44
2.2.1. Thermodynamic analysis of the reactive system ................................................... 44
2.2.2. Blank tests, reproducibility and mass transfer limitations ..................................... 45
2.2.3. Evolution of the reaction as a function of time on stream ..................................... 46
2.2.4. Catalyst characterization ...................................................................................... 47
2.2.5. Catalytic activity .................................................................................................. 50
2.3. Discussion .................................................................................................................. 54
2.4. Conclusion of Chapter 2 ............................................................................................. 58
Chapter 3 Gas-phase hydrodeoxygenation of guaiacol over iron-based catalysts. Effect of gases composition, iron load and supports (silica and activated carbon) ..................... 59
3.1. Experimental .............................................................................................................. 59
3.1.1. Catalyst preparation ............................................................................................. 59
3.1.2. Catalytic runs ....................................................................................................... 60
3.1.3. Characterization of the fresh passivated and spent catalysts.................................. 60
3.1.4. Evaluation of catalytic runs .................................................................................. 61
3.2. Results ....................................................................................................................... 62
3.2.1. Characterization of fresh passivated catalysts ....................................................... 62
3.2.2. Hydrogenation of CO and CO2 without guaiacol .................................................. 66
3.2.3. Individual effect of CH4, H2O, CO2 and CO on guaiacol HDO and used catalysts composition ................................................................................................................... 67
3.2.4. Effect of catalyst type (iron load and support) on guaiacol HDO in the presence of a model lignin pyrolysis gases ....................................................................................... 71
3.2.5. High HDO conversion experiments ...................................................................... 72
3.3. Discussion .................................................................................................................. 73
3.3.1. Reaction mechanisms........................................................................................... 73
3.3.2. Effect of gases ..................................................................................................... 74
3.3.3. Effect of support .................................................................................................. 75
3.3.4. High HDO conversion reactions .......................................................................... 76
3.4 Conclusion of Chapter 3 .............................................................................................. 76
Chapter 4. Aromatics hydrocarbons and phenols from direct hydrotreatment of lignin vapors before condensation on Fe/silica and Fe/Activated Carbon catalyst. ................... 79
4.1 Experimental ............................................................................................................... 79
4.2 Results ........................................................................................................................ 81
7
4.2.1 Improvement of the quality of lignin pyrolysis bio-oils ......................................... 81
4.2.2 Deactivation of catalyst ......................................................................................... 85
4.3 Conclusion of Chapter 4 .............................................................................................. 88
Chapter 5. Lignin to green aromatics by pyrolysis vapors Hydro-de-Oxygenation over iron-based catalysts: experiments on guaiacol HDO, kinetics and modeling of the integrated process ............................................................................................................... 89
5.1. Experimental. ............................................................................................................. 89
5.2. Definition of ASPEN Plus modeling .......................................................................... 89
5.2.1. Definition of components lignin, char, lignin-oligomer and “PYROLOST”. ........ 90
5.2.2. Lignin pyrolysis input .......................................................................................... 90
5.2.3. Simulation set up ................................................................................................. 92
5.2.4. Operating blocks and flow-sheet .......................................................................... 92
5.3. Results ....................................................................................................................... 93
5.3.1. Pathway and kinetics of guaiacol HDO over Fe/SiO2 catalyst .............................. 93
5.3.2. Catalyst deactivation ............................................................................................ 96
5.3.3. Simulation of lignin to BTX process under Aspen Plus ........................................ 97
5.3.4. Influence of fluidization gas flow rate on the whole process ................................. 99
5.4. Conclusion of Chapter 5 ........................................................................................... 100
Perspectives....................................................................................................................... 101
References ......................................................................................................................... 103
Annex 1. Determination of the modified Thiele modulus to assess mass transfers by internal diffusion. ............................................................................................................. 108
Annex 2. Details of XRD and carbon balance of Chapter 2. ........................................... 110
Annex 3. Numerical example of the calculation of coke yield. ........................................ 112
Annex 4 .Fittings and discussion on Mössbauer spectra of Chapter 3 ........................... 114
Annex 5. Regeneration of Fe/Silica catalyst..................................................................... 116
Annex 6. Calibration of the GC*GC-FID heart-cutting method for selected compounds and use of predictive method. .......................................................................................... 123
Annex 7. All data used for kinetic modeling of guaiacol HDO in model gas .................. 132
Annex 8. Description of ASPEN model and results ......................................................... 134
Annex 9. DRIFTS study on the adsorption of guaiacol on Fe/Silica catalyst ................. 136

8

9
Résumé de la thèse
Nota : Ce résumé présente brièvement le contexte de cette étude, la bibliographie, les principaux résultats et les perspectives.
R.1.Contexte de cette thèse Cette thèse se place dans le contexte des bio-raffineries. Notre besoin croissant en
carburants et molécules chimiques se confronte à la raréfaction des ressources fossiles et à l’augmentation de l’effet de serre. Les produits pétroliers représentent la principale source de carburants et produits chimiques pour encore quelques décennies. Néanmoins, des solutions plus durables, qui rejettent moins de CO2 d’origine fossile, et plus socialement équitables, doivent être développées.
La biomasse ligno-cellulosique (bois, déchets agricoles, etc...) est la source de carbone renouvelable au plus fort potentiel. Elle représente un potentiel mobilisable de 2230Mtep/an (tonne équivalent pétrole, sans risque de déforestation) soit plus de 65% des 3365Mtep d’énergies renouvelables potentielles. La biomasse pourrait donc répondre à 22% de nos besoins énergétiques mondiaux actuels (d’après les hypothèses de Dessus et al. [1] en accord avec Parikka et al. [2]).
Les bio-raffineries ont pour objectif de valoriser de manière optimale la biomasse. La figure R.1 présente un schéma simplifié d’une bio-raffinerie ainsi que le cadre de ce travail.
Figure R.1. Schéma simplifié d’une bio-raffinerie présentant le cadre de ce travail : la valorisation des lignines en composés aromatiques (benzène, phénols, etc.).
Les parois cellulaires des biomasses ligno-cellulosiques sont constituées d’un réseau complexe de cellulose, lignine, hémicelluloses (xylane ou mannane) et de minéraux. On peut
10
convertir la biomasse dans son ensemble, par exemple par gazéification ou pyrolyse, ou bien la convertir après fractionnement de ses polymères. La première étape d’une bio-raffinerie peut être le fractionnement des polymères de la biomasse par les procédés de type Kraft, organosolv, etc [3].
La valorisation des celluloses et des hémicelluloses fait déjà l’objet de nombreuses recherches [4–7].
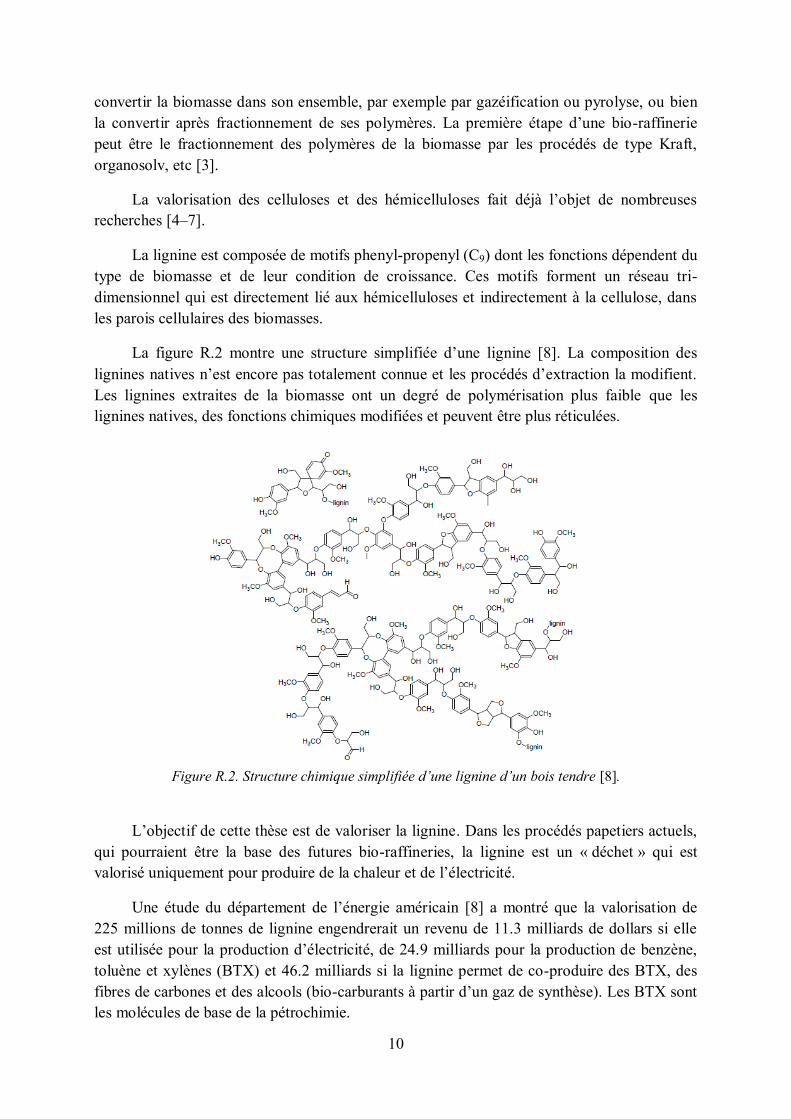
La lignine est composée de motifs phenyl-propenyl (C9) dont les fonctions dépendent du type de biomasse et de leur condition de croissance. Ces motifs forment un réseau tri-dimensionnel qui est directement lié aux hémicelluloses et indirectement à la cellulose, dans les parois cellulaires des biomasses.
La figure R.2 montre une structure simplifiée d’une lignine [8]. La composition des lignines natives n’est encore pas totalement connue et les procédés d’extraction la modifient. Les lignines extraites de la biomasse ont un degré de polymérisation plus faible que les lignines natives, des fonctions chimiques modifiées et peuvent être plus réticulées.
Figure R.2. Structure chimique simplifiée d’une lignine d’un bois tendre [8].
L’objectif de cette thèse est de valoriser la lignine. Dans les procédés papetiers actuels, qui pourraient être la base des futures bio-raffineries, la lignine est un « déchet » qui est valorisé uniquement pour produire de la chaleur et de l’électricité.
Une étude du département de l’énergie américain [8] a montré que la valorisation de 225 millions de tonnes de lignine engendrerait un revenu de 11.3 milliards de dollars si elle est utilisée pour la production d’électricité, de 24.9 milliards pour la production de benzène, toluène et xylènes (BTX) et 46.2 milliards si la lignine permet de co-produire des BTX, des fibres de carbones et des alcools (bio-carburants à partir d’un gaz de synthèse). Les BTX sont les molécules de base de la pétrochimie.

11
C’est pourquoi nous avons orienté cette thèse sur la production de BTX par conversion de la lignine. Ce sujet représente de notre point de vue un enjeu important pour les bio-raffineries. La figure R.3 présente le diagramme de Van Krevelen de la conversion de la lignine par pyrolyse puis hydrotraitement des bio-huiles de pyrolyse. Notre objectif est d’hydro-désoxygéner (HDO) sélectivement les vapeurs de pyrolyse de la lignine en BTX.
Figure R.3. Diagramme de Van Krevelen représentant la lignine, les bio-huiles de pyrolyse et le
traitement recherché pour produire des BTX (Benzène, Toluène, Xylènes). On recherche une HDO sélective des vapeurs de pyrolyse de lignine.
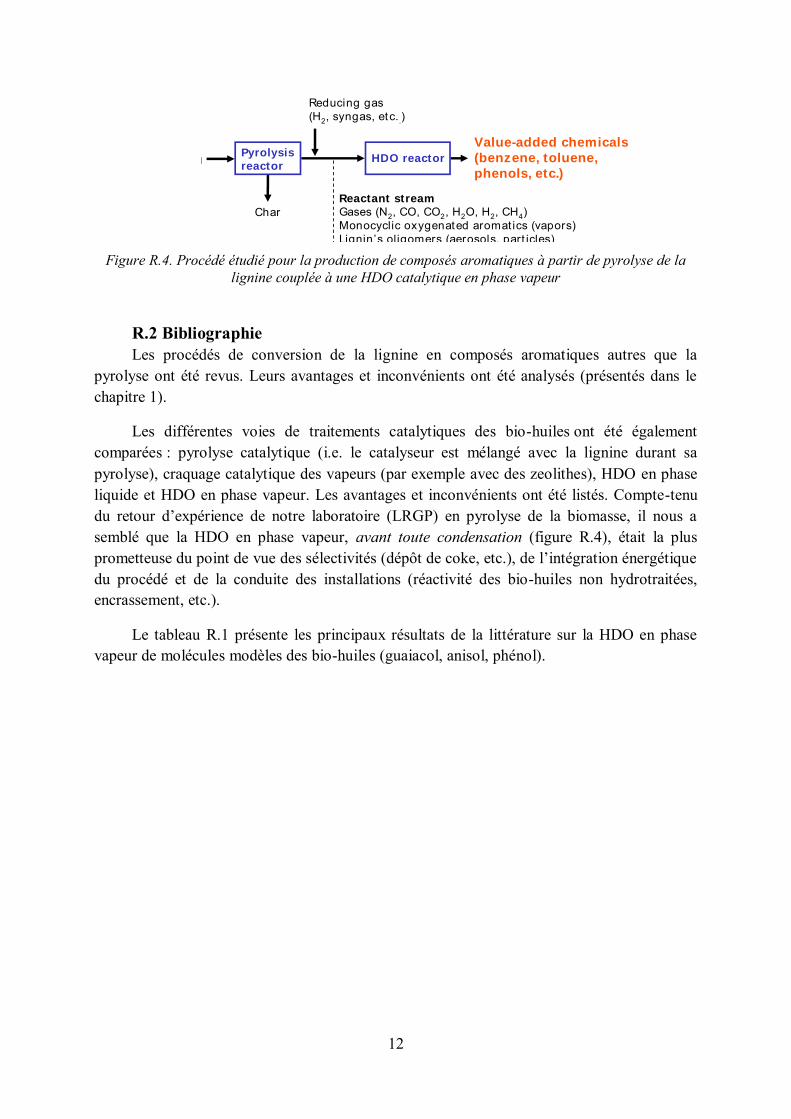
La figure R.4 présente de manière simplifiée le procédé étudié : il couple un réacteur de pyrolyse de la lignine à un réacteur d’hydrodésoxygénation (HDO) en phase vapeur. En effet, les bio-huiles de pyrolyse de la lignine sont composées de noyaux aromatiques avec de nombreuses fonctions oxygénées (principalement hydroxyl et méthoxy). Ces bio-huiles sont très réactives et donc difficiles à revaporiser ou à injecter dans un réacteur même en phase liquide. C’est pourquoi nous pensons qu’un traitement direct de ces bio-huiles en phase vapeur, avant leur condensation, serait plus avantageux pour le développement de leur HDO et de leur valorisation. Le mélange en sortie du réacteur catalytique de HDO sera composé de BTX et d’autres aromatiques moins oxygénés que les bio-huiles. Il sera condensé et devra être distillable.
0
0.1
0.2
0.3
0.4
0.5
0.4 0.9 1.4 1.9 2.4
H/C
O/C
Lignins
Pyrolytic
oil
Cyclo-
hexanol
AlkanesBTX
O
OH
OH
O
O
OH
OH
LigninO
CH3
O
Lignin
O
O
CH3
O
OH
Lignin
CH3
CH3
OOH
CH3
CH3 CH3
CH3
CH3CH3
Desired
route
Undesired
route
Pyrolysis
Guaiacol
12
Figure R.4. Procédé étudié pour la production de composés aromatiques à partir de pyrolyse de la
lignine couplée à une HDO catalytique en phase vapeur
R.2 Bibliographie Les procédés de conversion de la lignine en composés aromatiques autres que la
pyrolyse ont été revus. Leurs avantages et inconvénients ont été analysés (présentés dans le chapitre 1).
Les différentes voies de traitements catalytiques des bio-huiles ont été également comparées : pyrolyse catalytique (i.e. le catalyseur est mélangé avec la lignine durant sa pyrolyse), craquage catalytique des vapeurs (par exemple avec des zeolithes), HDO en phase liquide et HDO en phase vapeur. Les avantages et inconvénients ont été listés. Compte-tenu du retour d’expérience de notre laboratoire (LRGP) en pyrolyse de la biomasse, il nous a semblé que la HDO en phase vapeur, avant toute condensation (figure R.4), était la plus prometteuse du point de vue des sélectivités (dépôt de coke, etc.), de l’intégration énergétique du procédé et de la conduite des installations (réactivité des bio-huiles non hydrotraitées, encrassement, etc.).
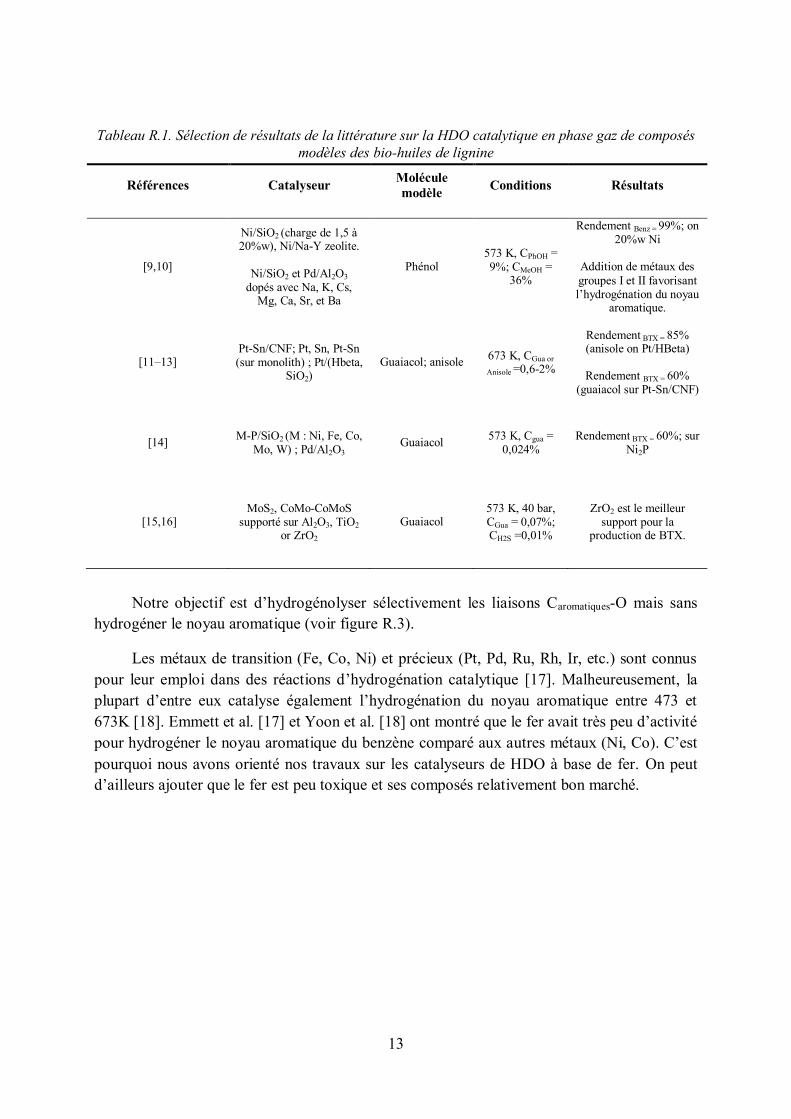
Le tableau R.1 présente les principaux résultats de la littérature sur la HDO en phase vapeur de molécules modèles des bio-huiles (guaiacol, anisol, phénol).
Reactant stream
Gases (N2, CO, CO2, H2O, H2, CH4)Monocyclic oxygenated aromat ics (vapors)Lignin’s oligomers (aerosols, part icles)
Reducing gas (H2, syngas, etc..)
Lignin
Char
Pyrolysis
reactorHDO reactor
Value-added chemicals
(benzene, toluene,
phenols, etc.)
13
Tableau R.1. Sélection de résultats de la littérature sur la HDO catalytique en phase gaz de composés modèles des bio-huiles de lignine
Références Catalyseur Molécule modèle Conditions Résultats
[9,10]
Ni/SiO2 (charge de 1,5 à 20%w), Ni/Na-Y zeolite.
Ni/SiO2 et Pd/Al2O3 dopés avec Na, K, Cs,
Mg, Ca, Sr, et Ba
Phénol 573 K, CPhOH = 9%; CMeOH =
36%
Rendement Benz = 99%; on 20%w Ni
Addition de métaux des groupes I et II favorisant l’hydrogénation du noyau
aromatique.
[11–13] Pt-Sn/CNF; Pt, Sn, Pt-Sn (sur monolith) ; Pt/(Hbeta,
SiO2) Guaiacol; anisole 673 K, CGua or
Anisole =0,6-2%
Rendement BTX = 85% (anisole on Pt/HBeta)
Rendement BTX = 60% (guaiacol sur Pt-Sn/CNF)
[14] M-P/SiO2 (M : Ni, Fe, Co, Mo, W) ; Pd/Al2O3
Guaiacol 573 K, Cgua = 0,024%
Rendement BTX = 60%; sur Ni2P
[15,16] MoS2, CoMo-CoMoS
supporté sur Al2O3, TiO2 or ZrO2
Guaiacol 573 K, 40 bar, CGua = 0,07%; CH2S =0,01%
ZrO2 est le meilleur support pour la
production de BTX.
Notre objectif est d’hydrogénolyser sélectivement les liaisons Caromatiques-O mais sans hydrogéner le noyau aromatique (voir figure R.3).
Les métaux de transition (Fe, Co, Ni) et précieux (Pt, Pd, Ru, Rh, Ir, etc.) sont connus pour leur emploi dans des réactions d’hydrogénation catalytique [17]. Malheureusement, la plupart d’entre eux catalyse également l’hydrogénation du noyau aromatique entre 473 et 673K [18]. Emmett et al. [17] et Yoon et al. [18] ont montré que le fer avait très peu d’activité pour hydrogéner le noyau aromatique du benzène comparé aux autres métaux (Ni, Co). C’est pourquoi nous avons orienté nos travaux sur les catalyseurs de HDO à base de fer. On peut d’ailleurs ajouter que le fer est peu toxique et ses composés relativement bon marché.

14
R.3 Matériels et méthodes Un catalyseur à base de fer a été préparé selon la méthode présentée dans la figure R.5.
Figure R.5. Méthode de préparation, réduction sous H2 (in-situ, avant la réaction de HDO),
passivation et refroidissement avant analyses des catalyseurs
Les essais de conversion du guaiacol ont été menés dans un lit fixe traversé présenté sur la figure R.6. La mise au point de ce banc d’essais a constitué une étape importante de cette thèse.
Le guaiacol a été choisi comme molécule modèle des bio-huiles de lignine car il possède les fonctions chimiques clef (hydroxyl et méthoxy) et sa composition élémentaire est proche de celle du mélange complexe des bio-huiles (voir figure R.3).
Figure R.6. Installation de conversion du guaiacol (molécule modèle) en lit fixe traversé
L’installation permet de modifier la composition du gaz (apport de H2O, CO, CO2, H2, etc.). Le débit de guaiacol est contrôlé par un pousse-seringue et le guaiacol est vaporisé au
2 impingerswith propanol
(-60°C)
T
Vent
µGCOn-line analysis
(CH4, H2, CO, etc.)To GC-FID-MSIntegral off-line analysis Guaiacol, phenols, BTX, etc.
Heated lines
Catalyst bed
Syringe pump
Oven
Fritted
Mass Flow
Controllers
H2
N2
CO
CH4
4 ways valve

15
dessus du lit catalytique. En sortie du lit catalytique, les condensables sont analysés en ligne par une boucle chauffée (non représentée sur la figure R.6) couplée à un GC-FID (gas chromatography-flame ionisation detector) et par des barboteurs (puis injection liquide sur un GC-FID/MS). Les composés en phase gaz après les barboteurs (du H2 au C7) sont analysés par un µGC 4 voies en ligne. Nous n’avons jamais détecté de composés C6+ avec la µGC en sortie des barboteurs confirmant leur efficacité.
Une autre installation a été utilisée pour la HDO de vapeurs réelles de lignine (figure R.7). Un réacteur de pyrolyse de type « cuillère » (donc fermé pour le solide) est couplé à un lit fixe. Les vapeurs sont produites dans le premier four et injectées sur le lit catalytique placé dans un second four. Les goudrons sont analysés après condensation dans des barboteurs par GC*GC (heart cutting)/MS-FID. Plus de 170 composés ont été identifiés grâce à cette méthode. Pour plus de détails sur la méthode analytique et les composés analysés, voir l’annexe 6.
Figure R.7. Installation couplant un réacteur de pyrolyse (batch pour la lignine) à un lit fixe
catalytique pour le traitement de vapeur réelle de lignine
Les catalyseurs usagés ou non (passivés car le fer réduit est pyrophorique, voir figure R.5) sont analysés par XRD, Mössbauer (Institut Jean Lamour, Pr. Malaman, Nancy), SEM et TEM (Faculté des Sciences, Dr. Ghanbaja, Nancy). Les spectres Mössbauer ont été fittés pour quantifier les phases du fer en fonction du mélange gazeux traités (voir annexe 2 et annexe 4).
La température programmée d’oxydation (TPO) et la sorption de N2 sont réalisées au LRGP. Aucuns résultats de TPO ne sont présentés dans ce résumé bien qu’ils soient intéressants (voir chapitres 2, 3 et 4). La TPO a permis d’identifier différents types de cokes déposés, notamment lors du traitement des gaz réels (chapitre 4).

16
R.4 Résultats
R.4.1 Conversion du guaiacol dans un gaz modèle simple composé de H2 et Ar L’effet de la température et de la pression partielle de H2 a été étudié (voir le chapitre
2). Seul l’effet du temps de contact (1/WHSV = g catalyseur / (g guaiacol / h)) est présenté.
R.4.1.1 Effet du temps de contact sur les produits formés
Figure R.8. Effet du temps de contact (en heure : 1/Weight Hourly Space Velocity = g catalyseur / (g
guaiacol /h)) sur a) les fractions molaires du guaiacol et des produits majoritaires et de la HDO (conversion des liaisons Caromatique-O), b) les fractions molaires des produits minoritaires (Fe/SiO2;
673 K; pH2 = 0.9 bar).
Les principaux produits formés par la HDO du guaiacol sur le catalyseur Fe/SiO2 (15% massique de fer) sont le phénol et le méthane puis le benzène et le CO. L’effet du temps de contact montre que les phénol et crésols passent par un maximum puis ils sont consommés. Benzène, toluène et CO augmentent avec le temps de contact.
R.4.1.2 Mécanismes de conversion du guaiacol sur Fe/SiO2 et Co/Kieselguhr Les principales réactions impliquées dans la HDO du guaiacol sur le Fe/SiO2 (et
Co/Kieselguhr) sont présentées sur la figure R.9.
Figure R.9. Schéma simplifié des réactions de HDO du guaiacol sur Fe/SiO2 et Co/Kieselguhr
0
20
40
60
80
100
0.0
0.2
0.4
0.6
0.8
0 0.5 1 1.5
XH
DO
(%)
% v
ol
1/WHSV (gcat/(gGuaiacol/h))
Guaiacol
Phenol
Methane
X HDO a)
0.0
0.1
0.2
0.3
0 0.5 1 1.5%
vo
l
1/WHSV (gcat/(gGuaiacol/h))
Benzene
Toluene
Anisole
CO
Cresols
b)
+H2
OH
OCH3
OH
Phenol +H2
BT +nH2 Ring
hydrogenated
+nH2
Methanol
CO, PAH, coke
CH3
Only for Cobalt catalyst
Alkanes, CH4 Guaiacol
CH4
-H2O
Desired products
+H2
-H2O
% m
ol
% m
ol

17
Le fer est sélectif pour la production de BTX car il ne catalyse pas l’hydrogénation du noyau aromatique contrairement au cobalt. Un système de huit réactions avec la détermination de leur vitesse a été défini (non présenté ici, voir chapitre 5). Le système réactionnel modélisé (avec le solveur Excel) permet de bien représenter l’évolution des espèces en fonction du temps de contact.
Le mécanisme catalytique est proposé suite à l’étude de Popov et al. [19] sur l’adsorption du guaiacol sur SiO2 (figure R.10).
Deux modes d’adsorption sont possibles pour le guaiacol sur les groupements silanols du SiO2, l’un conduisant à la formation de phénol (mode I, fig. R.10) et l’autre à l’anisole (mode II, fig R.10). Le mode I semble prioritaire dans notre cas (Figure R.8a). Le H2 est dissocié sur le fer et les atomes d’hydrogène sont transférés par spill-over aux molécules.
Figure R.10. Mécanisme de HDO du guaiacol sur Fe/SiO2, modes d’adsorption selon Popov et al.
[19].
Des analyses TEM (figure R.11) ont montré que le coke est principalement déposé à l’interface des particules de fer et de silice ce qui corrobore le mécanisme proposé dans la figure R.10. Le coke proviendrait d’une trop forte adsorption des espèces oxygénés (type phénols, catéchols, etc.) et à une rapide réticulation de ces espèces.
OH
OCH3
Si O Si O Si O Si
O
H
Fe Si O Si O Si O Si
O
H
CH3 O
OH
H HSpill-over
I) II)H2 (gas)
OH
OCH3
Si O Si O Si O Si
O
H
Fe Si O Si O Si O Si
O
H
CH3 O
OH
H HSpill-over
I) II)
OH
OCH3
Si O Si O Si O Si
O
H
Fe Si O Si O Si O Si
O
H
CH3 O
OH
H HSpill-over
I) II)H2 (gas)

18
Figure R.11. Analyse TEM du catalyseur coké (guaiacol + H2)
La formation de coke est inhérente à cette réaction de HDO [20]. Il semble très difficile de la supprimer mais nos sélectivités (présentées par la suite) montrent que notre catalyseur réduit fortement le dépôt de coke.
R.4.2 Conversion du guaiacol dans un gaz modèle composé de CO, CO2, H2O et H2 (et Ar)
R.4.2.1 Effet de la composition du gaz L’effet de la composition du gaz sur les sélectivités et le vieillissement du catalyseur ont
été étudié. La figure R.12 montre les signatures diffractométriques et Mossbauer des catalyseurs à l’issue des réactions de conversion dans différents mélanges de gaz.

19
Figure R.12. Analyses XRD et 57Fe Mossbauer (à 300K) de : a) 10%Fe/AC; b) 15%Fe/SiO2 non
usagés ; c) 15%Fe/SiO2 usagé avec Guaiacol +H2+CO2+CO+H2O ; d) 10%Fe/SiO2 avec Guaiacol+H2+CO; e) 10%Fe/SiO2 avec Gua+H2+CO. La ligne en pointillés représente les espèces
Fe3+.
-Fe est la principale espèce de fer sur les catalyseurs réduits, non usagés puis passivés. La présence de Fe3O4 peut provenir de la passivation et du stockage à l’air ambiant (humide). L’apport de CO dans le mélange réactionnel forme du Fe5C2. La désactivation du catalyseur avec le mélange guaiacol+H2+CO2+CO+H2O provient d’une oxydation du fer, du dépôt de coke et de la formation de carbure. Notre catalyseur reste néanmoins actif et sélectif durant 3 heures de traitement de ce mélange complexe. Des essais de plus longues durées sur un gaz réel sont encore nécessaires.

20
Des particules de magnétite super-paramagnétiques ont été mises en évidence par la spectroscopie Mössbauer. Les spectres Mössbauer ont été fittés (Pr. Malaman) permettant une quantification de chaque phase (non présentée, voir annexe 4).
R.4.2.2 Effet de la fraction massique de fer imprégné sur la silice et du support (silice et charbon actif)
La figure R.13 montre que la charge en fer (de 5 à 15% massique) a peu d’effet sur la sélectivité des produits, par contre le support (silice ou charbon actif) a un important effet. Le catalyseur Fe/charbon actif produit principalement des phénols (aromatiques avec une ou deux fonctions hydroxyl) et très peu de BT. Cet effet peut être dû aux fonctions de surface du charbon qui possèdent une affinité différente des silanols (acides de Bronsted) de la silice.
Figure R.13. Effet du catalyseur sur les rendements en produits (T=673K, P=1 atm, 50%vol. H2, 5%
CO2, 2% CO, 2% H2O, 1% Guaiacol, Argon Q.S.)
R.4.2.3 Comparaison avec la littérature La figure R.14 compare la sélectivité en BT observée à celle des principaux résultats de
la littérature. La représentation sous la forme de rendement carbone de Benzène + Toluène en fonction de la HDO (conversion des liaisons Caromatique-O) semble très intéressante pour comparer les performances des catalyseurs. Le catalyseur le plus « sélectif » serait le Ni2P/SiO2 à ce niveau de conversion de HDO. Le catalyseur employé dans cette étude est moins actif que ceux de la littérature : il nécessite un plus grand temps de contact, mais il est très sélectif. Par ailleurs, un plus grand temps de contact n’est pas rédhibitoire avec notre catalyseur à base de fer beaucoup moins cher et toxique que ceux présentés dans la figure R.14.
0
20
40
60
80
100
5%Fe/silica 10%Fe/silica 15%Fe/silica 10%Fe/AC
Gases+coke
Anisole
Catechol
Cresol
PhOH
BT
Yie
ld (
%m
ol)

21
Figure R.14. Comparaison avec les résultats de la littérature sur la HDO du guaiacol. Rendement
carbone en Benzène + toluène représenté en fonction de la conversion HDO (conversion des liaisons Caromatique-O) CNF: carbon nano fiber. Références : a :Chapitre 2 ; b :[21] ; c :[11] ; d : [14] ; e :
chapitre 3.
R.4.3 Conversion des gaz réels de pyrolyse de lignine La conversion des vapeurs réelles de pyrolyse de lignine a été étudiée pour deux types
de catalyseurs (15% massique Fe/SiO2 et 10% massique Fe/AC) et pour deux masses de 15%Fe/SiO2 (2 et 4 g). On a toujours injecté 2 g de lignine en 4 injections de 0.5g dans le four de pyrolyse. Des couches séparées de catalyseurs ont été réalisées pour étudier le profil de dépôt de cokes (non présenté, voir chapitre 4).
La figure R.15 montre l’effet des catalyseurs sur la couleur des bio-huiles collectées dans les barboteurs de méthanol après la première injection de lignine (0.5g de lignine pyrolysée).
Figure R.15. Clichés photographiques des bio-huiles de pyrolyse de lignine dissoutes dans 15mL de
méthanol : a) sans catalyseur, b) 2g de 15%Fe/SiO2, c) 4g de 15%Fe/SiO2, d) 2g of 10%Fe/AC
0
25
50
75
100
0 20 40 60 80 100
X HDO (%)
B+T
C yield (%)
17% Fe/SiO2 02%Co/Kies Pt/C 637K Pt-Sn/CNF 673K Ni2P/SiO2 15%Fe/SiO2
17%Fe/SiO 2 673K; 1,5h [ref. a]
20%Co/SiO 2 673K; 0,8h [ref. a]
1%Pt/AC 623K; 0;54h [ref. b]
8%Pt-8%Sn/CNF 673K; 3,2h [ref. c] 8,6%Ni 2 P/SiO 2 573K; 20,2h
15%Fe/SiO 2 673K; 7,5h [ref. e]
[ref. d]
22
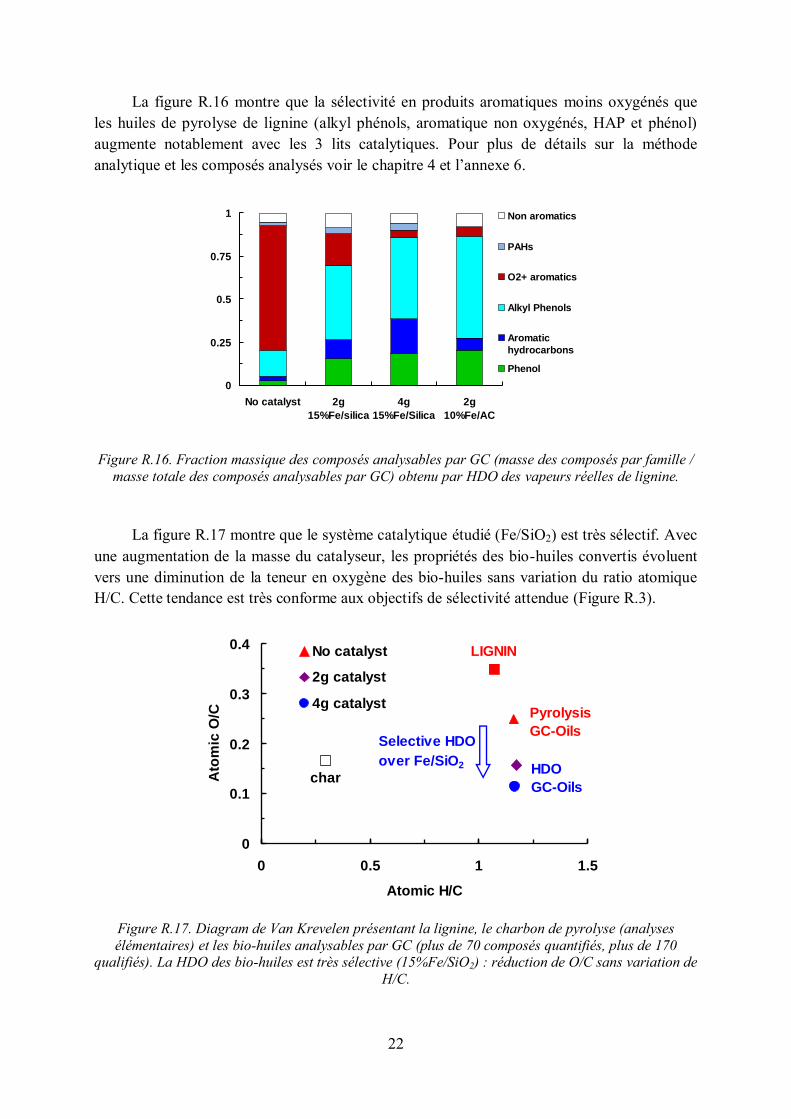
La figure R.16 montre que la sélectivité en produits aromatiques moins oxygénés que les huiles de pyrolyse de lignine (alkyl phénols, aromatique non oxygénés, HAP et phénol) augmente notablement avec les 3 lits catalytiques. Pour plus de détails sur la méthode analytique et les composés analysés voir le chapitre 4 et l’annexe 6.
Figure R.16. Fraction massique des composés analysables par GC (masse des composés par famille /
masse totale des composés analysables par GC) obtenu par HDO des vapeurs réelles de lignine.
La figure R.17 montre que le système catalytique étudié (Fe/SiO2) est très sélectif. Avec une augmentation de la masse du catalyseur, les propriétés des bio-huiles convertis évoluent vers une diminution de la teneur en oxygène des bio-huiles sans variation du ratio atomique H/C. Cette tendance est très conforme aux objectifs de sélectivité attendue (Figure R.3).
Figure R.17. Diagram de Van Krevelen présentant la lignine, le charbon de pyrolyse (analyses élémentaires) et les bio-huiles analysables par GC (plus de 70 composés quantifiés, plus de 170
qualifiés). La HDO des bio-huiles est très sélective (15%Fe/SiO2) : réduction de O/C sans variation de H/C.
0
0.25
0.5
0.75
1
No catalyst 2g
15%Fe/silica
4g
15%Fe/Silica
2g
10%Fe/AC
Non aromatics
PAHs
O2+ aromatics
Alkyl Phenols
Aromatic
hydrocarbons
Phenol
0
0.1
0.2
0.3
0.4
0 0.5 1 1.5
Atomic H/C
Ato
mic
O/C
No catalyst
2g catalyst
4g catalyst
char
LIGNIN
Pyrolysis
GC-Oils
HDO
GC-Oils
Selective HDO
over Fe/SiO2

23
R.4.4 Intégration des résultats expérimentaux dans un modèle sous Aspen Plus Les résultats expérimentaux obtenus lors de la conversion du guaiacol dans un mélange
complexe ont été intégrés dans un modèle de procédé sous Aspen Plus (figure R.18).
Il nous semble encore trop complexe d’intégrer les résultats des gaz réels de lignine avec un modèle cinétique ou même des corrélations compte-tenu de la complexité des mélanges (plus de 170 composés identifiés uniquement en GC) et des lois cinétiques. Des méthodes avancées de lumping thermodynamique et cinétique doivent être utilisées pour intégrer la complexité des bio-huiles réelles sous Aspen Plus.
Figure R.18. Hypothèses simplificatrices pour la modélisation sous Aspen Plus du procédé intégrant
la pyrolyse de la lignine, le réacteur catalytique de HDO et la récupération des aromatiques en phase vapeur par lavage.
Les détails de la modélisation ainsi que les différents résultats sont consultables dans le chapitre 5 de ce document. Toutefois, nous nous proposons de présenter dans ce paragraphe le bilan matière global du procédé ainsi modélisé (figure R.19)
Figure R.19. Bilan matière de la production d’aromatiques par pyrolyse de lignine et HDO en phase vapeur (500kg/h de lignine, 650kg de catalyseur, 7200kg/h de N2 pour la fluidisation du lit fluidisé de
pyrolyse)
Catalytic
reactor
Wash oil
Clean gasAbsorption
column
Aromatic molecules
(dissolved in wash oil, to be distilled)
Condensed water
673 K
303 K
Cooling
Lignin Pyrolysis
reaction
N2 at 298KFluidization gas
Char, oligomers, lost in pyrolysis
H2
Heat of pyrolysis
Extra heat for pyrolysis
673 K
Heat of catalytic reactions
H2 17 kg/h
Coke (catalyst)8,8 kg/h
Char150 kg/h
Oligomers60 kg/h
Pyrolysis Loss76,2 kg/h
Gases152 kg/h
Condensed 70kg/hHDO
(Catalyticreactor)
Pyrolysis(fluidized
bed reactor)
Lignin
500kg/h
Recovery(absorber)

24
Le procédé ainsi modélisé montre que 500kg/h de lignine traitée conduit à la production de 70kg/h de produits condensés, composés respectivement de 17.8 et 4.3 kg/h de benzène et toluène. Les composés condensés ne représentent que 8% de la teneur en carbone initiale de la lignine. Les « pertes » en carbone sont dues au charbon de pyrolyse et aux oligomères supposés non convertis par le catalyseur. Pour un développement économique de la filière « lignin to BTX » par pyrolyse, il faudra envisager une co-valorisation du carbone solide (fibres de carbone, charbon actif, etc.) et du gaz de synthèse (électricité, carburant liquide) comme proposé par l’étude du DOE [8].
Par ailleurs, il faudra également optimiser l’étape de pyrolyse (ou de « liquéfaction »). Le modèle Aspen Plus a montré l’importance de l’effet de dilution du gaz de fluidisation si un lit fluidisé est utilisé pour la pyrolyse de la lignine (voir chapitre 5). Au LRGP, nous pensons qu’un lit fluidisé n’est pas forcément le mieux adapté à la pyrolyse de lignines [22,23], sauf si son design est spécialement modifié [24].
R.5 Conclusion et perspectives Cette thèse est le fruit d’une riche collaboration entre le LRGP (CNRS-ENSIC), le
SRSMC (Pr. Bettahar, M. Mercy, CNRS-Faculté des Sciences de Nancy) et l’IJL (CNRS-Faculté des Sciences de Nancy).
Nous avons montré :
1. qu’un catalyseur Fe/SiO2, peu cher et peu toxique, est sélectif pour la réaction d’hydrodésoxygénation du guaiacol (molécule modèle des bio-huiles de lignine) en benzène et toluène ;
2. l’effet de la composition du gaz (H2, H2O, CO, CO2) sur la sélectivité et la désactivation du catalyseur ;
3. l’effet de la charge en fer (5, 10, 15%mas.) sur la silice et du support (SiO2 et charbon actif) sur la sélectivité et la désactivation des catalyseurs ;
4. que ces catalyseurs à base de fer sont également très sélectifs pour la HDO de vapeurs réelles de pyrolyse de lignine ;
5. que le bilan carbone de l’ensemble du procédé (pyrolyse > HDO > récupération des BTX, modèle sous Aspen Plus) demande encore à être optimisé.
Les principales perspectives de recherche sont :
1. préciser la désactivation du catalyseur sur des gaz réels et sa régénération, des premiers essais intéressants de régénération sont présentés (annexe 5) ;
2. optimiser la pyrolyse/liquéfaction en continue de la lignine à l’échelle laboratoire (quelques grammes/heure) ;
3. étudier l’effet d’additifs sur la sélectivité et la stabilité du catalyseur à base de fer ;

25
4. étudier le recyclage des espèces actives (fer, additifs) après oxydation du catalyseur désactivé, puis imprégnation dans la lignine (ou la biomasse) pour obtenir un catalyseur phase active / charbon, produit au sein même du procédé.

26

27
Valorization of lignin pyrolysis vapors by iron-catalyzed direct hydrodeoxygenation
Roberto Olcese’s PhD memory
LRGP CNRS-ENSIC, France
2009-2012

28

29
Chapter 1. Introduction and context of the study
1.1 The lignocellulosic biorefinery Lignocellulosic biomass is seen as an interesting resource for green chemicals and fuel
production because it is well-spread worldwide, close to carbon neutral and it does not compete with food production. Near 22% of our current energy needs could be supplied by lignocellulosic biomass without changing our agriculture practice [1,2].
Lignocellulosic biomass is mainly composed by cellulose, lignin and hemicelluloses (Table 1.1). Cellulose is a useful polymer, with a well-developed market. Meanwhile, the conversion of lignin and hemicelluloses into fuel and chemicals is still being developed [8,25] (Figure 1.1).
Figure 1.1. A possible ligno-cellulosic biorefinery (OMACs: oxygenated mono-aromatic compounds)
30
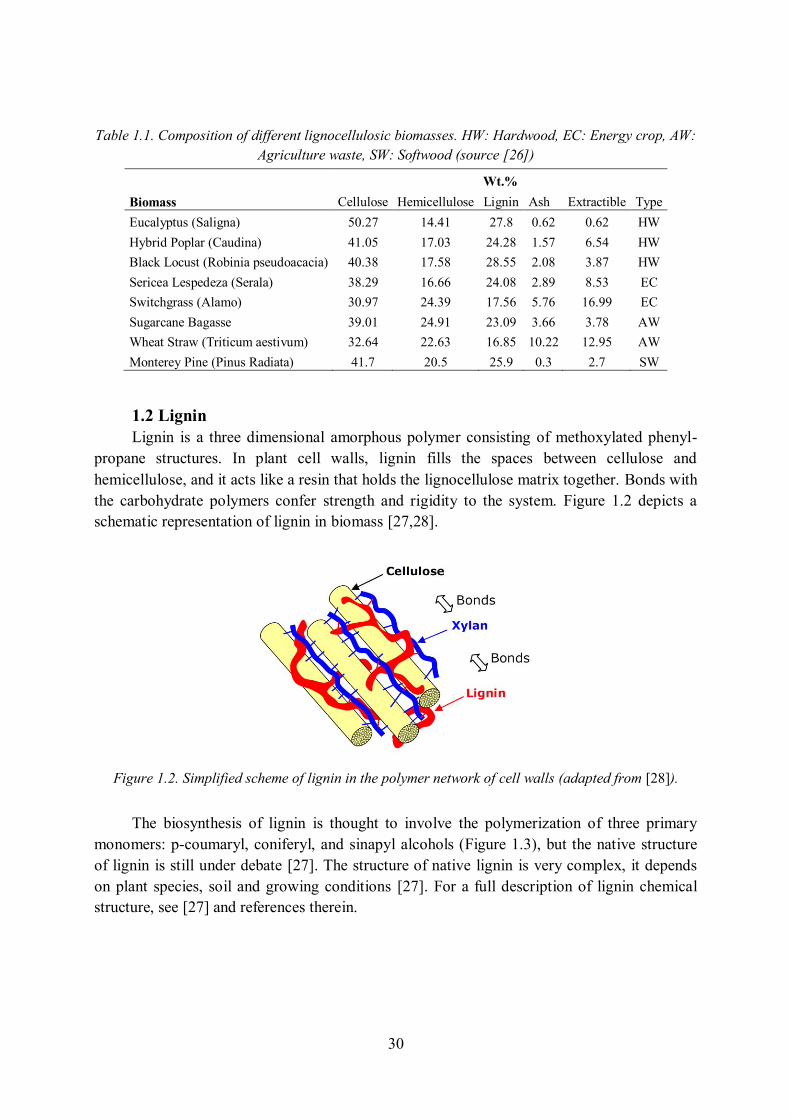
Table 1.1. Composition of different lignocellulosic biomasses. HW: Hardwood, EC: Energy crop, AW: Agriculture waste, SW: Softwood (source [26])
Biomass Wt.%
Cellulose Hemicellulose Lignin Ash Extractible Type Eucalyptus (Saligna) 50.27 14.41 27.8 0.62 0.62 HW Hybrid Poplar (Caudina) 41.05 17.03 24.28 1.57 6.54 HW Black Locust (Robinia pseudoacacia) 40.38 17.58 28.55 2.08 3.87 HW Sericea Lespedeza (Serala) 38.29 16.66 24.08 2.89 8.53 EC Switchgrass (Alamo) 30.97 24.39 17.56 5.76 16.99 EC Sugarcane Bagasse 39.01 24.91 23.09 3.66 3.78 AW Wheat Straw (Triticum aestivum) 32.64 22.63 16.85 10.22 12.95 AW Monterey Pine (Pinus Radiata) 41.7 20.5 25.9 0.3 2.7 SW
1.2 Lignin Lignin is a three dimensional amorphous polymer consisting of methoxylated phenyl-
propane structures. In plant cell walls, lignin fills the spaces between cellulose and hemicellulose, and it acts like a resin that holds the lignocellulose matrix together. Bonds with the carbohydrate polymers confer strength and rigidity to the system. Figure 1.2 depicts a schematic representation of lignin in biomass [27,28].
Figure 1.2. Simplified scheme of lignin in the polymer network of cell walls (adapted from [28]).
The biosynthesis of lignin is thought to involve the polymerization of three primary
monomers: p-coumaryl, coniferyl, and sinapyl alcohols (Figure 1.3), but the native structure of lignin is still under debate [27]. The structure of native lignin is very complex, it depends on plant species, soil and growing conditions [27]. For a full description of lignin chemical structure, see [27] and references therein.

31
OH
OH
OH
OH
OCH3
OH
OH
OCH3
OCH3
p-courmaryl coniferyl sinapyl
Figure 1.3. The building blocks for lignin natural synthesis
The composition of softwood and hardwood lignin varies in the relative abundance of the p-coumaryl, coniferyl, and sinapyl alcohols. Coniferyl alcohols constitute approximately 90% of softwood lignin, whereas roughly equal proportions of coniferyl alcohol and sinapyl alcohol appear in hardwood lignin, although many exceptions are known [27].
Figure 1.4 Proposed structural motifs of softwood lignin [8]
In order to separate lignin from lignocellulosic biomass, many chemical processes exist
(Kraft, soda pulping, Organosolv, steam-explosion, etc…). The separation process also has a big influence on lignin properties (Table 1.2) [8].

32
Table 1.2. Properties of some extracted lignin. Lignin Model chemical structure
Kraft Lignin. The mostly produced lignin. It is industrially obtained as black liquor (liquid). Its average molecular weight is 2000-3000 g/mol, and it contains 1-1.5wt.% of sulfur from the Kraft pulping process [8].
Lignosulfonate. It has many direct applications as cheap surfactant. Its average MW is 20000-50000 g/mol. Its sulfur content is 4-8wt.% [8].
Organosolv Lignin. It is a dry sulfur-free solid with a MW <5000 g/mol [3,8]. Structure from [29].
33
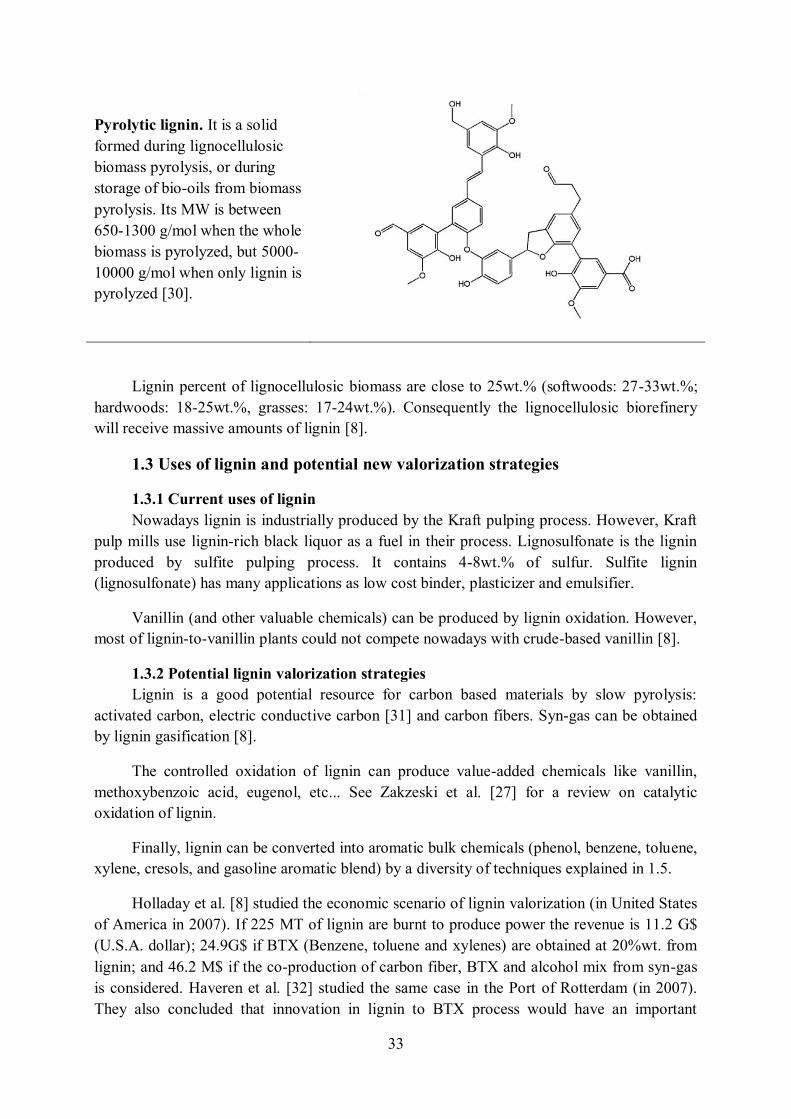
Pyrolytic lignin. It is a solid formed during lignocellulosic biomass pyrolysis, or during storage of bio-oils from biomass pyrolysis. Its MW is between 650-1300 g/mol when the whole biomass is pyrolyzed, but 5000-10000 g/mol when only lignin is pyrolyzed [30].
Lignin percent of lignocellulosic biomass are close to 25wt.% (softwoods: 27-33wt.%; hardwoods: 18-25wt.%, grasses: 17-24wt.%). Consequently the lignocellulosic biorefinery will receive massive amounts of lignin [8].
1.3 Uses of lignin and potential new valorization strategies
1.3.1 Current uses of lignin Nowadays lignin is industrially produced by the Kraft pulping process. However, Kraft
pulp mills use lignin-rich black liquor as a fuel in their process. Lignosulfonate is the lignin produced by sulfite pulping process. It contains 4-8wt.% of sulfur. Sulfite lignin (lignosulfonate) has many applications as low cost binder, plasticizer and emulsifier.
Vanillin (and other valuable chemicals) can be produced by lignin oxidation. However, most of lignin-to-vanillin plants could not compete nowadays with crude-based vanillin [8].
1.3.2 Potential lignin valorization strategies Lignin is a good potential resource for carbon based materials by slow pyrolysis:
activated carbon, electric conductive carbon [31] and carbon fibers. Syn-gas can be obtained by lignin gasification [8].
The controlled oxidation of lignin can produce value-added chemicals like vanillin, methoxybenzoic acid, eugenol, etc... See Zakzeski et al. [27] for a review on catalytic oxidation of lignin.
Finally, lignin can be converted into aromatic bulk chemicals (phenol, benzene, toluene, xylene, cresols, and gasoline aromatic blend) by a diversity of techniques explained in 1.5.
Holladay et al. [8] studied the economic scenario of lignin valorization (in United States of America in 2007). If 225 MT of lignin are burnt to produce power the revenue is 11.2 G$ (U.S.A. dollar); 24.9G$ if BTX (Benzene, toluene and xylenes) are obtained at 20%wt. from lignin; and 46.2 M$ if the co-production of carbon fiber, BTX and alcohol mix from syn-gas is considered. Haveren et al. [32] studied the same case in the Port of Rotterdam (in 2007). They also concluded that innovation in lignin to BTX process would have an important

34
impact within 20-30 years. The production of phenol from lignin has deserved more attention because phenol is more valuable than BTX [32,33]. The economics of lignin to phenol processes is decreased by the cost of lignin preparation [33], costly high-pressure equipment [25,33] and low phenol yields [32].
1.4 Aromatic hydrocarbons. Uses and other sources
1.4.1 Uses and markets of BTX and phenols BTX are widely used as fuel additives and solvents and are starting blocks for several
molecules. Benzene and p-xylene are very important starting blocks for synthesis and polymer industry. There exist commercial technology for the conversion of toluene and m-xylene into benzene and p-xylene [8,27,34].
Phenol is the starting block for the synthesis of resin, dies, pigments, antioxidants, etc... Holladay et al. [8] outlined that the phenol’s market volume is high, while the market risk is low.
1.4.2 Conventional sources of BTX and phenol Conventional technologies for BTX production are: naphtha reforming (C6–C12; over
Pt/Al2O3), C2–C6 paraffins conversion on Gallium-promoted ZSM5, coal pyrolysis and methanol-to-gasoline Mobil process on ZSM-5 [34].
Phenol is nowadays produced from cumene that is supplied from fossil resources [35]. Cumene is oxidized to cumene hydroperoxide; then cumene hydroperoxide is decomposed into phenol and acetone [35].
1.4.3 Other bio-based sources of BTX Using classical process, biomass can be gasified to syngas, then syngas converted to
methanol, and methanol converted into aromatic hydrocarbons on ZSM5 (Mobil process). Bio-ethanol is nowadays produced by fermentation of carbohydrates. BTX can also be produced from ethanol conversion on ZSM5-based catalyst [36].
Catalytic pyrolysis of carbohydrates (cellulose) on zeolites produced important yields of BTX, and low coke yields [7]. This is also a promising strategy for the production of hydrocarbons from biomass.
Isolated lignin is a very heterogeneous resource. However, lignin is always composed by aromatic monomers with different fractions in guaiacyl, syringyl or coumaryl groups [27]. Therefore, research works focus on the development of processes for the conversion of lignin into aromatic hydrocarbons (Benzene, Toluene, Xylene BTX, aromatic fuels, phenols).
1.5 Processes for the conversion of lignin to phenol and aromatic hydrocarbons
Table 1.3 summarizes literature results on proposed processes for the conversion of lignin into aromatic hydrocarbons. This list may not be exhaustive but shows different examples of the many developed processes. The main goal for all these processes is to remove

35
selectively O atoms without breaking C-C bonds. Confidential technologies may have been developed by private companies waiting for higher crude oil prices [33,37,38].
Table 1.3. Examples of strategies for lignin valorization into hydrocarbons
Name and references
Description State of the art Pro and cons
“Noguchi Process” [33]
Catalytic hydrotreatment of lignin dissolved on lignin-based phenolic mixture.
Many variables were tried by Crown Zellerbach company, for the production of phenol and p-cresol, but they were judged non-profitable in 1965.
High yields in monophenols, coproduction of non-oxygenates. ×Expensive reactors for Hydrotreatment at >400°C, complex separation (distillation) of products.
“Catalytic ebullated bed” [39]
Lignin falls into a boiling bed of phenols were H2 is ebullated in the presence of CoMo catalyst, volatile low oxygen content phenols (mainly cresols) abandon the bed and they are condensed.
A pilot was operated in 1980. Mainly phenol and cresols are produced. × A carbonaceous solid is formed and the bed is clogged.
“Base catalyzed depolymerization and HDO of phenols” [40]
Lignin is treated by H2O (catalyzed by NaOH) to yield phenols; the solution is neutralized and phenols are extracted; and then hydrotreated (50 bar H2, transition metal catalyst).
On the demonstration stage (Chevron, ENI) [38]
High yield of hydrocarbons (64%wdry lignin) × Too many steps separating phenols from reaction media.
“Catalytic Pyrolysis” [41,42]
Lignin is pyrolyzed in presence of a solid catalyst.
Many catalysts have been optimized in a pyro-probe (1mg scale); researches are conducted to scale up laboratory experience to a continuous pilot.
No need of hydrogen. Low pressure. × Lignin char is agglomerated with the catalyst, difficult regeneration and steady-state operation
“Pyrolysis, and HDO of condensed pyrolysis vapors” [43]
Lignin is pyrolyzed, vapors are condensed and then hydrotreated (100 bar H2, precious metal catalysts).
A pilot was operated by De Wild et al. [43] (ECN Netherlands). Fludized-bed clogging happened, but that may be solved by optimizing design [24,43].
Phenols are separated from char before catalytic treatment × Low yield of hydrocarbons heavier than C6.
“Pyrolysis and low pressure, gas phase HDO of never-condensed phenolic vapors” [9,11,14,44–46], this work)
Lignin is pyrolyzed; vapors are hydrotreated before they condense on Fe-based catalyst.
After catalyst development with model compounds, current research focus on real vapors.
Catalysts are not in contact with char. Easier operation of reactors. Low pressure. Cheap catalyst. × Need the development of a trustable steady-state lignin pyrolysis reactor with a high vapors yield.
All processes have advantages and disadvantages (Table 1.3) and few of them have been optimized to its best. In a manner, the process choice depends on the lignin source and on the goal products. For example, a process working in the liquid phase would be chosen for a liquid lignin (like Kraft lignin), but pyrolysis would best handle lignins with a low water content (evaporating high amounts of water would be energy-consuming). Lignin composition

36
also affects the viscoelastic properties of the “sticky” intermediate material formed under heating [23] which could govern process design. More researches are needed to choose the best process for each lignin type.
Catalytic pyrolysis has the advantage of not consuming hydrogen and not needing a high pressure reactor (high capital cost). The drawback is that catalyst ends mixed and stuck with lignin char at the end of the reaction, that makes troublesome the scale-up to continuous reactors [47]. Moreover, the regeneration of zeolite by burning coke and char seems not to restore the performance [48]. Many interesting results have been found in a pyroprobe using this strategy [41,42,49]; it must be considered that a pyroprobe load 1mg of catalyst per experiment [41], and this amounts are too low to try regeneration and re-use of catalyst.
The catalytic conversion of wood pyrolysis vapors on zeolites has been also studied [48,50–52]. Using H-ZMS5 light hydrocarbons from cellulose and hemicelluloses are effectively converted to aromatic hydrocarbons. However, phenolic molecules from lignin pyrolysis seem to show low reactivity or form carbon deposit [53,54]. The lignin-derived fraction of bio-oil must be separated before catalytic conversion [52,53]. For these reasons, H-ZMS5 zeolites are maybe not convenient for lignin pyrolysis vapors upgrading.
High pressure liquid phase processes were developed. One-step processes consist on depolymerization and hydrodeoxygenation HDO on the same reactor (typically an autoclave). Some researchers add high pressure H2 directly into the reactor (using a catalyst) [33,39,55], others use a liquid H donor like formic acid [56] or tetralin [57].
Two-step liquid phase based strategies were also tested. On the first step lignin is depolymerized (by pyrolysis [43], or base-catalyzed depolymerization [40]) into oxygenated unstable aromatic compounds. This lignin-based oil is then converted at high pressures of H2 (>50 bar) in reactors which mimic crude oils hydrotreatment [15,16,40,58].
Conventional hydrotreatment catalysts (CoMoS) for oil refinery are not suitable for bio-oil HDO because of low sulfur content on the initial feedstock (low partial pressure of H2S decreases catalytic activity). Yakovlev et al. [59] studied the HDO of anisole and bio-diesel on Ni and Ni-Cu based catalysts (supported on alumina, zirconia and ceria) at 10 bar. They found that Ni-Cu/CeO2 can convert anisole to cyclohexane at 523K with yields close to 100%. The addition of copper to nickel catalyst decreases the tendency to hydrogenate anisole to methane, and facilitates the reduction of nickel during activation (reduction) of the catalyst.
The main disadvantage of this liquid phase hydrotreatment is the use of costly high pressure reactors and pure high pressure (>50 bar) hydrogen. Moreover, handling liquid lignin-based oils can lead to the polymerization and stability issues [47].
Lignin fast pyrolysis consists in heating lignin quickly to 673-773K in the absence of oxidative gas (i.e. O2). Products of lignin pyrolysis are: condensable vapors, non condensable gases and solid products [43]. Condensable vapors are a very complex and unstable mixture of oxygenated aromatic molecules, most of them with more than one oxygen atom per aromatic ring. Water and little hydrocarbons (methanol, acetic acid, etc) are also formed by

37
lignin pyrolysis. Non condensable gases are CO2, CO, CH4 and traces of light hydrocarbons. Two solids are formed during lignin pyrolysis. ”Char” is the name given to a carbon-rich fluffy solid that keeps inside the pyrolysis reactor. Another fraction of lignin pyrolysis products remains stuck to the exit of the reactor (even if it is heated), and forms solids when they are condensed. This fraction of lignin pyrolysis was identified as lignin oligomers (also called “pyrolytic lignin” [30,60–62], see Table 1.2).
Faix et al. [63] studied the products of the non-catalytic pyrolysis of lignin at 600°C in a pyroprobe (Py-GC-FID) reactor. 15–30 wt.% of OMACs was obtained using different lignins. De Wild et al. [43] studied the pyrolysis of lignin in a fluidized bed at 400°C; they obtained 9wt.% of GC-analyzable phenolic molecules.
Figure 1.5. Van Krevelen diagram of lignin hydrotreatment (based on [43]). Pyrolytic oil was
obtained by de Wild et al. on a fluidised bed [43]. The green triangle involves roughly all kinds of lignin [64].
Lignin pyrolysis vapors contain more than 50 Oxygenated Mono-Aromatic Compounds
(OMAC) [25,43,65,66]. Some of these compounds are very valuable isolated, but the mixture is too complex to be distilled (low mass percentage of individual compound, instability when heating).
Guaiacol is a minor but significant component in a very complex mixture in lignin bio-oils [22]. It has been chosen as a model compound because its elemental composition is close to the overall elemental composition of lignin bio-oils and its hydroxyl and methoxyl functions on the aromatic ring are significant and key functions for aromatics species in lignin bio-oil.
The vapor phase HDO of never-condensed lignin pyrolysis vapors on a sustainable, cheap and simple iron catalyst is our strategy (Fig. 1.6).

38
Figure 1.6. Gas-phase HDO of never condensed lignin pyrolysis vapors
Gas-phase HDO prior to condensation (Fig. 1.6) would help to optimize heat integration
in the process and reduce problems of feeding the reactive liquid bio-oils. Our goal is to enhance the properties of these oils making a distillable mixture, enriched in targeted compounds (benzene, phenol, p-cresol, alkyl phenols, and aromatic fuel) nowadays produced from crude.
The hydrogenation should be soft in order to favor BTX production at the expense of the ring hydrogenation and methane formation (Fig.1.5). The catalyst should act selectively towards the hydrogenolysis of the oxygen-aromatic bonds of hydroxyl or methoxyl functions, i.e. it should be able to activate molecular hydrogen and the C(aromatic)-O bond. Moreover, it should be resistant to lignin pyrolysis products and have the desired aspects of any catalyst: low price, low deactivation, easy regeneration and environmentally friendly disposal.
Phenol is also an interesting product, but allowing much oxygen atoms linked to aromatic ring could produce an endless list of isomers difficult to be separated from the different compounds in bio-oils.
1.6 Catalyst for HDO of lignin pyrolysis vapors under pyrolysis conditions Lignin pyrolysis occurs generally at low pressure (just enough to overcome pressure
drop in filters and condenser, <2 bar) and temperatures from 623 to 873K. In a fluidized-bed, a carrier gas is used (Ar [43], pyrolysis gases [67]), so OMACs came out diluted (1-0.1%vol) [43]. Literature of HDO on typical crude-oil hydrotreatment conditions (i.e. Phydrogen=20-150 atm, T=473-673K, liquid phase) is quite extensive, but out of the scope of this work. See [27] and [58] for complete reviews.
1.6.1 Catalysis under fast pyrolysis conditions in the presence of H2 using model molecules
Whilst undertaking our work, few papers appeared on the subject using similar reaction conditions but different catalysts (Ni2P/SiO2, Fe2P/SiO2, MoP/SiO2, Co2P/SiO2 and WP/SiO2 [14]; CoMoS over alumina, zirconia or titania [15,16,68]; Pt/Al2O3 [69], Pt/HBeta zeolite [13], Pt-Sn/CNF [11]). From the academic point of view, they indicated that the catalysts activity and selectivity strongly depend on the nature of the active phase and that of the support. These factors particularly influence the two main competitive reactions, namely the HDO and the aromatic ring hydrogenation.
Reactant stream
Gases (N2, CO, CO2, H2O, H2, CH4)Monocyclic oxygenated aromat ics (vapors)Lignin’s oligomers (aerosols, part icles)
Reducing gas (H2, syngas, etc..)
Lignin
Char
Pyrolysis
reactorHDO reactor
Value-added chemicals
(benzene, toluene,
phenols, etc.)

39
Transition (Fe, Co, Ni) and precious metals (Pt, Pd, Ru, Rh, Ir, etc.) are known to catalyze hydrogenation [17], but unfortunately most of them also catalyze benzene hydrogenation in the temperature range 473–673 K [18]. Emmett and Skau [17] detected no activity for benzene hydrogenation at 673 K working with Fe. Lately, Yoon and Vannice [18] measured a relatively low activity of Fe for benzene hydrogenation compared to other transition or precious metals (Ni, Co). Fe is a trade-off between activity and selectivity. This is the reason why we chose iron as the active phase in the guaiacol HDO, expecting minimum aromatic ring hydrogenation.
Metal–support interactions and support acidity play a crucial role in complex chemistry of transition metal supported catalysts. It was studied for hydrogenation of aromatics hydrocarbons [70–74] as well as for aromatic alcohols [15,16,75–79]. Benzene is hydrogenated with higher rates on Ni catalysts when silica was used as a support instead of alumina [79]. For HDO reaction on supported Mo catalysts, alumina gave higher activity but rapid deactivation due to coke deposit [75,76,79]. In contrast, the use of the less acidic active carbon led to lower activity but a better selectivity in HDO products [75,77–79]. We concluded that silica and activated carbon would be good iron carriers due to its low acidity.
Cobalt was chosen for comparison. Cobalt is an inexpensive active phase compared to precious metals. It is a component of typical CoMoS/Al2O3 hydrotreating catalyst and it is active for HDO [59]. Our group performed a screening of catalyst at 623 K [21]. It was shown that cobalt is able to catalyze the production of BT from guaiacol. For those reasons, our first works focus on the gas phase HDO of guaiacol to BTX as a model compound of lignin pyrolysis vapors using Fe/SiO2 and Co/Kieselguhr catalysts, at the temperature of interest (623–723 K) for coupling the HDO catalytic reactor to the pyrolysis reactor.
1.6.2 Transition metals for wood pyrolysis vapors upgrading without H2
Mullen and Boateng [41] studied the catalytic pyrolysis of lignin with a pyroprobe. Different lignins were mixed and pyrolyzed with NH3-treated H-ZMS-5 or CoO-MoO3/Al2O3. With the zeolite catalyst lignin is first cracked and deoxygenated to C2–C6 olefins which then are converted into BTX. With CoO-MoO3/Al2O3 catalyst, lignin is thought to be depolymerized to phenols, and then phenols are deoxygenated on CoO-MoO3 sites to aromatic hydrocarbons.
Aho et al. [50] used different zeolites (Beta, Y and Ferreirite) for the catalytic conversion of wood pyrolysis vapors. The quality of oils was enhanced. Iron-doped zeolites were also tested. They found that iron-doping increased the yield in alkyl phenols at the expense of methoxy phenols. Zeolites were regenerated by coke burning, specific surface was conserved but some acidity was lost.
Antonakou et al. [80] evaluated the performance of Al-MCM-41 materials (and Fe, Cu and Zn loaded derivatives) on the catalytic conversion of wood pyrolysis vapors. They found that Cu and Fe ions catalyze the dehydrogenation of organic molecules (producing H2) and enhance the production of phenols.

40
Valle et al. [51] studied the conversion of wood bio-oil/methanol mixtures on Ni modified H-ZMS5. Nickel was added to catalyze dehydrogenation; thus increasing the yield in aromatic hydrocarbons from bio-oil. Lignin derived molecules were a very important source of carbon deposits [81], and the authors recommend the separation of these compounds before catalytic conversion [53].
1.7 Brief description of the following chapters The conversion of lignin pyrolysis vapors into phenol and aromatics hydrocarbons was
studied in four steps.
First, iron was identified as an active and selective catalytic phase for guaiacol gas-phase HDO. Chapter 2 explores the influence of hydrogen concentration, temperature, time-on-stream on guaiacol of Fe/SiO2 catalyst; and the advantages of Fe-based catalyst compared to a commercial Co-based catalyst. This chapter is identical to our first article on this subject [44].
Second (Chapter 3), the influence of other gases present in lignin pyrolysis (CO, CO2, CH4, H2O) was studied separately and together on Fe-catalyzed guaiacol HDO at 673K. Catalyst composition was also varied using different Fe loadings (5, 10 and 15wt.%) and using Activated carbon instead of silica. At present the full content of Chapter 3 is under revision for a second paper to Applied Catalysis B.
Third, Chapter 4 shows an original experiment with real lignin pyrolysis vapors. Lignin pyrolysis is carried out by a home-made set-up. Lignin pyrolysis vapors are mixed to H2 and then passed through a catalytic fixed bed reactor. Then the converted bio-oils are condensed and analyzed by GC-MS-FID heart-cutting technique. This result showed the feasibility of the process even with real lignin vapors. The full content of Chapter 4 is intended to be submitted to Green Chemistry or a similar journal.
Chapters 2, 3 and 4 also contain characterizations of fresh and used catalyst by X-Ray Diffraction, Mossbauer spectroscopy, Temperature Programmed Oxidation, and Transmission Electronic Microscopy.
Finally, in Chapter 5, a kinetic model for guaiacol HDO on Fe/SiO2 is proposed based on experimental data. This model is coupled to an Aspen Plus simulation of the whole process of lignin to BTX by catalytic HDO of lignin vapors including pyrolysis, catalytic reactor and BTX vapors recovery.

41
Chapter 2. Gas-phase hydrodeoxygenation of guaiacol over Fe/SiO2 catalyst From [44]: R.N. Olcese et al. Applied Catalysis B: 115-116 (2012) 63-73.
Abstract
Catalytic hydrodeoxygenation (HDO) of guaiacol was studied over Fe/SiO2 as a model reaction of lignin pyrolysis vapors hydrotreatment. The catalytic conditions were chosen to match with the temperature of never-condensed lignin pyrolysis vapors. The catalyst was characterized by XRD, Mossbauer spectroscopy, N2 sorption and temperature programmed oxidation. A comparison is made with a commercial cobalt-based catalyst. Cobalt-based catalyst shows a too high production of methane.
Fe/SiO2 exhibits a good selectivity for BT production. It does not catalyze the aromatic ring hydrogenation. Temperature (623–723 K) and space time (0.1–1.5 gcat h/gGUA) influence the aromatic carbon–oxygen bond hydrogenolysis reaction whereas H2 partial pressure (0.2–0.9 bar) has a minor influence. 38% of BT yield was achieved under the best investigated conditions. Reaction mechanisms for guaiacol conversion over Fe/SiO2 are discussed.
2.1 Material and method
2.1.1. Thermodynamic analysis The chemical equilibrium was studied with GASEQ [82]. 31 compounds were defined:
phenols (phenol, cresols, catechols, and guaiacol), ring hydrogenated (cyclohexane, cyclohexene, cyclohexanol,etc.), HDO products (BTX), PAHs, carbon, methanol, water, carbon dioxide and monoxide and alkanes (from methane to C6).
Many compounds were not pre-defined on GASEQ library. Their properties (ΔH°f, ΔG°f and Cp(T)) were calculated using THERGAS [83] (based on tabulated data or Benson’s method). Starting data were 1% guaiacol, 90% H2, 9% Ar, 1 atm and 673 K.
2.1.2. Experimental 2.1.2.1. Preparation of catalyst
Iron over silica (Fe/SiO2) catalyst was prepared by simple impregnation. 12 g of silica (Aerosil 130, Degussa) were contacted with 65 ml of an iron nitrate nonanhydrate (Sigma) solution in deionised water (0.2 g/ml, 0.46 M Fe(III)). The mixture was exposed to vacuum at room temperature for 3 h, and then dried 24 h at 373 K. The resulting impregnated solid was grounded and sieved (100–160 µm), and then calcined at 773 K under Argon flow (50 Nml/min) for 1 h. A test iron-free silica sample was prepared repeating the same procedure but using deionised water instead of iron nitrate solution.
The calcinated catalyst was reduced in situ by pure H2 (50 ml/min) before guaiacol HDO. Temperature was increased from 298 K to 773 K at a rate of 5 K/min, then hold 773 K during 60 min. The reactor feed was then changed to hydrogen–argon mix at desired flows and H2 molar fraction and the temperature was set to the reaction temperature. After a stabilisation time (60 min),guaiacol syringe pump was turn on.

42
The Cobalt on Kieselguhr catalyst (Co/Kies) was supplied from Strem Chemicals. It was grounded, sieved and reduced under the same conditions as the iron-based catalyst.
2.1.2.2. Guaiacol catalytic HDO experiments
Catalytic tests were made in a continuous flow fixed-bed reactor (d = 4.1 mm) at atmospheric pressure (Fig. 2.1). A known mass of catalyst (30–200 mg) was placed into a quartz reactor. The reactor was heated with an electrical furnace. Reaction temperature was measured with a thermocouple placed inside the reactor and set at 623, 673 or 723 K. The gas flow rates (Ar, H2) were controlled with mass flow controllers (MFC, Bronkhorst). Mass residence time (1/WHSV = gcatalyst/(gGUAIACOL/h)) was changed by the variation of catalyst mass. The inlet line of the reactor was heated (473–523 K).At this stage guaiacol was injected and vaporized with a syringe pump (43–172 µl/h). All runs were done at 1 mol.% (= 1% mol) of guaiacol. About 1000 µmol of guaiacol was injected on the catalyst bed for nominal conditions (Fe/SiO2, 673 K, 1/WHSV = 0.38 h, 30 min time on stream). In a standard run, gas flows, liquid flow and catalyst mass were 73 Nml/min H2, 7.5 Nml/min Ar, 239 µl/h Guaiacol and 100 mg, respectively.
Figure 2.1. Scheme of the experimental set-up for catalytic conversion of biomass pyrolysis tar model compounds.
Table 2.1 displays the operating conditions studied in this work. The screening of catalyst performances needs short times on stream due to the rapid deactivation by coking, inherent of this reaction (see for instance reference [12]).

43
Table 2.1 Experimental conditions investigated in this Chapter.
Catalyst type Temperature (K)
H2 partial pressure (Bar)
1/WHSV (h) (g catal / (gguaiacol/h))
Fe/SiO2 623, 673a, 723 0, 0.2, 0.5, 0.9a 0.11, 0.38a, 0.79, 1.50
Co/kieselguhr 673 0.9 0.49, 0.70, 0.81
a nominal conditions
The outlet of the reactor was also heated (473 K) to avoid any condensation of products and guaiacol. The heated exit pipe was connected to 2 impingers filled with about 15 ml of isopropanol (cooled at 213 K) where condensable products were collected. The authors are aware of the tar protocole [84,85]. The sampling efficiency of the 2 impingers was checked by analyzing the 2nd impinger [85] and by the µGC analysis (see below).
50 µl of internal standard (1-undecene) was injected in the entire impingers solution volume at the end of the experiment. Condensable products were first identified off-line by GC–MS analysis and then quantified by GC–FID on a 1701 (60 m, ID 0.25 mm, 0.25 µm) column, with a split division ratio of 1/30. The GC heated program was as follow: 313 K for 5 min, 5 K/min to 423 K, 10 K/min to 543 K then hold 5 min. Relative response factors were calculated from pure compounds, with very good reproducibility (relative standard deviation of 3 injections lower than 5% for each products). Reactant and product concentrations at the exit were calculated dividing GC data on the time on stream.
Incondensable products (methane, ethane, CO, CO2, etc.) were analyzed on-line with a µGC-Varian 490 equipped with four modules connected to the exit of the impingers. The four modules were composed of two molecular sieves 5A, a PoraPlot U and a CP–Wax 52CB columns. µGC-490 signal was calibrated using four standard bottles (Air Liquide, France). It allows quantifying BTX on-line at concentration lower than 10 ppm every 3 min. No BTX signal was detected at the outlet of the impingers thus confirming the good condensation of BTX and phenolic products in the impingers. µGC on-line data was first integrated and then divided on the time on stream to calculate the average flow rate of permanent gases.
2.1.2.3. Characterizations of the catalyst
The load in iron of the Fe/SiO2 catalyst was checked by ICPMS analysis (CNRS-SARM procedure [86]) and was 17wt.%). Co/Kieselguhr cobalt load was 25wt.%. Specific surface areas of catalysts were calculated from sorption isotherms of nitrogen at 77 K, using BET method. Isotherms were obtained with a Sorptomatic 1990 (Thermo Finnigan, Waltham, MA, USA). All the samples were previously outgassed at 523 K for several hours.

44
The samples have been analyzed by conventional X-ray powder analysis (XPERT Pro Cu Kα) and the crystal structures have been refined using the Fullprof software [87]. The 57Fe Mossbauer measurements were carried out using a constant-acceleration spectrometer in standard transmission geometry with a 57CoRh source (25 mCi). Spectra were recorded at 300 K. A polycrystalline absorber with natural abundance of 57Fe isotope and thickness of about 15 mg cm-2 was used. The Mossbauer spectra were fitted with a least-squares method program assuming Lorentzian peaks [88].
TPO was performed on the used catalyst using the same reactor as for guaiacol catalytic conversion. 60 mg of sample were flowed by air (50 Nml/min) and temperature was increased from 293 to 1073 K at 3 K min-1. Produced carbon dioxide was measured online by the µGC. Carbon monoxide was not detected.
2.1.3. Definitions Carbon yields (YC%) were calculated using Equation 2.1 where Nj
i is the number of j (C, O, H) atoms per a molecule, i (guaiacol, anisole, etc.). ni (mole) is the amount of i product at the exit of the reactor and nGUA° (mole) is the amount of guaiacol moles introduced in the reactor. HDO conversion (XHDO%) was calculated using Equation 2.2 (PhOH: Phenol; ANI: anisole; MePhOH: cresols; GUA: Guaiacol; Cat: Catechol; MeCat: Methyl catechol).
H/C* and O/C* of products were calculated by equation 2.3 and 2.4 respectively. O/C* was defined to be equal to zero if a complete HDO is achieved to produce H2O. H/C* is equal to 1.14 if guaiacol is completely converted into toluene. Under this condition, guaiacol HDO is optimal. If the carbon atom of guaiacol are completely hydrogenated into CH4, H/C* is equal to 4.
)).(()).((
.100%0
GUAGUA
C
ii
CiC nN
nNY (2.1)
).(2)).(2(
1.100% 0GUA
MeCatCatGUAMePhOHANIPhOHHDO n
nnnnnnX (2.2)
i
iC
iC
iH Y
NNCH
100%
.*/ (2.3)
i
iC
iC
iO Y
NNCO
100%.*/ (2.4)
2.2. Results
2.2.1. Thermodynamic analysis of the reactive system Some key reactions were analyzed in THERGAS [83] to determine the variation of the
free Gibbs energy as a function of the temperature. The key reactions (R1–R6) are given in Table 2.2 and their free Gibbs energy in Table 2.3. Table 2.3 shows that the goal reactions

45
(R1 and especially R2) are possible on the entire range of temperature. The selectivity of BTX formation from phenols HDO should be consequently optimized by a suitable kinetic approach. The formation of saturated rings (R3 or R5) is not favored from 700 K. Reactions R4 and R6 are favored at higher temperatures. CH4 would be the final product if the thermodynamic equilibrium is achieved considering the 31 possible compounds. This result is trivial since methane is the most stable molecule at this temperature.
Table 2.2 Key reactions selected to assess the thermodynamic of guaiacol HDO Guaiacol + 2 H2 = Benzene + H2O+ methanol R1, HDO conversion of guaiacol to benzene
Guaiacol + 2 H2 = Toluene + 2 H2O R2, HDO conversion of guaiacol to toluene
Guaiacol + 4 H2 = Cyclohexanol + methanol R3, hydrogenation of the guaiacol aromatic ring
2 Guaiacol + 3 H2 = Diphenyl + 2 methanol + 2H2O
R4, polymerization reaction
Benzene + 3H2 = Cyclohexane R5, hydrogenation of benzene
Benzene = 3 H2 + 6 C R6, pyrolysis of benzene with coke production
Table 2.3. Variation of free Gibbs energy of some key reactions involved during guaiacol HDO
Temperature (K)
ΔG (kcal/mol)
R1 R2 R3 R4 R5 R6
400 -32.72 -50.4 -27.57 -60.22 -14.3 -34.99 500 -33.39 -51.18 -18.54 -61.45 -5.18 -39.22 600 -33.89 -51.85 -9.25 -62.47 4.17 -43.63 700 -34.26 -52.43 -0.18 -63.31 13.6 -48.17 800 -34.53 -52.93 9.71 -64.01 23.07 -52.79 900 -34.71 -53.36 19.27 -64.6 32.53 -57.47 1000 -34.83 -53.75 28.85 -65.08 41.97 -62.19
2.2.2. Blank tests, reproducibility and mass transfer limitations Homogeneous conversion of guaiacol was checked to be negligible below 723 K for our
empty reactor. An experiment with the non-impregnated iron-free silica also showed no conversion. The nominal experiment (90% H2, 673 K, 0.38 gcat h/gGUA, Fe/SiO2) was repeated five times. A good reproducibility was achieved. Relative standard deviation of guaiacol conversion was 4% and 5.5% for product distribution. Guaiacol conversion was 70%.

46
Carbon balances were between 84% and 92% without the carbonaceous deposit on the catalyst. The carbonaceous deposit quantified by TPO was 7% for nominal conditions (see below). Total carbon balance (GC analyzed species + coke deposit) was 94% (for nominal conditions).
Major products detected by GC/MS in the impingers’ solution were: phenol, cresols, anisole, benzene, toluene, and methanol. Methylcatechol was also detected. Our GC method allows to measure methanol only roughly. Methanol concentration on exit gas was about 0.04 vol.% for nominal conditions.
In order to rule out the external mass transfer limitations, catalytic runs were done by varying the mass of catalyst in the range 30–210 mg, but tailoring reactant flow to maintain a stable 1/WHSV of 0.38 h. No variation of guaiacol conversion or products yields was found.
We did not succeed to investigate experimentally the internal mass transfer because of a too high pressure drop inside the bed for smaller particles. The internal mass transfer limitation was ruled out using the modified Thiele or Weisz modulus (as in [89]).
The modified Thiele modulus allows comparing a reaction-induced flow rate to a diffusion flow rate when the true intrinsic reaction kinetics (order and kinetic constant) are unknown and when only the flow of consumed reagent is available. The details of calculation are given in the Annex 1. The modified Thiele modulus was below 0.4 for all the investigated conditions. The experiments were thus conducted under the chemical regime.
2.2.3. Evolution of the reaction as a function of time on stream Fig. 2.2 shows the evolution of guaiacol conversion, HDO conversion and main
products with time on stream. Conditions for a high conversion of guaiacol but with a HDO conversion of about 60% was chosen (Fe/SiO2, T = 673 K, P = 1 atm, 90% H2, 1 vol.% guaiacol, 9% Ar, 1/WHSV = 1.50 gcat h/gGUA) to compare our results with published data [9,11,12,14]. The aim of this paper is not to investigate the kinetic of primary guaiacol conversion (that needs low guaiacol conversion) but rather the evolution of benzene selectivity as a function of time on stream. Since the desired BTX products come from secondary reactions, their productions in appreciable yields need a high guaiacol conversion in primary products (phenols, etc.) and secondary conversion of these primary products. It is indeed of great interest to investigate the stability of the catalyst on BT selectivity and not only on guaiacol conversion.
The main product gases were methane and carbon monoxide. Ethylene, ethane and carbon dioxide were also detected by the µGC but at molar fractions lower than 0.015 mol%.

47
Figure 2.2 Evolution of the gases molar fraction and of guaiacol and HDO conversions as a function of time on stream (Fe/SiO2, T = 673 K, P = 1 atm, 90% H2, 1 vol.% guaiacol, 9% Ar, 1/WHSV = 1.50
gcat h/gGUA).
CH4 can be formed from methoxyl function decomposition and ring hydrogenation. CH4
mole fraction stays below 1 mol% (1 mol of CH4 formed for 1 mol of guaiacol at 1 vol.%). This finding suggests that there is very little ring hydrogenation. CO could be formed from phenol dehydroxylation. Aromatic ring dehydroxylation could form coke precursors (PAH through cyclopentadienyl radical) [90,91].
A decrease in guaiacol and HDO conversion is observed due to the catalyst deactivation that will be explained by the characterization of the catalyst.
2.2.4. Catalyst characterization Specific surface area of fresh calcinated catalyst was 116 m2/g close to 130 m2/g of the
original silica. This result shows that our impregnation method does not reduce significantly the porous structure of silica. Used catalyst (under nominal conditions) showed almost the same specific surface (118 m2/g). This finding is consistent with very few diffusion limitations in the pores [89]. Co/Kieselguhr specific surface was 38 m2/g.
XRD patterns (see Annex 3) confirmed the presence of α-Fe as major phase before and after reaction as showed by the signals 2θλKαCu = 44.6°, 64.9° and 83° [92,93]. The crystallite size evaluated for 110 lines (2θλKαCu of 45°) of iron (Fullprof software procedure [87]) indicated that the average size of crystallites was about 10 nm. Other minor peaks on XRD patterns of spent catalyst could be explained by the presence of magnetite (Fe3O4, 2θλKαCu = 35.5° and 62.9°) and/or maghemite (Fe2O3, 2θλKαCu = 35.75° and 63.14°). Iron oxides are a minor phase after reduction and after guaiacol conversion. The reduced catalyst (before guaiacol conversion) was shown to be pyrophoric and thus difficult to be analyzed. The silica
% m
ol

48
gives a diffusion signal at small angles. Co/Kieselguhr commercial catalyst was found to be amorphous.
Figure 2.3. Mossbauer spectrum of the used catalyst (after 4 h time on stream, Fig. 2.2). Imp: impurities (see text).
The Mossbauer spectrum of the spent catalyst (Fig. 2.3, after 4 h of guaiacol conversion) clearly shows a sextet characteristic of α iron (H = 331(1) kOe, IS = 0.00(1) mm/s, EQ = 0.00(1) mm/s, gamma = 0.31(1) mm/s). Several small contributions that could be addressed to cementite (Fe3C, formed by Fe carburisation) and magnetite are also observed. The respective area of the sextet and the peaks of impurities are estimated to about 85%, 3% and 12%Area for α Fe, Fe3O4 and the carbide phase, respectively. These results are in fair agreement with the XRD pattern where metallic iron as a major phase and magnetite Fe3O4 as a very minor phase are observed yielding the carbide compound to be probably amorphous. Moreover, the magnetically ordered state observed for these three compounds in the Mossbauer spectrum implies that the particles were not in superparamagnetic domain. Therefore, their sizes of particles are in fair agreement with those deduced from the X-ray pattern since a superparamagnetic behavior for α Fe, Fe3O4 and (Fe,C) compounds occur for sizes below around 2 and 10 nm for Fe and the two other phases, respectively [88].
The supposed active phase (α Fe) stays the major phase even after 4 h of guaiacol HDO with no dramatic change in size and magnetite or carbide species formed in negligible amounts. This finding strongly suggests that the deactivation mechanism would mainly take place through coke deposition instead of iron carbide or oxide formation. Further work will deal with the effect of steam (and other pyrolysis gas) on the surface cleaning.

49
Analysis (by XRD and Mossbauer) of spent catalysts after 3 months of storage also shows a slow oxidation of the catalyst if stored at room conditions but reduced iron remains the major phase.
BET measurements showed that specific surface area of the used catalyst was almost the same as that of the fresh catalyst. Consequently, coke deposition does not plug significantly the pore mouths.
Figure 2.4. Evolution of CO2 formation during temperature programmed oxidation of used Fe/SiO2
(after nominal conditions).
Coke deposit was investigated by means of TPO. TPO profile of the carbonaceous compounds is shown on Fig. 2.4. It exhibits three peaks at 634 (major peak), 741 and 924 K and a shoulder at 527 K corresponding to different coke species, most probably including coke precursors (PAH), solid amorphous (not seen by XRD) carbon formed from the PAH and iron carbide (analyzed by Mossbauer).
The nature and number of coke species depend on the nature of the catalyst. Zhu et al. [12] performed a similar study on Pt/SiO2 and Pt/HBeta zeolite catalyst after anisole hydrotreatment. They found two peaks on silica supported catalyst and three peaks on zeolite supported catalyst. They explained that coke oxidation could be catalyzed by platinum.
Valle et al. [51,81] studied coke formed during gas-phase upgrading of wood bio-oils on HZMS-5. Two peaks were obtained on the TPO curves. They explained that the first peak came from thermal decomposition of bio-oils, and the second peak came from catalytic reaction.
The integral of CO2 production during TPO represented 7% of the carbon balance, which is consistent with the fact that products measured by GC and µGC accounted of around 85% (see Annex 2) of the carbon balance. The overall carbon balance is thus closed to about 94%. Coke production was 6.6% g of coke/g of converted guaiacol in nominal conditions.

50
Coke deposit level depends on several factors, amongst them the nature of the metal catalyst and of the oxygenated reactant molecule. The amount of carbon deposit is thus lower for Pt/SiO2 [12] (3.0% g coke/g of converted anisole) but anisole was the HDO model compound. Anisole is a less oxygenated compound easier to be hydro-deoxygenated than guaiacol.
TPO quantification of coke deposit upon time on stream was not investigated. However, the “GC carbon balance” (moles of carbon analyzed by GC in aromatics and in permanent gases at the outlet/moles of carbon injected in guaiacol) was stable and close to 85% for the entire time-on-stream (4 h) (see Annex 2). This suggests that coke deposition does not increase with time on stream due to lower guaiacol and HDO conversions upon time on stream.
2.2.5. Catalytic activity 2.2.5.1. Effect of H2 partial pressure The effect of hydrogen partial pressure on conversion and yields was investigated at 673
K, considering the first time-on-stream point (Fig. 2.5).
The conversion of guaiacol on Fe/SiO2 in the absence of hydrogen differed clearly from any hydrotreatment experiments evidencing the role of hydrogen in the reaction. Guaiacol conversion was 30% without H2, compared with 70% for
2HP of 0.2 bar. However, the effect
of hydrogen became negligible for 0.2–0.9 bar of H2.
Figure 2.5. Effect of H2 partial pressure on (a) molar fraction of non-reacted guaiacol and major products and on HDO conversion (see Eq. (2.2)), (b) molar fraction of minor products (Fe/SiO2; 673
K; 1 bar, 0.38 gcat h/gGUA).
In the absence of hydrogen almost no HDO product were trapped in the impingers (except about 10% of anisole + cresols). Non-condensable gases were also produced in very little amounts. Carbon balance (without coke) was 70% for the run without hydrogen, whilst it was between 84% and 92% for all the other runs. This indicates important carbon deposit in the former case. One important role of hydrogen is to reduce the formation of coke precursors (probably PAH from phenol conversion). H2O could be a reaction product of HDO and is also
% m
ol
% m
ol

51
present in the pyrolysis gas. H2O could also prevent the accumulation of coke by steam gasification [12]. The effect of H2O partial pressure on coke deposition will be presented in future papers.
XHDO% remains almost unchanged in the range 0.2 bar<2HP <0.9 bar. Benzene and
toluene yields increase slightly with hydrogen partial pressure at the expense of phenol and cresols (Fig. 2.5). The conversion of guaiacol into BT is reduced in a very little extent with the decrease of H2 partial pressure. Carbon balance (without coke) was stable (0.2 bar<
2HP<0.9 bar) indicating that coke deposit on catalyst was not formed in a higher yield if H2 partial pressure decreased from 0.9 to 0.2 bar. These findings are quite important and show that the conversion of lignin vapors into BTX would even be possible if the gas stream is relatively poor in hydrogen. Fe/SiO2 is a versatile catalyst towards H2 partial pressure.
Shin and Keane [9] studied the effect of the partial pressure of hydrogen on the formation of cyclohexanol from phenol conversion at 573 K on Ni/SiO2 They found that the reaction rate increases with H2 concentration but benzene selectivity was essentially independent of hydrogen concentration, which is roughly consistent with our results (Fig. 2.5). The effect of hydrogen pressure on guaiacol hydrogenation was also reported for Pt/Al2O3 catalyst or HY zeolite [69]. In the presence of hydrogen both isomerisation and HDO reactions (BTX, phenol, anisole, o-cresol) were observed with metal supported catalyst. In the absence of hydrogen, it gave isomerisation reactions. This may be ascribed to the low conversion conditions intentionally used (<12%). In similar reaction conditions, HY zeolite also exclusively gave isomerisation reactions [69].
2.2.5.2. Effect of temperature
Fig. 2.6 shows the products evolution as a function of the temperature.
Guaiacol conversion and XHDO% increase with temperature (623–723 K). Benzene and toluene yield increase with temperature but also undesirable products (CH4, CO) yield increases. The tendency to the production of higher yield in methane observed with high temperatures is consistent with thermodynamic equilibrium. However, CH4 molar fraction remains below 1 vol.% even at 723 K, confirming the high selectivity for the range of investigated temperature. In our opinion, the influence of temperature on selectivity is a key factor considering that lignin fast pyrolysis is normally carried out at temperatures from 673 K to 873 K to increase the yield in OMACs [22,63]. The selectivity of Fe/SiO2 is high even with temperatures suitable to treat never-condensed pyrolysis vapors.

52
Figure 2.6. Effect of temperature on (a) molar fraction of non-reacted guaiacol and major products and on HDO conversion (see Eq. (2.2)), (b) molar fraction of minor products
(Fe/SiO2; 2HP = 0.9 bar; 0.38 gcat h/gGUA).
2.2.5.3. Effect of WHSV
Fig. 2.7 shows the effect of 1/WHSV from 0.11 to 1.50 h on products molar fraction.
Figure 2.7. Effect of WHSV on (a) molar fraction of non-reacted guaiacol and major products and on HDO conversion (see Eq. 2.2), (b) molar fraction of minor products (Fe/SiO2; 673 K;
2HP = 0.9 bar).
Guaiacol is completely converted at 0.8 h of 1/WHSV. XHDO% increased to 77% at 1.5 h (Fig. 2.7 (a)). Phenol concentration is still quite high (0.37 vol.%) at 1/WHSV of 1.5 h whereas BT yield reaches 38%. Methane molar fraction does not increase after 0.8 h although HDO increases. At 1/WHSV of 1.5 h the molar balance of analyzed aromatic rings was 84%. The fraction of not analyzed rings (16%) in mono-aromatics is mainly converted to PAH and coke precursors because no ring hydrogenated products (cyclohexane and cyclohexene) were detected. Higher BT selectivity could be achieved at higher 1/WHSV by further phenols
% m
ol
% m
ol
% m
ol
% m
ol
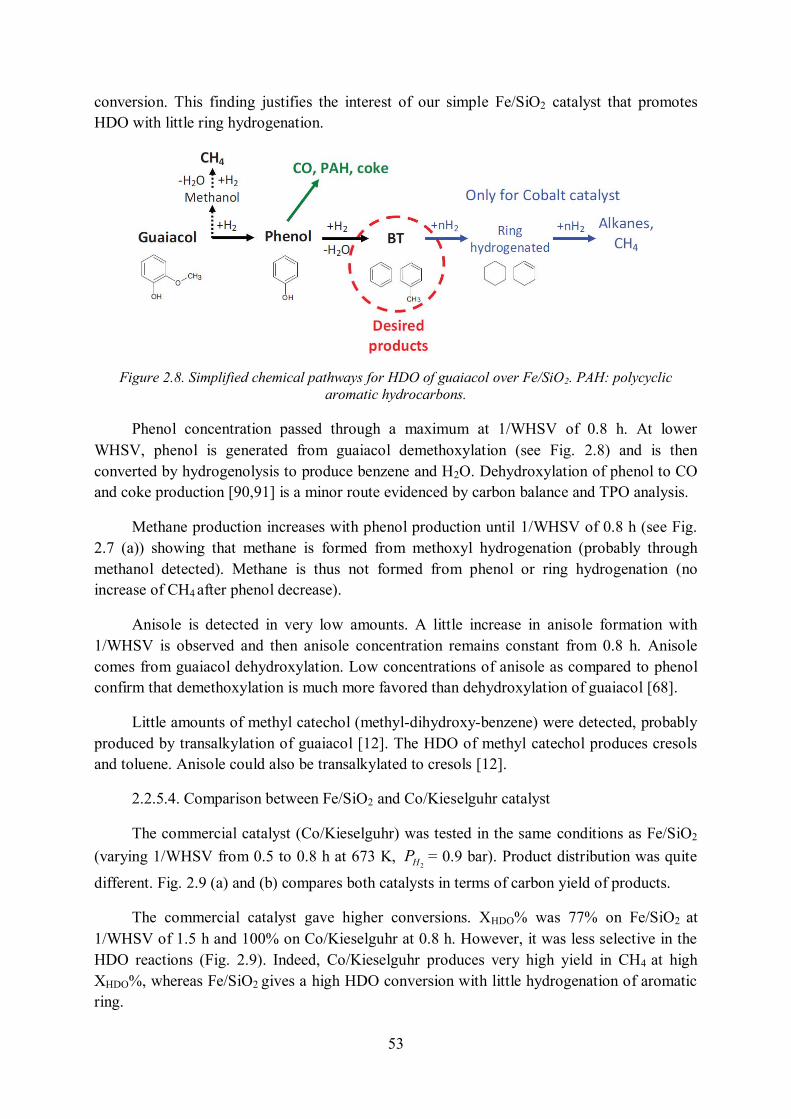
53
conversion. This finding justifies the interest of our simple Fe/SiO2 catalyst that promotes HDO with little ring hydrogenation.
Figure 2.8. Simplified chemical pathways for HDO of guaiacol over Fe/SiO2. PAH: polycyclic aromatic hydrocarbons.
Phenol concentration passed through a maximum at 1/WHSV of 0.8 h. At lower
WHSV, phenol is generated from guaiacol demethoxylation (see Fig. 2.8) and is then converted by hydrogenolysis to produce benzene and H2O. Dehydroxylation of phenol to CO and coke production [90,91] is a minor route evidenced by carbon balance and TPO analysis.
Methane production increases with phenol production until 1/WHSV of 0.8 h (see Fig. 2.7 (a)) showing that methane is formed from methoxyl hydrogenation (probably through methanol detected). Methane is thus not formed from phenol or ring hydrogenation (no increase of CH4 after phenol decrease).
Anisole is detected in very low amounts. A little increase in anisole formation with 1/WHSV is observed and then anisole concentration remains constant from 0.8 h. Anisole comes from guaiacol dehydroxylation. Low concentrations of anisole as compared to phenol confirm that demethoxylation is much more favored than dehydroxylation of guaiacol [68].
Little amounts of methyl catechol (methyl-dihydroxy-benzene) were detected, probably produced by transalkylation of guaiacol [12]. The HDO of methyl catechol produces cresols and toluene. Anisole could also be transalkylated to cresols [12].
2.2.5.4. Comparison between Fe/SiO2 and Co/Kieselguhr catalyst
The commercial catalyst (Co/Kieselguhr) was tested in the same conditions as Fe/SiO2 (varying 1/WHSV from 0.5 to 0.8 h at 673 K,
2HP = 0.9 bar). Product distribution was quite
different. Fig. 2.9 (a) and (b) compares both catalysts in terms of carbon yield of products.
The commercial catalyst gave higher conversions. XHDO% was 77% on Fe/SiO2 at 1/WHSV of 1.5 h and 100% on Co/Kieselguhr at 0.8 h. However, it was less selective in the HDO reactions (Fig. 2.9). Indeed, Co/Kieselguhr produces very high yield in CH4 at high XHDO%, whereas Fe/SiO2 gives a high HDO conversion with little hydrogenation of aromatic ring.

54
Figure 2.9. Carbon yield (see Eq. (1)) of (a) benzene + toluene (goal products) and (b) methane (undesired products) as a function of HDO conversion for a range of WHSV (see Table 2.1) at 673 K
obtained with Fe/SiO2 and Co/Kieselguhr.
In order to compare the performance of the catalysts, the Van Krevelen [43] diagram was modified using equations 2.3 and 2.4 (Fig. 2.10). When Co/Kieselguhr is used, the hydrogenation of carbons happens with C-O bonds scissions. Consequently, hydrogen and carbon are consumed to produce the undesired methane. When Fe/SiO2 is used, the diagram clearly shows that the reaction is much more directed towards the desired route and oxygen atoms are cleaved from aromatic ring without a massive hydrogenation of carbon atoms.
Figure 2.10. Van Krevelen diagram of products (H/C* and O/C* where calculated by Eqs. (2.3) and
(2.4), respectively) (Fe/SiO2 and Co/Kieselguhr: 673 K, 0.9 bar H2, 1/WHSV 0.11–1.50 h).
2.3. Discussion It is difficult to compare our result with literature data since publications on guaiacol
HDO in the gas phase are scarce and sometimes made from a different purpose than the gas-phase HDO of lignin vapors into BTX. Literature data are presented in Table 2.4.

55
Table 2.4. Comparison between HDO results from literature.
Catalyst Molecule 1/WHSV
(h) T
(K) P
(atm) Gas concentration Products XHDO
% BTX yield Refs.
Fe/SiO2 Guaiacol 1.5 673 1 1% GUA; 9% Ar; 90% H2
Benzene, Phenol, Anisole, Cresol, Toluene, CH4
74% 38% This work
Pt-Sn/CNF Guaiacol
and anisole
3.2 673 1 0.6% GUA; 82.5 %N2; 16.9% H2
Benzene, phenol, cresol, toluene,
methane, catechol 85% 60% [11]
Ni2P/SiO2 Guaiacol 20.2 573 1 0.024% GUA; 80% H2, N2 rest
Benzene, Phenol, Anisole 64% 60% [14]
CoMo/ZrO2 Guaiacol 0.06 573 40 0.0675% GUA;
0.01% H2S, 99.92% H2
Phenol; benzene, methanol, catechol 28%* 7% [15]
Pt/Alumina Guaiacol 0.1 573 1.4 3% Guaiacol, 29% H2, 68% N2
Phenol, dimethoxybenzene, anisole, benzene,
toluene
<13% <10% [69]
Ni/SiO2 Phenol 0.56 573 1 9% PhOH; 36.4% MeOH; 54.4% H2
Benzene, cyclohexane, cyclohexene,
cyclohexanone
99% 99% [9]
Pd/CeO2 Phenol 46.2 453 1 11.1% PhOH;
22.2% Ethanol; 66,7 H2
Cyclohexanone, cyclohexanol 0% 0% [94]
Pt/Hbeta (zeolite) Anisole 0.4 673 1 2% Anisole, 98%
H2 Benzene, toluene,
xylene 100% 85% [12]
Zhao et al. [14] obtained remarkable results: high BT yield (60%) at high HDO conversion (64%) using nickel phosphide. However, the optimal reaction temperature was 573 K, much lower than lignin vapors temperature. It would be interesting to analyze the performance of these catalysts at typical lignin pyrolysis vapors temperatures (673–873 K). One expects that methane production could become important on nickel-based catalyst at these temperatures.
In addition (i) the contact time was much higher (20 h) than the one used in this study (1.5 h) and (ii) the concentration of guaiacol was also very low (0.024 vol.%) as compared to the concentration used in this study (1 vol.%). One has also to get in mind that nickel phosphides are expensive minerals (relative to iron) and environmentally unfriendly. Recently, Gonzalez-Borja et al. [11] tested Pt-Sn catalysts under experimental conditions close to ours. They obtained a 60% yield in BT at XHDO% of 85%. The results are very interesting but Pt is a much more precious metal than iron. The deep work of Bui et al. [15,16] was inspired by catalyst already proved for petroleum hydrotreatment. Unfortunately, performances obtained on CoMoS catalysts were not that expected: the HDO conversion (28%) was ~2.5 lower than in our study and the BTX yield very poor (7% against 38%) at the

56
reaction temperature of 573 K. Nevertheless, experiments were carried out at conditions of co-feeding of biomass with fossil raw materials and on a long time on stream (40 h).
We also examined the few literature data on the catalytic gas phase hydrotreatment of phenol, the key intermediate in the studied reaction. Phenol is a solid at room temperature. Consequently many authors dissolved it in order to pump it. Shin and Keane [9] investigated the influence of nickel loadings on the hydrogenation of phenol (dissolved in methanol or water) at 573 K. They found that ring hydrogenation is catalyzed at low nickel loads but HDO to benzene is favored by high nickel loadings (20wt.%) (Table 2.4). The important result is the remarkable yield in benzene of 99% at 573 K. However, such performances were obtained at temperatures lower than the temperature of lignin vapors (673 K) and moreover by using methanol as an additive in the reactant flow (9% phenol; 36% methanol). Experiments reported clearly the important role of methanol additive in the reaction rates and products distribution [9], with and without hydrogen.
Ethanol was used instead of methanol in the hydrogenation of phenol over Pd/CeO2 catalysts at 473 K by Velu et al. [94]. In this example, the catalysts unfortunately were totally selective to ring hydrogenation (cyclohexanone, cyclohexanol). Almost no HDO products were detected. Water was used by Shore et al. [95] with Pd and Pd-Yb silica supported catalyst. They also obtained ring hydrogenation products.
The reactivity of anisole, the second important intermediate in hydrogenation of guaiacol, has also to be discussed. Anisole HDO was investigated by Zhu et al. [12] on Pt supported on SiO2 and HBeta zeolite at 673 K. They attained a BTX yield of 85% at XHDO of 100% on Pt/HBeta zeolite. The formation of toluene and xylene is explained by anisole transalkylation. This finding is consistent with guaiacol transalkylation to methyl catechol observed in this work and by Nimmanwudipong et al. [69] on Pt/Al2O3. Transalkylation is thought to be catalysed by acid sites [30].
The Fe/SiO2 system seems well suitable to the HDO of guaiacol at the reaction temperature of lignin pyrolysis vapors: high HDO conversion, fairly good yield in BTX, low aromatic ring hydrogenation and low coke deposit. As proposed in the introduction, iron is a poor hydrogenating metal towards the aromatic ring as compared to nickel or precious metals [17,18]. Silica is poorly acidic as compared to alumina [75] or some zeolites [96] and consequently lowers coke deposit from oxygenated aromatic hydrocarbons conversion [9,75].
For the hydrogenation of hydrocarbons species on metal supported catalysts, it is admitted that the reaction occurs on the support at the metal–support interface or in the vicinity of the metal particle. The substrate molecule adsorbed on acidic sites is hydrogenated by spilt-over H-species originating from the H2 molecule dissociated on the metal particles [70,71,97,98]. With phenols-type compounds, there is a competition between the hydrogenation of the C-C aromatic bonds and the hydrogenolysis of C-O external bond. The competition can be controlled by the mode of adsorption of the phenolic molecules [15].
The interaction between phenolic compounds and silanol groups present on silica was deeply studied by means of infrared spectroscopy [19]. This study shows that the surface
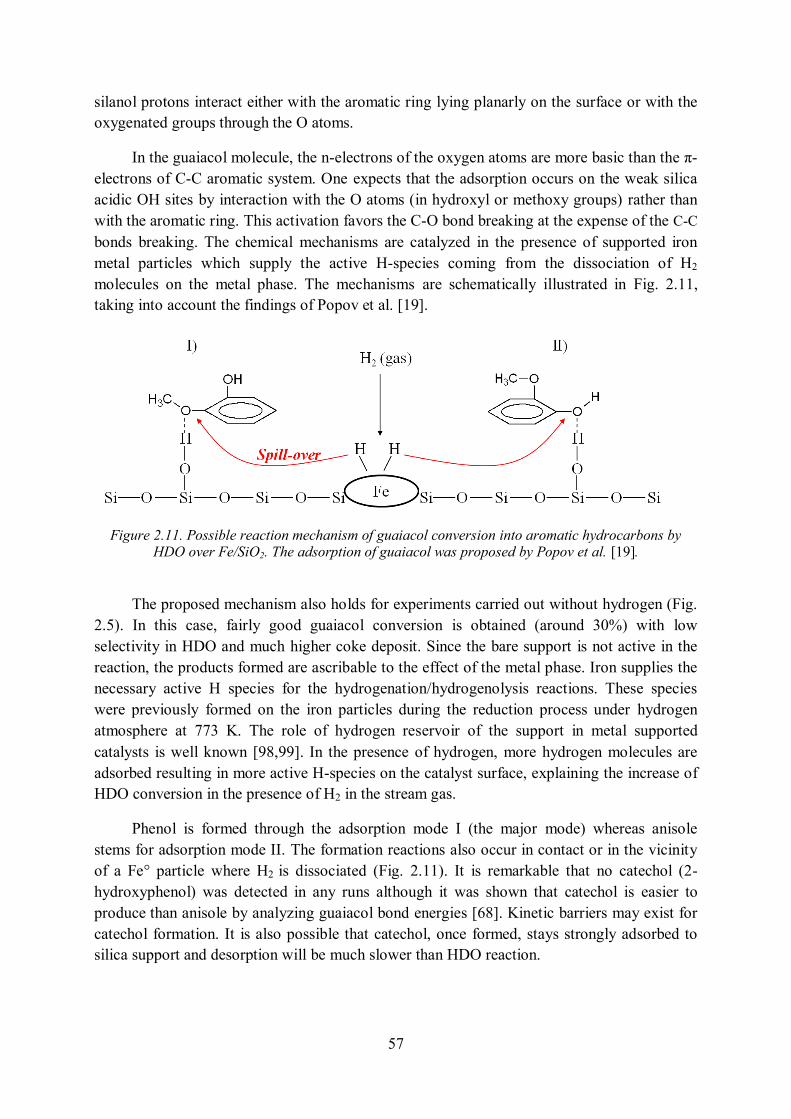
57
silanol protons interact either with the aromatic ring lying planarly on the surface or with the oxygenated groups through the O atoms.
In the guaiacol molecule, the n-electrons of the oxygen atoms are more basic than the π-electrons of C-C aromatic system. One expects that the adsorption occurs on the weak silica acidic OH sites by interaction with the O atoms (in hydroxyl or methoxy groups) rather than with the aromatic ring. This activation favors the C-O bond breaking at the expense of the C-C bonds breaking. The chemical mechanisms are catalyzed in the presence of supported iron metal particles which supply the active H-species coming from the dissociation of H2 molecules on the metal phase. The mechanisms are schematically illustrated in Fig. 2.11, taking into account the findings of Popov et al. [19].
Figure 2.11. Possible reaction mechanism of guaiacol conversion into aromatic hydrocarbons by HDO over Fe/SiO2. The adsorption of guaiacol was proposed by Popov et al. [19].
The proposed mechanism also holds for experiments carried out without hydrogen (Fig. 2.5). In this case, fairly good guaiacol conversion is obtained (around 30%) with low selectivity in HDO and much higher coke deposit. Since the bare support is not active in the reaction, the products formed are ascribable to the effect of the metal phase. Iron supplies the necessary active H species for the hydrogenation/hydrogenolysis reactions. These species were previously formed on the iron particles during the reduction process under hydrogen atmosphere at 773 K. The role of hydrogen reservoir of the support in metal supported catalysts is well known [98,99]. In the presence of hydrogen, more hydrogen molecules are adsorbed resulting in more active H-species on the catalyst surface, explaining the increase of HDO conversion in the presence of H2 in the stream gas.
Phenol is formed through the adsorption mode I (the major mode) whereas anisole stems for adsorption mode II. The formation reactions also occur in contact or in the vicinity of a Fe° particle where H2 is dissociated (Fig. 2.11). It is remarkable that no catechol (2-hydroxyphenol) was detected in any runs although it was shown that catechol is easier to produce than anisole by analyzing guaiacol bond energies [68]. Kinetic barriers may exist for catechol formation. It is also possible that catechol, once formed, stays strongly adsorbed to silica support and desorption will be much slower than HDO reaction.

58
Bronsted acid sites are also responsible of transalkylation [96]. Methyl catechol (di-hydroxy methyl benzene) was detected in some runs. It can be produced by transalkylation of guaiacol [69]. Further HDO of methyl catechol explains the formation of cresols and toluene.
2.4. Conclusion of Chapter 2 Fe/SiO2 was shown to be an active and selective catalyst for the conversion of guaiacol
into aromatic hydrocarbons at temperatures as high as 673 K matching with the temperature of never condensed lignin pyrolysis vapors. Hydrogen partial pressure (0.2–0.9 bar) affects product distribution only slightly. Temperature (623–723 K) accelerates reaction rate without big changes in the selectivity. The lower activity of Fe/SiO2 compared with Co-based catalyst is offset by a higher HDO selectivity on a wider range of temperature. Moreover, Fe/SiO2 produces less methane than the commercial cobalt-based catalyst even at high HDO conversions. Fe/SiO2 could be a more versatile catalyst easier to be operated in catalytic reactors. It has also the advantage of being inexpensive and environmentally friendly. It could be a potential catalyst for lignin to BTX production process by lignin fast pyrolysis followed by HDO of the vapors. HDO conversion of 74% and BT yield of 38% was achieved in the best investigated conditions.
Works are still needed to investigate the effect of other gases and tars generated by lignin pyrolysis and to optimize this catalyst. The commercial application of lignin to BTX processes will depend on the development of suitable technologies for lignin conversion and vapors catalytic up-grading and on the evolution of BTX prices nowadays produced from crude oil.

59
Chapter 3 Gas-phase hydrodeoxygenation of guaiacol over iron-based catalysts. Effect of gases composition, iron load and supports (silica and activated carbon) The content of this chapter was submitted to Applied Catalysis B (under revision).
Abstract Guaiacol is used as a model compound to study the conversion of lignin pyrolysis
vapors into aromatics (benzene, phenols), but other gases are present in lignin pyrolysis vapors. The effect of each individual gas present in a pyrolysis gas (H2, CO, CO2, H2O, CH4) on the selectivity of a 10wt.%Fe/SiO2 catalyst is studied (673K, atmospheric pressure 1/WHSV=0.6 gcat.h/ggua). Then a mixture of guaiacol, H2, H2O, CO and CO2 was prepared to mimic lignin pyrolysis vapors, and reaction was tested at high HDO conversion with 15%Fe/SiO2 and Fe/AC catalyst. TEM, Mössbauer, XRD and TPO were used to characterize catalysts.
3.1. Experimental
3.1.1. Catalyst preparation Iron over silica (Fe/SiO2) catalyst was prepared by simple impregnation [44]. 7 g of
silica (Aerolyst 3039, Degussa; grounded and sieved 63-250 µm) were contacted with 21 ml of an iron nitrate nonahydrate (Sigma) solution in deionised water. The mixture was exposed to vacuum at room temperature for 3 hours, and then dried 24 hours at 373 K. The resulting impregnated solid was re-grounded and sieved (63-250 µm), and then treated under Argon flow (50 Nml/min) with temperature increasing from 298 K to 773 K at 5 K/min and hold at 773 K for 1 hour. The amount of iron nitrate nonahydrate diluted on water was tailored to reach 5, 10 and 15 wt.% Fe on the reduced catalyst. Iron loadings were checked by elemental analysis and calculated assuming that Fe2O3 (given by the elemental analysis) is completely reduced. 4.9, 9.5 and 14.7wt% of iron loads (if assumed reduced) have been quantified. Iron over carbon catalyst was prepared by the same method, but using activated carbon NORIT RX-3 “Extra” as support.
The argon-treated catalyst was reduced in-situ by pure H2 (50 ml/min) before guaiacol HDO. Temperature was increased from 298 K to 773 K at a rate of 5 K/min, then hold 773 K during 1 hour. The reactor feed was then changed to hydrogen-argon mix at desired flows and H2 molar fraction. The temperature was set to 673 K (reaction temperature). After a stabilisation time (50 min), guaiacol syringe pump, water syringe pump and/or other gases (CO, CO2, CH4) mass flow controllers were turn on. The start of the catalytic run was considered from guaiacol injection.
Fresh passivated catalysts were also prepared for further analysis. 200 mg of argon-treated catalyst were placed in a fixed bed reactor and flowed with 50 Nml/min of H2. Temperature was raised from 298 K to 773 K at a rate of 5K/min, then hold at 773 K for 1h. Sample was then left to cool to room temperature (293 K) under 50 Nml/min of Argon. Gas inlet was switched to 50 Nml/min of a mixture of 100 ppm of O2 in Argon and this condition

60
was maintained for 1h before exposing the catalyst to air. Otherwise, the reduced non passivated material was highly pyrophoric. However, used catalysts for HDO reaction did not show pyrophoric character, and they were analyzed without passivation.
3.1.2. Catalytic runs The experimental set-up was previously presented in Chapter 2. The only difference is
that products are analyzed on-line. Guaiacol was purchased from Sigma Aldrich. Ar and H2 were purchased from Messer, CO, CO2 and CH4 from Air Liquide. Ar, H2, CH4, CO and CO2 were introduced by five Mass Flow Controllers (Bronkhorst). Guaiacol and water were injected by means of two syringe pumps. All runs were made on a fixed-bed catalytic reactor. The conditions for all runs were P = 1-1.1 bar, T= 673 K, Fv=40 Nml/min (total volume flow rate), particle size 63-250 µm. All runs lasted 187 min, and the concentration of aromatics reactants and products were analyzed 5 times along time on stream (each 42 minutes). Low conversion experiments were made in a 4 mm i.d. quartz tube where 48-154 mg of catalyst were handled between two plugs of quartz wool. High HDO conversion experiments were made in 8 mm i.d. pyrex tube where 1000-1200 mg of catalyst were fixed between wool plugs. Products were piped (at 483 K to avoid condensation) to a 6 ways sampling valve (at 508 K) with a loop connected to a Gas Chromatograph (Varian 3800) equipped with a DB-1701 column (60m, ID 0.25 mm, 0.25µm, cyanopropylphenyl -14% / dimethylsiloxane – 86%) and a FID detector. The sample in the heated loop was injected with a split ratio of 20. Injection temperature was 250°C and GC furnace temperature program: heating from 60°C to 155°C at 6°C/min; then from 155°C to 175°C at 2°C/min; then from 175°C to 270°C at 10°C/min and hold 1 min at 270°C. This chromatographic method allows a good separation of products and a relative fast elution (42min between each analysis including cooling) for on-line analysis. Relative response factors were calculated from standard mixtures by means of liquid injection, with very good reproducibility (relative standard deviation of 3 injections lower than 5% for each product). The absolute response of the on-line sampling system was measured by injecting guaiacol and methanol into the reactor without catalyst at 623 K and under argon flow (blank test). The areas of guaiacol (for blank test) showed a standard deviation of 8 % for ten GC-FID analysis with the sampling loop.
The exit gases from the sampling valve was connected to a first glass bubbler filled by 2-Propanol at 273 K and then to a second bubbler at 213 K to protect the µGC from condensable heavy products. Incondensable products (methane, ethane, CO, CO2, etc.) were analyzed on-line with a µGC-Varian 490 described in Chapter 2.
In our reaction conditions, guaiacol conversion without catalyst was not detected, and catalytic reaction rates are chemically controlled (see Chapter 2 and Annex 1 or [44] for more details).
3.1.3. Characterization of the fresh passivated and spent catalysts The load in iron of catalysts was checked by ICP-MS analysis (CNRS-SARM
procedure [86]).The samples have been analyzed by conventional X-ray powder analysis (XPERT Pro Cu Kα) and the crystal structures have been refined using the Fullprof software [87]. The 57Fe Mössbauer measurements were carried out using a constant-acceleration
61
spectrometer in standard transmission geometry with a 57CoRh source (25 mCi). Spectra were recorded at 300 K. A polycrystalline absorber with natural abundance of 57Fe isotope and thickness of ~ 15 mg.cm-2 was used. The Mössbauer spectra were fitted with a least-squares method program assuming Lorentzian peaks.
Temperature Programmed Oxidation (TPO) was performed on a 4 mm i.d. quartz tube. Between 30-40mg of sample were placed between two quartz wool plugs and flowed by air (50 Nml/min). Temperature was increased from 293 to 1023 K at 5 K/min. Produced carbon dioxide was measured on-line by the µGC. Carbon monoxide was not detected.
Transmission electron microscopy (TEM) imaging was performed with a Philips CM20 (200 kV) microscope, equipped with an EDXS spectrometer.
3.1.4. Evaluation of catalytic runs For all runs, the aromatic ring balance (aromatic ring in analyzed product/aromatic ring
injected from guaiacol) was between 75-95% (mol based), depending on coke deposition conditions. For blank test, guaiacol molar balance was between 95 and 104%.
Yield of products (Yi) was calculated using Equation 3.1, where Ci is the molar percentage of the product i and X is the conversion of guaiacol. C°gua is the initial molar percentage of guaiacol, and was equal to 1%mol for all runs.
gua
0
gua
ii
XC
)mol(%C(%)Y (3.1)
The total amount of guaiacol converted on a 187 min experiment was calculated by integration of the five (along time on stream) GC-FID on-line analysis. Weighted mass of oxidized catalyst is used to calculate 1/WHSV. However, the weighted catalyst is Fe2O3/SiO2. Considering the loss of oxygen atoms due to reduction, a correction factor must be added to calculate the exact mass of catalyst in the reactor (in the worst case of 15wt.%Fe/SiO2 the correction factor is 0.96).
The size of iron particles supported on silica and activated carbon was measured by TEM images. For passivated and used catalyst, 3 images were selected and 10-15 particles were measured manually for each image and all results were averaged. The iron available surface was calculated considering full exposed perfect spheres of regular diameter. We are aware that it is needed to count more particles to get a precise size distribution of particle diameter, but the agreement between TEM and XRD is reasonable.
For the TPO experiment, the raw CO2 molar fraction was treated as follows. Initial CO2 molar fraction in air (0,038%) and baseline were subtracted. The resulting data contained negative points that were replaced by zero. Finally, the CO2 flow data was integrated numerically (Equation 3.2) to calculate coke mass fraction (%w) on spent catalyst. Then it was referred to initial mass of catalyst of the catalytic run to calculate coke yield. A numeric example is presented in Annex 3.

62
100%
1..).()(
2
2
2
/
/
CokeTPOspentSiOFe
runCatfreshSiOFe
TPOCOvrunCat
depositCarbon wW
WCFµmoln (3.2)
3.2. Results
3.2.1. Characterization of fresh passivated catalysts In Chapter 2, a 130 m2/g silica (Aerosil 130) was used. On this chapter we tried a 250
m2/g silica (Aerolyst 3036) to enhance the catalyst formulation. Initial BET specific surface area of silica was 250 m2/g. However, measured specific surface area of the impregnated catalyst (without reduction) was about 144 m2/g. Textural structure of silica is clearly modified by the method of catalyst preparation.
Table 3.1 and figure 3.1 display the Mössbauer and XRD characterizations of fresh - passivated and used catalysts. Only the composition of the fresh catalysts is discussed in this section.
The XRD pattern of the fresh passivated 10%Fe/AC catalyst essentially shows the diffraction peaks corresponding to -Fe (Figure 3.1-a) and some very large diffusion peaks. The corresponding Mössbauer spectrum exhibits the characteristic sextuplet of -Fe (with line widths of 0,4-0,6 mm/s corresponding to small particles ~15 nm and a proportion area of 35%, table 3.1) and a central doublet with hyperfine parameters of about IS = 0.3 mm/s, QS 0.9 mm/s assigned as Fe3+ species (Table 3.1). Mössbauer spectra and fits are discussed in Annex 4. Galuszka et al. [100] found also this signal in Fe/SiO2 catalyst and proposed that this may be caused by very little particles of hematite (α-Fe2O3; < 13 nm) and/or lepidocrocite γ-FeOOH. They explain the presence of this oxidized iron forms as a consequence of the passivation process and exposure to humid air. It is worth noting that we observe the presence of this doublet (with various intensities) in all the five studied samples, the linewidth of this Fe3+ doublet going from 0,5-0.85 mm/s.
The XRD pattern of the fresh passivated 15%Fe/SiO2 is totally indexed as -Fe and magnetite Fe3O4 (Figure 3.1-b). The corresponding Mössbauer spectrum is in fair agreement with these conclusions. Nevertheless, very broad peaks, at the highest velocities, and a large doublet, in the central part, complete the spectrum. The external peaks correspond to ordered magnetites with various grain sizes [101] and the central doublet to Fe3+ species as previously observed in the 10%Fe/AC catalyst sample (Table 3.1). However, this fit could not explain the whole observed absorption area, and the difference was ascribed as superparamagnetic particles of magnetite [102].
-Fe remains the major iron species (on a molar basis, table 3.1) in both fresh passivated catalysts.

63
Table 3.1. Mössbauer hyperfine parameters of different catalysts *Calculated by difference. Mössbauer spectra and fits are discussed in Annex 4. Assuming the
Lamb Mössbauer factor effect similar for all species. Mole fractions of species were calculated assuming Fe3+ as Fe2O3 and Superpara as Fe3O4.
Catalyst Species IS (mm/s) QS (mm/s) H (kG) Area (%) Molar
percentage of species (%mol.)
10%Fe/AC, fresh and passivated.
-Fe 0 0 330 35 60.6 Fe3+ 0.34 0.92 0 65 39.4
15%Fe/SiO2, fresh and passivated.
-Fe 0 0 331 42 71.0 Fe3+ 0.35 0.9 - 29 17.1
Fe3O4 ~0.3 ~0 465 20 8.2 Superpara - - - 9* 3.7
10%Fe/SiO2, Gua+H2+CO+CO2+H2O high benzene yield
-Fe 0 0 329 18 48.2 Fe3+ 0.37 0.95 - 12 11.2
χ-Fe5C2 0.25 0.09 210 30 14.8 χ-Fe5C2 0.2 0.06 190
χ-Fe5C2 0.22 0.08 116 Superpara 40* 25.8
10%Fe/SiO2, Gua+H2+CO
Fe3+ 0.3 0.9 - 28 42.5 χ-Fe5C2 0.25 0.09 209
72 57.5 χ-Fe5C2 0.2 0.06 183 χ-Fe5C2 0.22 0.08 109
10%Fe/SiO2, Gua+H2+CO2
-Fe 0 0 329 26 59.6 Fe3+ 0.37 0.95 0 24 19.2
χ-Fe5C2 0.25 0.09 210 50 21.1 χ-Fe5C2 0.2 0.06 183
χ-Fe5C2 0.22 0.08 110

64
Figure 3.1. XRD patterns and 57Fe Mössbauer spectra (recorded at 300K) : a) Fresh and passivated 10%Fe/AC; b) Fresh and passivated 15%Fe/SiO2; c) 15%Fe/SiO2 from high conversion experiment (Gua+H2+CO2+CO+H2O, see text for conditions); d) 10%Fe/SiO2 from Gua+H2+CO; e) 10%Fe/SiO2 from Gua+H2+CO2. Dotted line represents Fe3+ species.

65
Figure 3.2. TEM analysis of a ,b and c) 15% Fe/silica fresh passivated catalyst, d) of 10% Fe/AC
fresh passivated catalyst
Passivated fresh catalysts were characterized by TEM (Figures 3.2 a-d). Table 3.2 summarizes the result of particle size analysis. It is observed that iron particles are mainly spherical, and that silica has a colloidal structure. The average iron particle size on silica shows little deviations for the three silica loads. On the other hand, TEM micrographs showed clearly that activated carbon-supported iron particles are bigger than silica-supported ones, probably due to different surface oxygen functionalities on activated carbon that leads to a more hydrophobic support than silica and reduces catalyst dispersion [103].
Crystallite average size was calculated using Scherrer’s equation at 2θ=44.7° peak. It yielded 17 nm for 15%Fe/SiO2 catalyst and 20 nm for 10%Fe/AC. For 15%Fe/SiO2, TEM and XRD particle size consistency is reasonable. However, the 10%Fe/AC crystallite size deduced from XRD was lower than that observed by TEM. It is possible that iron is supported on carbon as agglomerates.

66
Table 3.2 Characterization results of fresh catalyst from TEM and XRD analyses. *Based on Scherrer’s equation at 2θ=44.6° (K=0.9).
Catalyst Iron particle size (nm)
Crystallite size from XRD* (nm)
5%Fe/Silica 13 Not analyzed
10%Fe/Silica 18 Not analyzed
15%Fe/Silica 14 17
10%Fe/AC 29 20
3.2.2. Hydrogenation of CO and CO2 without guaiacol Before performing guaiacol hydrotreating tests in the presence of different gases, the
activity of 10%Fe/silica catalyst on CO2 and CO hydrotreatment was evaluated. Figures 3.3 and 3.4 show experimental data for these reactions. Results are in agreement with literature for CO [104] and CO2 hydrogenations [105].
Figure 3.3. Conversion and products of CO2 hydrogenation at 673 K, 1 atm, 5%mol. CO2, 50% H2, 80mg of 10%Fe/SiO2.
Figure 3.4. Conversion and products of CO hydrogenation at 673 K, 1 atm, 5%mol. CO, 50% H2 , 80mg of 10%Fe/SiO2.
When CO2 was the reactant, CO was the major product from CO2 hydrogenation (reverse water-gas shift: CO2+H2 = CO+H2O). For both CO and CO2 (in H2), methane was the most important hydrocarbon product. Ethane and ethylene were also detected (from the methanation reactions). These reactions are not desirable, since they consume hydrogen uselessly and they produce carbon deposits on the catalyst.
Since CO2 hydrogenation produced mainly CO, the reactivity of CO+H2 on 10%Fe/SiO2 was studied on the same conditions. When CO was the reactant, the CO conversion diminished drastically in the first minutes of reaction, and considerable amounts of carbon deposit were analyzed by TPO. CO2 is produced probably from CO dismutation [104]. CO conversion (in H2) decreases drastically whereas CO2 conversion (in H2) is more stable. CO conversion could lead to a faster deactivation of the catalyst than CO2. The effect of CO
% m
ol
% m
ol

67
and CO2 on the composition of the catalyst and its deactivation is discussed in the following section.
3.2.3. Individual effect of CH4, H2O, CO2 and CO on guaiacol HDO and used catalysts composition
SiO2 without iron was inactive for guaiacol conversion (100mg, 1%Gua, 50% H2 rest Ar). Activated carbon (without iron) showed a very low activity (100mg, 1%Gua, 50% H2 rest Ar, Xgua<5%). Fe2O3/SiO2 showed very low activity (100mg, 1% Gua, 50% H2, 5%CO2, 2%CO, 2%H2O, rest Ar, 673K, Xgua<5%). The composition of reactant mixture was chosen to mimic real lignin pyrolysis vapors [43].Guaiacol conversion was studied with a higher H2/H2O ratio of 20%mol. H2/10%mol.H2O at 673K (rather than 50%mol. H2/5%H2O) on the pre-reduced catalyst. Under these conditions α-Fe is converted to Fe3O4. No conversion of guaiacol was detected on this oxidized catalyst. Benzene or toluene (the desired products) were never detected during all these experiments.
In order to clarify the role of each gas on the reaction, experiments were conducted on 10%Fe/silica catalyst with 50%mol of H2, 1% guaiacol, 5% of each (CH4, H2O, CO or CO2) and rest Ar. Figure 3.5 shows the conversion of guaiacol vs. time on stream for different gases composition. For guaiacol conversion under H2 (50%mol.,rest Ar), 100% of guaiacol conversion is seen at the beginning of the run followed by a quick deactivation. As expected, the addition of CH4 (Gua+H2+CH4 in Figures 3.5 and 3.6) leads to similar results. CH4 has very few chemical effects on this reaction.
Figure 3.5. Effect of gases on guaiacol conversion. (T=673K, P=1 atm, 50%mol. H2, 1% guaiacol, 5% extra gas (CH4, H2O, CO or CO2) on 80mg of 10%Fe/SiO2
Figure 3.6. Effect of gases on molar yield. (T=673K, P=1 atm, 50%mol. H2, 1% guaiacol, 5% extra gas (CH4, H2O, CO or CO2) on 80mg of 10%Fe/SiO2. Gases and coke yield are calculated by difference.
CO and H2O slow down the reaction rate (figure 3.5) at the beginning of the run probably due to a fast deactivation of the catalyst (from CO dismutation) and/or by sorption competitions on active sites. From 100 minutes time on stream, the conversion of guaiacol is similar with H2 only or CO, H2O or CH4 (in H2). In the case of Gua+H2+CO2 we observed high initial conversion, comparable to Gua+H2 experiment, but the deactivation of the catalyst
0
20
40
60
80
100
Gua+H2 Gua+H2+CH4 Gua+H2+H2O Gua+H2+CO Gua+H2+CO2
Gases+coke
Anisole
Catechol
Cresol
PhOH
BT
Yie
ld (
%m
ol)
0
20
40
60
80
100
0 50 100 150
CO2
CO
CH4
No extra gas
H2O
Time on stream (min)
Xgu
aiac
ol (
%)
Gua+H2+CO2
Gua+H2+CO
Gua+H2+CH4
Gua+H2 only
Gua+H2+H2O

68
is remarkably lower and the integral of converted guaiacol during 3 h increases. Guaiacol conversion is not stabilized after 3h time-on-stream but is always higher than the ones of other experiments in Figure 3.5.
Product yields (i.e. moles of i produced by mole of guaiacol converted) showed minor deviation upon time on stream (except for the high HDO conversion experiment, see Fig. 3.11). Figure 3.6 shows the time-average yield of products from guaiacol conversion as a function of gas composition. TPO profiles of used catalysts are shown in Figure 3.7. Table 3.3 displays the integral of CO2 produced during TPO (g carbon deposit / 100g of catalyst). In figure 3.6, coke and gases cannot be plotted in terms of yield (per guaiacol converted, equation 1) because they can be produced from other species than guaiacol (CO, CO2, etc.).
The presence of H2O seems to reduce phenol conversion to benzene and toluene, and considerable amounts of catechol were produced (figure 3.6). Moreover, the lack in %mol during Gua+H2+H2O run (figure 3.6) should be attributed to non identified peaks on GC-FID, rather than gases and coke. Indeed, low carbon deposit was produced in the H2O polluted experiment (table 3.3). A GC-MS analysis of the solution recovered in the bubblers after the on-line sampling loop showed several aromatic compounds with two oxygen atoms like methyl di-hydroxy-benzene, methyl guaiacols and di-methoxy-benzene. The addition of other gases than H2O leads to a lower effect in product selectivity (figure 3.6).
Two or three peaks (570-600K, 630-670K and 730-760K) are evidenced on figure 3.7 (normalized TPO profiles) depending on gas composition. The low-temperature peak (570-600K) seems to be related to guaiacol conversion because this peak is not seen with CO+H2 mixture (without guaiacol) (Figure 3.7). Gua+H2 showed similar profiles as Gua+H2+CH4 and Gua+H2+CO2 runs (Fig. 3.7) producing about the same C yield of coke. The CO2 polluted experiment produced more coke than the reference run (Gua+H2), but carbon yield is similar based on the mole of converted guaiacol. Indeed, integral conversion of guaiacol is higher with CO2+H2 than with H2 alone (Figure 3.5). Gua+H2+CO experiment leads to a very big yield in carbon deposit (table 3.3). If all the iron atoms are converted to carbide, carbon in carbide would be negligible compared with carbon deposit.
The potential origins of the TPO peaks are discussed in the discussion section.
Table 3.3. Result from integration of TPO curves for the conversion of guaiacol, CO and CO2 at 673K, 1 atm, 80 mg 10%Fe/SiO2.
Experiment g C/ 100 g used catalyst %C yield mol Ccoke/mol Cgua converted CO+H2 23 - Gua+H2 10 5.7
Gua+H2+CH4 11 7 Gua+H2+H2O 4 4.5 Gua+H2+CO 19 21.7 Gua+H2+CO2 13 5.8

69
Figure 3.7. TPO profiles of 10%Fe/SiO2 catalyst used in guaiacol HDO (except for
CO+H2) for 3h (1/WHSV=0.6 gcat.h/ggua, 50%H2, 5% of H2O, CO2, CH4 or CO). a) low temperature peak or shoulder, b) middle temperature peak or shoulder, c) high
temperature peak or shoulder.
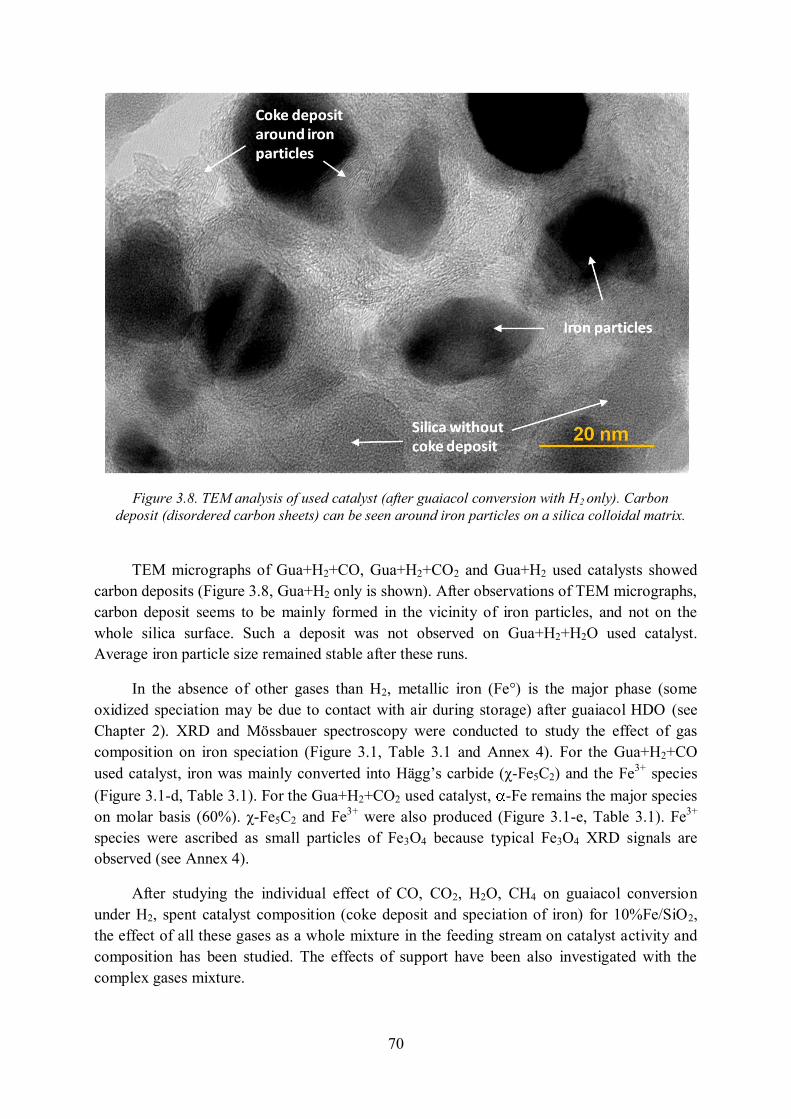
70
Figure 3.8. TEM analysis of used catalyst (after guaiacol conversion with H2 only). Carbon deposit (disordered carbon sheets) can be seen around iron particles on a silica colloidal matrix.
TEM micrographs of Gua+H2+CO, Gua+H2+CO2 and Gua+H2 used catalysts showed carbon deposits (Figure 3.8, Gua+H2 only is shown). After observations of TEM micrographs, carbon deposit seems to be mainly formed in the vicinity of iron particles, and not on the whole silica surface. Such a deposit was not observed on Gua+H2+H2O used catalyst. Average iron particle size remained stable after these runs.
In the absence of other gases than H2, metallic iron (Fe°) is the major phase (some oxidized speciation may be due to contact with air during storage) after guaiacol HDO (see Chapter 2). XRD and Mössbauer spectroscopy were conducted to study the effect of gas composition on iron speciation (Figure 3.1, Table 3.1 and Annex 4). For the Gua+H2+CO used catalyst, iron was mainly converted into Hägg’s carbide (χ-Fe5C2) and the Fe3+ species (Figure 3.1-d, Table 3.1). For the Gua+H2+CO2 used catalyst, -Fe remains the major species on molar basis (60%). χ-Fe5C2 and Fe3+ were also produced (Figure 3.1-e, Table 3.1). Fe3+ species were ascribed as small particles of Fe3O4 because typical Fe3O4 XRD signals are observed (see Annex 4).
After studying the individual effect of CO, CO2, H2O, CH4 on guaiacol conversion under H2, spent catalyst composition (coke deposit and speciation of iron) for 10%Fe/SiO2, the effect of all these gases as a whole mixture in the feeding stream on catalyst activity and composition has been studied. The effects of support have been also investigated with the complex gases mixture.

71
3.2.4. Effect of catalyst type (iron load and support) on guaiacol HDO in the presence of a model lignin pyrolysis gases
Figure 3.9. Effect of support and iron load on guaiacol conversion. (T=673K, P=1 atm, 50% H2, 5% CO2, 2% CO, 2% H2O, 1% Guaiacol, rest Argon)
Figure 3.10. Effect of support and iron load on yield. (T=673K, P=1 atm, 50% H2, 5% CO2, 2% CO, 2% H2O, 1% Guaiacol, rest Argon)
Nominal reactant mixture contained 50% H2, 5% CO2, 2% CO, 2% H2O, 1% Guaiacol, and rest Argon and is referred as “Gua + H2 + CO2 + CO + H2O”. These proportions were chosen in order to mimic the real gas composition from lignin pyrolysis. In the study of the effect of individual gases, the same molar fraction (5%mol.) was used for both gases for a more rational comparison. This led of course to an overestimation of the effect of CO or H2O when set at 2% in the gas mixture which mimics the real gas.
The four experiments with 3 different iron loads on silica (5, 10, 15%wt.) and 10%Fe over activated carbon (Figure 3.9 and 3.10) were made with different mass of catalyst, but with the same iron surface (0.3 m2 of iron) calculated from TEM images.
Figure 3.9 shows the conversion of guaiacol on different catalysts. Only minor differences on guaiacol conversion as a function of time on stream can be seen for the 4 catalysts. Thus, under the tested conditions, guaiacol conversion is roughly proportional to the exposed iron’s surface.
Product yields showed only minor deviation along the catalytic run. Figure 3.10 shows the time-average yield of products for the 4 catalysts. The three silica-supported catalysts showed similar yields of aromatic hydrocarbons and phenols. However, carbon-supported catalyst produced almost no benzene and toluene and higher yield in catechol than silica-supported catalysts.
The TPO profiles of the 3 silica-supported used catalysts showed the same pattern integrals values were about 600 µmol C for the 3 runs.
0
20
40
60
80
100
0 50 100 150
10%Fe/Silica
15% Fe/Silica
5% Fe/Silica
10% Fe/AC
Time on stream (min)
X g
uai
aco
l (%
)
0
20
40
60
80
100
5%Fe/silica 10%Fe/silica 15%Fe/silica 10%Fe/AC
Gases+coke
Anisole
Catechol
Cresol
PhOH
BT
Yie
ld (
%m
ol)

72
3.2.5. High HDO conversion experiments The conversion of guaiacol in the gas nominal mixture was studied on 1000 mg of 15%
Fe/silica catalyst and 1200 mg of 10% Fe/AC. For both experiments guaiacol conversion was 100% all over time on stream. High mass of catalyst is needed to get a high selectivity in benzene (see Chapter 2 for more details about reaction pathways). The aim of these experiments is not to study deactivation of catalyst based on guaiacol conversion but to investigate the evolution in benzene and phenol selectivity with time on stream. We previously justified the need of high guaiacol conversion to study benzene yield because one of the limiting step in the reaction network is phenol conversion [17].
Figure 3.11 shows the products concentration upon time on stream for the 15%Fe/silica catalyst. Initially, guaiacol is almost completely converted into Benzene and Toluene. Some important deactivation is observed on the first hour of the run, and then conversion and selectivity are stable during three hours. The goal of these experiments is to study product yield, and not to study catalyst long term deactivation. This result shows that Fe/silica catalyst is active and selective for guaiacol HDO in the gas phase even in presence of H2, CO, CO2 and H2O. The next step of our work will be to test this catalyst on a real lignin pyrolysis gas.
XRD and Mössbauer analyses of this catalyst (Table 3.1, Figure 3.1-c) showed the coexistence of χ-Fe5C2, -Fe, and Fe3+ species identified as small Fe3O4 particles on XRD. The major phase remains -Fe on a molar basis (48%). 40% of the Mössbauer spectrum area remains unexplained. More fundamental research is needed to clarify the oxidation state of iron species on this system. However, we may think that it probably corresponds to different “magnetites” with various grain sizes. Figure 3.12 shows the product from guaiacol HDO on 10% Fe/AC catalyst as a function of time on stream. Guaiacol is hydrodeoxygenated partially to phenol and cresol, but the following reaction from phenol and cresol to benzene and toluene did not happen. The selectivity in phenol and cresols even increases during the first hour and is then well stable.
Figure 3.11. Yield of products from guaiacol conversion on silica supported iron catalyst (1000mg, 7.5gcat.h/ggua 15%Fe/SiO2, T=673K, P=1 atm, 50% H2, 5% CO2, 2% CO, 2% H2O, 1% Guaiacol, rest Argon)
Figure 3.12. Yield of products from guaiacol conversion on carbon supported iron catalyst (1200mg, 9 gcat.h/ggua 10%Fe/AC, T=673K, P=1 atm, 50% H2, 5% CO2, 2% CO, 2% H2O, 1% Guaiacol, rest Argon)

73
3.3. Discussion
3.3.1. Reaction mechanisms The XRD and Mössbauer analysis show that iron may exist in reduced (metallic,
carbidic) or oxidized state (Fe2O3, Fe3O4) as a function of gases composition. The iron carbide is formed due to interaction with carbonaceous surface species. Presence of iron oxides is attributed, not only to passivation and exposure to air during storage but also to deactivation of metallic iron throughout oxidation processes by phenols, water, carbon oxides. The amorphous carbon phase (Fig. 3.8) could also be produced by iron carbide oxidation during passivation or storage [106]. Therefore, catalyst deactivation is believed to be due to both iron oxidation and carbon deposit. The faster deactivation with CO and H2O (figure 3.5) could be due to carburization (high amount of χ-Fe5C2 analyzed in table 3.1) and oxidation respectively. Nevertheless, the catalyst is still active after 3h time on stream even with CO or H2O.
If the gas composition favors the formation of Fe3O4 instead of Fe°, the activity disappears (tested with H2/H2O mixtures). It seems thus more probable that a reduced iron is needed to be active.
The presence of -Fe after 3h (table 3.1) leads to a higher conversion of guaiacol with CO2 experiment (Figure 3.5). Consequently, -Fe would be a more active iron species than χ-Fe5C2. Furthermore, Mössbauer spectroscopy only gives the bulk composition of iron species and not the composition of surface-iron. Iron particles could be in the form of grains with layers of different speciations, H and C species could diffuse through these layers. It is also possible that a metallic core can remain even when the surface is totally oxidized or carburized. Residual -Fe or other speciations could also be present but not detected by Mössbauer (if inferior to about 5%wt.).
In our previous study with Fe/SiO2 (Chapter 2) we proposed a bifunctional catalysis for the gas phase HDO of guaiacol in the presence of H2. Reduced iron phases would be the active phase, the main role of which is to activate H2. The support offers the acid actives sites on which the guaiacol molecule adsorbs and then reacts with H-spiltover species coming from dihydrogen dissociated on the reduced iron sites. The Carom-O linkage (present in guaiacol, phenol, catechol, etc) could be activated via adsorption on silanols as proposed by Popov et al. [19]. This means that the overall reaction rate is controlled by both the stability of the chemisorbed oxygenate species and the rate of the Carom-O bond breaking [107]. The bifunctional mechanism was used in literature to explain other phenolic HDO result [15,20,107–109]. The experiment Gua+H2+CO (Fig. 3.5 and 3.6) linked to Mössbauer spectroscopy (no metallic iron was detected, table 3.1, Fig 3.1-d) suggests that χ-Fe5C2 may also participate in guaiacol HDO mechanism.
Observations of TEM images in this study showed that carbon deposits are formed in the vicinity of iron particles (Figure 3.8). It was never observed on silica colloids without iron in agreement with the finding that the SiO2 is not active without iron. HDO reaction would rather happen in the iron-silica interface where hydrogen dissociated by iron particles contacts

74
phenolic molecules adsorbed on silanol groups of silica. However, guaiacol molecule may adsorb and react also with iron species (without the participation of silica) consistent with the activity of 10%Fe/AC. However silica support seems needed to convert phenol into benzene since 10%Fe/AC experiment produced very little benzene and high phenol yield (Fig. 3.12).
Fe/SiO2-catalysed HDO of guaiacol (that is a set of complex reactions) mainly occurs through the hydrogenolysis of the Caromatic-O bonds in hydroxyl or methoxyl groups. Many other reactions may happen (transalkylation, ring hydrogenation, dehydration, dehydrogenation, etc). Bui et al. proposed a general reaction network for guaiacol HDO, but they found that using CoMoS/ZrO2 catalyst (40 atm, 573K), observed products lead to a network as simple as guaiacol to phenol to benzene. An interesting and complete reaction network was developed and fitted for gas-phase guaiacol HDO on Pt/Al2O3 (1 atm, 573K) by Nimmanwudipong et al. [69].
Transalkylation occurs in our experiments, cresol and/or toluene were produced on every run (always less than phenol or benzene). Ring hydrogenated products were not detected.
Phenol is the main intermediate product in our case and is rapidly formed from guaiacol demethoxylation. A competition between hydrogenolysis of the Caromatic-O bond and hydrogenation of the aromatic ring was studied by Keane and co-workers [9,95]. Hydrogenolysis to benzene was favored by high nickel loadings and elevated temperatures [9].
3.3.2. Effect of gases It should be first noticed that CO and H2O (both in H2) have mainly an effect on the
initial conversion of guaiacol compared with H2 only (figure 3.5) showing an effect on the deactivation rate rather than on long term activity. After 100 minutes time on stream, the conversion of guaiacol is similar for all gases except for CO2. With CO2 (in H2) the conversion is higher but not yet completely stable after 3h time on stream. Longer time on stream experiments are needed to investigate stable conversion with CO2.
A potential competitive route for phenol conversion is the hydrogenation of the aromatic ring followed by dehydration forming a double bond in the ring (cyclohexene derivative) and re-hydrogenation of the double bond to cyclohexane derivatives [13,110]. We never detected cyclohexene or cyclohexane derivatives or any ring hydrogenation products with our iron-based bifunctional catalyst. It was previously shown that iron activity for hydrogenation of the aromatic ring is very low [17,18]. There is also a competition between HDO of phenol to form benzene and H2O (through hydrogenolysis of Caromatic-OH) and decarbonylation to form a C5 species that could be a coke precursor [90].
Water has a negative effect on HDO initial activity and on the selectivity of the catalyst (Figures 3.5 and 3.6). Decreased initial activity could be due to some oxidation of iron active site. It can also be explained through silanols-activation. H2O molecules may compete for silanols adsorption sites and, in the mean time, make the desorption of phenolic molecules faster than HDO of Carom-O linkage. This explains the low conversion and the high yields to
75
catechol and other highly-oxygenated molecules by hydrolysis. Zhu et al. [12,13] found similar results concerning selectivity change to hydrolysis products working on anisole catalytic reactions over zeolites (and Pt/HBeta catalyst). Shin and Keane [9] studied the hydrogenation of phenol on Ni/SiO2 at 573K. In the presence of H2 and CH3OH, phenol is converted to benzene; but in the presence of H2 and H2O, cyclohexanone was also produced and benzene yield decreased. Those results are consistent with our finding.
CO2 has a very positive effect to reduce deactivation. Coke deposit yield based on guaiacol converted (Table 3.3) was almost not changed (compared with Gua+H2 without CO2). A possible explanation is that CO2 impedes the formation of coke especially in the vicinity of the reactive sites, probably by H2O molecules produced by the reverse water-gas shift reaction (WGSR) [105]. Indeed, water addition was shown to impede coke formation (Table 3.3). Moreover, the amount of water produced by the reverse WGSR (around 0.5%) could be too low to slowdown the HDO reaction rate. In other words, in the presence of CO2, there are enough H2O molecules formed to reduce coke from useful active sites but not enough to affect phenolic molecules sorption. If this explanation is true, there should exist an optimum concentration of water on the gas phase that reduces coking without decreasing catalyst activity and selectivity.
The formation of carbide represents a negligible amount of carbon deposit on the Gua+H2+CO spent catalyst. Consequently, the TPO pattern for guaiacol conversion with CO (and H2) could be mainly attributed to coke formation from heavy hydrocarbons from CO hydrogenation. Galuszka et al. [100] showed by infrared analysis coupled to TPO and Mössbauer analysis that the carbonaceous deposit on Fe/SiO2 (after Fisher-Tropsch synthesis) is likely composed of aliphatic, carbidic and amorphous forms of deposit. The two types of carbonaceous deposit analyzed in our case (for CO+H2 conversion without guaiacol, Figure 3.7) may come from aliphatic and amorphous species since the carbide contribution to carbon deposit is negligible. When guaiacol is added to H2+CO, a third peak on the TPO curve appears at low temperatures probably from an oxygenated form of the carbonaceous deposit [100], formed from phenolic species conversion.
From Mössbauer spectroscopy (Figure 3.1-c, table 3.1), it is shown that, with the nominal gases composition (Gua+H2+CO+CO2+H2O), metallic iron is still the major iron species (on a molar basis). These gases composition and experimental conditions are sufficiently reducing to maintain a suitable fraction of reduced –active iron and especially of metallic iron.
3.3.3. Effect of support Experiments with different catalysts were conducted with different mass percentages of
iron over silica but conserving the same iron surface, consequently mass of catalyst on run and silica surface were different. However, the activity and selectivity remains unchanged (Figure 3.9 and 3.10). Reaction may happen on the iron-silica interface in agreement with the finding that no conversion of guaiacol was observed over pure silica without iron [44].
Under our nominal conditions (50% H2, 5% CO2, 2% CO, 2% H2O, 1% Guaiacol, rest Argon), 10%Fe/AC catalyst also showed a very low yield of benzene and toluene compared to
76
silica-supported catalyst, and consequently high yield of phenol (Figure 3.11 and 3.12). Activated Carbon is a complex support. Both acid and basic functionalities of different chemistry could be initially present, or generated at 673K on activated carbon surface in the presence of H2O and CO2 [103,111]. More fundamental research is needed to explain this selectivity as compared to that of silica. Influence of support nature on selectivity was also observed by Bui et al. [15]. They obtained a good selectivity to benzene instead of ring hydrogenation products using ZrO2 as support for CoMoS instead of TiO2 or Al2O3.
3.3.4. High HDO conversion reactions Figure 3.11 shows that Fe/SiO2 catalyst can be used for the HDO of model lignin
pyrolysis vapors into BTX, even in the presence of CO, CO2 and H2O. (66% of BT Carbon yield).
It is very difficult to compare our result with literature because conditions and/or goals were not always the same. The result from Gonzalez-Borja and Resasco [11] on bimetallic Pt-Sn/Carbon Nanofiber/Inconel monolith was selected because their conditions were similar to ours. They found similar selectivity and higher activity with the drawback of using Pt. Shin and Keane obtained 99% of benzene from phenol on 20%Ni/SiO2 at lower temperature (573K), we did not tested nickel because it could convert guaiacol to methane at 673K [18]. High-pressure liquid phase data is less comparable. Good yield in aromatic hydrocarbons from depolymerized lignin (base-catalyzed) have been obtained with sulfided Mo catalysts promoted by Fe or other metals [40].
Figure 3.12 shows the phenol and cresol yield for Fe/AC catalyst in a very high HDO conversion experiment. Guaiacol is fully converted to mono-oxygenated aromatic molecules (phenol), but those valuable molecules are not further hydrogenated. This is a very important result for researchers looking to produce phenols from lignin pyrolysis vapors. Very oxygenated aromatic molecules could be converted to less oxygenated, more stable and value-added phenols directly from lignin vapors catalytic treatment. Activated carbon was also chosen based on its potential benefit for support and iron regeneration and recovery (by coke and support oxidation). Activated carbon or char can be produced from the pyrolysis process. The support catalyst could be thus produced and regenerated in the process itself [112–114]. Regeneration of iron/AC and recovery strategies of iron are still needed to be looked for.
3.4 Conclusion of Chapter 3 For a better understanding of the guaiacol HDO on iron supported catalysts the
individual behavior of gases (CO, CO2, CH4, and H2O) was investigated. XRD and Mössbauer analyses are both needed to investigate iron speciations.
Methane has few effects on guaiacol HDO contrary to the other gases. Water strongly inhibits the overall activity but increases production of phenols instead of benzene through the hydrogenolysis of the adsorbed precursors. Carbon monoxide has a strong negative effect on initial reaction rate due to carburization of iron and formation of an important yield of coke. Carbon dioxide has a very positive effect on guaiacol HDO reaction reducing deactivation.

77
Under the lignin pyrolysis model mixture (Gua+H2+CO+CO2+H2O) 15%Fe/SiO2 was active and selective for the production of benzene and toluene with no ring hydrogenation (66% of Carbon yield of BT, 1/WHSV=7.5h). Some reduced iron remains on the catalyst, Fe3+, Fe3O4 and Fe5C2 were also observed. 10%Fe/AC was active and selective for phenol and cresol production from guaiacol.
Coking was shown to deposit in the vicinity iron particles. This finding suggested that the HDO occurred at the metal-support interface.
The above conclusions prompt us to undertake in the next future the investigation of these catalysts on real pyrolysis gases.

78

79
Chapter 4. Aromatics hydrocarbons and phenols from direct hydrotreatment of lignin vapors before condensation on Fe/silica and Fe/Activated Carbon catalyst.
Abstract
We present the first hydrotreatment of real lignin pyrolysis vapors, before any condensation, using inexpensive and sustainable iron-silica (Fe/SiO2) and iron-activated carbon (Fe/AC) catalysts. Lignin pyrolysis was conducted in a tubular reactor and vapors were injected in a fixed bed of catalysts (673K, 1 atm) with stacks to investigate the profile of coke deposit. More than 90 GC-analyzable compounds were identified and quantified by GC*GC/FID-MS-FID (heart cutting) and a combination of internal calibration with FID response factors prediction. The catalysts showed a good selectivity for the hydrodeoxygenation (HDO) of real lignin vapors to benzene, toluene, xylenes (BTX), phenol, cresols and alkyl phenols. The profile of carbon deposits was studied by temperature programmed oxidation (TPO) and reveals the importance of deposit from lignin oligomers.
4.1 Experimental Iron over silica (15%Fe/Silica) catalyst was prepared by simple impregnation. 15.65 g
of silica (Aerolyst 3039, Degussa; grounded and sieved 380-100 µm) were contacted with a solution of 20.15 mg iron nitrate nonahydrate (Sigma) in 46 ml deionised water. The mixture was exposed to vacuum at room temperature for 3 hours, and then dried 24 hours at 373 K. The resulting impregnated solid was re-grounded and sieved (380-100 µm), and then treated under Argon flow (50 Nml/min) with temperature increasing from 298 K to 773 K at 5 K/min and hold at 773 K for 1 hour, then cooled to room temperature under argon flow. Gas flow was switched to 50 Nml/min of H2 and temperature was re-raised to 773K at 5K/min, hold during 1 hour. Then the catalyst was cooled to room temperature and passivated at room temperature using a gas with 100 ppm of O2 in argon. 10%Fe/Activated Carbon catalyst was prepared mixing 14g of activated carbon NORIT RX-3 “Extra” (380-100 µm) with 11.24 g of iron nitrate and 14 ml of water. Then it was treated as 15%Fe/Silica catalyst. Before catalytic tests, the catalysts were reduced in-situ under 300 Nml/min of H2, increasing temperature at 5K/min until reaching reaction temperature (673K). For more details about preparation and characterization see Chapter 3.
Organocell lignin (OCL) was supplied by the Institute of Wood Chemistry (Hambourg, Germany). Lignin and char were analyzed with a Thermo Scientific Flash Elemental Analyzer CHNS. Oxygen mass percentage was determined by difference. Lignin’s water content was determined by weight difference after 24 h at 373K.
The batch pyrolysis experiment was conducted in a home-made experimental bench (Figure 4.1) [115]. It consists in a steel tubular reactor heated with a furnace (773 K, thermocouple in the pyrolysis zone) continuously swept by 300 Nml/min of N2, where lignin loads were quickly introduced by a steel sample boat. Between one experiment and another, the sample boat was taken away from the hot zone in a cooling zone. Once the sample boat

80
was cooled down in N2, it was removed and char was weighted. Then the sample boat was cleaned, reloaded with lignin and placed in the cool zone of the tubular reactor. Then the reactor was purged during 10 min in order to sweep away air that entered during operations with the sample boat. At this moment the bench was ready for another pyrolysis experiment. Once the sample boat is introduced into the hot zone, pyrolysis is considered to last 10 min (from visual observation of aerosols during a blank test, without catalyst).
Figure 4.1. Experimental bench for batch pyrolysis connected to a fixed-bed reactor
At the exit of the pyrolysis bench, a horizontal fixed-bed reactor was connected. A valve
system prevents air to enter and to oxidize the catalyst during the lignin reloading operations by flushing N2. After loading of lignin in the sample boat, purging air, closing the pyrolysis reactor and flushing it with N2, H2 was flushed on the catalytic fixed-bed reactor for 20 min before the pyrolysis experiment (before sample boat introduction into the pyrolysis zone). The catalytic reactor was a 10 mm internal diameter steel pipe externally heated. At the entrance of the reactor, 300Nml/min of H2 (Air Liquide) were introduced (to be mixed with pyrolysis vapors). Catalyst was packed by means of quartz wool plugs. In one experiment, several quartz wool plugs were placed to divide the catalyst bed in 4 stacks of 500mg of catalyst (Figure 4.1). Thanks to this staged fixed bed, the profile of carbon depositions along the catalytic bed was analyzed.
The exit of the catalytic reactor was connected to two impingers with 10 ml of methanol in order to sample condensable vapors. The first impinger was cooled at 273K (ice) and the second one at 213 K (2-propanol-liquid N2). Once the pyrolysis was finished, both impingers were disconnected and washed with about 5 ml of methanol, then 1 µL of 1-undecene was added in each impinger as internal standard for Gas Chromatography (GC). The amount of collected compounds in each impinger was analyzed separately, but results presented in this

81
article correspond to the sum of the two impingers. The exit of the impingers was connected to a gas sampling bag.
Oils were analyzed with an Agilent 7890 Gas Chromatography coupled to an Agilent 5975C MS analyzer. 1 µL of methanol solution of products and internal standard were injected with a split ratio of 20 into an Agilent HP-5MS (30mx250µmx0.25µm) column (0.93 Nml/min of He) connected with a heart-cutting system to an Agilent DB-Wax123 (30mx320µmx0.25µm) column (3.44 Nml/min of He; RTheart-cutting: 26-27.3 min). These two columns were chosen for GC*GC because of their complementarity in terms of polarity and separation selectivity. Oven temperature program was: 313K (hold 10 min), then increased at 5K/min to 473K (hold 21 min). The exit of HP-5MS was connected simultaneously to a Flame Ionization Detector (FID) and to the Mass Spectrometer (MS). The exit of DB-Wax column was connected to a separate FID. A simplified scheme of the GC*GC (heart cutting)/FID-MS-FID is given in Annex 6.
The relative response factor of 11 compounds was determined experimentally with 3 standard solutions. The response factors on FID of other compounds were predicted using the method of de Saint Laumer et al. [116]. More details on the calibration and predictive quantification method, examples of chromatographs and a list of identified and quantified compounds are given the Annex 6. More than 170 different compounds were detected and qualified by MS and NIST database (see Annex 6). Between 70 and 93 compounds were quantified depending on the runs.
The concentration of gases in the sampling bag was measured with a µGC-Varian 490 equipped with four modules: 2 molecular sieves 5A, a PoraPlot U and a CP –Wax 52CB columns. µGC-490 signal was calibrated using four standard bottles (Air Liquide, France). It is outlined that benzene was never detected by µGC at the gas phase (Limit of Detection 10 ppm), which means that our condensation system is suitable, even if it is different from EU “Tar Protocol” [84].
4.2 Results
4.2.1 Improvement of the quality of lignin pyrolysis bio-oils The GC-analyzed products of lignin pyrolysis without catalyst in the hydrotreatment
reactor (at 673K) represented 8.7-9.5%w of initial dry lignin. This result is in fair accordance with literature [43]. The mass yield of gases was 10%w. This value is lower than literature (17-20%w [43]), probably due to our bag sampling system. The char yield was about 42%w for every run. Our mass balance is 61%. The lack of 39%w. should be composed by reaction water (15-21%w, not measured), vapors that are too heavy to be analyzed by GC (11-10%w [43]; i.e. lignin oligomers), some lignin or char spotted away from the sample boat by violent lignin pyrolysis reaction and light condensable hydrocarbons that are not conveniently measured by our GC method (because of solvent peak). It must be considered that our experimental bench was conceived to produce real pyrolysis vapors easily at the laboratory scale and not optimized to maximize bio-oil yield.
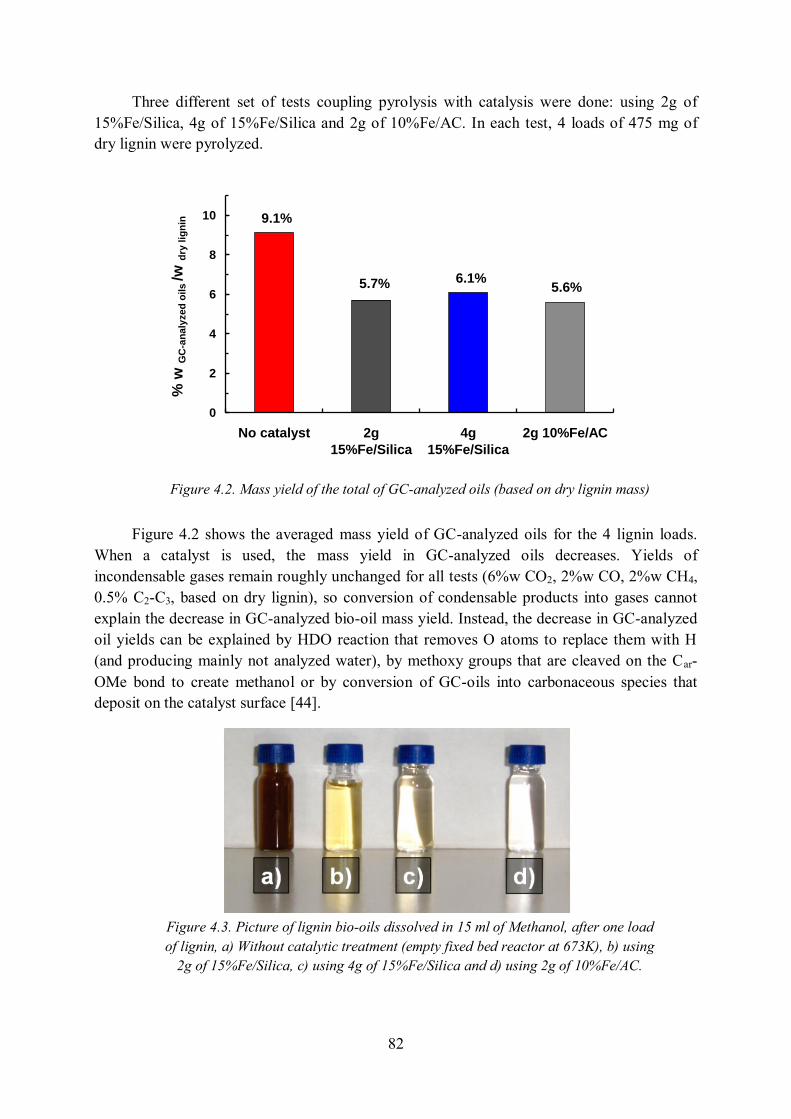
82
Three different set of tests coupling pyrolysis with catalysis were done: using 2g of 15%Fe/Silica, 4g of 15%Fe/Silica and 2g of 10%Fe/AC. In each test, 4 loads of 475 mg of dry lignin were pyrolyzed.
Figure 4.2. Mass yield of the total of GC-analyzed oils (based on dry lignin mass)
Figure 4.2 shows the averaged mass yield of GC-analyzed oils for the 4 lignin loads.
When a catalyst is used, the mass yield in GC-analyzed oils decreases. Yields of incondensable gases remain roughly unchanged for all tests (6%w CO2, 2%w CO, 2%w CH4, 0.5% C2-C3, based on dry lignin), so conversion of condensable products into gases cannot explain the decrease in GC-analyzed bio-oil mass yield. Instead, the decrease in GC-analyzed oil yields can be explained by HDO reaction that removes O atoms to replace them with H (and producing mainly not analyzed water), by methoxy groups that are cleaved on the Car-OMe bond to create methanol or by conversion of GC-oils into carbonaceous species that deposit on the catalyst surface [44].
Figure 4.3. Picture of lignin bio-oils dissolved in 15 ml of Methanol, after one load of lignin, a) Without catalytic treatment (empty fixed bed reactor at 673K), b) using
2g of 15%Fe/Silica, c) using 4g of 15%Fe/Silica and d) using 2g of 10%Fe/AC.
0
2
4
6
8
10
No catalyst 2g
15%Fe/Silica
4g
15%Fe/Silica
2g 10%Fe/AC
% w
GC
-an
aly
zed
oils /w
dry
lig
nin
9.1%
5.7% 6.1%5.6%

83
Despite the loss of GC-analyzed oil, the quality of bio-oils was remarkable enhanced. Figure 4.3 shows a picture of the oils dissolved in 15 ml of Methanol (the first impinger), the hydrotreatment with 15%Fe/Silica converted opaque brown lignin oils into a transparent yellow liquid. 10%Fe/AC produced the same color effect, even using just 2 g of catalyst.
Figure 4.4 and 4.5 shows the composition of GC bio-oils by groups of molecules. The improvement of bio-oil quality is evident. 15%Fe/Silica catalyzes the formation of benzene, phenol and other useful products at the expense of unstable molecules with two or more oxygen atoms per aromatic ring (hereafter noted as AM2+O), such as guaiacol, catechol, vanillin, etc). In the 15%Fe/Silica catalyzed experiment, the aromatic hydrocarbon group contains 25%w of benzene and 75% of alkyl-benzenes. Some of them could be separated for commercialization (p-xylene), but the entire mixture of aromatic hydrocarbons could also be a good bio-based blend for diesel [117].
2g of 10%Fe/AC gives a higher mass yield in phenol and alkylphenols compounds and a lower yield in PAH, AM2+O and aromatics species than 2g 15% Fe/SiO2. It produced low amounts of benzene and hydrocarbons in agreement with experiments with guaiacol [45]. The bio-oil was enriched in phenol. 1.14%w/wdry lignin were obtained instead of 0.23 %w/wdry lignin
in the experiment without catalyst. The yield in alkyl phenols was also increased (Figure 4.4).
Figure 4.4. Mass fraction of GC-analyzed oils obtained during HDO of lignin pyrolysis vapors (mass fractions based on the total mass of GC-analyzed oils).

84
Figure 4.5. Mass fraction of the alkyl-phenol compounds (based on total mass
of alkyl-phenols) obtained during HDO of lignin pyrolysis vapors. “Others” are methoxy-benzenes (like anisole) and C5+-alkyl phenols.
Cresols are also produced in significant yields. p-cresol is a valuable chemical for
polymer synthesis, but it is difficult to obtain it without m-cresol [33]. Unfortunately, our experiments produced both p- and m- cresols in similar amounts (Figure 4.5).
The alkyl phenol group contains many isomers (e.g. dimethyl phenols, propylmethyl phenols, allyl phenols, etc) (Figure 4.5). This fraction can be used in the synthesis of phenolic resin [118], it can be cracked to targeted molecules [119,120] or hydrotreated to C7+ fuels [44].
The non-aromatic fraction (Figure 4.4) was composed almost entirely by 5C-cyclic hydrocarbons (methyl cyclopentadiene, methyl cyclopentenones, etc). They are produced probably from carbohydrates (cellulose, hemicelluloses) that were not completely separated from lignin by the wood fractionation process.
The Van Krevelen diagram of lignin, char and GC-analyzed oils is displayed in Figure 4.6. The atomic O/C ratio of the GC-analyzed oil is diminished by catalytic hydrotreatment on Fe/Silica while H/C ratio remains unchanged. This green and simple catalyst follows the desired “selectivity route” for HDO. It catalyzes selectively the hydrogenolysis of C-O bonds and not the cracking or hydrogenation of C-C bonds. The same conclusion was found in our last work using guaiacol as a model compound [44].
0
0.25
0.5
0.75
1
No catalyst 2g
15%Fe/silica
4g
15%Fe/Silica
2g
10%Fe/AC
Others
Butyl Phenols
Propyl Phenols
Ethyl Phenols
m-cresol
p-cresol
o-Cresol

85
Figure 4.6. Van Krevelen diagram of lignin, char (based on elementary analysis) and GC-analyzed oils (based on GC quantification) obtained from HDO of lignin pyrolysis
vapors on 15%Fe/Silica catalyst. A very selective HDO is obtained by Fe/Silica catalyst: O/C atomic ratio is reduced without reducing H/C ratio.
4.2.2 Deactivation of catalyst Results showed on Figure 4.2, 4.4, 4.5 and 4.6 are averaged results from the four loads
(4x475mg) of lignin on the same catalytic bed. However, deactivation was studied from one load to another. Figure 4.7 shows mass yields and O/C atomic ratio (based on the sum of GC-analyzed compounds) of bio-oils from lignin pyrolysis followed by 4g of 15%Fe/Silica. In the converted bio-oils from the first lignin load, AM2+O were almost completely disappeared and the aromatic hydrocarbons yield was near 1.4%w/wdry lignin. However, from the third load, the activity of the catalyst decreased. Phenols were less converted to hydrocarbons and some AM2+O reappeared; as a consequence, the O/C ratio increased.
The catalyst was hold at 673K under H2 flow for 20 minutes between lignin pyrolysis loads, so deactivation by oxidation of Fe is not likely to happen. The deactivation may come from carbon deposits or by unstable molecules that block the entrance of pores. For that reason, used catalyst was characterized by TPO (Figure 4.8). As explained in the experimental section, the catalyst bed was divided in stacks to analyze the carbon deposits along the reactor length. Figure 4.8 shows the TPO profiles and the mass fraction carbon deposit along the four stacks as numbered in Figure 4.1. Carbon deposit accumulates at the beginning of the reactor (40% in stack 1, 13% in stack 4, Figure 4.8) and then decreases. This finding is consistent with the results of Mihalcik et al. [52] on wood pyrolysis catalytic treatment who studied the selectivity of zeolite as a function of the position of the catalytic bed in the condensation train.
0
0.1
0.2
0.3
0.4
0 0.5 1 1.5
Atomic H/C
Ato
mic
O/C
No catalyst
2g catalyst
4g catalyst
char
LIGNIN
Pyrolysis
GC-Oils
HDO
GC-Oils
Selective HDO
over Fe/SiO2
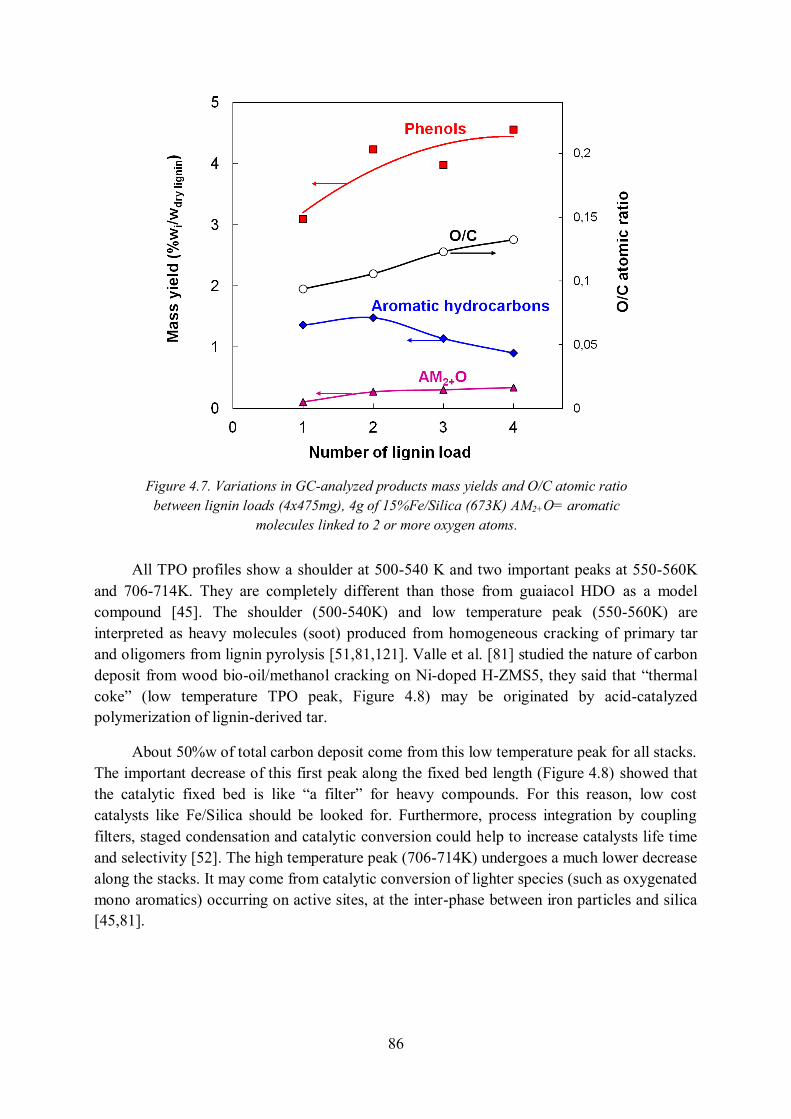
86
Figure 4.7. Variations in GC-analyzed products mass yields and O/C atomic ratio
between lignin loads (4x475mg), 4g of 15%Fe/Silica (673K) AM2+O= aromatic molecules linked to 2 or more oxygen atoms.
All TPO profiles show a shoulder at 500-540 K and two important peaks at 550-560K
and 706-714K. They are completely different than those from guaiacol HDO as a model compound [45]. The shoulder (500-540K) and low temperature peak (550-560K) are interpreted as heavy molecules (soot) produced from homogeneous cracking of primary tar and oligomers from lignin pyrolysis [51,81,121]. Valle et al. [81] studied the nature of carbon deposit from wood bio-oil/methanol cracking on Ni-doped H-ZMS5, they said that “thermal coke” (low temperature TPO peak, Figure 4.8) may be originated by acid-catalyzed polymerization of lignin-derived tar.
About 50%w of total carbon deposit come from this low temperature peak for all stacks. The important decrease of this first peak along the fixed bed length (Figure 4.8) showed that the catalytic fixed bed is like “a filter” for heavy compounds. For this reason, low cost catalysts like Fe/Silica should be looked for. Furthermore, process integration by coupling filters, staged condensation and catalytic conversion could help to increase catalysts life time and selectivity [52]. The high temperature peak (706-714K) undergoes a much lower decrease along the stacks. It may come from catalytic conversion of lighter species (such as oxygenated mono aromatics) occurring on active sites, at the inter-phase between iron particles and silica [45,81].

87
Figure 4.8. TPO profiles of catalyst stacks after four loads of lignin. Points are experimental measurements of CO2 by µGC and curve numerical integration as
explained in Annex 3. % C deposit defined as mass of carbon deposit on a stack/ total mass of carbon deposit on all stacks.
The result of elementary analysis of lignin was 64.37 %wC, 5.78%wH and 29.85%wO
(by difference). Char was 80.3%wC, 2%wH and 17.7%wO. Taking into consideration these values, GC analysis of oils and TPO, carbon balance was calculated. Figure 4.9 compares the carbon balance for pyrolysis of lignin without catalyst and using 2g 15% Fe/Silica.
GC-analyzed oils yielded 9.9%C without catalyst and 6.7%C with 2g of 15%Fe/Silica. This could be explained by the formation of catalytic coke from pyrolysis GC-oils, the slight increase in gas yield, and the hydrogenolysis of Car-OCH3 bond that will produce methanol (not analyzed by our method due to the use of methanol as a solvent). Methanol was preferred because it is a lighter solvent, easier to be separated from compounds of interest [85]. However, carbon deposit on catalyst represents 10.8%C of lignin. Its origin cannot be explained only by catalytic coke from GC-analyzed oils, confirming that most of carbon deposit may be formed by not analyzed heavy molecules (lignin oligomers and heavy PAHs generated during lignin pyrolysis) as explained before.
0
50
100
150
200
250
303 503 703 903
0
10
20
30
40
50
0 1 2 3 4
Stack 1
Stack 2
Stack 3
Stack 4
% of Cdeposit
CO
2 f
low
(µ
mo
l/(m
in.g
ca
t)
Temperature (K)
Stack number
% o
f C
arb
on
de
po
sit
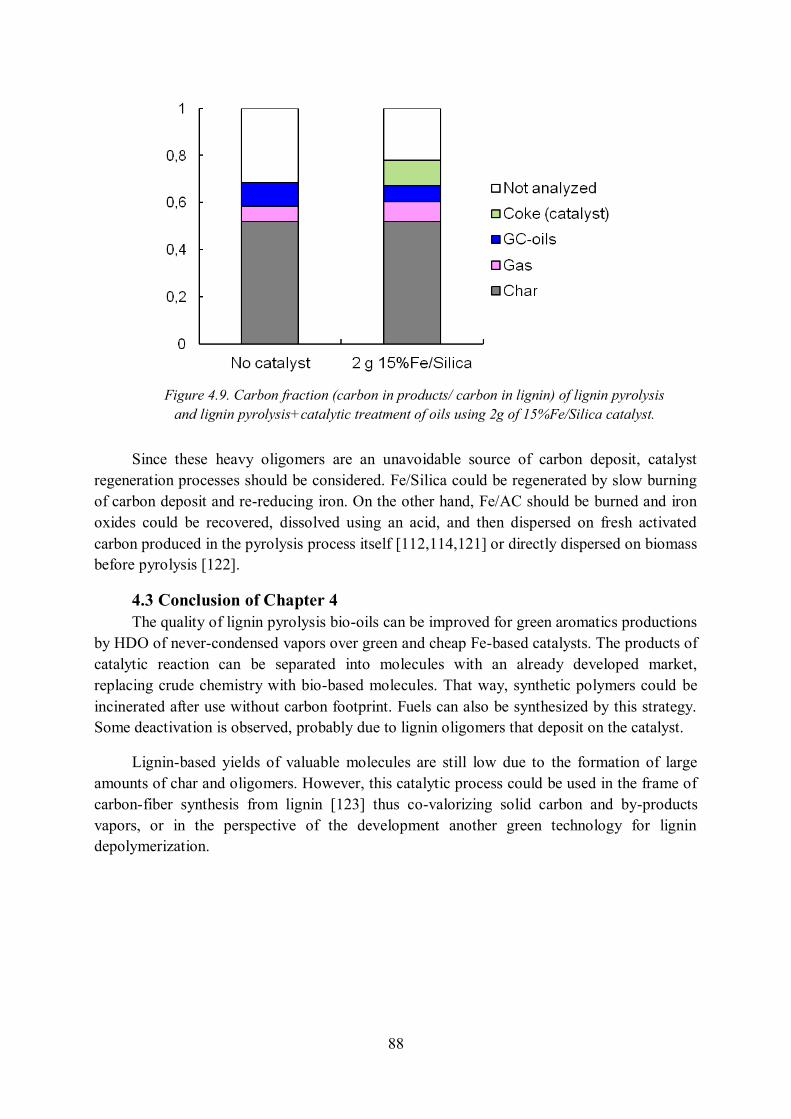
88
Figure 4.9. Carbon fraction (carbon in products/ carbon in lignin) of lignin pyrolysis
and lignin pyrolysis+catalytic treatment of oils using 2g of 15%Fe/Silica catalyst.
Since these heavy oligomers are an unavoidable source of carbon deposit, catalyst regeneration processes should be considered. Fe/Silica could be regenerated by slow burning of carbon deposit and re-reducing iron. On the other hand, Fe/AC should be burned and iron oxides could be recovered, dissolved using an acid, and then dispersed on fresh activated carbon produced in the pyrolysis process itself [112,114,121] or directly dispersed on biomass before pyrolysis [122].
4.3 Conclusion of Chapter 4 The quality of lignin pyrolysis bio-oils can be improved for green aromatics productions
by HDO of never-condensed vapors over green and cheap Fe-based catalysts. The products of catalytic reaction can be separated into molecules with an already developed market, replacing crude chemistry with bio-based molecules. That way, synthetic polymers could be incinerated after use without carbon footprint. Fuels can also be synthesized by this strategy. Some deactivation is observed, probably due to lignin oligomers that deposit on the catalyst.
Lignin-based yields of valuable molecules are still low due to the formation of large amounts of char and oligomers. However, this catalytic process could be used in the frame of carbon-fiber synthesis from lignin [123] thus co-valorizing solid carbon and by-products vapors, or in the perspective of the development another green technology for lignin depolymerization.

89
Chapter 5. Lignin to green aromatics by pyrolysis vapors Hydro-de-Oxygenation over iron-based catalysts: experiments on guaiacol HDO, kinetics and modeling of the integrated process
Abstract
Experiments were conducted in a differential fixed bed reactor operating at 673K (1 atm.) with a gas mixture (guaiacol, H2, H2O, CO, CO2) that mimics the real gas composition from lignin pyrolysis. Major and minor products are modeled by a semi-detailed kinetic mechanism. The kinetic model is then included in an Aspen Plus model of lignin to BTX process. Aspen Plus model handles: (1) pyrolysis of lignin, including char, oligomers, gases and aromatic yields, (2) catalytic conversion of aromatics by the kinetic model, (3) heat exchangers and (4) BTX vapors recovery by scrubbing with 1-methyl-naphthalene. Mass and carbon balances, heat needs and selectivity in goal products are given for the overall process. The effect of gas dilution on heat needs and scrubbing flow rate is highlighted. High flow rates of carrier gas needed for biomass pyrolysis in fluidized bed lead to the entrainment of fines and oligomers, dilute the goal products and impact considerably the process intensification.
5.1. Experimental. 15wt.% Fe/Silica was prepared as explained in Section 3.1. The fixed-bed bench with a
gas mixture that mimics lignin pyrolysis vapors has been described in Section 3.1. The mass of catalyst was changed (0.000058-0.001034 kgcat) to study the kinetics of the reaction. Data was fitted on a zeroth order model using Excel solver. All data is given in Annex 7.
5.2. Definition of ASPEN Plus modeling Our group has developed advanced models under Aspen Plus by coupling pyrolysis
correlations with detailed kinetic mechanisms [124,125]. The goal of this work is to give a simplified but realistic model to assess process integration and operating variables. To the best of our knowledge, such an integrated model, which couples pyrolysis description with lumped compounds and a semi-detailed kinetic mechanism for catalytic HDO, has never been previously developed.
More details on the block units (input and output) and the Aspen Plus flow sheet are given in the Annex 8.

90
Figure 5.1. Scheme of Lignin to BTX process by HDO of pyrolysis vapors and its simplification for modeling under Aspen Plus
5.2.1. Definition of components lignin, char, lignin-oligomer and “PYROLOST”. Lignin, lignin oligomers and char were treated as non-conventional solids. All other
compounds were defined as conventional compounds in the Aspen Plus database. Lignin was considered to be 57.8%w C, 5.7%w H and 36.5%w O (that corresponds to an oxygenated lignin [64]), fixed carbon was 40% and volatile matter 60% [43]. It is assumed dry and ash-free for ASPEN simulation. Char was considered to be 73.6%w C, 5.6%w H and 32.7%w O [126] with 100% fixed carbon. Lignin’s oligomers (~10%w yield from dry lignin) were considered to be only one compound and the formula was taken from Scholze et al. [60], fixed carbon and volatile matter were assumed the same than for lignin. The enthalpies of the three non-conventional solids were predicted based on the HCOALGEN Aspen property model. For lignin, heat of combustion was set to 10,000 Btu/lb [8], while it was calculated from Boie’s correlations for lignin oligomers and char. Heat capacities were calculated from the Aspen Plus built-in Kirov’s correlation. Density of lignin, char, lignin oligomers and PYROLOST were predicted with DCOALIGT built-it tool.
A theoretical compound was introduced to reach an atomic balance on modeling pyrolysis - called PYROLOST. It was defined as a non-conventional solid, fixed carbon 10%, volatile matter 90%, 94.4%w C and 5.6%w H. Enthalpy calculations were also based on HCOALGEN method.
5.2.2. Lignin pyrolysis input Lignin pyrolysis was modeled based on data from de Wild et al.[43]. These authors
operated a fluidized bed at 673K and 0.1 kg/h of lignin. We choose this work because of the pertinence of the experimental design (flash pyrolysis in an adapted fluidized bed) and the analytical tools leading to a good mass balance (89%). Many heavy products are produced by lignin pyrolysis. They are not GC analyzable and reduce considerably the experimental mass balance.
The capacity of the process simulation (i.e. the lignin input flow) is fixed to 500 kg/h that corresponds to a demonstration unit scale [127].
Lignin pyrolysis aromatic vapors (~9%w) were considered to be only guaiacol. Guaiacol is assumed to be a “lumped” model molecule representative of functional groups in aromatic vapors. In future development of the model, other lumped species could be defined
Catalytic
reactor
Wash oil
Clean gasAbsorption
column
Aromatic molecules
(dissolved in wash oil, to be distilled)
Condensed water
673 K
303 K
Cooling
Lignin Pyrolysis
reaction
N2 at 298KFluidization gas
Char, oligomers, lost in pyrolysis
H2
Heat of pyrolysis
Extra heat for pyrolysis
673 K
Heat of catalytic reactions

91
(as in [124]) if kinetic data on their catalytic HDO are available. Traces of acetic acid and di-methyl-ketone were also considered to model light oxygenated hydrocarbons. As a consequence of lumping aromatic vapors into guaiacol and experimental uncertainties, atomic O balance surpassed 100%. Hence water yield was decreased until O balance close perfectly. We choose to change water yield rather than other oxygenated products for three reasons: (1) it does not change the carbon yield, which is a very important parameter in this work and for process selectivity, (2) water is produced in a high amount and closure of O balance has few effects on its overall yield and (3) H2O molar fraction has few chemical effect on kinetics of tar HDO in this range of variation [45].
The mass yield in oligomers was kept from ref. [43] and the molecular structure taken from Scholze [60]. Char yield [43] and elemental formula [126] were also fixed. A PYROLOST compound was thus defined to close C and H balances. The closure of C and H balances leads to a formula CH0.7 which is consistent with a loss as “soot” or heavy PAH that could be formed in the gas phase conversion of primary tar and/or from char fines entrainment.
Table 5.1 shows a comparison between the experimental data by De Wild et al. [43] and the model values that were introduced in Aspen Plus.
Table 5.1. Comparison between real lignin pyrolysis results and data introduced on our model.
* Distribution of non-condensable gases and other hydrocarbon yield taken from batch pyrolysis experiment at 500°C [43]
Real compound %w measured by De Wild et al. [43] Model compound %w ASPEN Plus
simulation
Char 30 Char 30
H2O 21 H2O 14.18
Unknown condensable products (oligomers) 12
Oligomer, molecular structure taken from Scholze et al. [60] (Model A)
12
Phenols (guaiacol, syringol, alkyl phenols, etc)
9 Guaiacol 9
Non-condensable gases 17* CH4 1.46 CO 3 CO2 12.54
Methanol 2.18* Methanol 2.18
Other hydrocarbons (acetone, formic acid, furaldehyde)
0.1-0.2* Acetic acid 0.2
Acetone 0.2
Lack on mass balance (Pyrolysis Loss) 11 PYROLOST 15.24

92
5.2.3. Simulation set up Redlich-Kwong-Aspen (RK-ASPEN) was used as the thermodynamic property method
for conventional compounds. All Aspen Plus process units are operated at atmospheric pressure.
5.2.4. Operating blocks and flow-sheet The modeled and simplified Lignin to BTX process is composed a pyrolysis reactor,
heater of pyrolysis products and career gas (to simplify the model of pyrolysis reactor), catalytic reactor, condenser and absorber for BTX recovery (Fig. 5.1).
We are aware that much more process steps are needed [128,129] and that stage condensation could help to increase BTX yield [52,128].
a) Lignin pyrolysis reactor: Lignin pyrolysis was modeled with an Aspen Plus RYield reactor. Pyrolysis product yields are set from the experimental results defined in Table 5.1. The pyrolysis reactor operates isothermally at 298K to simplify the model. Heat is generated as lignin pyrolysis is an exothermic reaction. Heat of pyrolysis is calculated by Aspen Plus from the enthalpy of lignin and products.
Lignin pyrolysis products are then mixed to N2 at 298K (career gas used for fluidized bed reactor). This mixture is then heated to 673K (pyrolysis temperature), using the heat produced during pyrolysis and some extra needed heat.
Char, lignin oligomers and PYROLOST are then separated from the gaseous mixture with a Sep block. In real conditions, these products stay in the fluidized bed and the downstream train.
b) Hydrogen mixing: Hydrogen is heated to 673K and mixed to pyrolysis products. The active phase is reduced iron. H2 flow is calculated to ensure that H2/(H2+H2O) ratio is an iron-reducing gas (taking into account H2O produced by lignin pyrolysis and HDO) [45].
c) Catalytic reactor: The Aspen Plus RPlug reactor was used for modeling the catalytic reactor and experimental kinetics data were introduced. In order to overcome discontinuities dues to zero order reactions, a combination of three RPlug reactors in series was implemented. Indeed, with zero order reactions, Aspen Plus calculates the reactions even if the reactive components are totally consumed. In the first reactor, the mass of catalyst is defined to have guaiacol conversion so the guaiacol exit flow is less than 0.01 kg/h. In the second reactor, guaiacol reactions are not considered and the mass of catalyst is defined so that methanol mass flow is less than 0.01 kg/h. In the third reactor, methanol reactions are not considered and the mass of catalyst is adjusted so that phenol exit mass flow is 0.1 kg/h. In real bio-refinery conditions if at commercial scale, the conversion would be adjusted to match with goal products of the market and with catalysts deactivation. The combination of RPlug reactors represents the HDO reactor and it results in 650 kg of catalyst based on our kinetic data. 650kg of catalyst for 500kg/h of lignin gives a WHSV, defined as the biomass flow rate divided by the mass of catalyst of around 0.8 h-1 which is consistent with experimental data on wood pyrolysis vapors conversion on zeolite catalyst [130].

93
Catalytic coke was modeled by C(s) graphite, that is a conventional solid in Aspen Plus. Heat (calculated by Aspen Plus from enthalpy of input and output compounds) is generated in the HDO reactor since HDO reactions are exothermic [44] and that isothermal conditions are required.
d) Separation of products and cleaning of gas phase: Catalytic coke was separated with a Sep block. In real conditions, coke remains on the catalytic material.
Coke free products were cooled to 303 K (see Figure 5.1). Condensed products at 303K were separated in a decanter modeled as a Flash2 block.
The liquid free product stream was injected to the bottom of a RadFrac block with 5 theoretical plates to model absorption of BTX by 1-methylnaphthalene. The RadFrac block represents a simplified model of the absorber (also called scrubber) based on the known process to recover BTX in coal carbochemistry plants [129]. It is out of the scope of the present article to give a detailed model description of the BTX absorption and recovery process. 1-Methyl Naphthalene was introduced to absorb gas in the RadFrac block. The UNIFAC method was used to predict thermodynamic equilibrium in the RadFrac block (i.e. activity of compounds on the liquid phase vs partial pressure on gas phase). The 1-Methyl Naphthalene flow rate was varied until the Benzene recovery reached 97% in agreement with the recovery efficiency in industrial carbochemical processes [129].
5.3. Results
5.3.1. Pathway and kinetics of guaiacol HDO over Fe/SiO2 catalyst
Figure 5.2. Effect of catalyst mass on guaiacol and major products (benzene, phenol) molar
flow rate. 15%Fe/SiO2 at 673K.
Figure 5.3. Effect of catalyst mass on minor products flow rate. 15% Fe/SiO2 at 673K.
On Figure 5.2 and 5.3, the molar flow rates of guaiacol and products at the exit of the reactor are displayed as a function of the mass of catalyst for 67 min of reaction time on stream. The reactor was operated for three hours.
The concentration of benzene (Figure 5.2) and toluene (Figure 5.3) vs. the mass of catalyst showed a linear evolution.

94
The apparent rate of a compound i decomposition or formation, expressed per unit mass of catalyst, r (kmol.s-1.kgcat
-1), reads:
ni
nni CRTkkPr )( (5.1)
where n is the reaction order, k a kinetic constant (kmol.s-1.kgcat-1.atm-n) Pi the partial
pressure of reactant i (atm), R the molar gas constant (8.205x10⁻² m3 atm kmol-1 K-1), T the temperature of the catalyst bed (K), and Ci the molar concentration of i in the gas phase (kmol/m3).
Assuming a plug flow for the gas phase streaming across the catalyst bed, the molar differential balance of i over an elementary mass of catalyst, dm, reads:
dmQFRTkdF
nin
i )( (5.2)
where Fi is the molar flow rate of reactant i (kmol/s) and Q is the total volume flow rate of the gas phase (m3/s) at the temperature of the reactor and at atmospheric pressure.
Integration of Eq. (5.2) for n≠1 leads to Equation 5.3.
Qmtwitht
QRTkFF n
nn
iOn
i 111 )( (5.3)
where F0 i (kmol/s) is the molar flow rate at the entrance of the catalyst bed, and t (s.kgcat/m3) is the space time [89].
From equation (5.3) it can be demonstrated that when a compound (product or reactive) exhibit a linear evolution with the mass of catalyst (or space time) the overall reaction rate is zero order. Therefore, we deduced that reactions are zeroth order (n=0).
Since linear evolutions were observed for all products, zero order kinetics for all reaction was supposed and experimental data was fitted this way. The zero order kinetics observed for all reactions indicates that the oxygenated species are strongly adsorbed through hydroxyl moieties having a high surface coverage [20,131,132]. The development of a L-H kinetic model is out of the scope of this article.

95
OCH3
OHGuaiacol
OCH3
Anisole
Benzene
OH
CH3
Cresols
+H2
+2H2 -CH4 -H2O
Phenol
CO + Coke + 5H2
CH3 OH
MethanolCoke + H2O + H2
+H2 -H2O
+H2 -H2O
OH
CH3
+H2 -H2O
+H2 -H2O
Toluene Figure 5.4. Proposed pathways for the HDO of guaiacol on Fe/SiO2
Figure 5.4 shows the proposed reaction pathways for guaiacol HDO over Fe/SiO2 based
on the evolution of products as a function of the catalyst mass. Guaiacol was converted mainly into phenol, but some anisole and cresols (the addition of three isomers) were also produced. Phenol reacted further to form benzene. Anisole seems to be stable in our conditions. However cresols continue reacting to form toluene. Methanol showed a maximum and then disappeared. The amounts of produced methanol (only 10% of formed phenol, see Figure 5.2 and 5.3) are too low to be explained solely by the decomposition of guaiacol into phenol. Therefore, we proposed that guaiacol is converted to phenol by two ways: Way-1) by producing CH4, H2O (i.e. consuming two H2 molecules) and Way-2) by producing methanol and consuming only one H2 molecule. When catalyst mass is enough to completely convert guaiacol, methanol concentration diminishes sharply. We explained this in terms of conversion of methanol that is no longer supplied by guaiacol HDO Way-2. The conversion of methanol does not result in an increase of CH4, so methanol cracking into CO, H2 and coke was proposed. Aromatic ring molar balance was closed at 90-95%. This loss in aromatic ring could be explained by phenol cracking into H2, CO and a carbonaceous deposit. More details on the chemical mechanism of guaiacol HDO over Fe/SiO2 can be found in Chapter 2.
Table 5.3 shows the kinetic constants determined for each reaction. This data was used to model linear evolution of compounds as a function catalyst mass on Figure 5.2 and 5.3. Discontinuities are produced by the zeroth order model (when a reactant disappears, the reaction stops).

96
Table 5.3. Kinetic constant (k) for guaiacol HDO obtained from experimental data (1 atm, 673 K, 15%Fe/SiO2 catalyst,50% H2, presence of CO, CO2, H2O) using a zeroth order model for all
reactions. Reaction ki (kmol/s.kgcat)
OCH3
OH
OHCH3 OHH2+ +
4.0E-07
OCH3
OHOH
H2+ + CH4 OH2+2
1.2E-06
OH
H2+ OH2+
1.1E-07
OH
5 C* + CO + 3 H2
2.1E-08
OCH3
OH
OCH3
H2+ + OH2
4.0E-08
OCH3
OH OH
CH3H2+ + OH2
3.0E-07
CH3
H2 + OH2
OH
CH3 +
2.4E-08
Coke + H2 + H2OCH3 OH
2.3E-07
5.3.2. Catalyst deactivation Catalyst deactivation was observed that is inherent of this type of reactions for all types
of catalysts due to coke formation [11,44]. During 187 min of time on stream the distribution of products changed. Independently of the mass of catalyst used (58-1034 mg), the products were more oxygenated that at the beginning. The experimental point at 21 min showed a particular behavior that is related with the stabilization of pseudo steady state of adsorbed molecules on catalyst surface, so it was not considered in kinetic calculations. The same zero order model was applied to points at different time on stream (Full results are presented on Annex 7). The reaction rate of reactions vs. time on stream is plotted in Figure 5.5. Among empirical laws for coke-generated catalytic deactivation [133], k = k°.exp(α.t) was found to best fit data. k is reaction rate in kmol s-1 kg-1, k0 is the initial reaction rate, α is the deactivation coefficient in min-1 and t is the time on stream in minutes.

97
Figure 5.5. Decrease of measured kinetic constant for guaiacol HDO,
based on zero order model.
α was between 4.6 - 5.0x10⁻³ min-1 for guaiacol conversion, and phenol and cresols conversion into benzene and toluene respectively. This could mean that all reactions are taking place on the similar active sites that deactivates roughly at the same rate. Active sites may be in the vicinity of iron particles where H2 dissociation occurred and SiO2 support where molecules are adsorbed and reacts with dissociated H species [44,45]. On the other hand, the production of cresol decreased faster (α = 7.3x10⁻³ min-1). It is possible that this reaction involving HDO and trans-alkylation happen on different active sites (acid sites [12,96]).
5.3.3. Simulation of lignin to BTX process under Aspen Plus All heat and mass flows predicted by our ASPEN Plus simulation are listed in Annex 8.
In the present chapter only two process aspects are highlighted: the mass and carbon yield of the whole process, and the effect of fluidization-dilution gas on process variables.
Figure 5.6 describes the mass flows of ASPEN Plus simulation (besides N2 and 1-methyl naphthalene). It is observed that the amount of catalytic coke is relatively low compared with char, oligomers and pyrolysis loss which lead to the major loss in mass and carbon.
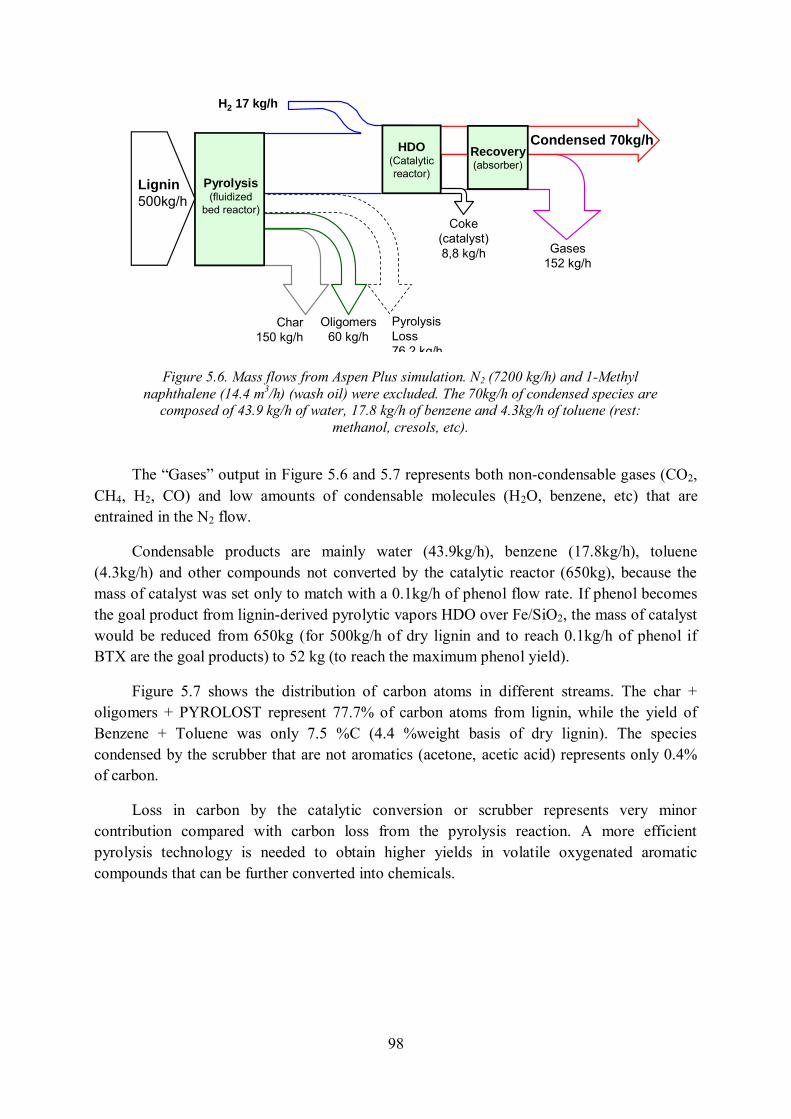
98
Figure 5.6. Mass flows from Aspen Plus simulation. N2 (7200 kg/h) and 1-Methyl
naphthalene (14.4 m3/h) (wash oil) were excluded. The 70kg/h of condensed species are composed of 43.9 kg/h of water, 17.8 kg/h of benzene and 4.3kg/h of toluene (rest:
methanol, cresols, etc).
The “Gases” output in Figure 5.6 and 5.7 represents both non-condensable gases (CO2, CH4, H2, CO) and low amounts of condensable molecules (H2O, benzene, etc) that are entrained in the N2 flow.
Condensable products are mainly water (43.9kg/h), benzene (17.8kg/h), toluene (4.3kg/h) and other compounds not converted by the catalytic reactor (650kg), because the mass of catalyst was set only to match with a 0.1kg/h of phenol flow rate. If phenol becomes the goal product from lignin-derived pyrolytic vapors HDO over Fe/SiO2, the mass of catalyst would be reduced from 650kg (for 500kg/h of dry lignin and to reach 0.1kg/h of phenol if BTX are the goal products) to 52 kg (to reach the maximum phenol yield).
Figure 5.7 shows the distribution of carbon atoms in different streams. The char + oligomers + PYROLOST represent 77.7% of carbon atoms from lignin, while the yield of Benzene + Toluene was only 7.5 %C (4.4 %weight basis of dry lignin). The species condensed by the scrubber that are not aromatics (acetone, acetic acid) represents only 0.4% of carbon.
Loss in carbon by the catalytic conversion or scrubber represents very minor contribution compared with carbon loss from the pyrolysis reaction. A more efficient pyrolysis technology is needed to obtain higher yields in volatile oxygenated aromatic compounds that can be further converted into chemicals.
H2 17 kg/h
Coke (catalyst)8,8 kg/h
Char150 kg/h
Oligomers60 kg/h
Pyrolysis Loss76,2 kg/h
Gases152 kg/h
Condensed 70kg/hHDO
(Catalyticreactor)
Pyrolysis(fluidized
bed reactor)
Lignin
500kg/h
Recovery(absorber)
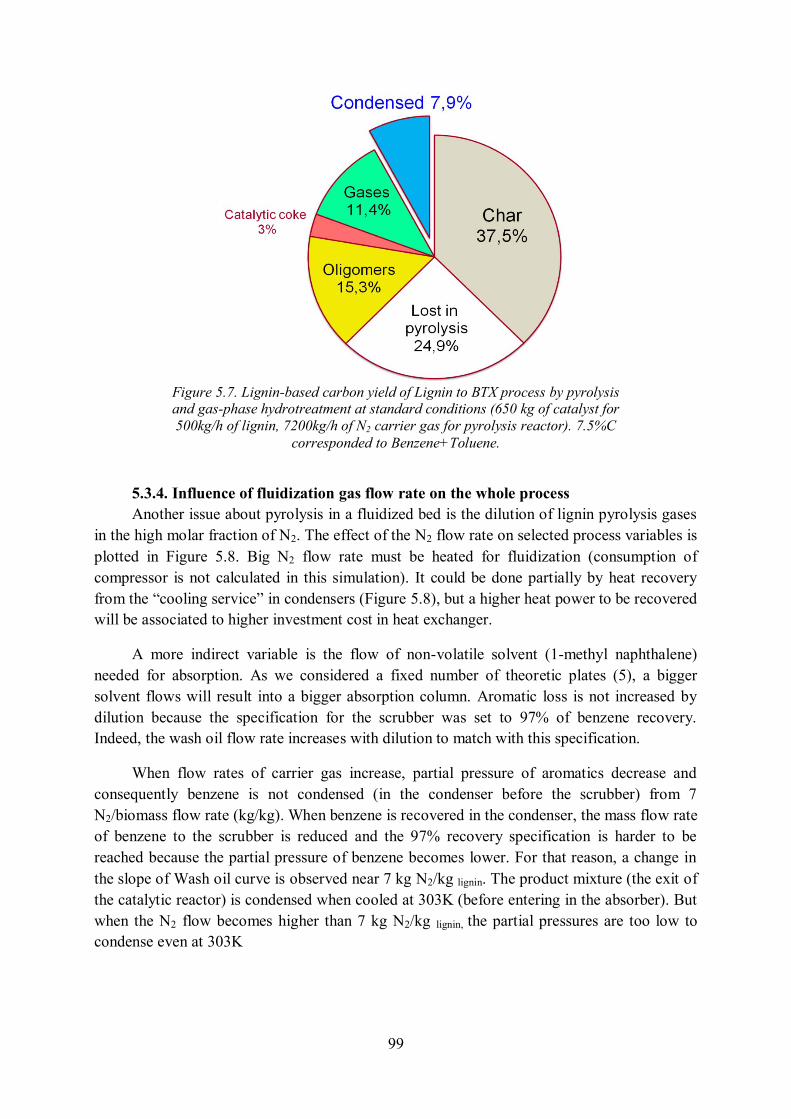
99
Figure 5.7. Lignin-based carbon yield of Lignin to BTX process by pyrolysis and gas-phase hydrotreatment at standard conditions (650 kg of catalyst for 500kg/h of lignin, 7200kg/h of N2 carrier gas for pyrolysis reactor). 7.5%C
corresponded to Benzene+Toluene.
5.3.4. Influence of fluidization gas flow rate on the whole process Another issue about pyrolysis in a fluidized bed is the dilution of lignin pyrolysis gases
in the high molar fraction of N2. The effect of the N2 flow rate on selected process variables is plotted in Figure 5.8. Big N2 flow rate must be heated for fluidization (consumption of compressor is not calculated in this simulation). It could be done partially by heat recovery from the “cooling service” in condensers (Figure 5.8), but a higher heat power to be recovered will be associated to higher investment cost in heat exchanger.
A more indirect variable is the flow of non-volatile solvent (1-methyl naphthalene) needed for absorption. As we considered a fixed number of theoretic plates (5), a bigger solvent flows will result into a bigger absorption column. Aromatic loss is not increased by dilution because the specification for the scrubber was set to 97% of benzene recovery. Indeed, the wash oil flow rate increases with dilution to match with this specification.
When flow rates of carrier gas increase, partial pressure of aromatics decrease and consequently benzene is not condensed (in the condenser before the scrubber) from 7 N2/biomass flow rate (kg/kg). When benzene is recovered in the condenser, the mass flow rate of benzene to the scrubber is reduced and the 97% recovery specification is harder to be reached because the partial pressure of benzene becomes lower. For that reason, a change in the slope of Wash oil curve is observed near 7 kg N2/kg lignin. The product mixture (the exit of the catalytic reactor) is condensed when cooled at 303K (before entering in the absorber). But when the N2 flow becomes higher than 7 kg N2/kg lignin, the partial pressures are too low to condense even at 303K

100
An important fraction of hydrogen does not react in the catalytic reactor. Figure 5.8 also shows the fraction of H2 in the cleaned gas stream. An excess of fluidization gas will impede the separation of H2 for recovery and recycling.
Figure 5.8. Effect of career gas flow rate over biomass flow rate used for pyrolysis on a) gas phase composition (H2 and Benzene %mol.),b) wash oil flow rate and extra heat needs (heat of pyrolysis is
not included).
Fe/SiO2 is active in the presence of pyrolysis gases [45]. However, an accumulation of CO2, if the clean gas is recycled without CO2 separation, could transform the gas mixture into an iron oxidizing mixture. So Fe/SiO2 will be transformed into Fe3O4/SiO2 and the activity disappears [45].
For all these reasons it would be advantageous to decrease fluidization gas flow rate as much as possible, which depends on particle class and fluidization regime [134].
Using H2 as fluidization gas could solve some of this problem but it would lead to safety problem and a high consumption in H2 if not recycled.
Furthermore, other technologies of pyrolysis reactors could be looked for [22,24].
5.4. Conclusion of Chapter 5 Lignin conversion to aromatic hydrocarbons by direct HDO of pyrolysis vapors is a
potential strategy for the valorization of dry lignin.
Basis for scaling Fe/SiO2 catalyst reactors and the overall process are given based on a semi-detailed kinetic model included in Aspen Plus. The Aspen Plus model can also be used for optimizing the BTX or phenol yield. Mass and carbon balances of the integrated lignin to BTX process are given.
Better lignin pyrolysis technologies are needed to increase the yield of monoaromatic compounds at the expense of char and lignin oligomers and to decrease the amount of carrier gas.
% m
ol
% m
ol H
2

101
Perspectives
Note: Conclusion of experimental or simulation findings are presented at the end of each chapter. This is an overall view of them, and of future challenges that lignin valorization to BTX by HDO of pyrolysis vapors may overcome.
A catalytic system for the HDO of lignin pyrolysis vapors has been developed step-by-step: from model compound (guaiacol) conversion to real gases and integration of experimental results in an Aspen Plus model of the integrated process.
Concerning catalyst selection, a selectivity problem may appear. Too active system may produce non-condensable gases from lignin vapors (CH4, CO), which are less valuable than aromatic chemicals. Some researchers used very active metals intentionally poisoned, to tailor a desired activity (Ni2P, Pt-Sn), but we showed that a catalyst as simple as iron dispersed on silica or activated carbon was active (but less than Pt or Ni) and selective.
Our goal was to use an H2-rich mixture produced from biomass gasification. But when trying different gas composition we faced a barrier. When the H2O-H2 mixture is in equilibrium with Fe3O4 (and not with Fe°), activity disappears.
Considering that (i) lignin can intake some humidity, (ii) lignin pyrolysis produces water and (iii) HDO reaction produces water, there is a minimum requirement for H2 partial pressure. Biomass gas may need to be enriched in H2 to reach this minimum. This is a drawback of iron-based catalyst. The development of a catalyst that can be more active and selective under less reductive H2O-H2 conditions is an open challenge for future research. The addition of additives to enhance the mobility of O species could be an interesting perspective.
When CO and CO2 are also added to the mixture, the problems become more complex. Many reactions can occur (such as CO hydrogenation). Moreover, it has been seen that metallic iron can be transformed to a variety of species (carbides, Fe3+, etc), and that molecules like H2O compete for adsorption sites with phenols.
Other characteristics to be enhanced are the yield in carbon deposit from guaiacol reaction and the catalyst deactivation rate, both parameters may be linked. More research is needed to identify the detailed chemistry of coke deposit when converting guaiacol.
Perspectives mentioned above can be explored using model molecules.
Research on real lignin is very different from model molecules. Lab-scale continuous pyrolysis reactors adapted for lignin were not available at CNRS-LRGP. Such a reactor with the following characteristics: feed flow rate as low as 100 mg/h, continuous operation, adaptability for all kind of lignins, fast pyrolysis, is not yet commercial to the best of our knowledge. By using a discontinuous pyrolysis reactor coupled to a catalytic reactor, lignin bio-oil quality was enhanced with iron-based catalyst with some loss of carbon yield and a decrease in the activity. Only continuous pyrolysis coupled to catalysis tests (including

102
regeneration cycles) can give accurate information about the long-term performance of the catalyst.
The loss of activity is explained by pores mouth blockage by thermal coke formed from lignin oligomers. A possible catalytic strategy to avoid this problem and enhance bio-oil yield is to use a catalyst that convert lignin oligomers into monomers before they enter into the HDO reactor (for example, a basic catalyst to accelerate the hydrolysis of C-O-C bonds).
The regeneration of HDO catalyst should be also considered since highly oxygenated aromatics will polymerize to form coke even if oligomers are destroyed. Our exploratory result shows regeneration with air and H2 is possible (at least partially) using simple Fe/Silica catalyst. Regeneration could be more complicated with sophisticated catalyst. The recovery of iron by iron-based products (and additives) impregnation and reduction during biomass pyrolysis to produce an iron-supported over a biomass char catalyst could be an interesting perspective.
HDO is an exothermic reaction, so the reactor should be designed to enhance heat transfer and process integration. Carbon deposit combustion and reducing of Fe2O3 into Fe° are also exothermic reactions. An accurate model considering internal and external mass and heat transfers is needed to identify a fast regeneration protocol that does not decrease the catalyst properties.
Nowadays, the application of this technology may be justified in the frame of carbon fiber or activated carbon co-production from lignin. The highly oxygenated byproduct tar can be converted into useful chemicals.
If the main goal is BTX and phenolic production, lignin pyrolysis may not be the better route. First, the pyrolysis of lignin must be enhanced to obtain higher yields in volatile compounds and less char. Second, better technologies for lignocellulosic biomass fractionation (such as the organosolv process) are needed. Most of them were developed to enhance the quality of cellulose but not yet to optimize energy recovery and other polymers (hemicelluloses, lignin) properties and yields.
This route (pyrolysis + HDO of vapors) need to be compared with direct catalytic pyrolysis of lignin and liquid-phase reactions (liquefaction, hydrotreatment, solvolysis… ).

103
References [1] B. Dessus, B. Devin, F. Pharabod, Houille blanche 47 (1992) 21. [2] M. Parikka, Biomass Bioenergy 27 (2004) 613. [3] N. Brosse, A. Dufour, X. Meng, Q. Sun, A. Ragauskas, Biofuels, Bioprod. Biorefin. (2012) DOI: 10.1002/bbb.1353. [4] T. Werpy, Top Value Added Chemicals From Biomass. Volume 1-Results of Screening for Potential Candidates From Sugars and Synthesis Gas, DTIC Document, 2004. [5] A. Corma, S. Iborra, A. Velty, Chem. Rev. 107 (2007) 2411. [6] A. Corma, O. de la Torre, M. Renz, Energy Environ. Sci. (2012) DOI: 10.1039/C2EE02778J. [7] T.R. Carlson, G.A. Tompsett, W.C. Conner, G.W. Huber, Top. Catal. 52 (2009) 241. [8] J. Holladay, J. Bozell, J. White, D. Johnson, Top Value-Added Chemicals from Biomass Volume II—Results of Screening for Potential Candidates from Biorefinery Lignin, U.S. Department of Energy, 2007. [9] E.-J. Shin, M.A. Keane, Ind. Eng. Chem. Res. 39 (2000) 883. [10] N. Mahata, K.V. Raghavan, V. Vishwanathan, M.A. Keane, Reaction Kinetics and Catalysis Letters 72 (2001) 297–302. [11] M.A. Gonzalez-Borja, D.E. Resasco, Energy Fuels 25 (2011) 4155. [12] X. Zhu, R.G. Mallinson, D.E. Resasco, Appl. Catal. A 379 (2010) 172. [13] X. Zhu, L.L. Lobban, R.G. Mallinson, D.E. Resasco, J. Catal. (2011). [14] H.Y. Zhao, D. Li, P. Bui, S.T. Oyama, Appl. Catal. A 391 (2011) 305. [15] V.N. Bui, D. Laurenti, P. Delichere, C. Geantet, Appl. Catal. B 101 (2010) 246. [16] V.N. Bui, D. Laurenti, P. Afanasiev, C. Geantet, Appl. Catal. B 101 (2011) 239. [17] P.H. Emmett, N. Skau, J. Am. Chem. Soc. 65 (1943) 1029–1035. [18] K.J. Yoon, M.A. Vannice, J. Catal. 82 (1983) 457. [19] A. Popov, E. Kondratieva, J.M. Goupil, L. Mariey, P. Bazin, J.-P. Gilson, A. Travert, F. Mauge, J. Phys. Chem. C 114 (2010) 15661. [20] E. Furimsky, Appl. Catal. A 199 (2000) 147–190. [21] R.N. Olcese, M. Bettahar, D. Petitjean, J.-C. Moise, A. Dufour, in:, First International Congress on Catalysis for Biorefineries (CatBior), Torremolinos-Malaga, Spain, 2011, p. 288-293. [22] D.J. Nowakowski, A.V. Bridgwater, D.C. Elliott, D. Meier, P. de Wild, J. Anal. Appl. Pyrolysis 88 (2010) 53. [23] A. Dufour, M. Castro-Diaz, N. Brosse, P. Marchal, M. Bouroukba, R.N. Olcese, C. Snape, in:, San Diego, ACS meeting, 2012. [24] C. Briens, in:, The International Conference on Thermochemical Conversion Science, Chicago, 2011. [25] G.W. Huber, S. Iborra, A. Corma, Chem. Rev. 106 (2006) 4044. [26] Biomass Program: Feedstock Composition and Property Database http://www.afdc.energy.gov/biomass/progs/search1.cgi (2012). [27] J. Zakzeski, P.C.A. Bruijnincx, A.L. Jongerius, B.M. Weckhuysen, Chem. Rev. 110 (2010) 3552. [28] T.J. Haas, M.R. Nimlos, B.S. Donohoe, Energy Fuels 23 (2009) 3810–3817. [29] K. Barta, T.D. Matson, M.L. Fettig, S.L. Scott, A.V. Iretskii, P.C. Ford, Green Chem. 12 (2010) 1640. [30] R. Bayerbach, D. Meier, J. Anal. Appl. Pyrolysis 85 (2009) 98. [31] G. Xiao, M. Ni, R. Xiao, X. Gao, K. Cen, Journal of Biobased Materials and Bioenergy 6 (2012) 69. [32] J. Haveren, E.L. Scott, J. Sanders, Biofuels, Bioprod. Biorefin. 2 (2008) 41–57. [33] D. Goheen, in:, Lignin Structure and Reactions, ACS, 1966, p. 205–225.

104
[34] Kirk-Othmer Encyclopedia 4th Edition, 1993. [35] M. Weber, M. Weber, in:, L. Pilato (Éd.), Phenolic Resins: A Century of Progress, Springer Berlin Heidelberg, Berlin, Heidelberg, 2010, p. 9-23. [36] M. Inaba, K. Murata, M. Saito, I. Takahara, Reaction Kinetics and Catalysis Letters 88 (2006) 135. [37] G. Rødsrud, M. Lersch, A. Sjöde, Biomass Bioenergy (2012). [38] http://www.greencarcongress.com/2009/09/mascoma-chevron.html (s. d.). [39] H. Parkhurst, D. Huibers, M. Jones, in:, Symposium on Alternate Feedstocks for Petrochemicals ACS San Francisco Meeting, 1980, p. 657-667. [40] J.S. Shabtai, W.W. Zmierczak, E. Chornet, D. Johnson, Process for converting lignins into a high octane blending component. Patent US20030115792, 2003. [41] C.A. Mullen, A.A. Boateng, Fuel Process. Technol. 91 (2010) 1446. [42] Z. Ma, E. Troussard, J.A. van Bokhoven, Appl. Catal. A (2012). [43] P. de Wild, R. Van der Laan, A. Kloekhorst, E. Heeres, Environ. Prog. Sustainable Energy 28 (2009) 461. [44] R.N. Olcese, M. Bettahar, D. Petitjean, B. Malaman, F. Giovanella, A. Dufour, Appl. Catal. B 115-116 (2012) 63. [45] R.N. Olcese, M.M. Bettahar, B. Malaman, J. Ghanbaja, L. Tibavisco, D. Petitjean, A. Dufour, Submitted to Appl Catal B (2012). [46] R.. Pindoria, A. Megaritis, A.. Herod, R. Kandiyoti, Fuel 77 (1998) 1715. [47] G.W. Huber, R.D. Cortright, J.A. Dumesic, Angew. Chem. Int. Ed. 43 (2004) 1549–1551. [48] P.T. Williams, P.A. Horne, Fuel 74 (1995) 1839. [49] M.A. Jackson, D.L. Compton, A.A. Boateng, J. Anal. Appl. Pyrolysis 85 (2009) 226–230. [50] A. Aho, N. Kumar, A. Lashkul, K. Eränen, M. Ziolek, P. Decyk, T. Salmi, B. Holmbom, M. Hupa, D.Y. Murzin, Fuel 89 (2010) 1992–2000. [51] B. Valle, A.G. Gayubo, A.T. Aguayo, M. Olazar, J. Bilbao, Energy Fuels 24 (2010) 2060–2070. [52] D.J. Mihalcik, A.A. Boateng, C.A. Mullen, N.M. Goldberg, Ind. Eng. Chem. Res. 50 (2011) 13304–13312. [53] A.G. Gayubo, A.T. Aguayo, A. Atutxa, R. Aguado, J. Bilbao, Ind. Eng. Chem. Res. 43 (2004) 2610. [54] J. Jae, G.A. Tompsett, Y.-C. Lin, T.R. Carlson, J. Shen, T. Zhang, B. Yang, C.E. Wyman, W.C. Conner, G.W. Huber, Energy Environ. Sci. 3 (2010) 358. [55] A. Oasmaa, A. Johansson, Energy Fuels 7 (1993) 426–429. [56] M. Kleinert, T. Barth, Energy Fuels 22 (2008) 1371. [57] A.I. Afifi, E. Chornet, R.W. Thring, R.P. Overend, Fuel 75 (1996) 509–516. [58] D.C. Elliott, Energy Fuels 21 (2007) 1792. [59] V.A. Yakovlev, S.A. Khromova, O.V. Sherstyuk, V.O. Dundich, D.Y. Ermakov, V.M. Novopashina, M.Y. Lebedev, O. Bulavchenko, V.N. Parmon, Catal. Today 144 (2009) 362. [60] B. Scholze, D. Meier, J. Anal. Appl. Pyrolysis 60 (2001) 41. [61] B. Scholze, C. Hanser, D. Meier, J. Anal. Appl. Pyrolysis 58–59 (2001) 387. [62] R. Bayerbach, V.D. Nguyen, U. Schurr, D. Meier, J. Anal. Appl. Pyrolysis 77 (2006) 95. [63] O. Faix, D. Meier, I. Grobe, J. Anal. Appl. Pyrolysis 11 (1987) 403–416. [64] T. Faravelli, A. Frassoldati, G. Migliavacca, E. Ranzi, Biomass Bioenergy 34 (2010) 290–301. [65] C. Amen-Chen, H. Pakdel, C. Roy, Bioresour. Technol. 79 (2001) 277–299.

105
[66] D.K. Shen, S. Gu, K.H. Luo, S.R. Wang, M.X. Fang, Bioresour. Technol. 101 (2010) 6136. [67] O.D. Mante, F.A. Agblevor, S.T. Oyama, R. McClung, Bioresour. Technol. 111 (2012) 482. [68] V.N. Bui, G. Toussaint, D. Laurenti, C. Mirodatos, C. Geantet, Catal. Today 143 (2009) 172. [69] T. Nimmanwudipong, R. Runnebaum, D. Block, B. Gates, Catal. Lett. 141 (2011) 779. [70] S.D. Lin, M.A. Vannice, J. Catal. 143 (1993) 539–553. [71] S.D. Lin, M.A. Vannice, J. Catal. 143 (1993) 554–562. [72] M. Houalla, B. Delmon, J. Phys. Chem. 84 (1980) 2194–2199. [73] S. Noskova, M. Borisova, V. Dzisko, Kinet Katal (1975) 497. [74] C.H. Bartholomew, R.J. Farrauto, J. Catal. 45 (1976) 41–53. [75] A. Centeno, E. Laurent, B. Delmon, J. Catal. 154 (1995) 288. [76] M. Huuska, J. Rintala, J. Catal. 94 (1985) 230. [77] M. Ferrari, S. Bosmans, R. Maggi, B. Delmon, P. Grange, Catal. Today 65 (2001) 257–264. [78] M. Ferrari, B. Delmon, P. Grange, Microporous Mesoporous Mater. 56 (2002) 279. [79] A. Jasik, R. Wojcieszak, S. Monteverdi, M. Ziolek, M.M. Bettahar, J. Mol. Catal. A: Chem. 242 (2005) 81. [80] E. Antonakou, A. Lappas, M.H. Nilsen, A. Bouzga, M. Stöcker, Fuel 85 (2006) 2202–2212. [81] B. Valle, P. Castaño, M. Olazar, J. Bilbao, A.G. Gayubo, J. Catal. 285 (2012) 304. [82] http://www.c.morley.dsl.pipex.com/ (visited 1.10.2011). (s. d.). [83] C. Muller, V. Michel, G. Scacchi, G.M. Côme, J. Chim. Phys. 92 (1995) 1154–1178. [84] J. Good et al., The international standard for tar and particle measurement in biomass producergas www.eeci.net, CEN BT/TF 143 « Organic contaminants ( »tar« ) in biomass producer gases », 2005. [85] A. Dufour, P. Girods, E. Masson, S. Normand, Y. Rogaume, A. Zoulalian, J. Chromatogr. A 1164 (2007) 240. [86] J. Carignan, P. Hild, G. Mevelle, J. Morel, D. Yeghicheyan, Geostandards Newsletter 25 (2007) 187. [87] J. Rodríguez-Carvajal, Physica B: Condensed Matter 192 (1993) 55. [88] G. Le Caer, IJL-CNRS, private communication., s. d. [89] A. Dufour, A. Celzard, B. Ouartassi, F. Broust, V. Fierro, A. Zoulalian, Appl. Catal. A 360 (2009) 120. [90] R. Cypres, Fuel Process. Technol. 15 (1987) 1. [91] A. Dufour, E. Masson, P. Girods, Y. Rogaume, A. Zoulalian, Energy Fuels 25 (2011) 4182. [92] http://rruff.geo.arizona.edu/AMS/amcsd.php (visited 1.10.2011). (s. d.). [93] P. Decyk, M. Trejda, M. Ziolek, J. Kujawa, K. Głaszczka, M. Bettahar, S. Monteverdi, M. Mercy, J. Catal. 219 (2003) 146. [94] S. Velu, M.P. Kapoor, S. Inagaki, K. Suzuki, Appl. Catal. A 245 (2003) 317–331. [95] S.G. Shore, E. Ding, C. Park, M.A. Keane, Catal. Commun. 3 (2002) 77–84. [96] C. Perego, S. Amarilli, A. Carati, C. Flego, G. Pazzuconi, C. Rizzo, G. Bellussi, Microporous Mesoporous Mater. 27 (1999) 345–354. [97] F. Benseradj, F. Sadi, M. Chater, Appl. Catal. A 228 (2002) 135–144. [98] W.C. Conner Jr, J.L. Falconer, Chem. Rev. 95 (1995) 759–788. [99] R. Wojcieszak, S. Monteverdi, J. Ghanbaja, M.M. Bettahar, J. Colloid Interface Sci. 317 (2008) 166–174.
106
[100] J. Galuszka, T. Sang, J.A. Sawicki, J. Catal. 136 (1992) 96. [101] B. Kalska-Szostko, M. Zubowska, D. Satula, in:, Proceedings of the XL Zakopane School of Physics, Poland, 2006, p. 365-369. [102] R.E. Vandenberghe, I. Nedkov, T. Merodiiska, L. Slavov, Hyperfine Interactions 165 (2006) 267. [103] C. Sepúlveda, K. Leiva, R. García, L.R. Radovic, I.T. Ghampson, W.J. DeSisto, J.L.G. Fierro, N. Escalona, Catal. Today 172 (2011) 232. [104] A.A. Chen, M.A. Vannice, J. Phillips, J. Phys. Chem. 91 (1987) 6257–6269. [105] G.D. Weatherbee, C.H. Bartholomew, J. Catal. 87 (1984) 352. [106] S. Janbroers, J.N. Louwen, H.W. Zandbergen, P.J. Kooyman, J. Catal. 268 (2009) 235. [107] G. Neri, A.M. Visco, A. Donato, C. Milone, M. Malentacchi, G. Gubitosa, Appl. Catal. A 110 (1994) 49. [108] E. Laurent, B. Delmon, Ind. Eng. Chem. Res. 32 (1993) 2516–2524. [109] M.A. Keane, R. Larsson, Catalysis Letters 129 (2009) 93. [110] E.O. Odebunmi, D.F. Ollis, J. Catal. 80 (1983) 56. [111] F. Rodríguez-reinoso, Carbon 36 (1998) 159. [112] A. Dufour, A. Celzard, V. Fierro, E. Martin, F. Broust, A. Zoulalian, Appl. Catal. A 346 (2008) 164. [113] Z. Min, P. Yimsiri, M. Asadullah, S. Zhang, C.-Z. Li, Fuel 90 (2011) 2545. [114] J. Rodriguez-Mirasol, T. Cordero, J.J. Rodriguez, Energy Fuels 7 (1993) 133. [115] S. Baumlin, F. Broust, M. Ferrer, N. Meunier, E. Marty, J. Lédé, Chem. Eng. Sci. 60 (2005) 41. [116] J.-Y. de Saint Laumer, E. Cicchetti, P. Merle, J. Egger, A. Chaintreau, Anal. Chem. 82 (2010) 6457. [117] D. Johnson, E. Chornet, W. Zmierczak, J. Shabtai, Fuel Chemistry Division Preprints (2002) 380. [118] A. Effendi, H. Gerhauser, A.V. Bridgwater, Renewable and Sustainable Energy Rev. 12 (2008) 2092. [119] M.B. Neuworth, Transmethylation of Methyl-Substituted Phenols, U.S. Patent 3417149, 1968. [120] K.-H. Keim, R. Kiauk, E. Meisenburg, Process for the catalytic isomerization of o-cresol, U.S. Patent 4283571, 1981. [121] T. Davidian, N. Guilhaume, E. Iojoiu, H. Provendier, C. Mirodatos, Appl. Catal. B 73 (2007) 116. [122] Y. Richardson, J. Blin, G. Volle, J. Motuzas, A. Julbe, Appl. Catal. A 382 (2010) 220. [123] J.F. Kadla, S. Kubo, R.A. Venditti, R.D. Gilbert, A.L. Compere, W. Griffith, Carbon 40 (2002) 2913–2920. [124] L. Abdelouahed, O. Authier, G. Mauviel, J.P. Corriou, G. Verdier, A. Dufour, Energy Fuels (2012). [125] J. François, L. Abdelouahed, G. Mauviel, M. Feidt, O. Mirgaux, C. Rogaume, F. Patisson, A. Dufour, in:, 4th International Conference on Engineering for Waste and Biomass Valorisation, Porto, 2012. [126] R.K. Sharma, J.B. Wooten, V.L. Baliga, X. Lin, W. Geoffrey Chan, M.R. Hajaligol, Fuel 83 (2004) 1469. [127] D. Elliott, PyNe IEA Bioenergy Task 34 Newsletter 30 (2011). [128] H.-G. Franck, H.-G. Franck, J.W. Stadelhofer, Industrial Aromatic Chemistry: Raw Materials, Processes, Products, Springer-Verlag, 1988. [129] J. Farmer, Benzene Emission from Coke by-Product Recovery Plants - Background Information for Proposed Standards, U. S. Environmental Protection Agency, 1984.

107
[130] T.R. Carlson, Y.-T. Cheng, J. Jae, G.W. Huber, Energy Environ. Sci. 4 (2011) 145. [131] V. LaVopa, C.N. Satterfield, Energy Fuels 1 (1987) 323–331. [132] N. Marín-Astorga, G. Pecchi, J.L.G. Fierro, P. Reyes, J. Mol. Catal. A: Chem. 231 (2005) 67. [133] P. Forzatti, L. Lietti, Catal. Today 52 (1999) 165. [134] D. Geldart, Powder technology 7 (1973) 285–292. [135] J. Zieliński, I. Zglinicka, L. Znak, Z. Kaszkur, Appl. Catal. A 381 (2010) 191. [136] J.. Moulijn, A.. van Diepen, F. Kapteijn, Appl. Catal. A 212 (2001) 3. [137] D. Green, Perry’s Chemical Engineers’ Handbook 8th Edition, McGraw-Hill, 2007. [138] J.M. Ortega, A.G. Gayubo, A.T. Aguayo, P.L. Benito, J. Bilbao, Ind. Eng. Chem. Res. 36 (1997) 60. [139] C. Kern, A. Jess, Chem. Eng. Sci. 60 (2005) 4249. [140] C.A. Querini, S.C. Fung, Appl. Catal. A 117 (1994) 53. [141] A. Bourane, D. Bianchi, J. Catal. 218 (2003) 447.

108
Annex 1. Determination of the modified Thiele modulus to assess mass transfers by internal diffusion.
Internal diffusion limitation was investigated through modified Thiele modulus calculation as in [89].
The modified Thiele modulus, , is a dimensionless number which reads:
p
2
pGUAe
pGUAGUA0
NSCD
VXF
where GUAGUA0 XF is the molar flow rate of guaiacol converted inside the catalyst bed
(mol s-1), Vp is the outer volume of a particle of silica (100-160µm), assumed to be spherical (m3), De is the effective diffusivity (m2 s-1),
GUAC is the molar concentration of guaiacol (mol m-3), Sp is the outer surface area of a particle (m2), and Np is the number of particles of the bed.
Gas transport within the silica particles is assumed to take place mainly according to Knudsen diffusion (mean free path of guaiacol molecules higher than the typical pore size).
Knudsen diffusivity, DK (m2 s-1) is such that:
GUA
KM
RT8
3
dD
where d is the average pore diameter (m), and GUAM is the molecular weight of guaiacol
(kg mol-1). Knudsen diffusivities were calculated for pore diameter of 10 nm.
The effective diffusivity is described by an effective diffusion coefficient, De, which reads:
Ke DD
where and are the porosity of the silica particles and the tortuosity of their pores, respectively.
Measuring De is a difficult experimental task, notably because of the high temperature involved. Moreover, to the authors’ knowledge, no previous work ever dealt so far with diffusion of guaiacol at high temperature in silica pores. This is the reason why the effective diffusivities were assumed for / = 0.5 /2.
The modified Thiele modulus, , calculated for the nominal conditions (70% of guaiacol conversion) is of about 0.028 for pores of 10nm (0.283 for pores of 1nm). It is always lower than 0.4. Under these conditions, the guaiacol conversion rate should not be

109
limited by internal diffusion in pores. The catalytic tests were thus conducted under chemical regime.

110
Annex 2. Details of XRD and carbon balance of Chapter 2.
XRD pattern of the spent catalyst is given in figure S.1.
The XRD pattern of spent Fe//SiO2 catalyst in Figure A-2.1 showed the presence of α-Fe as major phase before and after reaction as showed by the signals 2θλKαCu = 44.6◦, 64.9◦ and 83° [92,93]. The crystallite size evaluated for 110 lines (2θλKαCu of 45°) of iron indicated that the average size of crystallites was about 10 nm. Other minor peaks on XRD patterns of spent catalyst could be explained by the presence of magnetite (Fe3O4, 2θλKαCu = 35.5° and 62.9°) and/or maghemite (Fe2O3, 2θλKαCu = 35.75° and 63.14°). Iron oxides are a minor phase after reduction and after guaiacol conversion.
Figure A-2.1 XRD pattern of the spent catalyst after 4h of guaiacol conversion (λKαCu).
Evolution of coke deposit with time on stream
Figure A-2.2 shows no evolution of GC carbon balance with time on stream. Coke formation could be related to this GC carbon balance and does not seem to increase with time on stream. Coke formation could reduce the catalyst selectivity and thus increase the coke formation. On the opposite the coke deposition could be reduced due to a lower acidity of coke compared with SiO2 and a lower HDO conversion upon time on stream.

111
Figure A-2.2. Evolution of GC carbon balance (carbon analyzed by GC in aromatics and in permanent gases at the outlet/carbon injected by guaiacol) and HDO conversion
as a function of time on stream (same conditions than in Figure 2.2 in Chapter 2).
0
20
40
60
80
100
0 100 200 300
%
Time on stream (min)
GC carbon balance
HDO conversion

112
Annex 3. Numerical example of the calculation of coke yield.
Two values needs to be calculated from catalytic run: the real mass of catalyst initially inserted and the number of moles of guaiacol converted during the whole catalytic test.
Fe2O3/SiO2 is weighted. The proportion of Fe2O3 to SiO2 is such that the catalyst will reach the desired iron mass load once reduced (for example 10%Fe/SiO2 or wγ-Fe/( wγ-Fe+ wSiO2) = 0.1). It results that we are weighting oxygen atoms linked to iron that will go away during in-situ reduction.
Consider that 80 mg of Fe2O3/SiO2 were weighted before catalytic test. That corresponds to the mass of Silica, iron and oxygen contained in Hematite such as:
)(280 HematiteoSiOFe WWWmg (A-3.1)
Iron to silica mass ratio is 10%
2
1.0SiOFe
Fe
WWW
(A-3.2)
WFe + WSiO2 is the real mass of catalyst, after reduction, during the catalytic reaction that we need to calculate. The mass of iron is WFe = AWFe.n°Fe (n°Fe : number of moles of iron atoms, AW: atomic weight i.e. 55.85 g/mol). The number of oxygen atoms is n°O = 3/2.n°Fe considering the proportions of Hematite. Hematite-derived mass of oxygen is WO = AWO.n°O (AWO = 16 g/mol). Those terms are included in Equation A-2.2.
)(043.0.32.1.0
2
2
)(SiOFeO
O
Fe
SiOFe
HemO WWWAWAW
WWW
(A-3.3)
Combining (A-3.1) and (A-3.3) leads to:
CatalSiOFe WmgmgWW Re7.76
043.180
2 (A-3.4)
Consequently, the real mass of catalyst on the experiment was 76,7 mg.
The number of moles of guaiacol converted is calculated from catalytic run. The n° of moles of guaiacol converted per minute is F°gua.Xgua. F°gua is 17.86 µmol/minutes and Xgua goes from 0 to 1. Integral was calculated using trapezoid method along 187 min. Values were between 800-2300 µmol.
From Temperature Programmed Oxidation (TPO) test two values are needed: the mass of spent catalyst introduced in the test (let’s consider 40 mg) and the integral of CO2 signal on the µGC. The raw signal was treated as follows: air CO2 content (0.038%) and baseline were subtracted and negative values were replaced by 0%vol. CO2 data was then converted into

113
molar flow rate considering that the total flow rate remained unchanged Fv = 50 ml STP/min (STP: 1atm, 298K) and ideal gases. This signal was then integrated along time of test (Equation 5). 300 µmol CO2 was a typical value.
RTdvolF
n COvTPOCO .100
..%2
2 (A-3.5)
Then considering that all carbon deposit on catalyst where purely carbon C(s). The mass of coke of spent catalyst was 0.57 mmol x 12mg/mmol = 3.6 mg. So considering Equation A-3.6, the mass of catalyst inserted on the TPO test is 40mg – 3.6mg = 36.4 mg .
TPOcoke
TPOTPOcatreal
TPOcoke
TPOcatreal
TPO WWWWWW (A-3.6)
The mass of coke produced during the whole catalytic run can be calculated by Equation A-3.7, and converted to 7.6 mg / 12 mg/mmol = 0.63 mmol (630 µmol).
mgmg
mgmgw
wwW TPO
Catalyst
RunCatCatalyst
TPOCokeRunCat
Coke 6.74.36
7.76.6.3. (A-3.7)
Finally the coke carbon yield is the number of moles of coke divided by the number of moles Carbon of guaiacol converted, i.e. 630 µmolcoke produced/(7.1500 µmolguaiacol converted) = 0.06 (6%).

114
Annex 4 .Fittings and discussion on Mössbauer spectra of Chapter 3
Figure A-4.1. Observed and calculated Mössbauer spectra of 10%Fe/AC fresh passivated. Typical signal of -Fe is observed. The blue doublet represents Fe3+ species not detected by XRD.
Figure A-4.2. Observed and calculated Mössbauer spectra of 15%Fe/SiO2 fresh passivated. A typical signal of -Fe is observed (42%) and a large doublet (28%), in the central part, completes the spectrum. This doublet (blue dotted line) corresponds to Fe3+ species as previously observed in the other samples. However, these two multiplets could not explain the whole observed absorption area. Very broad peaks (red markers) are not taken into account. The proportion area of these peaks has been estimated to 30%. They correspond to the magnetite clearly detected by XRD. The external peaks correspond to ordered magnetites with various grain sizes (see reference [101]) and the central ones are ascribed as superparamagnetic particles of magnetite.

115
Figure A-4.3. Observed and calculated Mössbauer spectra of 15%Fe/SiO2 Gua+H2+CO2+CO+H2O. Typical signals of -Fe and χ-Fe5C2 are observed. The blue doublet represents Fe3+ species not detected by XRD. Since unidentified phases represent 40% of the areaof the spectrum, 4 singlets were used to fit this lacking area (blue dotted lines). They probably correspond to small particles of “superparamagnetic magnetite” which is clearly observed by XRD.
Figure A-4.4. Observed and calculated Mössbauer spectra of 10%Fe/SiO2 Gua+H2+CO. A typical signal of χ-Fe5C2 is observed. The blue doublet represents Fe3+ species not detected by XRD.
Figure A-4.5. Observed and calculated Mössbauer spectra of 10%Fe/SiO2 Gua+H2+CO2. Typical signals of -Fe and χ-Fe5C2 are observed. According to XRD, the central broad doublet (blue dotted line) could be assigned to superparamagnetic signal of magnetite

116
Annex 5. Regeneration of Fe/Silica catalyst
A-5.1. Introduction
Lignin pyrolysis produces several oligomers and precursors of carbon deposit (Chapter 4). The accumulation of carbon deposits reduces the catalytic activity (Chapter 2, 3, 4 and 5). For that reason a strategy must be developed to regenerate spent catalyst.
Carbon deposit can be removed by combustion (with O2 or air), or gasification (H2O, CO2). However, the carbon reaction with O2 is exothermic, and temperatures in the vicinity of carbon deposit could be high enough to agglomerate silica-supported iron particles, thus reducing the number of active sites. Moreover, iron must be re-reduced after oxidation to be active.
We tried to regenerate Fe/SiO2 catalyst by direct contact with air at reaction’s temperature, and then re-exposing the catalyst to the reactant mixture. Results and perspectives are presented here.
A-5.2. Experimental
15%Fe/Silica catalyst was prepared as described in Chapter 3. The fixed bed, TPO, TEM, Mössbauer, X-Ray Diffraction and GC analysis were also similar.
The coking-regeneration experiment was made on 8 mm pyrex reactor. 1000 mg of 15%w Fe/SiO2 catalyst were reduced and stabilised, then it was treated with a mixture of 2% Guaiacol, 2% CO, 2% H2O, 5% CO2, 50% H2, rest Ar for 2 h at 673 K in order to generate large amounts of coke. The regeneration protocol consisted in treating the catalyst with a air-Ar mixture (2% O2) for 10 min at 50 Nml/min and 673 K, and then with air (50 Nml/min, 673 K) for 50 min. Such a stepwise oxidation (starting with 2%vol. O2) was thought to reduce over-temperature. The CO + CO2 produced by carbonaceous deposit burning were measured by µGC. After that the catalyst was directly contacted with nominal reactive mixture (1% Guaiacol, 2% CO, 2% H2O, 5% CO2, 50% H2, rest Ar), without pre-reduction and the catalytic activity was analyzed as described in Chapter 3 by GC analysis (conversion of guaiacol, etc.). Catalyst was cold down to room temperature under Argon flow. A scheme of this procedure is presented on Figure A-5.1.
117
Figure A-5.1. An explanation of coking-regeneration technique. The first reaction was done intentionally at 2%vol guaiacol to produce more coke.
A-5.3. Results
A-5.3.1 Regeneration of catalyst by oxidation
After coking conditions (2%vol. guaiacol), air was slowly injected to the catalyst (2%O2 during 10 min, then pure air during 50 min, always at 673K). Figure A-5.2 shows the profile of COx produced during O2 injection. A fast combustion is shown leading to a sharp peak that lasted no more than 10 min.
Figure A-5.2. Carbon flow (measured by µGC) from catalyst regeneration by exposure to 2% O2 (10 min) and then air at 673K
After this treatment, the standard reactants mixture was injected (50% H2, 5% CO2, 2% CO, 2% H2O, 1% Guaiacol, rest Argon). Figure A-5.3-a shows the guaiacol conversion and

118
yield of the conversion of guaiacol for the regenerated catalyst, and Figure A-5.3-b shows the results under the same conditions for a fresh catalyst (after reduction).
Figure A-5.3-a. Yield of products from guaiacol conversion on coked-regenerated silica supported iron catalyst (1000mg 15%Fe/SiO2, T=673K, P=1 atm, 50% H2, 5% CO2, 2% CO, 2% H2O, 1% Guaiacol, rest Argon)
Figure A-5.3-b. Yield of products from guaiacol conversion on fresh silica supported iron catalyst (1000mg 15%Fe/SiO2, T=673K, P=1 atm, 50% H2, 5% CO2, 2% CO, 2% H2O, 1% Guaiacol, rest Argon)
The activity of the catalyst has been degraded by regeneration. Some guaiacol comes out from the reactor on the regenerated catalyst, while it is totally converted during the 3 hours run on the fresh catalyst. Moreover, the selectivity was changed. For the fresh catalyst (Figure A-5.3-b), guaiacol is converted to phenol and benzene; while benzene or toluene productions are negligible on coked-regenerated catalyst.
A-5.3.2 Characterization of regenerated material
In order to identify possible sources of activity lost, some characterizations were done on this coked-regenerated-reused catalyst (XRD, Mossbauer, TEM). We are aware that it would have been more correct to characterize the catalyst just after carbon deposit burn out (before re-contacting it with reactant mixture) but this was just an explorative experiment.
Figure A-5.4-a. XRD of used-regenerated-reused 15%Fe/Silica catalyst (stars are signals corresponding to Fe3O4)
Figure A-5.4-b. Mössbauer spectroscopy of used-regenerated-reused 15%Fe/Silica catalyst.
119
Figure A-5.4-a and A-5.4-b show the XRD and Mössbauer results respectively. Typical Fe3O4 signals were found; instead, in Chapter 2 and 3, fresh catalyst showed reduced Fe° signals. The reactant mixture cannot reduce iron. The H2O/H2 ratio (0.05) was calculated to convert Fe3O4 into Fe° (at 673K [135]). However, the other oxidizing species in the reactant mixture (CO2, guaiacol) may impede the reduction of Fe3O4.
Figure A-5.5. An agglomerate of iron particles on a 15% Fe/SiO2 catalyst regenerated by direct exposure to air at 673K.
Figure A-5.5 shows a TEM image of an agglomerate of iron particles on coked-regenerated-reused catalyst. This was neither observed on fresh Fe/SiO2, nor in used catalyst without regeneration. Moreover, the average diameter of iron particles on silica (calculated from analysis of TEM images) increased from 13.6 nm on fresh catalyst (Chapter 3) to 29 nm for regenerated catalyst.
a) b) Figure A-5.6. TEM-image of 15%Fe/Silica catalyst a) Fresh catalyst b) After coking, violent regeneration by direct exposure to air at 673K and re-used.
Figure A-5.6-a and A-5.6-b show a TEM image of fresh and regenerated catalyst respectively, with a similar scale. The violent treatment during regeneration produced also a modification of the shape of silica colloids. The colloids in regenerated sample are “stuck” together and their surface is less rough than fresh catalyst. This could also cause deactivation

120
since silica surface chemical functions participate on the reaction [19,44]. Surface structural properties (area and pore sizes) of regenerated catalyst were not analyzed.
A-5.3.3 Reduction of regenerated material
From this result we can conclude that there are, at least, three possible phenomena which could cause the non-recovery of catalytic activity: Fe oxidation, iron particle agglomeration (sintering) and/or silica surface degradation [133].
In order to identify the cause of non-recovery of catalytic activity, the regenerated catalyst was reduced in-situ under a pure H2 50 Nml/min flow at 5K/min from 298 to 773K, and tested for guaiacol conversion in reactant standard mixture (50% H2, 5% CO2, 2% CO, 2% H2O, 1% Guaiacol, rest Argon). The amount of catalyst used was 116 mg for the regenerated catalyst, it was compared with an run using 58 mg of fresh catalyst (taken from Chapter 3) in order to keep the exposed iron surface to a constant value of 0.5 m2 of exposed iron (to take into consideration the lost of exposed iron per gram due to increase in iron particles’ diameter). Figure A-5.7 shows the results for both runs. A fair accordance on guaiacol conversion as well on phenol and BT yields is found along time on stream. The activity per m2 of iron seems to be completely recovered after the violent regeneration and re-reduction.
Figure A-5.7. Comparison between fresh and regenerated re reduced catalyst
A-5.4. Discussion
The mobility of supported metal and oxides is affected mostly by temperature, but some influence of the atmosphere nature and support interaction may exist [133,136]. The minimum sintering temperature can be predicted by the empirical Tamman equation (Equation A-5.1). The Hüttig equation (A-5.2) predicts the minimum temperature where atom crystallographic defects become mobile. Table 1 summarizes data for possible iron species.

121
TTamman=0.5 x Tmelting (K) Equation A-5.1
THüttig=0.3 x Tmelting (K) Equation A-5.2
Table A-5.1. Tamman and Hüttig temperatures for iron oxides. Iron-specie Tmelting [137] (K) TTamman (K) THüttig (K)
Fe° 1808 904 542 Fe3O4 1811 906 543 Fe2O3 1833 917 550 FeO* 1693 847 508
* The formation of FeO requires temperatures superior to 823K and specific H2/H2O ratios [135] (will not happen in air flow).
Reaction temperature (673K) is higher than Hüttig temperature of iron, so the lost of crystallographic defects may be unavoidable under our conditions for guaiacol HDO. Tamman temperatures for oxides and Fe° are in the range of 904-917K.
The sintering of Fe/SiO2 is thus explained as follows: the direct exposure to 2%vol O2 was too violent for the catalyst. Heat produced by coke combustion and iron oxidation was not conveniently evacuated, and the iron particles’ temperature reached TTamman. From Table A-5.1 we can deduce that a controlled oxidation of Fe/Silica catalyst to Fe2O3 prior to combustion of carbon deposit would allow higher temperatures without sintering. Furthermore, regeneration methods by a low partial pressure of O2 and/or with H2O (which leads to endothermal reactions) could be looked for.
Temperature Programmed Oxidation of used catalyst (Chapter 2,3 and 4) showed peaks until 715K. So it is possible to burn out carbon deposit without reaching TTamman (917K).
A protocol for the regeneration of Fe/Silica catalyst (used on HDO of real lignin pyrolysis vapors) must be carefully designed under this criterion. Modeling reactor heat transfer and extra and intra particle heat and mass transfer is needed to develop such protocol. For that reason calorimetric measures for different carbon deposits oxidation are needed [81,138], since its nature is not fully identified. Moreover, Fe° oxidation and carbon deposit oxidation may be affected by its surroundings (e.g. iron species can catalyze carbon deposit oxidation).
References on modeling coke oxidation are [139] (regeneration in a fixed bed reactor) and [140] (modeling of TPO).
On the other hand, the oxidation state of iron must be reduced (iron-zero) to be active. The direct exposure to reactant mixture (at 673K) did not result in a reduction of iron oxides. Higher temperatures and/or higher H2 or CO concentrations are needed. Since Fe3O4 reduction is also an exothermic reaction, care must be taken to not overpass Tamman temperature during reduction.

122
The deterioration of silica surface seems to not affect the catalytic activity, since the same activity per m2 of iron was found on regenerated and fresh catalyst. THüttig Silica is 751 K. If temperature over passed Fe3O4 TTamman= 917K (that explains particle sintering), it is logical to observe a significant lost of defects in silica structure.
However, the deterioration of silica colloids will decrease metal-support interactions, making more easy the agglomeration of Fe particles [133]. The Tamman temperature is just an empirical criterion to have an approximation of the maximum acceptable temperature.
A-5.5. Conclusion and perspective
The regeneration of Fe/Silica catalyst used for guaiacol HDO was found to be partially possible. Carbon deposit burning must be followed by careful re-reduction of iron.
From TEM images, we identified sintering as a possible cause of the not fully recovered activity.
In order to design a fast, easy and effective protocol for catalyst regeneration, a precise model must be built considering heat transfer from the reactor’s wall, external and internal heat and mass transfer into the catalyst particles.
TEM analysis, BET and/or chemisorptions after regeneration/deactivation cycles with different gas compositions (O2, H2O, etc.) and temperature could be undertaken.

123
Annex 6. Calibration of the GC*GC-FID heart-cutting method for selected compounds and use of predictive method.
The GC*GC/FID-MS-FID set-up is presented on figure A-6.1.
Figure A-6.1. Scheme of GC*GC(heart cutting)/MS-FID-FID device used for identification and quantification of products of lignin pyrolysis and catalytic
hydrotreatment
A HP-5MS (diphenyl -5% - dimethylpolysiloxan -95%, not polar) was coupled to a DB-WAX (polyethylenglycol, polar) because of their complementary polarities which enable to separate differents compounds in a complex mixture. The HP-5MS was connected to a FID and MS (in parallel) which allows quantification on the FID and qualification on the MS on the same injection. The DBWAX is connected to a FID for quantification of the heart-cut part of the HP-5MS. Qualification of the heart-cut part can be achieved by the MS without any heart-cutting.
On a single FID, the area of product i (Ai) divided by the area of 1-Undecene (A1-Und), the internal standard, is proportional to the molar ratio between product i and 1-Undecene (αi/ α1-Und is a response factor):
n°i/n°1-Und = (αi/ α1-Und) . Ai/A1-Und. (A-6.1)
HP-5MS is connected simultaneously to MS and FID analysis (Figure A-6.1). Consequently, the FID signal is lower than in the case of full analysis by FID but the frame of this method is not quantify trace components. The signal of the HP-5MS FID is proportional to the full signal (without any split).

124
AFID-HP-5MS = b.AFID-full (A-6.2)
where “b” is an analytical response factor (<1), inherent of the GC set-up, depending on heart cutting and split between FID and MS.
So combining (A-6.1) and (A-6.2) we can calculate a relative corrected response factor even if 1-undecene area is fully measured in DB-WAX FID but product i area is partially (but proportionally) measured on the FID from the HP-5MS column.
(A-6.3) n°i/n°1-Und = (αi/ α1-Und).(1/b). Ai HP-5MS FID/A1-Und DB-WAX FID.
Three 15ml methanol solutions of benzene, toluene, phenol, anisole, naphthalene, biphenyl, m-cresol, 2,6 dimethyl phenol, 3-methyl catechol, guaiacol, 2-methoxy catechol were prepared. All chemicals were purchased from Sigma-Aldrich. These compounds were selected as the most important ones from MS qualitative analysis and are significant of the main functional moities in GC-analyzable bio-oils. Then 1µL of 1-undecene was spiked in each solution by means of a µ-syringe. 1 µL of solutions were injected into the GC by means of an automatic sampler with a split ratio of 20. On the HP-5MS FID, the areas of benzene, toluene, anisole, naphthalene, biphenyl, 2,6 dimethyl phenol, 3-methyl catechol and 2-methoxy catechol areas were measured. On the DB-WAX FID, the areas of 1-undecene, guaiacol and m-cresol were measured (see figure D, chromatograms).
The experimental response factor relative to 1µL of 1-undecene (4.86 µmol) (αi/ α1-Und) was calculated by plotting the ratio of areas (Ai/A1-Und; measured in both FIDs) vs. the n° of moles of i prepared with a high precision balance (100% purity was considered) in standard solutions. Figure A-6.2 shows some plots for phenol (using signals from the two different FIDs) and guaiacol (only using DB-WAX FID signal). The three points were fitted in Excel with a y=c.x formula (linear, forced to zero). R2 was 0.9892 in the worst case (toluene) and always higher than 0.995 for all other compounds. The slope of curves was then divided by 0.00486 mmols in order to calculate (αi/ α1-Und).(1/b) or (αi/ α1-Und).

125
Figure A-6.2. Examples of plots for calibration of compounds on GC heart-
cutting method (Phenol) or not (Guaiacol).
Application of predictive method of de Saint Laumer et al. [116]
Experimental response factor was quantified only for previously listed key compounds. All other compounds were quantified based on a prediction method of the response factor.
De Saint Laumer et al. [116] developed a method to predict the relative response factor of any molecule on a FID based on its enthalpy of combustion. Among variants developed by these authors we choose to work with the following predictive model:
(A-6.4) nS-L i/nS-L j = (αi/ αj); so nS-L i/nS-L 1-Und = (αi/ α1-Und).
(A-6.5)
nS-L i=1/((-0,071+(0,000857*(11,06+(103,51*nC-i)+(21,85*nH-i)-(48,18*nO-i)))+(0,127*nar-i)))
Where nC i, nH I and nO i are the number of Carbon, Hydrogen and Oxygen atoms, and nar
i is the number of aromatic rings on the molecule (the complete formula includes other elements). nS-L i is the number of de Saint Laumer of compound i.
So the response factor (αi/ α1-Und) can be calculated knowing the atomic composition and number of aromatic rings of the molecule, if both 1-undecene and i molecule were measured on the same FID. The response factor of compounds that appeared on HP-5MS FID (benzene, toluene, anisole, phenol, 2,6 dimethyl phenol, naphthalene, biphenyl, 3-methyl catechol, 3-methxoy catechol) cannot be directly predicted by de Saint Laumer’s method. A correction factor (b, in Equation A-6.3) must be used to consider the ratio between HP-5MS FID signal and DB-WAX FID signal.

126
In order to measure the b factor, predicted response factor (nS-L i/nS-L 1-Und) were compared to experimental response factor (n°i/n°1-Und)/(Ai/A1-Und). Results showed that a factor of b = 0.617 minimizes the average deviation between predicted and measured response factors. Figure A-6.3 shows experimental vs. predicted values. A satisfactory approximate accordance is observed. Deviation could come from the heart cutting system but also on uncertainty from de Saint Laumer method.
Figure A-6.3. Comparison between experimental response factors and predicted by
de Saint Laumer’s method and experimental correction factor “b”. The worst prediction was 3-methoxy catechol with a relative deviation of 13%.
When quantifying the 70-93 compounds present in lignin pyrolysis oils (catalytically
converted or not), the experimental factors where used when available. The experimental m-cresol factor was used for p-cresol (both eluted on DB-WAX FID). On the other hand, other analyzed compounds (including o-cresol) were measured using the predictive method as explained before. Figure A-6.4 and A-6.5 show two examples of chromatographs. A table of detected (more than 170 for all runs) and quantified species (70-93 for each run) with their retention time is included at the end of this supplementary material.
If simultaneous FID-MS and heart-cutting devices are not available on site, this method could be used on separate GC-FID and GC-MS devices (using exactly the same type of column and GC parameters, the internal standard should be separated from other compounds if the quantification is conducted by FID).

127
Figure A-6.4. FID Chromatographs signal for lignin pyrolysis oils without catalyst (first impinger).
Figure A-6.5. FID Chromatographs signal for lignin pyrolysis oils using 4g of 15%Fe/Silica catalyst
(first impinger).

128
Table of detected (171 compounds) and quantified (70-93) species with their Retention Time on the HP-5MS column
Only cresol isomers were separately quantified, for all other compounds only functional groups and molecular formulas were identified with MS signal. Some compounds correspond almost to the same Retention Time, they were identified in different samples. The maximum number of quantified compounds on a single chromatograph was 93 corresponding to raw lignin oils (without catalyst). 1-undecene, guaiacol and p & m-cresols were quantified on DB-Wax FID.
RT (min) Molecule
4.6 Methyl pentene 4.73 Acetaldehyde 4.85 Acetic acid 4.87 Butanone 5.4 Methyl propionate 5.5 Cyclopentadiene
5.53 Methyl cyclopentadiene 5.8 Methyl cyclopentene 6 Benzene
6.3 Cyclohexadiene 6.67 Methoxypropanol
7 Pentanone 7.15 Heptane 7.2 Propanoic acid 7.5 Di methyl furan
8.75 Methyl glyoxal 9.0 ; 9.6 and 10.2 Methyl cyclohexadienes
10.6 Toluene 12.3 Cyclopentanone 14.7 Furfural 14.8 Cyclopentenone 15.16 Methyl cyclopentanone 16.25 Ethyl benzene 16.49 Dimethyl cyclohexadiene 16.7 Xylene 17.4 Vinylfuran 17.85 Styrene 17.9 Xylene 18.7 Methyl cyclopentenone 19.1 Hydroxy butanoic acid 19.16 Butyrolactone 19.2 Anisole 19.47 Di methyl cyclohexene 19.6 Cyclopentanone, 3,4-bis(methylene)-
19.64 and 21.05 Cumene (and isomer) 20.37 Dimethyl-2- cyclopenten 1 one 21.15 Cyclopentanone, 3,4-bis(methylene)- 21.5 Tri methyl benzene and Methyl Ethyl benzene 21.7 Methyl cyclopentenone 21.71 Methyl Ethyl benzene 22.3 Phenol 22.9 Methyl Ethyl benzene 23 Benzofurane
23.1 Dimethyl cyclopentenone 23.4 -23.6 Butyl benzene (and isomer)
24 Methyl anisole

129
24.13-24.2 Tri methyl benzene 24.25 Allyl benzene 24.5 Tri methyl cyclopentenone 24.7 Indane 24.8 Di methyl cyclopenten -one 25 2 hydroxy benzaldehyde
25.06 Indene 25.36 o-cresol 25.6 Di methyl Ethyl benzene 26.4 Methyl styrene 25.8 Tri methyl cyclopentenone 25.9 Propyl Ethyl benzene 27.5 2,6 dimethyl phenol 27.6 Cinnamal 27.7 Ethyl methyl phenol
27.8 - 28 Di methyl ethyl benzene 27.9 Di methyl anisole 28.3 Methyl indane 28.5 Ethyl phenol 28.7 Di vinyl benzene
28.9 and 28.85 Di methyl phenol 29 Methyl indene
29.3 2-Hydroxy-5-methylbenzaldehyde 29.3 Benzene, (1-methyl-2-propynyl)- 29.5 Ethyl phenol 29.9 Di methyl phenol
30.07 ; 30.3 and 30.5 methyl guaiacols 30.2 Ethyl methyl phenol 30.4 Naphthalene 30.5 Catechol 30.8 Ethyl benzofurane 30.9 Tri metyl phenol 31.2 Courmaran 31.4 Dimethyl benzofuran
31.6 and 31.94 Ethyl methyl phenols 32.1 Methyl pentenyl anisole 32.4 2-Dihydro-3-methylnaphthalene 32.5 Propyl phenol 32.57 Methyl di methoxy benzene 32.6 Methyl catechol
32.8 - 33.37 - 33.47 Ethyl guaiacols 32.9 Methoxy catechol
32.901 Allyl cresol 33 Tri methyl phenol
33.2 Naphthalene, 1,2-dihydro-4-methyl 33.45 Methyl catechol 33.5 Allyl phenol 33.59 Indanol 33.6 Di methyl anisole (or an isomer) 33.8 Butyl phenol (or isomer) 33.9 Ethanone (methylethenyl) phenyl 33.92 Dimethyl butenyl benzene
34.07 and 34.6 Methyl naphthalene 34.3 Butyl phenol isomer 34.5 Vinyl guaiacol 34.65 Ethyl di methoxy benzene 34.7 Propyl ethyl phenol
34.8 and 35.9 Butyl phenol isomer 34.98 and 35.7 Indenol isomers
35 Allyl phenol (or isomer)

130
35.1 Ethyl catechol 35.23 Indanol 35.35 Anethole 35.5 Di methyl catechol 35.68 Methyl benzofuran 35.8 Eugenol 35.83 Butyl anisole 35.84 Butyl methoxy benzene 35.96 2-Allyl-4-methylphenol 36.1 Propyl guaiacol 36.3 Estragol (or isomer) 36.4 Ethyl catechol
36.44 and 36.88 Di hydro safrole isomers 36.45 Butyl anisole isomer 36.7 Biphenyl 36.89 Butyl anisole isomer 36.9 Eugenol isomer
37 and 37.43 Ethyl naphthalene 37.1 Vanillin 37.3 Eugenol isomer 37.4 2-Allyl-4-methylphenol 37.7 4-Hydroxy-3-methylbenzaldehyde 37.87 Di methyl naphthalene 38.2 Ethyl guaiacol 38.36 Dimethoxy propyl benzene 38.5 Eugenol isomer 38.69 Dihydroxy tetrahydronaphthalene 38.7 Propyl guaiacol 39 Propyl di hydroxy benzene
39.05 Methoxy Benzofuran carboxaldehyde 39.3 Di methoxy benzaldehyde 39.5 Butyl catechol 36.59 Methyl biphenyl 39.6 Acetovanillone 39.7 Methyl eugenol 40.05 4-Hydroxy-3-methylacetophenone 40.15 Dimethoxy propyl benzene 40.4 Naphtol 40.43 Phenyl furan 40.45 Tri methyl naphthalene 40.65 Di benzofuran 40.77 Guaiacylacetone 41.4 4-Allyl-1,2-diacetoxybenzene 41.6 Acetoveratrone 42.15 3-Ethoxy-4-methoxybenzaldehyde 41.9 Di methoxy butyl benzene 42.3 Tetra methyl naphthalene (eudalin) 42.4 Fluorene 42.6 Benzenepropanol, 4-methoxy- 42.9 Butyl di methoxy benzene
43; 43.2 and 43.8 Methyl naphthols 43.49 Di methyl biphenyl 43.5 Di benzopyrane 43.9 Homovanillic acid 44 Hydroxy fluorene
44.27 Di methyl biphenyl 44.6 Methoxy naphthol 46 Ethyl homo vanillate
47.7 Propyl biphenyl 49.2 Anthracene

131
53.2 Retene 56 - 56.7 Methoxy anthracene
57.3 Methyl antracene 57.9 9,10-Anthracenedione 58.8 Di butyl catechol

132
Annex 7. All data used for kinetic modeling of guaiacol HDO in model gas
During 187 min of time on stream the distribution of products changed. Independently of the mass of catalyst used (58-1034 mg), the products were more oxygenated that at the beginning. Figure A-7.1 shows the concentration of products vs. time on stream for each catalytic experiment. The experimental point at 21 min showed a particular behavior that is related with the stabilization of steady state of adsorbed molecules on catalyst surface, so it was not considered in kinetic calculations.
% m
ol
% m
ol
% m
ol
% m
ol
% m
ol
% m
ol
133
Figure A-7.1. Evolution of products vs. time on stream at different mass of catalyst (40Nml/min,
673K, 1-1,2 atm). Reactant mixture 50% H2 mol base, 5% CO2, 2.5% CO, 2.5 H2O, 1% Guaiacol, rest Ar. Toluene and anisole were not included when values were lower than 0,005%.
A slight activity to the hydrogenation of CO2 into CO, and CO into CH4 is observed, it is coherent with literature [45,104,105].
The experiment at Wcat = 229 mg (Figure A-7.1) shows clearly that our catalyst could also be used to maximize the phenol yield.
% m
ol
% m
ol
% m
ol
% m
ol
% m
ol
% m
ol

134
Annex 8. Description of ASPEN model and results Figure A-8.1 shows the full flow sheet from ASPEN plus. Table A-8.1 describes the
input and result of each block (for the standard condition presented in the chapter 5).
Figu
re A
-8.1
. ASP
EN P
lus f
lows
heet
for t
he si
mul
atio
n of
lign
in to
BTX
pro
cess
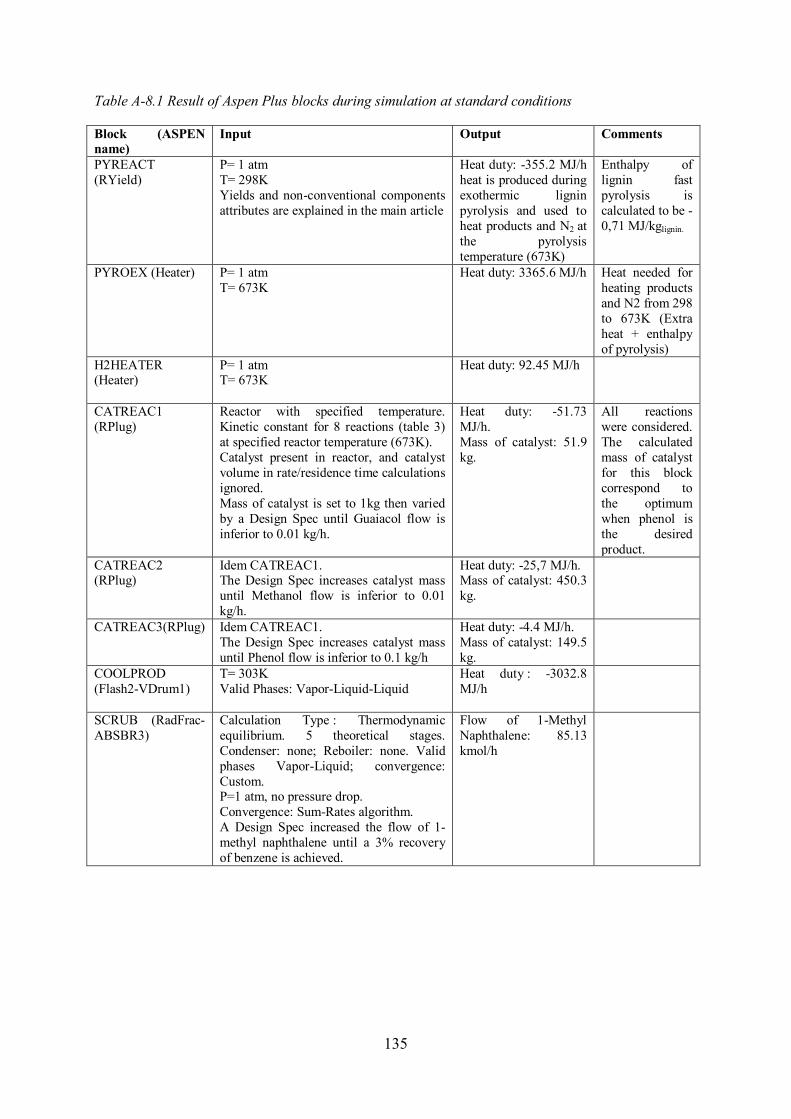
135
Table A-8.1 Result of Aspen Plus blocks during simulation at standard conditions
Block (ASPEN name)
Input Output Comments
PYREACT (RYield)
P= 1 atm T= 298K Yields and non-conventional components attributes are explained in the main article
Heat duty: -355.2 MJ/h heat is produced during exothermic lignin pyrolysis and used to heat products and N2 at the pyrolysis temperature (673K)
Enthalpy of lignin fast pyrolysis is calculated to be -0,71 MJ/kglignin.
PYROEX (Heater) P= 1 atm T= 673K
Heat duty: 3365.6 MJ/h Heat needed for heating products and N2 from 298 to 673K (Extra heat + enthalpy of pyrolysis)
H2HEATER (Heater)
P= 1 atm T= 673K
Heat duty: 92.45 MJ/h
CATREAC1 (RPlug)
Reactor with specified temperature. Kinetic constant for 8 reactions (table 3) at specified reactor temperature (673K). Catalyst present in reactor, and catalyst volume in rate/residence time calculations ignored. Mass of catalyst is set to 1kg then varied by a Design Spec until Guaiacol flow is inferior to 0.01 kg/h.
Heat duty: -51.73 MJ/h. Mass of catalyst: 51.9 kg.
All reactions were considered. The calculated mass of catalyst for this block correspond to the optimum when phenol is the desired product.
CATREAC2 (RPlug)
Idem CATREAC1. The Design Spec increases catalyst mass until Methanol flow is inferior to 0.01 kg/h.
Heat duty: -25,7 MJ/h. Mass of catalyst: 450.3 kg.
CATREAC3(RPlug) Idem CATREAC1. The Design Spec increases catalyst mass until Phenol flow is inferior to 0.1 kg/h
Heat duty: -4.4 MJ/h. Mass of catalyst: 149.5 kg.
COOLPROD (Flash2-VDrum1)
T= 303K Valid Phases: Vapor-Liquid-Liquid
Heat duty : -3032.8 MJ/h
SCRUB (RadFrac-ABSBR3)
Calculation Type : Thermodynamic equilibrium. 5 theoretical stages. Condenser: none; Reboiler: none. Valid phases Vapor-Liquid; convergence: Custom. P=1 atm, no pressure drop. Convergence: Sum-Rates algorithm. A Design Spec increased the flow of 1-methyl naphthalene until a 3% recovery of benzene is achieved.
Flow of 1-Methyl Naphthalene: 85.13 kmol/h

136
Annex 9. DRIFTS study on the adsorption of guaiacol on Fe/Silica catalyst
A-9.1 Introduction
The reactive mechanisms occurring during guaiacol HDO on Fe/SiO2 catalyst are explored. This is an unfinished explorative work between IRCELYON (C. Mirodatos, Y. Schuurman and L. Dreibine) and LRGP.
A-9.2 Experimental
1% Fe/silica catalyst was prepared by the same method as developed before [44]. Pure silica (without Fe) was prepared the same way but the iron nitrate solution was replaced by de-ionized water. A portion of the as-prepared silica was heated under Ar flow to 900°C for 3 hs (called silica900).
DRIFTS experiments were performed on a Nicolet IR 550 instrument equipped with an in situ DRIFTS cell from Spectratech. About 30 mg of catalyst with a grain size of 250-380 µm was used.
Argon and hydrogen were sent at flows of 50ml/min and 25 min/min respectively. Guaiacol was introduced to the DRIFTS monitored catalytic bed with a bubbler at room temperature (0.0024% vol. = Psat
gua). Before making any measure, the catalyst was heated under Argon flow at 400°C (10°C/min ramp), then hold 400°C 20 min. Then backgrounds, silica and guaiacol signals were measured at different temperatures. Important differences with temperature were only found on the 1400-800 cm-1 region.
IR data must be recorded considering a background. KBr is considered as a neutral background. KBr-backgrounded IR signal was taken as the baseline for silica. For the other spectra, clean silica at corresponding temperature was the background.
Surface saturation by adsorbed guaiacol was considered to occur when the IR spectra did not change after 10 min.
A-9.3 Results
A-9.3.1 Guaiacol adsorption on silica under Argon flow
Figure A-9.1 shows the KBr-backgrounded IR spectra of silica at different temperatures under Ar (both heat treated at 400°C under Argon), the changes are remarkable. Silica showed 3745 cm-1 signal corresponding to silanols. Heat treatment does not affect markedly silanols signal but mainly signal at 1900cm-1 and 1500-700cm-1.
Figure A-9.2 shows sample-backgrounded IR spectra of guaiacol-treated silica at 60°C saturated and after different desorption times. We observe the bands corresponding to adsorbed guaiacol that were published by Popov et al. [19]. An extra shoulder near 3620 cm-1 was also observed at every sample. Popov founded a 3620 cm-1 with phenol adsorbed on silica, and they related this band to “perturbed -OH group linked to aromatic cycle”.
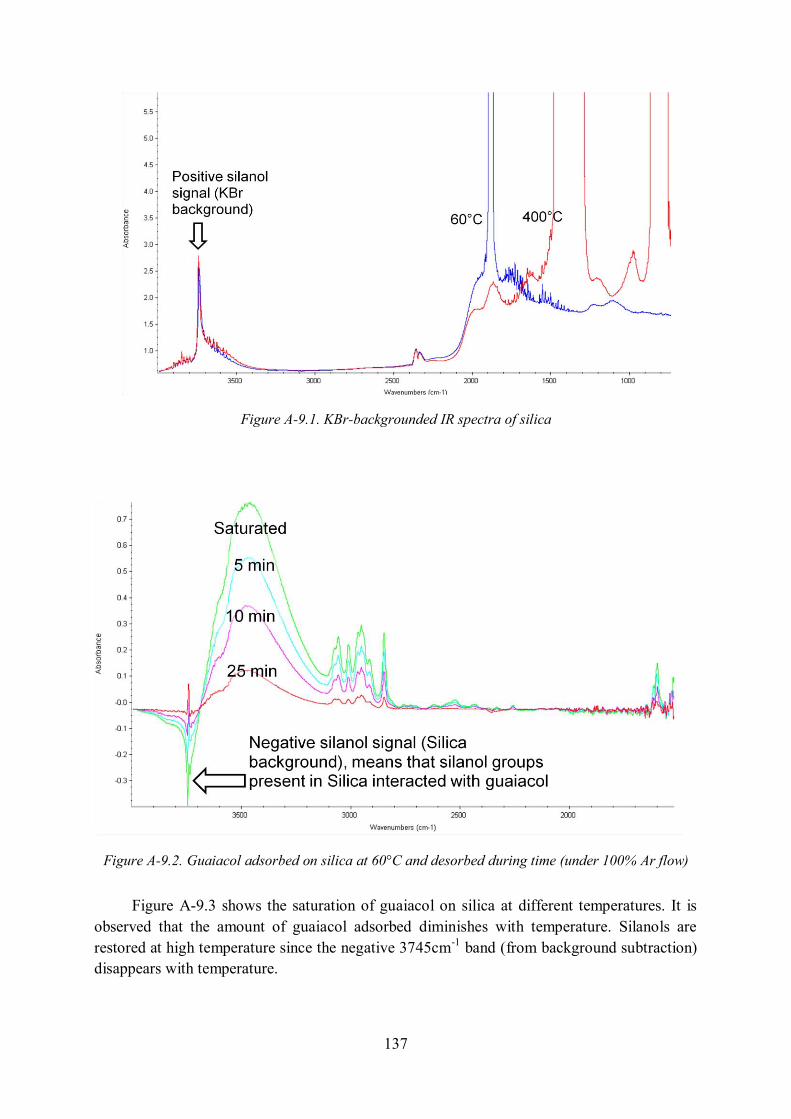
137
Figure A-9.1. KBr-backgrounded IR spectra of silica
Figure A-9.2. Guaiacol adsorbed on silica at 60°C and desorbed during time (under 100% Ar flow)
Figure A-9.3 shows the saturation of guaiacol on silica at different temperatures. It is observed that the amount of guaiacol adsorbed diminishes with temperature. Silanols are restored at high temperature since the negative 3745cm-1 band (from background subtraction) disappears with temperature.

138
At 200°C guaiacol adsorption becomes very low and desorption is difficult to observe because of low signal (Figure A-9.4), similar behavior is observed at 300°C and 400°C.
Even after evacuation at 400°C, C-H vibrations typical of guaiacol are still observed. Claude Mirodatos thinks that they are some kind of carbonaceous deposit like a coke precursor. However, silanols are completely restored since the negative signal (3745cm-1) disappears.
Figure A-9.3. Influence of temperature on the saturation of guaiacol on silica
Figure A-9.4. Desorption of guaiacol from silica at 200°C. Exposure to pure Argon during 5 or 20 min did not result in any change.

139
A-9.3.2 Result with Fe/Silica catalyst
A 5%Fe/Silica catalyst was too dark to reflect enough IR signals; that is why we worked only with 1%. Figure A-7.5 shows the IR spectra of guaiacol adsorbed on silica and on 1%Fe silica catalyst at 60°C. No differences were found, so we may assume that there is not a particular interaction between guaiacol and iron. However, iron surface was very low and 60°C is too far from reaction temperatures (400°C). More research is needed to validate the hypothesis of no guaiacol-iron interaction.
In-situ DRIFTS of guaiacol HDO in pure hydrogen was taken out at increasing temperatures. No IR signal was detected on the catalyst (400°C, 100%H2 with guaiacol) even at long exposure (1h) on reaction conditions. The only proof of reaction happening is the m/z=78 signal on Mass Spectroscopy that showed a little but clear increase; however MS could never detect any other signal of aromatic molecule (not even guaiacol at pure feeding), probably because of low partial pressure of this molecules (benzene may have a better response factor).
Figure A-9.5. IR spectra of guaiacol adsorbed on silica and 1%Fe/silica catalyst at 60°C (Argon flow). The difference on the strength of signal may be related to many factors (e.g. the opacity of
powder); and cannot be related to the adsorptive characteristics.

140
A-9.3.3 Result with Silica vs. Silica900.
Figure A-9.6 Sample-backgrounded IR spectra of guaiacol on silica (saturated at 60°C) and silica900 (after 2h guaiacol exposure at 60°C).The signal of silica900 was multiplied
by 2.54 in order to be compared.
The adsorption of guaiacol on silica and silica900 were compared (Figure A-9.6). Signals of Silica900 were weaker than silica, so they where multiplied by 2.54 (corresponding to the ratio of the negative silanol peaks) to normalize signal to the same scale. A sharp new peak is observed at 3558 cm-1 (corresponding to “free” PhO-H vibration, after Popov et al.[19]) after heat treatment of silica at 900°C. The negative silanol signal changed its shape (Fig. A-9.6). Saturation was not reached on this sample (silica900) even after 2h of exposure to guaiacol. It is clear that our thermal treatment modified silica surface chemistry and consequently the way that guaiacol is adsorbed. Research on this field could be useful to predict the loss of activity of catalyst after high temperature treatments for regeneration (like coke oxidation, see Annex 5)
A-9.4 Perspectives
After a meeting with Claude Mirodatos and Yves Schuurman, five experiments were proposed to better understand the mechanisms involved in guaiacol HDO on Fe/SiO2 catalyst:
1) The measurement of heat of adsorption of guaiacol and benzene by the difference in saturation IR spectra at different temperatures by the “Bianchi’s” method [141].
2) The measurement of magnetic properties of iron, in order to follow the evolution of oxidation state of iron after the first contact with guaiacol.
3) The pulse measurement of guaiacol-H2 system on a normal reactor with a MS to study the kinetics of the reaction.

141
4) The measurement of guaiacol and benzene adsorption on a calorimeter, to support DRIFTS results.
5) Testing silica catalysts heated at different temperatures (or treated at 900°C different exposures times)

142
143
~ UNIVERSITÉ ~ DE LORRAINE
AUTORISATION DE SOUTENANCE
DU DOCTORAT DE L'UNIVERSITE DE LORRAINE
000
VU LES RAPPORTS ETABLIS PAR :
Monsienr BRIENS Cédric, Professeur, University of Western Ontario (Canada),
Monsieur SCHUURMAN Yves, Professeur, IRCE, Université de Lyon!.
Le Président de l 'Université de Lorraine, autorise :
Monsieur OLCESE Roberto Nicolas
à soutenir devant un jury de l'UNIVERSITE DE LORRAINE, une thèse intitulée:
"Valorization of Iignin pyrolysis vapors by iron-catalysed direct hydrodeoxygenation"
en vue de l'obtention du titre de :
DOCTEUR DE l'UNIVERSITE DE LORRAINE
Intitulé du doctorat: "Génie des Procédés et des Produits"
Fait à Vandoeuvre, le 15 Octobre 2012
Le Président de l'Univers ité de Lorraine,
Pierre MUTZENHARDT
UNIVERSITË DE LORRAINE 34 COURS LÉOPOLD - CS 25233 54052 NANCY CEDEX TEL: 03 54 50 54 00 [email protected]
1 -

144
Valorization of lignin pyrolysis vapors by iron-catalyzed direct hydrodeoxygenation. Lignin is a promising feedstock for the production of bio-based aromatic hydrocarbons (benzene, toluene, xylenes BTX) and/or phenols. In this work, the catalytic hydrotreatment of lignin pyrolysis vapours was studied. Lignin pyrolysis vapors are a complex mixture of unstable oxygenated molecules. Our goal was to hydrogenate selectively the Caromatic-O bond lignin vapours, before their condensation, to produce higher yield of useful molecules (BTX, phenol). The conversion of a model molecule (guaiacol) was studied (350-450°C, 1 atm, 90%mol. H2). Commercial Cobalt-based catalyst was not selective and converted guaiacol into CH4. Inexpensive Fe-silica catalyst was active and selective for the conversion of guaiacol into benzene and toluene. H2 molar fraction showed no effect on the 20-90%mol. range. The effect of H2O, CO, CO2 and CH4 on guaiacol conversion with Fe-silica catalyst was studied separately. These gases are also present in lignin pyrolysis vapors. H2O inhibits Car-O bond hydrogenolysis. CO increases deactivation. CH4 has no effect and CO2 decreases deactivation. Under a mixture of gases that mimics lignin pyrolysis vapors with H2, Fe-silica is still active and very selective for the production of Benzene and Toluene (66% carbon yield). Fe-Activated carbon is selective for the production of phenol and cresol that are also useful chemicals. Real lignin pyrolysis vapors were generated with a discontinuous pyrolysis reactor. Products were mixed with H2 and directly introduced into a catalytic fixed bed reactor. The enhancement of oil quality was remarkable both for Fe-silica or Fe-Activated Carbon catalyst. A kinetic model for the conversion of guaiacol in model pyrolysis vapor with Fe-silica catalyst was developed. The resulting kinetics was implemented in an Aspen plus model that handles the entire lignin to BTX process including pyrolysis, catalytic reactor, heat exchanger and products recovery. The benzene + toluene (BT) carbon yield is 7.5% based on lignin. Char and lignin oligomers yields of existing lignin pyrolysis technology are too high and reduce carbon yield in BT. Valorisation des vapeurs de pyrolyse de lignine par hydrodéoxygénation directe catalysées par le fer La lignine est une matière première bio-sourcée prometteuse pour la production durable des hydrocarbures aromatiques (benzène, toluène, xylènes, BTX) et/ou des phénols. Dans ce travail, nous avons étudié l’hydrotraitement catalytique des vapeurs de pyrolyse de lignine. Les vapeurs de pyrolyse de lignine sont un mélange complexe de molécules oxygénées instables. Notre objectif est d’hydrogéner sélectivement la liaison Caromatique-O présente dans ces molécules, avant leur condensation, pour produire des composés d’intérêts (benzène, phénol). La conversion d’une molécule modèle (guaiacol) a été étudiée (350-450°C, 1 atm, 90% H2). Un catalyseur commercial à base de cobalt n’est pas sélectif et converti totalement le guaiacol en CH4. Par contre, le catalyseur Fer-silice est actif et sélectif pour la conversion du guaiacol en benzène et toluène. La fraction molaire en H2 n’a produit aucun effet entre 20-90%mol. L’effet de H2O, CO, CO2 et CH4 sur la conversion du guaiacol (Fer-silice) a été étudié. Ces gaz sont également présents dans les vapeurs de pyrolyse de lignine. La vapeur d’eau ralentit l’hydrogénolyse de la liaison Car-O, le CO augmente la désactivation, CH4 n’a pas d’effet et CO2 diminue la désactivation. Avec un mélange de gaz représentatif des vapeurs de pyrolyse de lignine et un apport en H2, le catalyseur Fer-silice est actif et sélectif pour la production de benzène et de toluène (66% de rendement en carbone). Le catalyseur Fer-charbon actif est sélectif pour la production du phénol et de crésols qui sont aussi des molécules utiles pour l’industrie. Des vapeurs de pyrolyse de lignine ont été générées avec un réacteur discontinu. Elles ont été mixées avec du H2, puis introduites directement dans un réacteur catalytique. L’amélioration de la qualité des huiles a été remarquable avec les deux catalyseurs (Fer-silice et Fer-charbon actif). Un modèle cinétique a été développé pour la conversion du guaiacol dans un mélange significatif des vapeurs de pyrolyse de lignine avec le catalyseur fer-silice. Ce modèle cinétique a été intégré dans un modèle de procédé sous Aspen Plus. L’ensemble du procédé de conversion de la lignine en BTX est modélisé, incluant la pyrolyse, le réacteur catalytique, les échangeurs de chaleur et la récupération des produits par lavage. Le rendement carbone de benzène et toluène (BT) basé sur la lignine est de 7.5%. Les technologies existantes pour la pyrolyse de la lignine produisent trop de charbon et d’oligomères au détriment des produits aromatiques.