les5e_ptb_06
14
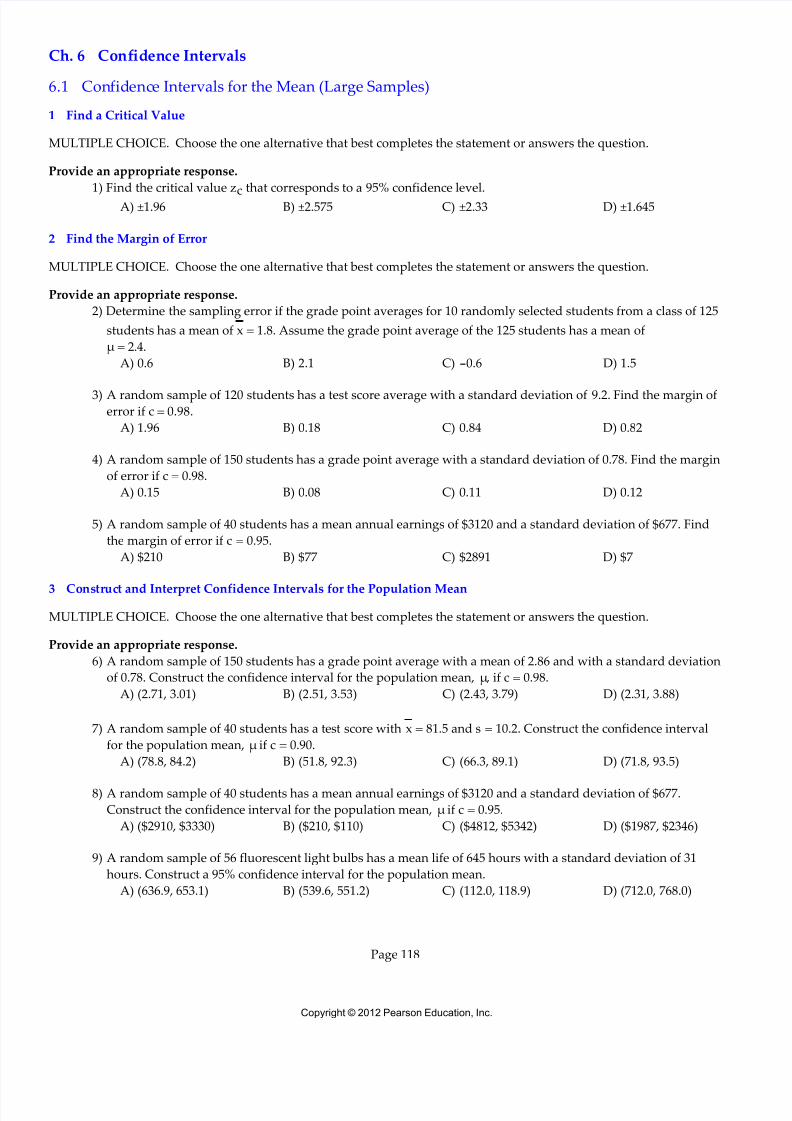
Ch. 6 Confidence Intervals 6.1 Con fid enc e Intervals for the Mean (Large Samples) 1 Find a Critical Value MULTIPLE CHOICE. Choose the one alternative that best completes the statement or answers the question. Provide an appropriate response. 1) Find the critical value z c that corresponds to a 95% confidence level. A) ±1.96 B) ±2.575 C) ±2.33 D) ±1.645 2 Find the Margin of Error MULTIPLE CHOICE. Choose the one alternative that best completes the statement or answers the question. Provide an appropriate response. 2) Determine the sampling error if the grade point averages for 10 randomly selected students from a class of 125 students has a mean of x = 1.8. Assume the grade point average of the 125 students has a mean of μ = 2.4. A) 0.6 B) 2.1 C) -0.6 D) 1.5 3) A random sample of 120 students has a test score average with a standard deviation of 9.2. Find the margin of error if c = 0.98. A) 1.96 B) 0.18 C) 0.84 D) 0.82 4) A random sample of 150 students has a grade point average with a standard deviation of 0.78. Find the margin of error if c = 0.98. A) 0.15 B) 0.08 C) 0.11 D) 0.12 5) A random sample of 40 students has a mean annual earnings of $3120 and a standard deviation of $677. Find the margin of error if c = 0.95. A) $210 B) $77 C) $2891 D) $7 3 Constr uc t and Interpret Confidence Intervals for the Population Mean MULTIPLE CHOICE. Choose the one alternative that best completes the statement or answers the question. Provide an appropriate response. 6) A random sample of 150 students has a grade point average with a mean of 2.86 and with a standard deviation of 0.78. Construct the confidence interval for the population mean, μ , if c = 0.98. A) (2.71, 3.01) B) (2.51, 3.53) C) (2.43, 3.79) D) (2.31, 3.88) 7) A random sample of 40 students has a test score with x = 81.5 and s = 10.2. Construct the confidence interval for the population mean, μ if c = 0.90. A) (78.8, 84.2) B) (51.8, 92.3) C) (66.3, 89.1) D) (71.8, 93.5) 8) A random sample of 40 students has a mean annual earnings of $3120 and a standard deviation of $677. Construct the confidence interval for the population mean, μ if c = 0.95. A) ($2910, $3330) B) ($210, $110) C) ($4812, $5342) D) ($1987, $2346) 9) A random sample of 56 fluorescent light bulbs has a mean life of 645 hours with a standard deviation of 31 hours. Construct a 95% confidence interval for the population mean. A) (636.9, 653.1) B) (539.6, 551.2) C) (112.0, 118.9) D) (712.0, 768.0) Page 118 Copyright © 2012 Pearson Education, Inc.
-
Upload
jiger-shah -
Category
Documents
-
view
213 -
download
0
Transcript of les5e_ptb_06
8/20/2019 les5e_ptb_06
http://slidepdf.com/reader/full/les5eptb06 1/14
Ch. 6 Confidence Intervals
6.1 Confidence Intervals for the Mean (Large Samples)
1 Find a Critical Value
MULTIPLE CHOICE. Choose the one alternative that best completes the statement or answers the question.
Provide an appropriate response.
1) Find the critical value zc that corresponds to a 95% confidence level.
A) ±1.96 B) ±2.575 C) ±2.33 D) ±1.645
2 Find the Margin of Error
MULTIPLE CHOICE. Choose the one alternative that best completes the statement or answers the question.
Provide an appropriate response.
2) Determine the sampling error if the grade point averages for 10 randomly selected students from a class of 125
students has a mean of x = 1.8. Assume the grade point average of the 125 students has a mean of
μ = 2.4.
A) 0.6 B) 2.1 C) -0.6 D) 1.5
3) A random sample of 120 students has a test score average with a standard deviation of 9.2. Find the margin oferror if c = 0.98.
A) 1.96 B) 0.18 C) 0.84 D) 0.82
4) A random sample of 150 students has a grade point average with a standard deviation of 0.78. Find the margin
of error if c = 0.98.
A) 0.15 B) 0.08 C) 0.11 D) 0.12
5) A random sample of 40 students has a mean annual earnings of $3120 and a standard deviation of $677. Find
the margin of error if c = 0.95.
A) $210 B) $77 C) $2891 D) $7
3 Construct
and
Interpret
Confidence
Intervals
for
the
Population
Mean
MULTIPLE CHOICE. Choose the one alternative that best completes the statement or answers the question.
Provide an appropriate response.
6) A random sample of 150 students has a grade point average with a mean of 2.86 and with a standard deviation
of 0.78. Construct the confidence interval for the population mean, μ , if c = 0.98.
A) (2.71, 3.01) B) (2.51, 3.53) C) (2.43, 3.79) D) (2.31, 3.88)
7) A random sample of 40 students has a test score with x = 81.5 and s = 10.2. Construct the confidence interval
for the population mean, μ if c = 0.90.
A) (78.8, 84.2) B) (51.8, 92.3) C) (66.3, 89.1) D) (71.8, 93.5)
8) A random sample of 40 students has a mean annual earnings of $3120 and a standard deviation of $677.
Construct the confidence interval for the population mean, μ if c = 0.95.
A) ($2910, $3330) B) ($210, $110) C) ($4812, $5342) D) ($1987, $2346)
9) A random sample of 56 fluorescent light bulbs has a mean life of 645 hours with a standard deviation of 31
hours. Construct a 95% confidence interval for the population mean.
A) (636.9, 653.1) B) (539.6, 551.2) C) (112.0, 118.9) D) (712.0, 768.0)
Page 118
Copyright © 2012 Pearson Education, Inc.
8/20/2019 les5e_ptb_06
http://slidepdf.com/reader/full/les5eptb06 2/14
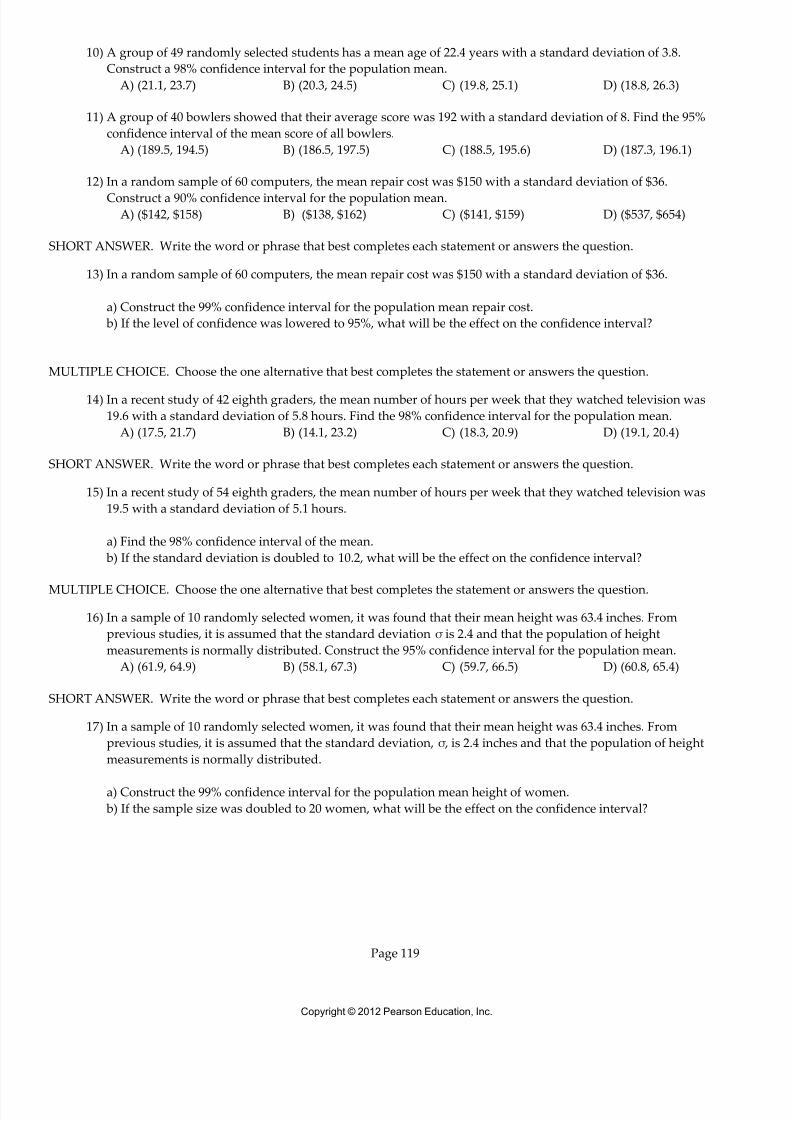
10) A group of 49 randomly selected students has a mean age of 22.4 years with a standard deviation of 3.8.
Construct a 98% confidence interval for the population mean.
A) (21.1, 23.7) B) (20.3, 24.5) C) (19.8, 25.1) D) (18.8, 26.3)
11) A group of 40 bowlers showed that their average score was 192 with a standard deviation of 8. Find the 95%
confidence interval of the mean score of all bowlers.
A) (189.5, 194.5) B) (186.5, 197.5) C) (188.5, 195.6) D) (187.3, 196.1)
12) In a random sample of 60 computers, the mean repair cost was $150 with a standard deviation of $36.
Construct a 90% confidence interval for the population mean.A) ($142, $158) B) ($138, $162) C) ($141, $159) D) ($537, $654)
SHORT ANSWER. Write the word or phrase that best completes each statement or answers the question.
13) In a random sample of 60 computers, the mean repair cost was $150 with a standard deviation of $36.
a) Construct the 99% confidence interval for the population mean repair cost.
b) If the level of confidence was lowered to 95%, what will be the effect on the confidence interval?
MULTIPLE CHOICE. Choose the one alternative that best completes the statement or answers the question.
14) In a recent study of 42 eighth graders, the mean number of hours per week that they watched television was
19.6 with a standard deviation of 5.8 hours. Find the 98% confidence interval for the population mean.
A) (17.5, 21.7) B) (14.1, 23.2) C) (18.3, 20.9) D) (19.1, 20.4)
SHORT ANSWER. Write the word or phrase that best completes each statement or answers the question.
15) In a recent study of 54 eighth graders, the mean number of hours per week that they watched television was
19.5 with a standard deviation of 5.1 hours.
a) Find the 98% confidence interval of the mean.
b) If the standard deviation is doubled to 10.2, what will be the effect on the confidence interval?
MULTIPLE CHOICE. Choose the one alternative that best completes the statement or answers the question.
16) In a sample of 10 randomly selected women, it was found that their mean height was 63.4 inches. From
previous studies, it is assumed that the standard deviation σ is 2.4 and that the population of height
measurements is normally distributed. Construct the 95% confidence interval for the population mean.
A) (61.9, 64.9) B) (58.1, 67.3) C) (59.7, 66.5) D) (60.8, 65.4)
SHORT ANSWER. Write the word or phrase that best completes each statement or answers the question.
17) In a sample of 10 randomly selected women, it was found that their mean height was 63.4 inches. From
previous studies, it is assumed that the standard deviation, σ , is 2.4 inches and that the population of height
measurements is normally distributed.
a) Construct the 99% confidence interval for the population mean height of women.
b) If the sample size was doubled to 20 women, what will be the effect on the confidence interval?
Page 119
Copyright © 2012 Pearson Education, Inc.
8/20/2019 les5e_ptb_06
http://slidepdf.com/reader/full/les5eptb06 3/14
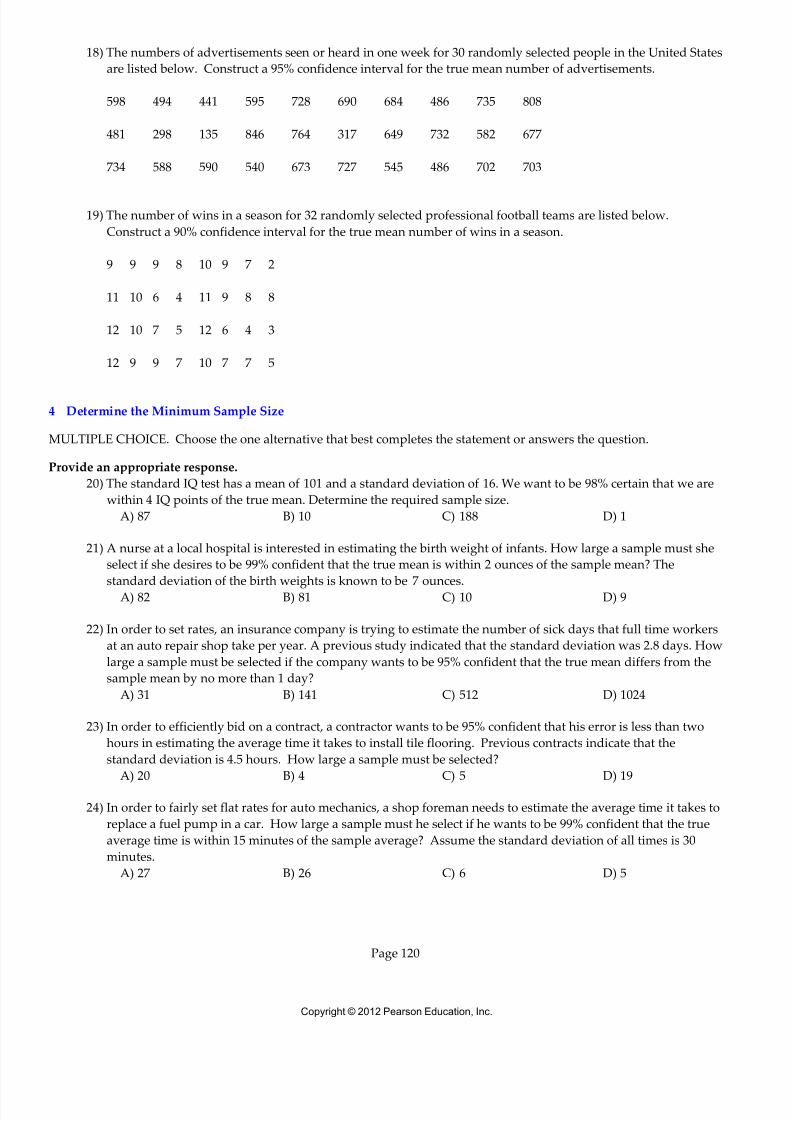
18) The numbers of advertisements seen or heard in one week for 30 randomly selected people in the United States
are listed below. Construct a 95% confidence interval for the true mean number of advertisements.
598 494 441 595 728 690 684 486 735 808
481 298 135 846 764 317 649 732 582 677
734 588 590 540 673 727 545 486 702 703
19) The number of wins in a season for 32 randomly selected professional football teams are listed below.
Construct a 90% confidence interval for the true mean number of wins in a season.
9 9 9 8 10 9 7 2
11 10 6 4 11 9 8 8
12 10 7 5 12 6 4 3
12 9 9 7 10 7 7 5
4 Determine the Minimum Sample Size
MULTIPLE CHOICE. Choose the one alternative that best completes the statement or answers the question.
Provide an appropriate response.
20) The standard IQ test has a mean of 101 and a standard deviation of 16. We want to be 98% certain that we are
within 4 IQ points of the true mean. Determine the required sample size.
A) 87 B) 10 C) 188 D) 1
21) A nurse at a local hospital is interested in estimating the birth weight of infants. How large a sample must she
select if she desires to be 99% confident that the true mean is within 2 ounces of the sample mean? The
standard deviation of the birth weights is known to be 7 ounces.
A) 82 B) 81 C) 10 D) 9
22) In order to set rates, an insurance company is trying to estimate the number of sick days that full time workers
at an auto repair shop take per year. A previous study indicated that the standard deviation was 2.8 days. How
large a sample must be selected if the company wants to be 95% confident that the true mean differs from the
sample mean by no more than 1 day?
A) 31 B) 141 C) 512 D) 1024
23) In order to efficiently bid on a contract, a contractor wants to be 95% confident that his error is less than two
hours in estimating the average time it takes to install tile flooring. Previous contracts indicate that the
standard deviation is 4.5 hours. How large a sample must be selected?
A) 20 B) 4 C) 5 D) 19
24) In order to fairly set flat rates for auto mechanics, a shop foreman needs to estimate the average time it takes to
replace a fuel pump in a car. How large a sample must he select if he wants to be 99% confident that the true
average time is within 15 minutes of the sample average? Assume the standard deviation of all times is 30
minutes.
A) 27 B) 26 C) 6 D) 5
Page 120
Copyright © 2012 Pearson Education, Inc.
8/20/2019 les5e_ptb_06
http://slidepdf.com/reader/full/les5eptb06 4/14
SHORT ANSWER. Write the word or phrase that best completes each statement or answers the question.
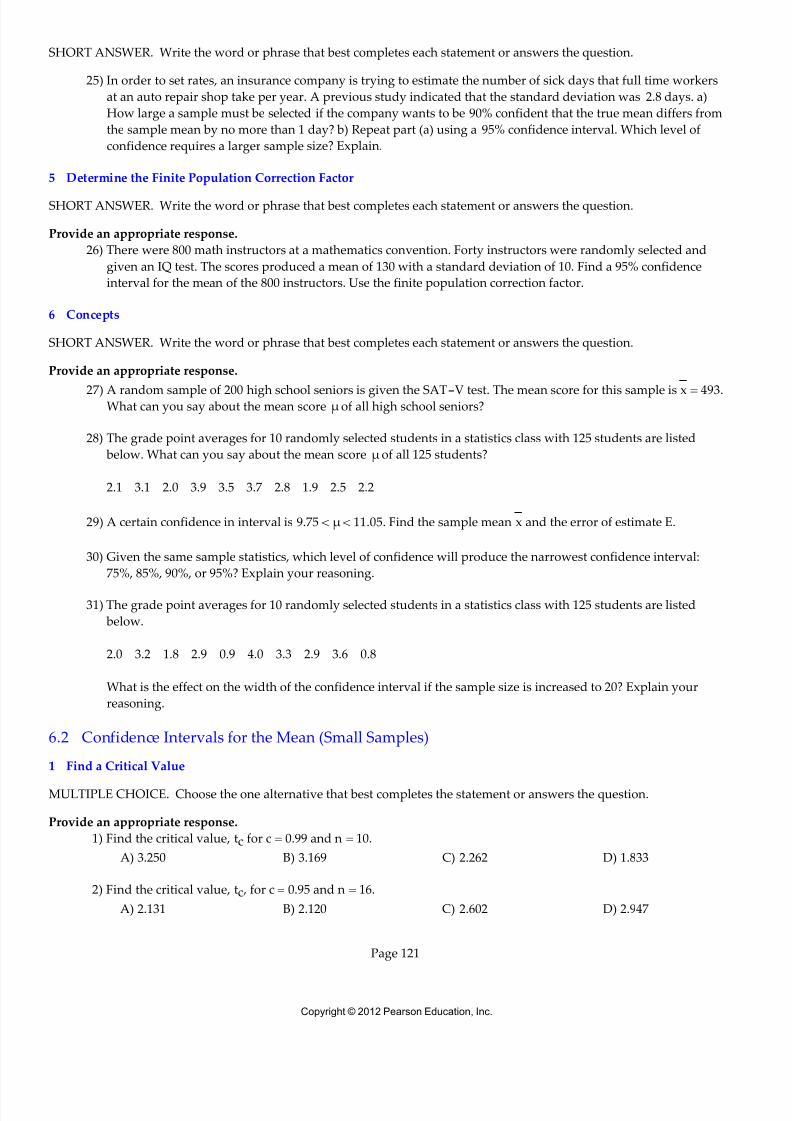
25) In order to set rates, an insurance company is trying to estimate the number of sick days that full time workers
at an auto repair shop take per year. A previous study indicated that the standard deviation was 2.8 days. a)
How large a sample must be selected if the company wants to be 90% confident that the true mean differs from
the sample mean by no more than 1 day? b) Repeat part (a) using a 95% confidence interval. Which level of
confidence requires a larger sample size? Explain.
5 Determine the Finite Population Correction Factor
SHORT ANSWER. Write the word or phrase that best completes each statement or answers the question.
Provide an appropriate response.
26) There were 800 math instructors at a mathematics convention. Forty instructors were randomly selected and
given an IQ test. The scores produced a mean of 130 with a standard deviation of 10. Find a 95% confidence
interval for the mean of the 800 instructors. Use the finite population correction factor.
6 Concepts
SHORT ANSWER. Write the word or phrase that best completes each statement or answers the question.
Provide an appropriate response.
27) A random sample of 200 high school seniors is given the SAT-V test. The mean score for this sample is x = 493.What can you say about the mean score μ of all high school seniors?
28) The grade point averages for 10 randomly selected students in a statistics class with 125 students are listed
below. What can you say about the mean score μ of all 125 students?
2.1 3.1 2.0 3.9 3.5 3.7 2.8 1.9 2.5 2.2
29) A certain confidence in interval is 9.75 < μ< 11.05. Find the sample mean x and the error of estimate E.
30) Given the same sample statistics, which level of confidence will produce the narrowest confidence interval:
75%, 85%, 90%, or 95%? Explain your reasoning.
31) The grade point averages for 10 randomly selected students in a statistics class with 125 students are listed
below.
2.0 3.2 1.8 2.9 0.9 4.0 3.3 2.9 3.6 0.8
What is the effect on the width of the confidence interval if the sample size is increased to 20? Explain your
reasoning.
6.2 Confidence Intervals for the Mean (Small Samples)
1 Find a Critical Value
MULTIPLE CHOICE. Choose the one alternative that best completes the statement or answers the question.
Provide an appropriate response.
1) Find the critical value, tc for c = 0.99 and n = 10.
A) 3.250 B) 3.169 C) 2.262 D) 1.833
2) Find the critical value, tc , for c = 0.95 and n = 16.
A) 2.131 B) 2.120 C) 2.602 D) 2.947
Page 121
Copyright © 2012 Pearson Education, Inc.
8/20/2019 les5e_ptb_06
http://slidepdf.com/reader/full/les5eptb06 5/14
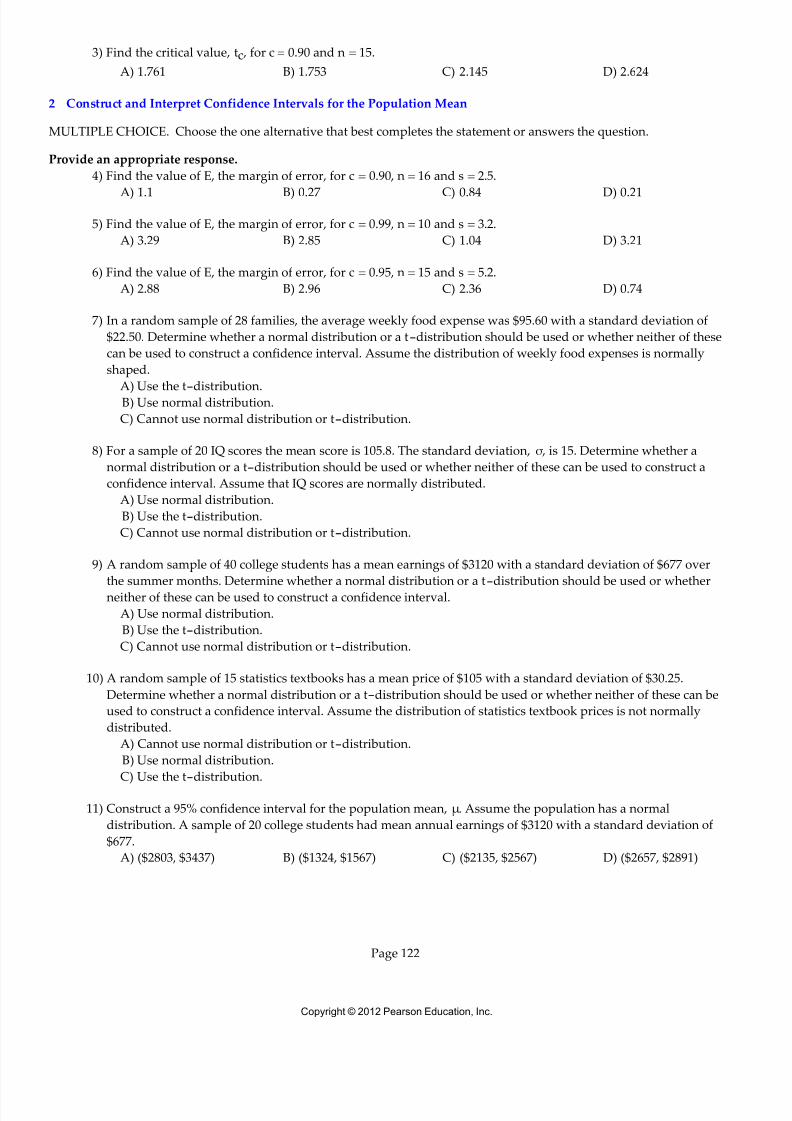
3) Find the critical value, tc , for c = 0.90 and n = 15.
A) 1.761 B) 1.753 C) 2.145 D) 2.624
2 Construct and Interpret Confidence Intervals for the Population Mean
MULTIPLE CHOICE. Choose the one alternative that best completes the statement or answers the question.
Provide an appropriate response.
4) Find the value of E, the margin of error, for c = 0.90 , n = 16 and s = 2.5.
A) 1.1 B) 0.27 C) 0.84 D) 0.21
5) Find the value of E, the margin of error, for c = 0.99, n = 10 and s = 3.2.
A) 3.29 B) 2.85 C) 1.04 D) 3.21
6) Find the value of E, the margin of error, for c = 0.95, n = 15 and s = 5.2.
A) 2.88 B) 2.96 C) 2.36 D) 0.74
7) In a random sample of 28 families, the average weekly food expense was $95.60 with a standard deviation of
$22.50. Determine whether a normal distribution or a t-distribution should be used or whether neither of these
can be used to construct a confidence interval. Assume the distribution of weekly food expenses is normally
shaped.
A) Use the t-
distribution.B) Use normal distribution.
C) Cannot use normal distribution or t-distribution.
8) For a sample of 20 IQ scores the mean score is 105.8. The standard deviation, σ , is 15. Determine whether a
normal distribution or a t-distribution should be used or whether neither of these can be used to construct a
confidence interval. Assume that IQ scores are normally distributed.
A) Use normal distribution.
B) Use the t-distribution.
C) Cannot use normal distribution or t-distribution.
9) A random sample of 40 college students has a mean earnings of $3120 with a standard deviation of $677 over
the summer months. Determine whether a normal distribution or a t-distribution should be used or whether
neither of these can be used to construct a confidence interval.
A) Use normal distribution.
B) Use the t-distribution.
C) Cannot use normal distribution or t-distribution.
10) A random sample of 15 statistics textbooks has a mean price of $105 with a standard deviation of $30.25.
Determine whether a normal distribution or a t-distribution should be used or whether neither of these can be
used to construct a confidence interval. Assume the distribution of statistics textbook prices is not normally
distributed.
A) Cannot use normal distribution or t-distribution.
B) Use normal distribution.
C) Use the t-distribution.
11) Construct a 95% confidence interval for the population mean, μ. Assume the population has a normal
distribution. A sample of 20 college students had mean annual earnings of $3120 with a standard deviation of
$677.
A) ($2803, $3437) B) ($1324, $1567) C) ($2135, $2567) D) ($2657, $2891)
Page 122
Copyright © 2012 Pearson Education, Inc.
8/20/2019 les5e_ptb_06
http://slidepdf.com/reader/full/les5eptb06 6/14
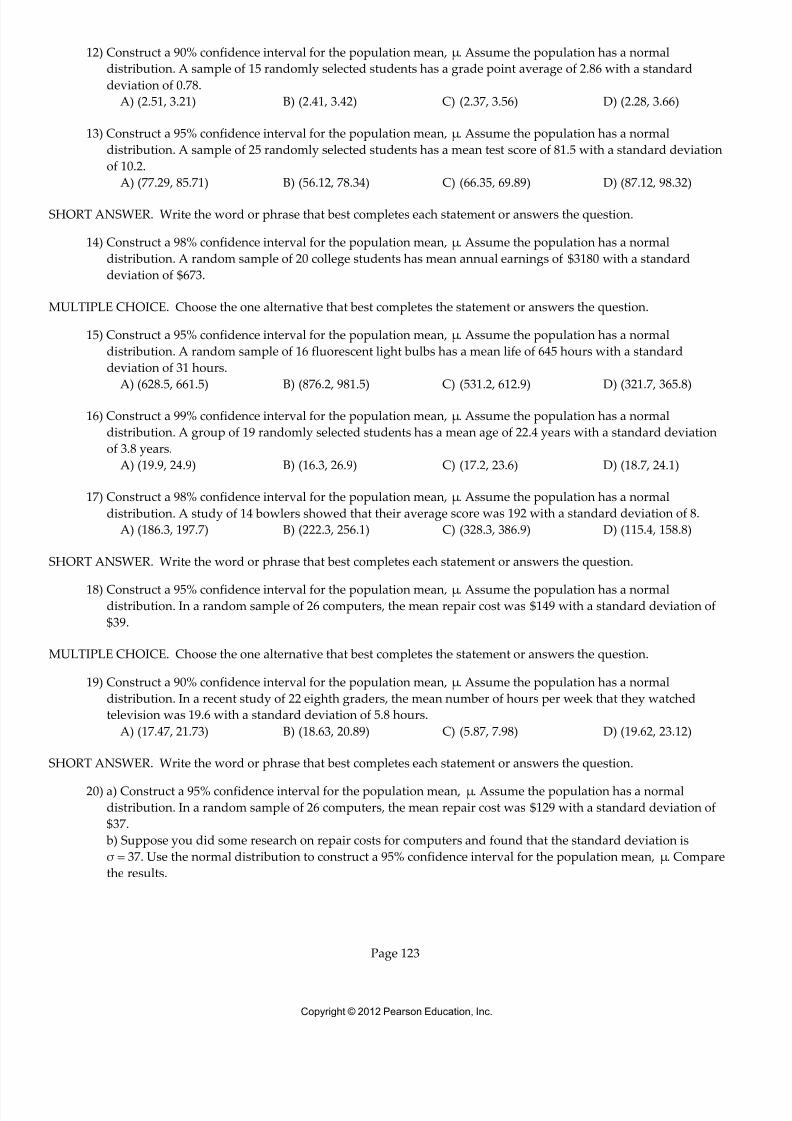
12) Construct a 90% confidence interval for the population mean, μ. Assume the population has a normal
distribution. A sample of 15 randomly selected students has a grade point average of 2.86 with a standard
deviation of 0.78.
A) (2.51, 3.21) B) (2.41, 3.42) C) (2.37, 3.56) D) (2.28, 3.66)
13) Construct a 95% confidence interval for the population mean, μ. Assume the population has a normal
distribution. A sample of 25 randomly selected students has a mean test score of 81.5 with a standard deviation
of 10.2.
A) (77.29, 85.71) B) (56.12, 78.34) C) (66.35, 69.89) D) (87.12, 98.32)
SHORT ANSWER. Write the word or phrase that best completes each statement or answers the question.
14) Construct a 98% confidence interval for the population mean, μ. Assume the population has a normal
distribution. A random sample of 20 college students has mean annual earnings of $3180 with a standard
deviation of $673.
MULTIPLE CHOICE. Choose the one alternative that best completes the statement or answers the question.
15) Construct a 95% confidence interval for the population mean, μ. Assume the population has a normal
distribution. A random sample of 16 fluorescent light bulbs has a mean life of 645 hours with a standard
deviation of 31 hours.
A) (628.5, 661.5) B) (876.2, 981.5) C) (531.2, 612.9) D) (321.7, 365.8)
16) Construct a 99% confidence interval for the population mean, μ. Assume the population has a normal
distribution. A group of 19 randomly selected students has a mean age of 22.4 years with a standard deviation
of 3.8 years.
A) (19.9, 24.9) B) (16.3, 26.9) C) (17.2, 23.6) D) (18.7, 24.1)
17) Construct a 98% confidence interval for the population mean, μ. Assume the population has a normal
distribution. A study of 14 bowlers showed that their average score was 192 with a standard deviation of 8.
A) (186.3, 197.7) B) (222.3, 256.1) C) (328.3, 386.9) D) (115.4, 158.8)
SHORT ANSWER. Write the word or phrase that best completes each statement or answers the question.
18) Construct a 95% confidence interval for the population mean, μ. Assume the population has a normaldistribution. In a random sample of 26 computers, the mean repair cost was $149 with a standard deviation of
$39.
MULTIPLE CHOICE. Choose the one alternative that best completes the statement or answers the question.
19) Construct a 90% confidence interval for the population mean, μ. Assume the population has a normal
distribution. In a recent study of 22 eighth graders, the mean number of hours per week that they watched
television was 19.6 with a standard deviation of 5.8 hours.
A) (17.47, 21.73) B) (18.63, 20.89) C) (5.87, 7.98) D) (19.62, 23.12)
SHORT ANSWER. Write the word or phrase that best completes each statement or answers the question.
20) a) Construct a 95% confidence interval for the population mean, μ. Assume the population has a normal
distribution. In a random sample of 26 computers, the mean repair cost was $129 with a standard deviation of
$37.
b) Suppose you did some research on repair costs for computers and found that the standard deviation is
σ = 37. Use the normal distribution to construct a 95% confidence interval for the population mean, μ. Compare
the results.
Page 123
Copyright © 2012 Pearson Education, Inc.
8/20/2019 les5e_ptb_06
http://slidepdf.com/reader/full/les5eptb06 7/14
MULTIPLE CHOICE. Choose the one alternative that best completes the statement or answers the question.
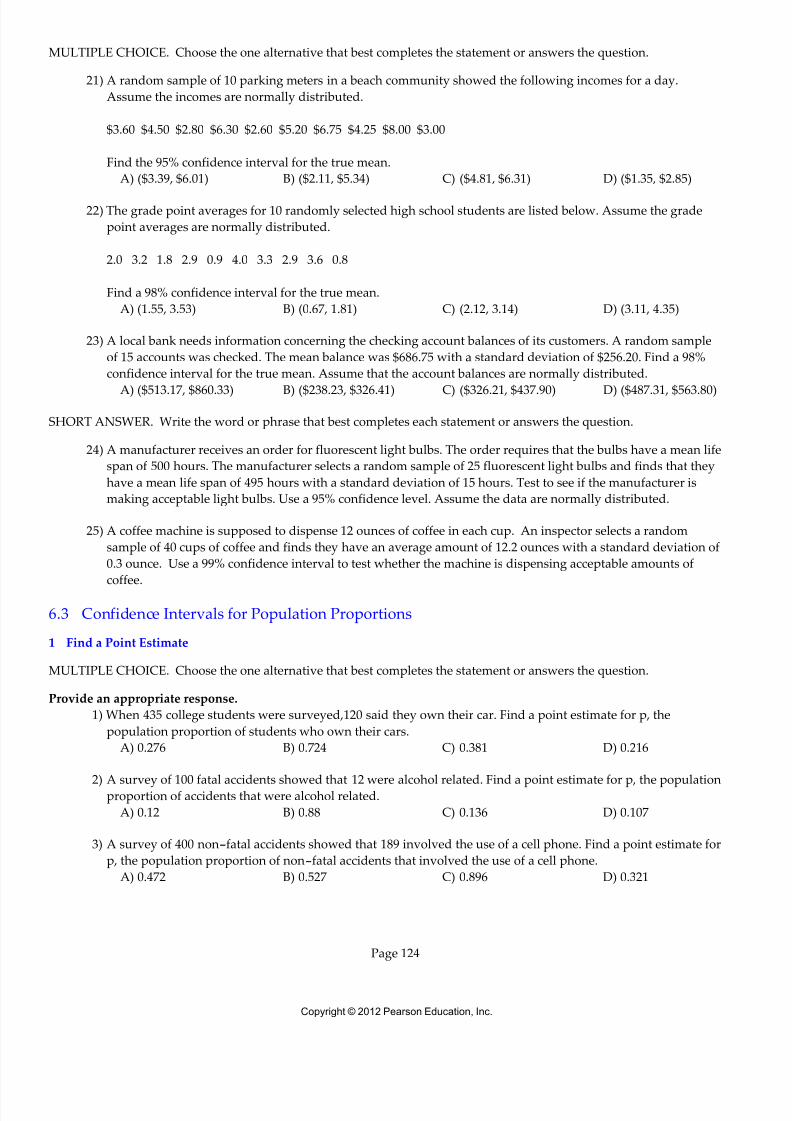
21) A random sample of 10 parking meters in a beach community showed the following incomes for a day.
Assume the incomes are normally distributed.
$3.60 $4.50 $2.80 $6.30 $2.60 $5.20 $6.75 $4.25 $8.00 $3.00
Find the 95% confidence interval for the true mean.
A) ($3.39, $6.01) B) ($2.11, $5.34) C) ($4.81, $6.31) D) ($1.35, $2.85)
22) The grade point averages for 10 randomly selected high school students are listed below. Assume the grade
point averages are normally distributed.
2.0 3.2 1.8 2.9 0.9 4.0 3.3 2.9 3.6 0.8
Find a 98% confidence interval for the true mean.
A) (1.55, 3.53) B) (0.67, 1.81) C) (2.12, 3.14) D) (3.11, 4.35)
23) A local bank needs information concerning the checking account balances of its customers. A random sample
of 15 accounts was checked. The mean balance was $686.75 with a standard deviation of $256.20. Find a 98%
confidence interval for the true mean. Assume that the account balances are normally distributed.
A) ($513.17, $860.33) B) ($238.23, $326.41) C) ($326.21, $437.90) D) ($487.31, $563.80)
SHORT ANSWER. Write the word or phrase that best completes each statement or answers the question.
24) A manufacturer receives an order for fluorescent light bulbs. The order requires that the bulbs have a mean life
span of 500 hours. The manufacturer selects a random sample of 25 fluorescent light bulbs and finds that they
have a mean life span of 495 hours with a standard deviation of 15 hours. Test to see if the manufacturer is
making acceptable light bulbs. Use a 95% confidence level. Assume the data are normally distributed.
25) A coffee machine is supposed to dispense 12 ounces of coffee in each cup. An inspector selects a random
sample of 40 cups of coffee and finds they have an average amount of 12.2 ounces with a standard deviation of
0.3 ounce. Use a 99% confidence interval to test whether the machine is dispensing acceptable amounts of
coffee.
6.3 Confidence Intervals for Population Proportions
1 Find a Point Estimate
MULTIPLE CHOICE. Choose the one alternative that best completes the statement or answers the question.
Provide an appropriate response.
1) When 435 college students were surveyed,120 said they own their car. Find a point estimate for p, the
population proportion of students who own their cars.
A) 0.276 B) 0.724 C) 0.381 D) 0.216
2) A survey of 100 fatal accidents showed that 12 were alcohol related. Find a point estimate for p, the populationproportion of accidents that were alcohol related.
A) 0.12 B) 0.88 C) 0.136 D) 0.107
3) A survey of 400 non-fatal accidents showed that 189 involved the use of a cell phone. Find a point estimate for
p, the population proportion of non-fatal accidents that involved the use of a cell phone.
A) 0.472 B) 0.527 C) 0.896 D) 0.321
Page 124
Copyright © 2012 Pearson Education, Inc.
8/20/2019 les5e_ptb_06
http://slidepdf.com/reader/full/les5eptb06 8/14
4) A survey of 250 homeless persons showed that 17 were veterans. Find a point estimate p, for the population
proportion of homeless persons who are veterans.
A) 0.068 B) 0.932 C) 0.073 D) 0.064
5) A survey of 2650 golfers showed that 379 of them are left-handed. Find a point estimate for p, the population
proportion of golfers that are left-handed.
A) 0.143 B) 0.857 C) 0.167 D) 0.125
2 Construct and Interpret Confidence Intervals for the Population Proportion
MULTIPLE CHOICE. Choose the one alternative that best completes the statement or answers the question.
Provide an appropriate response.
6) In a survey of 2480 golfers, 15% said they were left-handed. The surveyʹs margin of error was 3%. Construct a
confidence interval for the proportion of left-handed golfers.
A) (0.12, 0.18) B) (0.18, 0.21) C) (0.12, 0.15) D) (0.11, 0.19)
SHORT ANSWER. Write the word or phrase that best completes each statement or answers the question.
7) The Federal Bureau of Labor Statistics surveyed 50,000 people and found the unemployment rate to be 5.8%.
The margin of error was 0.2%. Construct a confidence interval for the unemployment rate.
8) When 495 college students were surveyed, 150 said they own their car. Construct a 95% confidence interval forthe proportion of college students who say they own their cars.
9) A survey of 300 fatal accidents showed that 123 were alcohol related. Construct a 98% confidence interval for
the proportion of fatal accidents that were alcohol related.
10) A survey of 400 non-fatal accidents showed that 197 involved the use of a cell phone. Construct a 99%
confidence interval for the proportion of fatal accidents that involved the use of a cell phone.
MULTIPLE CHOICE. Choose the one alternative that best completes the statement or answers the question.
11) A survey of 280 homeless persons showed that 63 were veterans. Construct a 90% confidence interval for the
proportion of homeless persons who are veterans.A) (0.184, 0.266) B) (0.176, 0.274) C) (0.167, 0.283) D) (0.161, 0.289)
12) A survey of 2450 golfers showed that 281 of them are left-handed. Construct a 98% confidence interval for the
proportion of golfers that are left-handed.
A) (0.100, 0.130) B) (0.203, 0.293) C) (0.369, 0.451) D) (0.683, 0.712)
SHORT ANSWER. Write the word or phrase that best completes each statement or answers the question.
13) In a survey of 10 golfers, 2 were found to be left-handed. Is it practical to construct the 90% confidence interval
for the population proportion, p? Explain.
14) The USA Today claims that 44% of adults who access the Internet read the international news online. You
want to check the accuracy of their claim by surveying a random sample of 120 adults who access the Internetand asking them if they read the international news online. Fifty-two adults responded ʺyes.ʺ Use a 95%
confidence interval to test the newspaperʹs claim.
Page 125
Copyright © 2012 Pearson Education, Inc.
8/20/2019 les5e_ptb_06
http://slidepdf.com/reader/full/les5eptb06 9/14
3 Determine the Minimum Sample Size
MULTIPLE CHOICE. Choose the one alternative that best completes the statement or answers the question.
Provide an appropriate response.
15) A researcher at a major hospital wishes to estimate the proportion of the adult population of the United States
that has high blood pressure. How large a sample is needed in order to be 95% confident that the sample
proportion will not differ from the true proportion by more than 4%?
A) 601 B) 13 C) 1201 D) 423
16) A pollster wishes to estimate the proportion of United States voters who favor capital punishment. How large a
sample is needed in order to be 95% confident that the sample proportion will not differ from the true
proportion by more than 5%?
A) 385 B) 271 C) 10 D) 769
17) A private opinion poll is conducted for a politician to determine what proportion of the population favors
decriminalizing marijuana possession. How large a sample is needed in order to be 95% confident that the
sample proportion will not differ from the true proportion by more than 2%?
A) 2401 B) 1692 C) 4802 D) 25
18) A manufacturer of golf equipment wishes to estimate the number of left-handed golfers. How large a sample is
needed in order to be 98% confident that the sample proportion will not differ from the true proportion by
more than 2%? A previous study indicates that the proportion of left-handed golfers is 8%.
A) 999 B) 707 C) 1086 D) 17
19) A researcher wishes to estimate the number of households with two cars. How large a sample is needed in
order to be 98% confident that the sample proportion will not differ from the true proportion by more than 5%?
A previous study indicates that the proportion of households with two cars is 19%.
A) 335 B) 237 C) 413 D) 8
SHORT ANSWER. Write the word or phrase that best completes each statement or answers the question.
20) A state highway patrol official wishes to estimate the number of drivers that exceed the speed limit traveling a
certain road.
a) How large a sample is needed in order to be 95% confident that the sample proportion will not differ fromthe true proportion by more than 2%?
b) Repeat part (a) assuming previous studies found that 70% of drivers on this road exceeded the speed limit.
6.4 Confidence Intervals for Variance and Standard Deviation
1 Find Critical Values
MULTIPLE CHOICE. Choose the one alternative that best completes the statement or answers the question.
Provide an appropriate response.
1) Find the critical values, X 2R andX
2L , for c = 0.95 and n = 12.
A) 3.816 and 21.920 B) 3.053 and 24.725 C) 4.575 and 26.757 D) 2.603 and 19.675
2) Find the critical values, X 2R andX
2L , for c = 0.90 and n = 15.
A) 6.571 and 23.685 B) 4.075 and 31.319 C) 4.660 and 29.131 D) 5.629 and 26.119
Page 126
Copyright © 2012 Pearson Education, Inc.
8/20/2019 les5e_ptb_06
http://slidepdf.com/reader/full/les5eptb06 10/14
3) Find the critical values, X 2R andX
2L , for c = 0.98 and n = 20.
A) 7.633 and 36.191 B) 6.844 and 27.204 C) 8.907 and 38.582 D) 10.117 and 32.852
4) Find the critical values, X 2R andX
2L , for c = 0.99 and n = 10.
A) 1.735 and 23.587 B) 2.156 and 25.188 C) 2.088 and 21.666 D) 2.558 and 23.209
2 Construct
Confidence
Intervals
for
the
Population
Variance
and
Population
Standard
Deviation
MULTIPLE CHOICE. Choose the one alternative that best completes the statement or answers the question.
Assume the sample is taken from a normally distributed population and construct the indicated confidence interval.
5) Construct a 95% confidence interval for the population standard deviation σ of a random sample of 15 men
who have a mean weight of 165.2 pounds with a standard deviation of 13.5 pounds. Assume the population is
normally distributed.
A) (9.9 , 21.3) B) (97.7, 453.3) C) (2.7, 5.8) D) (10.4, 19.7)
6) A random sample of 16 men have a mean height of 67.5 inches and a standard deviation of 1.5 inches.
Construct a 99% confidence interval for the population standard deviation, σ.
A) (1.0, 2.7) B) (1.0, 2.8) C) (0.8, 2.2) D) (1.1, 2.5)
7) A random sample of 20 women have a mean height of 62.5 inches and a standard deviation of 3.2 inches.
Construct a 98% confidence interval for the population variance, σ2.
A) (5.4, 25.5) B) (2.3, 5.0) C) (1.7, 8.0) D) (5.7, 26.8)
8) The heights (in inches) of 20 randomly selected adult males are listed below. Construct a 99% confidence
interval for the variance, σ2.
70 72 71 70 69 73 69 68 70 71
67 71 70 74 69 68 71 71 71 72
A) (1.47, 8.27) B) (21.61, 69.06) C) (1.35, 8.43) D) (2.16, 71.06)
9) The grade point averages for 10 randomly selected students are listed below. Construct a 90% confidence
interval for the population standard deviation, σ.
2.0 3.2 1.8 2.9 0.9 4.0 3.3 2.9 3.6 0.8
A) (0.81, 1.83) B) (0.32, 0.85) C) (0.53, 1.01) D) (1.10, 2.01)
10) The mean replacement time for a random sample of 12 microwave ovens is 8.6 years with a standard deviation
of 4.2 years. Construct the 98% confidence interval for the population variance, σ2.
A) (7.8, 63.6) B) (2.8, 8.0) C) (1.9, 15.1) D) (7.4, 54.3)
11) A student randomly selects 10 CDs at a store. The mean is $13.75 with a standard deviation of $1.50. Construct
a 95% confidence interval for the population standard deviation, σ.
A) ($1.03, $2.74) B) ($0.99, $2.50) C) ($1.06, $7.51) D) ($0.84, $2.24)
Page 127
Copyright © 2012 Pearson Education, Inc.
8/20/2019 les5e_ptb_06
http://slidepdf.com/reader/full/les5eptb06 11/14
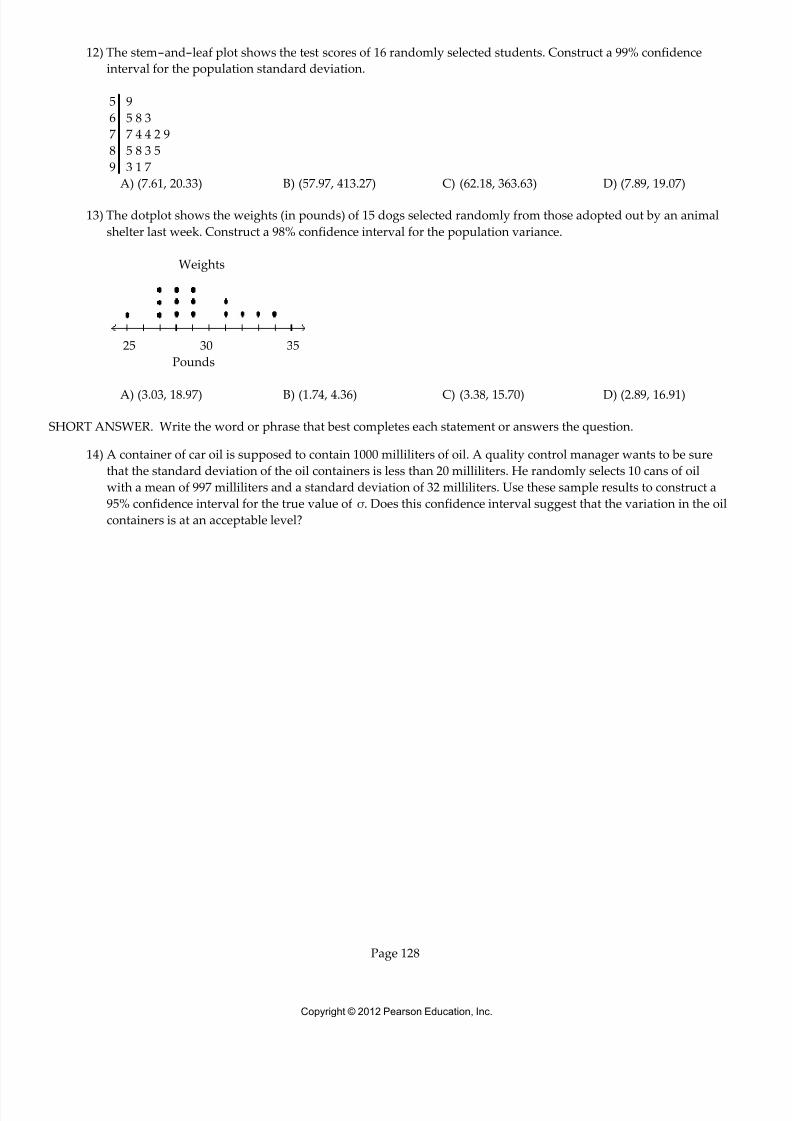
12) The stem-and-leaf plot shows the test scores of 16 randomly selected students. Construct a 99% confidence
interval for the population standard deviation.
5
6
7
8
9
9
5 8 3
7 4 4 2 9
5 8 3 5
3 1 7
A) (7.61, 20.33) B) (57.97, 413.27) C) (62.18, 363.63) D) (7.89, 19.07)
13) The dotplot shows the weights (in pounds) of 15 dogs selected randomly from those adopted out by an animal
shelter last week. Construct a 98% confidence interval for the population variance.
Weights
25 30 35
Pounds
A) (3.03, 18.97) B) (1.74, 4.36) C) (3.38, 15.70) D) (2.89, 16.91)
SHORT ANSWER. Write the word or phrase that best completes each statement or answers the question.
14) A container of car oil is supposed to contain 1000 milliliters of oil. A quality control manager wants to be sure
that the standard deviation of the oil containers is less than 20 milliliters. He randomly selects 10 cans of oil
with a mean of 997 milliliters and a standard deviation of 32 milliliters. Use these sample results to construct a
95% confidence interval for the true value of σ. Does this confidence interval suggest that the variation in the oil
containers is at an acceptable level?
Page 128
Copyright © 2012 Pearson Education, Inc.
8/20/2019 les5e_ptb_06
http://slidepdf.com/reader/full/les5eptb06 12/14
Ch. 6 Confidence IntervalsAnswer Key
6.1 Confidence Intervals for the Mean (Large Samples)1 Find a Critical Value
1) A
2 Find the Margin of Error
2) A
3) A
4) A
5) A
3 Construct and Interpret Confidence Intervals for the Population Mean
6) A
7) A
8) A
9) A
10) A
11) A
12) A
13) a) ($138, $162)
b) A decrease in the level of confidence will decrease the width of the confidence interval.
14) A
15) a) (17.9, 21.1)
b) An increase in the standard deviation will widen the confidence interval.
16) A
17) a) (61.4, 65.4)
b) An increase in the sample size will decrease the width of the confidence interval.
18) (543.8, 658. 0)
19) (7.2, 8.8)
4 Determine the Minimum Sample Size
20) A
21) A
22) A
23) A
24) A
25) a) 22
b) 31; A 95% confidence interval requires a larger sample than a 90% confidence interval because more information is
needed from the population to be 95% confident.
5 Determine the Finite Population Correction Factor
26) (127.0, 133.0)
6 Concepts
27) The sample mean x = 493 is the best estimator of the unknown population mean μ.
28) The sample mean x = 2.77 is the best point estimate of the unknown population mean μ.
29) Sample mean x = 10.40 and the error of estimate E = 0.65.30) The 75% level of confidence will produce the narrowest confidence interval. As the level of confidence decreases, zc
decreases, causing narrower intervals.
31) The width of the interval will decrease. As n increases, E decreases because n is in the denominator of the formula
for E. So the intervals become narrower.
6.2 Confidence Intervals for the Mean (Small Samples)1 Find a Critical Value
1) A
2) A
Page 129
Copyright © 2012 Pearson Education, Inc.
8/20/2019 les5e_ptb_06
http://slidepdf.com/reader/full/les5eptb06 13/14
3) A
2 Construct and Interpret Confidence Intervals for the Population Mean
4) A
5) A
6) A
7) A
8) A
9) A
10) A
11) A12) A
13) A
14) ($2798, $3562)
15) A
16) A
17) A
18) ($133.24, $164.76)
19) A
20) a) ($114.05, $143.95)
b) ($114.78, $143.22); The t-confidence interval is wider.
21) A
22) A23) A
24) (488.81 , 501.19). Because the interval contains the desired life span of 500 hours, they are making good light bulbs.
25) (12.1, 12.3) Because the interval does not contain the desired amount of 12 ounces, the machine is not working
properly.
6.3 Confidence Intervals for Population Proportions1 Find a Point Estimate
1) A
2) A
3) A
4) A
5) A
2 Construct
and
Interpret
Confidence
Intervals
for
the
Population
Proportion
6) A
7) (0.058, 0.060)
8) (0.263 , 0.344)
9) (0.344, 0.476)
10) (0.428, 0.557)
11) A
12) A
13) It is not practical to find the confidence interval. It is necessary that np^ > 5 to insure that the
distribution of p^ be normal. (np
^ = 2)
14) (0.345, 0.522) Because the interval contains the reported percentage of 44%, the newspaperʹs claim is accurate.
3 Determine
the
Minimum
Sample
Size15) A
16) A
17) A
18) A
19) A
20) a) 2401
b) 2017
Page 130
Copyright © 2012 Pearson Education, Inc.
8/20/2019 les5e_ptb_06
http://slidepdf.com/reader/full/les5eptb06 14/14
6.4 Confidence Intervals for Variance and Standard Deviation1 Find Critical Values
1) A
2) A
3) A
4) A
2 Construct Confidence Intervals for the Population Variance and Population Standard Deviation
5) A
6) A
7) A
8) A
9) A
10) A
11) A
12) A
13) A
14) The 95% confidence interval is (22.01, 58.42). Because this interval does not contain 20, the data suggest that the
standard deviation is not at an acceptable level.
Page 131