Le projet Mer Rouge –Mer Morte - cmimarseille.org · Eau potable : 850 Mm 3 Transfertsaumures:...
17
#WorldInCommon AGENCE FRANÇAISE DE DÉVELOPPEMENT | FRENCH DEVELOPMENT AGENCY Le projet Mer Rouge – Mer Morte Atelier régional sur les instruments économiques dans la gestion de la demande en eau en Méditerranée 13 avril 2018 Frédéric Maurel
Transcript of Le projet Mer Rouge –Mer Morte - cmimarseille.org · Eau potable : 850 Mm 3 Transfertsaumures:...
#WorldInCommonAGENCE FRANÇAISE DE DÉVELOPPEMENT | FRENCH DEVELOPMENT AGENCY
Le projet Mer Rouge – Mer Morte
Atelier régional sur les instruments économiques dans la gestion de la demande en eau en Méditerranée
13 avril 2018
Frédéric Maurel
2
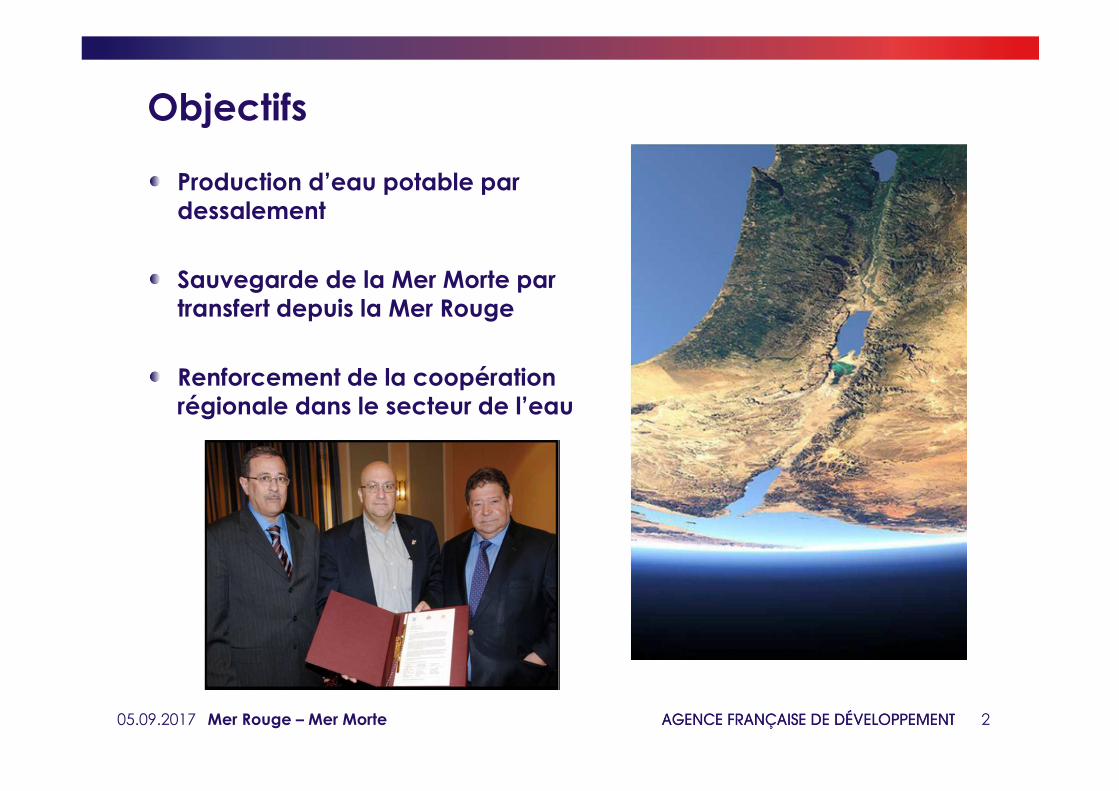
Objectifs
Production d’eau potable par dessalement
Sauvegarde de la Mer Morte par transfert depuis la Mer Rouge
Renforcement de la coopérationrégionale dans le secteur de l’eau
05.09.2017 Mer Rouge – Mer Morte
3
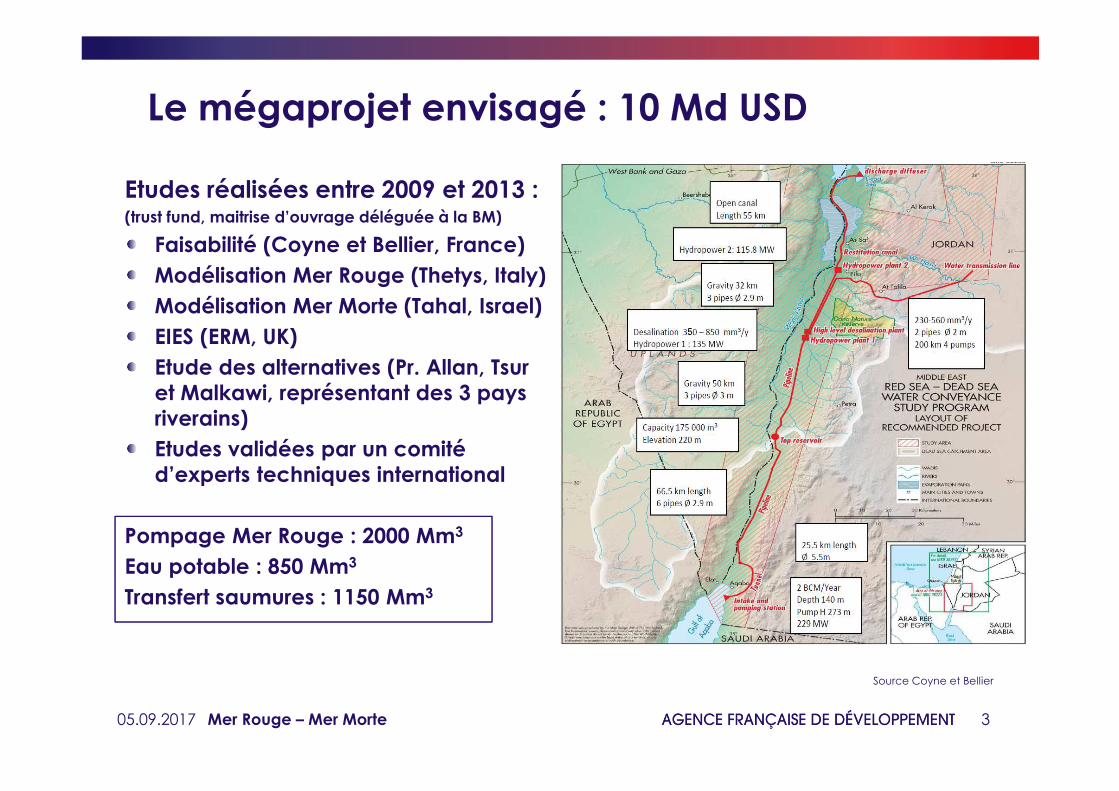
Le mégaprojet envisagé : 10 Md USD
Etudes réalisées entre 2009 et 2013 :(trust fund, maitrise d’ouvrage déléguée à la BM)
Faisabilité (Coyne et Bellier, France)
Modélisation Mer Rouge (Thetys, Italy)
Modélisation Mer Morte (Tahal, Israel)
EIES (ERM, UK)
Etude des alternatives (Pr. Allan, Tsuret Malkawi, représentant des 3 pays riverains)
Etudes validées par un comitéd’experts techniques international
Pompage Mer Rouge : 2000 Mm3
Eau potable : 850 Mm3
Transfert saumures : 1150 Mm3
Source Coyne et Bellier
05.09.2017 Mer Rouge – Mer Morte
4
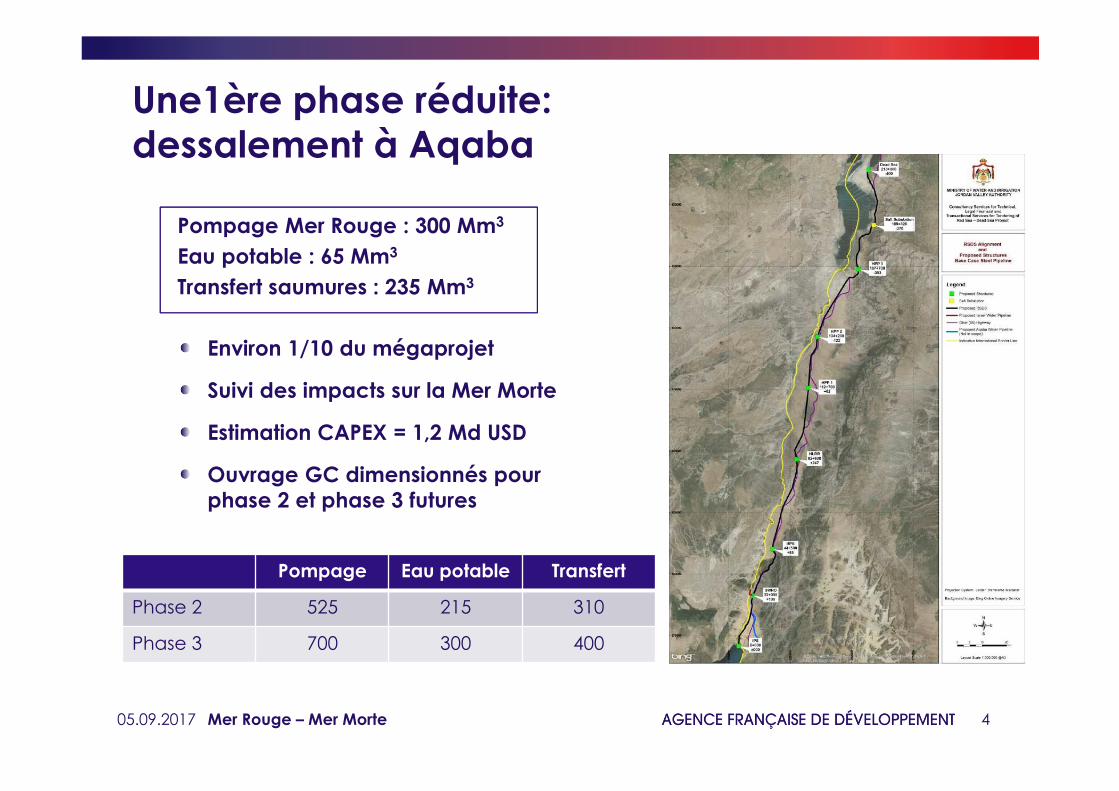
Une1ère phase réduite: dessalement à Aqaba
Pompage Mer Rouge : 300 Mm3
Eau potable : 65 Mm3
Transfert saumures : 235 Mm3
Environ 1/10 du mégaprojet
Suivi des impacts sur la Mer Morte
Estimation CAPEX = 1,2 Md USD
Ouvrage GC dimensionnés pour phase 2 et phase 3 futures
Pompage Eau potable Transfert
Phase 2 525 215 310
Phase 3 700 300 400
05.09.2017 Mer Rouge – Mer Morte
5
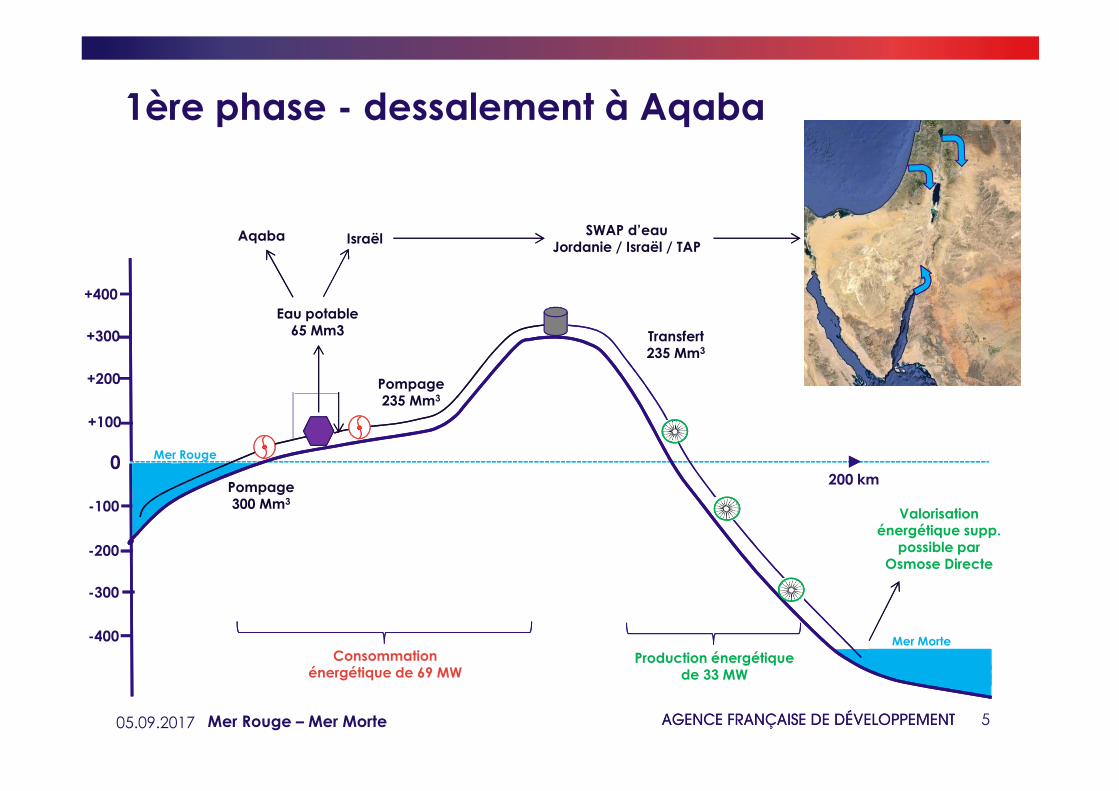
1ère phase - dessalement à Aqaba
0
-100
-200
-300
-400
+100
+200
+300
+400
Pompage300 Mm3
Mer Rouge
Mer Morte
Eau potable 65 Mm3
Pompage235 Mm3
Transfert235 Mm3
Production énergétique de 33 MW
Consommation énergétique de 69 MW
Valorisation énergétique supp.
possible par Osmose Directe
SWAP d’eau Jordanie / Israël / TAP
Aqaba
200 km
Israël
05.09.2017 Mer Rouge – Mer Morte
6
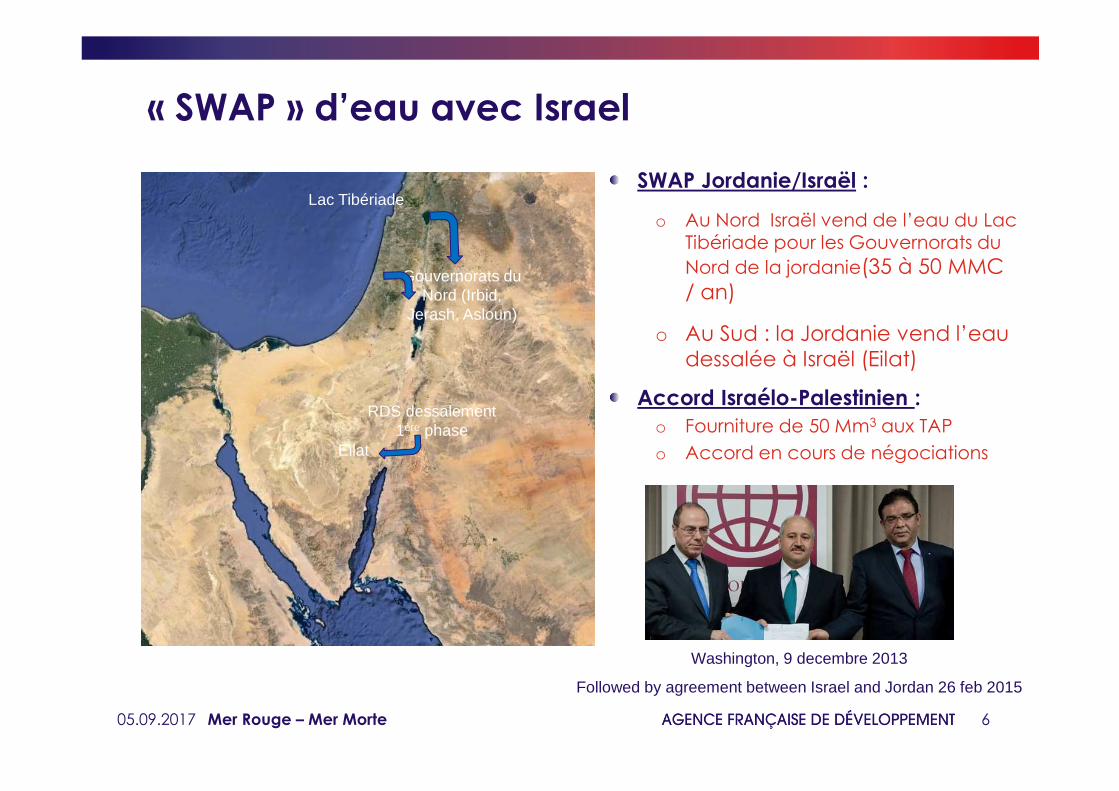
« SWAP » d’eau avec Israel
SWAP Jordanie/Israël :
o Au Nord Israël vend de l’eau du Lac Tibériade pour les Gouvernorats du
Nord de la jordanie(35 à 50 MMC / an)
o Au Sud : la Jordanie vend l’eaudessalée à Israël (Eilat)
Accord Israélo-Palestinien :
o Fourniture de 50 Mm3 aux TAP
o Accord en cours de négociations
Lac Tibériade
Gouvernorats du Nord (Irbid,
Jerash, Asloun)
RDS dessalement 1ère phase
Eilat
Washington, 9 decembre 2013
Followed by agreement between Israel and Jordan 26 feb 2015
05.09.2017 Mer Rouge – Mer Morte
7
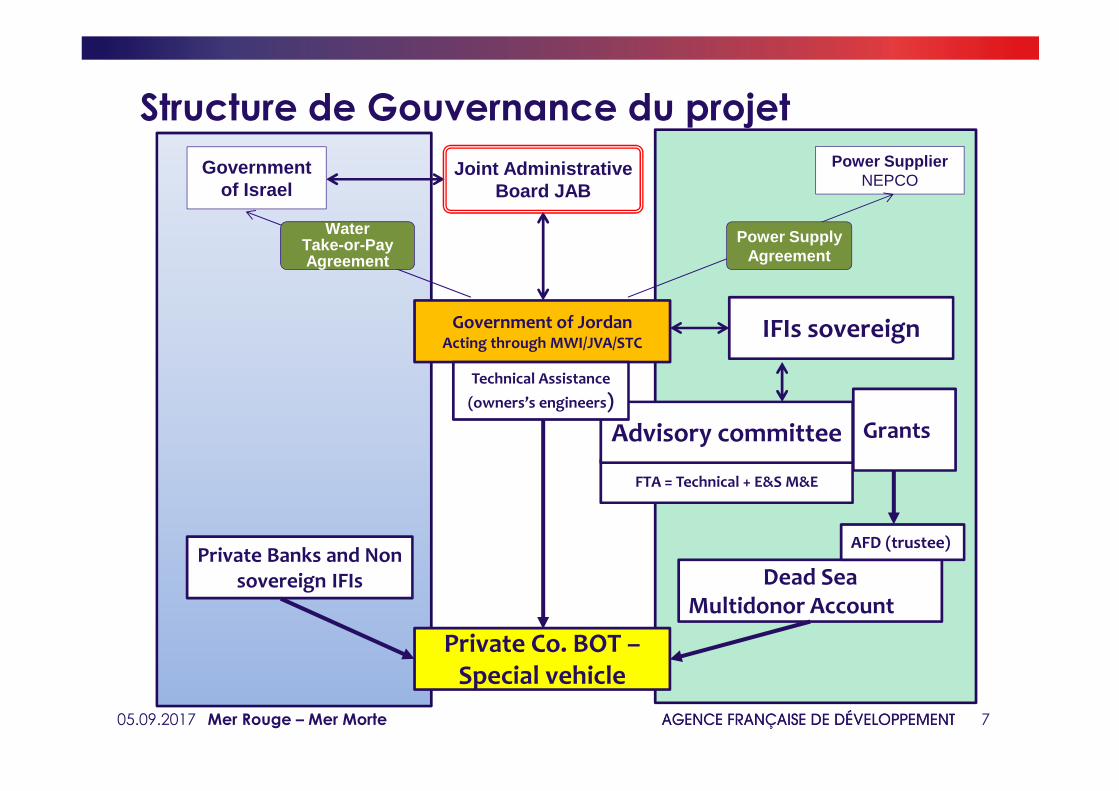
Structure de Gouvernance du projet
Private Co. BOT –Special vehicle
Government of JordanActing through MWI/JVA/STC
Private Banks and Non sovereign IFIs
Grants
Dead Sea Multidonor Account
AFD (trustee)
IFIs sovereign
FTA = Technical + E&S M&E
Advisory committee
Technical Assistance
(owners’s engineers)
Joint Administrative Board JAB
Government of Israel
Power SupplierNEPCO
WaterTake-or-Pay Agreement
Power Supply Agreement
05.09.2017 Mer Rouge – Mer Morte
8
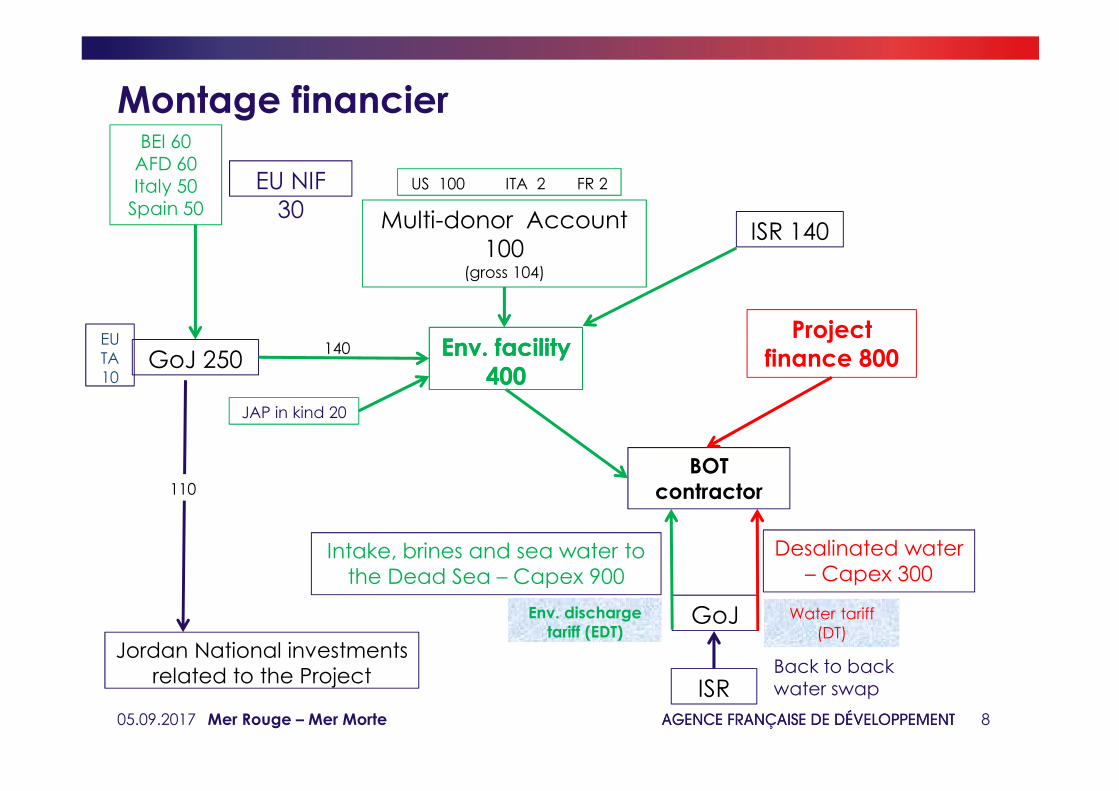
Montage financier
ISR
EU NIF 30
BEI 60AFD 60Italy 50
Spain 50
BOT contractor
ISR 140
GoJ 250
Multi-donor Account100
(gross 104)
Intake, brines and sea water to the Dead Sea – Capex 900
Desalinated water – Capex 300
GoJ
Back to backwater swap
Env. facility400
Env. facility400
Project finance 800
Water tariff (DT)
Env. discharge tariff (EDT)
US 100 ITA 2 FR 2
JAP in kind 20
Jordan National investmentsrelated to the Project
EU TA 10
140
110
05.09.2017 Mer Rouge – Mer Morte
9
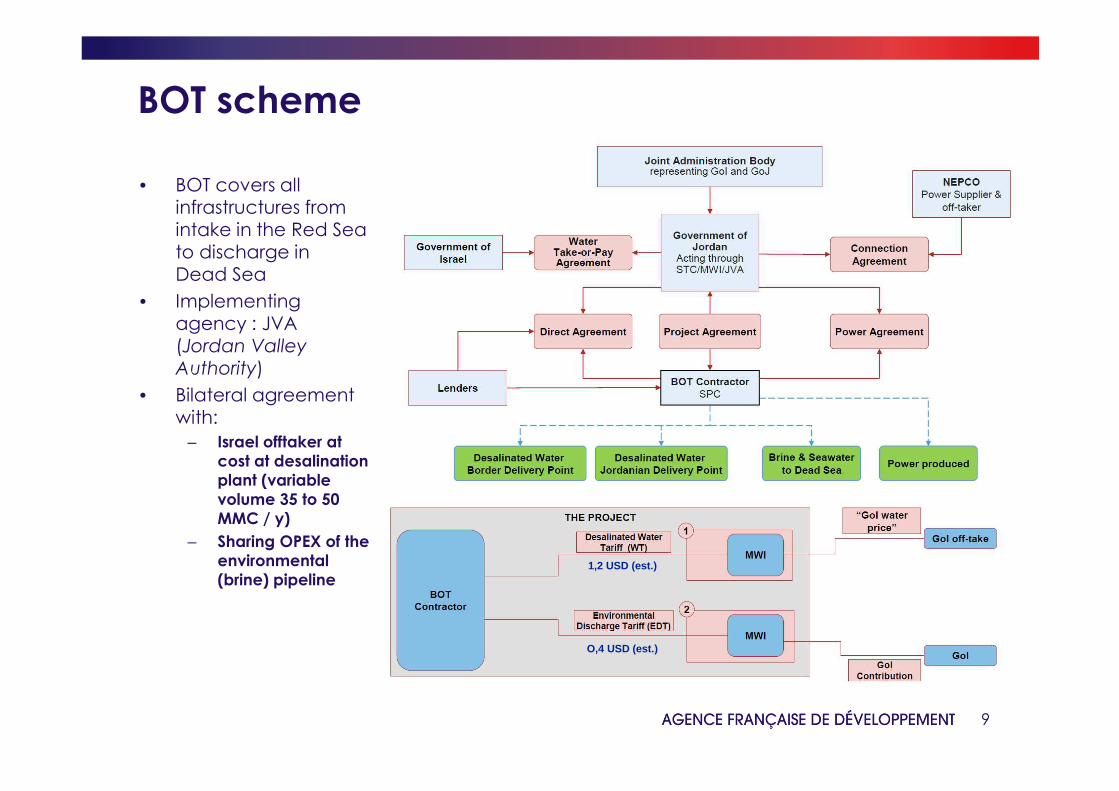
BOT scheme
• BOT covers all infrastructures from intake in the Red Sea to discharge in Dead Sea
• Implementing agency : JVA (Jordan Valley
Authority)
• Bilateral agreement with:
– Israel offtaker at cost at desalination plant (variable volume 35 to 50 MMC / y)
– Sharing OPEX of the environmental (brine) pipeline
1,2 USD (est.)
O,4 USD (est.)
10
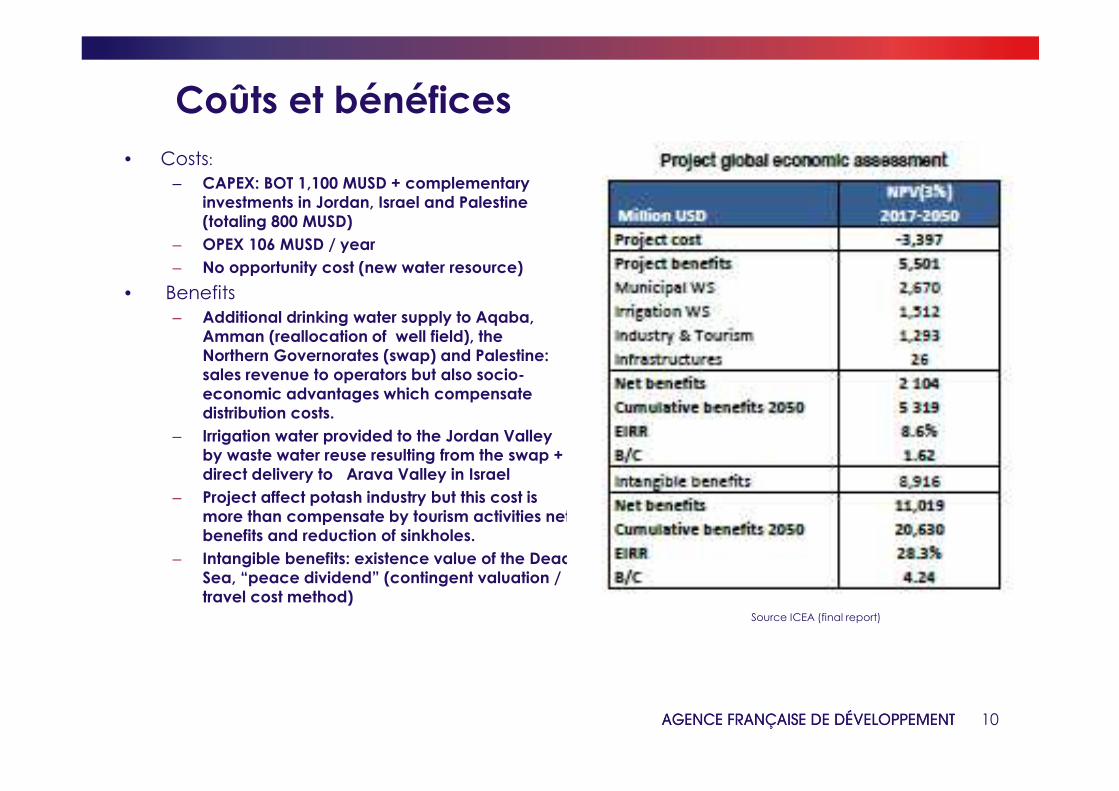
• Costs:
– CAPEX: BOT 1,100 MUSD + complementary investments in Jordan, Israel and Palestine (totaling 800 MUSD)
– OPEX 106 MUSD / year
– No opportunity cost (new water resource)
• Benefits
– Additional drinking water supply to Aqaba, Amman (reallocation of well field), the Northern Governorates (swap) and Palestine: sales revenue to operators but also socio-economic advantages which compensate distribution costs.
– Irrigation water provided to the Jordan Valley by waste water reuse resulting from the swap + direct delivery to Arava Valley in Israel
– Project affect potash industry but this cost is more than compensate by tourism activities net benefits and reduction of sinkholes.
– Intangible benefits: existence value of the Dead Sea, “peace dividend” (contingent valuation / travel cost method)
Coûts et bénéfices
Source ICEA (final report)
11
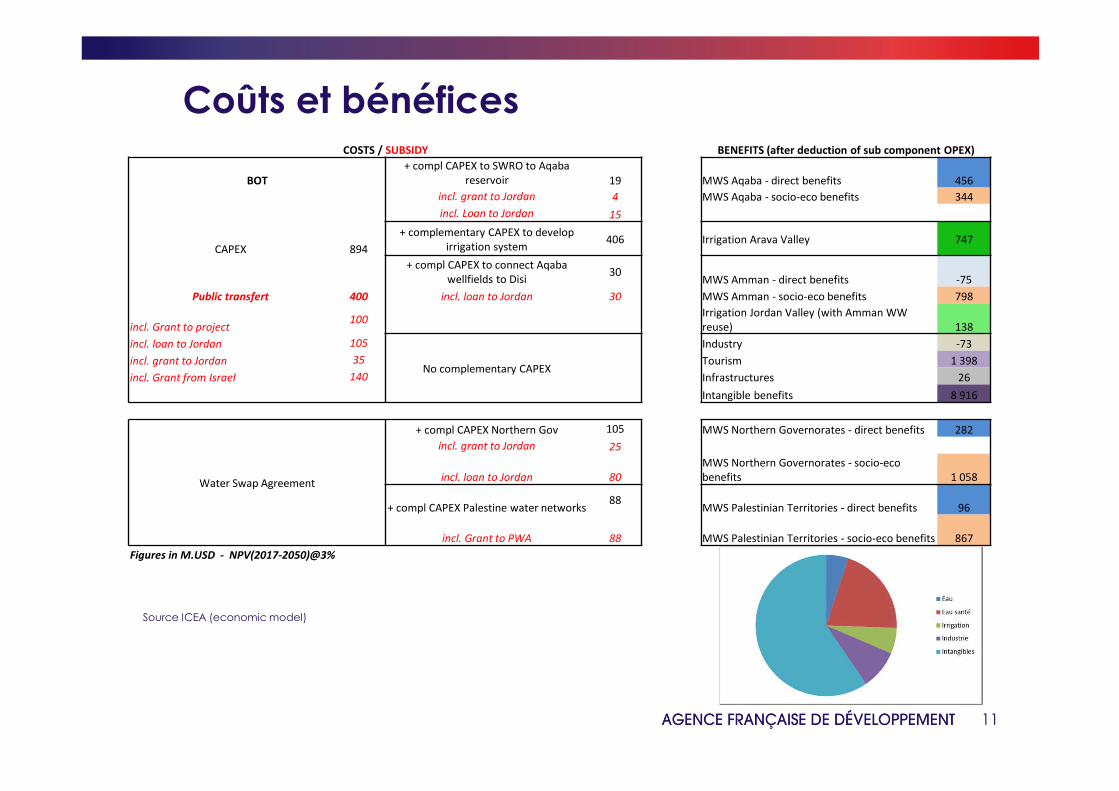
Coûts et bénéfices
Source ICEA (economic model)
COSTS / SUBSIDY BENEFITS (after deduction of sub component OPEX)
BOT
+ compl CAPEX to SWRO to Aqaba
reservoir 19 MWS Aqaba - direct benefits 456
incl. grant to Jordan 4 MWS Aqaba - socio-eco benefits 344
incl. Loan to Jordan 15
CAPEX 894
+ complementary CAPEX to develop
irrigation system406 Irrigation Arava Valley 747
+ compl CAPEX to connect Aqaba
wellfields to Disi 30
MWS Amman - direct benefits -75
Public transfert 400 incl. loan to Jordan 30 MWS Amman - socio-eco benefits 798
incl. Grant to project100
Irrigation Jordan Valley (with Amman WW
reuse) 138
incl. loan to Jordan 105
No complementary CAPEX
Industry -73
incl. grant to Jordan 35 Tourism 1 398
incl. Grant from Israel 140 Infrastructures 26
Intangible benefits 8 916
Water Swap Agreement
+ compl CAPEX Northern Gov 105 MWS Northern Governorates - direct benefits 282
incl. grant to Jordan 25
incl. loan to Jordan 80
MWS Northern Governorates - socio-eco
benefits 1 058
+ compl CAPEX Palestine water networks88
MWS Palestinian Territories - direct benefits 96
incl. Grant to PWA 88 MWS Palestinian Territories - socio-eco benefits 867
Figures in M.USD - NPV(2017-2050)@3%
12
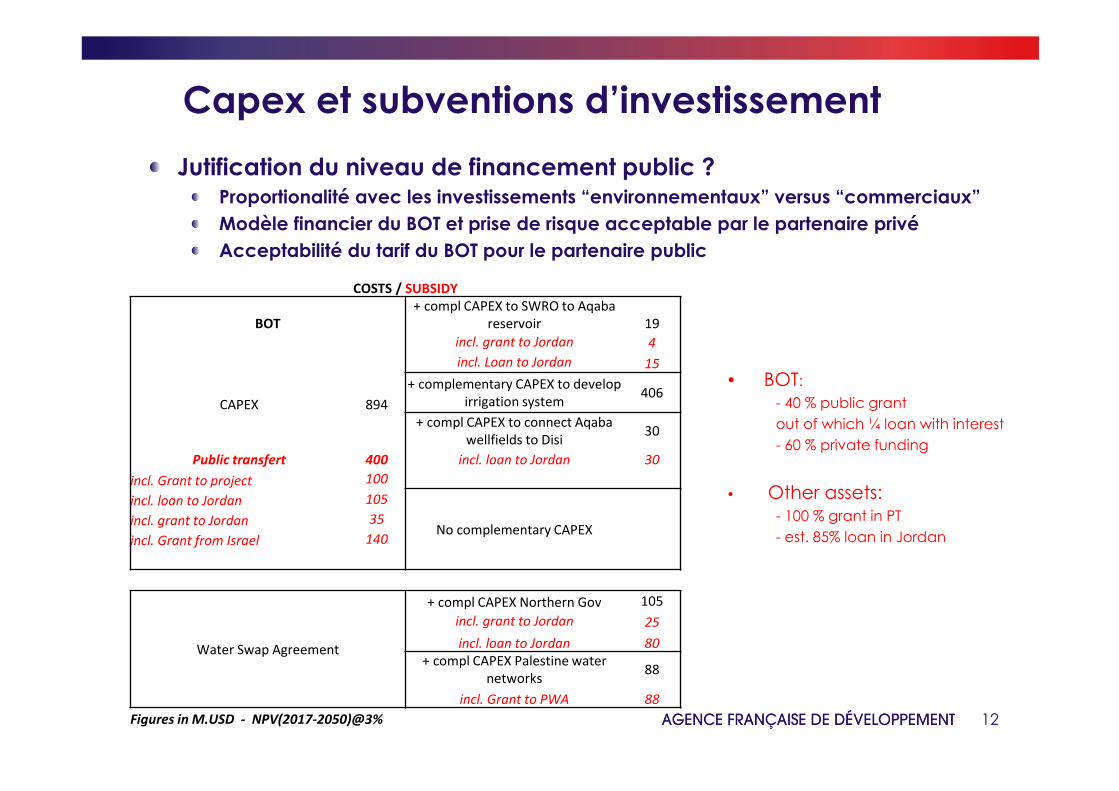
Capex et subventions d’investissement
• BOT:
- 40 % public grant
out of which ¼ loan with interest
- 60 % private funding
• Other assets:- 100 % grant in PT
- est. 85% loan in Jordan
Jutification du niveau de financement public ?Proportionalité avec les investissements “environnementaux” versus “commerciaux”
Modèle financier du BOT et prise de risque acceptable par le partenaire privé
Acceptabilité du tarif du BOT pour le partenaire public
COSTS / SUBSIDY
BOT
+ compl CAPEX to SWRO to Aqaba
reservoir 19
incl. grant to Jordan 4
incl. Loan to Jordan 15
CAPEX 894
+ complementary CAPEX to develop
irrigation system406
+ compl CAPEX to connect Aqaba
wellfields to Disi 30
Public transfert 400 incl. loan to Jordan 30
incl. Grant to project 100
incl. loan to Jordan 105
No complementary CAPEXincl. grant to Jordan 35
incl. Grant from Israel 140
Water Swap Agreement
+ compl CAPEX Northern Gov 105
incl. grant to Jordan 25
incl. loan to Jordan 80
+ compl CAPEX Palestine water
networks88
incl. Grant to PWA 88
Figures in M.USD - NPV(2017-2050)@3%
13
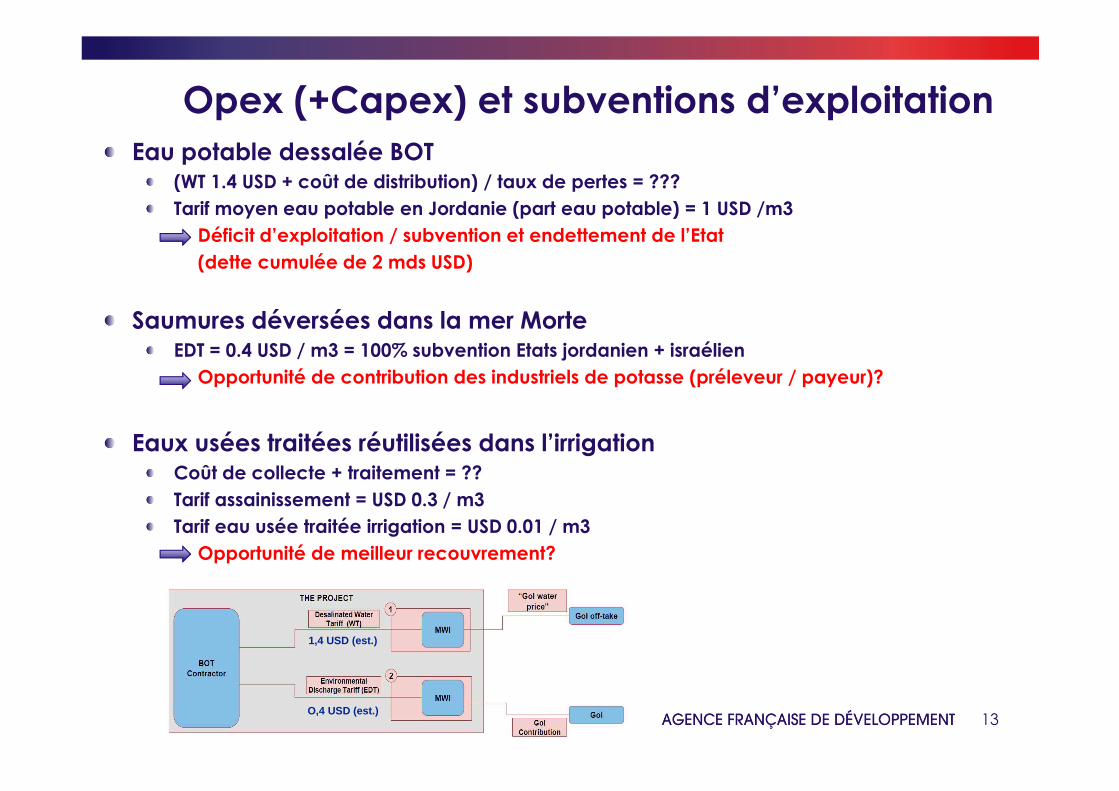
Opex (+Capex) et subventions d’exploitationEau potable dessalée BOT
(WT 1.4 USD + coût de distribution) / taux de pertes = ???
Tarif moyen eau potable en Jordanie (part eau potable) = 1 USD /m3
Déficit d’exploitation / subvention et endettement de l’Etat
(dette cumulée de 2 mds USD)
Saumures déversées dans la mer MorteEDT = 0.4 USD / m3 = 100% subvention Etats jordanien + israélien
Opportunité de contribution des industriels de potasse (préleveur / payeur)?
Eaux usées traitées réutilisées dans l’irrigationCoût de collecte + traitement = ??
Tarif assainissement = USD 0.3 / m3
Tarif eau usée traitée irrigation = USD 0.01 / m3
Opportunité de meilleur recouvrement?
1,4 USD (est.)
O,4 USD (est.)
14
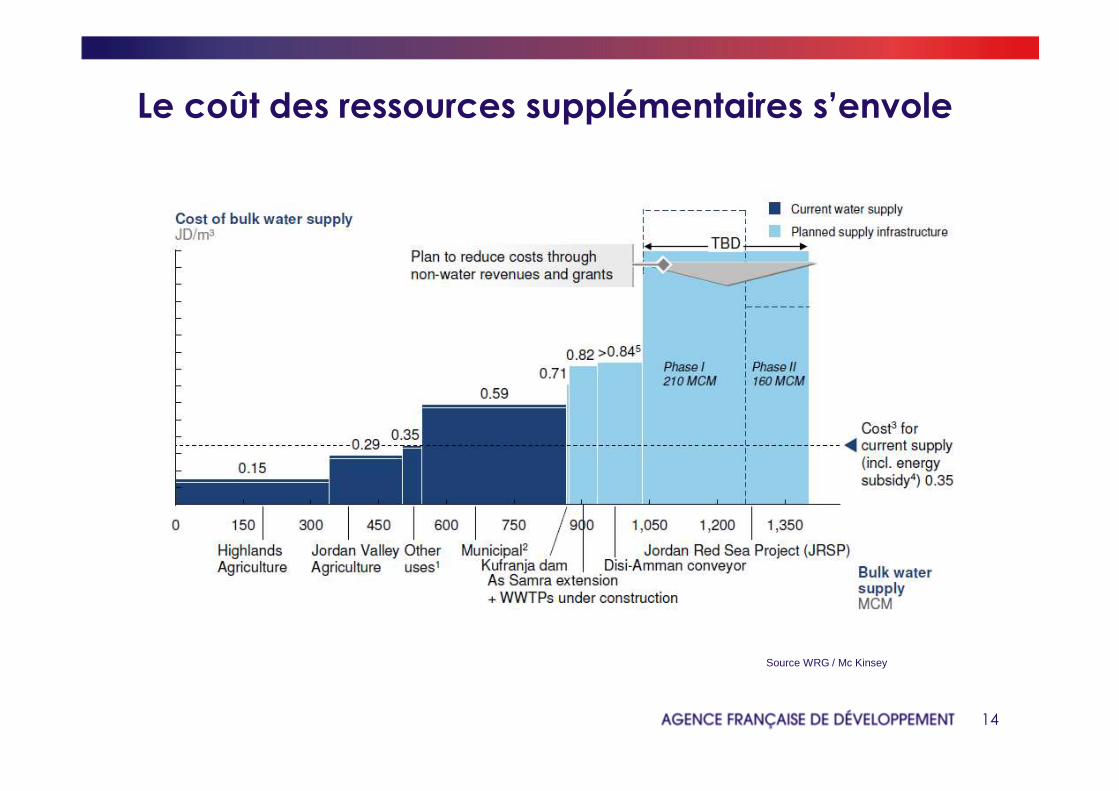
Le coût des ressources supplémentaires s’envole
Source WRG / Mc Kinsey
15
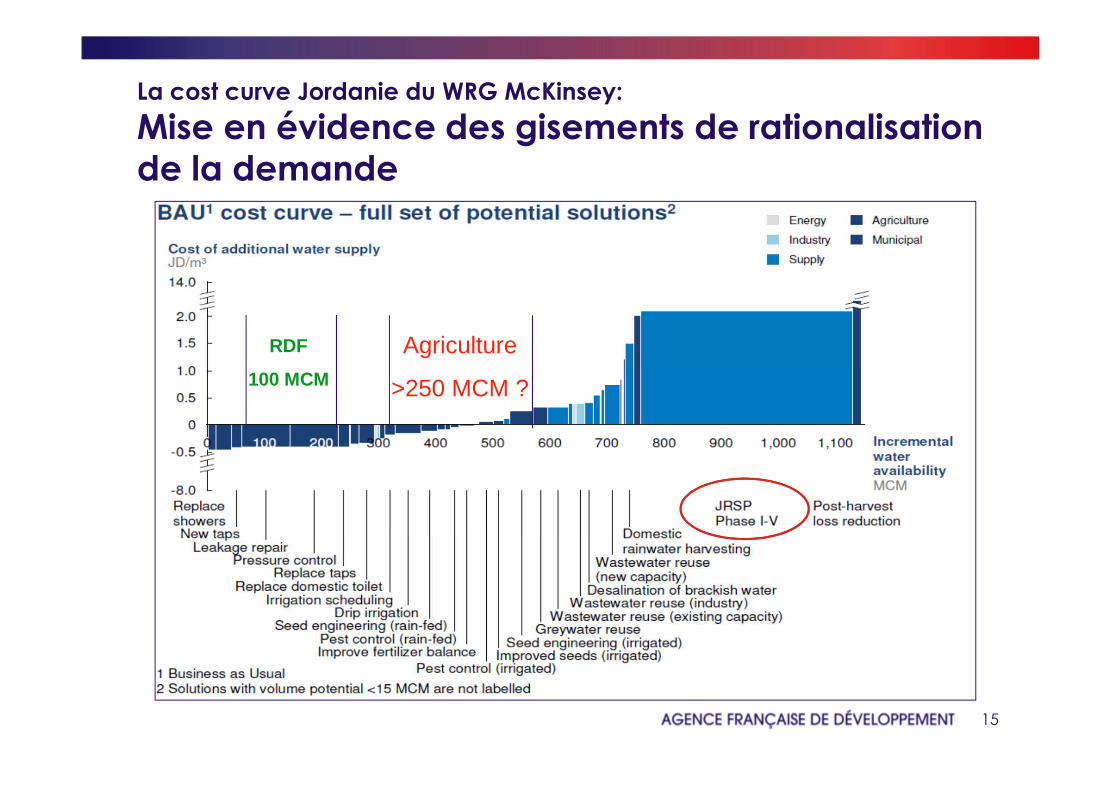
La cost curve Jordanie du WRG McKinsey:
Mise en évidence des gisements de rationalisation de la demande
Agriculture
>250 MCM ?
RDF
100 MCM
#WorldInCommonAGENCE FRANÇAISE DE DÉVELOPPEMENT | FRENCH DEVELOPMENT AGENCY
MERCI
afd.fr
1705.09.2017 Mer Rouge – Mer Morte
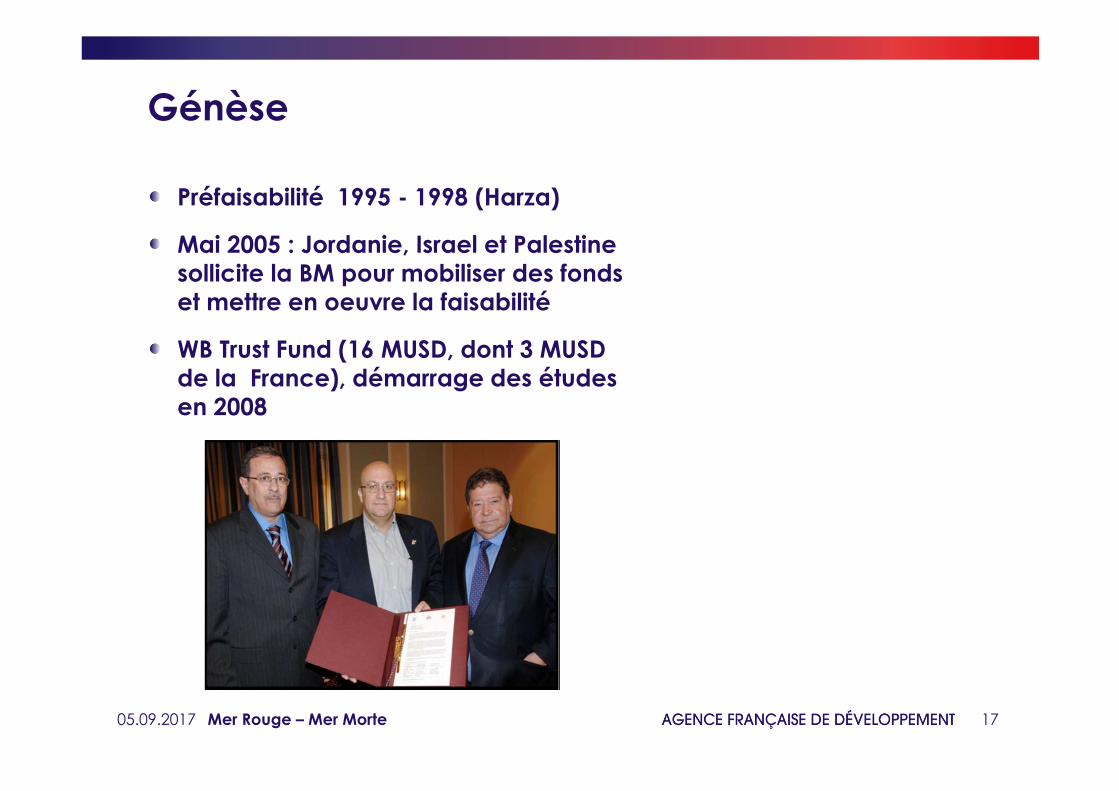
Génèse
Préfaisabilité 1995 - 1998 (Harza)
Mai 2005 : Jordanie, Israel et Palestine sollicite la BM pour mobiliser des fondset mettre en oeuvre la faisabilité
WB Trust Fund (16 MUSD, dont 3 MUSD de la France), démarrage des étudesen 2008